Article

A Statistical Approach for Analysis of Dissolution Rates Including Surface Morphology

by
Elisabete Trindade Pedrosa
1,*,
Inna Kurganskaya
1,
Cornelius Fischer
2 and
Andreas Luttge
1,3,4
1
Faculty of Geosciences, University of Bremen, 28359 Bremen, Germany
2
Institute of Resource Ecology, Department of Reactive Transport, Helmholtz-Zentrum Dresden-Rossendorf, 04318 Leipzig, Germany
3
Marum—Center for Marine Environmental Sciences, University of Bremen, Leobener Strasse, 28359 Bremen, Germany
4
MAPEX—Center for Materials and Processes, University of Bremen, Bibliothekstraße 1, 28359 Bremen, Germany
*
Author to whom correspondence should be addressed.
Minerals 2019, 9(8), 458; https://doi.org/10.3390/min9080458
Submission received: 17 June 2019 / Revised: 19 July 2019 / Accepted: 25 July 2019 / Published: 27 July 2019

Abstract

:
Understanding mineral dissolution is relevant for natural and industrial processes that involve the interaction of crystalline solids and fluids. The dissolution of slow dissolving minerals is typically surface controlled as opposed to diffusion/transport controlled. At these conditions, the dissolution rate is no longer constant in time or space, an outcome observed in rate maps and correspondent rate spectra. The contribution and statistical prevalence of different dissolution mechanisms is not known. Aiming to contribute to close this gap, we present a statistical analysis of the variability of calcite dissolution rates at the nano- to micrometer scale. A calcite-cemented sandstone was used to perform flow experiments. Dissolution of the calcite-filled rock pores was measured using vertical scanning interferometry. The resultant types of surface morphologies influenced the outcome of dissolution. We provide a statistical description of these morphologies and show their temporal evolution as an alternative to the lack of rate spatial variability in rate constants. Crystal size impacts dissolution rates most probably due to the contribution of the crystal edges. We propose a new methodology to analyze the highest rates (tales of rate spectra) that represent the formation of deeper etch pits. These results have application to the parametrization and upscaling of geochemical kinetic models, the characterization of industrial solid materials and the fundamental understanding of crystal dissolution.

Graphical Abstract

1. Introduction

When rocks are subjected to fluid injection (e.g., with regard to gas storage, hydro-fracturing, geothermal or oil exploration), dissolution and precipitation events will be triggered and change the microstructure of the rock (e.g., [1] and references therein). One of the most important microstructural changes of the rock is related to the generation and breakdown of porosity and its impact on permeability [2]. These changes have a significant effect on the quality of reservoir rocks [3,4,5]. Thus, the quantitative prediction of the rates at which minerals dissolve and precipitate in these rocks is crucial for its long-term usage.
Calcite is a common cement type of sedimentary reservoir rocks [6,7]. It is also one of the fastest minerals to respond to the presence of fluids and changes in their chemical composition [8,9,10,11]. Although extensively studied, the dissolution rate of calcite is still under discussion. Calcite dissolution rates measured at similar experimental conditions can vary within several orders of magnitude [12]. This is due to both crystallographic and microstructural factors intrinsic to the mineral itself (e.g., crystallinity, crystal orientation, number and distribution of crystal defects) that result in a heterogeneous evolution of the dissolving surface, hence of reaction rates [13,14,15,16]. Inter-dataset disagreement can also occur due to the contrast between non-site-specific observations (e.g., in a powder) versus site-specific variations within a domain or field of view (e.g., AFM or VSI frame). The observed variance imposes a significant challenge for the geoscience community in finding physical parameters substituting intrinsic dissolution rates. Currently, a normalization approach using concepts of specific surface area and reactive surface area is implemented in models involving pore scale processes. This has been discussed at length elsewhere ([16] and references within). Both parameters serve as a crude approximation for dissolution processes at the microscopic scale and have a number of pitfalls. First, specific surface area may be not directly quantitatively linked to surface reactivity. For example, reactive sites at some surfaces may be poisoned by strongly binding ions. Second, reactive surface area does not have a strict physical meaning at the atomistic scale—the populations of reactive sites (e.g., step and kink sites) may vary significantly over time, reactive features (e.g., etch pits, hillocks, and steps) may grow and occupy “non-reactive surface area” (e.g., atomic terraces).
An alternative treatment recently offered is based on representation and quantitative description of rate spectra [15,17], a statistical frequency distribution of rates. The spectra have been shown to vary over spatial and temporal domains, as it was shown in site-specific experiments [15,18,19,20]. The systematic analysis of these variations and their quantitative description may potentially provide very important kinetic information for reactive transport models at the pore scale. It is in this context that we opted to measure the spatial and temporal variation of surface reaction rates of calcite crystals adding two innovative approaches: the rate of calcite dissolution is measured directly from a reservoir-type host rock (a quartz sandstone with calcite cement); and a detailed statistical analysis, using central indexes and maximum rates, is applied to represent and evaluate the range of dissolution rates represented by the rate spectra. The first, allowed for the analysis of individual pores of micrometer size directly from the host rock that otherwise cannot be directly measured due to limitations of analytical instruments. The second presents an alternative approach to the calculation of rate constants that lack the inclusion of the spatial variability of mineral dissolution rates.
Using a fluid cell specifically designed for obtaining optimal experimental conditions for studying surface-controlled reactions, the sandstone was subjected to a continuous flow for a total reaction time of 32 h. Vertical scanning interferometry (VSI) topography maps of the calcite cement allowed for surface changes observation over different reaction times and the calculation of surface retreat rate maps. We also address the correlation between grain size and dissolution reaction rates. The experimental data presented here opens a window to address questions such as upscaling of models from the atomistic scale to the macro and geological scale.

2. Materials and Methods

2.1. Sample Description and Flow-Through Experiments

The calcite cement selected for the dissolution experiments belongs to a sandstone from the Bebertal outcrop [21]. This outcrop is of particular interest because it is the northern-most outcrop of the Upper-Rotliegend sandstones in middle Europe, and it is the only one that contains time-equivalent sandstones deposited under the same conditions as those forming the prolific gas reservoirs of the Southern Permian Basin [22]. Thin-section analyses showed that the calcite cement consists of single crystals that have grown in between the sandstone’s grains (poikilitic calcite), i.e., quartz, K-feldspars, Na-feldspars, hematite, illite, and barite (see an example in Figure S1 of Supplementary Material ).
A section of the sandstone (2.5 cm diameter cylindrical sample) was embedded in epoxy and polished using micro-diamond-oil suspensions (15, 6, 3, 1, 0.25, and 0.1 µm). The sample was then gold coated and imaged with a SEM (JEOL JSM-6510) equipped with energy-dispersive X-ray analysis (EDX). The unreacted sample was then repolished to remove the gold coating before proceeding with the experiments.
The experimental conditions were chosen to provide comparable results to previous studies of calcite dissolution [12,18,20,23,24]. All flow-through experiments were carried out using a 2 mmol Na2CO3 fluid solution, prepared by mixing a reagent Na2CO3 powder (≥ 99.5%) with MilliQ water (resistivity > 18.2 MΩ cm). The fluid solution was purged with compressed air until it was fully equilibrated with atmospheric CO2, achieving a constant pH of 8.7 (alkalinity ≈ 4.0 meq.kg−1—H2O). The flow cell used in the experiments was designed for achieving optimal conditions to guarantee a surface-controlled reaction (cp., [25]). These conditions include, a minimum hydraulic residence time (HRT) to minimize diffusion boundary layer effects and isolate surface-controlled mechanisms, and a low flow rate for minimizing the need for high solvent quantities. The reactor cell has a total volume of 75 µL (2.50 × 0.60 × 0.05 cm3). The flow rate used in all experimental runs was 0.6 mL·min−1 resulting in a HRT of 7.5 s. This low HRT was used to guarantee undersaturated conditions at all times during the experimental runs. This means that the fluid is theoretically fully renovated inside the cell each 7.5 s. At these conditions, it is expected that all newly dissolved ions are rapidly diffused away from the mineral surface into the bulk fluid and readily dragged out of the cell by advection. In comparison, a study by [20] showed that a HRT of as much as 50 s in a 12 mL flow-through cell resulted in statistically similar calcite dissolution rates, and [22] have reported calcite marble dissolution rates for experiments using a HRT of 36 s.

2.2. Surface Retreat Maps (∆h), Reaction Rate Maps (r) and Rate Spectra

Ten calcite-filled sandstone pores (cement patches) were chosen arbitrarily for analyzing rate spatial and temporal variabilities (see SEM-BSE overview image of the sample in Supplementary Material, Figure S2 for exact locations). The sample topographies were analyzed ex situ in a sequence of reaction steps. Before and after each reaction step, topography/height maps (hi) of these patches were obtained using Vertical Scanning Interferometry (VSI). The reaction time intervals chosen were 3, 6, 9, 12, 18, 24, and 32 h. A ZeMapper white light interferometer (Zemetrics, Tucson, AZ, USA) equipped with five Mirau objectives was used (same as in [22,26,27]). The surface height maps provide lateral and vertical topography information and have a vertical scan range of up to 1 mm. A detailed description of the VSI operation can be found in [12,28], and references therein. Here, the surface topography maps were obtained by using Mirau objectives of 50× and 100× magnification that have a field of view of 303 × 303 and 152 × 152 µm, respectively.
Two types of information could be calculated using these height maps: (1) spatially resolved dissolution rate maps, and (2) the total surface normal retreat or total material flux. Surface-height retreat maps (∆h) were obtained by calculating ∆hi-j = hi – hj, where hi and hj are any of the topography maps at times j > i. The dissolution rate maps (r) were then calculated by dividing the surface retreat maps (∆h) by the time step (Δt = i−j) and the molar volume of calcite (Vm = 3.693 × 10⁻⁵ m3·mol−1), resulting in maps with the typical mineral dissolution rate units in [mol·m−2·s−1].
The total rate corresponding to the total volumetric loss of calcite (rT) was calculated from the surface normal retreat maps (∆hi−j). To obtain correct values of rates and their statistical distributions, a 7 × 7 median filter plus a de-spiking filtering process was applied before the material flux calculations using SPIP (Image Metrology A/S). This filter eliminates VSI data spikes that typically occur due to system inherent optical disturbance effects such as batwings and interferometric slope effects [29]. A typical example of the filtering process can be seen in Figure S3 of Supplementary Material.
A reaction rate spectrum is the range of values given by the analysis of the frequency of appearance of rates in a given rate map (i.e., histogram of the rates). This kind of data representation is useful because it allows to easily find the rate mode(s) of each rate map (i.e., the rate value(s) that are most frequent in that surface).
An inert mask is typically used to create a reference surface (with ∆hi = 0 for all i) necessary for the calculation of the surface retreat maps and to obtain the rate maps (e.g., [12,22]). In this study, the quartz and feldspar grains surrounding the calcite cement were used as reference surfaces. Quartz and feldspar dissolve 4 to 5 orders of magnitude slower than calcite [30]. Thus, these surfaces are sufficiently stable over the course of these reaction times to be used as “insoluble” reference surfaces.

2.3. Statistical Analysis

Several modelling studies (e.g., [31,32]), have shown that a different surface morphology or roughness or topography created by, e.g., atomic step edges, kink sites, terraces impacts the outcome of reaction rates. Although, VSI operates at a higher length scale (micrometer vs atomic scale from models), correlating different surface morphologies to statistically distinct dissolution rates or vice-versa, validates the expectations revealed by the models.
Ten calcite-filled sandstone pores were used to quantify the spatial and temporal variability of the reaction rates. Below, we present a detailed statistical analysis of the rates in one particular calcite cement patch to characterize intra-pore rate variability. This particular patch was chosen because it contains the sample’s two characteristic surface dissolution morphologies (Figure 1). The most frequent rates (modes) of the sub-sections rate spectra (Figure 1b,c) fit the two smaller modes of the rate spectrum of the whole map (Figure 1a). The highest mode at rate close to zero (Figure 1a) corresponds to the “unreactive” grains used as height reference in Figure 1d.
Additionally, inter-pore variability was studied in the combined results on a total of ten such calcite cement patches. Similarly to the illustration in Figure 1e,f, sub-sections of the 70 rate maps were selected according to their surface morphology and to exclude unreacted areas from the statistics. The rate maps consist of matrices with n × m number of lines and columns depending on their pixel size. Each pixel is a measured rate value at that position. Depending on the objective used (magnification) and the size of the rate map, these matrices can have thousands or millions of pixels. The average is calculated by summing up all the rates in the selected matrix and dividing it by the number of pixels. The median is the middle rate in the matrix, the mode is the most frequent rate in the matrix, and the standard deviation is the average of the square differences from the average rate in the matrix. The central statistical parameters of rates (average, median, mode, and standard deviation) were calculated directly from the rate maps using an in-house code. The average rates presented here are not to be confused with the average rates typically calculated from the volume of calcite dissolved and a measurement of the sample’s surface area. For discussion purposes, we present this value as well in Figure 1g.
Surface sites of higher reactivity, such as etch pits, are not always the most frequent rates in a rate spectrum. Hence, we performed statistics on the highest rates found in each rate map. For this purpose we “extracted” a set of maximum rate values from each rate map. A selection of a set of maximum rate values is preferred to the selection of a single maximum rate value from each rate map. As mentioned before, VSI maps contain inherent noise. The rate maps are essentially matrices with rate values. The highest rate value from each row and column of the matrix was “extracted” and used as a second set of rates for statistical analysis. The number of rate maxima extracted from each rate map equals n + m. The average and standard deviation of each new set of rates (rate maxima) was calculated in the same way as mentioned before. For simplified data illustration, and not to be confused with the central statistical parameters, we did not include the median and mode values for this second set of rates.

2.4. Grain Size Measurements

The size of the cement patches was calculated by image segmentation of the VSI topography maps using image grayscale analysis. There was no attempt to measure the three-dimensional surface area of the grains. The grain size discussed here refers to the 2D geometrical size of the cement patches. We aimed at finding a correlation, or lack of, between the total amounts of calcite lost during experiments and the size of the cement patches.

3. Results

The dissolution experiments resulted in measurable height retreats (see below), with no evidence of back-reaction (precipitation) observed at the VSI scale, confirming that the hydraulic residence time used was sufficient to guarantee undersaturated fluid conditions in relation to calcite during the ongoing of the experiments. This is a good indicator for the successful diffusion of reactants from the mineral surface into solution. The minerals were rapidly driven to undersaturated conditions due to the advective flow that, in theory, quantitatively transported all newly dissolved chemical species (e.g., Ca2+ and CO32−) away from the surface and out of the fluid cell.

3.1. Microstructure of the Reacted Calcite Patches

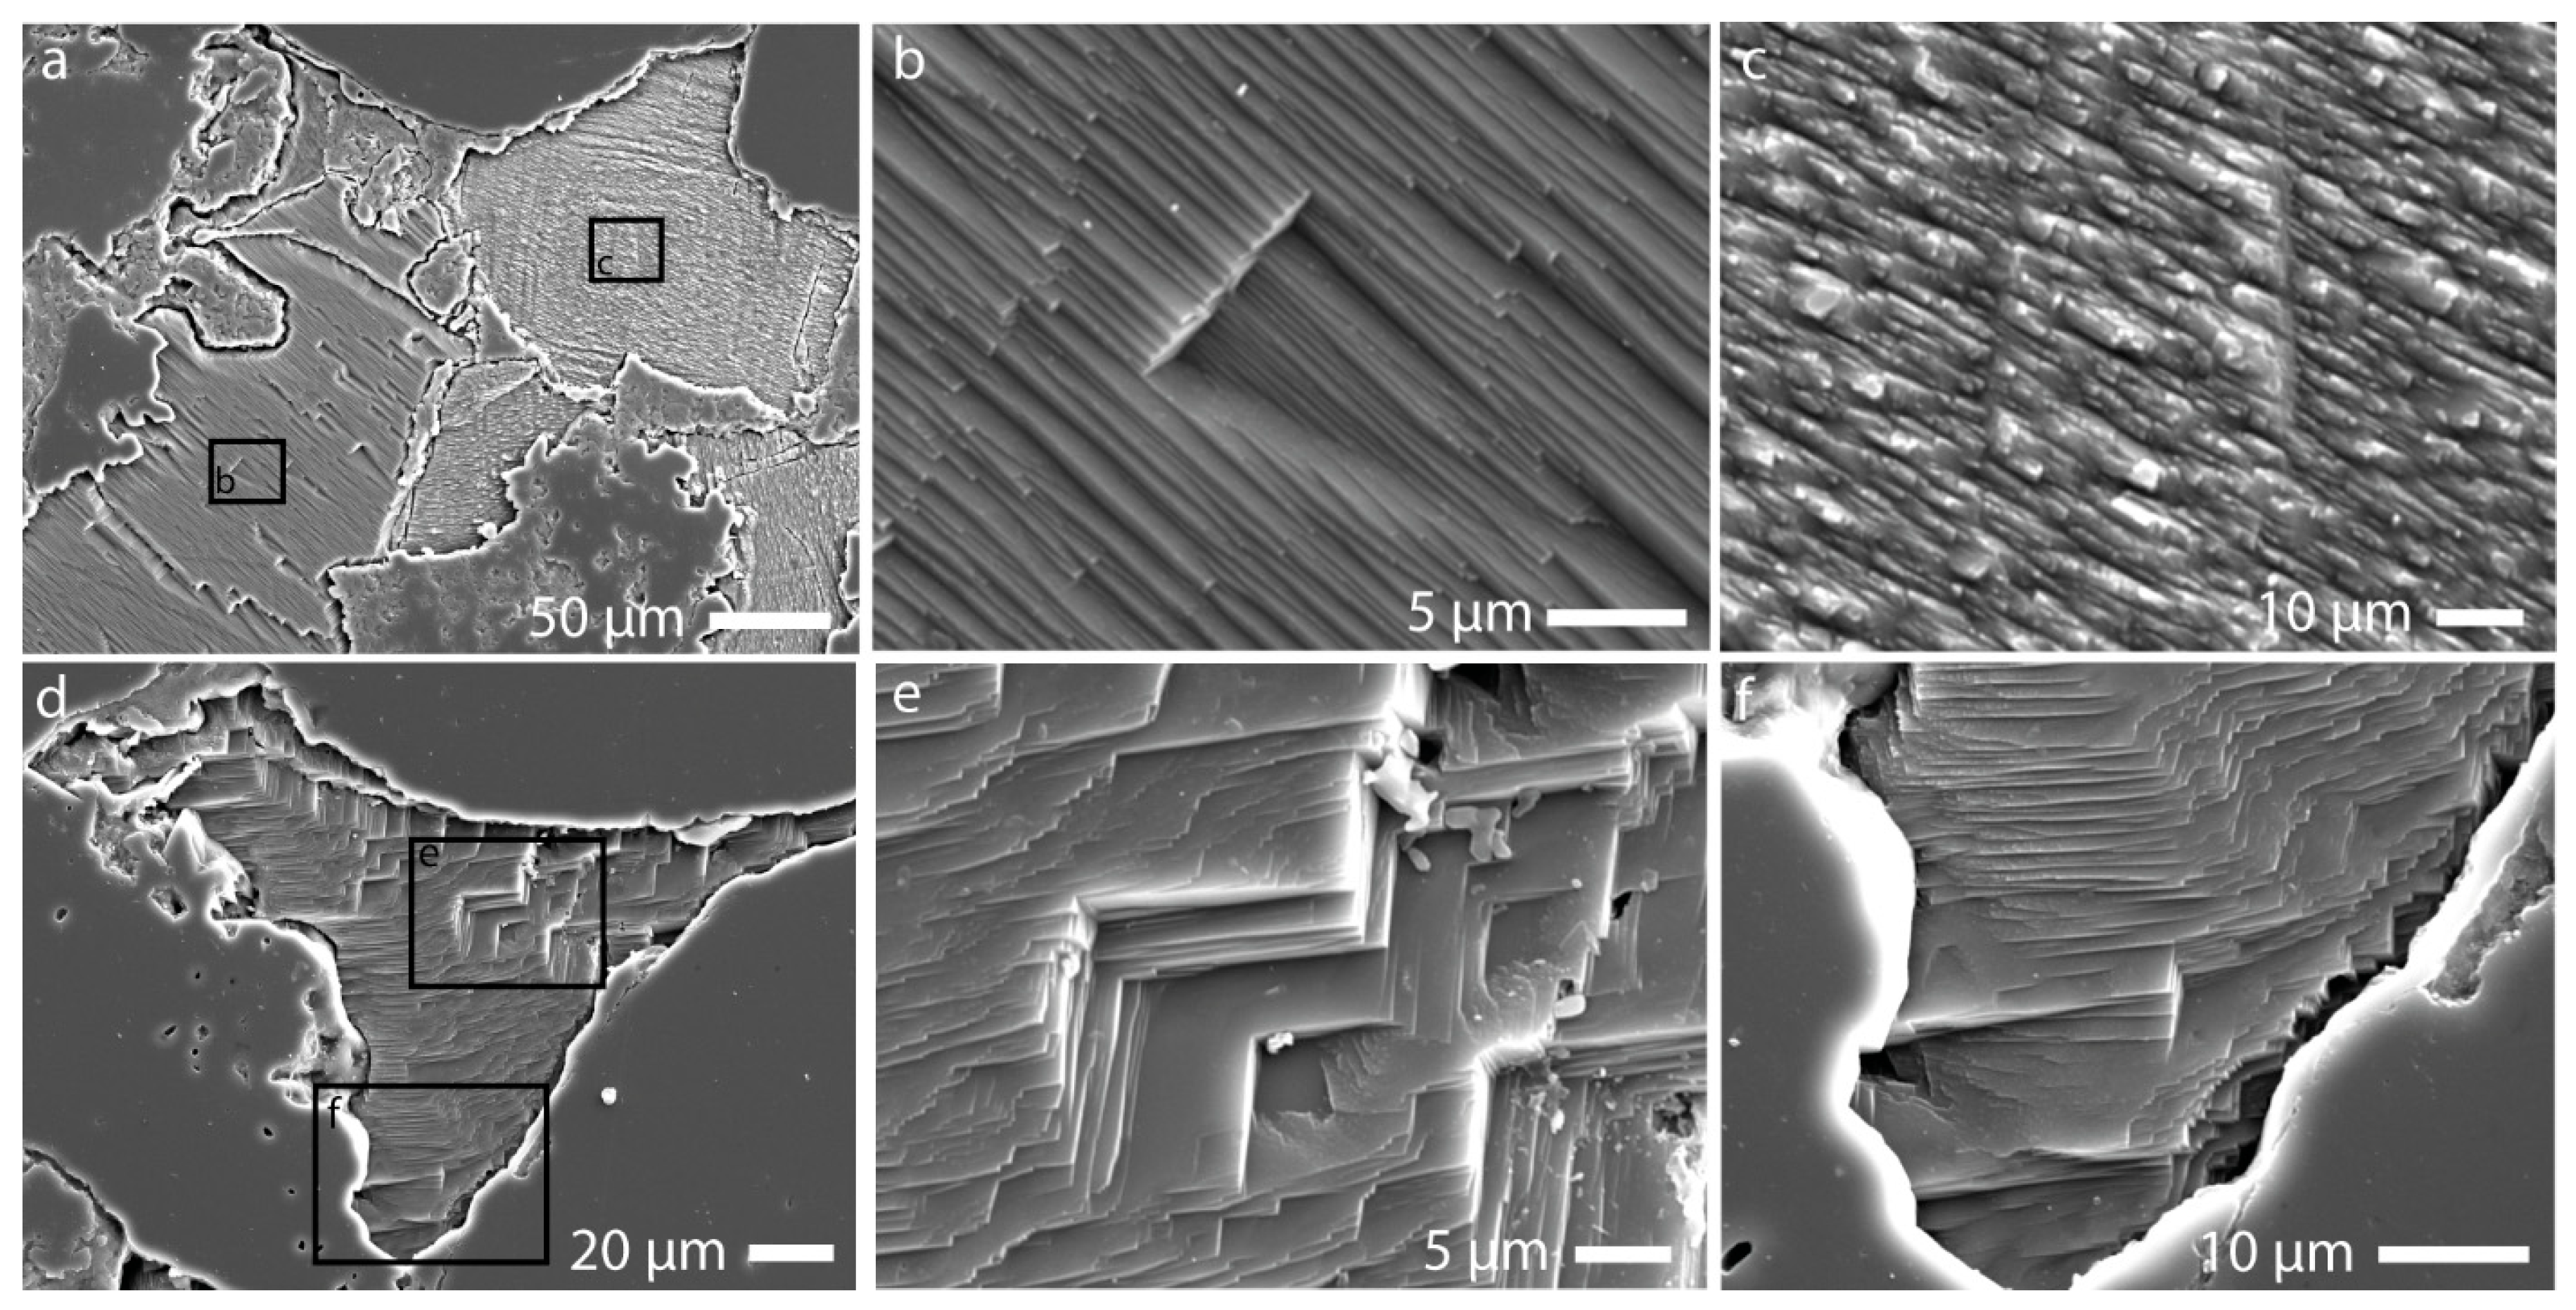
After the dissolution experiments (32 h), distinct surface microstructures were observed in the reacted calcite patches. Complementary to VSI, the analysis of secondary electron (SE) microscopy images (Figure 2) revealed that some patches (Figure 2a–c) contained more than one type of dissolution pattern, while others presented a unique microstructure (Figure 2d–f) as expected from the sample characterization observation of poikilitic calcite from thin-section analysis (see Supplementary Material, Figure S1). The surface exhibited either organized, crystallographically-oriented dissolution patterns, e.g., crystalline micron-height sheets or packs (Figure 2e,f), striations with matching orientations (Figure 2b), or a complex hill-and-valley surface microstructure (Figure 2c). In some cases (e.g., Figure 2d), the calcite dissolution process leaves behind pits having the typical rhombohedral crystallographic orientation of calcite (Figure 2e).

3.2. Height Maps and Reaction Rate Maps

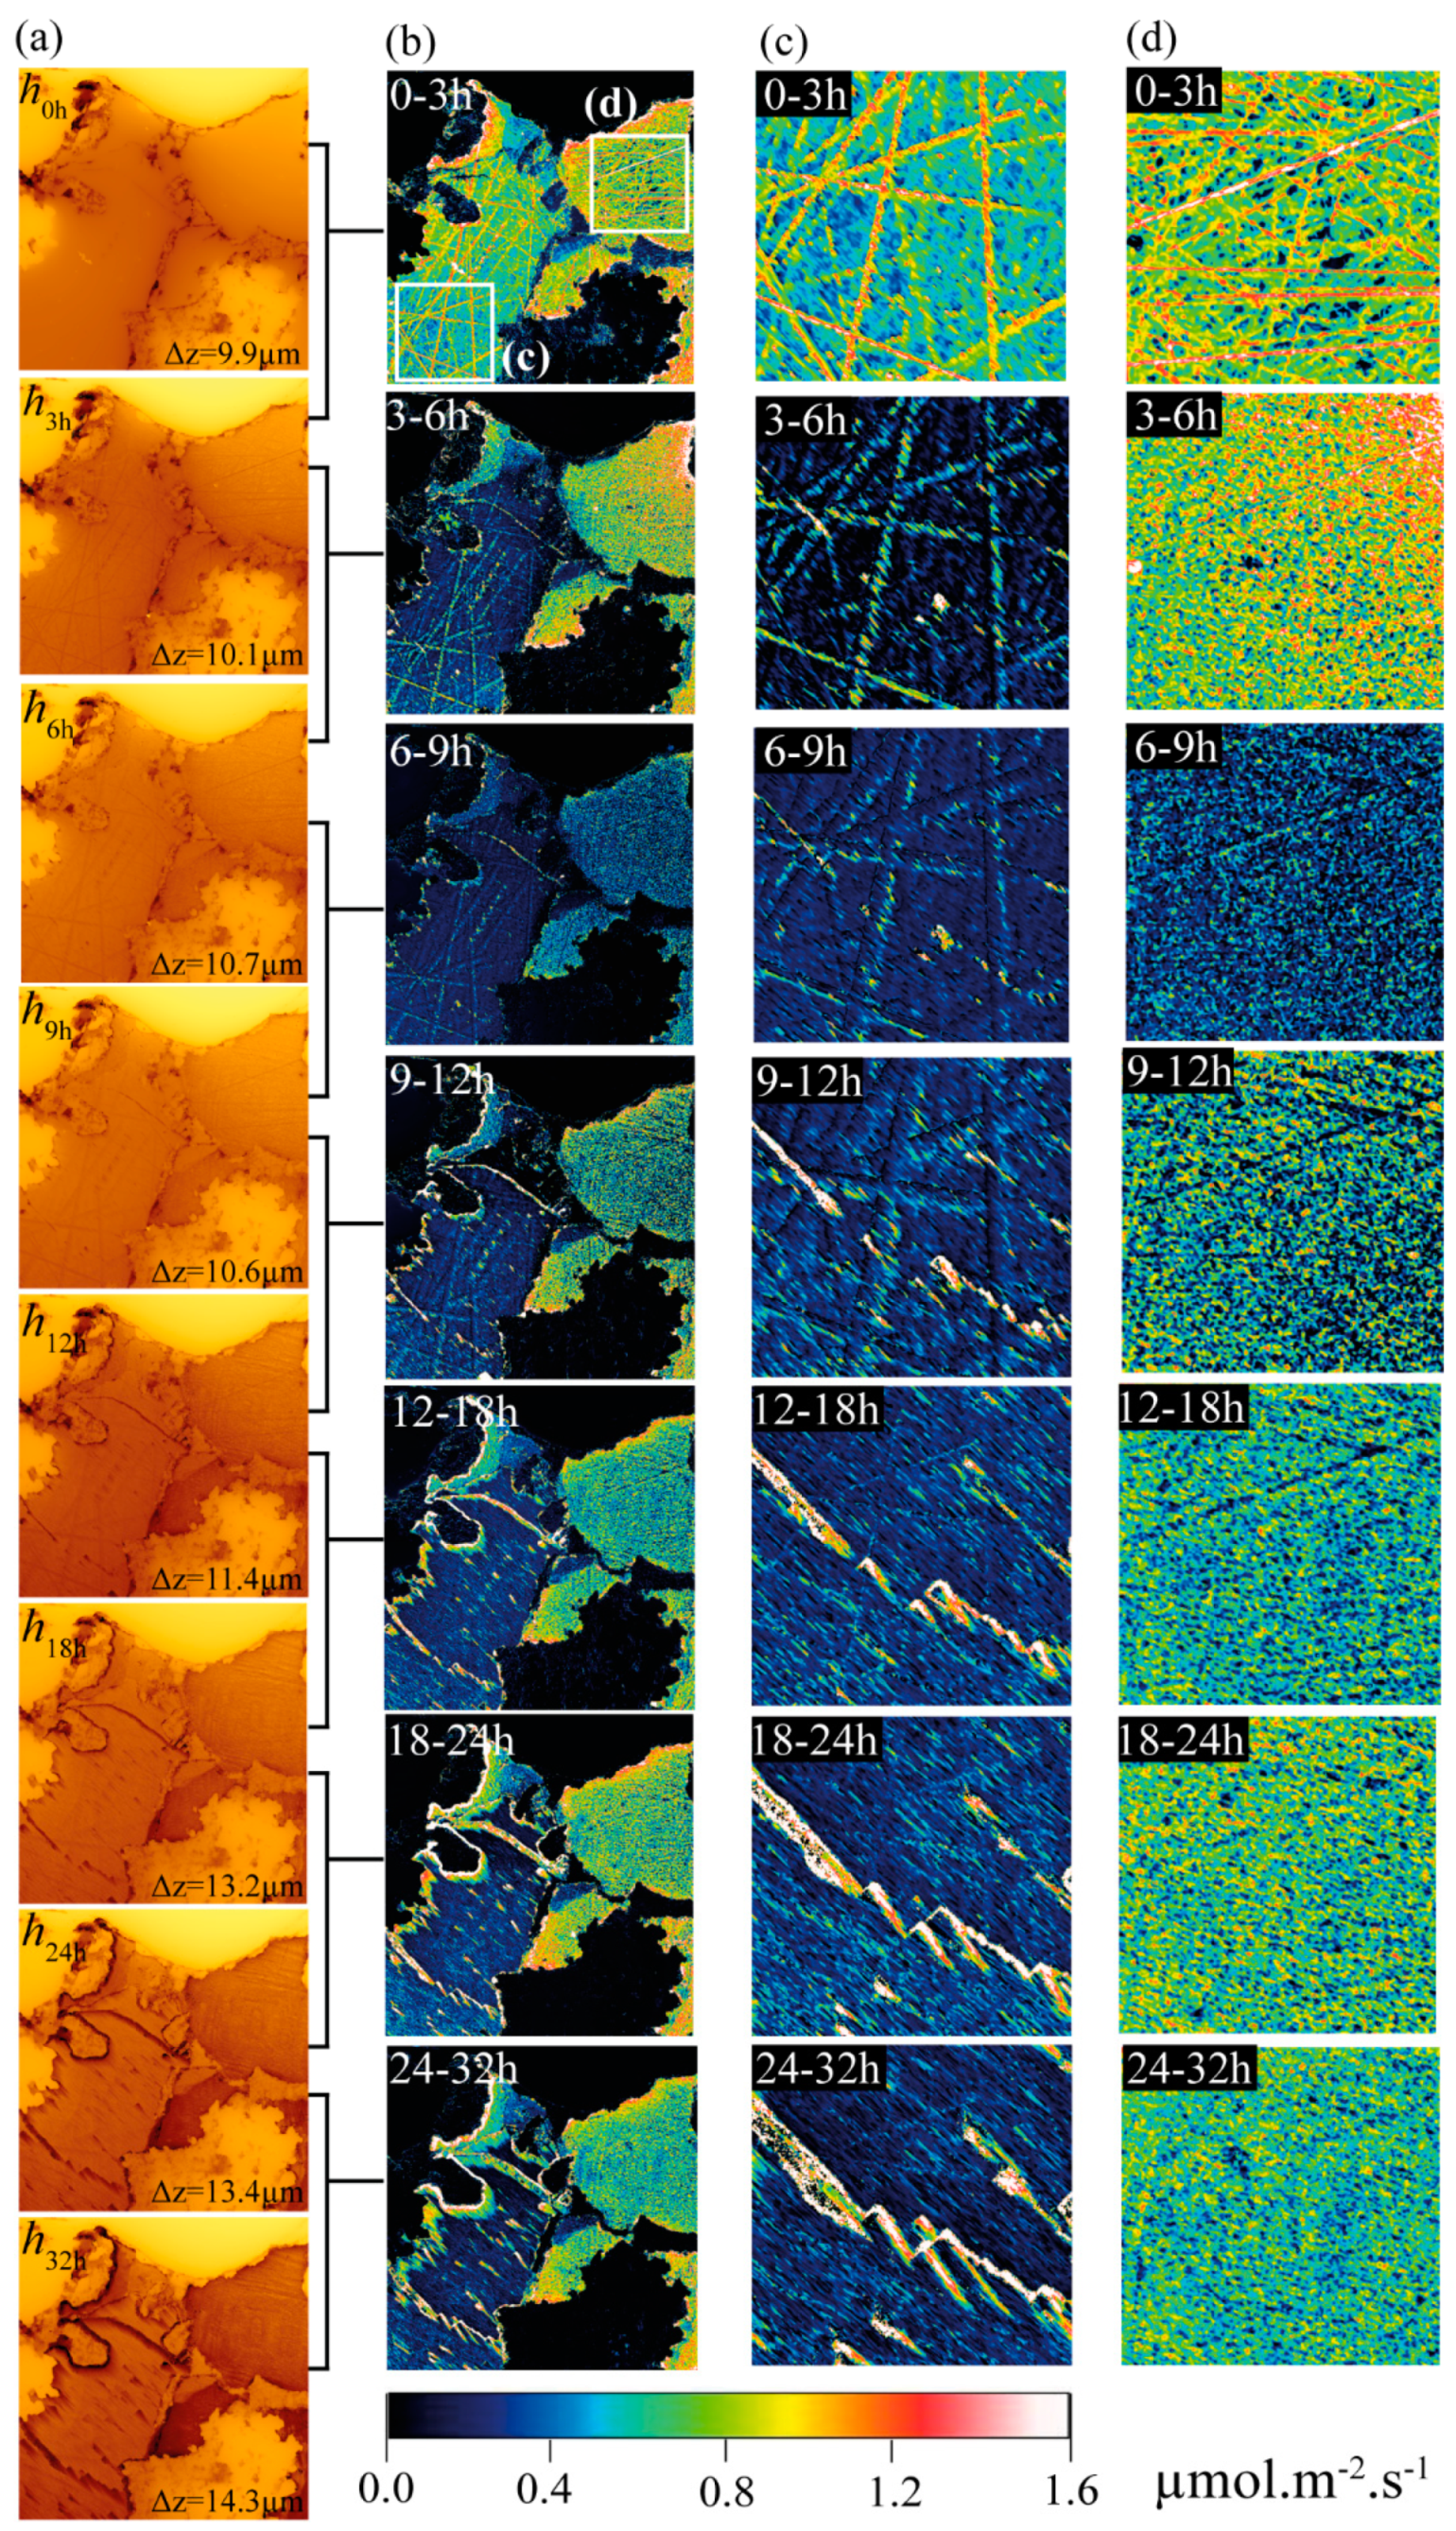
To investigate the dissolution rate variability that can occur inside a single sandstone pore, the patch of Figure 2a was selected due to its contrasting surface microstructures (see previous section). The VSI height maps (Figure 3a time sequence) show how the surface height changed during the dissolution experiments, with darker yellows corresponding to calcite and brighter yellows to the unreacted quartz and feldspar grains. Notice that the first four reaction steps have the same time duration (3 h), while the next two time intervals are of 6 h and the last of 8 h.
Figure 3b shows the sequence of rate maps calculated from the difference between the height maps (Figure 3a). The quartz and feldspar grains appear black in these maps, confirming the assumption that the retreat of these grains was insignificant in relation to the calcite retreat at the experimental conditions. In this calcite patch, the highest reactive sites are either at its edges or in random locations in the middle of the grains. The edge or grain boundary retreat is not uniform around the entire patch and changes intensity over time (Figure 3b). Two deep trenches, also visible in the height maps (Figure 3a), cross the left (higher) grain at the end of the experiment.
During the initial reaction, the highest rates in both sub-sections occur as straight-line dissolution patterns that are related to the shear-stress caused by the polishing process. After the disappearance of this polishing artifact, two distinct dissolution surface microstructures appear: an area that has an overall lower dissolution rate that develops deep pits (Figure 3c), and a more homogeneously rate distributed area that relates to the hill-and-valley surface microstructure (Figure 3d). We can only assume that these two distinct dissolution patterns belong to two different calcite grains. Notice that the initial polishing-related dissolution persisted much longer in the first grain (until at least 12 h) than in the hill-and-valley surface, where polishing artifacts are only seen in the first rate map (0–3 h). The rate maps show that big dissolution trenches, also seen in Figure 3a, developed from a row of elongated triangular pits that grew with the same orientation and directly from the middle of the grain (Figure 3c, 9–32 h). The rates also vary differently in the two distinct surfaces (detailed analysis is presented below). Lastly, the rate maps also show the steps of dissolution that gave rise to the step-pack structures seen in Figure 2b.

3.3. Statistical Analysis of Rates

Here, we present a detailed statistical analysis of dissolution rates found in the sandstone sample, focusing first on the intra-pore variability of a single calcite cement patch, and then on inter-pore rate variability of ten calcite cement patches (see the full topography data and rate maps in Supplementary Material Figures S4–S13).

3.3.1. Intra-Pore Rate Variability (Total Material Flux, Central Tendencies, and Rate Maxima)

The cement patch shown in Figure 2a was chosen for this analysis because it includes the diversity in dissolution microstructures and rates (Figure 3). The sub-sections of Figure 3c,d were used to perform the statistics.
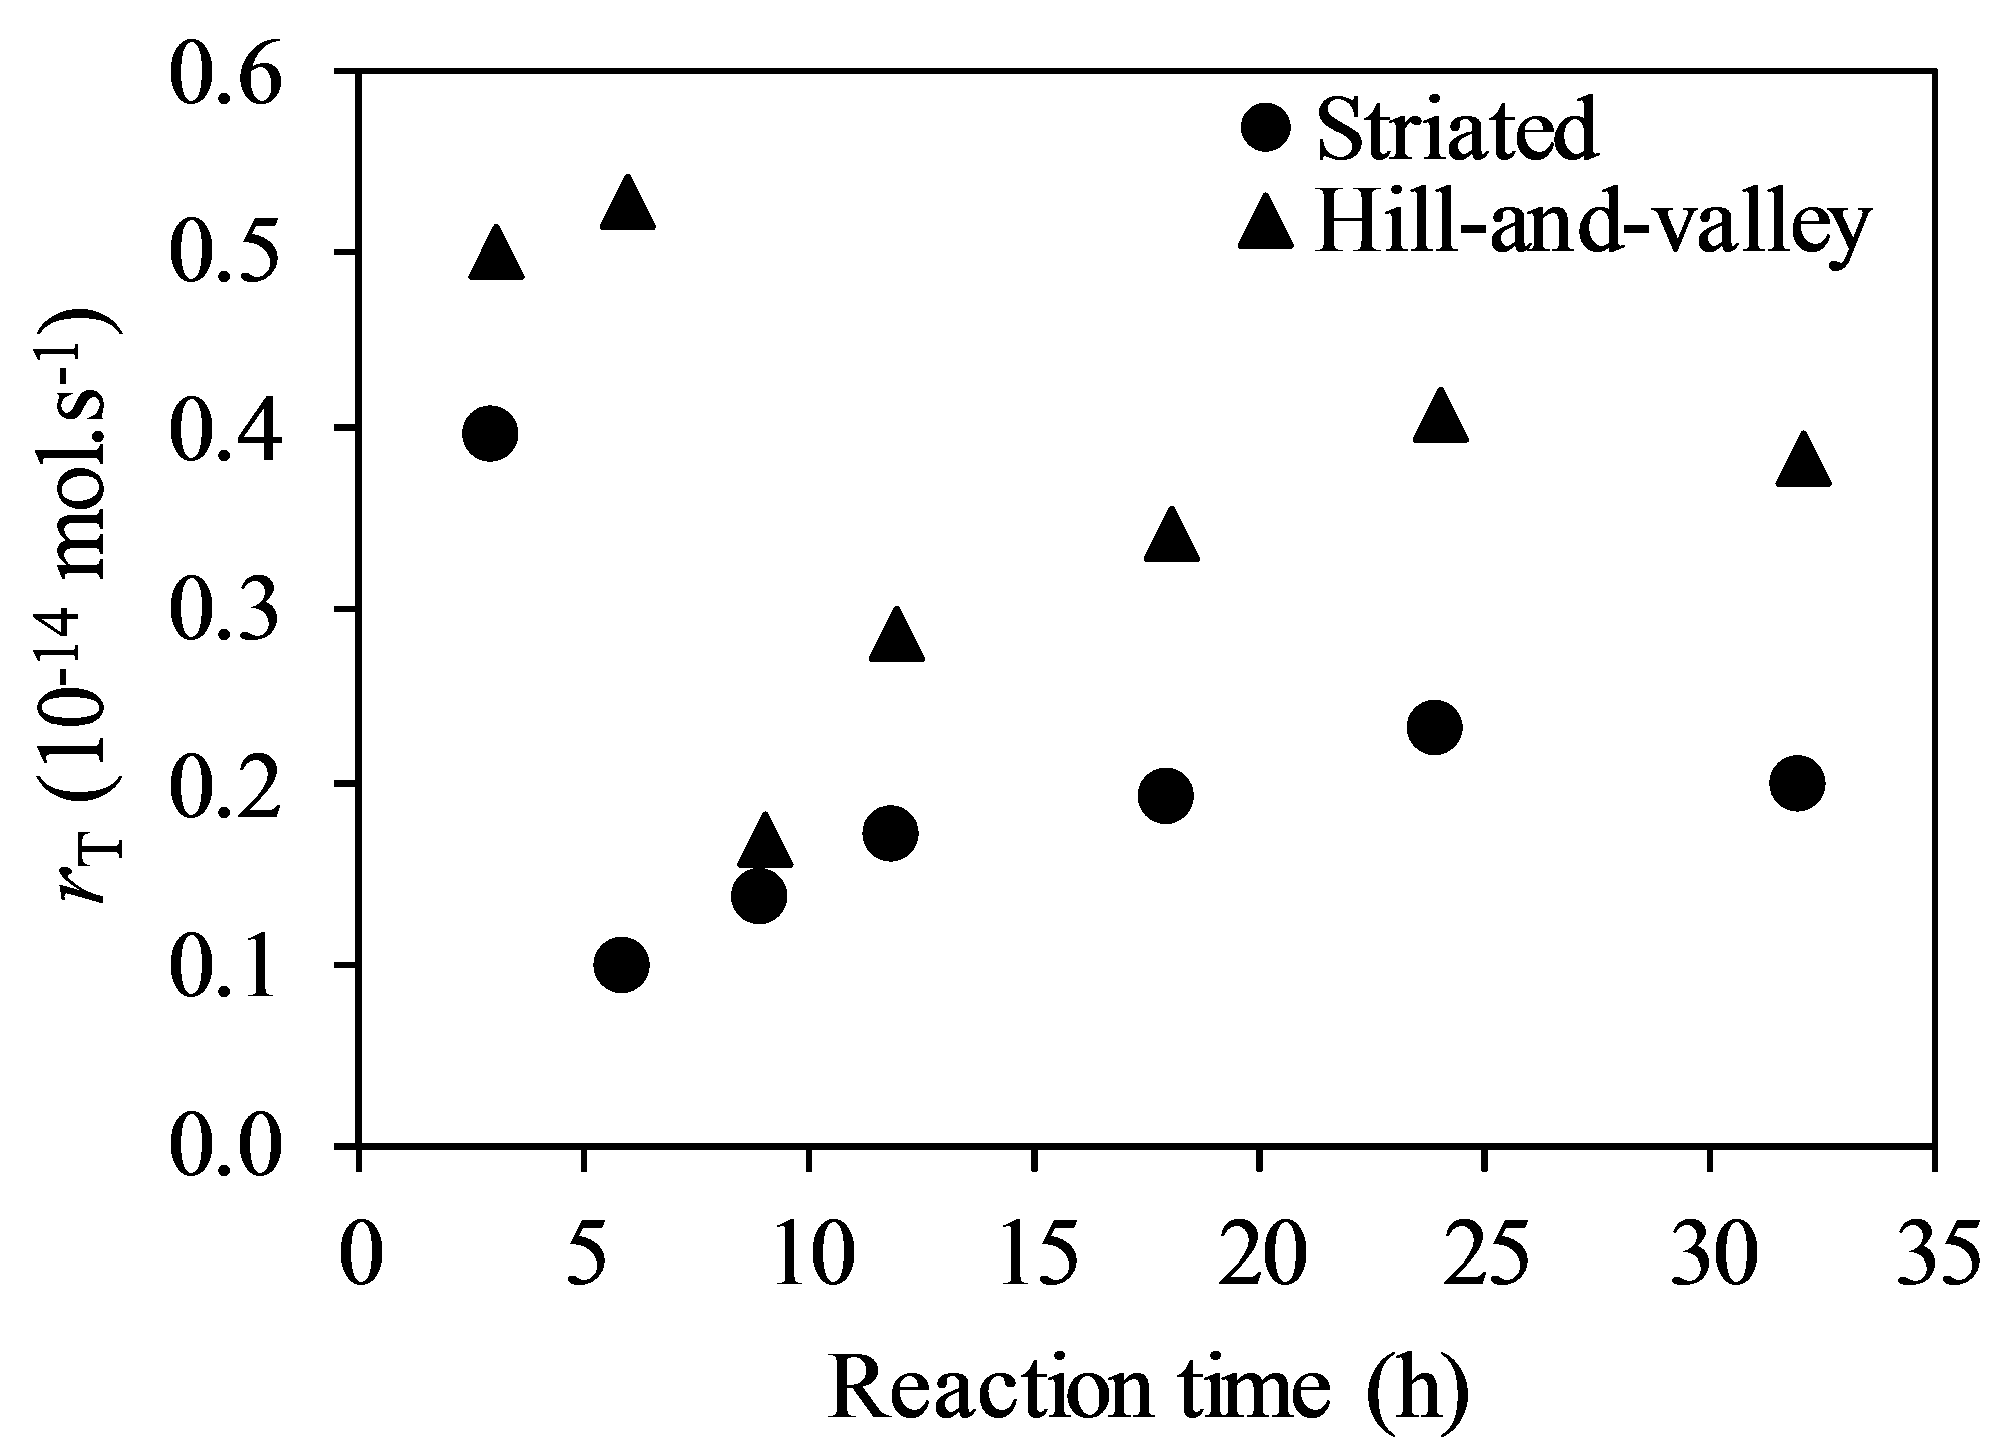
The total material flux rate (rT) of the calcite patches reflect the total amount of calcite lost during each reaction time interval (Figure 3c,d), calculated from the integral of the height difference maps (Δh). The total dissolution rate was always higher in the patch exhibiting hill-and-valley morphological type than in the patch with pits and striations (Figure 4). The striated patch (circles, Figure 4) underwent the highest material loss in the first 3 h of reaction (0.4 × 10⁻¹⁴ mol·s−1) and underwent a significant decrease in the following three hours of reaction, increasing steadily until 24 h, and underwent another slight decrease in the last 8 h of reaction. The hill-and-valley patch (triangles, Figure 4), maintained high (≈0.5 × 10⁻¹⁴ mol·s−1) rates during the first 6 h of reaction, which also decreased significantly during the next 3 h and increased again in a similar pace as its neighbor patch, but with an almost two times higher rate.
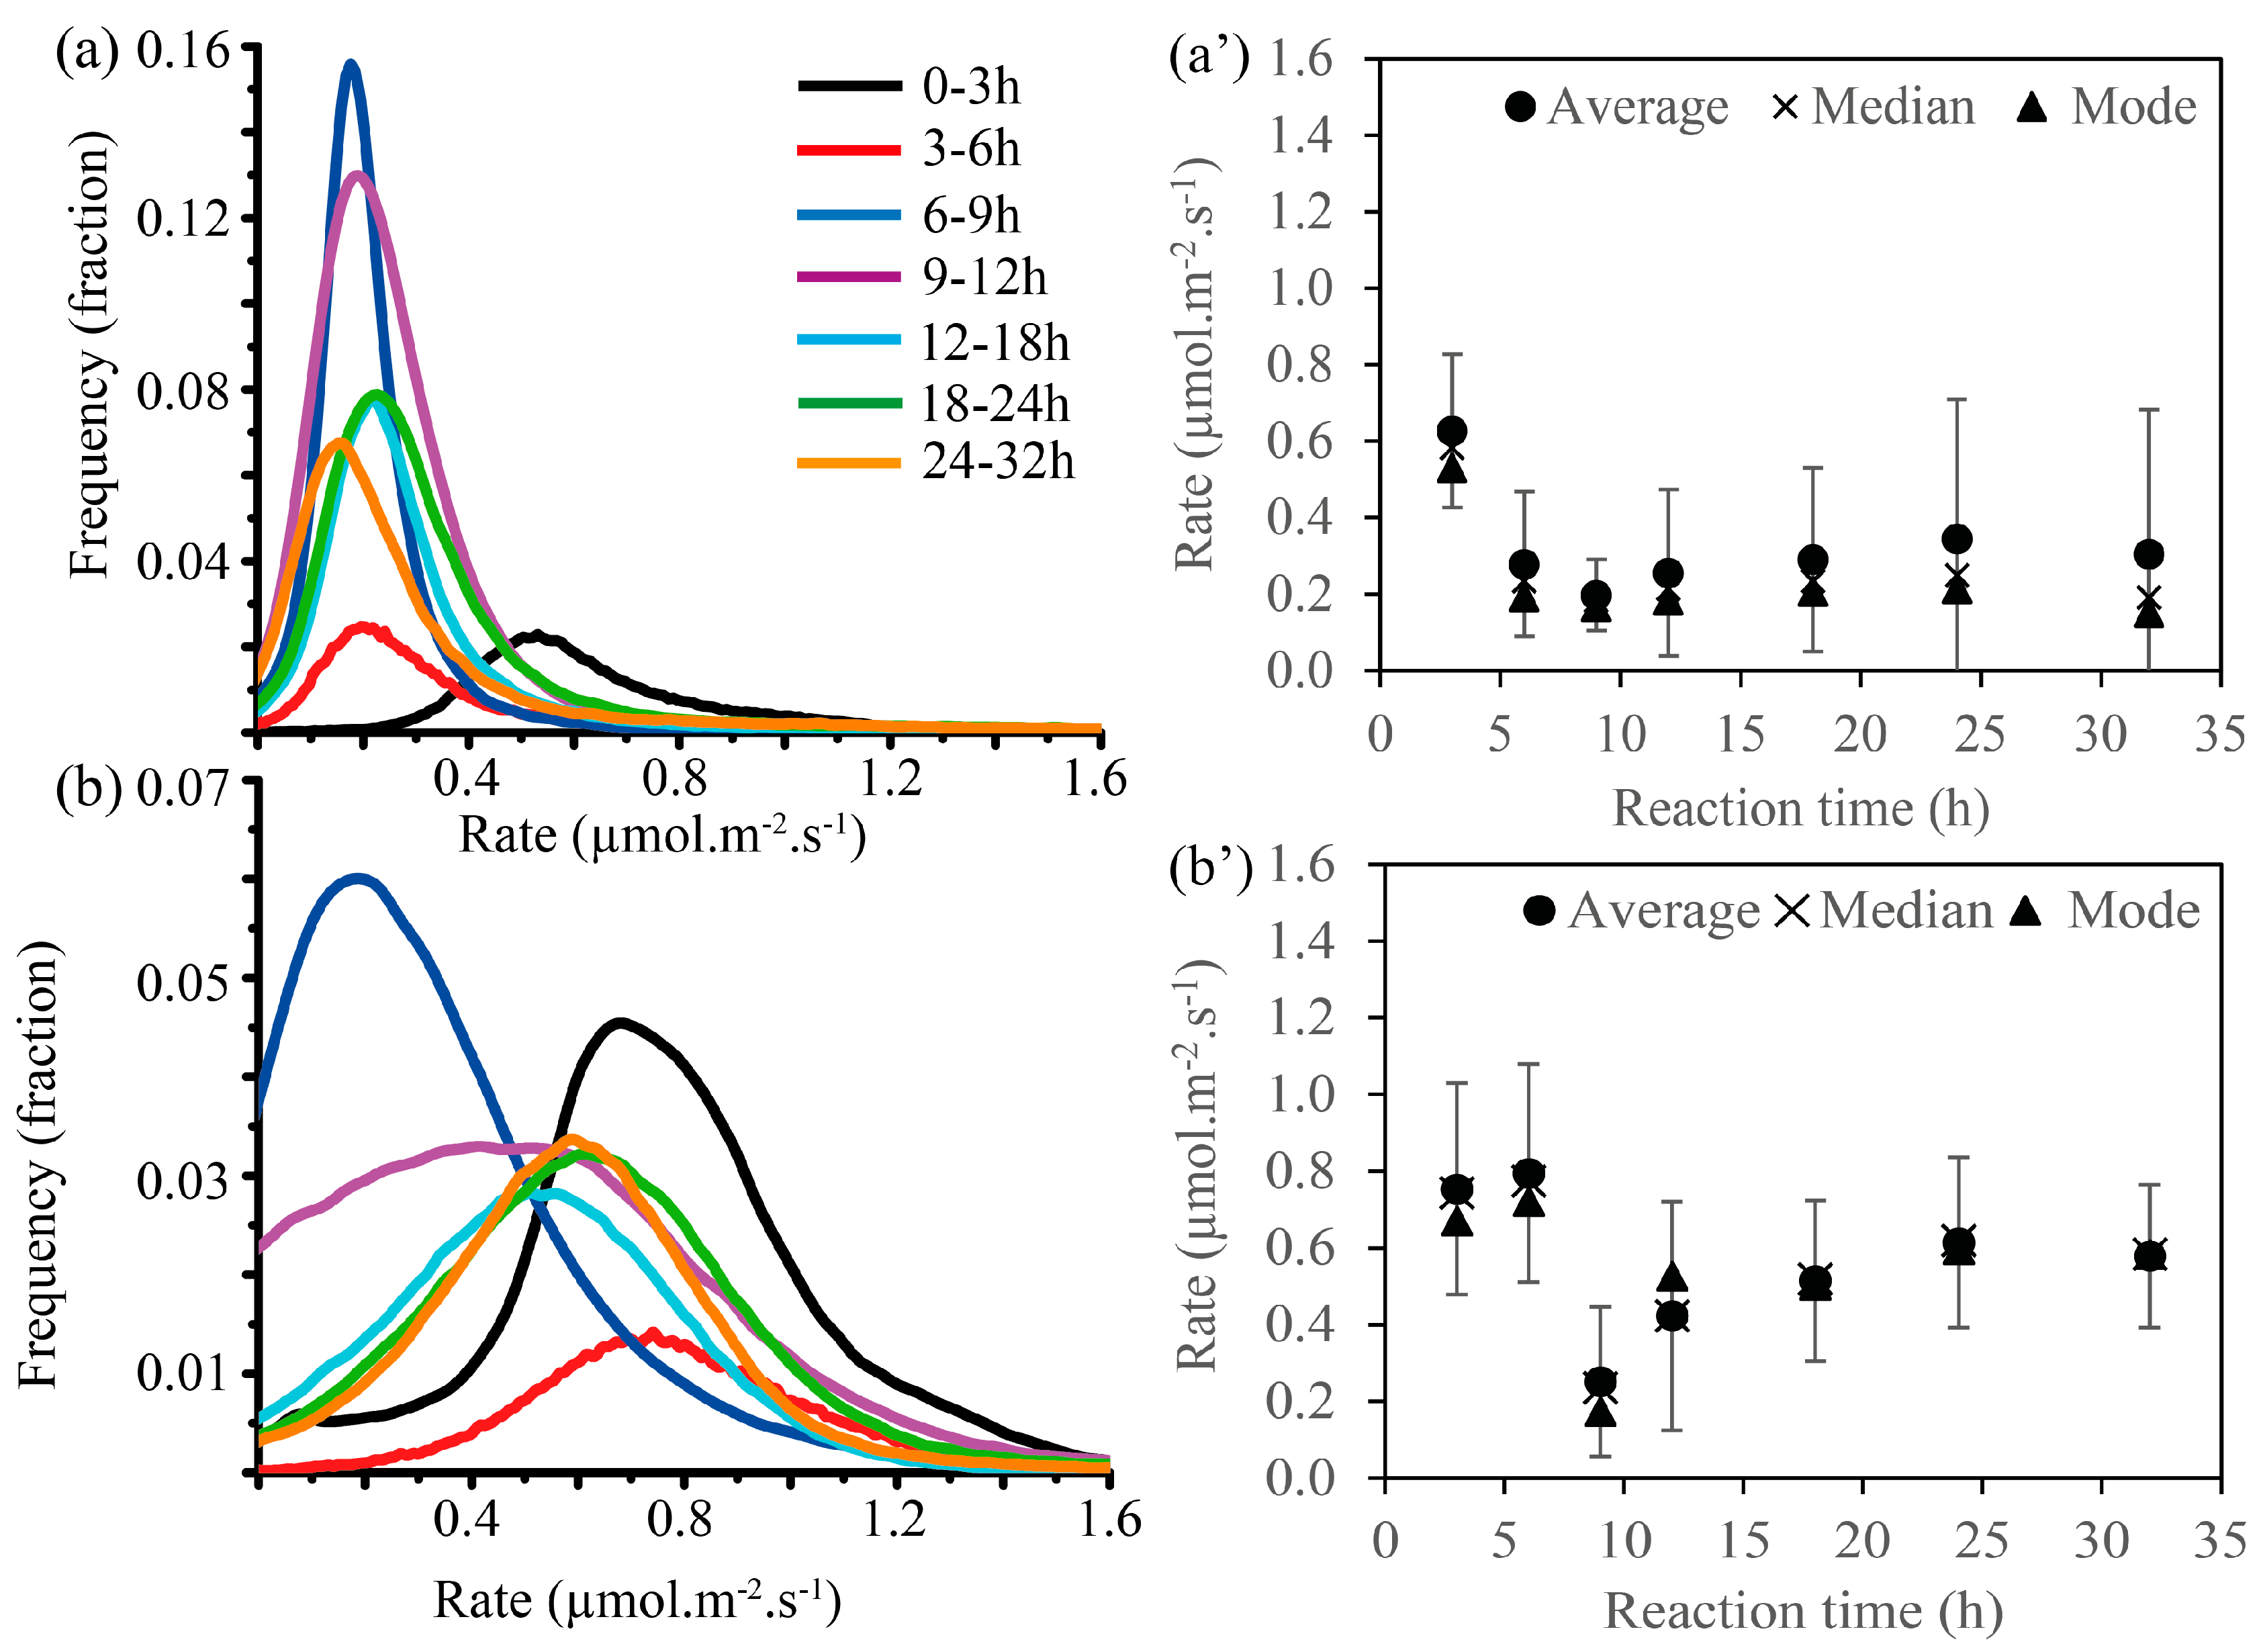
The rate spectra plots (Figure 5a,b) show the rate distribution of the seven reaction time steps for the two calcite cement sub-sections (Figure 3c,d). The striated sub-section that contains deep pits (Figure 5a) has a narrower distribution of central parameters (average, median and mode) than the hill-and-valley sub-section (Figure 5b). The plots of the central statistical parameters show that the first patch (Figure 3c) has a positive skewness maintained through the entire reaction time (see the difference between mean and mode at Figure 5a’), and the standard deviation of rates is also higher, when compared to the more homogeneous symmetric distribution also maintained through the entire reaction time (Figure 5b’). These plots also show that for almost all time steps, the more homogeneous sub-section dissolved faster than the other, except for time step 6–9 h, when the hill-and-valley sub-section suffered a significant rate decrease to 0.2 µmol·m−2·s−1. The corresponding distributions are wider, and high-frequency rates span wider ranges in comparison to the striated patch. The average highest rates (after the disappearance of the polishing artifacts) were 0.3 ± 0.4 and 0.6 ± 0.2 µmol·m−2·s−1 for the striated and hill-and-valley patches, respectively.
For better visualization of the rate central tendencies, the rate spectra of Figure 5 are limited to rates < 1.6 µmol·m−2·s−1. However, the rate maps include higher rates that occur at very low frequencies (the rate spectra “tails”). Although less frequent, these areas can account for significant material losses. Thus, a second statistical analysis was made of maximum rates, termed a statistical analysis of rate maxima (see below).
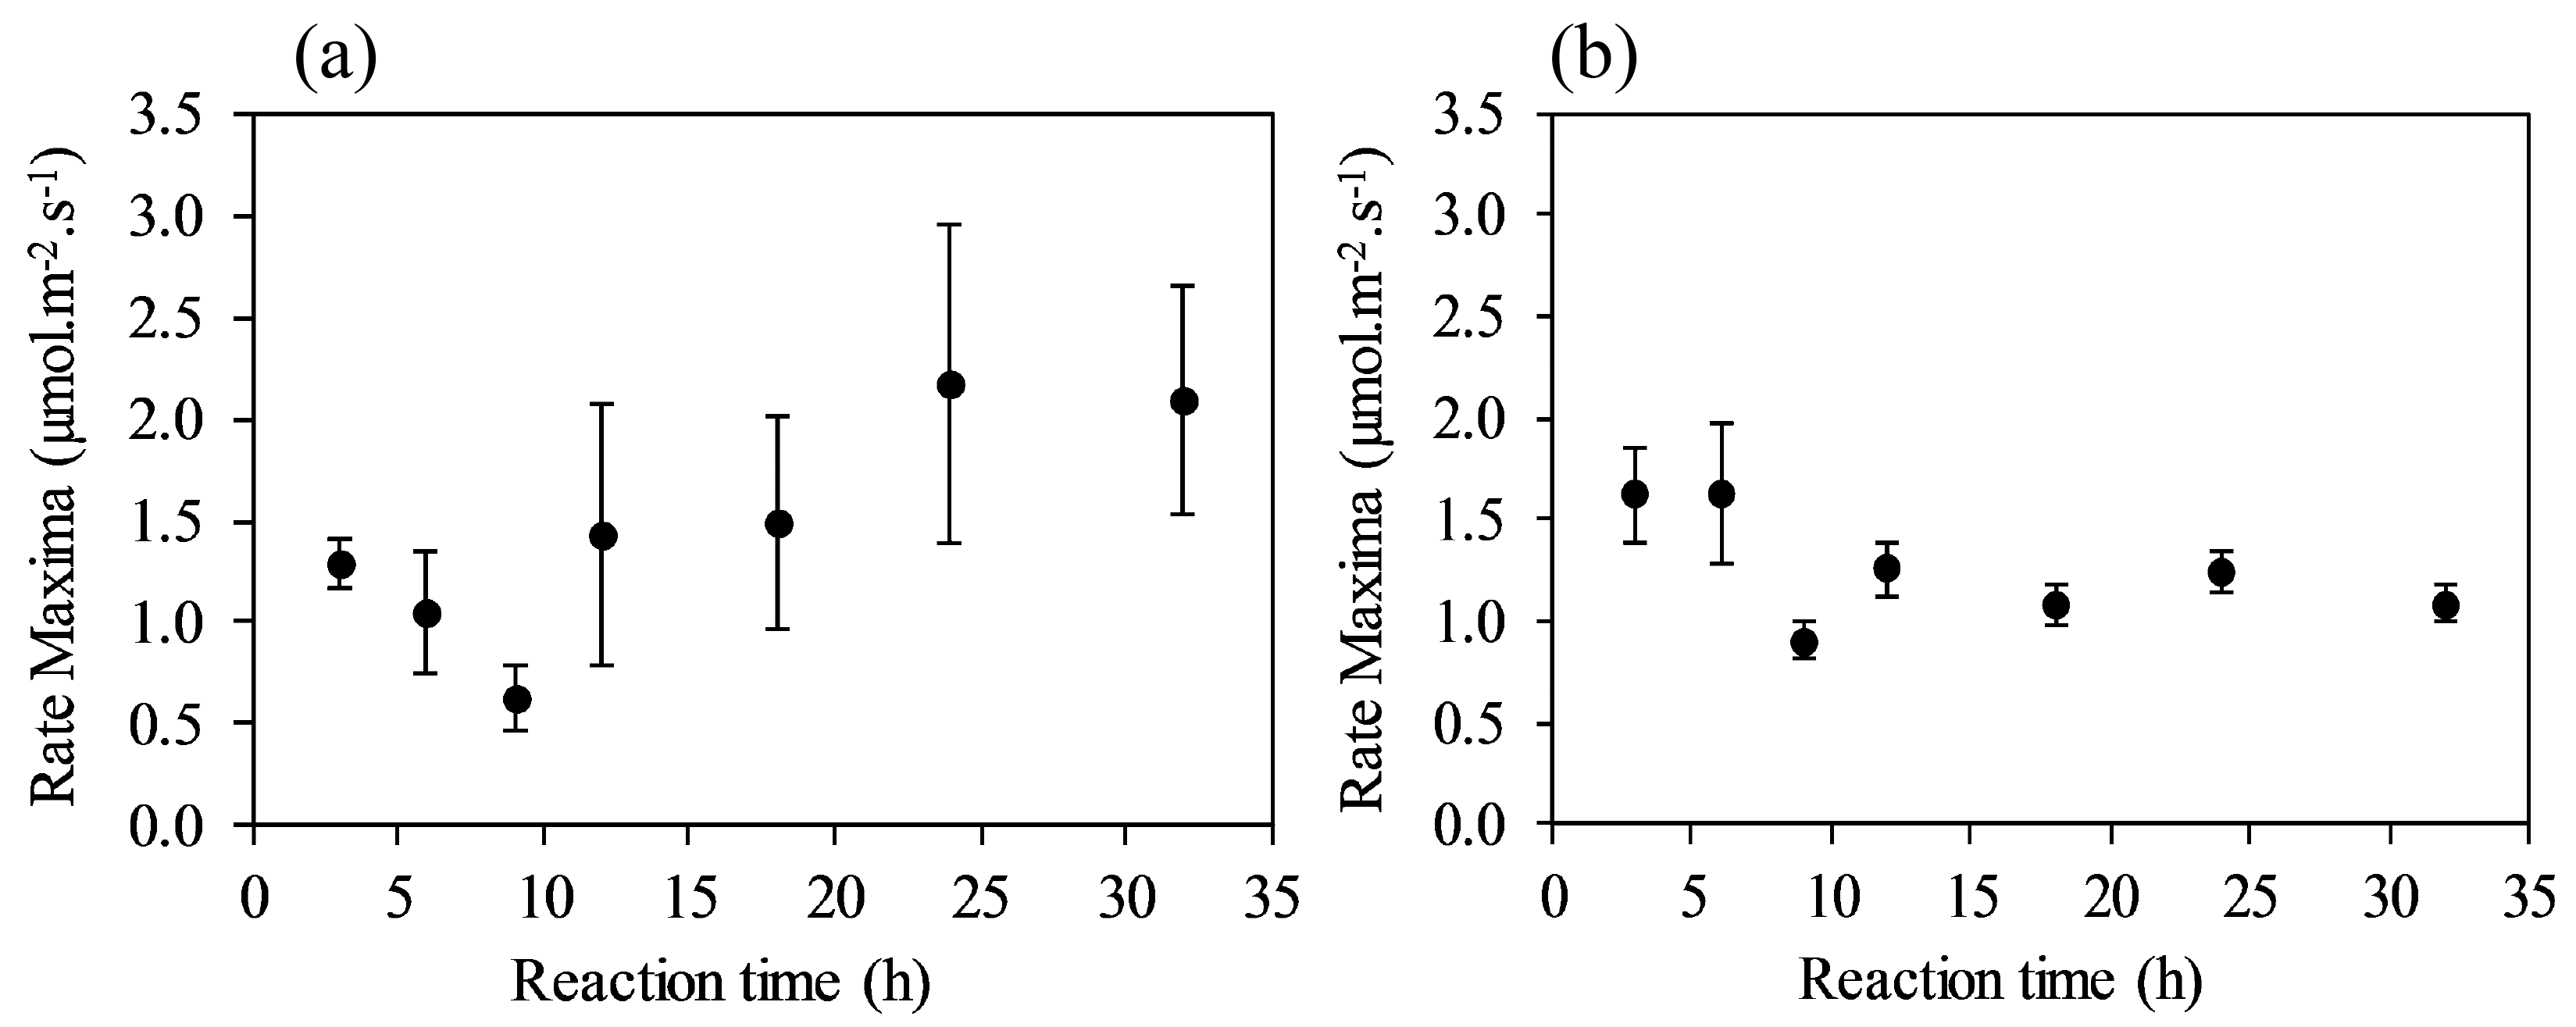
Figure 6 shows the temporal evolution of the statistical parameters of the maximum rates (MR) in the two reaction sequences (Figure 3c,d). The MR varied significantly more in the sub-section of the calcite pore in which pits develop (Figure 3c) than in the more homogeneous area (Figure 3d). When considering only the reaction steps after the disappearance of polishing defects, the maximum rates were almost two times higher for the patch in which pits develop, achieving 2.2 ± 0.8 µmol·m−2·s−1, compared to the rates of its neighbor patch (1.3 ± 0.1 µmol·m−2·s−1). The maximum rates of the hill-and-valley patch did not change significantly with time, having slightly higher rates (≈1.5 µmol·m−2·s−1) in the first 6 h, and ≈1.0 µmol·m−2·s−1 for the rest of the reaction. Note how the standard deviation of maximum rates is also much higher for the patch that developed dissolution pits (Figure 6a).

3.3.2. Inter-Pore Variability Statistics (Total Material Flux, Central Tendencies and Rate Maxima)

Here, we present a detailed statistical analysis of the reaction rates of the ten calcite-filled pores (calcite cement) of the reacted sandstone sample. The same statistical approach of the previous section was repeated for nine other cement patches. All generated rate map sub-sections and respective rate spectra for the full range of reaction times (0, 3, 6, 9, 12, 18, 24, and 32 h) can be found in Figures S14–S23 in Supplementary Material. The area covered by this statistical analysis was 6.7 × 104 µm2.
During the first nine hours of reaction, the average material flux (rT) of the striated patches (five in total) decreased linearly (R2 = 99.9%) with time (Figure 7a). During the rest of the experiment the material flux averaged between 2.2 ± 0.6 × 10⁻¹⁴ and 3.1 ± 1.0 × 10⁻¹⁴ mol·s−1 (Figure 7a). All patches were separated by less than 2.5 cm. The material flux of the hill-and-valley grains was always higher than for the striated type of surface, decreasing as well in the first 9 h reaction, stabilizing at 3.5 ± 1.5 × 10⁻¹⁴ mol·s−1 in the next 9 h and increasing to 4.1 ± 1.4 × 10⁻¹⁴ mol·s−1 in the last 14 h reaction. The central statistical parameters of the ten calcite cement patches (Figure 7b) generally show positive skewness in the rate distribution (average > median > mode). The modes (highest frequency rates), median, and average rates also decreased linearly (R2 ≈ 99.9%) for the initial 9 h of reaction, increasing linearly until 24 h reaction (R2 is 98.0%, 98.3%, and 91.1%, respectively), and decreasing slightly in the final 8 h of reaction. Rate dispersion in this last time step (24–32 h) is also slightly higher than in the previous time steps. The same is true for Figure 7c, which shows the variability of the maximum rates found in the calcite cement patches. The average of all maxima shows a steady average tendency around 1.6 ± 0.2 µmol·m−2·s−1.

4. Discussion

The experiments involved the reaction of a natural sandstone with a slightly alkaline solution and resulted in the dissolution of its calcite-filled pores (cement patches). The dissolution of these patches varied with time and sample location. The results reported far-from-equilibrium dissolution (undersaturated conditions) at surface-controlled conditions (high fluid advection). Such as demonstrated in Figure 1, average rates can be calculated from the material flux and surface area. In this example, the average rate plots in between the two most frequent rates. The significance and representativeness of this average value highly depends on the application. It is important to remind the reader that the selection of the two surface categories “striated and “hill-and-valley”, was purely qualitative from observation of their resultant surface morphologies (as shown in Figure 1) as the criterion for separation into these two groups.

4.1. From Polishing Defects to Crystallographically-Driven Dissolution

During the initial time steps, all patches showed the highest dissolution rates in patterns (Figure 3) that can be attributed to defects created by the shear-stress of polishing and lapping process. These patterns persisted for longer times (6–9 h) in those surfaces which subsequently developed morphologies termed striated sheet packet microstructures having rhombohedral shape. The surfaces that developed hill-and-valley microstructures typically attained their morphology transition after 3–6 h. The first are characterized by more heterogeneous distribution of rates, and the second by more homogeneously distributed rates (Figure 3c,d).
Changes in surface topography can be attributed to factors related to intrinsic crystal factors, such as the surface crystal orientation of each calcite patch. Similar to the approach of [33], we can relate the striated surface dissolution morphology to a plane that has a smaller “miscut” and tilt in relation to the cleavage plane, while the hill-and-valley surface morphology relates to a larger “miscut”. Moreover, larger miscuts effectively double the total dissolution rates (Figure 4). Although their crystallographic orientation is unknown, we can assume that the calcite cement patches developing deep rhombohedral pits are closely parallel to the {1014} calcite cleavage plane. We can also argue that much of the difference in surface dissolution seen in the two calcite cement sub-sections (Figure 3c,d) may be due to the crystal orientation itself. The two sub-sections are very likely different calcite grains that grew in different crystal orientations. The connection between dissolution rates of crystal material and orientation can be explained by the orientation-specific arrangement of reactive sites, such as steps and kinks [33,34], defined by the number of lattice neighbors (3 for kinks, 4 for step sites in calcite).
In an AFM study by [35], no polishing defects were seen in a 5° miscut calcite sample, which did not develop the typical calcite rhombohedral etch pits observed in the polished cleavage surface (zero miscut). The fact that they did not see any polishing artifacts on the miscut sample could reflect AFM’s smaller field of view, but in our study the polishing artifacts were also ephemeral features (hours). The prevalence of mechanical damage due to polishing effects has been reported for oligoclase in a study by [36], where polishing scratches resulted in dissolution rates that almost doubled the mean surface retreat.
The dissolution or growth mechanisms for each crystallographic plane, its morphology and ability to form etch pits, striations, hill-and-valley, and other morphologies, can be explained in terms of the Periodic Bond Chain Theory [37]. The reactivity of each crystallographic plane depends not only on arrangements of lattice bonds appearing on the surface, but also on the molecular structure of interfacial water binding to these sites. The strong dependence of reactivity for an exposed plane on the lattice bonding and interfacial water structure has been shown for carbonates [38] and other minerals [32] by Kinetic Monte Carlo modelling.

4.2. Intra-Variability of Rates

Overall, the consistency between the material flux fluctuations (Figure 4 and Figure 6a) and the fluctuations seen in the central statistics data (Figure 5a’,b’ and Figure 6b) reveal the accuracy of the analytical methods and data processing. As discussed in the previous section, both intra-pore and inter-pore data show a rapid rate decrease in the first hours (3–9 h), followed by a crystallographically-controlled dissolution (Figure 3). In all cases, the patches undergo a slight increase of dissolution rates until 24 h of reaction, and slightly decrease in the last 8 h. The decrease of rates in the last 8 h (e.g., Figure 4) could imply that the crystal dissolution process has achieved a temporary “steady rate” where surface dynamics is controlled by the same types of features and processes and rate distributions fluctuate in defined ranges, but can also be related to the reaction time interval being slightly higher than in the previous measurements. Longer reaction times would be necessary to verify for how longer this apparent “steady-state” would prevail in time. Probably not too long, due to the decreasing grain size (more details ahead).
The temporal evolution trends of the total rates were correlated to those of central statistical parameters calculated from the rate maps (Figure 8). The hill-and-valley surface total rates highly correlate to the average and median rates (Figure 8a,b), and have lower but still linear correlation to the modes (Figure 8c). In the striated surface the correlations are much lower (see Figure 8a–c). This lower correlation between central statistical rates and the total rates might reflect the higher impact of the dissolution pits of maximum rates to the overall dissolution (discussed in more detail below). Therefore, the areas controlled by crystallographically-defined processes, e.g., etch pit structures and microscopic step distributions, exhibit statistically different behavior.
Since we capture rates in time lapses, the variations between these time lapses is missing. This is a natural consequence of a finite difference approximation in rate calculations according to the formula r = ∆h/∆t. This means that if we were to subtract the 12 h or 24 h height map (Figure 3a) from the 3 h map, or any other combination of height maps, we would obtain slightly different rate values than in the rate map sequences shown in Figure 3b. Thus, as already observed in previous studies (e.g., [20]), measured rates differ according to the time we spend observing them. The associated method error is constrained by its spatial and temporal resolution. Due to the dynamic surface changes that occur during the ongoing of a dissolution process, the local dissolution rates seen at the nano to macroscale can effectively vary in time ([16], and references therein). Generally, the method captures variations at the nano to micron-scales relevant to pore-scale processes.

4.3. Inter-Pore Variability of Rates Versus Grain Size

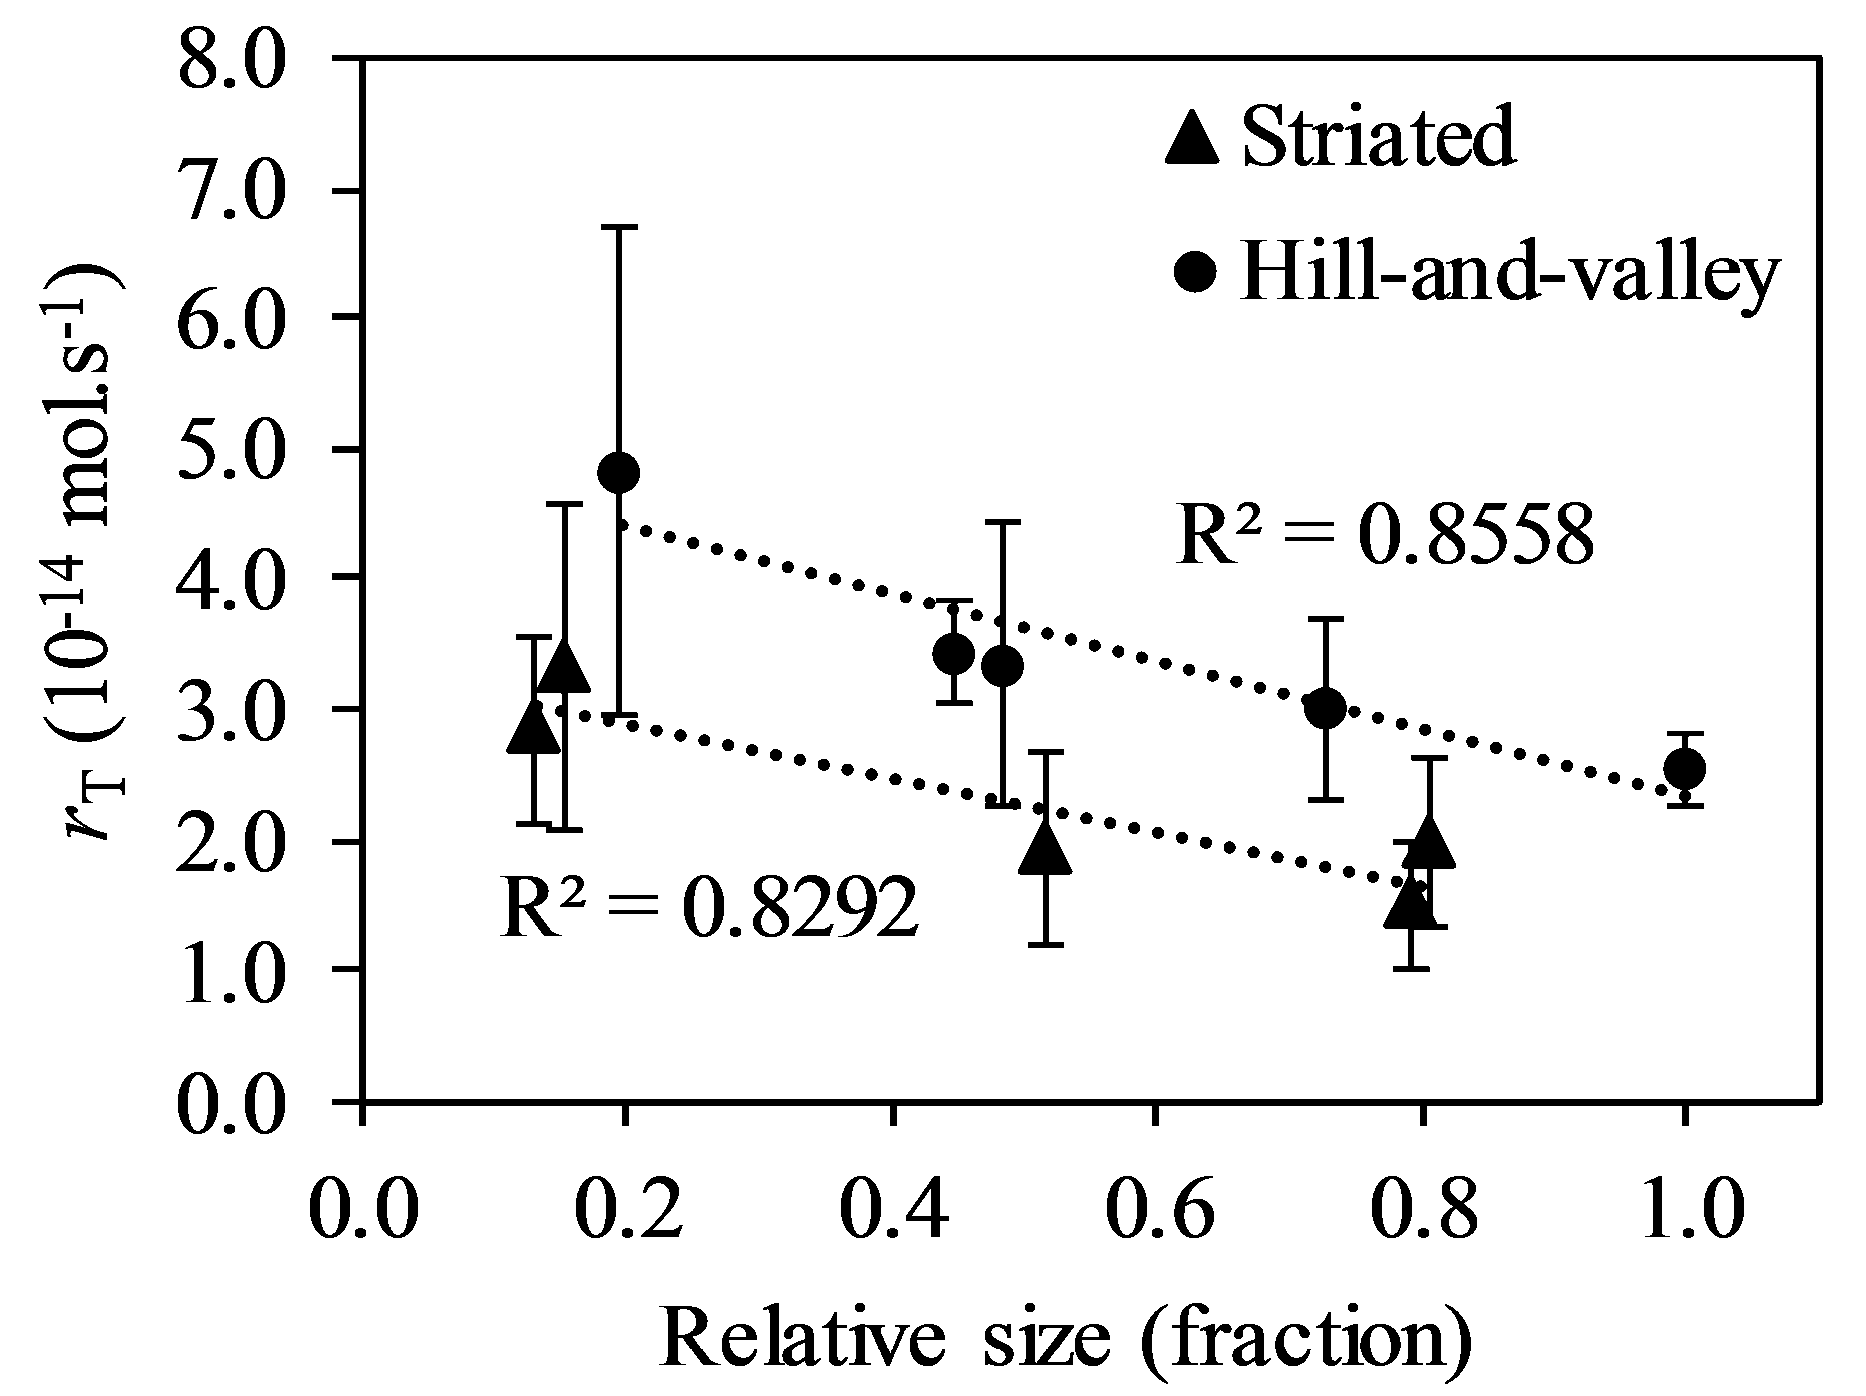
Concerning the results for inter-pore variability, the total rates were normalized to the relative size of the cement patches (Figure 7a). Thus, the grain size effect can be captured by analyzing normalized material fluxes as a function of the grain size. Effectively, smaller calcite patches tend to have higher size-normalized dissolution rates than the bigger ones (Figure 9). In this plot, the size of the grain is not relative to a 3D surface area measurement, but to a geometrical surface area or 2D area. Thus, plotting it against the change of rate over time, would give us the rate change over time, because the size of the grain is always the same. We wanted to investigate the tendency of the overall cement patches. If smaller patches dissolved faster than the bigger ones. This trend is slightly lower in the grains that developed the striated dissolution patterns (R2 = 82.9%) than in the hill-and-valley surfaces (R2 = 85.6%). Given that both types of surface morphologies show the same size-rate tendency (Figure 9), reduces significantly the hypothesis of this result being the coincidence of smaller samples having as well a more reactive orientation.
When dissolution is controlled by steps and distributions of their sources, grain edges may become a significant source of reactive features (steps and kinks at grain boundaries, such as illustrated in Figure 7 of [12]). Subsequently, smaller grains can have higher densities of these reactive features in the observation areas, and higher rates can result. In contrast, if dissolution is not controlled by the grain boundary reactive features, but the surface already contains reactive sites, such as stepped S and kinked K faces originated from a cross-cut to the surface, according to Hartman and Perdok [37,39,40] classification, the grain size indeed should not have influence unless it belongs to the nano-grain region where atomistic effects become important. Anisotropic surface kinetics related to different crystal faces and grain size have been demonstrated in kinetic modeling studies [41,42,43]. This interplay between dissolution steps generated at grain edges (or grain boundaries) and steps generated from crystal defects in the middle of grains (e.g., point or screw dislocations) has been previously discussed and demonstrated via kMC modelling [16]. At grain edges, reactive curvilinear steps constantly form supplying the grain with kink sites. At middle etch pits, straight steps with low kink site density form in the presence of active hollow cores. Thus, dissolution in the middle of grains (i.e., very large “patches”) would be more at the mercy of step movement at the boundary of etch pits that must continue to nucleate new “double kinks”; in contrast, steps at the edges have no such requirement. Smaller grains dissolve at faster rates because the grain has more step generator contributors.

4.4. Contribution of the Rate Maxima to the Overall Rates

The rate maxima observed in the single analyzed patches (Figure 6a,b) show distinct trends. The high maxima dispersion (high standard deviation) observed after 12 h reaction time in the striated surface (Figure 6a), reflects the appearance of the dissolution pits observed in that grain (Figure 3c). The rate maxima of the hill-and-valley grain (Figure 6b) are lower than the previous and much less dispersed (lower standard deviation), reflecting their homogeneous distribution. There, the maxima are attributed to the “hills” hypothetically containing highly reactive curved steps arising from nano-scale etch pit interactions [44]. The higher dispersion of rate maxima (Figure 6a) is attributed to the “long tail” of the rate spectra for striated with micron-scale etch-pit surfaces (Figure 5a), whilst lower maxima dispersion (Figure 6b) occurred for more homogeneously distributed wider rate spectra characterizing hill-and-valley structures (Figure 5b).
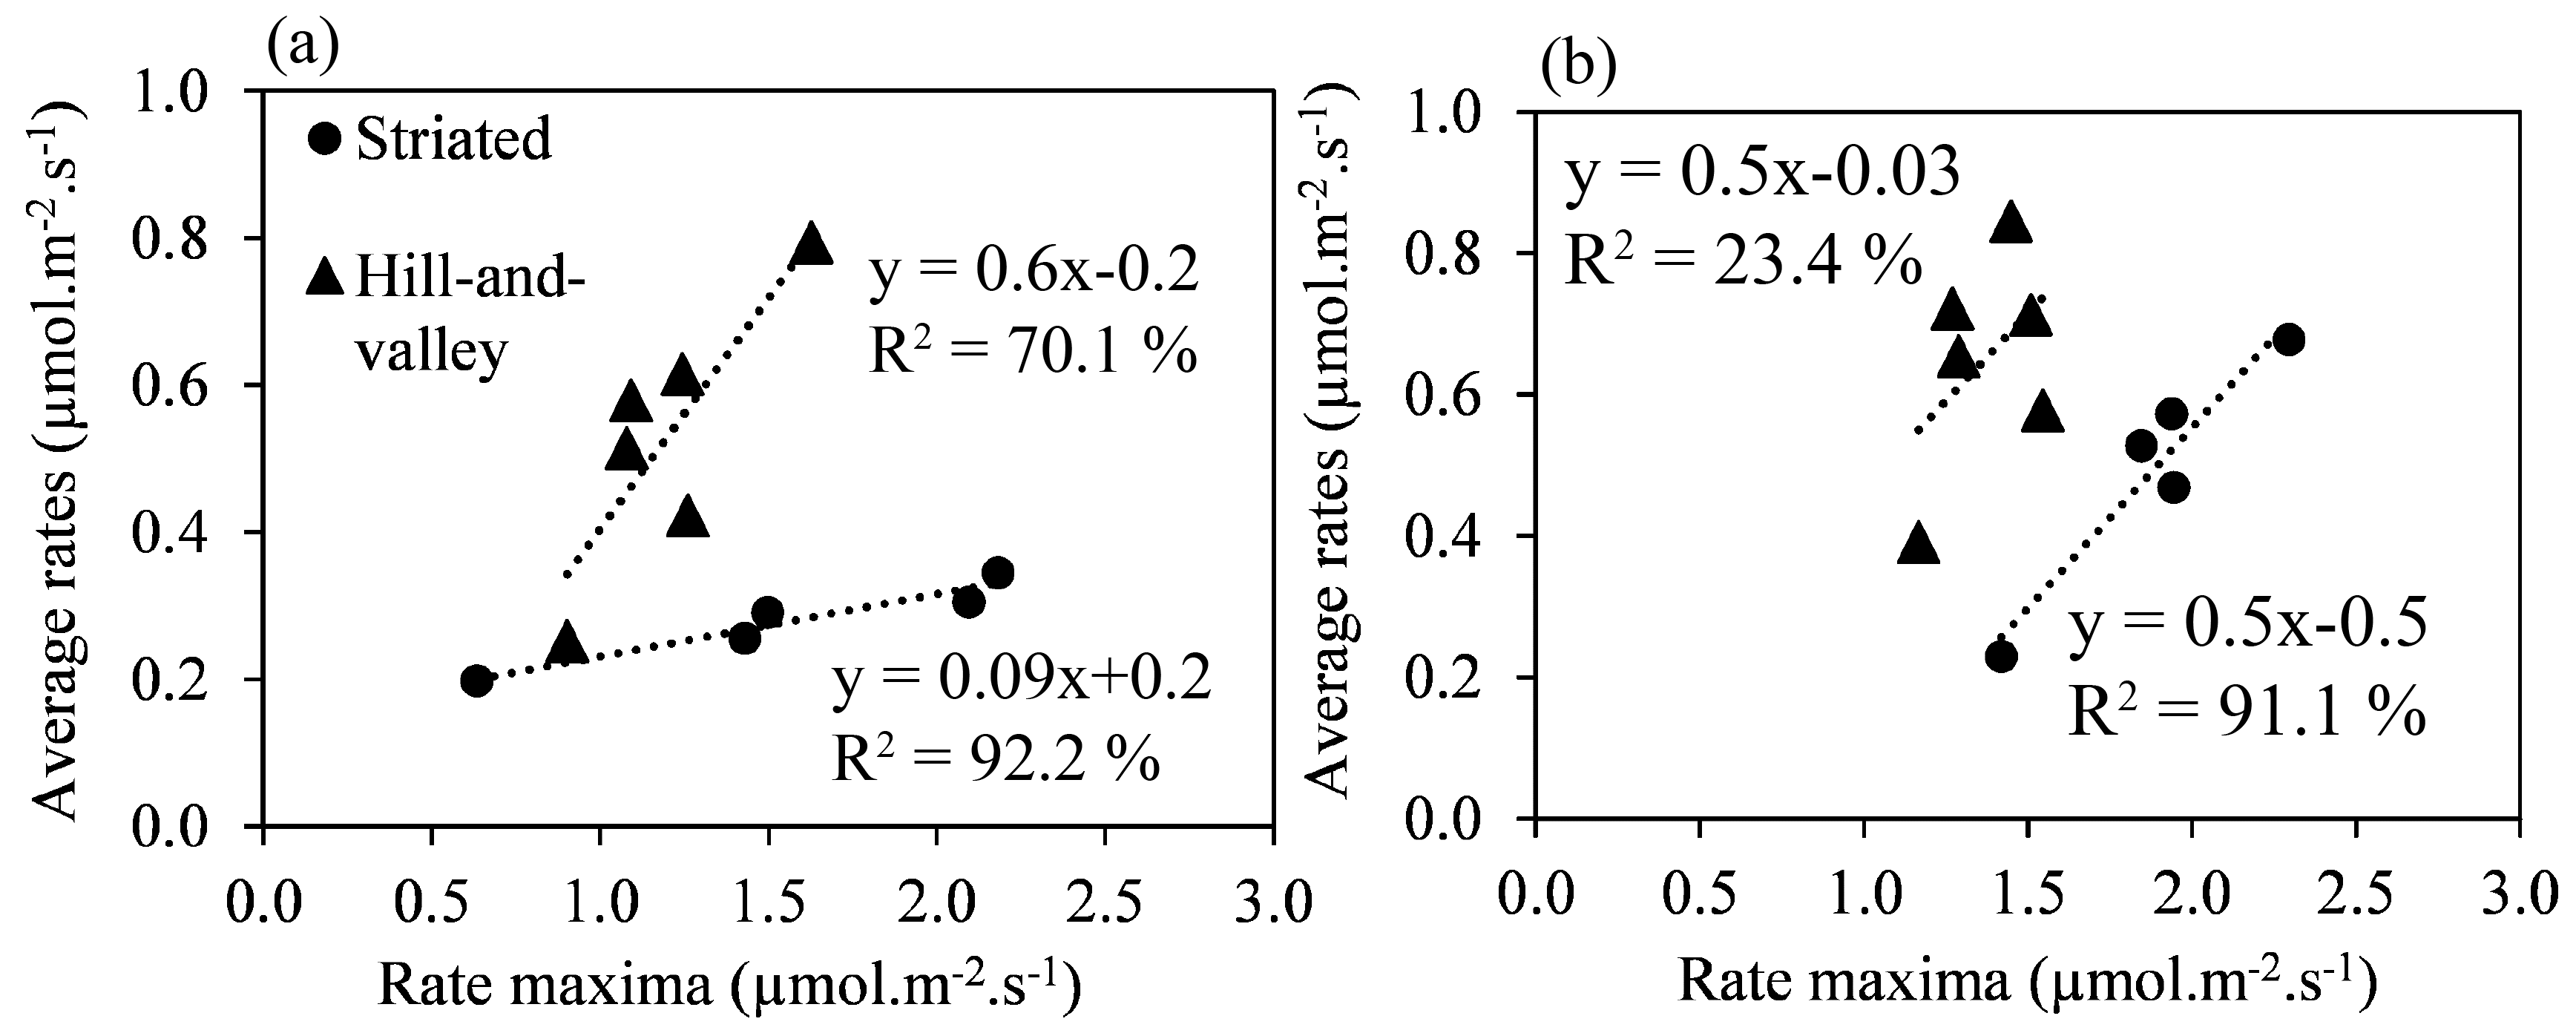
The data presented here, show that there is a close relationship between the microstructure/topography of the dissolving surface and the output rates, and that the output rates have to some extent a stochastic nature that can only be clearly defined using proper statistical analysis. For example, we found that there is a positive correlation between the rate maxima and the average rates (similar but lower for median and modes) in both striated and hill-and-valley surfaces (Figure 10a,b). However, the plots show a contradiction between intra-pore and inter-pore data. In the single patch (Figure 10a), the rate maxima have higher effect on the average rate of the hill-and-valley surface, whilst in the inter-pore data (covering data from 10 cement patches) the higher effect is on the striated surface (Figure 10b), as evidenced by the slope of the linear trends (Figure 10a,b). We would expect that the later observation is true, because the appearance of higher dissolution pits would generate more contrasting rates, bigger “tails” and would have a greater effect on the average rates, but it seems that in that single patch (Figure 3) the pits were just not deep or frequent enough for such contribution. That expectation was then met when we plotted the maximum rates against the central statistical parameters of the full set of patches (Figure 10b). In this higher set of data, the rate maxima of the etch pits in the striated surfaces contributed positively to the shift of the average rates, and there was no significant contribution of the maximum rates to the average rates of the calcite patches that dissolved homogeneously with the hill-and-valley surface structures.
We would like to add that, although the rate maps rate data is quite complex, we could have rate maxima repeated twice in the same data set due to the procedure used to extract the rate maxima from the rate maps (maximum value from each row and column of pixels).

4.5. Relevance to Previous Research and Implications

The variability of literature calcite dissolution rates has been extensively discussed before [12,15,16,25,45]. To sum up, the known parameters that influence dissolution kinetics include extrinsic parameters (related to the fluid and the environmental conditions) and intrinsic parameters (related to the solid) that operate at different scales (Table 1). It is important to note that at the interface between the fluid and the dissolving surface (fluid boundary layer), some of micro-nanoscopic parameters will likely interact with one another. The results presented here are the outcome of all these parameters acting together in concert, and the complex system that results cannot be easily mechanistically interpreted. Nevertheless, experiments with well-defined extrinsic parameters and statistical analysis of results provide important clues for defining the intrinsic parameters. As discussed by previous authors [17,38,44,46,47,48], this effort can only be achieved with the combined effort of numerical modelling studies.
The highest frequency dissolution rates reported here (e.g., Figure 7a) are in the same order of magnitude as reported in other VSI and AFM studies [18,22,49]. The closest similarities in rate variations are found in the study by [18], where practically all experimental conditions were the same (T, P, pH, alkalinity) and similar reaction time lapses were used (0.75 h). Contrary to this study [18], we did not see perfect rhombohedral-shaped etch pits. This is expected, because these features are specific to atomically flat crystal planes, such as the 104 cleavage plane of calcite. The calcite surfaces exposed here originated from the polishing of a sandstone sample. Thus, we had no control over what planes would be exposed. Still, we systematically observed two resulting morphologies (striated and hill-and-valley) that resulted from statistically different overall dissolution rates. In the study by Bibi et al. [18], the maximum registered rate at a macro-step was 1.4 µmol·m−2·s−1 that is within the rate maxima range registered here (1.6 ± 0.2 µmol·m−2·s−1). Although, we also saw similar macro-steps, the higher rates did not necessarily originate from macro-steps features (see e.g., Figure 3c; 24–32 h). This suggests that different surface topography features can as well result in the same rates. In the study by [22], a calcite marble sample was used and rates were also reported for a similar reaction time lapse as here (8 h). There is a certain similarity between the striated surfaces shown here and the surface of the reacted marble. These similarities might be related to a similar crystal plane orientation.
In other VSI studies [12,34,50], authors have reported lower (around one order of magnitude) calcite dissolution rates. However, the methods used for the calculation of dissolution rate were slightly different. The “global rate” reported by [12] is one order of magnitude lower (0.2 µmol·m−2·s−1), but the “total rate” that includes the contribution of a deep etch pit, is in the order of magnitude of the central statistical parameters reported here (0.1 µmol·m−2·s−1). These lower rates might be explained by the method used for their calculation (a single cross-profile height retreat), and by the location of the measurement (far from the edges of the crystal). Davis et al. [50] used five transect profiles in each sample to calculate an average height retreat, which can underestimate the full range of rates in the samples. The authors reported different rates for different reaction times (8 and 33.5 h) and dissolved single crystals in petri dishes using cell-free control nutrient-loaded fluids that might as well have influenced the outcome of dissolution. Nevertheless, the rates for the low nutrient case were very close to the ones reported here, i.e., between 0.54 and 0.62 µmol·m−2·s−1.
Smith et al. [33] reports a mean height retreat from profile lines, but it is not clear how many they used or what was the criterion used for their location, or what was the reaction time lapse used. Notwithstanding, the authors [33] report the variability of rates due to the anisotropic dissolution of calcite. Although the range of rates is somewhat smaller (0.012 to 0.4 µmol·m−2·s−1) than the reported here, their highest rates are within the most frequent rates (rate modes in e.g., Figure 7b) of the calcite cement dissolution.
Other VSI studies [51,52], report one order of magnitude lower average dissolution rates (0.08 and 0.07 µmol·m−2·s−1, respectively) for calcite single crystals. The overall rates reported in these studies were calculated by averaging the overall height retreat and dividing it by the surface area obtained from the topography map. This method might underestimate the contribution of etch pits to the rates. Two orders of magnitude lower calcite dissolution rates are also found in literature [53]. These have been calculated from height differences of profile lines over the reacted surface, but the criterion for choosing the location of those profiles was not given and might justify to some extent the difference. However, from what we saw here, the orientation and the size difference between our grains and the single crystals used in [53] might have played the most significant role.
Moreover, VSI dissolution rates have been measured by [54] using a mixed flow set-up and slightly carbonated fluids with saturation states in relation to calcite close to zero. The authors [54], obtained a mean rate of the same order of magnitude (≈0.5 µmol·m−2·s−1) as the rates measured here. The set-up used a high hydraulic residence time (200 min) that could result in diffusion effects and lower dissolution rates, but has been compensated by using stirring rates. As discussed by the authors, the overall fluid velocity at the surface seems to influence the outcome of rates.
A benchmark rate has been proposed for alkaline calcite dissolution [55]. According to the author’s rationalization, the dissolution rate of 0.5 µmol·m−2·s−1 should be chosen for flat/large samples and 6.0 µmol·m−2·s−1 for small or polished samples. The choice of these rates was justified by the rationale that bigger samples have less features that contribute to the availability of atomic steps than smaller samples. Small samples include step contributors not only from the crystal defects (that typically result in rhombohedral etch pits), but also from grain boundaries and/or its curvature. The rationale included the removal of fluid chemistry effects (all rates were converted to zero ion strength) and hydrodynamic effects or boundary layer diffusion effects. There is partial agreement between this proposal and our data. The average of all the calcite cement rates, excluding the time lapses the samples were influenced by polishing, is 0.6 ± 0.2 µmol·m−2·s−1. However, the initial rates average (only including the first reaction time lapse of 0 to 3 h) is 0.8 ± 0.5 µmol·m−2·s−1 and even the rate maxima are only 1.6 ± 0.8 µmol·m−2·s−1, values that are far from the proposed 6.0 µmol·m−2·s−1.
Such as in 3D studies (e.g., [19]), we show that VSI data also permits the study of different crystal faces, edges and corners and provide total material fluxes in the units mol·s−1. This 3D study [19], reported three orders of magnitude higher calcite dissolution rates (total rates) than what we measured here, but the authors used an acidic solution (pH = 4) for the experiments, much lower than one used here (pH = 8.7). As reported before [12], due to the uncertainty related in defining “reactive surface area”, the highest differences in rate magnitude are found in studies that measured rates from fluid chemistry.
The use of statistical analysis of maximum rates (as in Figure 6 and Figure 7c), is relevant for the characterization of materials for which a single breakdown event (e.g., development of macro dissolution pits) can degrade its quality or even safety usage, such as in the case of industrial relevant materials (e.g., [56,57,58]). For this specific application, the information about the average or even most frequent dissolution rates is not as important as the information about the existence of dissolution pits that, although less common in space, have the same probability of occurrence (in time).

5. Conclusions

This study presents empirical data on the dissolution rate of a sandstone’s pore-filled calcite under far from equilibrium conditions. We present a closer look at the highest frequency rates, but also to the rate maxima found in the calcite cement patches dissolution. We complemented the information derived from the rate maps and rate spectra with a detailed statistical analysis to the range of rates obtained from the VSI topography data.
The dissolution rate is highly influenced by the type of surface microstructure resultant from intrinsic crystal proprieties (e.g., plane orientation). The range of rates observed here are within the range of rates found in other VSI studies. We used the height difference maps to calculate total material fluxes over time, allowing the correlation between reactivity and grain (calcite patch) size. The data shows that smaller patches result in higher material losses, a relationship previously demonstrated only via modelling techniques. Because of their reduced size, the calcite grains dissolve mostly by the influence of grain edges and sometimes form crystallographic features that resemble the common cleavage plain etch pits. Thus, we recommend that higher attention should be given in finding the relationship between dissolution rate ranges and crystal size, which is linked to the problematic of upscaling geochemical kinetic models from atomic to macro-spatial scales.
The analysis of rate maxima provides additional quantitative information about the rates typically presented as rate spectra. The distribution and temporal change of rate maxima can eventually be used to correlate to different surface morphologies (e.g., etch pits, steps).
Mechanical damage due to sample pre-treatment (e.g., polishing) can result in higher initial reaction rates, but rapidly decrease giving place to crystallographic-driven dissolution. The extent of damage is case sensitive.
The challenge in quantifying mineral dissolution rates is not in finding one universal rate, but to accept that the rates are values that vary between scales, time and location for which a probability of rate ranges occurs. Empirical studies, such as the one presented here, provide us with a statistical approach to rates from a relatively large dataset (for laboratory scale), with the advantage of being closely related to natural conditions (sandstone with calcite-filled pores).
The collected data set together with its statistical analysis provide important background for further development of the methodological protocol for characterization of solid material reactive properties. It can be used to develop the strategy for upscaling of atomistic, e.g., Kinetic Monte Carlo and Voronoi method based, kinetic models as well as for further development of the fundamental understanding of crystal dissolution.

Supplementary Materials

The following are available online at https://www.mdpi.com/2075-163X/9/8/458/s1, Figure S1: A thin-section of the Rotliegend sandstone under double-polarized light showing the poikilitic calcite cement (single crystals inter-grown between the sandstone’s grains). Figure S2: BSE image of the sandstone sample and position of the investigated cement patches. Figure S3: Comparison between unfiltered and filtered data (large spikes and median 7 × 7). Figures S4–S13: Surface topographies and rate maps of cement patches m5, 9, 12, 16, 19, 23, 27, 28, 36, and 46. Figures S14–S23: Rate maps areas used for statistical analysis and respective rate spectra of the previous mentioned cement patches.

Author Contributions

Conceptualization, E.T.P.; methodology, E.T.P.; validation, E.T.P., I.K.; formal analysis, E.T.P.; investigation, E.T.P.; writing—original draft preparation, E.T.P.; writing—review and editing, I.K., C.F., A.L.; supervision, A.L.; project administration, C.F.; funding acquisition, C.F. and A.L.

Funding

We gratefully acknowledge financial support by the BMBF, grant 03G0871A to A.L. and C.F.

Acknowledgments

The authors thank Rolf S. Arvidson for careful proofreading and Ricarda Rohlfs for valuable discussions, Matthias Heidsiek for thin-section analysis, and Marcos Toro for overall technical support. As well as Malte Bahro, Janis Heuer, and Till Bollerman for introduction to VSI operation. We also want to acknowledge the contribution given by the two referees that resulted in significant improvements to this manuscript.

Conflicts of Interest

The authors declare no conflict of interest. The funders had no role in the design of the study; in the collection, analyses, or interpretation of data; in the writing of the manuscript, or in the decision to publish the results.

References

  1. Ruiz-Agudo, E.; Putnis, C.V.; Putnis, A. Coupled dissolution and precipitation at mineral–fluid interfaces. Chem. Geol. 2014, 383, 132–146. [Google Scholar] [CrossRef]
  2. Nermoen, A.; Korsnes, R.I.; Hiorth, A.; Madland, M.V. Porosity and permeability development in compacting chalks during flooding of nonequilibrium brines: Insights from long-term experiment. J. Geophys. Res. Solid Earth 2018, 123, 2090–2114. [Google Scholar] [CrossRef]
  3. Taylor, T.R.; Giles, M.R.; Hathon, L.A.; Diggs, T.N.; Braunsdorf, N.R.; Birbiglia, G.V.; Kittridge, M.G.; Macaulay, C.I.; Espejo, I.S. Sandstone diagenesis and reservoir quality prediction: Models, myths, and reality. Am. Assoc. Pet. Geol. 2010, 94, 1093–1132. [Google Scholar] [CrossRef]
  4. Wang, J.; Cao, Y.; Liu, K.; Liu, J.; Xue, X.; Xu, Q. Pore fluid evolution, distribution and water-rock interactions of carbonate cements in red-bed sandstone reservoirs in the Dongying Depression, China. Mar. Pet. Geol. 2016, 72, 279–294. [Google Scholar] [CrossRef]
  5. Hosa, A.; Wood, R. Quantifying the impact of early calcite cementation on the reservoir quality of carbonate rocks: A 3D process-based model. Adv. Water Resour. 2017, 104, 89–104. [Google Scholar] [CrossRef] [Green Version]
  6. Engelhardt, W.V. Die Bildung von Sedimenten und Sedimentgesteinen, 3rd ed.; Schweizerbart’sche, E.: Stuttgart, Germany, 1973; p. 378. [Google Scholar]
  7. Bjorlykke, K.; Ramm, M.; Saigal, G.C. Sandstone Diagenesis and Porosity Modification during Basin Evolution. Geol. Rundsch. 1989, 78, 243–268. [Google Scholar] [CrossRef]
  8. Yu, B.S.; Dong, H.L.; Ruan, Z. Mechanism for calcite dissolution and its contribution to development of reservoir porosity and permeability in the Kela 2 gas field, Tarim Basin, China. Sci. China Ser. D Earth Sci. 2008, 51, 567–578. [Google Scholar] [CrossRef]
  9. Kaszuba, J.; Yardley, B.; Andreani, M. Experimental perspectives of mineral dissolution and precipitation due to carbon dioxide-water-rock interactions. Rev. Mineral. Geochem. 2013, 77, 153–188. [Google Scholar] [CrossRef]
  10. McNamara, D.D.; Lister, A.; Prior, D.J. Calcite sealing in a fractured geothermal reservoir: Insights from combined EBSD and chemistry mapping. J. Volcanol. Geotherm. Res. 2016, 323, 38–52. [Google Scholar] [CrossRef] [Green Version]
  11. Rohmer, J.; Pluymakers, A.; Renard, F. Mechano-chemical interactions in sedimentary rocks in the context of CO2storage: Weak acid, weak effects? Earth-Sci. Rev. 2016, 157, 86–110. [Google Scholar] [CrossRef]
  12. Arvidson, R.S.; Ertan, I.E.; Amonette, J.E.; Luttge, A. Variation in calcite dissolution rates: A fundamental problem? Geochim. Cosmochim. Acta 2003, 67, 1623–1634. [Google Scholar] [CrossRef]
  13. Lasaga, A.C.; Blum, A.E. Surface chemistry, etch pits and mineral-water reactions. Geochim. Cosmochim. Acta 1986, 50, 2363–2379. [Google Scholar] [CrossRef]
  14. Jordan, G.; Rammensee, W. Dissolution rates of calcite (1014) obtained by scanning force microscopy: Microtopography-based dissolution kinetics on surfaces with anisotropic step velocities. Geochim. Cosmochim. Acta 1998, 62, 941–947. [Google Scholar] [CrossRef]
  15. Fischer, C.; Arvidson, R.S.; Luttge, A. How predictable are dissolution rates of crystalline material? Geochim. Cosmochim. Acta 2012, 98, 177–185. [Google Scholar] [CrossRef]
  16. Luttge, A.; Arvidson, R.S.; Fischer, C.; Kurganskaya, I. Kinetic concepts for quantitative prediction of fluid-solid interactions. Chem. Geol. 2019, 504, 216–235. [Google Scholar] [CrossRef]
  17. Luttge, A.; Arvidson, R.S.; Fischer, C. Fundamental Controls of Dissolution Rate Spectra: Comparisons of Model and Experimental Results. Procedia Earth Planet. Sci. 2013, 7, 537–540. [Google Scholar] [CrossRef] [Green Version]
  18. Bibi, I.; Arvidson, R.; Fischer, C.; Luttge, A. Temporal Evolution of Calcite Surface Dissolution Kinetics. Minerals 2018, 8, 256. [Google Scholar] [CrossRef]
  19. Noiriel, C.; Oursin, M.; Saldi, G.; Haberthür, D. Direct Determination of Dissolution Rates at Crystal Surfaces Using 3D X-ray Microtomography. ACS Earth Space Chem. 2019, 3, 100–108. [Google Scholar] [CrossRef]
  20. Brand, A.S.; Feng, P.; Bullard, W. Calcite Dissolution Rate Spectra Measured by In Situ Digital Holographic Microscopy Calcite Dissolution Rate Spectra Measured by In Situ Digital Holographic Microscopy. Geochim. Cosmochim. Acta 2017, 213, 317–329. [Google Scholar] [CrossRef]
  21. Fischer, C.; Gaupp, R.; Dimke, M.; Sill, O. A 3D high resolution model of bounding surfaces in aelian-fluvial deposits: An outcrop analogue study from the Permian Rotliegend, Northern Germany. J. Pet. Geol. 2007, 30, 257–273. [Google Scholar] [CrossRef]
  22. Fischer, C.; Dunkl, I.; Von Eynatten, H.; Wijbrans, J.R.; Gaupp, R. Products and timing of diagenetic processes in upper Rotliegend sandstones from Bebertal (North German Basin, Parchim formation, Flechtingen High, Germany). Geol. Mag. 2012, 149, 827–840. [Google Scholar] [CrossRef]
  23. Fischer, C.; Luttge, A. Beyond the conventional understanding of water–rock reactivity. Earth Planet. Sci. Lett. 2017, 457, 100–105. [Google Scholar] [CrossRef]
  24. Lea, A.S.; Amonette, J.E.; Baer, D.R.; Liang, Y.; Colton, N.G. Microscopic effects of carbonate, manganese, and strontium ions on calcite dissolution. Geochim. Cosmochim. Acta 2001, 65, 369–379. [Google Scholar] [CrossRef]
  25. Morse, J.W.; Arvidson, R.S. The dissolution kinetics of major sedimentray carbonate minerals. Earth-Sci. Rev. 2002, 58, 51–84. [Google Scholar] [CrossRef]
  26. Fischer, C.; Finkeldei, S.; Brandt, F.; Bosbach, D.; Luttge, A. Direct Measurement of Surface Dissolution Rates in Potential Nuclear Waste Forms: The Example of Pyrochlore. ACS Appl. Mater. Interfaces 2015, 7, 17857–17865. [Google Scholar] [CrossRef] [PubMed]
  27. Fischer, C.; Luttge, A. Pulsating dissolution of crystalline matter. Proc. Natl. Acad. Sci. USA 2018, 115, 897–902. [Google Scholar] [CrossRef] [Green Version]
  28. Luttge, A.; Bolton, E.W.; Lasaga, A.C. An interferometric study of the dissolution kinetics of anorthite: The role of reactive surface area. Am. J. Sci. 1999, 299, 652–678. [Google Scholar] [CrossRef]
  29. Lehmann, P.; Tereschenko, S.; Xie, W. Fundamental aspects of resolution and precision in vertical scanning white-light interferometry. Surf. Topogr. Metrol. Prop. 2016, 4, 024004. [Google Scholar] [CrossRef] [Green Version]
  30. Palandri, J.L.; Kharaka, Y.K. A Compilation of Rate Parameters of Water-Mineral Interaction Kinetics for Application to Geochemical Modeling; U.S. Geological Survey: Reston, VA, USA, 2004.
  31. de Assis, T.A.; Reis, F.D.A.A. Dissolution of minerals with rough surfaces. Geochim. Cosmochim. Acta 2018, 228, 27–41. [Google Scholar] [CrossRef]
  32. Kurganskaya, I.; Luttge, A. Kinetic Monte Carlo simulations of silicate dissolution: Model complexity and parametrization. J. Phys. Chem. C 2013, 117, 24894–24906. [Google Scholar] [CrossRef]
  33. Smith, M.E.; Knauss, K.G.; Higgins, S.R. Effects of crystal orientation on the dissolution of calcite by chemical and microscopic analysis. Chem. Geol. 2013, 360, 10–21. [Google Scholar] [CrossRef]
  34. Saldi, G.D.; Voltolini, M.; Knauss, K.G. Effects of surface orientation, fluid chemistry and mechanical polishing on the variability of dolomite dissolution rates. Geochim. Cosmochim. Acta 2017, 206, 94–111. [Google Scholar] [CrossRef] [Green Version]
  35. Bisschop, J.; Dysthe, D.K.; Putnis, C.V.; Jamtveit, B. In situ AFM study of the dissolution and recrystallization behaviour of polished and stressed calcite surfaces. Geochim. Cosmochim. Acta 2006, 70, 1728–1738. [Google Scholar] [CrossRef]
  36. Perez, A.; Daval, D.; Fournier, M.; Vital, M.; Delaye, J.M.; Gin, S. Comparing the reactivity of glasses with their crystalline equivalents: The case study of plagioclase feldspar. Geochim. Cosmochim. Acta 2019, 254, 122–141. [Google Scholar] [CrossRef] [Green Version]
  37. Hartman, P.; Perdok, W.G. On the relations between structure and morphology of crystals. I. Acta Cryst. 1955, 8, 49–52. [Google Scholar] [CrossRef]
  38. Kurganskaya, I.; Churakov, S.V. Carbonate Dissolution Mechanisms in the Presence of Electrolytes Revealed by Grand Canonical and Kinetic Monte Carlo Modeling. J. Phys. Chem. C 2018, 122, 29285–29297. [Google Scholar] [CrossRef]
  39. Hartman, P.; Perdok, W.G. On the relations between structure and morphology of crystals. II. Acta Cryst. 1955, 8, 521–524. [Google Scholar] [CrossRef]
  40. Hartman, P.; Perdok, W.G. On the relations between structure and morphology of crystals. III. Acta Cryst. 1955, 8, 525–529. [Google Scholar] [CrossRef]
  41. Zhang, L.; Luttge, A. Theoretical approach to evaluating plagioclase dissolution mechanisms. Geochim. Cosmochim. Acta 2009, 73, 2832–2849. [Google Scholar] [CrossRef]
  42. Briese, L.; Arvidson, R.S.; Luttge, A. The effect of crystal size variation on the rate of dissolution—A kinetic Monte Carlo study. Geochim. Cosmochim. Acta 2017, 212, 167–175. [Google Scholar] [CrossRef]
  43. Liu, J.; Aruguete, D.M.; Jinschek, J.R.; Donald, R.J.; Hochella, M.F. The non-oxidative dissolution of galena nanocrystals: Insights into mineral dissolution rates as a function of grain size, shape, and aggregation state. Geochim. Cosmochim. Acta 2008, 72, 5984–5996. [Google Scholar] [CrossRef]
  44. Kurganskaya, I.; Luttge, A. Kinetic Monte Carlo approach to study carbonate dissolution. J. Phys. Chem. C 2016, 120, 6482–6492. [Google Scholar] [CrossRef]
  45. Fischer, C.; Kurganskaya, I.; Schäfer, T.; Luttge, A. Variability of crystal surface reactivity: What do we know? Appl. Geochem. 2014, 43, 132–157. [Google Scholar] [CrossRef]
  46. Luttge, A. Etch pit coalescence, surface area, and overall mineral dissolution rates. Am. Mineral. 2005, 90, 1776–1783. [Google Scholar] [CrossRef]
  47. Godinho, J.R.A.; Piazolo, S.; Evans, L. Simulation of surface dynamics during dissolution as a function of the surface orientation: Implications for non-constant dissolution rates. Earth Planet. Sci. Lett. 2014, 408, 163–170. [Google Scholar] [CrossRef] [Green Version]
  48. Rohlfs, R.D.; Fischer, C.; Kurganskaya, I.; Luttge, A. Crystal dissolution kinetics studied by a combination of Monte Carlo and Voronoi methods. Minerals 2018, 8, 133. [Google Scholar] [CrossRef]
  49. Duckworth, O.W.; Martin, S.T. Dissolution rates and pit morphologies of rhombohedral carbonate minerals. Am. Mineral. 2004, 89, 554–563. [Google Scholar] [CrossRef]
  50. Davis, K.J.; Nealson, K.H.; Luttge, A. Calcite and dolomite dissolution rates in the context of microbe—Mineral surface interactions. Geobiology 2007, 5, 191–205. [Google Scholar] [CrossRef]
  51. Vinson, M.D.; Arvidson, R.S.; Luttge, A. Kinetic inhibition of calcite (104) dissolution by aqueous manganese (II). J. Cryst. Growth 2007, 307, 116–125. [Google Scholar] [CrossRef]
  52. Vinson, M.D.; Luttge, A. Multiple length-scale kinetics: An integrated study of calcite dissolution rates and strontium inhibition. Am. J. Sci. 2005, 305, 119–146. [Google Scholar] [CrossRef]
  53. Atanassova, R.; Cama, J.; Soler, J.M.; Offeddu, F.G.; Queralt, I.; Casanova, I. Calcite interaction with acidic sulphate solutions: A vertical scanning interferometry and energy-dispersive XRF study. Eur. J. Mineral. 2013, 25, 331–351. [Google Scholar] [CrossRef]
  54. Bouissonnié, A.; Daval, D.; Marinoni, M.; Ackerer, P. From mixed flow reactor to column experiments and modeling: Upscaling of calcite dissolution rate. Chem. Geol. 2018, 487, 63–75. [Google Scholar] [CrossRef]
  55. Colombani, J. The Alkaline Dissolution Rate of Calcite. J. Phys. Chem. Lett. 2016, 7, 2376–2380. [Google Scholar] [CrossRef] [PubMed] [Green Version]
  56. Heuer, J.; Luttge, A. Kinetics of pipeline steel corrosion studied by Raman spectroscopy-coupled vertical scanning interferometry. npj Mater. Degrad. 2018, 2, 40. [Google Scholar] [CrossRef]
  57. Holme, B.; Lunder, O. Characterisation of pitting corrosion by white light interferometry. Corros. Sci. 2007, 49, 391–401. [Google Scholar] [CrossRef]
  58. Dwivedi, D.; Lepková, K.; Becker, T. Carbon steel corrosion: A review of key surface properties and characterization methods. RSC Adv. 2017, 7, 4580–4610. [Google Scholar] [CrossRef]
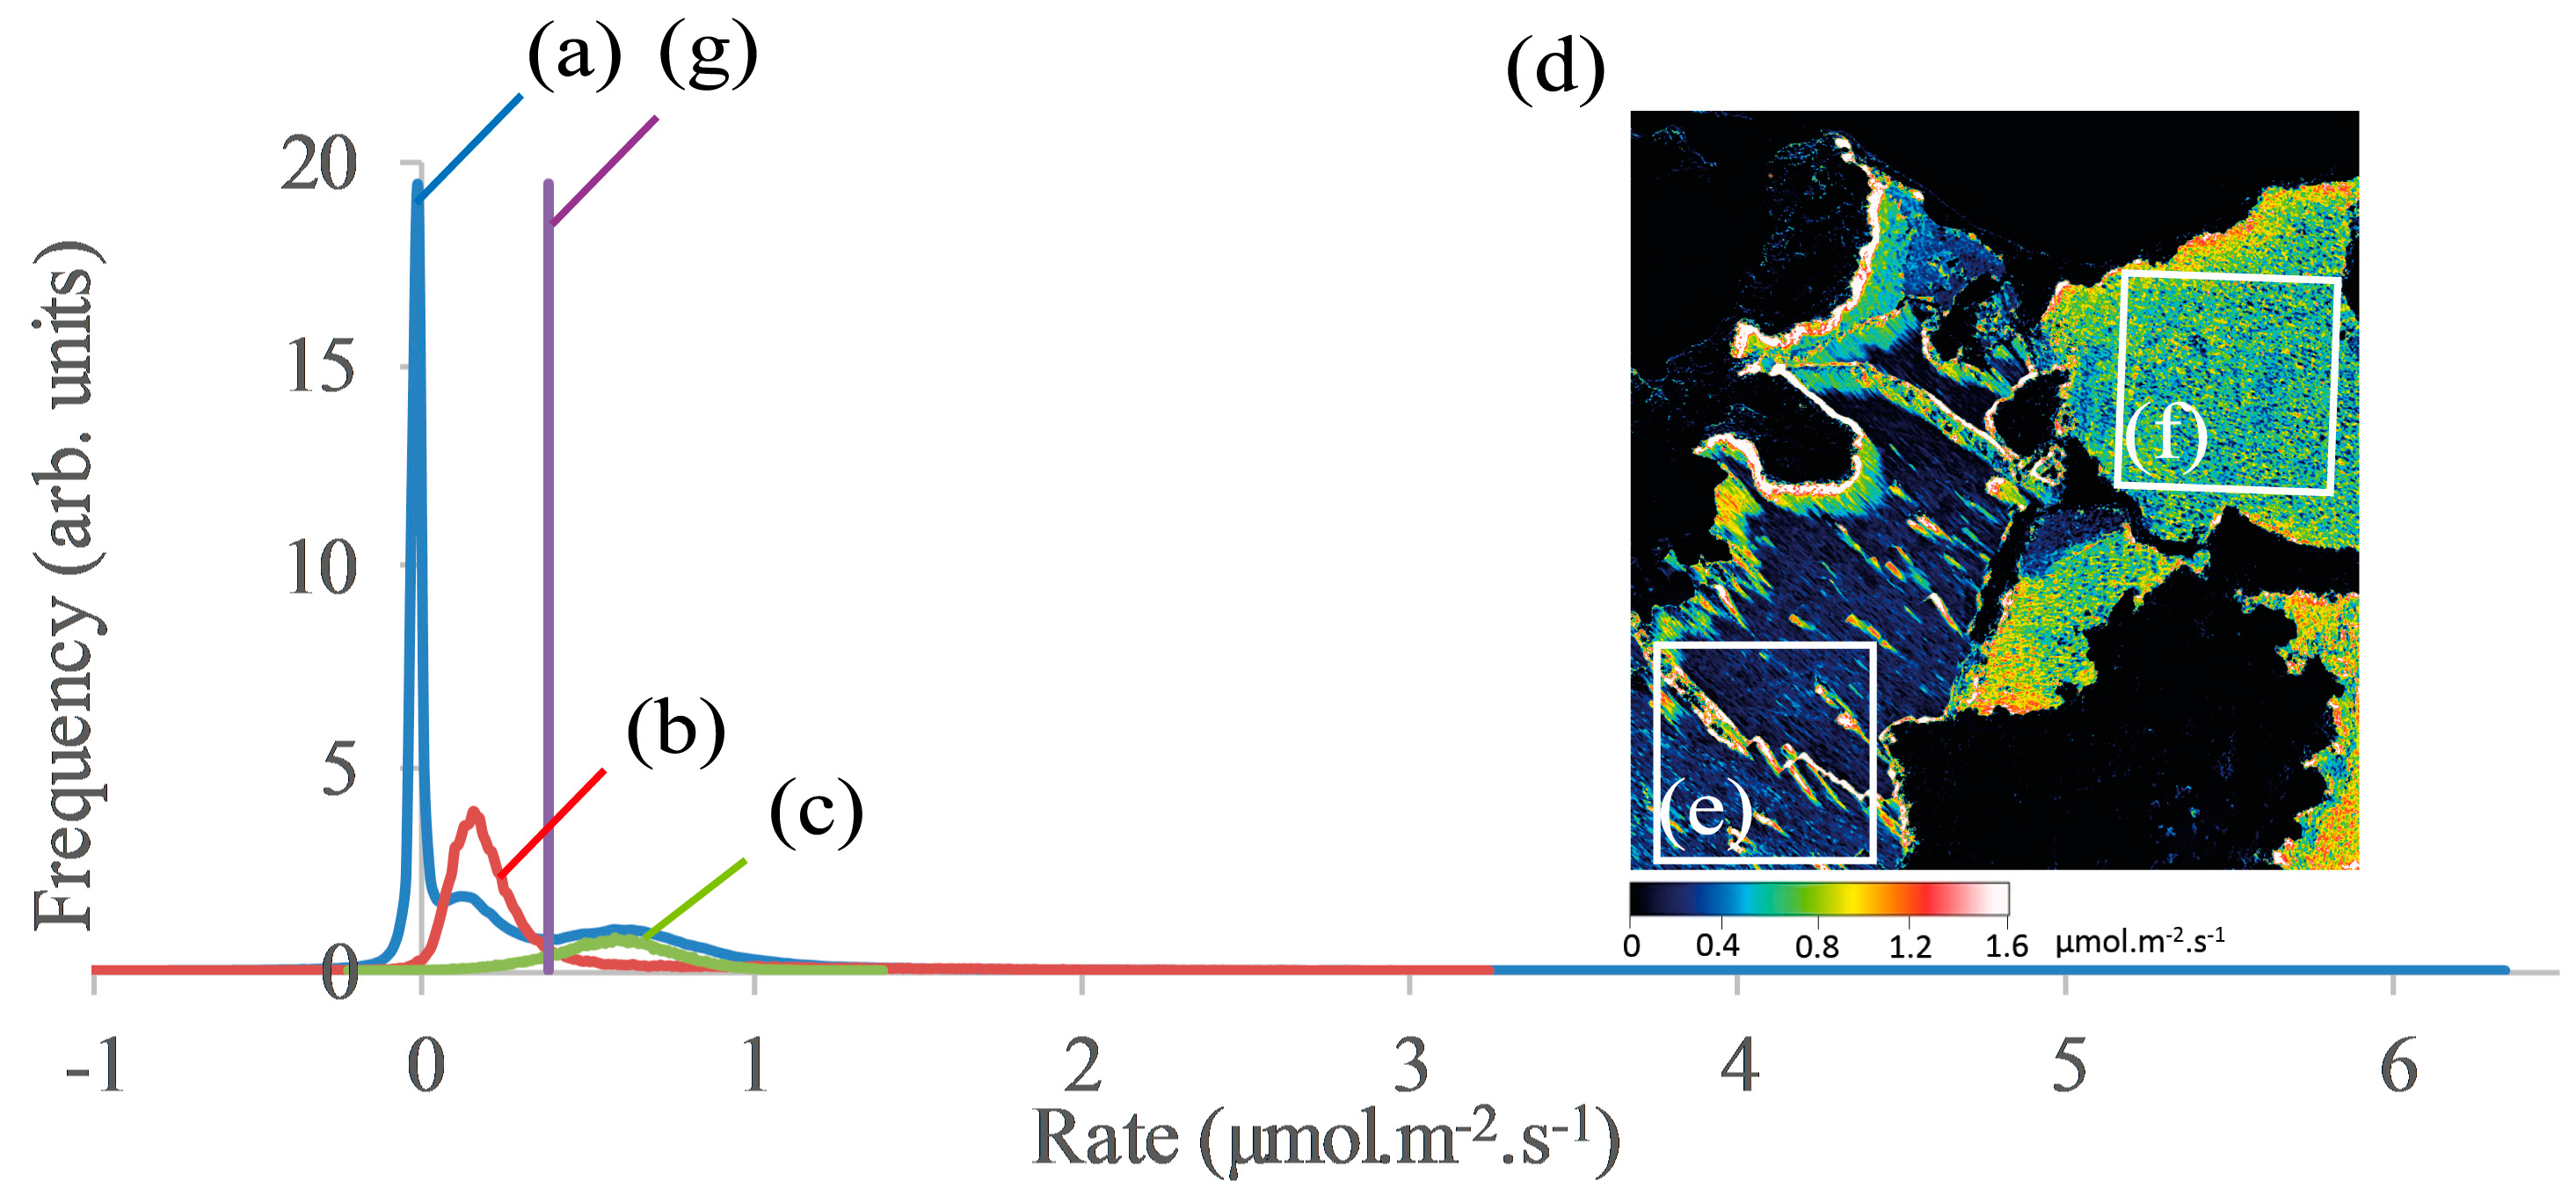
Figure 1. Selection of the calcite patches with characteristic surface dissolution morphologies: (a) rate spectrum of the full rate map showed in (d); (b) rate spectrum of the sub-section (e) from the full rate map (d); (c) rate spectrum of the sub-section (f) from the full rate map (d); (g) rate average calculated from the volume of calcite lost and the map’s surface area. The sub-section’s rate modes fit the rate modes of the full rate map. The highest frequency mode at zero rate corresponds to practically unreactive grains (black areas in the rate map).
Minerals 09 00458 g001
Figure 2. Secondary electron microscopy images of the calcite cement patches of the sandstone after dissolution (2 mmol Na2CO3, 32 h, room T): (a) Calcite patch showing two distinct dissolution microstructures; (b) detail of surface showing striated surface microstructure; (c) detail of hill-and-valley surface microstructure; (d) calcite patch showing a single microstructure; (e) detail of rhombohedral form of calcite sheets; and (f) detail of calcite patch corner showing micron-scale dissolution steps at the edge of the crystal (grain boundary).
Minerals 09 00458 g002
Figure 3. Reaction sequence data of a flow-through experiment using a 2 mmol Na2CO3 solution at room temperature: (a) height maps (hi) of the sandstone’s surface, darker yellow areas corresponds to deeper areas and brighter yellow to higher areas (278 × 288 µm); (b) rate maps (rij) obtained from the subtraction of the height maps difference; (c) and (d) are sub-sections (81 × 81 µm) of the rate maps, see location in b, 0–3 h. Values above 1.6 µmol·m−2·s−1 appear white colored in the maps.
Minerals 09 00458 g003
Figure 4. Total material flux rate (rT) change over time within the sub-sections in Figure 3c,d corresponding to striated and hill-and-valley surface morphologies, respectively. This rate was calculated from the total volume of calcite lost in each reaction time interval. The sample was reacted in a fluid cell using 2 mmol Na2CO3 solution with pH 8.7, at room temperature.
Minerals 09 00458 g004
Figure 5. Rate spectra and temporal evolution of the central statistical parameters: (a) and (a’) correspond to the striated surface (the sequence in Figure 3c); (b) and (b’) correspond to the rate maps of the hill-and-valley surface that show also homogeneous distribution of rates (the sequence in Figure 3d). The “error” bars represent the standard deviation of the measured rates.
Minerals 09 00458 g005
Figure 6. Statistical parameters (average and standard deviation) of the maximum rates of the map sequences of Figure 3c,d: (a) Striated surface morphology; (b) hill-and-valley surface morphology.
Minerals 09 00458 g006
Figure 7. Compilation of the rate of dissolution of ten calcite-filled sandstone pores: (a) Total material flux (rT) normalized to the size of the calcite patches (standard deviation was omitted for better visualization), selection of the two categories was made by qualitative observation of the reacted surface morphologies; (b) central statistical parameters (average, median and mode); (c) rate maxima. All rate values were calculated from the sub-section rate maps shown in Figures S14–S23 of Supplementary Material.
Minerals 09 00458 g007
Figure 8. Correlation between the total material flux (rT) and the rate central statistical parameters in the striated surface and hill-and-valley surface morphologies in all seven reaction time intervals: (a) average rates plotted against the total material flux; (b) median rates plotted against the total material flux; (c) Most frequent rate (rate modes) plotted against the total material flux. All plots show triangles for the striated surface morphology and circles for hill-and-valley surface type.
Minerals 09 00458 g008
Figure 9. Evolution of total material flux rates as a function of the calcite patches size. Each total material flux rate (rT) compiles the average rate from five cement patches maps. Data related to the first two reaction time steps (0–3 h and 3–6 h) were not included because of their apparent relation to polishing defects.
Minerals 09 00458 g009
Figure 10. The effect of maximum rates on the average rates showing the contrast between the statistics of a single measurement and the statistical analysis of a set of ten different calcite patches: (a) Single patch with different surface morphologies; (b) set of ten analyzed calcite cement patches also separated by surface morphology.
Minerals 09 00458 g010
Table 1. Parameters influencing mineral dissolution kinetics.
Macroscopic
ExtrinsicIntrinsic
Temperaturen° and distribution of defects (point and screw dislocations)
PressureSurface roughness
Fluid chemistry Grain size and their distribution
Saturation state Grain orientation
Ionic strengthReactive surface features and their distribution
Material transport
Micro-nanoscopic
ExtrinsicIntrinsic
Ion hydration shellsAtomic step dynamics
Ionic transport mechanismsKink site distributions and densities
Ionic self-diffusion coefficients Bond hydrolysis activation energies
Mechanisms of charge transferCoordination numbers
Adsorption/desorption of ionsSolid chemistry
Site protonation/deprotonationSite acidity
Diffusion boundary layer structure Surface-water interface molecular structure