Article

Interaction Mechanism of Ferric Ions with Celestite Surface and Implications for Flotation Recovery

1
School of Chemical Engineering and Technology, China University of Mining and Technology, Xuzhou 221116, China
2
National Engineering Research Center of Coal Preparation and Purification, China University of Mining and Technology, Xuzhou 221116, China
3
Henan Province Industrial Technology Research Institution of Resources and Materials, Zhengzhou University, Zhengzhou 450001, China
4
State Key Laboratory of Complex Nonferrous Meal Resources Clean Utilization, Kunming University of Science and Technology, Kunming 650093, China
*
Author to whom correspondence should be addressed.
Minerals 2019, 9(7), 405; https://doi.org/10.3390/min9070405
Submission received: 29 April 2019 / Revised: 25 June 2019 / Accepted: 25 June 2019 / Published: 1 July 2019
(This article belongs to the Section Mineral Processing and Extractive Metallurgy)

Abstract

:
In practical celestite flotation, iron contamination is commonly found on celestite surfaces. The effect of ferric ions on celestite flotation was assessed by a combination of ion release experiments, DFT calculation, X-ray photoelectron spectroscopy (XPS) analysis, adsorption isotherm study, and flotation experiments in this work. The ion release experiments showed that the associated limonite released ferric ions to solution. According to DFT calculation and surface complexation theory, we found that ≡SrOH0 and ≡SO4H0 are primary functional groups on celestite surface in aqueous environments. The XPS analysis and adsorption isotherm study revealed that ferric ions mainly adsorbed on celestite surface by complexing with two oxygen atoms of surface ≡SrOH0 groups to form ≡Sr–O–Fe–OH precipitates. Flotation results showed that ferric ions strongly depressed celestite flotation. Combined with the change in surface properties determined by XPS, it can be concluded that the adsorption of ferric ions on celestite surface decreased adsorption sites for the collector, and hence, led to depression on celestite flotation.

Graphical Abstract

1. Introduction

Strontium has been widely used in industry in the last several decades. Celestite (SrSO4) is the primary strontium mineral, and it is the main source of strontium metal and various strontium chemicals [1]. A great proportion of the world’s celestite is used for the strontium chemical production, especially strontium nitrate and carbonate. The most important chemical is the carbonate, which is used in the fabrication of cathode ray tubes for colour monitors and ceramic ferrites [2,3].
Flotation is widely used in the beneficiation of celestite due to the low cost and easy operation [4,5]. The practical mineral flotation pulp is characterized by complicated ion composition, which has significant influence on mineral surface properties and solution chemistry properties, therefore leading to an inevitable effect on flotation results [6]. These phenomena can either promote or inhibit the adsorption of flotation reagents, and hence, influence the flotation process. The ions in flotation pulp are released from mineral dissolution [7,8] and fluid inclusions [9,10], and are usually referred to as “unavoidable ions”. Ferric ion is considered to be a common unavoidable ion which may exert significant influence on mineral flotation even at low concentrations. Deng et al. [11] reported that the adsorption of ferric ions changed the atomic composition and chemical state of smithsonite surface, leading to a strong inhibitory effect on smithsonite flotation. The inhibition of ferric ion adsorption may be attributed to strong oxidation and hydrosis. In the flotation of spodumene with salicylhydroxamic acid and sodium oleate (NaOL) as a collector, the presence of ferric ions promoted collector adsorption, and hence, increased flotation recovery [12]. According to the study by Jiang et al. [13], ferric ions strongly depressed pyrite flotation when xanthate was used as a collector in the neutral to weakly alkaline pH range. The depression is mainly attributed to the formation of poorly hydrophobic ferric dihydroxy xanthate on the surfaces and in solution by the reactions between xanthate and ferric ions. In the absence of metal ions, fatty acid collectors can hardly be adsorbed on clean quartz surface, leading to the poor floatability of quartz [14,15]. However, after the treatment of metal ions such as ferric ions, the collector molecules in solution could complex with surface ferric ions, and hence, improve the floatability of quartz [16,17,18]. In the flotation of cassiterite, it was reported that a stable chelate formed on cassiterite surface or in solution due to the reactions between collector and ferric ions, leading to strong depression on cassiterite flotation [16].
Limonite is an amorphous secondary mineral that mainly consists of hydrated ferric oxides, and it is found to associate with celestite in many mines [19]. The surfaces of celestite in some mines are even dyed due to the iron contamination from associated limonite [20]. Therefore, ferric ions may present in flotation pulp, and consequently effect celestite flotation. Although the influence of ferric ions on mineral flotation has been widely studied, there are still research limitations as regards to the effect of ferric ions on celestite flotation and the corresponding interaction mechanisms that involve metal ions, reagents, and the celestite surface. In this work, the presence of ferric ions in celestite flotation pulp was confirmed by ion release experiments, then the influence of Fe(ΙΙΙ) ions on celestite flotation was investigated by micro-flotation and the mechanism was also studied in detail by a series of analytical test and calculations.

2. Materials and Methods

2.1. Materials

The high-purity celestite (SrSO4) sample used in this work was derived from Yunnan Province, China. The raw ore was first crushed to −1 mm, and the impurities were picked out during this process. Then the sample was ground to −74 μm using a three-head agate grinding machine. To remove surface contaminates, the grinding product was washed by ultrasonic cleaning several times in deionized water. According to the X-ray diffraction (XRD) pattern (Figure 1), the diffraction peaks of the celestite sample were primarily composed of celestite peaks, while the diffraction peaks of other minerals could hardly be detected. The chemical analysis revealed that the percentage of Sr in the celestite sample was 46.25%, while the theoretical content of Sr in pure celestite was 47.72%, implying the celestite purity was above 95%, meeting the experiment’s requirements.
Limonite is mainly composed of goethite (α-FeOOH) and hydrated goethite (α-FeOOH·H2O), containing varying quantities of lepidocrocite (γ-FeOOH), hydrated lepidocrocite (γ-FeOOH·H2O), silica, and clay minerals. According to the chemical element analysis, the iron grade of the limonite sample used in this work was 35.05%. The phase analysis of the iron minerals in the limonite sample was conducted and the results are shown in Table 1. It can be seen that limonite was the primary iron mineral, with only 4.80% of the Fe distributed in magnetite, carbonates, silicates, and sulphides.
Hexahydrate ferric chloride (FeCl3·6H2O) was supplied as the source of ferric ions, and sodium oleate (NaOL, C17H33CO2Na) was employed as a celestite collector. Solution pH values were regulated by hydrochloric acid and sodium hydroxide stock solutions. All reagents employed in the present study were of analytical grade, and pure deionized water was used throughout testing.

2.2. Ferric Ion Released from Limonite

The ferric ion release experiments were conducted in a 100.00 cm3 beaker. Limonite samples (2.00 g) were dispersed in deionized water (40.00 cm3). After magnetic stirring, the liquid supernatant was separated from solids by centrifugation to analyse the Fe concentration using an inductively coupled plasma (ICP-OES, OPTIMA8300, Perkin Elmer, Waltham, MA, USA) instrument. While investigating the effect of grinding on ferric ion release, before 30 min of magnetic stirring, the limonite samples were ground by a laboratory scale agate grinder for 1 min, 2 min, 4 min, 6 min, 10 min and 15 min, respectively.

2.3. XPS Analysis

The original and treated celestite samples were examined via ESCALAB 250Xi (Thermo Fisher, Waltham, MA, USA) with an Al K Alpha source. The survey scan of sample surface was first analysed to detect elemental compositions, after that, the precise scan was conducted to obtain the XPS spectrum of specific elements. The C 1s spectrum at 284.80 eV was obtained and used as an internal standard to calibrate all of the measured spectra for charge compensation.

2.4. Adsorption Experiments

The adsorption experiments were conducted in a thermostatic water bath at 298 K. Celestite samples (1.00 g) were dispersed in 40.00 cm3 of solution, and the ferric ion concentration of the solution ranged from 0.0 mg/dm3 to 20.00 mg/dm3. The suspensions were first vibrated for 40 min, then the liquid was separated from solids using a centrifuge. The separated liquid was transferred to analyse the concentration of the Fe by an inductively coupled plasma (ICP-OES, OPTIMA8300) instrument. The following formula was employed to calculate the equilibrium adsorption capacity.
q e = ( C 0 C e ) V m
where qe (mg/g) is adsorption capacity (equilibrium adsorption capacity), C0 (mg/dm3) is the initial concentration of metal ions; Ce (mg/dm3) is the equilibrium concentration of ions, m (g) is the mass of celestite sample, and V (dm3) is the volume of solution.
Three commonly used isotherm models, the Langmuir [21], Freundlich [22], and Temkin [23] isotherms, were selected to analyse the equilibrium data. The three models are given as follows:
1 q e = 1 Q 0 k 1 C e + 1 Q 0
where k1 (dm3/mg) is the Langmuir adsorption constant and Q0 (mg/g) is the maximum adsorption amount.
lg   q e = lg   k F + 1 n lg   C e
where KF and n are both Freundlich constants, n giving an indication of how favourable the adsorption process and KF (mg/g (dm3/mg)1/n) is the adsorption capacity of the adsorbent.
q e = B lg   K T + B lg   C e
where B is related to the heat of adsorption and KT (dm3/mg) is the equilibrium binding constant.

2.5. Flotation Experiments

A small-scale (40.00 cm3) flotation machine was used for flotation experiments. Celestite samples (2.00 g) were first placed into the flotation cell and mixed with a certain amount of deionized water. The pH of mineral suspension was regulated by hydrochloric acid and sodium hydroxide stock solutions; after conditioning for 1 min, flotation reagents were added to the flotation pulp in sequence, and the pulp was conditioned for 3 min before the addition of subsequent reagent. Finally, the flotation pulp was subjected to flotation, and the collected flotation products were filtered, dried, and weighed. Weighing data were used to calculate the corresponding flotation recovery.

2.6. Calculation Method

During the electronic property calculation of celestite, all calculations were performed with the plane-wave pseudopotential density functional theory (DFT) approach employing the Cambridge Serial Total Energy Package (CASTEP) program 8.0. The valence electronic configurations considered in this work were Sr 4s2 4p6 5s2, S 3s2 3p4. The calculation was conducted using PBEsol exchange correlation function under the cut-off energy of 340.00 eV. A Monkhorst–Pack (MP) grid size of 2 × 4 × 3 was adopted to sample the Brillouinzone (BZ), and the structural parameter was determined using the Broyden–Fletcher–Goldfarb–Shenno (BFGS) minimization technique. The convergence tolerances for geometry optimization calculations were set to a total energy of 1 × 10⁻⁶ eV/atom, a maximum force of 0.03 ev/Å, a maximum stress of 0.05 GPa, and a maximum displacement of 1 × 10⁻³ Å were used. For all property calculations, the same parameters in geometry optimization were employed.

3. Results and Discussion

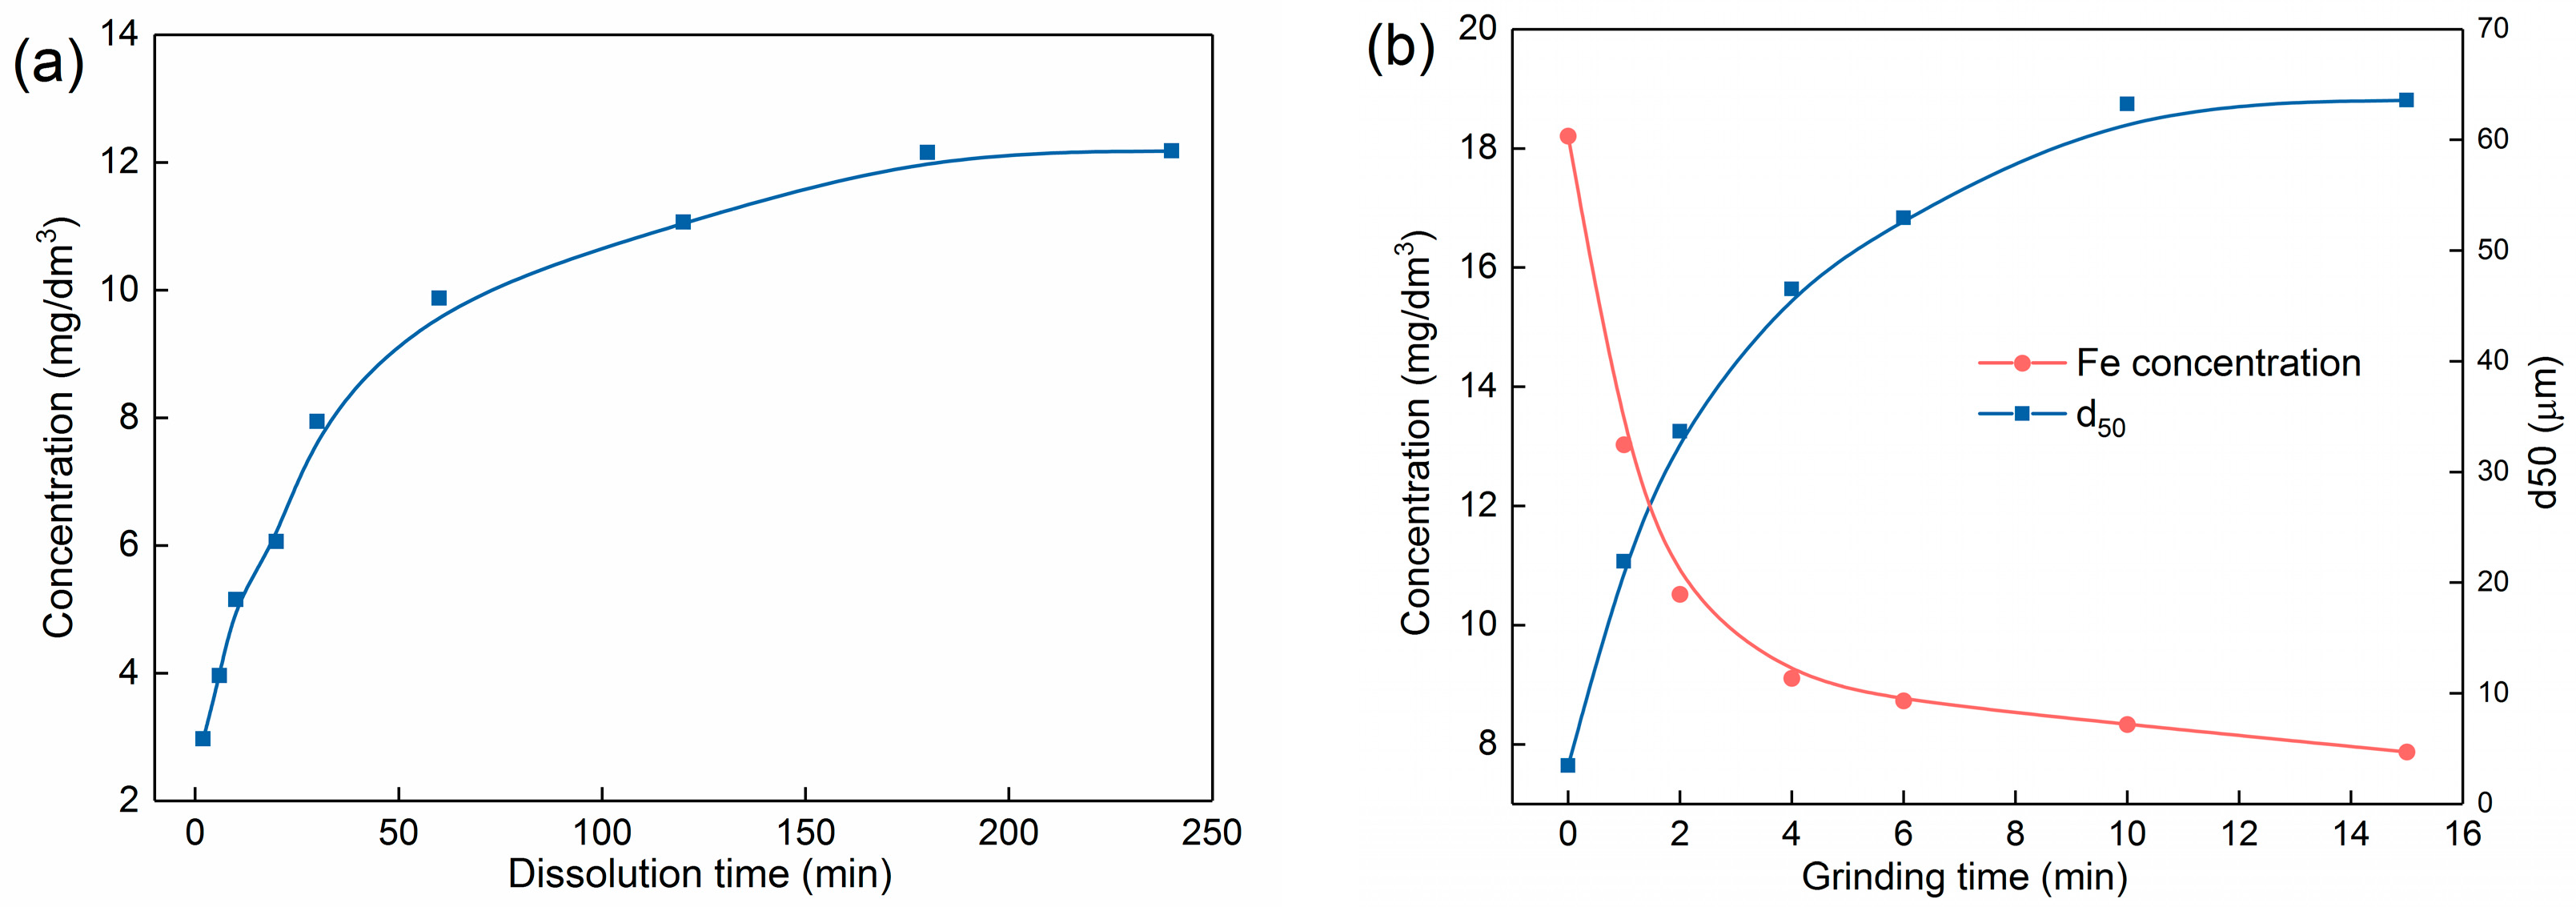
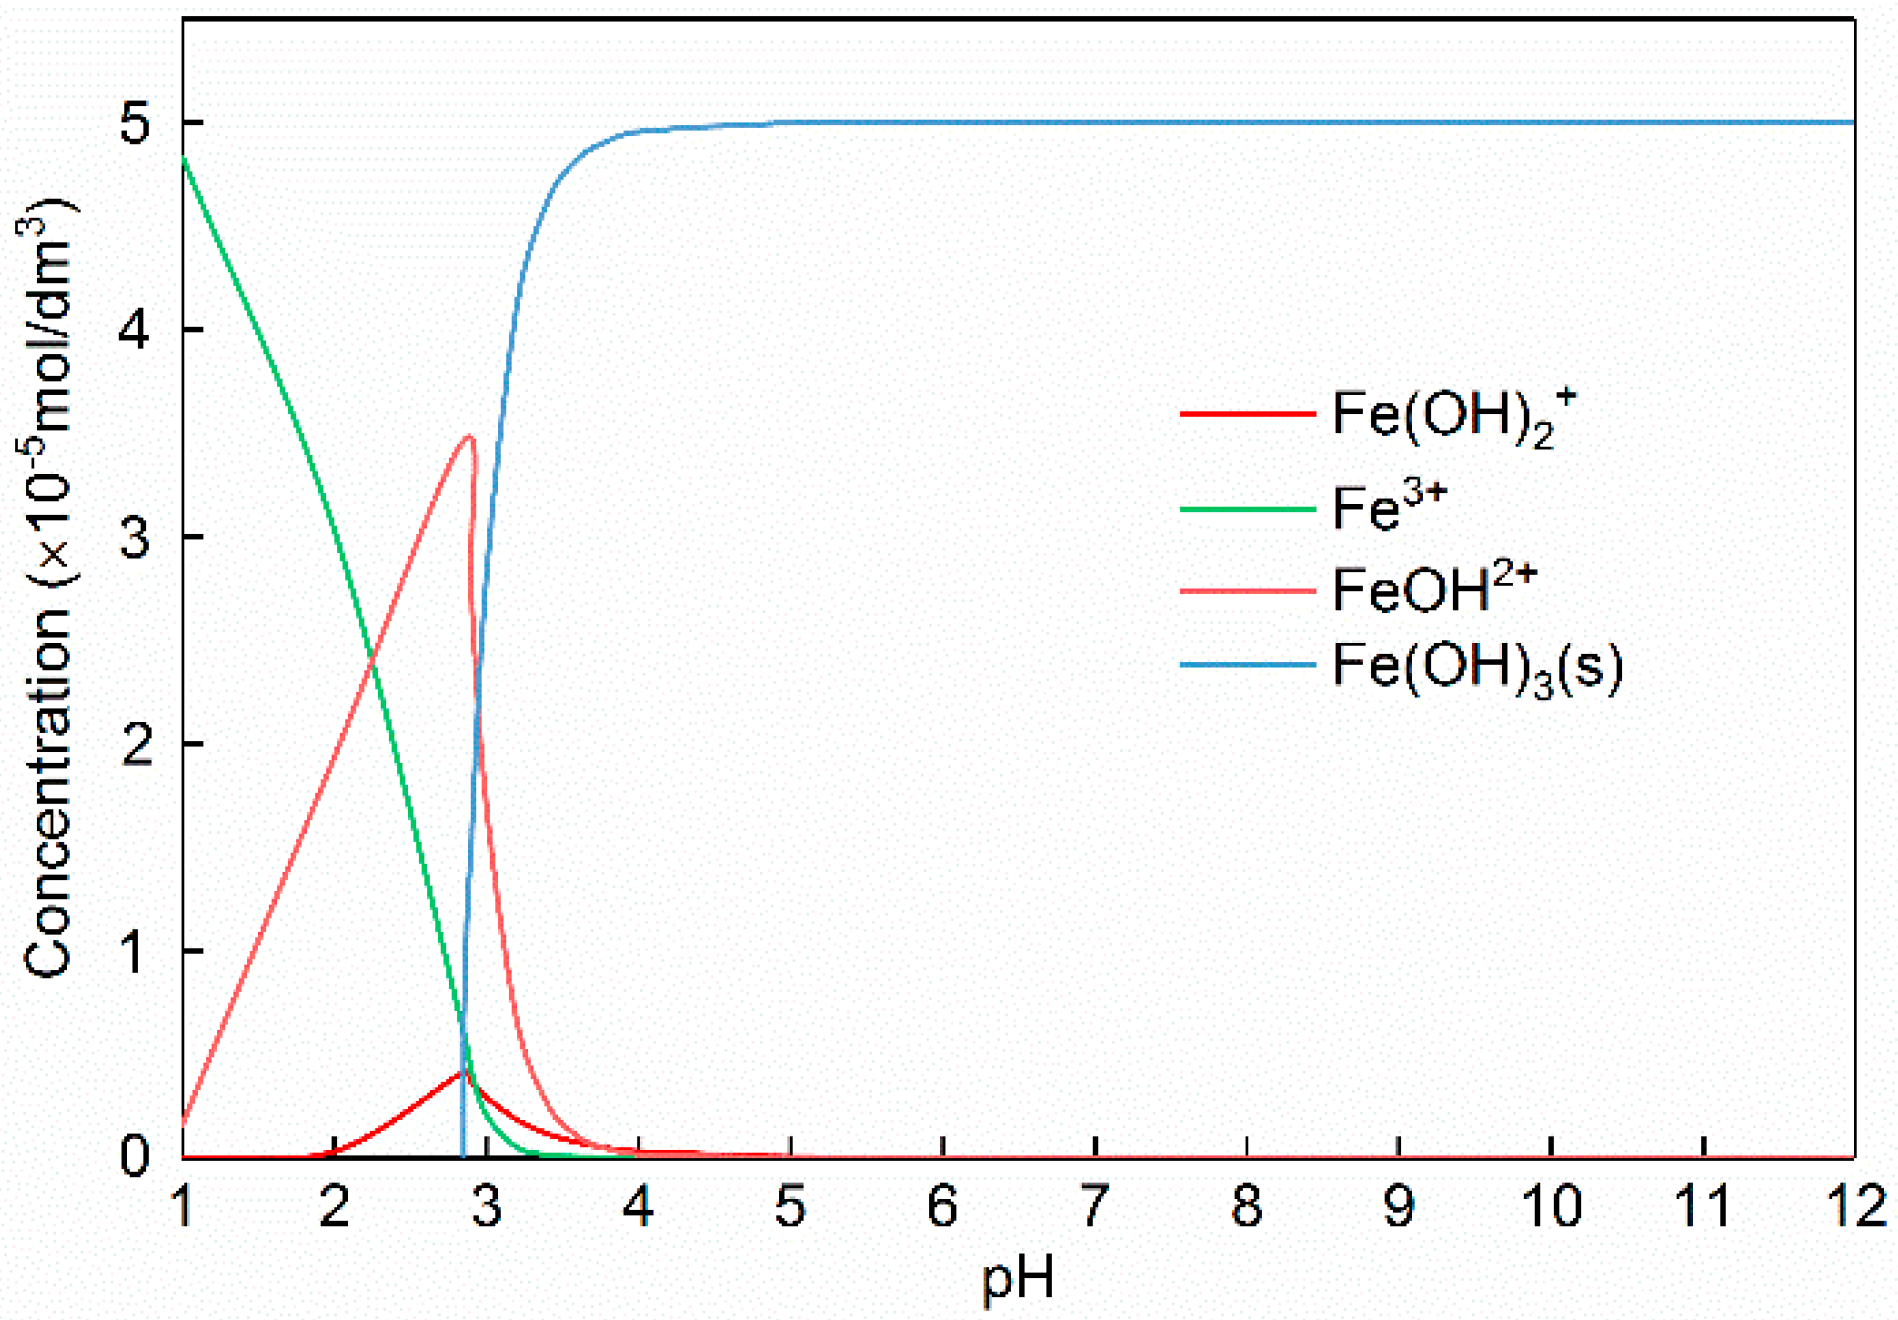
3.1. The Release of Ferric Ions from Limonite

Ferric ion release experiments from limonite were conducted to investigate the presence of ferric ions in celestite flotation environment. As shown in Figure 2a, limonite is characterized by a strong releasing capacity of ferric ions. The Fe concentration in solution increased rapidly to 11.06 mg/dm3 in 120 min. Thereafter, the Fe concentration increased slowly and reached equilibrium at 180 min. In the leaching process, the solution pH decreased gradually from 7.3 to 6.3, which may be attributed to the hydrolysis of released ferric ions. Grinding is an essential process before flotation and has been reported to motivate ion release from minerals [24,25,26]. According to Figure 2b, the particle size of limonite decreased rapidly with grinding time, meanwhile, the concentration of released Fe in solution increased, reaching 18.81 mg/dm3 after grinding 15 min. This may be the result of a reduction in particle size, which increased the surface area of particles exposed to solution [25]. According to the abovementioned results, it is known that the associated limonite was able to release ferric ions into the celestite flotation environment, inevitably exerting influence on the flotation process.

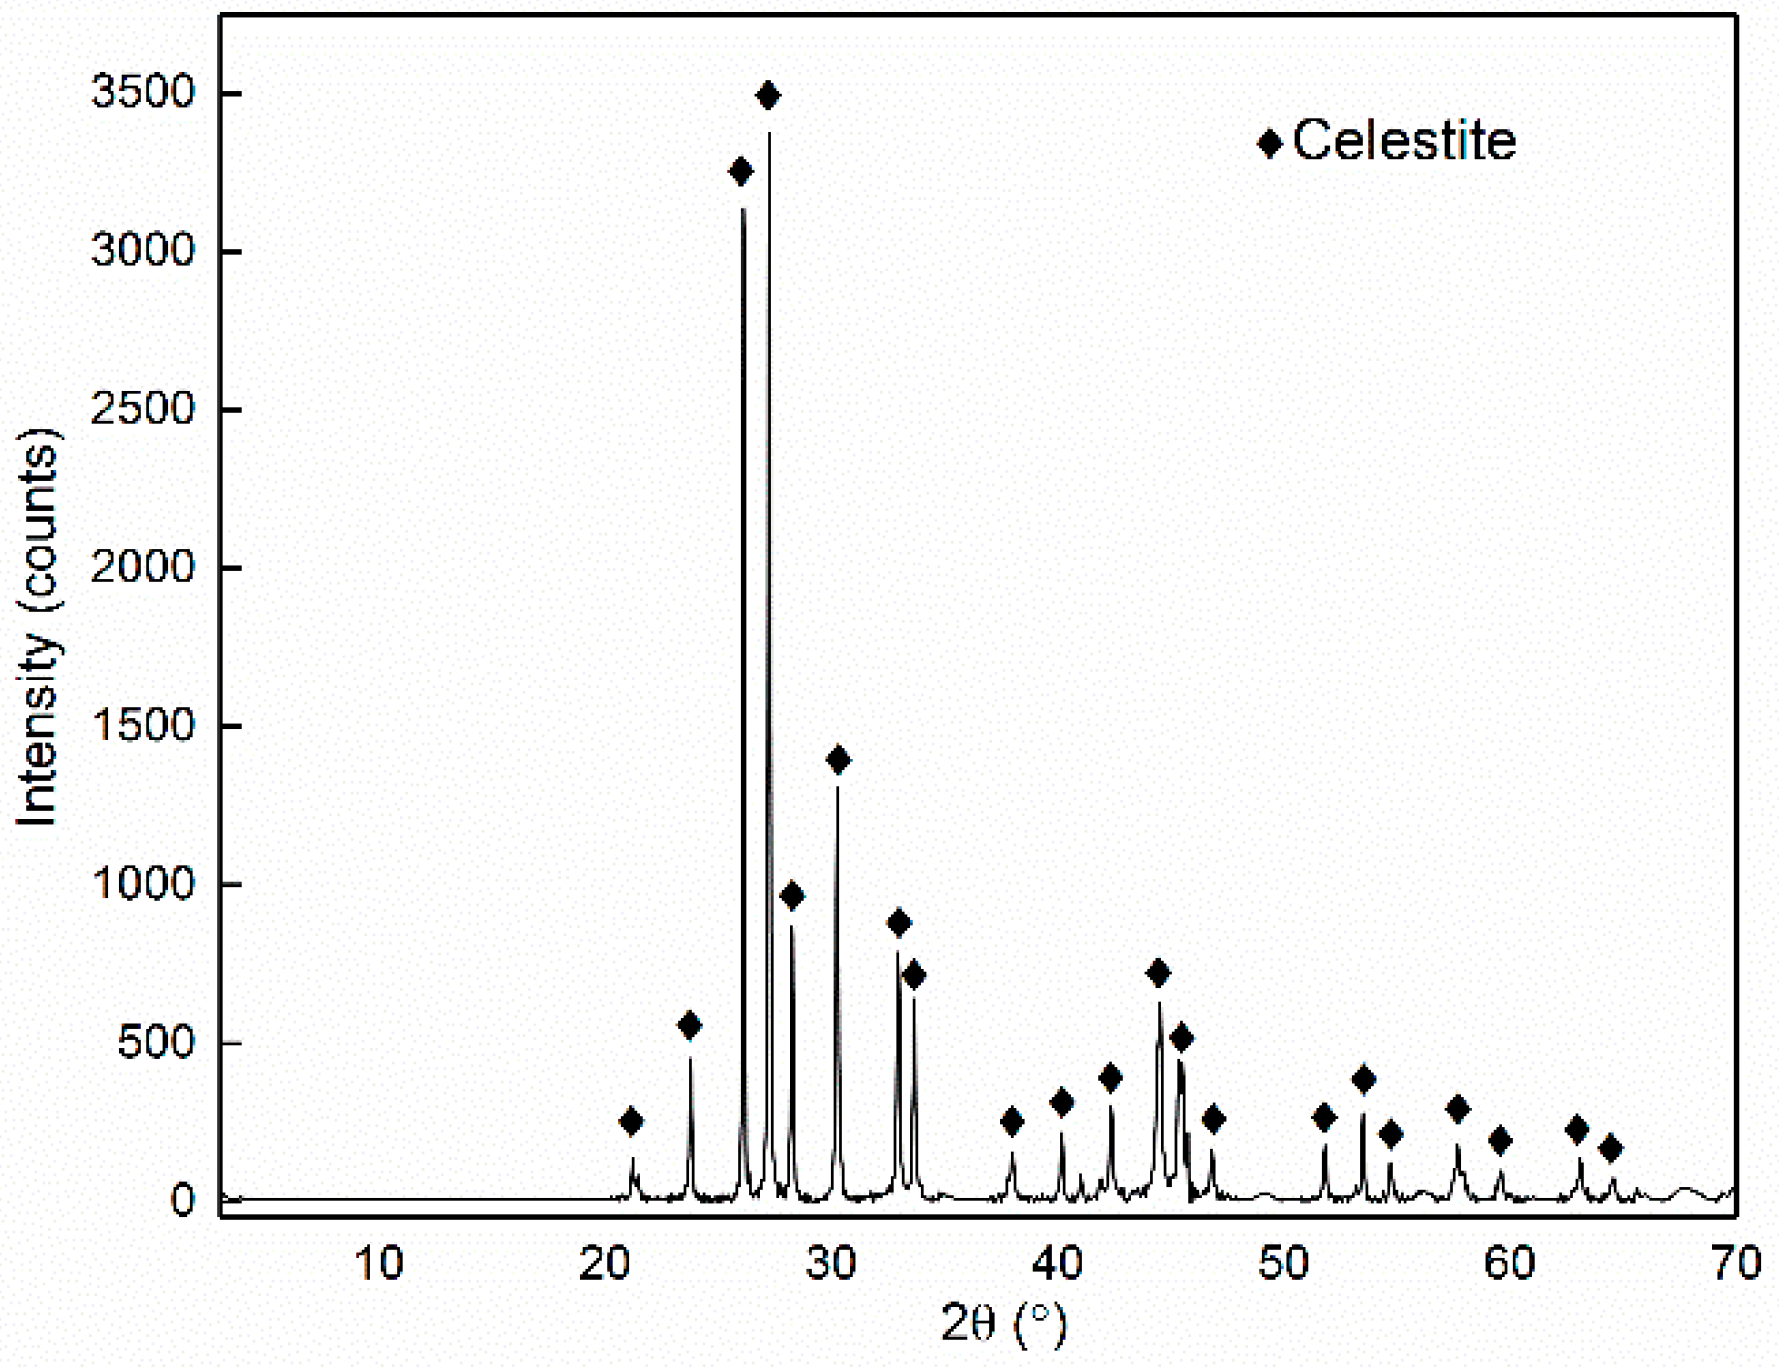
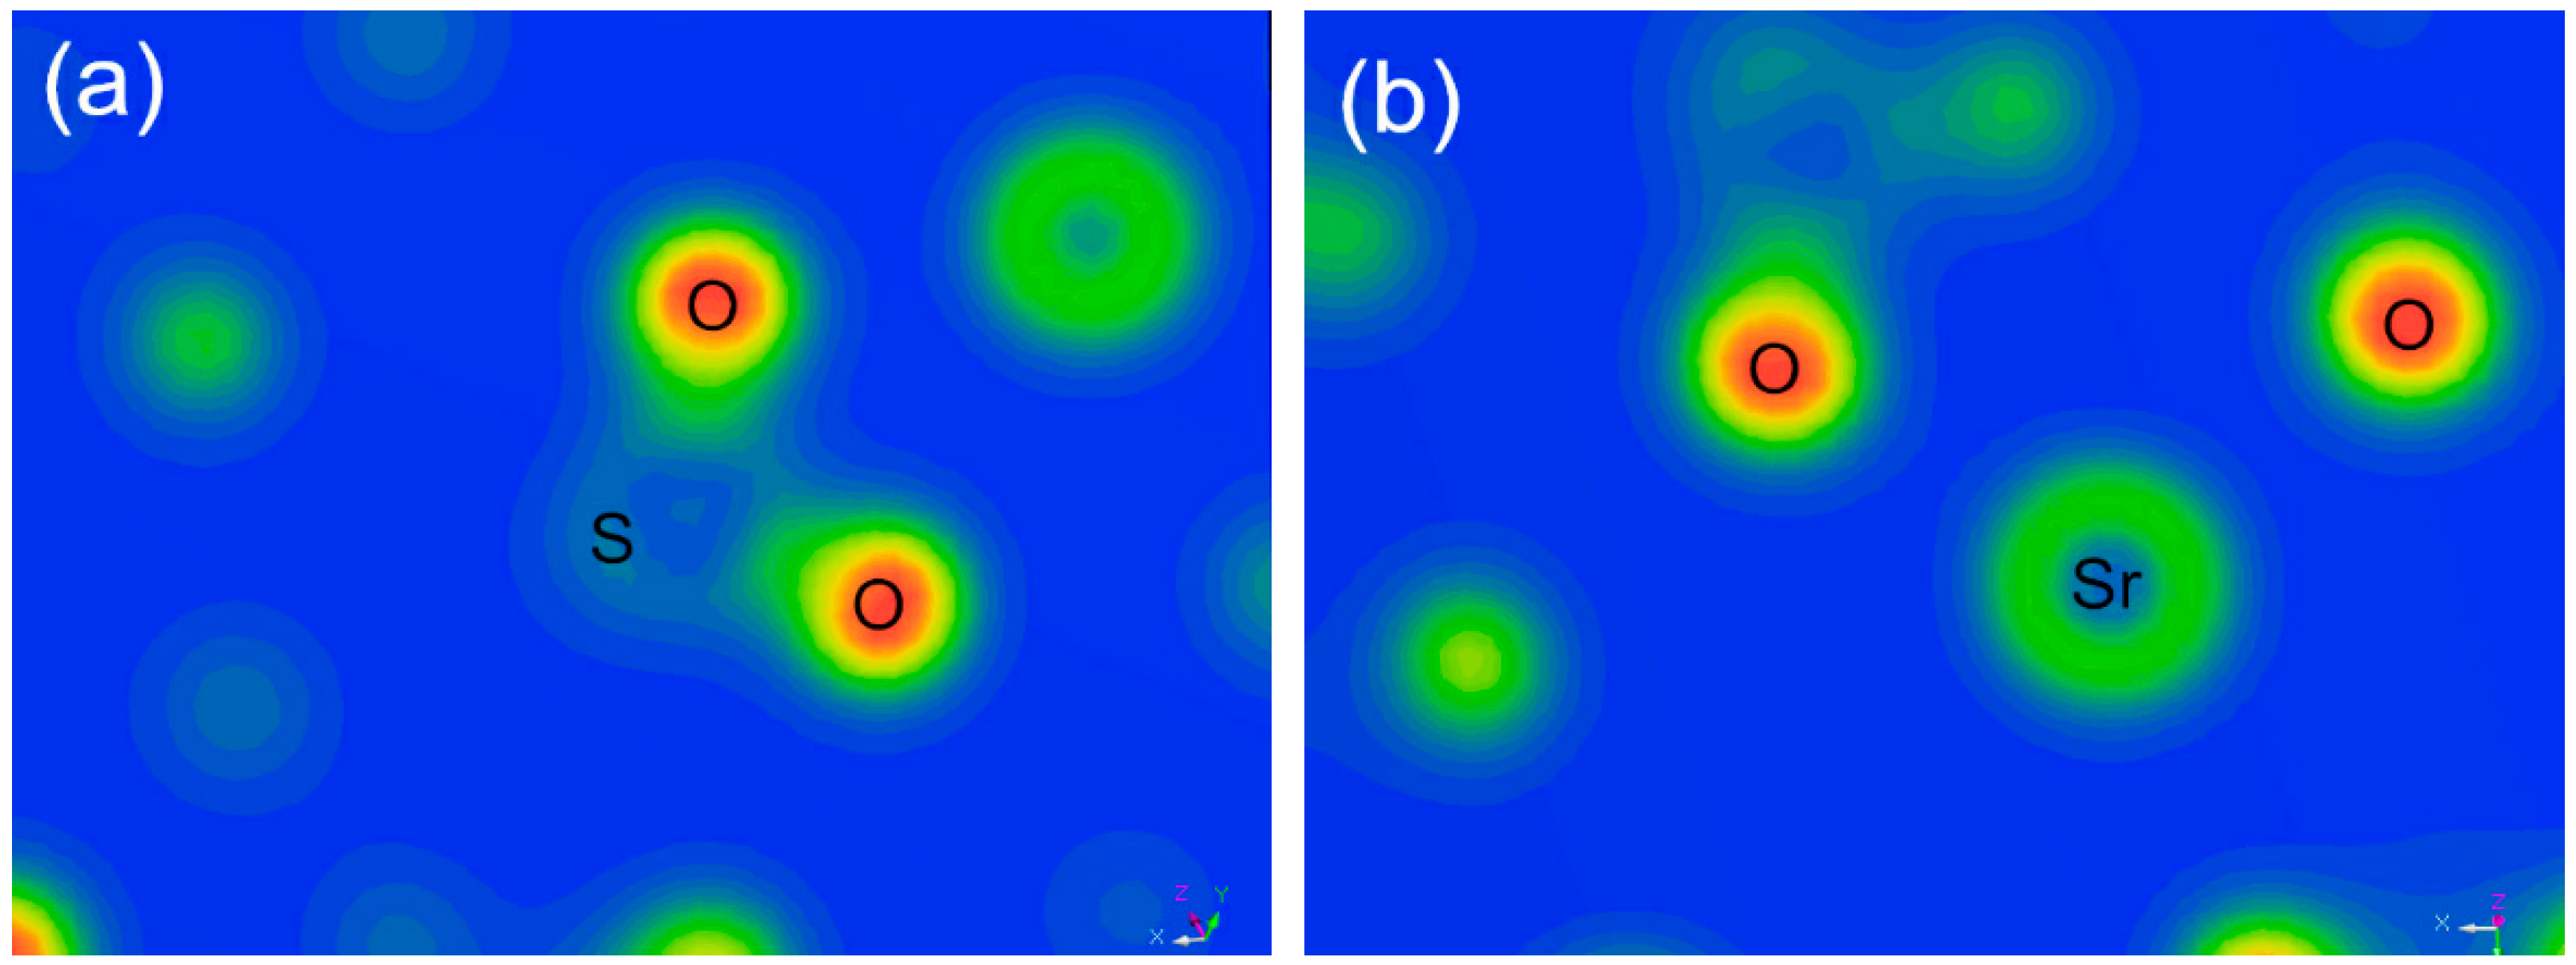
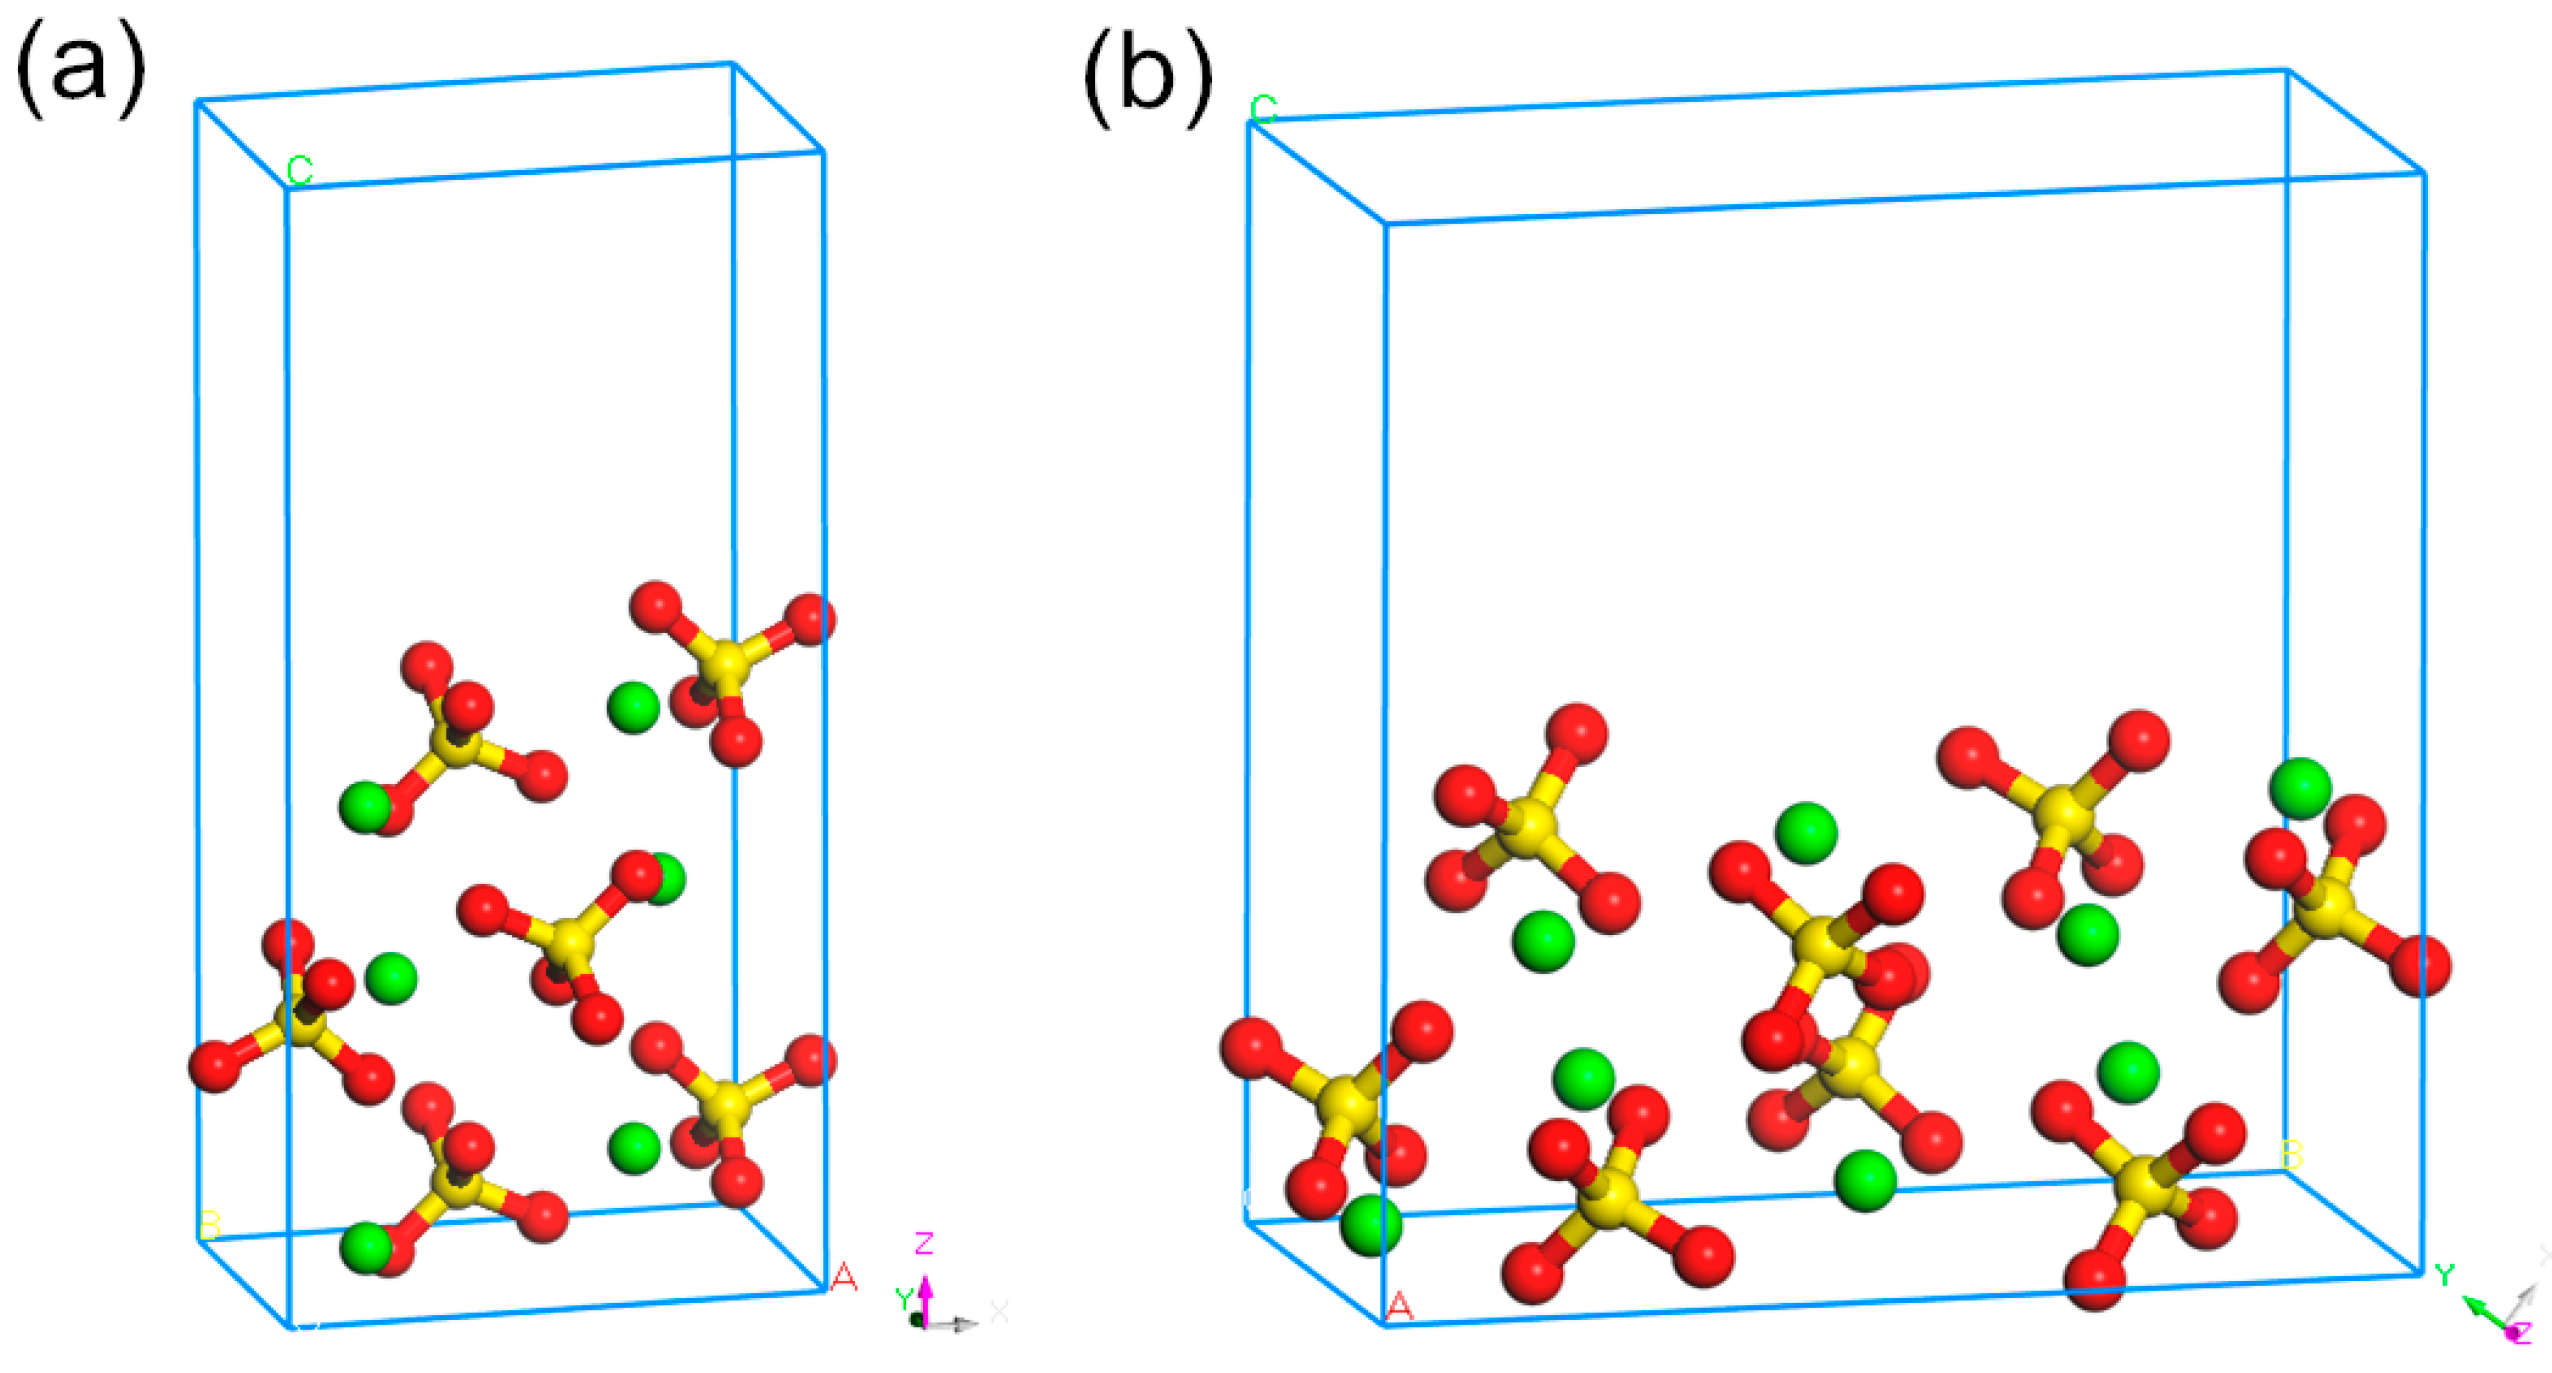
3.2. Surface Properties of Celestite

The interactions involving metal ions, flotation reagents, and minerals mainly occurred on mineral cleavage surfaces in flotation pulp. Hence, the properties of celestite cleavage surface play a key role in aqueous solution. According to DFT calculation, the electronic properties of celestite, including electron density map (EDM) and bond population, were investigated. The EDM is useful for illustrating bonding interaction by showing the electron distribution [27]. The EDM between S–O atoms and Sr–O atoms is shown in Figure 3. Each of the colours in the slices of the figures represents a specific range of the charge density, the electron density increases with the EDM colour changing from blue to red. Figure 3a reveals that there were many electron overlaps between the S–O atoms, while Figure 3b shows that there were few electrons distributed between the Sr–O atoms. The results indicate the covalency of the S–O bonds and ironicity of the Sr–O bonds. The bond population is exhibited in Table 2. It can be seen that the population of the S–O1, S–O2, and S–O3 bonds were 0.59, 0.58, and 0.54, respectively, suggesting that the S–O bond exhibited strong covalent character [28], along with short bond length, and it is known that the bonds within the SO4 groups were very strong and could hardly be broken [29]. The Sr–O bonds were characterized by a population lower than 0.15 and bond length higher than 2.50 Å, hence, the Sr–O bonds exhibited strong iconicity. The bond population was consistent with the EDM results. It can be concluded from the bond properties that it mainly ruptured along the weak Sr–O bonds instead of the strong S–O bonds during the mineral liberation process.
According to previous studies, the primary cleavage surfaces of celestite are {001} and {210} [30]. Based on the bond population analysis, it mainly ruptures along the weak Sr–O bond during the mineral liberation process. Therefore, the most likely cleavage position along the {001} and {210} directions can be determined, and on this basis of the structures of {001} and {210}, cleavage surfaces were built (Figure 4). It can be seen that on both {001} and {210} surfaces, there were ≡Sr2+ and ≡SO42− broken bonds exposed on the surfaces with a 1:1 ratio. According to surface complexation theory [31,32,33], the broken bonds transformed to ≡SrOH0 and ≡SO4H0 groups in aqueous environment due to the surface hydration (≡SrOH0 may present as ≡SrO and ≡SrOH2+, and ≡SO4H0 may present as ≡SO4 as solution pH changes). These surface groups can not only change surface electronic potential due to the protonation and deprotonation, but also play key roles on surface complexation such as metal ion adsorption.

3.3. Adsorption Mechanism of Ferric Ions on Celestite Surface
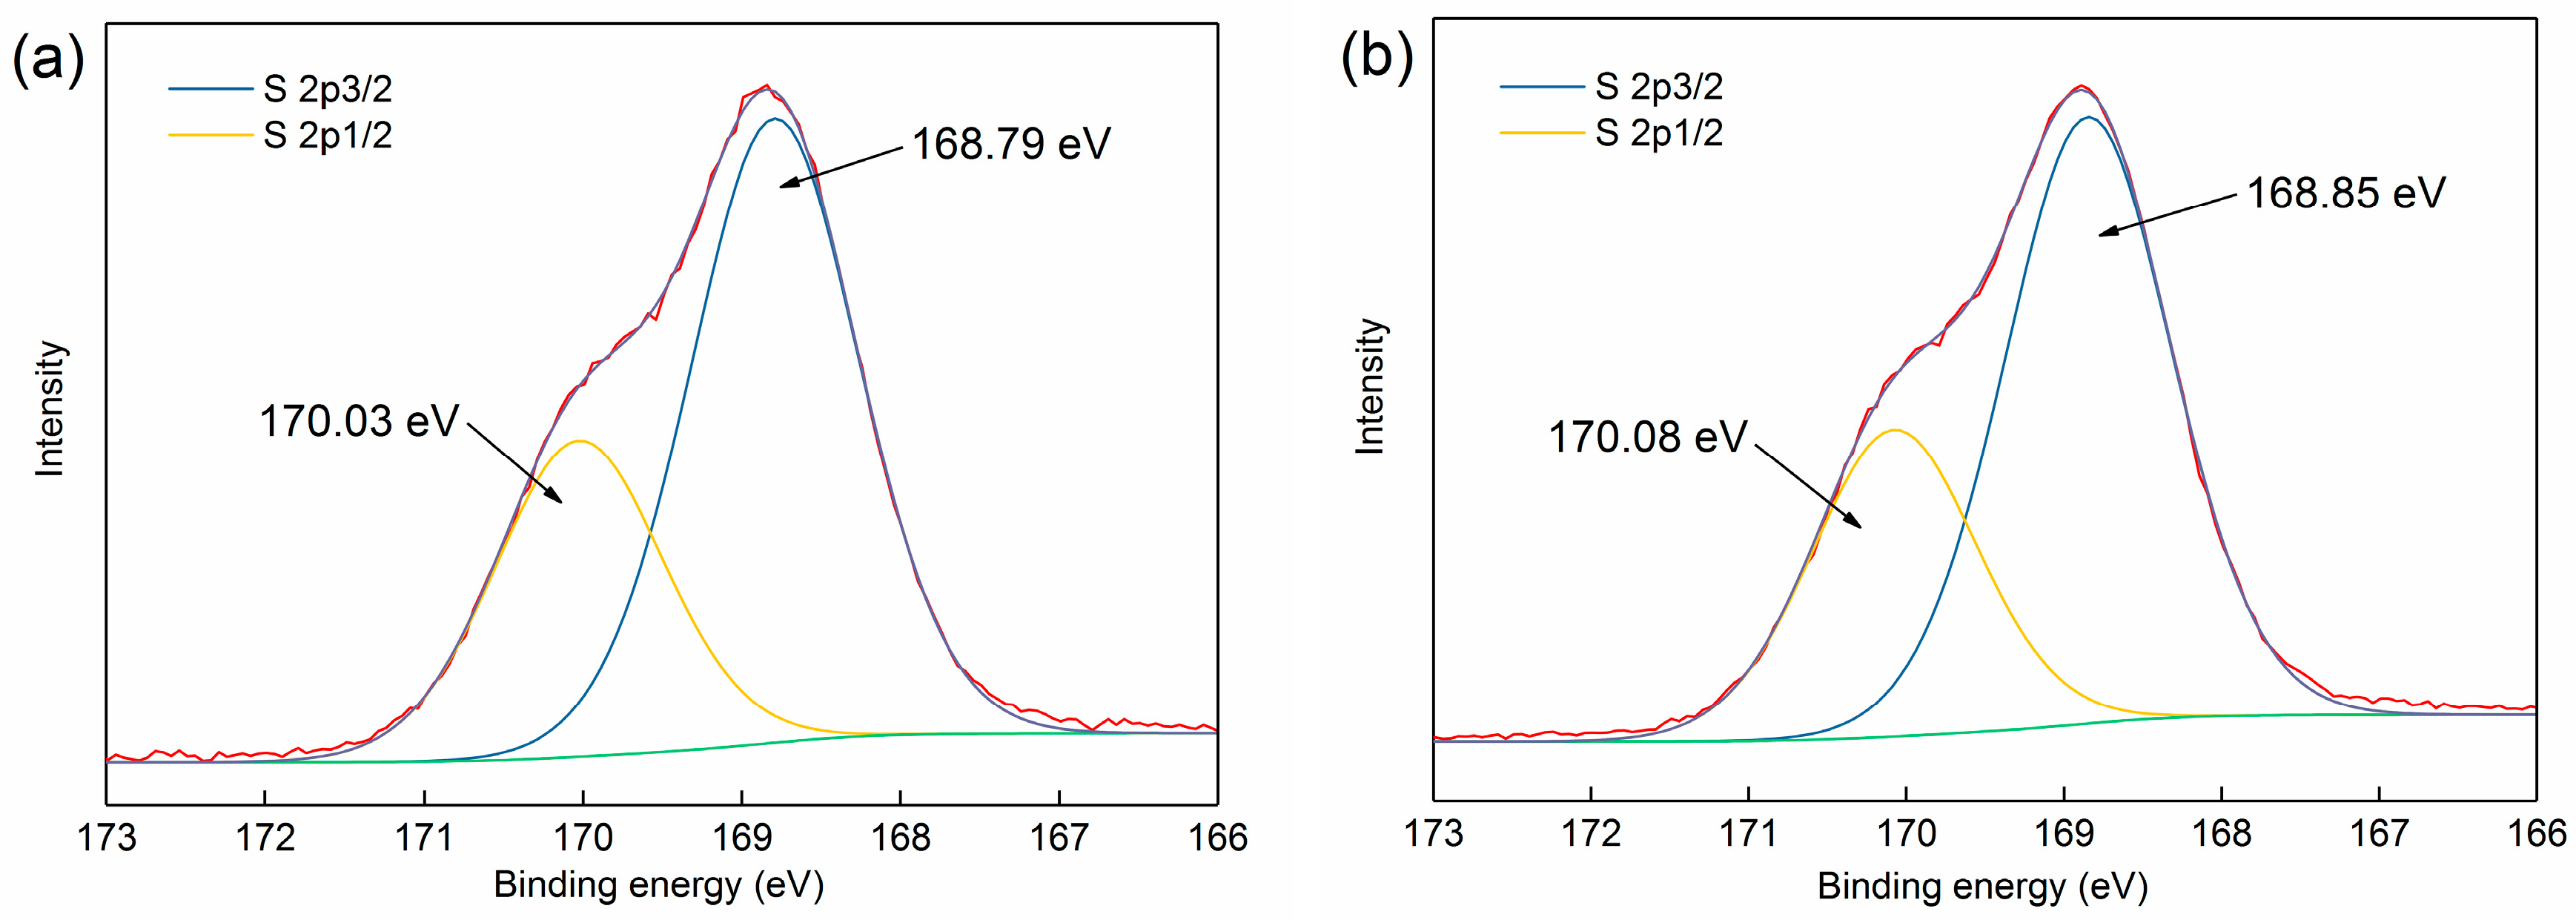
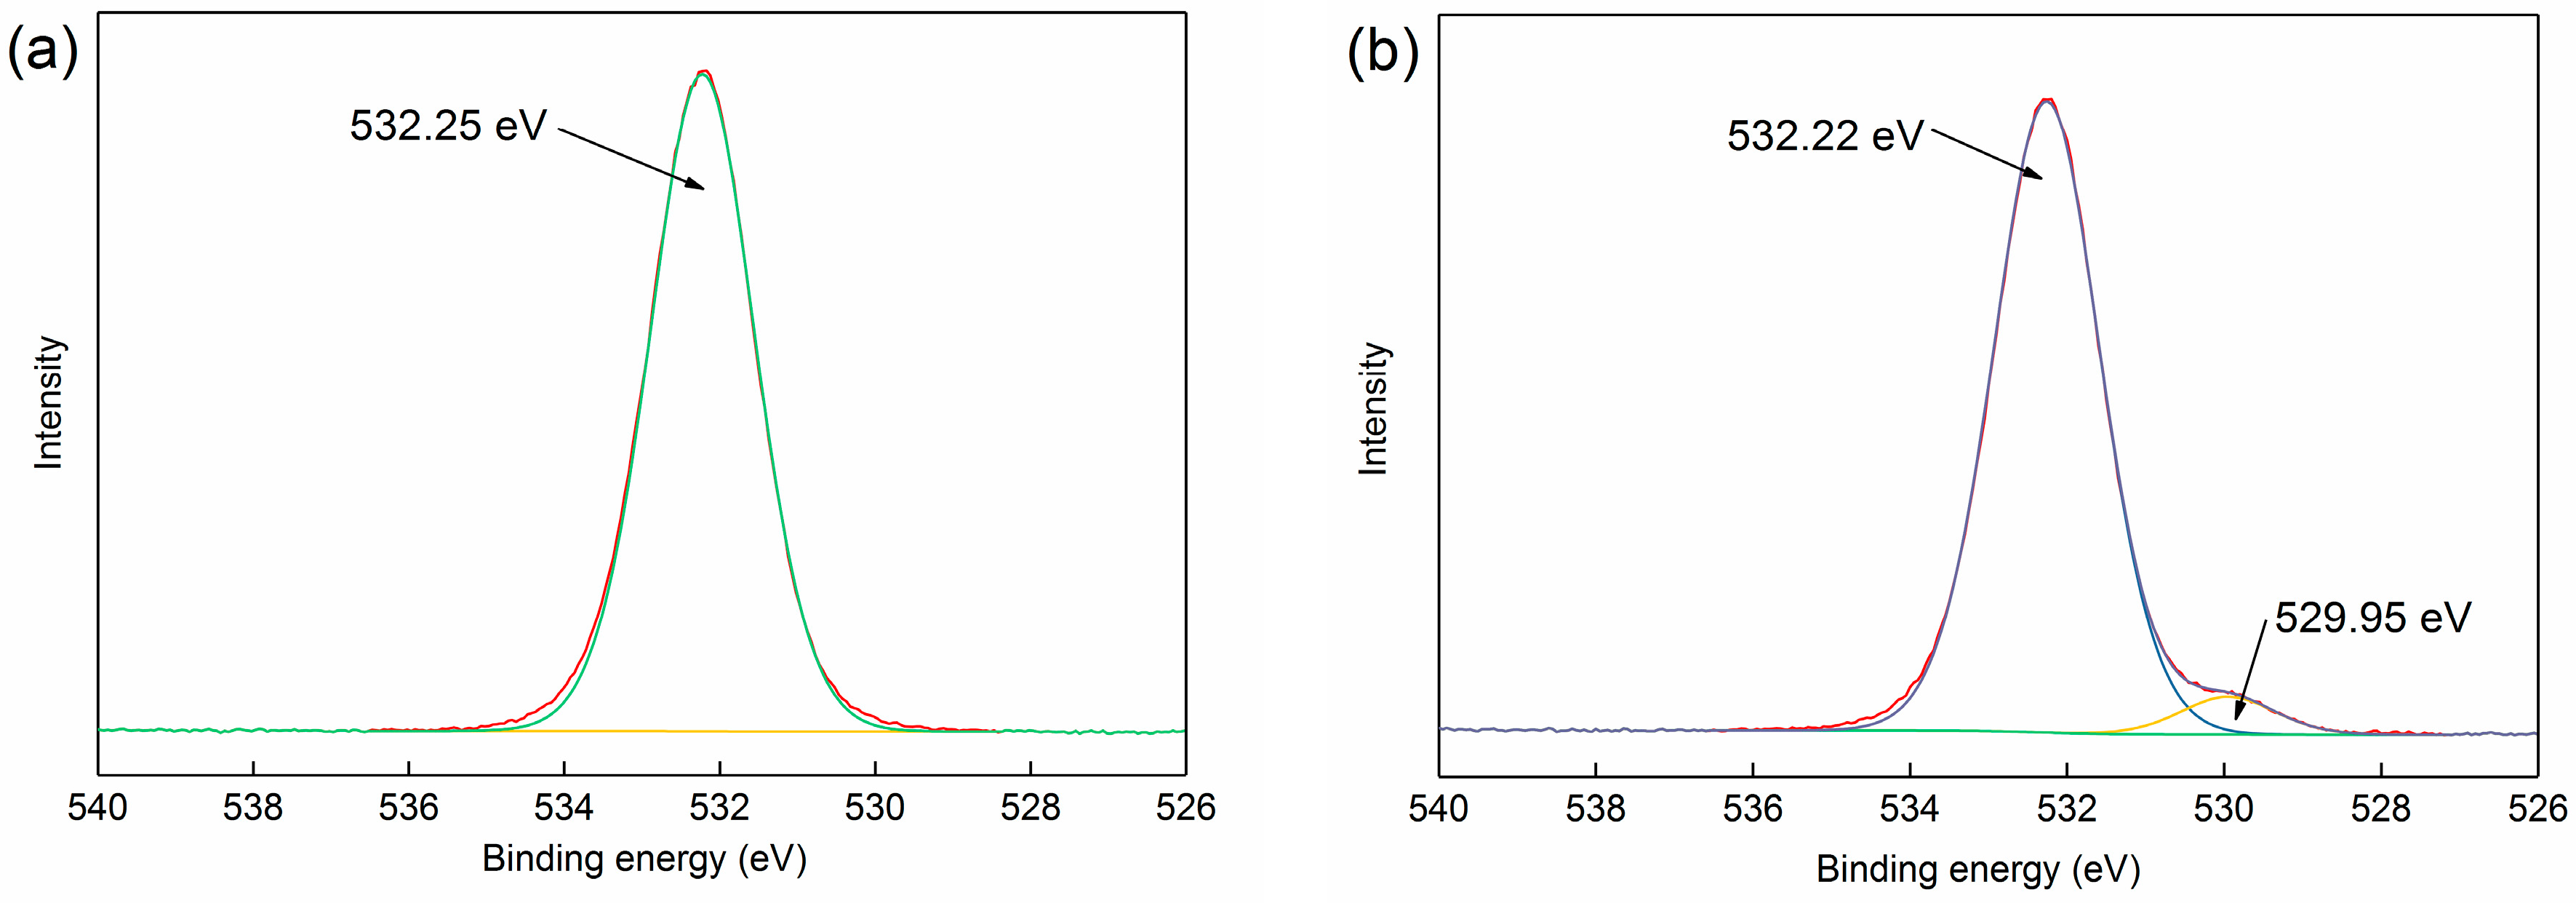
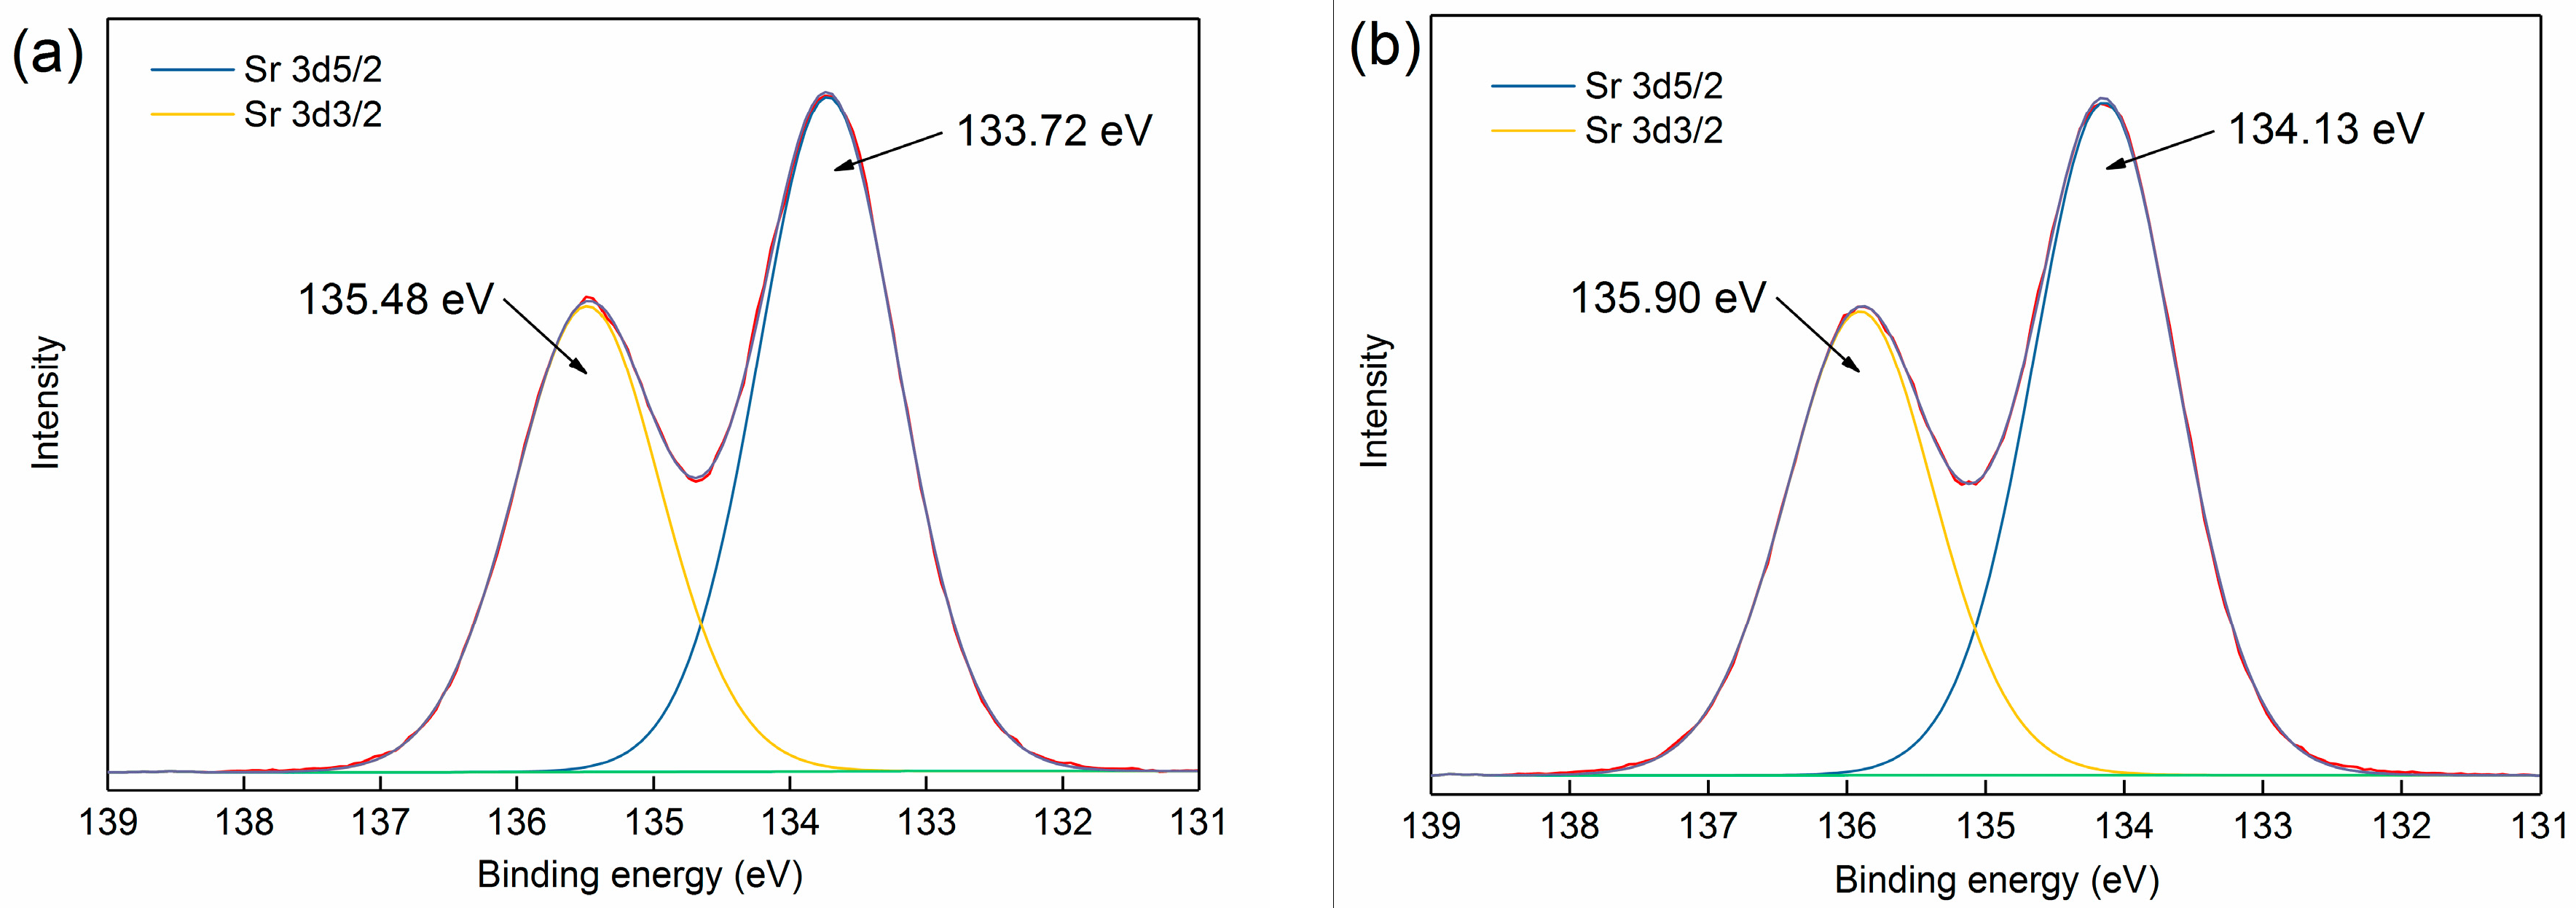
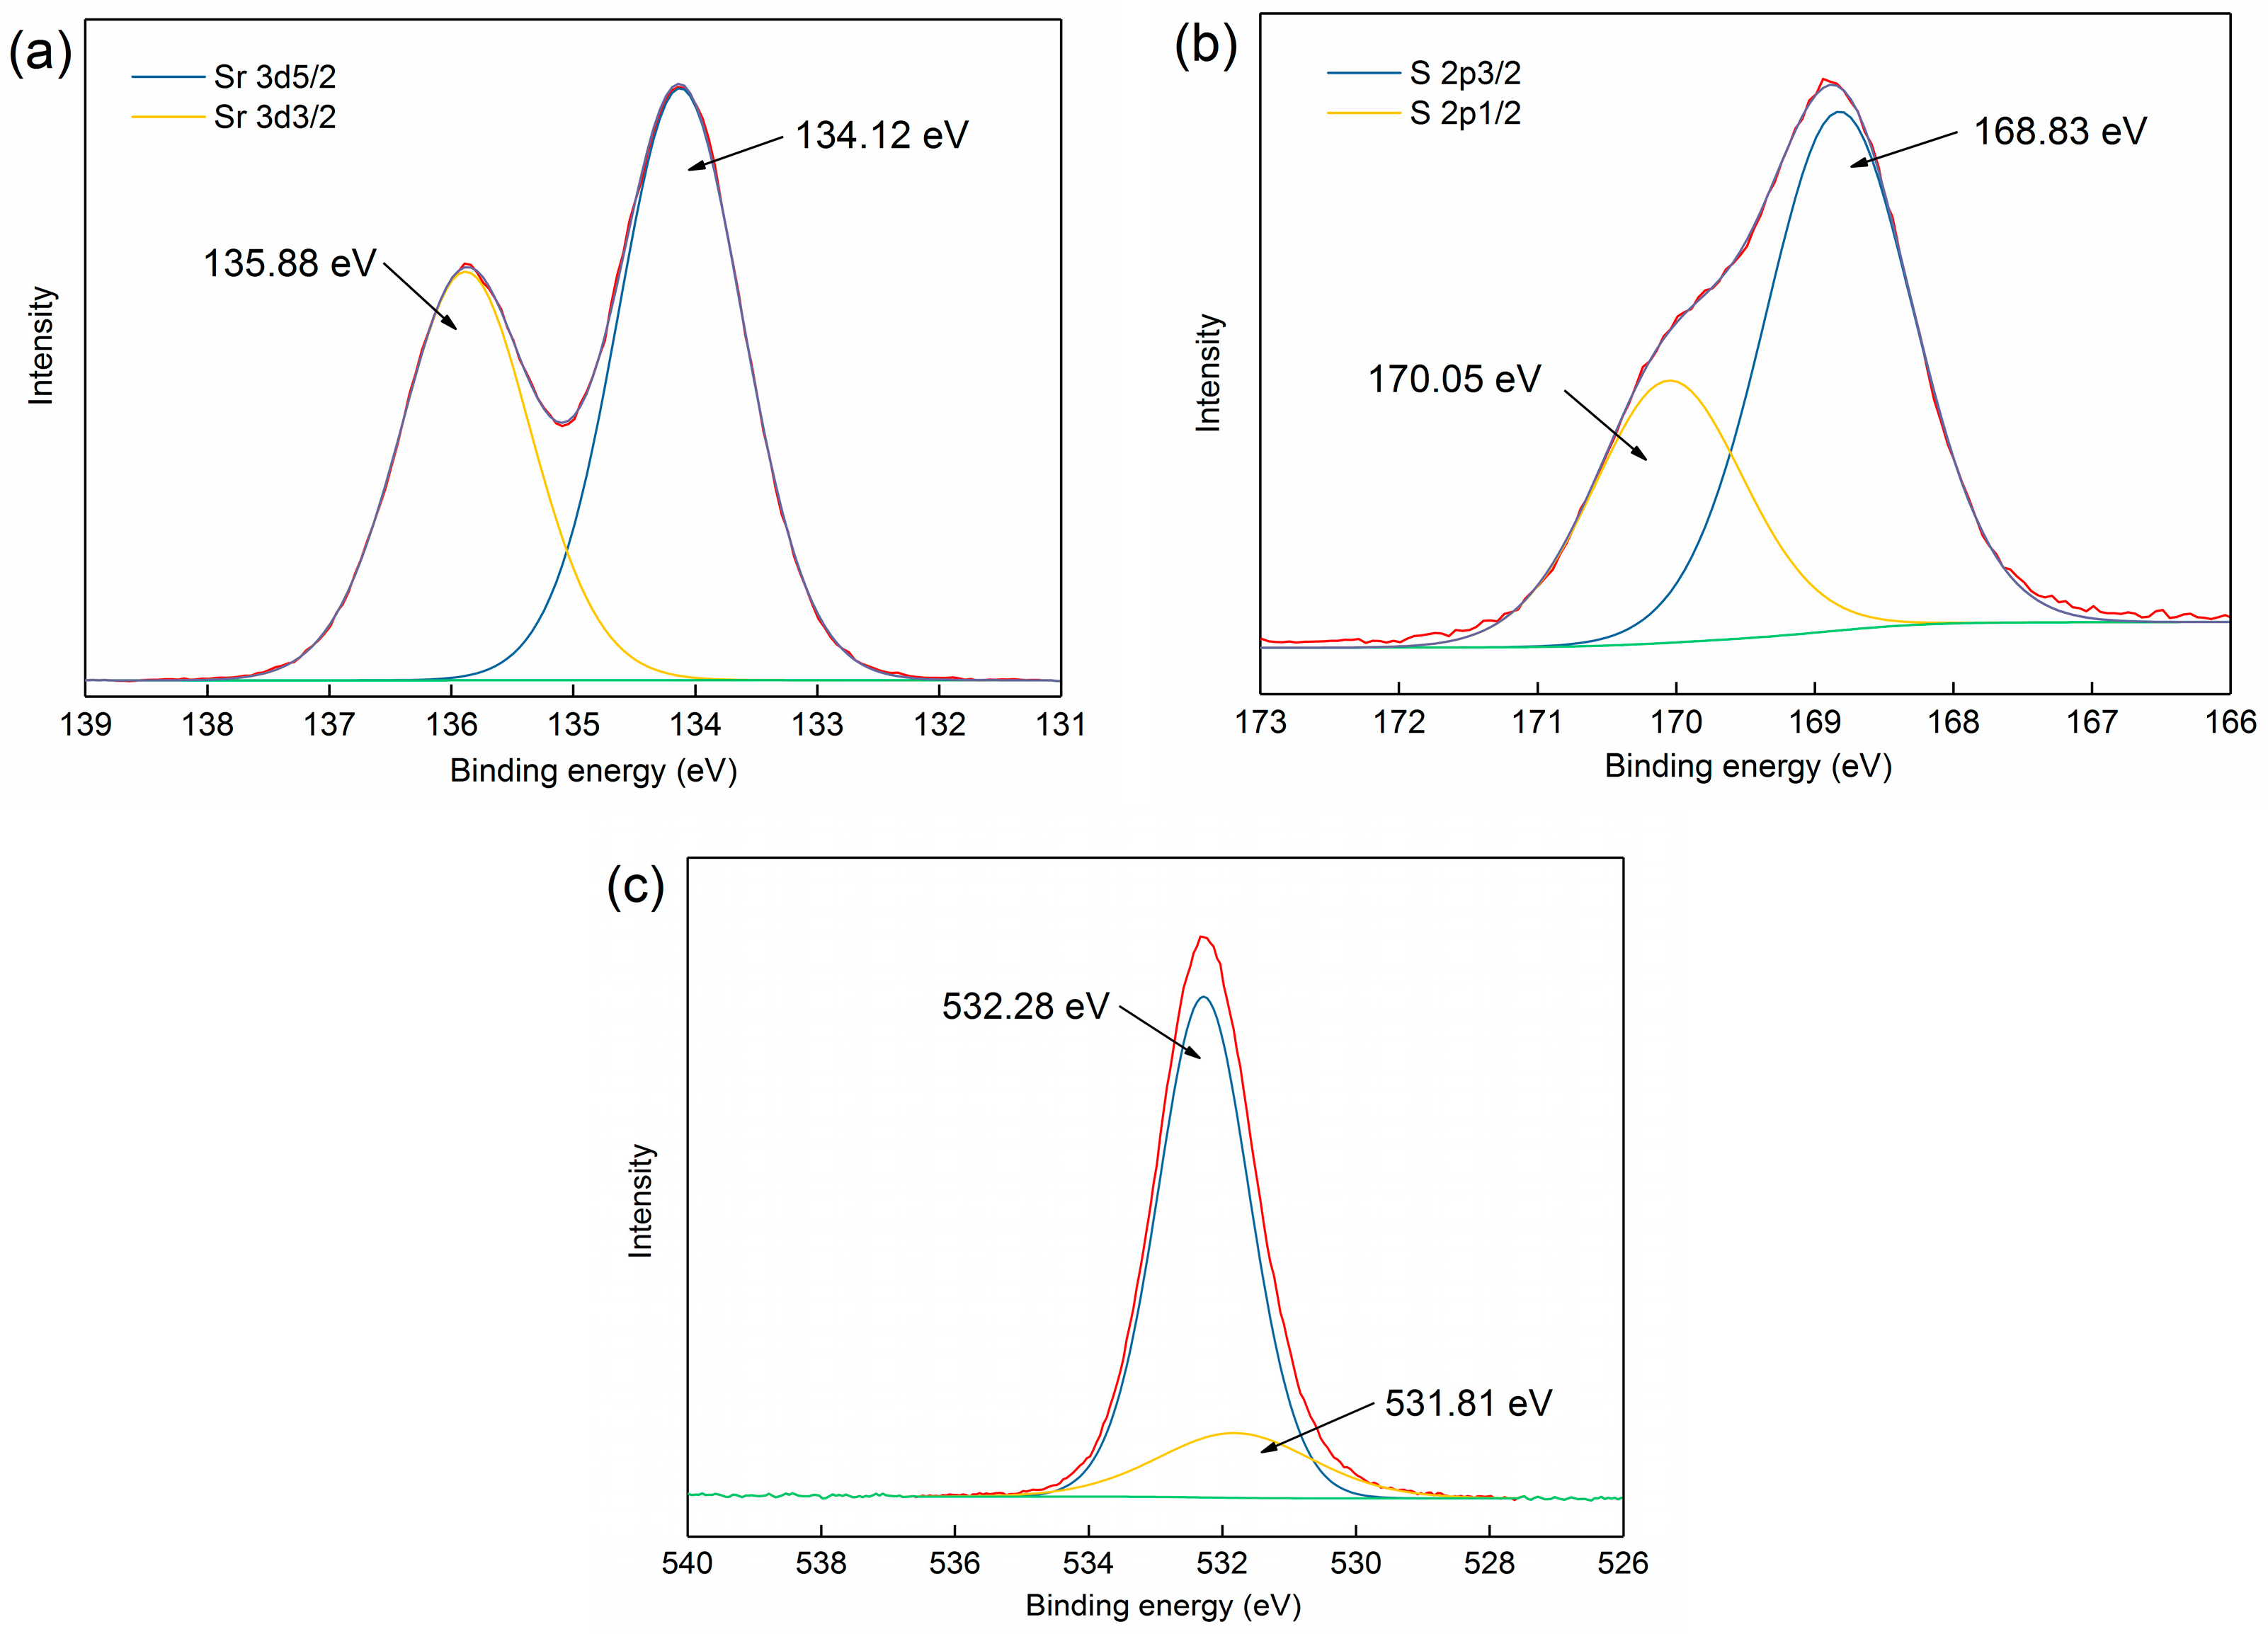
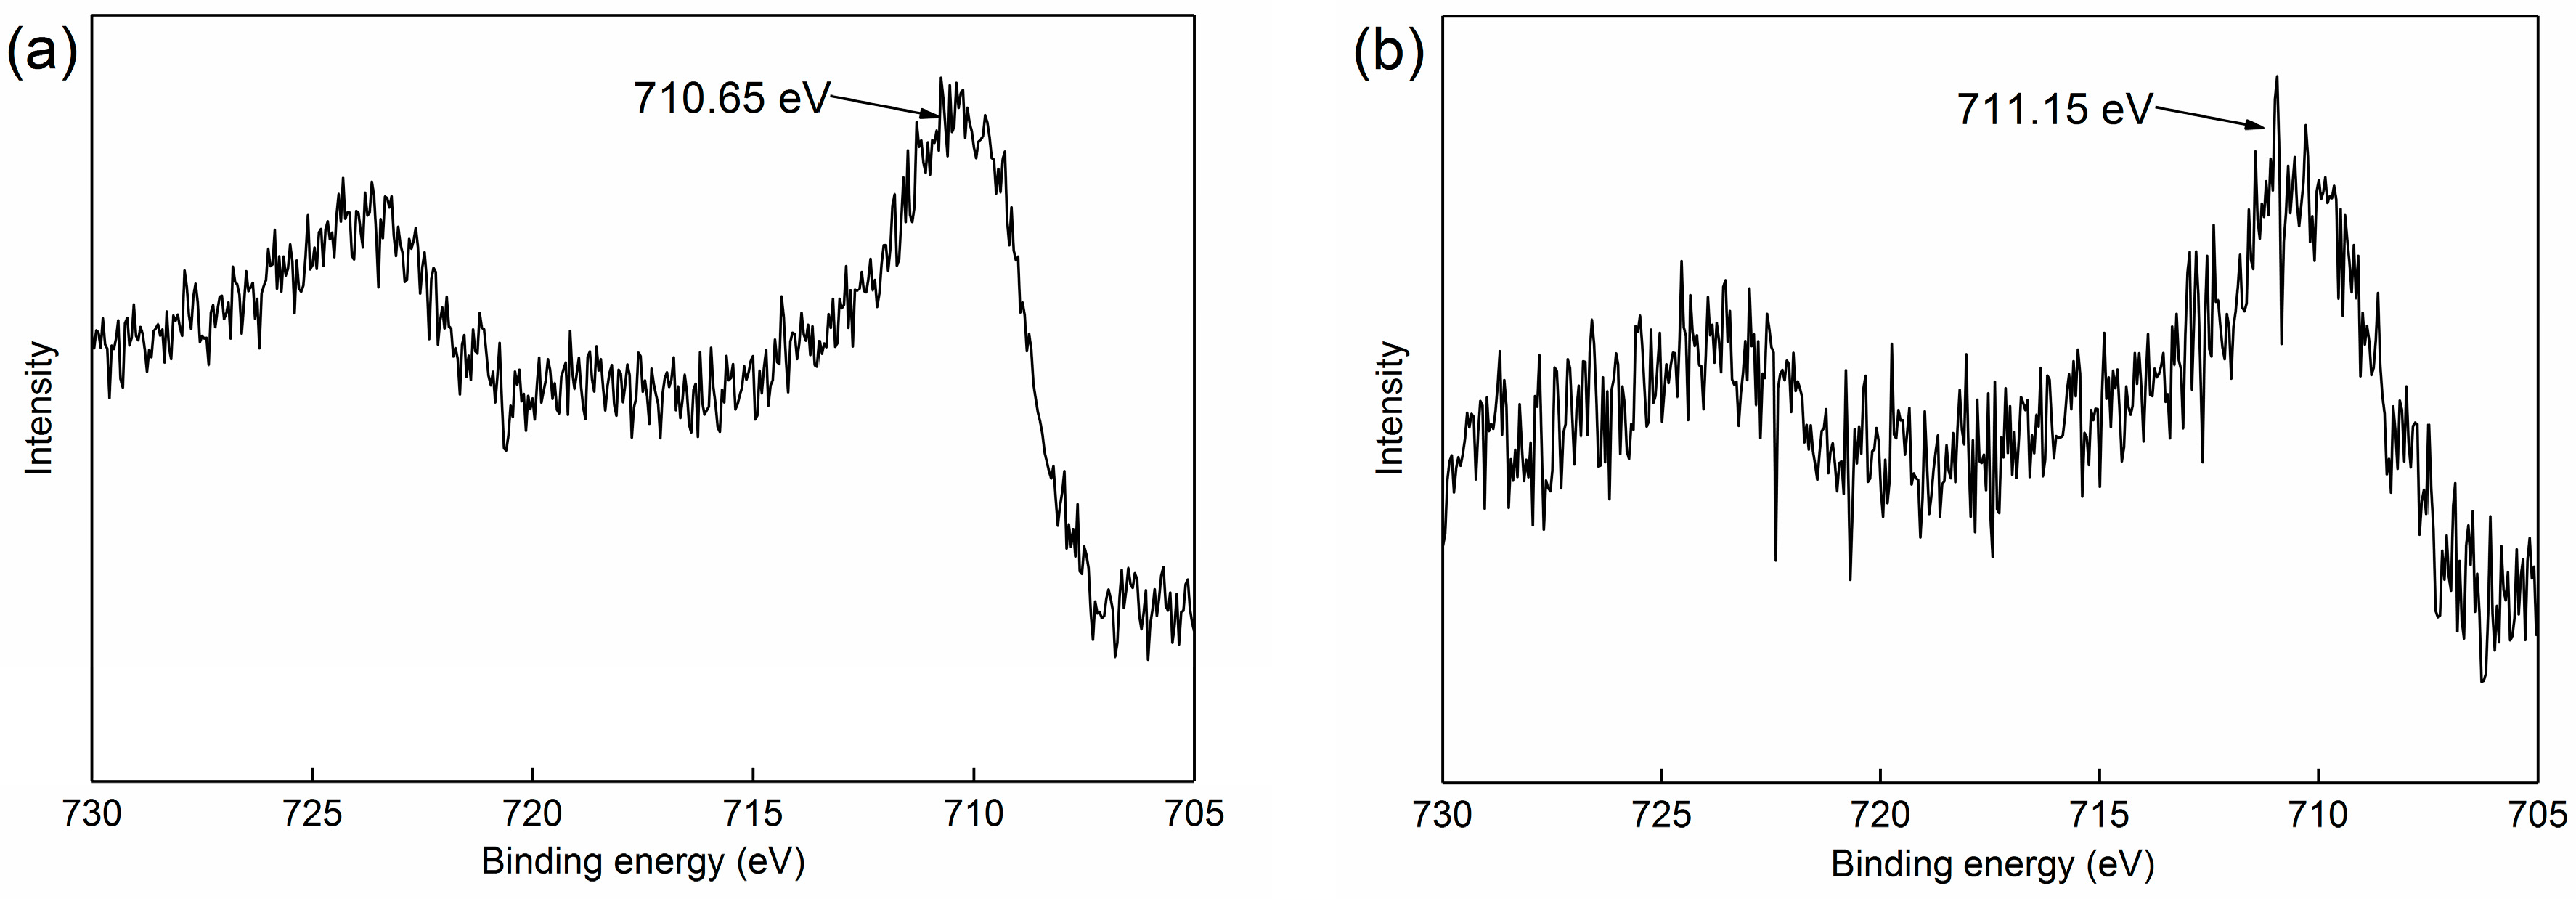
3.3.1. XPS Analysis

X-ray photoelectron spectroscopy (XPS) is useful to identify the elemental composition and chemical states on mineral surfaces due to the distinctive binding energies of the inner electrons of each element [34]. The XPS analysis was applied in this work to elucidate the effect of ferric ions on the surface properties of celestite. The celestite surfaces which were conditioned in the absence and presence of 5 × 10⁻⁵ mol/dm3 of ferric ions were analysed by XPS. Figure 5 shows the full spectra of original celestite and celestite treated by ferric ions over the binding energy of 1000–0 eV. The peaks of intrinsic elements of celestite including Sr 3d, S 2p, and O 1s can be observed, and peaks of C 1s contaminations can also be observed in Figure 5a. No other peaks such as Fe could be detected in the survey scan of original celestite, indicating the relatively high purity of the celestite samples. As shown in Figure 5b, two spectral peaks of Fe appeared around 730–705 eV of celestite conditioned by ferric ions. This implies the adsorption of ferric ions on celestite surface.
As shown in Figure 6a, the S 2p of original celestite can be reasonably fitted with two peaks at 168.79 eV and 170.03 eV. The component at 168.79 eV was assigned to S 2p3/2 and the peak at 170.03 eV was assigned to S 2p1/2 [35]. It can be seen from Figure 6b that after being treated with ferric ions, the binding energy of S 2p3/2 and S 2p1/2 had barely shifted, indicating the chemical surroundings of S in the SO42− group had not changed.
Figure 7 presents the O 1s spectrum of celestite before and after ferric ion treatment. On the original celestite surface, the peak positioned at 532.25 eV was attributed to the O 1s in SO42− of celestite. After the celestite was conditioned by ferric ions, the O 1s peak could be reasonably fitted with two peaks (Figure 7b); it shows that the binding energy of O 1s in SO42− was 532.22 eV [35], indicating the chemical environment of O in SO42− had not changed. Combined with the binding energy analysis of S 2p, it can be concluded that the ≡SO4H0 groups on celestite was not the adsorption site for ferric ions. This may due to the fact that ferric sulphate cannot stably exist in aqueous environments [36].
Figure 8 plots the diagrams of ferric ion species distribution as a function of pH at the concentration of 5 × 10⁻⁵ mol/dm3 (calculated by Visual MINTEQ3 software (version 3.1, Posted by Jon Petter Gustafsson)) [17]. It can be seen that the solution contains numerous ferric ion species, most of which are hydroxyl complexes. Free Fe3+ only presents at pH < 4. The specie of Fe(OH)3(s) appears at approximately pH 2.8; its proportion increased rapidly with pH and became the primary component at pH > 3. The pH condition of mineral flotation commonly ranges from weak acid to alkalescence. Under this occasion, the ferric ions mainly present as Fe(OH)3(s). It can be seen from Figure 7b that a new peak of O 1s appeared at 529.95 eV, implying the conditioning of ferric ion may have led to the formation of foreign oxygen-bearing adsorbate on celestite. The binding energy of new O 1s peak agreed with the binding energy of oxygen atom in Fe(OH)3(s).
Figure 9a shows the Sr 3d spectra of the original celestite, a double structure was obtained with a binding energy of 135.48 eV for the Sr 3d3/2 level and a binding energy of 133.72 eV for the Sr 3d5/2 level [37]. After the treatment of ferric ions, the binding energy of Sr 3d3/2 shifted 0.42 eV and the binding energy of Sr 3d5/2 shifted 0.41 eV (Figure 9b). The results suggest that the chemical surroundings of the Sr atom on celestite surface changed due to the adsorption of ferric ions. Combined with O 1s binding energy analysis and the solution chemistry of ferric ions, it can be deduced that ferric ions were adsorbed by interacting with surface ≡SrOH0 groups to form ≡Sr–O–Fe–OH precipitates [11,38].

3.3.2. Adsorption Isotherm Investigation

To investigate the adsorption configuration of ferric ion species on celestite surface, adsorption isotherms were analysed using Langmuir, Freundlich and Temkin models. The calculated parameters and correlation coefficients are listed in Table 3, and the resulting graphs are shown in Figure 10. It can be seen that the regression coefficient values (R2) for Langmuir, Freundlich and Temkin models were 0.93, 0.97 and 0.89, respectively. Hence, the Freundlich model best fits the experimental adsorption data. It must be noted that neither of the R2 values had achieved greater values (R2 > 0.99); this implies that the ferric ion adsorption on celestite is complicated, besides the interaction between ferric ion species and surface ≡SrOH0 groups, electrostatic adsorption may also occur due to the strong potential negativity of celestite surface [39]. The calculated 1/n values of the Freundlich model (0.55) was lower than 1, suggesting that ferric ions could be readily adsorbed by celestite surface under the studied temperature [40,41]. When it comes to the adsorption of metal ions on mineral surface, the Freundlich constant 1/n represents the number of metal ion species which interacted with one adsorption site on mineral surface, therefore the n value represents the number of binding oxygen on mineral surface which one adsorbed ion species interacted with [42,43,44]. It can be calculated that the n value of the Freundlich model for ferric ion adsorption was 1.83, indicating that ferric ions are mainly adsorbed on celestite surface by multi-coordination, the most adsorbed ferric ion species complex with two oxygen atoms of surface ≡SrOH0 groups.

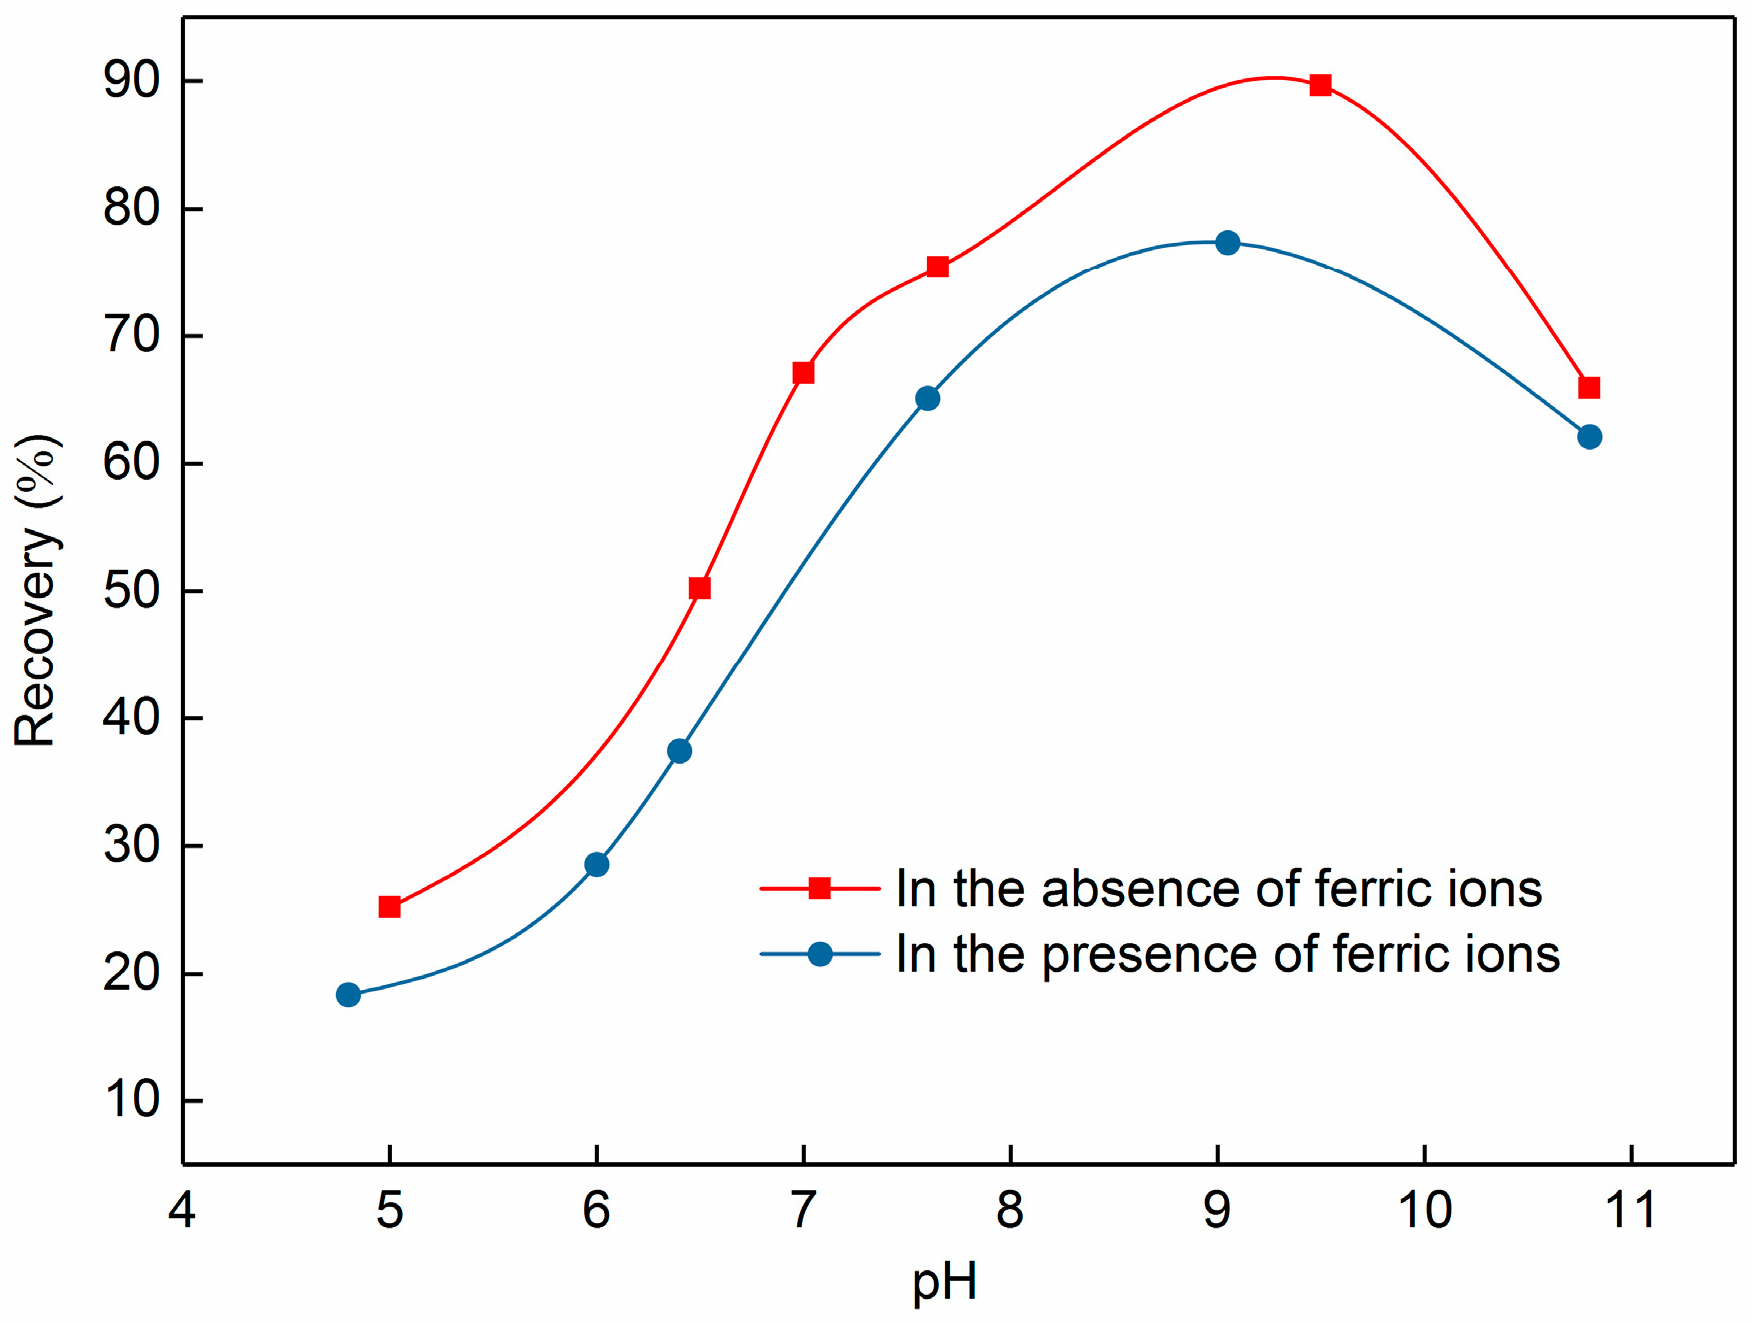
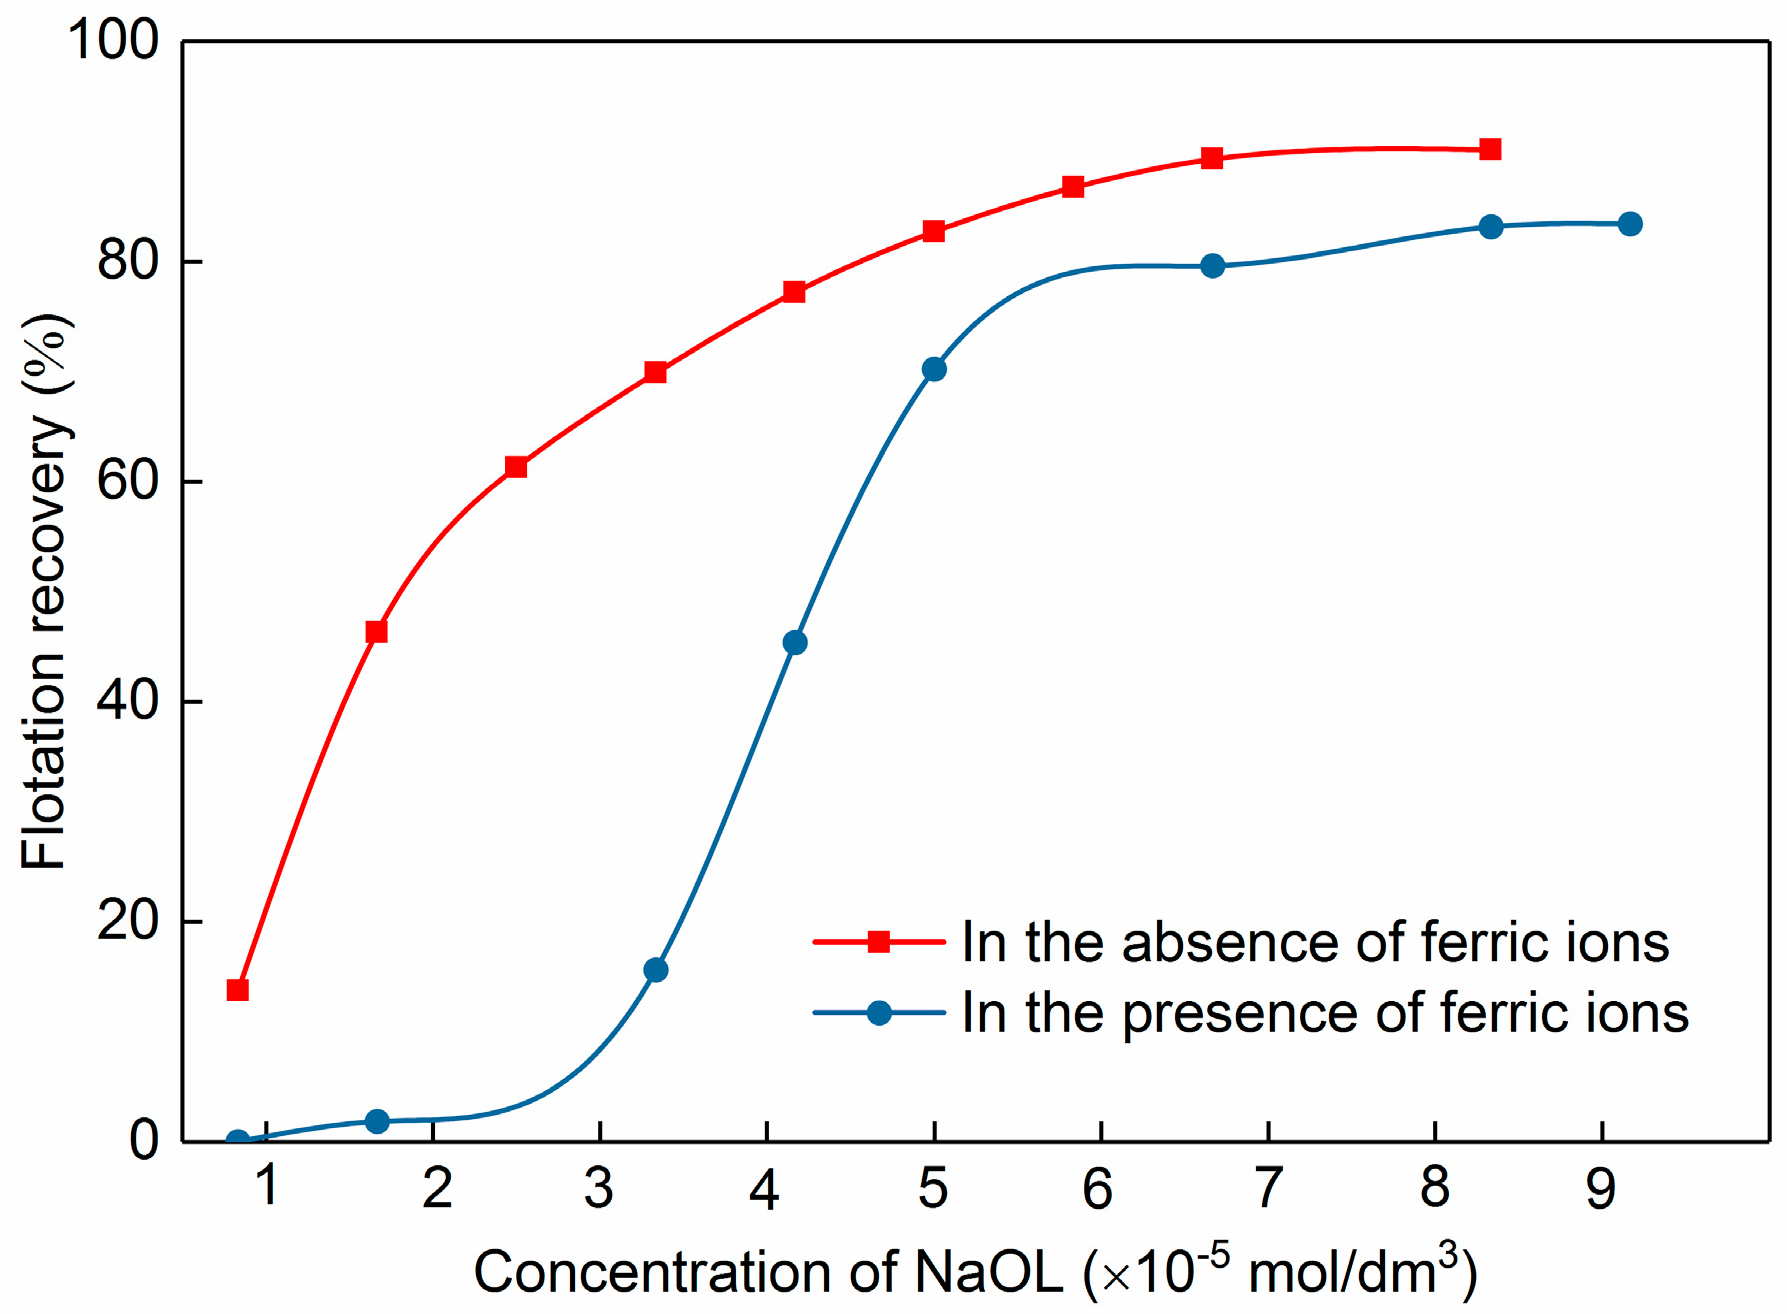
3.4. Implication Mechanism of Ferric Ions on Celestite Flotation

Figure 11 shows the effect of pH on celestite flotation in the absence and presence of ferric ions with 5 × 10⁻⁵ mol/dm3 of sodium oleate as collector. The original celestite exhibited strong floatability in the pH range of 8–10. The flotation recovery increased gradually with the increase of pH and reached maximum recovery of 89.64% at pH 9.5. Hereafter, as the pH increased, the flotation recovery decreased rapidly. When the celestite was conditioned by 5 × 10⁻⁵ mol/dm3 of ferric ions, the floatability of celestite decreased during the whole pH range. Ferric ions showed strong depression on celestite flotation in alkalescent environments, and the maximum gap between the two recovery curves was about 25.00% appearing at pH 9.2. While in a high pH environment of pH > 10, the depression of ferric ions turned very weak.
It is well established that the unabsorbed ferric ion species in solution precipitate oleate collectors by complexation, leading to the decrease of collector adsorption on mineral surface [17,45]. The solubility product (pLs) of ferric oleate was 34.2 [17], indicating the ferric oleate precipitate forms at quite low concentrations of ferric ion species and oleate ions. The distribution diagram of sodium oleate as a function of pH (Figure 12) reveals that sodium oleate mainly presents as oleate ions (OL, (OL)22− and H(OL)2) in the pH range from weak acid to alkaline, which is beneficial to the reaction between ferric ion species and oleate ions. The oleate ions replaced the hydroxyl in ferric hydroxide to form ferric oleate [46]. Therefore, the residual ferric ion species in celestite flotation pulp inevitably depressed celestite flotation by the consumption of oleate ions. However, the implication of adsorbed ferric ions on celestite flotation is still unclear. Flotation experiments as a function of NaOL concentration in the absence and presence of ferric ions were conducted. It can be seen from Figure 13 that, in the whole experiment range, the flotation recovery in the absence of ferric ions was higher than that in the presence of ferric ions under the same concentration of NaOL. The flotation recovery of original celestite increased rapidly with the increase of NaOL concentration and reached maximum recovery at the collector concentration of 6.67 × 10⁻⁵ mol/dm3. In the presence of ferric ions, the celestite began to float at NaOL concentration of 1.67 × 10⁻⁵ mol/dm3, and the flotation recovery increased rapidly when collector concentration was higher than 3.33 × 10⁻⁵ mol/dm3. To make up the collector which was consumed by ferric ions in solution, the concentration of sodium oleate was continuously increased until the maximum flotation recovery of 83.17% was obtained and on longer increased with the increase of collector concentration. As it can be seen that even the concentration of sodium oleate is high enough to make up for the collectors consumed by residual ferric ions, the maximum recovery was still lower than that of original celestite flotation. It suggests that the adsorption of ferric ions on celestite surface also decreased mineral floatability.
Oleate collectors are mainly adsorbed on mineral surface by complexing with surface metal sites [18,47]. The celestite surfaces before and after NaOL treatment were analysed by XPS. As shown in Figure 14a, after NaOL treatment, the binding energy of Sr 3d3/2 and Sr 3d5/2 on celestite surface was 135.88 eV and 134.12 eV, respectively. Compared with the binding energy of original celestite (Figure 9a), it was found that the chemical surroundings of Sr had changed after oleate adsorption. Figure 14b,c revealed that the binding energy of S 2p1/2, S 2p3/2, and O 1s of SO42− groups had barely shifted after NaOL treatment, indicating the SO42– on celestite surface was not involved in the collector adsorption reaction. A new peak of O 1s appeared at 531.81 eV, which might be ascribed to the oxygen atom in carboxy group of NaOL. The binding energy analysis suggests that oleate ions were adsorbed on celestite surface by complexing with Sr sites on celestite surface. The influence of collector treatment on atomic concentration are shown in Table 4, and it can be seen that the collector treatment increased C concentration from 5.77% to 10.08%, which may be attributed to the adsorption of the collector that are characterized with a long carbon chain. The surface Sr concentration decreased from 12.22% to 8.04%; it agreed with the binding energy analysis which revealed that the collector complexed with surface Sr sites.
To investigate the effect of adsorbed ferric ions on collector adsorption, the celestite treated by ferric ions and celestite treated by ferric ions and NaOL were analysed by XPS, and the precise scans of Fe 2p are shown in Figure 15. It can be seen that the binding energy of adsorbed Fe 2p3/2 on celestite surface was 710.65 eV. After the surface was further treated by NaOL, the binding energy of Fe 2p3/2 shifted 0.50 eV, indicating the interaction between adsorbed Fe and collector. The complexation between ferric ions and oleate ions has been reported to be characterized with a high complexing constant [17], leading to the complexation between adsorbed Fe on celestite surface and collector. Therefore, both surface ≡SrOH0 groups and adsorbed Fe on celestite surface are adsorption sites for collector during flotation process. However, the adsorption of ferric ions decreased celestite floatability according to flotation experiments. Combing with the adsorption mechanism of ferric ions on celestite which reveals that ferric ions are mainly adsorbed by complexing with two oxygen atoms of surface ≡SrOH0 groups, it can be deduced that the adsorption of ferric ions decreased adsorption sites for collectors, leading to the decrease of collector adsorption, and therefore, depressed celestite flotation (Figure 16).

4. Conclusions

The celestite flotation was inevitably affected by ferric ions released from associated limonite. The ferric ion–celestite interaction and its implications for flotation is a complicated process that requires a combination of different techniques to investigate. The release of ferric ions to a celestite flotation environment from limonite was confirmed by mineral dissolution experiments. Then the surface properties of celestite were studied using DFT calculation. On this basis, the adsorption mechanism of ferric ions on celestite surface was investigated by XPS analysis and adsorption isotherm study. Flotation tests and XPS analysis were used to reveal the implication mechanism of ferric ions for celestite flotation. Given the abovementioned results, we draw the following primary conclusions.
The associated limonite was able to release ferric ions to a celestite flotation environment. The ferric ions adsorbed on a celestite surface by interacting with two oxygen atoms of surface ≡SrOH0 groups to form ≡Sr–O–Fe–OH precipitates. The ferric ions depressed celestite flotation, and the maximum decrease of flotation recovery reached 25.00% under certain conditions. The adsorption of ferric ions on celestite surface decreased adsorption sites for the collector, hence, leading to depression on celestite flotation.

Author Contributions

S.C. designed and performed the experiments, analysed the data, and wrote the drafts of the paper; Y.C. helped to design experiments and check experimental data; Y.L. and Z.M. helped in paper preparation and paper draft checking; X.Z. helped in the DFT calculations.

Funding

This work was supported by the National Nature Science Foundation of China (grant number 51574240), the National Nature Science Foundation of China (grant number U1704252), and the Natural Science Foundation of Jiangsu Province (grant number BK20150192).

Conflicts of Interest

The authors declare no conflict of interest.

References

  1. Martínez-Luévanos, A.; Uribesalas, A.; López-Valdivieso, A. Mechanism of adsorption of sodium dodecylsulfonate on celestite and calcite. Miner. Eng. 1999, 12, 919–936. [Google Scholar] [CrossRef]
  2. Martinez, A.L.; Uribe, A.S. Interfacial properties of celestite and strontianite in aqueous solutions. Miner. Eng. 1995, 8, 1009–1022. [Google Scholar] [CrossRef]
  3. López-Valdivieso, A.; Robledo-Cabrera, A.; Uribe-Salas, A. Flotation of celestite with the anionic collector sodium dodecyl sulfate. Effect of carbonate ions. Int. J. Miner. Process. 2000, 60, 79–90. [Google Scholar] [CrossRef]
  4. Hernáinz Bermúdez De Castro, F.; Calero De Hoces, M. Flotation rate of celestite and calcite. Chem. Eng. Sci. 1996, 51, 119–125. [Google Scholar] [CrossRef]
  5. Hernáinz Bermúdez De Castro, F.; Gálvez Borrego, A. The influence of temperature during flotation of celestite and calcite with sodium oleate and quebracho. Int. J. Miner. Process. 1996, 46, 35–52. [Google Scholar] [CrossRef]
  6. Deng, J.S.; Wen, S.M.; Liu, J.; Xian, Y.J.; Wu, D.D.; Bai, S.J. New source of unavoidable ions in bornite Flotation Aqueous Solution: Fluid Inclusions. Ind. Eng. Chem. Res. 2013, 52, 4895–4901. [Google Scholar] [CrossRef]
  7. Deng, R.D.; Hu, Y.; Ku, J.G.; Ma, Y.Q.; Yang, Z.G. Ion migration law in flotation pulp and its influence on the separation of smithsonite and quartz. Sep. Sci. Technol. 2017, 53, 1–9. [Google Scholar]
  8. Shin-Nosuke, S.N.; Tanaka, T.; Yamamoto, K. Crystal structure control of the dissolution of rare earth elements in water-mineral interactions. Geochem. J. 2007, 40, 437. [Google Scholar] [CrossRef]
  9. Deng, J.S.; Wen, S.M.; Xian, Y.J.; Liu, J.; Bai, S.J. New discovery of unavoidable ions source in chalcopyrite flotation pulp: Fluid inclusions. Miner. Eng. 2013, 42, 22–28. [Google Scholar] [CrossRef]
  10. Liu, J.; Wen, S.M.; Wu, D.D.; Bai, S.J.; Liu, D. Determination of the concentrations of calcium and magnesium released from fluid inclusions of sphalerite and quartz. Miner. Eng. 2013, 45, 41–43. [Google Scholar] [CrossRef]
  11. Deng, R.D.; Hu, Y.; Ku, J.G.; Zuo, W.R.; Yang, Z.G. Adsorption of Fe(III) on smithsonite surfaces and implications for flotation. Colloid. Surf. A. 2017, 533, 308–315. [Google Scholar] [CrossRef]
  12. Shi, H.L.; Zhu, W.L. Influence and corresponding mechanism of Fe3+ on spodumene flotation. Rare Met. Cem. Carbides 2015, 43, 5–9. (In Chinese) [Google Scholar]
  13. Jiang, C.L.; Wang, X.H.; Parekh, B.K.; Leonard, J.W. The surface and solution chemistry of pyrite flotation with xanthate in the presence of iron ions. Colloid. Surf. A 1998, 136, 51–62. [Google Scholar] [CrossRef]
  14. Cui, M.M. The Influence and Its Elimination of Unavoidable Ions in the Flotation Separation of Smithsonite and Quartz. Master’s Thesis, Central South University, Changsha, China, 2012. [Google Scholar] [CrossRef]
  15. Malati, M.A.; Estefan, S.F. Activation of quartz by alkaline earth cations in oleate flotation. J. Chem. Technol. Biot. 2010, 17, 209–212. [Google Scholar] [CrossRef]
  16. Mackenzie, J.M.W. Zeta potential of quartz in the presence of ferric iron. Trans. AIME 1966, 235, 82. [Google Scholar]
  17. Wang, D.Z.; Hu, Y.H. Flotation Solution Chemistry; Hunan Science and Technology Press: Changsha, China, 1988. (In Chinese) [Google Scholar]
  18. Zhu, Y.S.; Zhu, J.G. Chemical Principles of Flotation Reagents, Revised edition; Central South University of Technology Press: Changsha, China, 1996. (In Chinese) [Google Scholar]
  19. Li, F.D. Celestite-the primary strontium mineral. Chem. Min. Technol. 1984, 3, 39–40. (In Chinese) [Google Scholar]
  20. Tang, D.K.; Shen, J.P. Mineral processing technology of celestite. Chem. Min. Technol. 1988, 1, 24–26. (In Chinese) [Google Scholar]
  21. Langmuir, I. The adsorption of gases on plane surfaces of glass, mica and platinum. J. Am. Chem. Soc. 1918, 40, 1361–1403. [Google Scholar] [CrossRef]
  22. Freundlich, H. Uber die adsorption in lunsungen. J. Phys. Chem. 1915, 57, 387. [Google Scholar]
  23. Johnson, R.D.; Arnold, F.H. The Temkin Isotherm Describes Heterogeneous Protein Adsorption. Biochim. Biophys. Acta 1995, 1247, 293. [Google Scholar] [CrossRef]
  24. Cao, S.M.; Cao, Y.J.; Ma, Z.L.; Liao, Y.F. Metal Ion Release in Bastnaesite Flotation System and Implications for Flotation. Minerals 2018, 8, 203. [Google Scholar] [CrossRef]
  25. Welham, N.J.; Llewellyn, D.J. Mechanical enhancement of the dissolution of ilmenite. Miner. Eng. 1998, 11, 827–841. [Google Scholar] [CrossRef]
  26. Guy, P.; Trahar, W. The influence of grinding and flotation environments on the laboratory batch flotation of galena. Int. J. Miner. Process. 1984, 12, 15–38. [Google Scholar] [CrossRef]
  27. Jones, R.O.; Gunnarsson, O. The density functional formalism, its applications and prospects. Rev. Mod. Phys. 1989, 61, 689–746. [Google Scholar] [CrossRef]
  28. Mulliken, R.S. Electronic Population Analysis on LCAO-MO Molecular Wave Functions. IV. Bonding and Antibonding in LCAO and Valence-Bond Theories. J. Chem. Phys. 1955, 23, 2343. [Google Scholar] [CrossRef]
  29. Gao, Z.Y.; Sun, W.; Hu, Y.H. Mineral cleavage nature and surface energy: Anisotropic surface broken bonds consideration. T. Nonferr. Metal. Soc. 2014, 24, 2930–2937. [Google Scholar] [CrossRef]
  30. Wang, P. Systematic Mineralogy; Geological Publishing House: Beijing, China, 1982. (In Chinese) [Google Scholar]
  31. Sposito, G.S. Molecular models of iron adsorption on mineral surfaces. Rev. Mineral. Geochem. 1990, 23, 261–279. [Google Scholar]
  32. Parks, G.A. Surface Energy and Adsorption at Mineral/Water Interfaces: An Introduction. Rev. Miner. 1990, 23, 133–175. [Google Scholar]
  33. Cappellen, P.V.; Charlet, L.; Stumm, W.; Wersin, P. A surface complexation model of the carbonate mineral-aqueous solution interface. Geochim. Cosmochim. Acta 1993, 57, 3505–3518. [Google Scholar] [CrossRef]
  34. Oelhafen, P. Practical surface analysis by auger and X-ray photoelectron spectroscopy. J. Electron. Spectrosc. 1984, 34, 203. [Google Scholar] [CrossRef]
  35. Vasquez, R.P. X-ray photoelectron spectroscopy study of Sr and Ba compounds. J. Electron Spectrosc. Relat. Phenom. 1991, 56, 217–240. [Google Scholar] [CrossRef]
  36. Yu, Y.; Song, L.; Zhou, S.Z.; Sun, C.Y. Influence of multivalent metal ions on the flotation of calcium salt mineral. Ind. Miner. Proc. 2015, 9, 9–13. (In Chinese) [Google Scholar]
  37. Moulder, J.; Stickle, W.F.; Sobol, P.E.; Bomben, K.D. Handbook of X-ray Photoelectron Spectroscopy: A Reference Book of Standard Spectra for Identification and Interpretation of XPS Data; Perkin-Elmer Corporation, Physical Electronics Division: Eden Prairie, MN, USA, 1992; ISBN 0-9627026-2-5. [Google Scholar]
  38. Feng, Q.C.; Zhao, W.J.; Wen, S.M.; Cao, Q.B. Activation mechanism of lead ions in cassiterite flotation with salicylhydroxamic acid as collector. Sep. Purif. Technol. 2017, 178, 193–199. [Google Scholar] [CrossRef]
  39. Lu, S.S. Research of Crystal Chemistry on Flotation of Several Sulfate Minerals. Ph.D. Thesis, Northeastern University, Shenyang, China, 2008. [Google Scholar]
  40. Carter, M.C.; Kilduff, J.E.; Weber, W.J. Site energy distribution analysis of preloaded adsorbents. Environ. Sci. Technol. 1995, 29, 1773. [Google Scholar] [CrossRef] [PubMed]
  41. Li, G.X. Adsorption Science, 2nd ed.; Chemical Industry Press: Beijing, China, 2008. [Google Scholar]
  42. Jia, M.X. Surface Structure Study of Silicate Minerals and Its Adsorption Mechanism for Metal Ions. Ph.D. Thesis, Northeastern University, Shenyang, China, 2001. (In Chinese). [Google Scholar]
  43. Zhou, D.H.; Li, X.Y.; Xu, F.L.; Dong, Y.Y. Adsorption characteristics of heavy metal ions onto soil in mass-action model. J. Environ. Sci. 1996, 4, 425–430. (In Chinese) [Google Scholar]
  44. Wu, H.H.; Wu, D.Q.; Peng, J.L. Experimental study of the reaction between metal ions and quartz surface. Geochemistry 1998, 6, 521–531. (In Chinese) [Google Scholar]
  45. Ou, L.M.; Ye, J.S.; Zeng, W.W.; Wan, L. Influence and Mechanism of Ferric and Ferrous Ions on Flotation of Smithsonite and Quartz. Nonferr. Metals. 2012, 6, 79–82. (In Chinese) [Google Scholar] [CrossRef]
  46. Zhang, G.F.; Zhu, Y.G.; Feng, Q.M.; Lu, Y.P.; Ou, L.M. Flotation mechanism of fine ilmenite by sodium oleate. Chin. J. Nonferr. Metal. 2009, 2, 372–377. (In Chinese) [Google Scholar]
  47. Bulatovic, S.M. Handbook of Flotation Reagents; Elsevier: Amsterdam, The Netherlands, 2007. [Google Scholar]
Figure 1. The X-ray diffraction (XRD) pattern of the celestite sample.
Minerals 09 00405 g001
Figure 2. Concentration of Fe released from limonite as a function of (a) dissolution time and (b) grinding time.
Minerals 09 00405 g002
Figure 3. (a) Electron density between S–O atoms, (b) electron density between Sr–O atoms.
Minerals 09 00405 g003
Figure 4. (a) {001} cleavage surface and (b) {210} cleavage surface of celestite (built in the Visualizer of Materials Studio Program 8.0). Green atoms are Sr atoms, yellow atoms are S atoms, and red atoms are O atoms.
Minerals 09 00405 g004
Figure 5. XPS survey spectra of (a) untreated celestite and (b) celestite treated with ferric ions.
Minerals 09 00405 g005
Figure 6. S 2p spectra of (a) untreated celestite and (b) celestite treated with ferric ions (The red lines are original curves and the green lines are background curves).
Minerals 09 00405 g006
Figure 7. O 1s spectra of (a) untreated celestite and (b) celestite treated with ferric ions (The red lines are original curves and the green lines are background curves).
Minerals 09 00405 g007
Figure 8. Distribution diagrams of ferric ions as a function of pH (Ferric ion: 5 × 10⁻⁵ mol/dm3).
Minerals 09 00405 g008
Figure 9. Sr 3d spectra of (a) untreated celestite and (b) celestite treated with ferric ions (The red lines are original curves and the green lines are background curves).
Minerals 09 00405 g009
Figure 10. Ferric ion adsorption of (a) Langmuir plots, (b) Freundlich plots and (c) Temkin plots (pH = 8).
Minerals 09 00405 g010
Figure 11. Flotation recovery of celestite as a function of pH, (ferric ion: 5 × 10⁻⁵ mol/dm3, NaOL: 5 × 10⁻⁵ mol/dm3).
Minerals 09 00405 g011
Figure 12. Species distribution diagram of sodium oleate as a function of pH, (NaOL: 5 × 10⁻⁵ mol/dm3).
Minerals 09 00405 g012
Figure 13. Flotation recovery of celestite as a function of NaOL concentration in the absence and presence of ferric ions, (ferric ion: 5 × 10⁻⁵ mol/dm3, pH = 8).
Minerals 09 00405 g013
Figure 14. (a) Sr 3d, (b) S 2p, and (c) O 1s spectra on celestite surface treated with ferric ions and NaOL, (ferric ion: 5 × 10⁻⁵ mol/dm3, NaOL: 5 × 10⁻⁵ mol/dm3) (The red lines are original curves and the green lines are background curves).
Minerals 09 00405 g014
Figure 15. Fe 2p spectra of (a) celestite treated with ferric ions and (b) celestite treated with ferric ions and NaOL, (ferric ion: 5 × 10⁻⁵ mol/dm3, NaOL: 5 × 10⁻⁵ mol/dm3).
Minerals 09 00405 g015
Figure 16. Schematic representation of the depression mechanism of ferric ion adsorption on celestite flotation.
Minerals 09 00405 g016
Table 1. Phase analysis results of iron.
PhaseMagnetiteIron Oxide (Limonite)Iron SulphideIron CarbonateIron SilicateTotal Iron Content
Percentage0.3733.370.210.680.4235.05
Distribution Rate1.0695.200.601.941.20100
Table 2. Mulliken bond population of celestite.
BondsPopulationLength (Å)
S–O10.591.48
S–O20.581.49
S–O30.541.50
Sr–O10.132.50
Sr–O20.102.63
Sr–O30.072.73
Table 3. Isotherm model constants for ferric ion adsorption onto celestite surface (T = 298 K).
ModelLangmuirFreundlichTemkin
ConstantsQ00.16kF0.03KT1.44
K10.29n1.83B0.10
R20.93R20.97R20.89
Table 4. Atomic concentrations of celestite samples before and after NaOL treatment.
AtomAtomic Concentration (%)
Before TreatmentAfter Treatment
Sr12.228.04
S19.3918.73
O62.6263.15
C5.7710.08

