Article

Optimization of Solids Concentration in Iron Ore Ball Milling through Modeling and Simulation

by
Patricia M. C. Faria
1,2,
Raj K. Rajamani
3 and
Luís M. Tavares
2,*
1
Department of Development Engineering, Vale S.A., Porto de Tubarão, Vitória-ES CEP 29090-900, Brazil
2
Department of Metallurgical and Materials Engineering, Universidade Federal do Rio de Janeiro—COPPE/UFRJ, Cx., CEP 21941-972, Rio de Janeiro 68505, Brazil
3
Department of Metallurgical Engineering, University of Utah, Salt Lake City, UT 84112, USA
*
Author to whom correspondence should be addressed.
Minerals 2019, 9(6), 366; https://doi.org/10.3390/min9060366
Submission received: 24 May 2019 / Revised: 12 June 2019 / Accepted: 13 June 2019 / Published: 18 June 2019
(This article belongs to the Section Mineral Processing and Extractive Metallurgy)

Abstract

:
Important advances have been made in the last 60 years or so in the modeling of ball mills using mathematical formulas and models. One approach that has gained popularity is the population balance model, in particular, when coupled to the specific breakage rate function. The paper demonstrates the application of this methodology to optimize solids concentration in ball milling of an iron ore from Brazil. The wet grinding experiments were conducted in bench (0.25 m diameter) and pilot-scale mills (0.42 m diameter), and surveys in a full-scale industrial (5.2 m diameter) mill. It is first demonstrated that the successful application of the model required recognizing the non-normalizable nature of the breakage function of the particular ore. It is then demonstrated how the model can be used to predict results of pilot-scale grinding tests under different conditions (overflow/grate discharge) based on data from batch grinding tests. Finally, the model is used to predict the effect of changing solids concentration inside the industrial mill, with good correspondence between the pilot plant and full-scale results, which demonstrated the benefit of reducing solids concentration to values between 76 and 80% in weight for the ore of interest from the 83% that was originally used in the operation.

1. Introduction

It has been well over half a century since Austin and Gardner [1], followed by Reid [2], applied the concept of first-order breakage kinetics to steady-state continuous grinding in a mill. The grinding mill was described as a perfect mixed reactor that transforms coarse particles into smaller ones, in such a way that the particles feeding the mill would be perceived as the reagent and the ground material the product.
Since then, several studies have been carried out in the development of detailed phenomenological grinding models that are derived from population balance considerations [3,4,5,6]. In these models, the explicit accounting of grinding sub processes (size reduction kinetics and progeny distribution, material transport in the mill, and size classification) makes them significantly advantageous over the simpler energy-size reduction equations. This type of model, in its complete form, is capable of describing the size distribution in tumbling mill grinding as a function of time in batch grinding or continuous milling, since it takes the breakage mechanisms that occur inside the size reduction machine into account. As such, according to this methodology, the plant scale mill can be optimized via laboratory-scale grinding mill tests. Under these circumstances, the population balance model (PBM) of ball milling became a very useful tool for both the design and optimization of the tumbling mills.
In fact, several investigators have presented convincing cases for the appropriateness of population balance models for use in scale-up and the optimization of ball mills [7,8,9,10,11,12,13,14]. In most cases, the results confirmed the validity of the linear population balance model for dry grinding and the specific power correlation that was previously observed by Herbst and Fuerstenau [15]. Generally, the breakage function has been found to be invariant over the range of operating variables for different mill sizes and the specific breakage rate function has been found to be independent of the operating conditions and mill design variables. On the other hand, wet grinding is inherently nonlinear, unlike dry grinding, so that the spatial distribution of material in the mill plays an important role [9]. Apparently, in wet grinding systems, the fine particles tend to suspend in the water, while the coarse particles are settled in the ball mass, resulting in an increased probability of breakage of the coarse particles [16,17]. This phenomenon, termed as “preferential breakage”, implies that, as the grind is extended, more and more fine particles are produced, resulting in the increased rate of breakage of coarse particles, while the rate of breakage of fine particles decreases. It demonstrates that the breakage and specific selection (breakage rate) functions generally are a function of the size distribution existing within the mill, as well as of the operating conditions.
The variable that can be more readily controlled in a wet ball mill in operation in industry is solids concentration, with selected studies having been conducted for iron ores. Martinovic et al. [18] measured the breakage rates at solids concentrations between 72 to 82% for an iron ore and found that the increase in solids concentration led to an increase in the slope of the breakage rate function, with higher rates for the coarse material and lower for the fine. Samskog et al. [19] also studied this effect while using pebbles as grinding media for solids concentrations ranging from 65 to 75%, also showing that higher concentrations led to higher rates of breakage of the coarse material.
The present work analyzes comminution of a Brazilian iron ore with unusual breakage behavior in batch and pilot-scale tests, as well as in an industrial mill, which demonstrated the application of the scale-up approach in optimizing the full-scale mill when operating at different slurry concentrations.

2. Mathematical Background

The phenomenological model that was chosen by Herbst and Fuerstenau [3] to represent tumbling mill behavior is a deterministic model (as opposed to a stochastic), which is formulated in terms of a continuous time variable and a discretized size variable. The development of the PBM when considering this approach is briefly described, as follows.
Consider the mass of material in a ball mill to be divided into n narrow size intervals with maximum size x1 and minimum size xn+1.The ith size interval, bound by xi above and xi+1 below, contains a mass fraction of material mi(t) at time t. A differential mass balance for the ith size interval yields the kinetic model [9]:
d [ H   m i ( t ) ] d t = S i ( t ) H   m i ( t )   +   j = 1 i 1 b ij S j ( t ) H   m j ( t )
where: mi(t) is the mass fraction of the material in the ith size interval at any time t, H is the total mass of material to be ground, which is also known as hold-up, Si(t) is the size discretized selection function for each ith size interval that denotes the fractional rate at which the material is broken out of the ith interval, bij is the size discretized breakage distribution function that represents the fraction of primary breakage fragments of material from the jth size interval, which appear in the ith size interval due to breakage [9].
The distinct advantage of Equation (1) is that the parameters Si(t) and bij can be directly obtained from single size fraction experimental data while using the simple graphical procedures [3,20,21]. Further, when the selection functions are environment and time independent, Equation (1) is linear with constant coefficients and it admits an analytical solution for batch grinding [3,9]. The estimation of both the selection and breakage function parameters of a linear model is made possible by a combination of an efficient modified Gauss-Newton non-linear regression routine and a reduced parameter set that was obtained from flexible functional forms for selection and breakage functions [5]. The extension of this model to the description of continuous grinding using residence time distribution information is straightforward for the linear case.
Various attempts have been made to correlate kinetic parameters to mill dimensions, mill speed, ball load, ball density, ball diameter, and hold-up mass of material, since population balance models are phenomenological in nature [6,9,14]. According to the findings first reported by Herbst and Fuerstenau [15], the Si is, to a good approximation, proportional to the specific power input to the mill (P/H):
S i E = S i H P
where SiE, termed the specific selection function for the ith size interval, is considered to be independent of mill design and operating conditions [9], H is the mill hold up, and P is the mill power. In addition, the breakage functions bij has been demonstrated to be, to a good approximation, invariant with respect to design and operating variables over a wide range of conditions [8], varying mostly as a function of ball size. Incorporating these findings into Equation (2) yields the energy normalized form of the batch grinding model:
d [   m i ( E ¯ ) ] d E ¯ = S i E   m i ( E ¯ )   +   j = 1 i 1 b ij S j E   m j ( E ¯ )
where E ¯ is the specific energy input to the mill and is equal to the product of specific power, P/H, and grind time, t. The implication of such a formulation is that the evolution of particle size distribution only depends on the specific energy input to the mill. In this sense, Equation (3) and its solution represents a detailed energy-size distribution model that has proven to be very useful for scale-up design [9].
To simplify the task of estimating these kinetic parameters (SiE and bij) from experimental data, a log-polynomial of adjustable order is frequently used to represent the size dependence of the specific selection function [5]:
S i E = S 1 E exp ( j J ζ j [ ln ( x i x i + 1 x 1 x 2 ) ] j ) j = 1 ,   2 ,   3   etc
where S1E is the feed size specific selection function determined from a feed disappearance plot, and ζj are the fitting parameters.
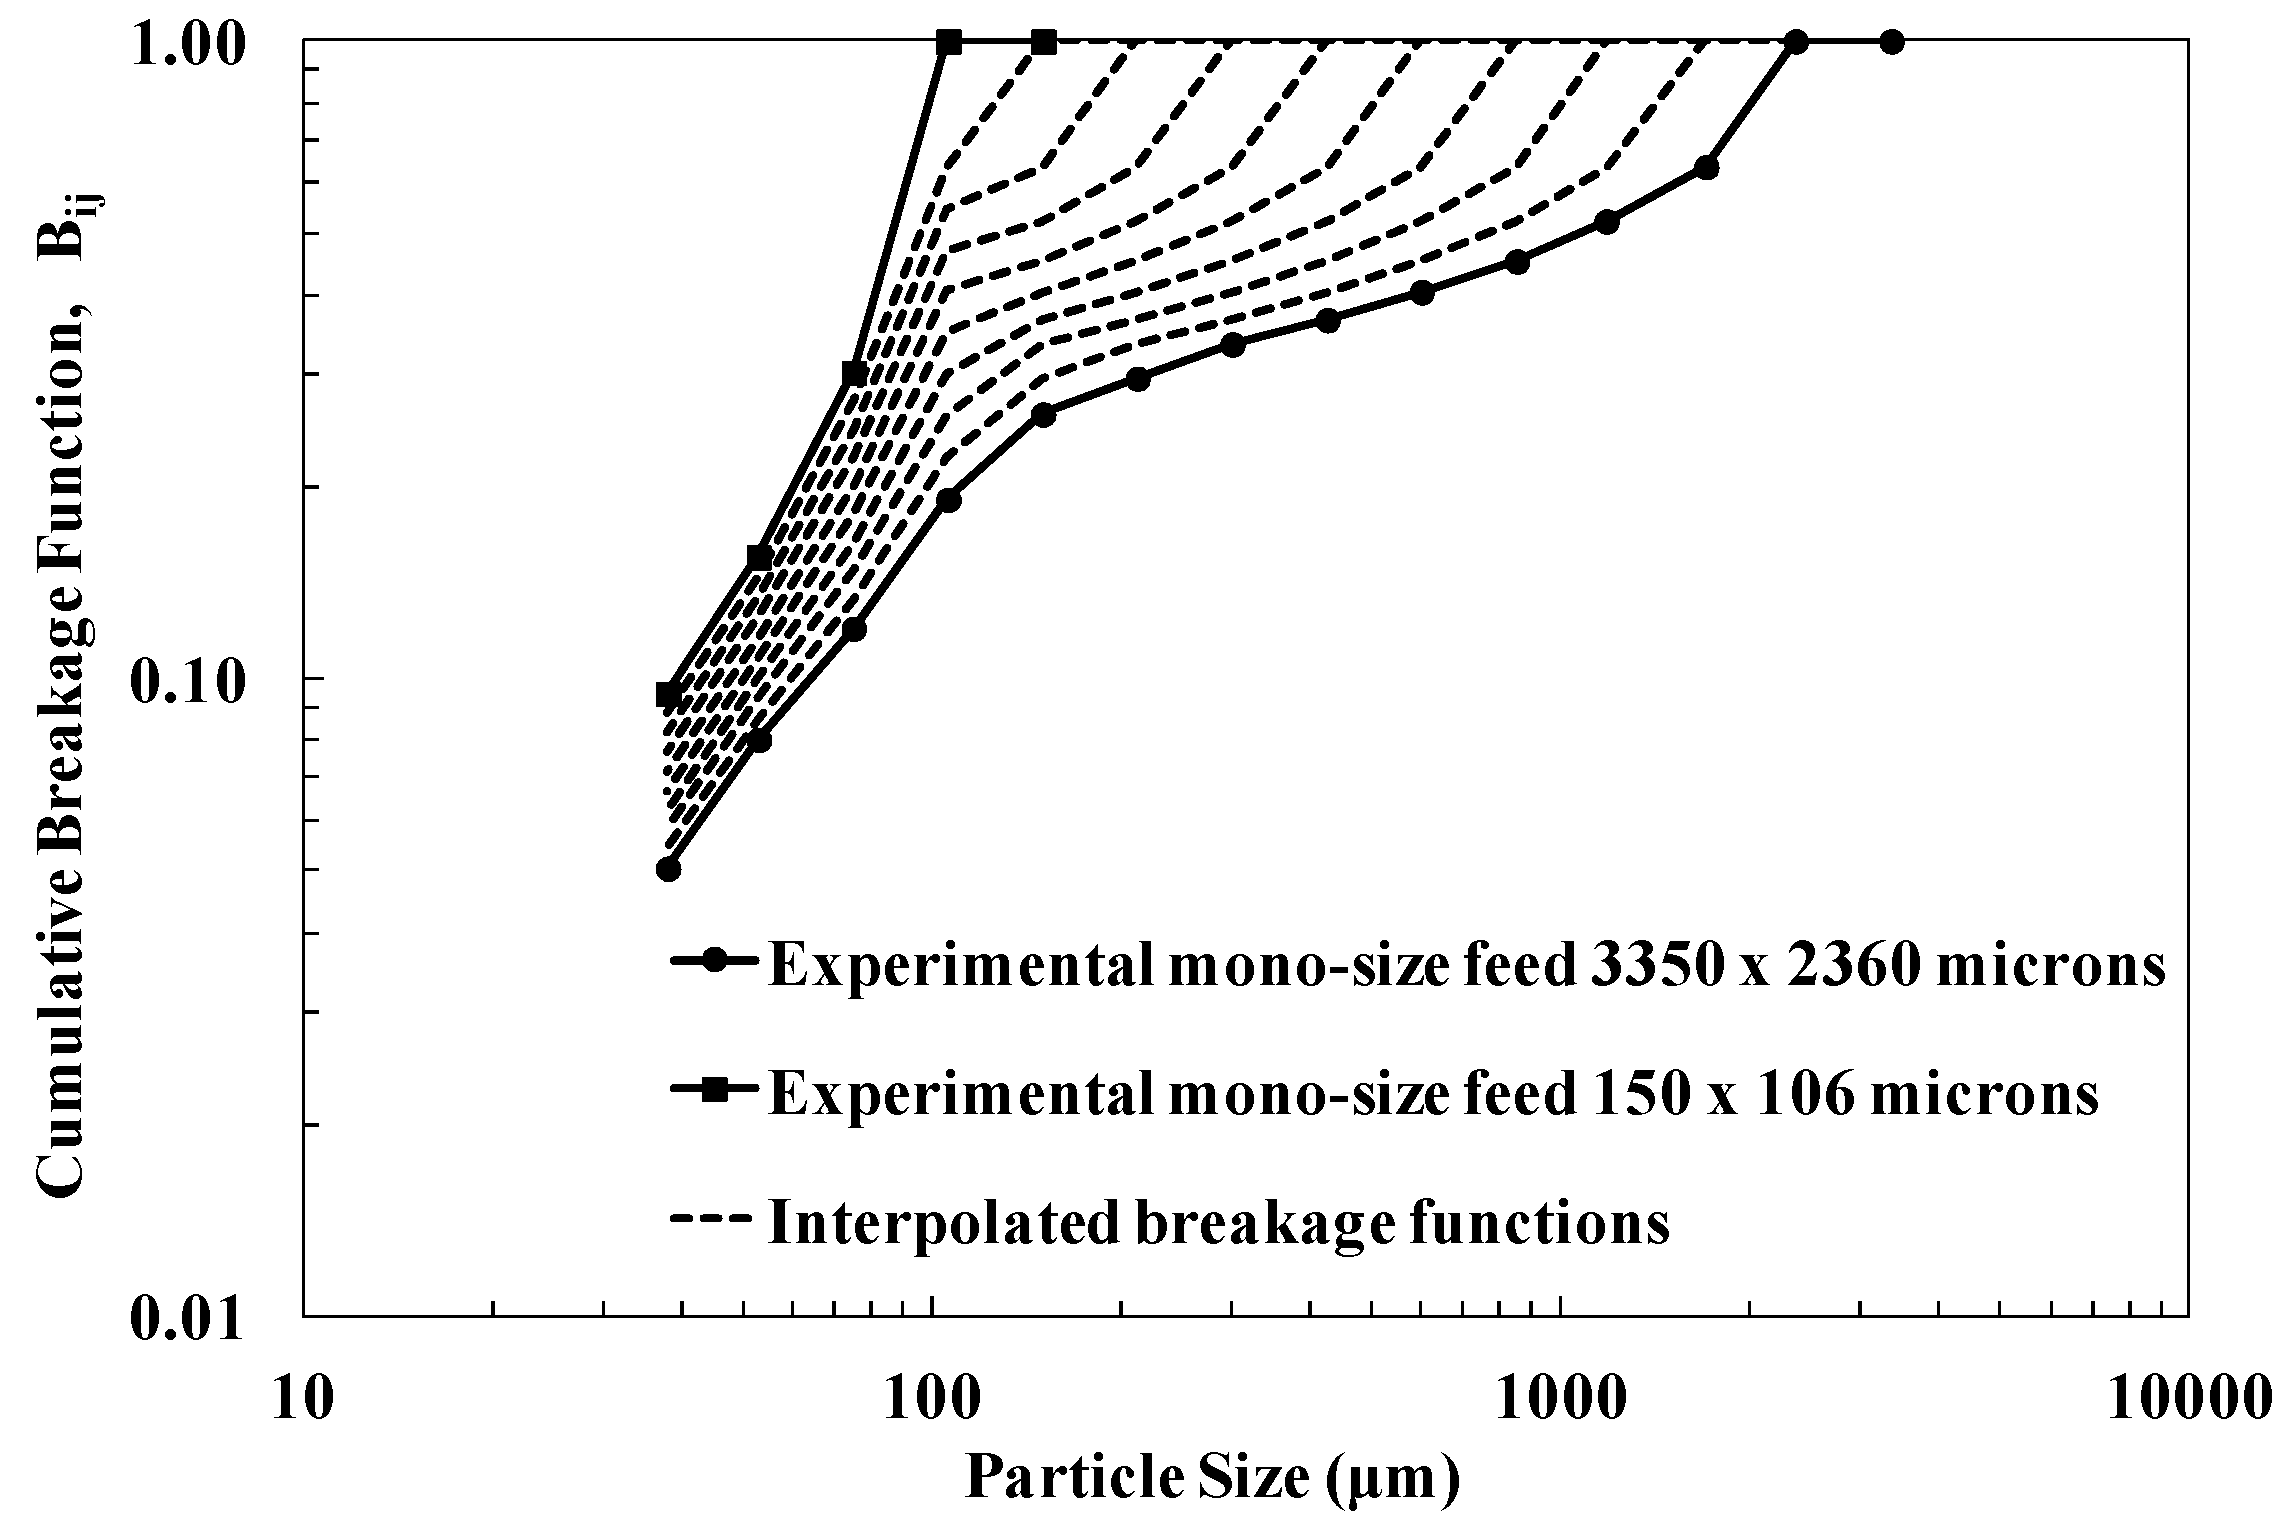
To represent the cumulative breakage function, three parameters (α1, α2, and α3) in the functional form are normally used ( B i j = k = i n b k j ) :
B i j = α 1 ( x i / x j + 1 ) α 2 + ( 1 α 1 ) ( x i / x j + 1 ) α 3
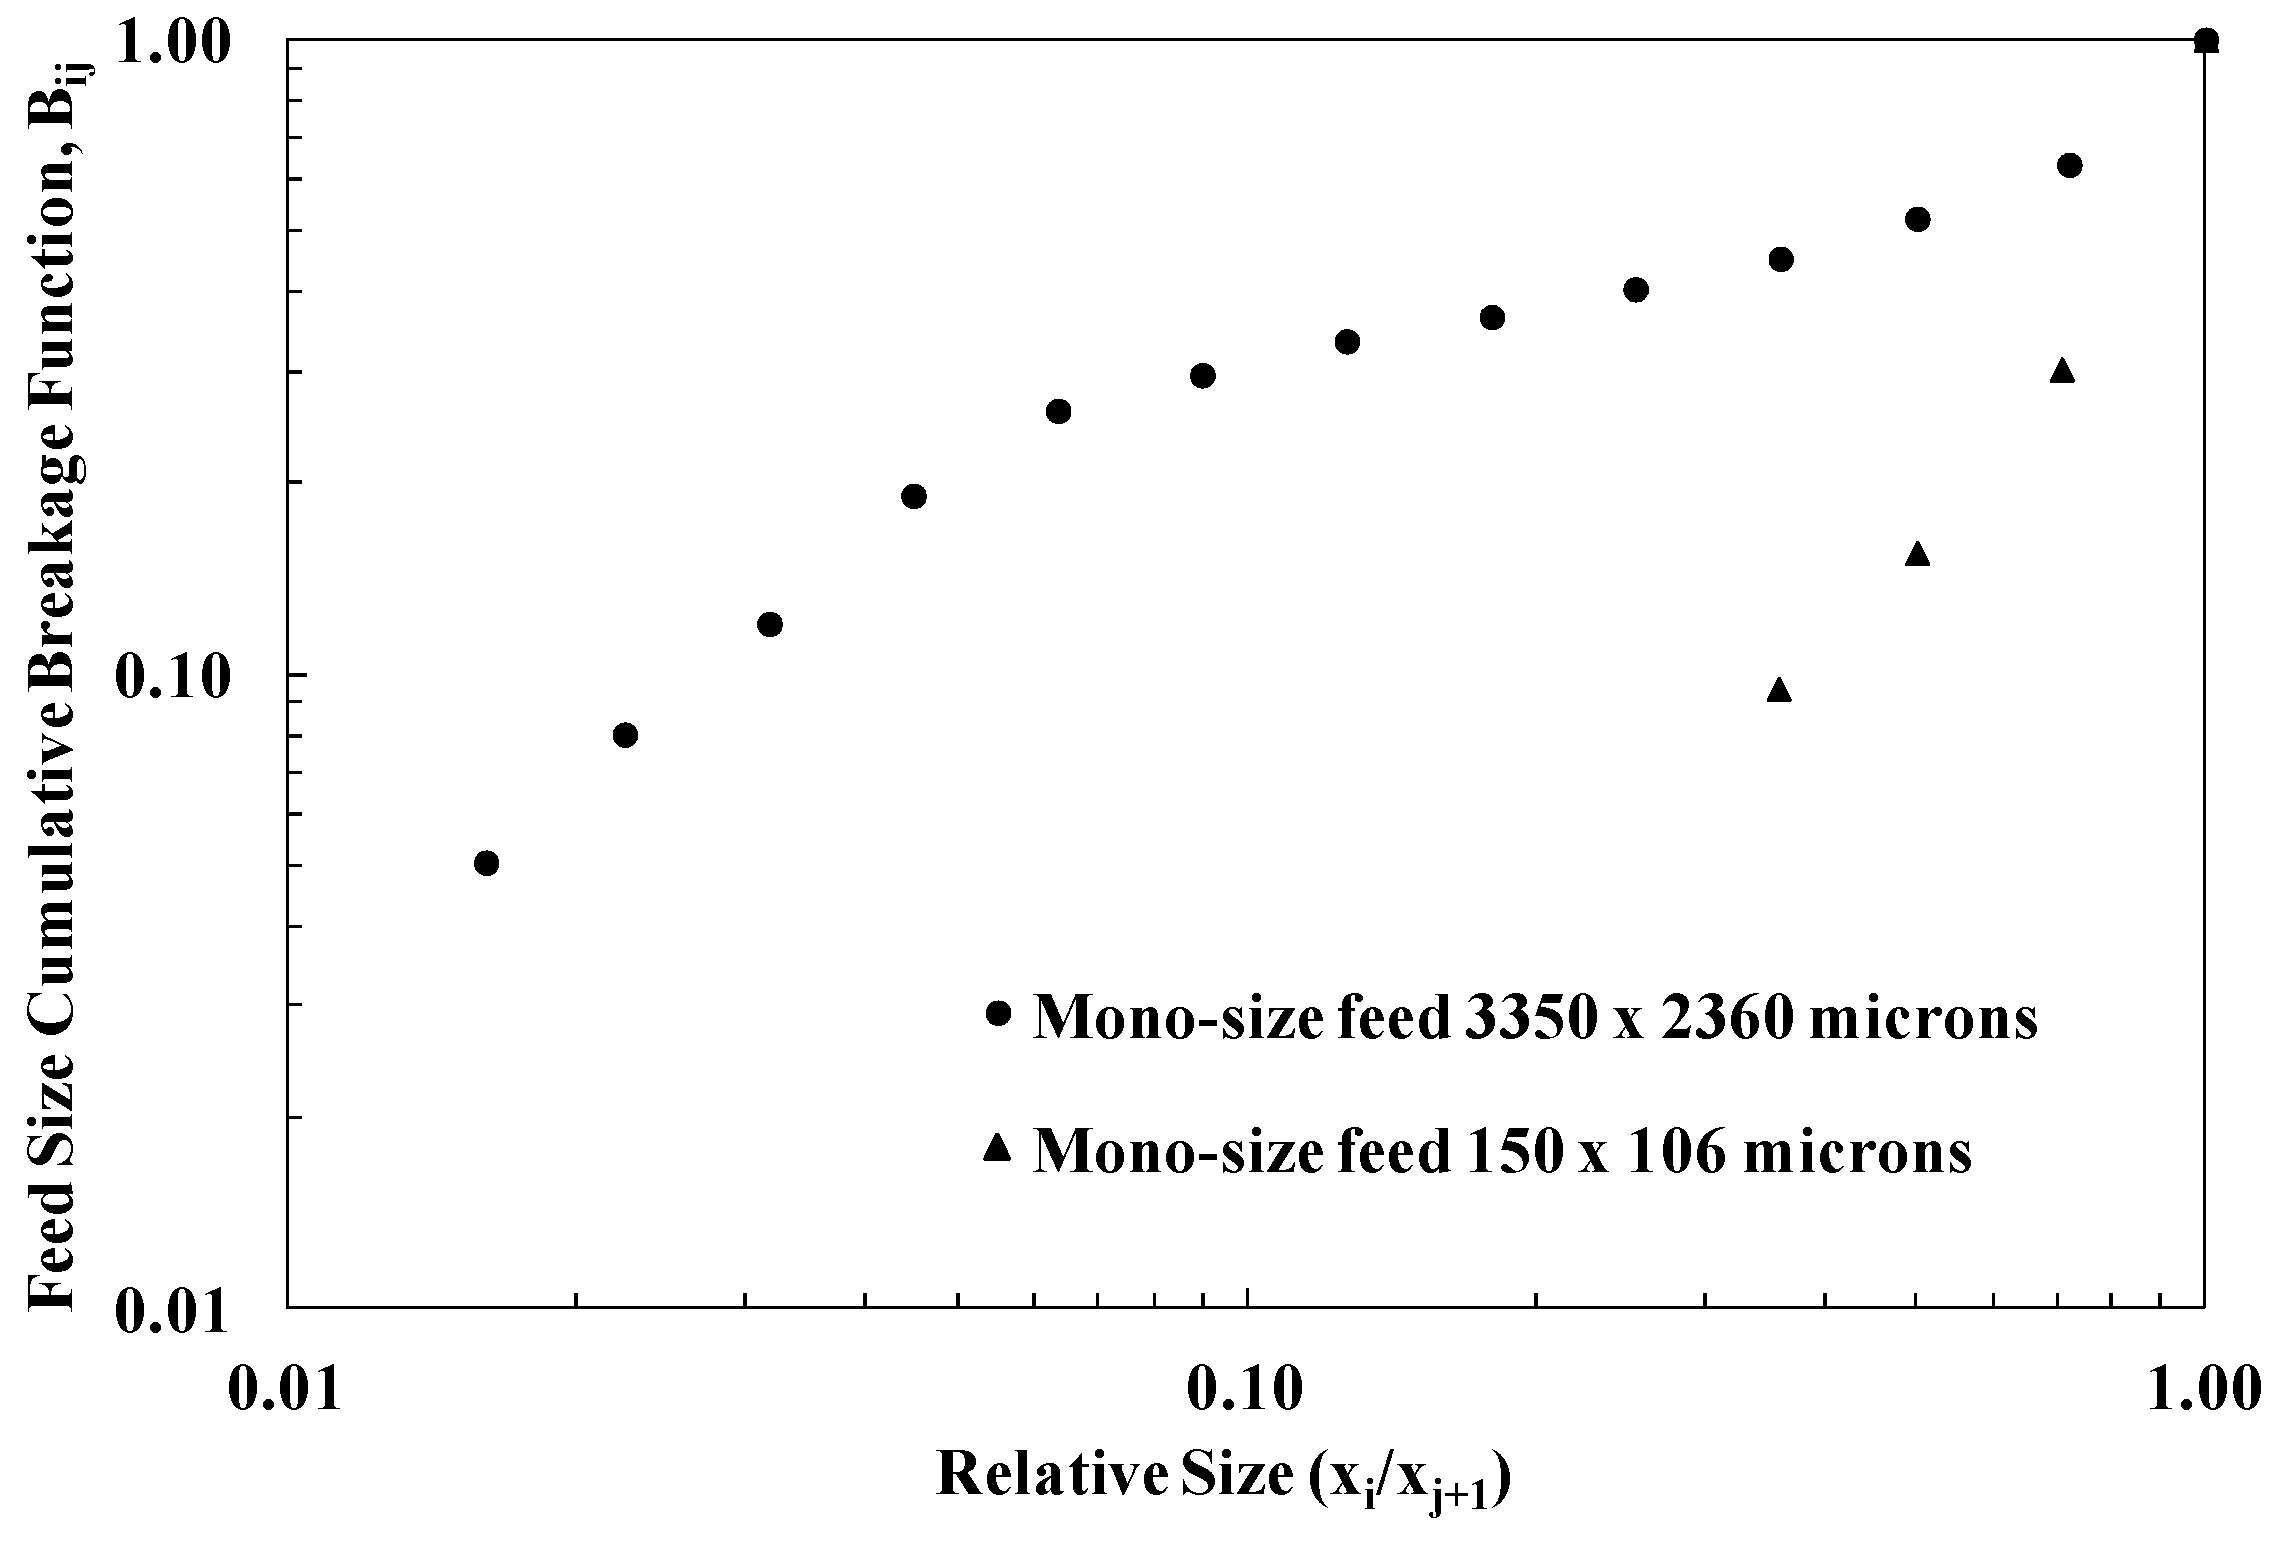
Equation (5) implies that the breakage distribution is a function of the ratio of daughter fragment size to parent particle size only and it does not depend on the absolute size of the parent particle. This assumption, which is known as normalizability condition, has been confirmed to be valid for several types of ores [11].
The model given by Equation (3) can be extended to continuous grinding. In this case, a description of a continuous tumbling mill requires not only a description of the breakage kinetics, but also a mathematical description of material transport through the mill:
m i , M P = 0 m i , B A T C H ( t ) E ( t ) d t
where the continuous response, mi,MP, is considered to be an average of batch responses, mi,BATCH(t), weighted according to the amount of material that resides for various times in the mill, E(t)dt.
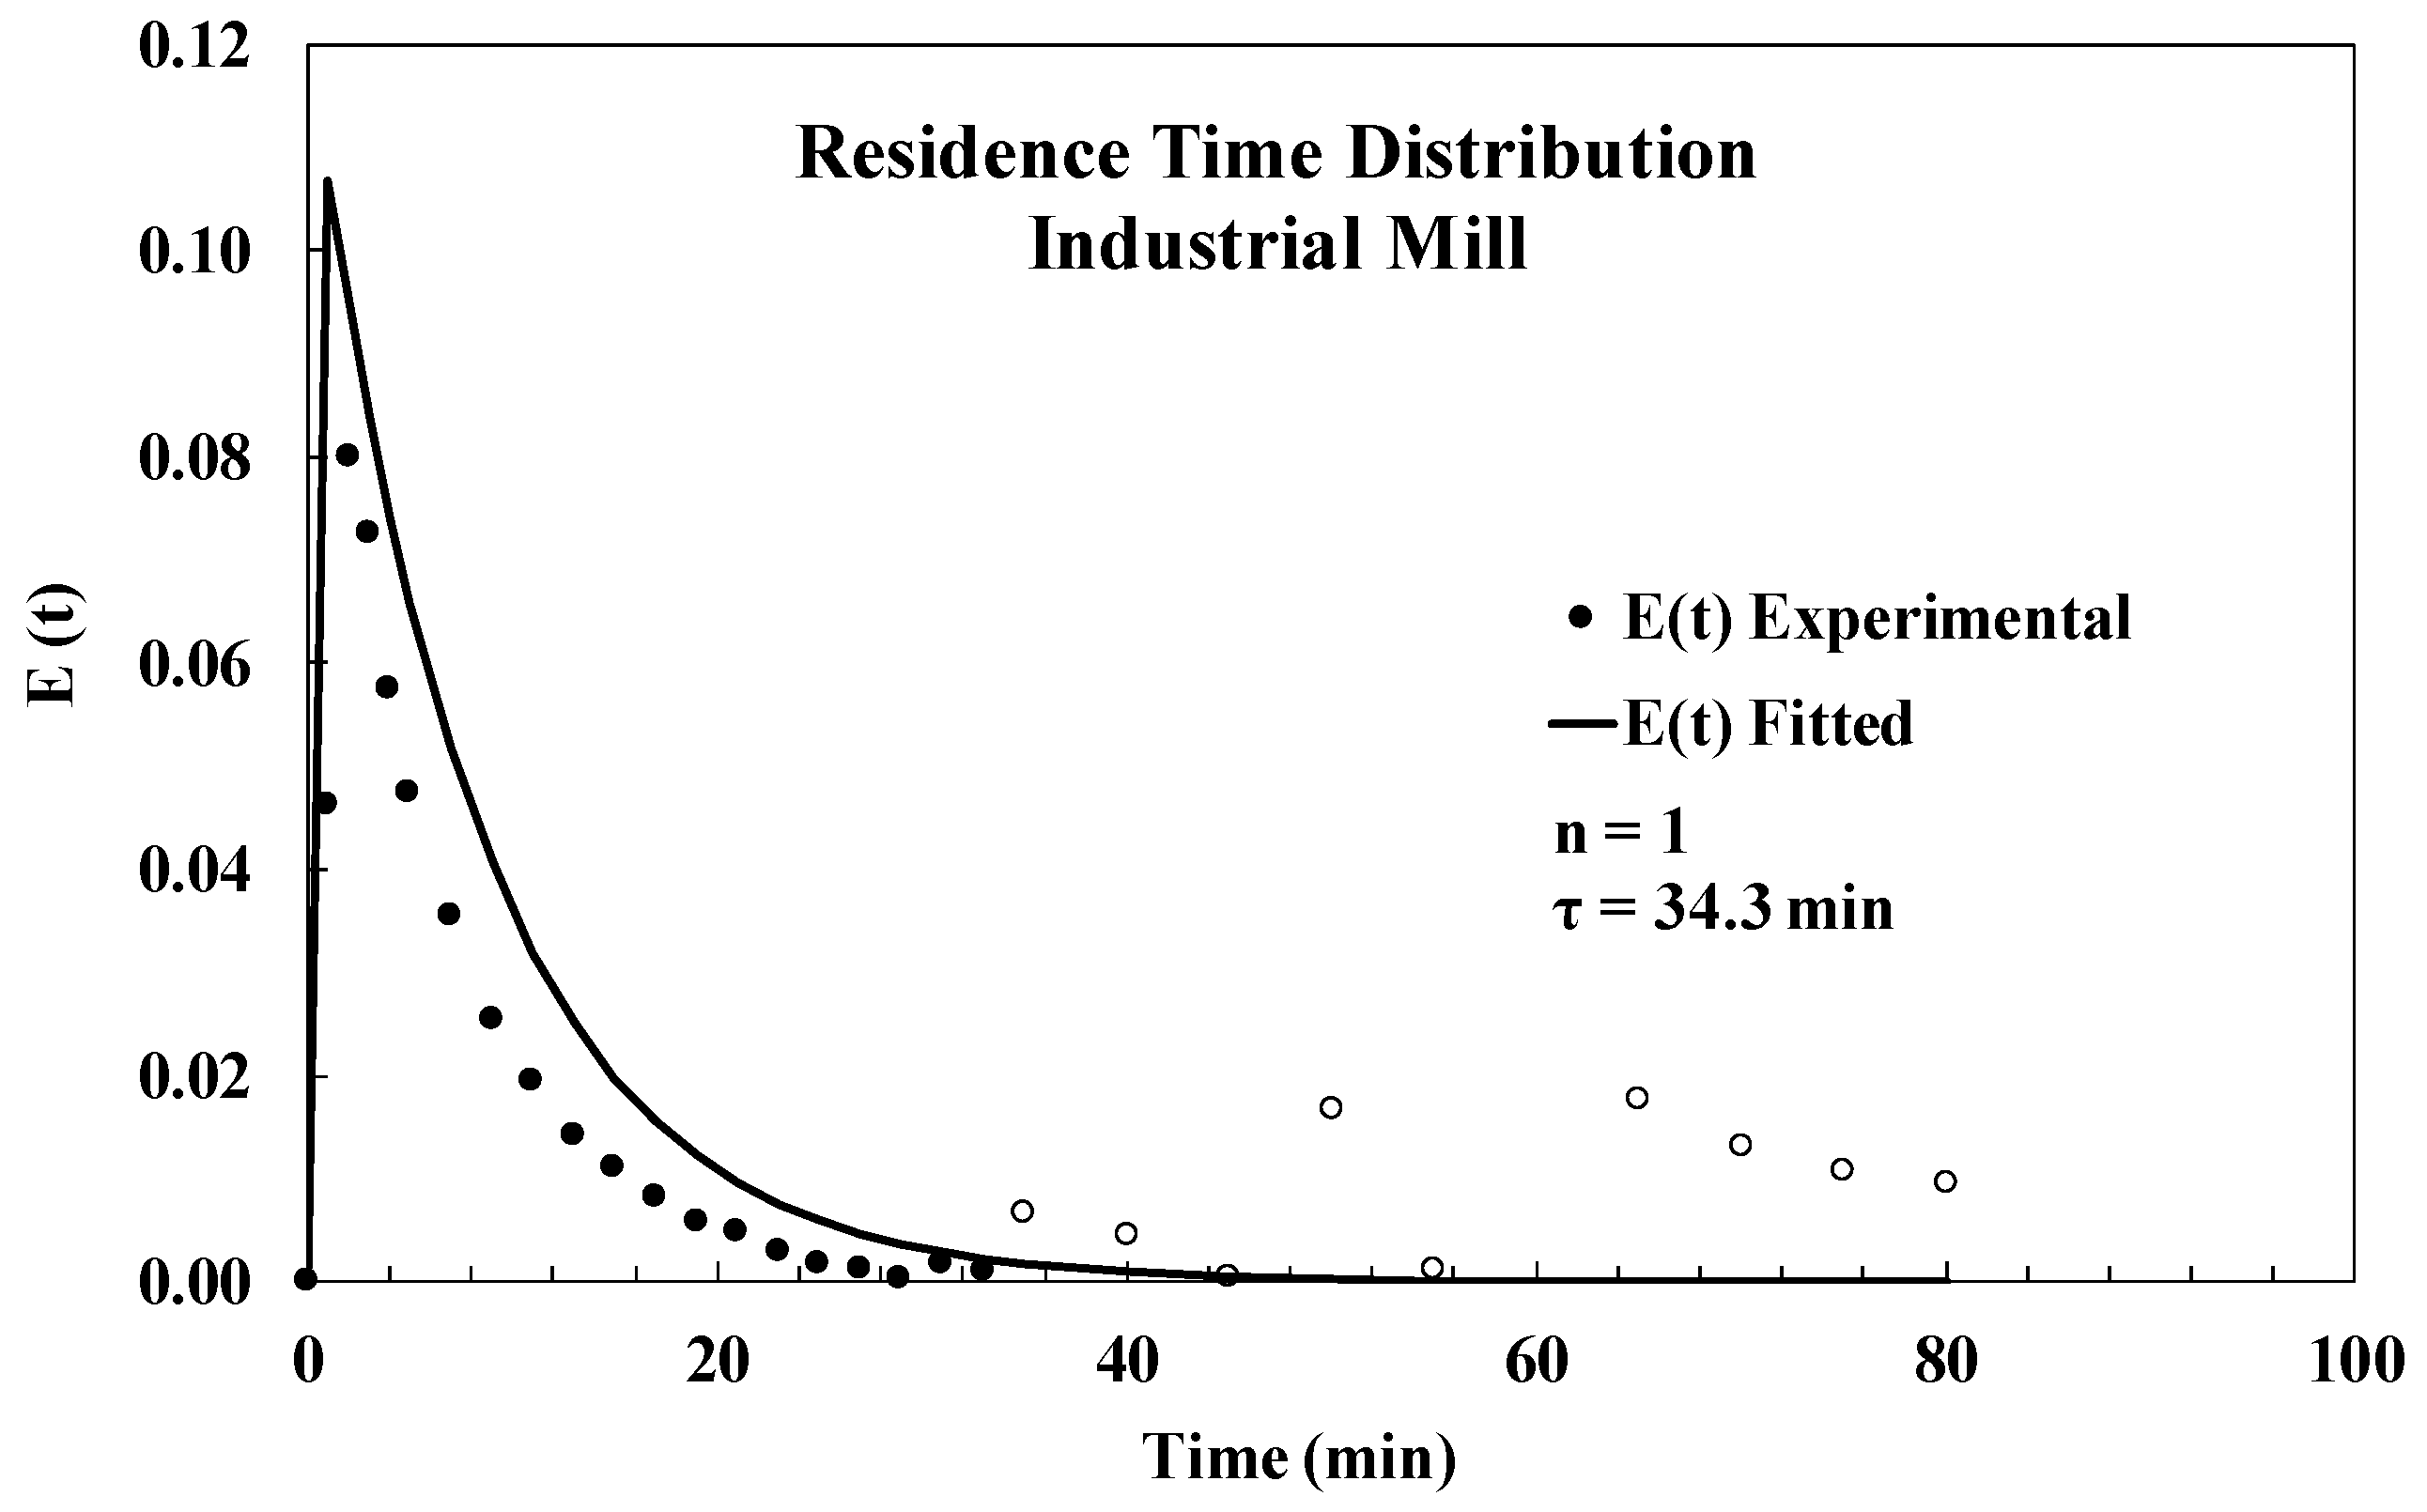
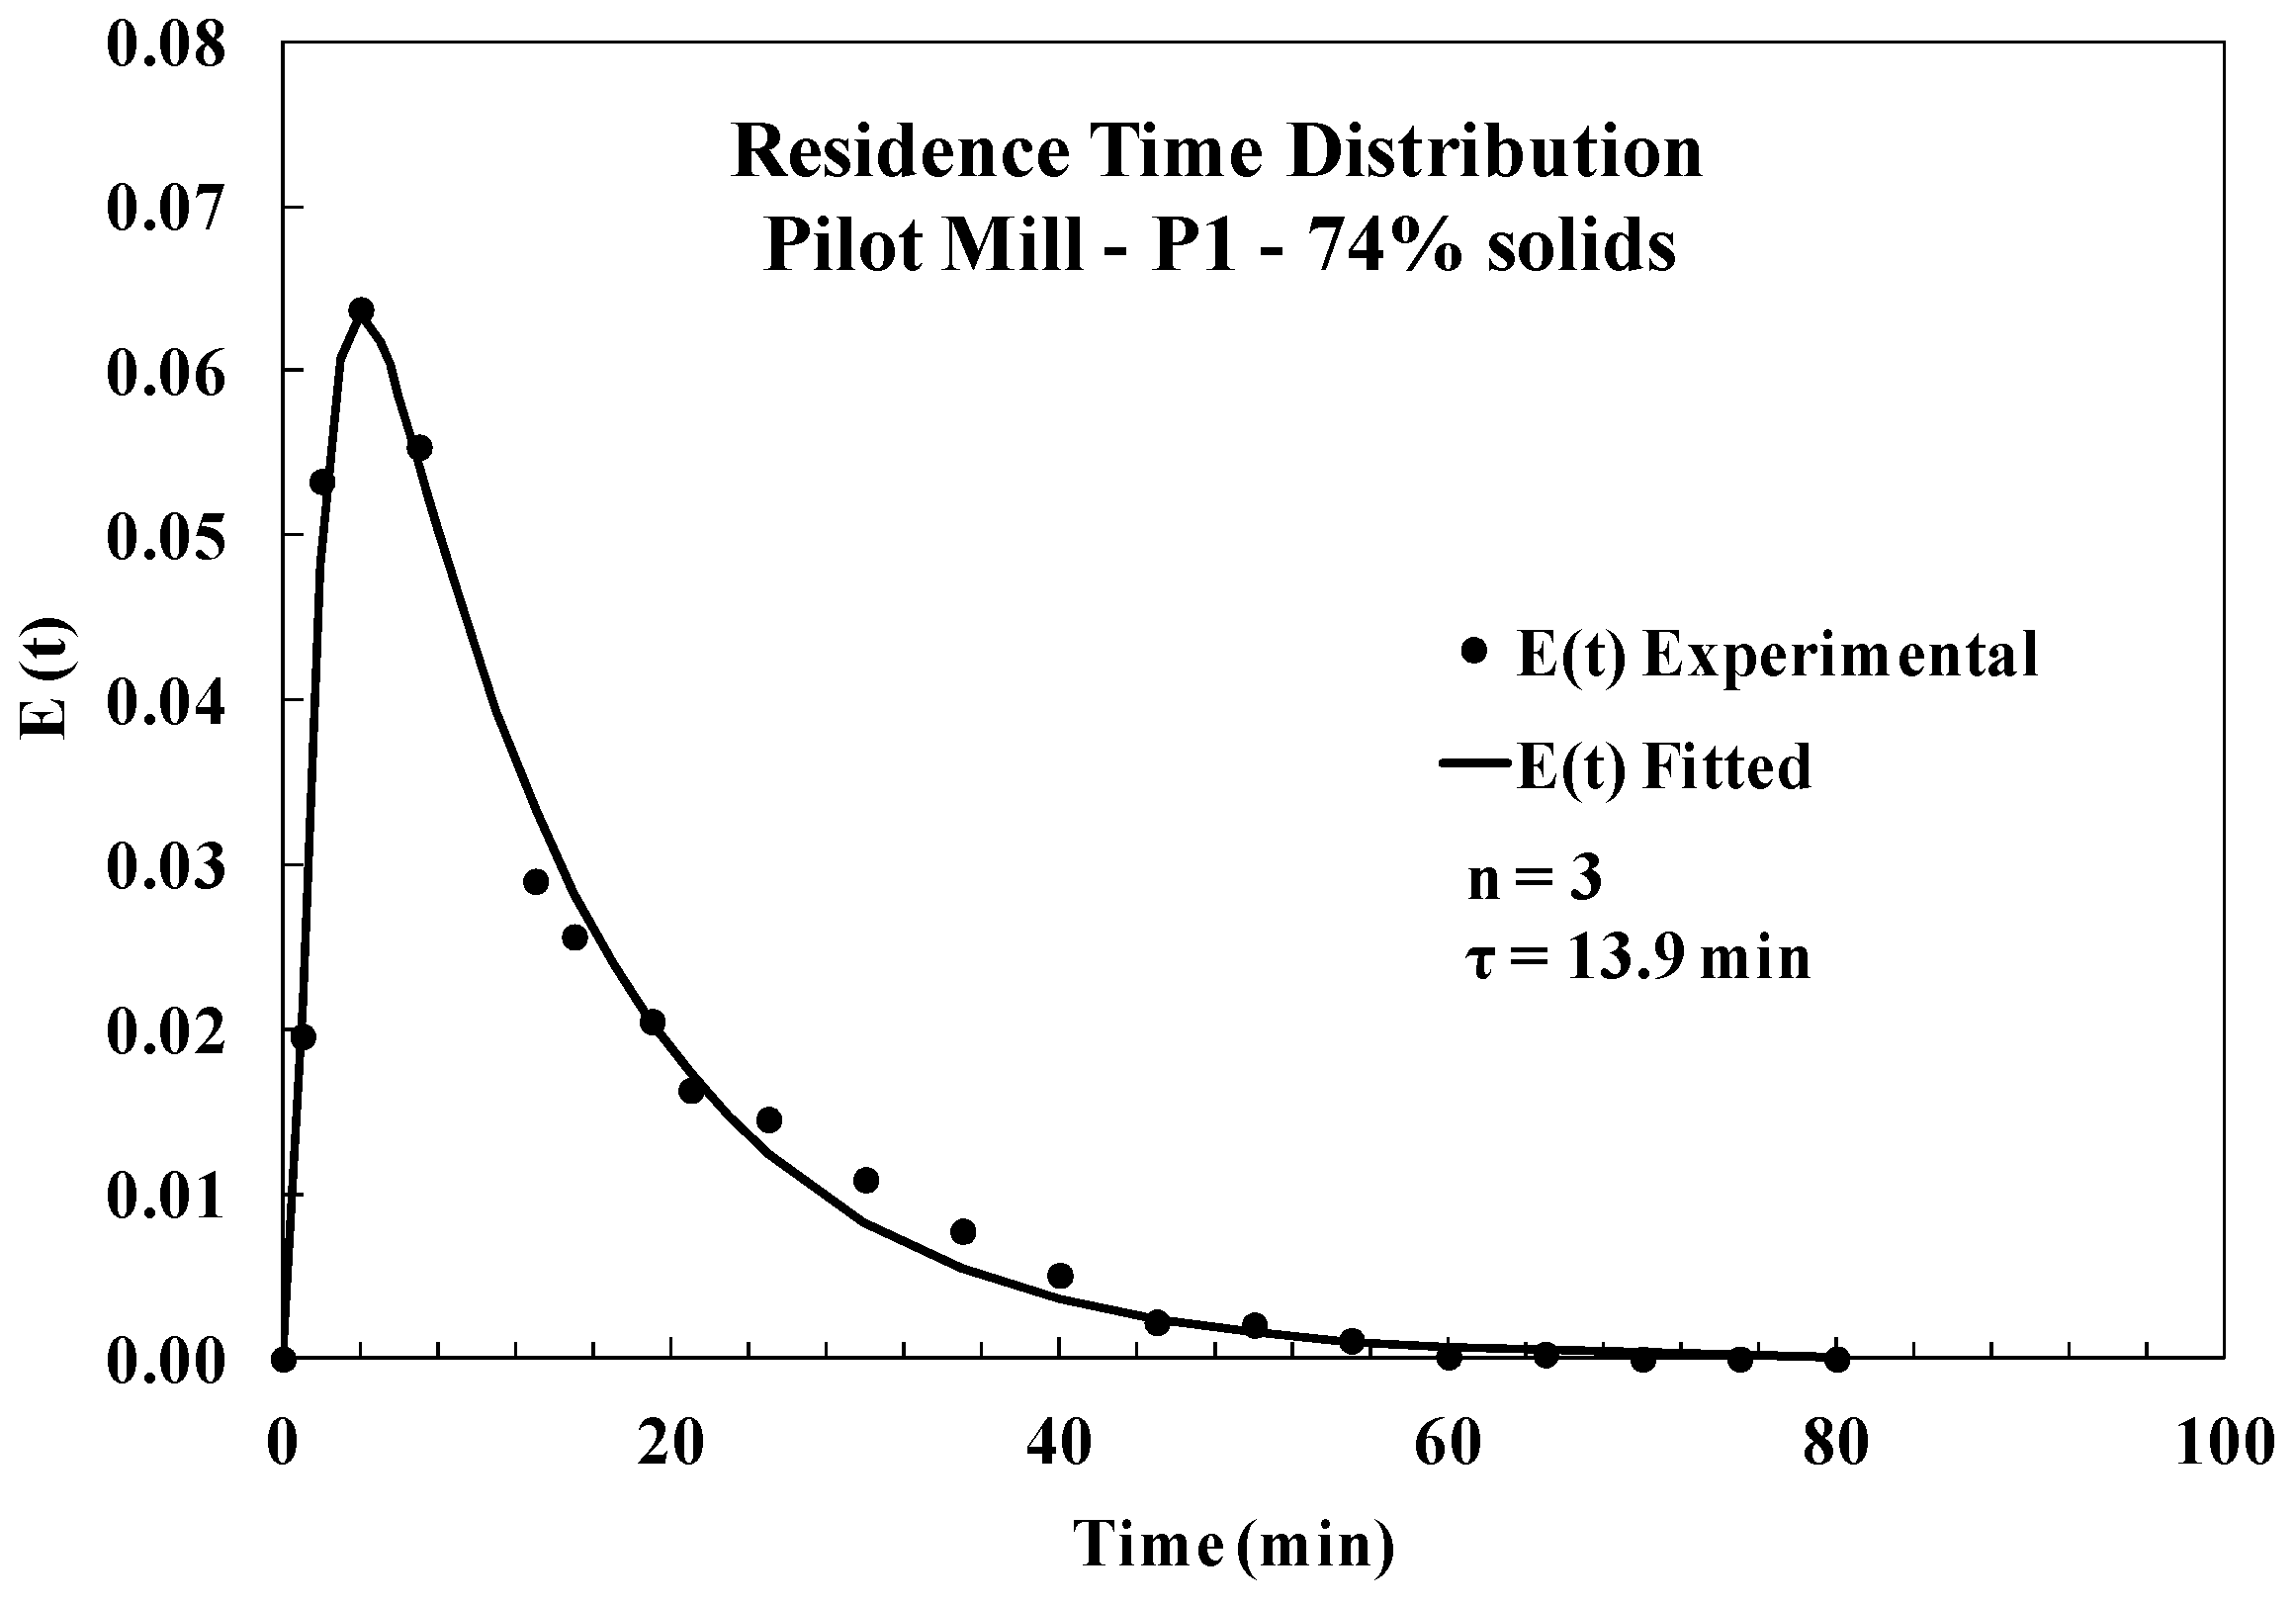
As briefly mentioned, a mill can be described as a perfect mixer. Consequently, the residence time distribution in a mill, E(t), can be represented with a highly flexible mixers-in-series model. The residence time distribution for three perfect and different mixers-in-series is [20]:
E ( t ) = τ 1 ( τ 2 τ 3 ) exp ( t / τ 1 ) + τ 2 ( τ 3 τ 1 ) exp ( t / τ 2 ) + τ 3 ( τ 1 τ 2 ) exp ( t / τ 3 ) ( τ 1 τ 2 ) ( τ 3 τ 1 ) ( τ 2 τ 3 )
where τ = τ 1 + τ 2 + τ 3 and t stands for time.
For two perfect and different mixers-in-series, the expression is [21]:
E ( t ) = exp ( t / τ 1 ) exp ( t / τ 2 ) ( τ 1 τ 2 )
where τ = τ 1 + τ 2 , whereas the expression for one perfect mixer is E ( t ) = exp ( t τ ) / τ .
A model that has been very successful to represent the residence time distribution (RTD) function is that one that considered one larger perfect mixer with average time τ1, which was followed by two perfect and equal mixers-in-series with average time τ2 [20]:
E ( t ) = τ 1 ( τ 1 τ 2 ) [ exp ( t / τ 1 ) exp ( t / τ 2 ) ] t ( τ 1 τ 2 ) τ 2 exp ( t / τ 2 )
where τ = τ 1 + 2 τ 2 .

3. Materials and Methods

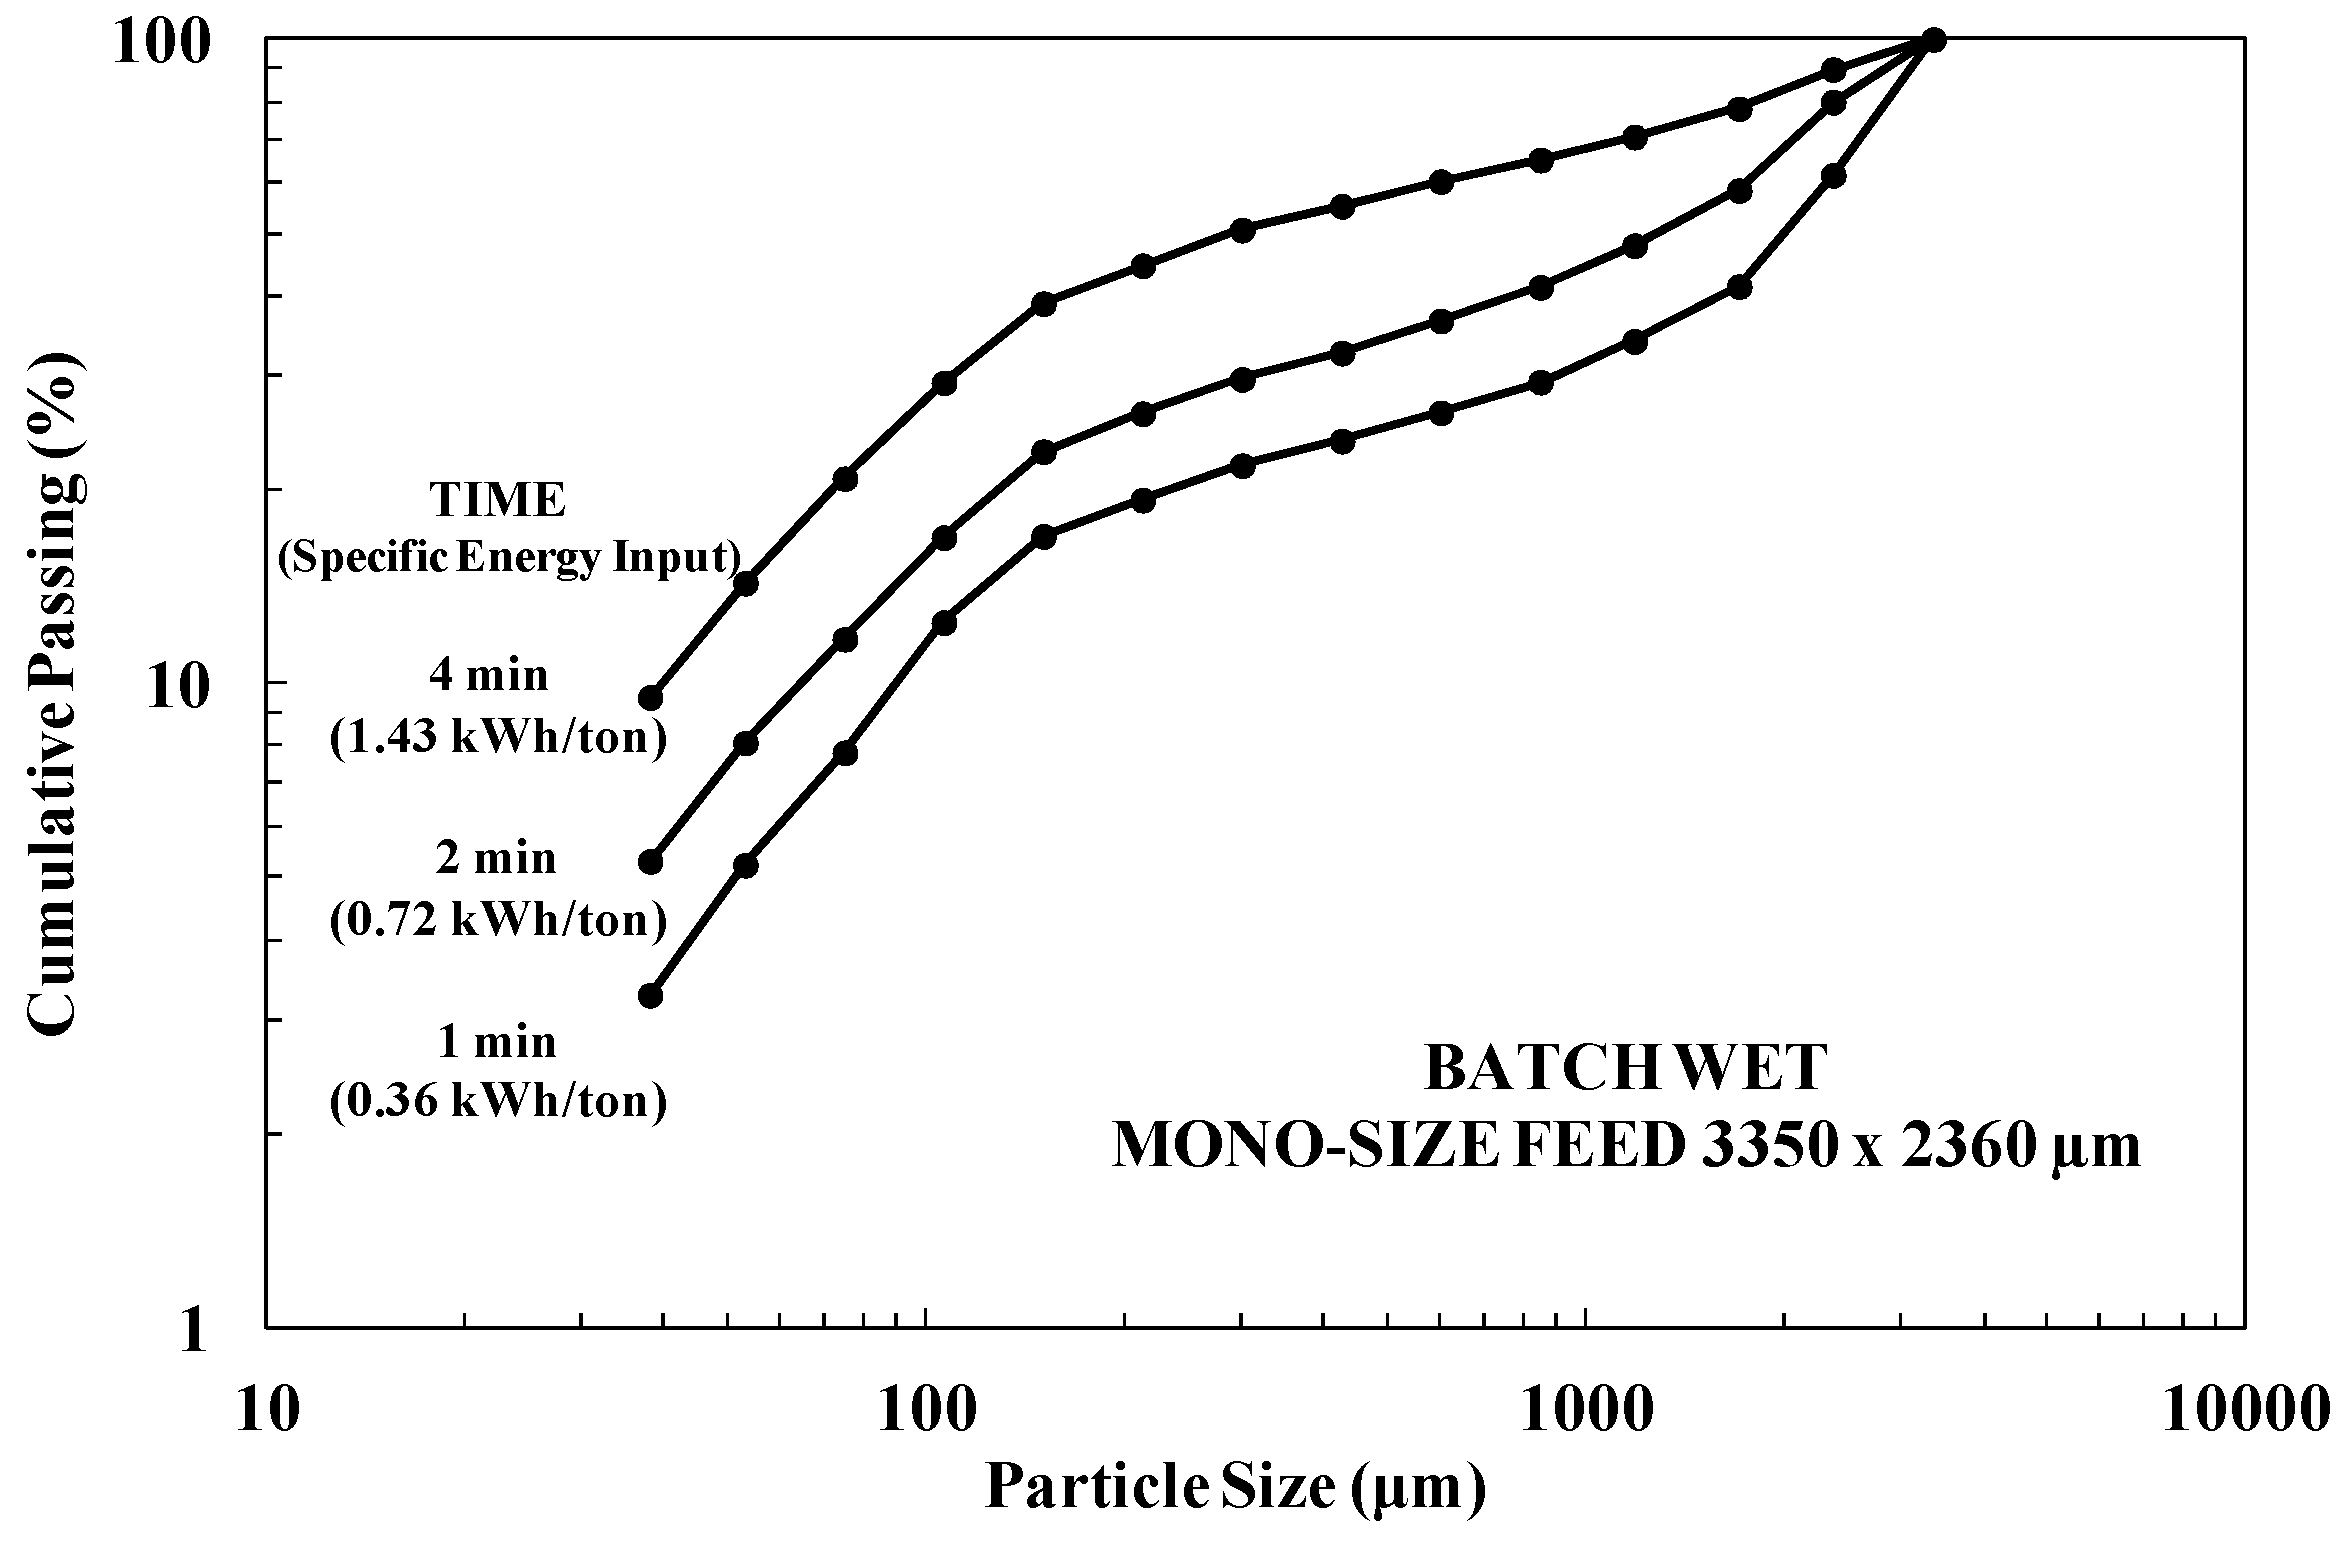
The material that was used was an iron ore pellet feed collected in Vale’s pelletizing complex in Vitória (Espírito Santo, Brazil). The specific gravity was measured as 4.34 g/cm3. The 80% passing size in the feed was about 540 μm and its top size 9.5 mm. The samples were initially homogenized, air-dried, and quartered. One sample was used for preparing narrow size samples for grinding tests (3.35–2.36 mm and 150–106 µm) using Sweco screens followed by washing in water in a fine screen to remove fines, while the remaining samples were split for additional testing. Material that was coarser than 2.36 mm was removed from the samples for the batch grinding tests, while material that was coarser than 3.35 mm was removed from the pilot-scale tests. The amount of material contained in the size range 3.35–9.5 mm was less than 3%, which resulted in no significant bias being introduced in the experiments.
The laboratory-scale mill consisted of a 25.4 cm diameter by 29.2 cm long (
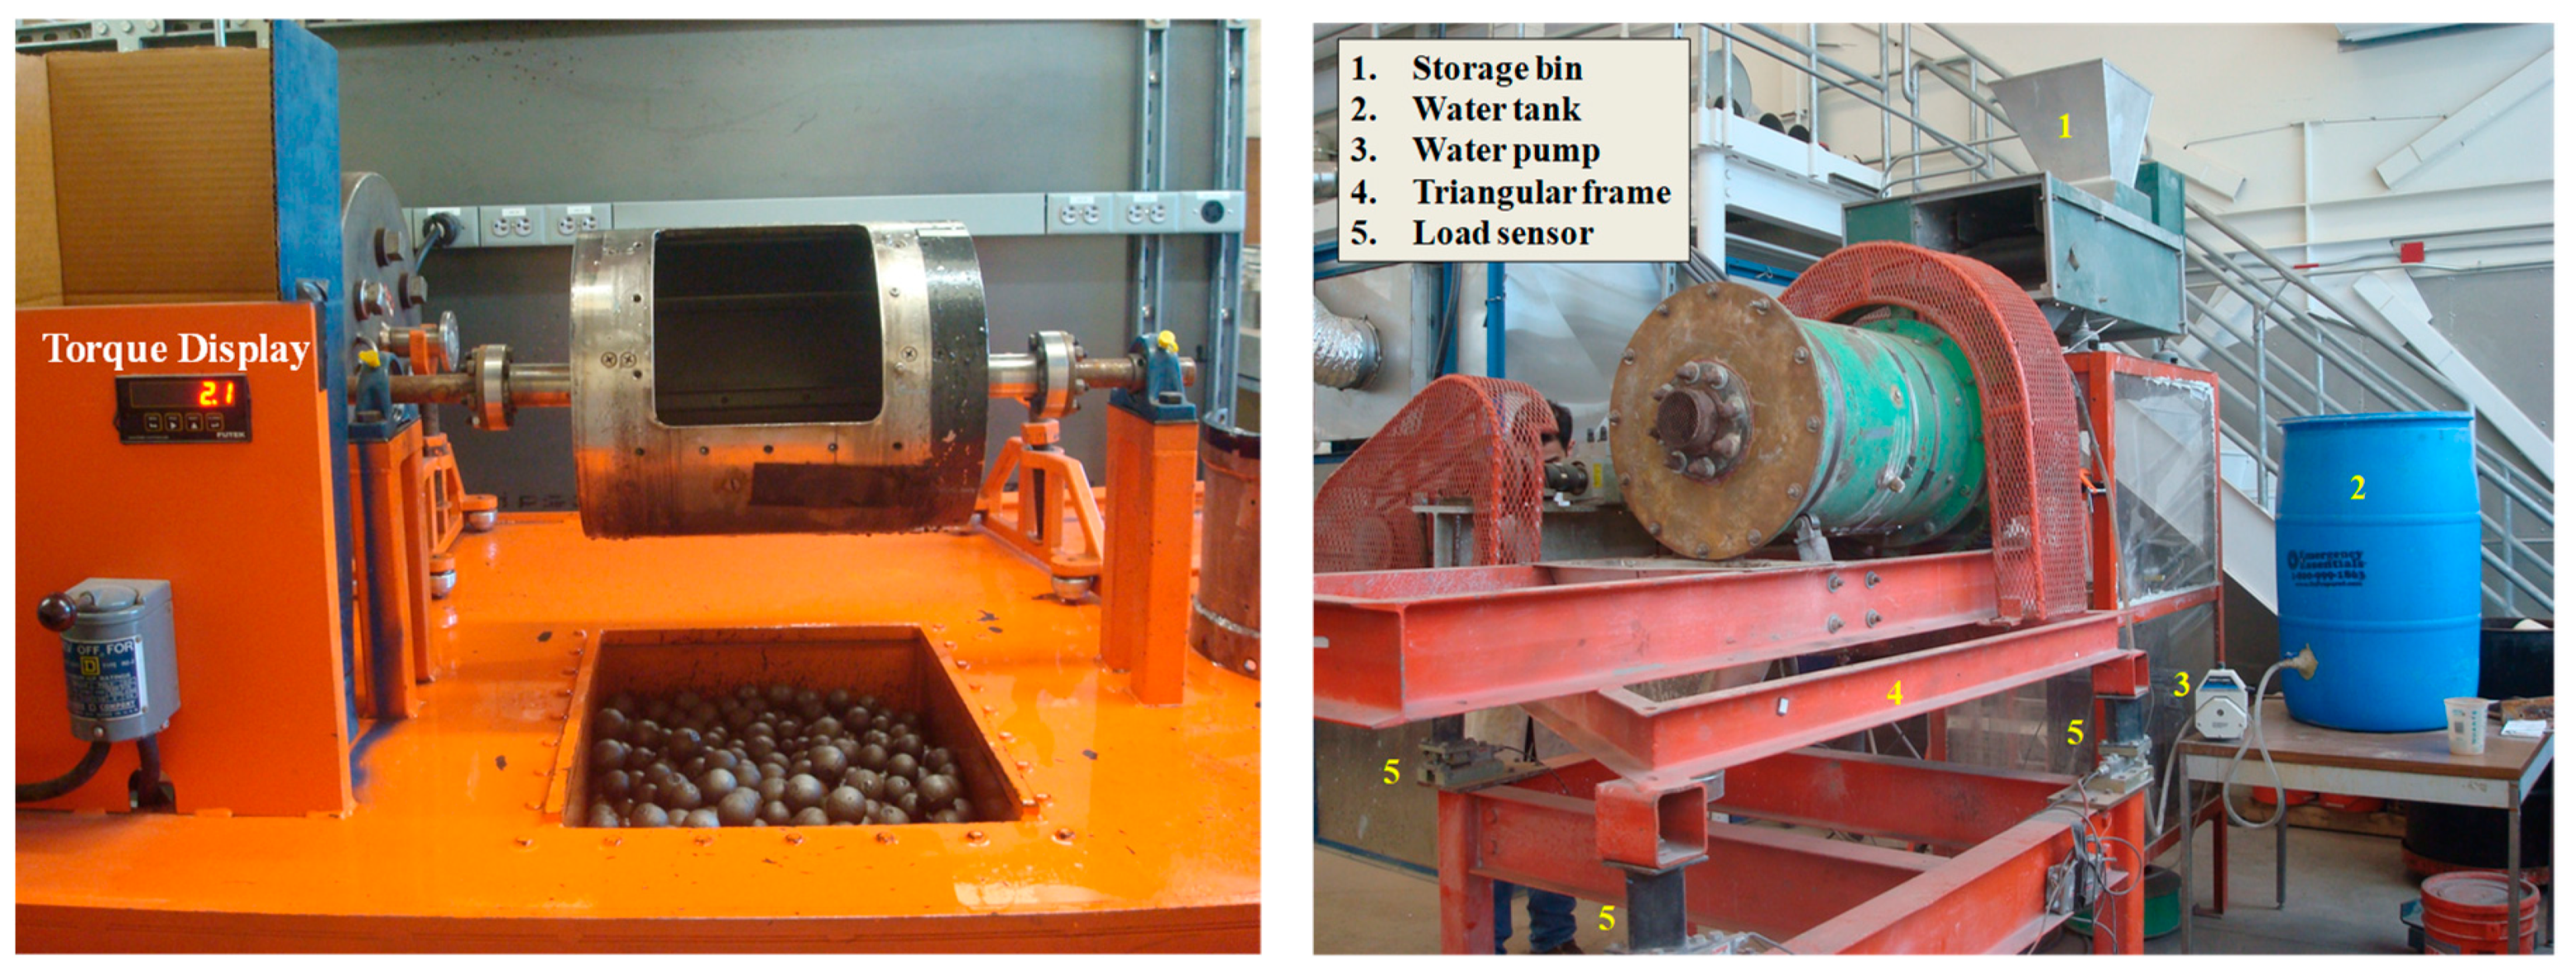
Table 1) cylindrical steel shell fitted with eight 2.0 cm width and 0.5 cm thickness square lifters. The mill was disposed in a steel frame and it was equipped with a Futek torque sensor (FUTEK Advanced Sensor Technology (Irvine, USA)) connected to a computer, in order to directly measure the torque (Figure 1). In the experiments, ball filling was kept constant at 40% and the speed of the mill for all the experiments was maintained at 68.3% of the critical speed. Narrow-size grinding experiments were carried out with material contained in two size ranges. Additional experiments were conducted with the feed comprised of the material with size below 2.36 mm. The ball top size that was used in the tests was 30 mm, with a seasoned charge [22], mimicking the industrial ball size distribution, with a minimum size of 12.7 mm [23], as shown in 
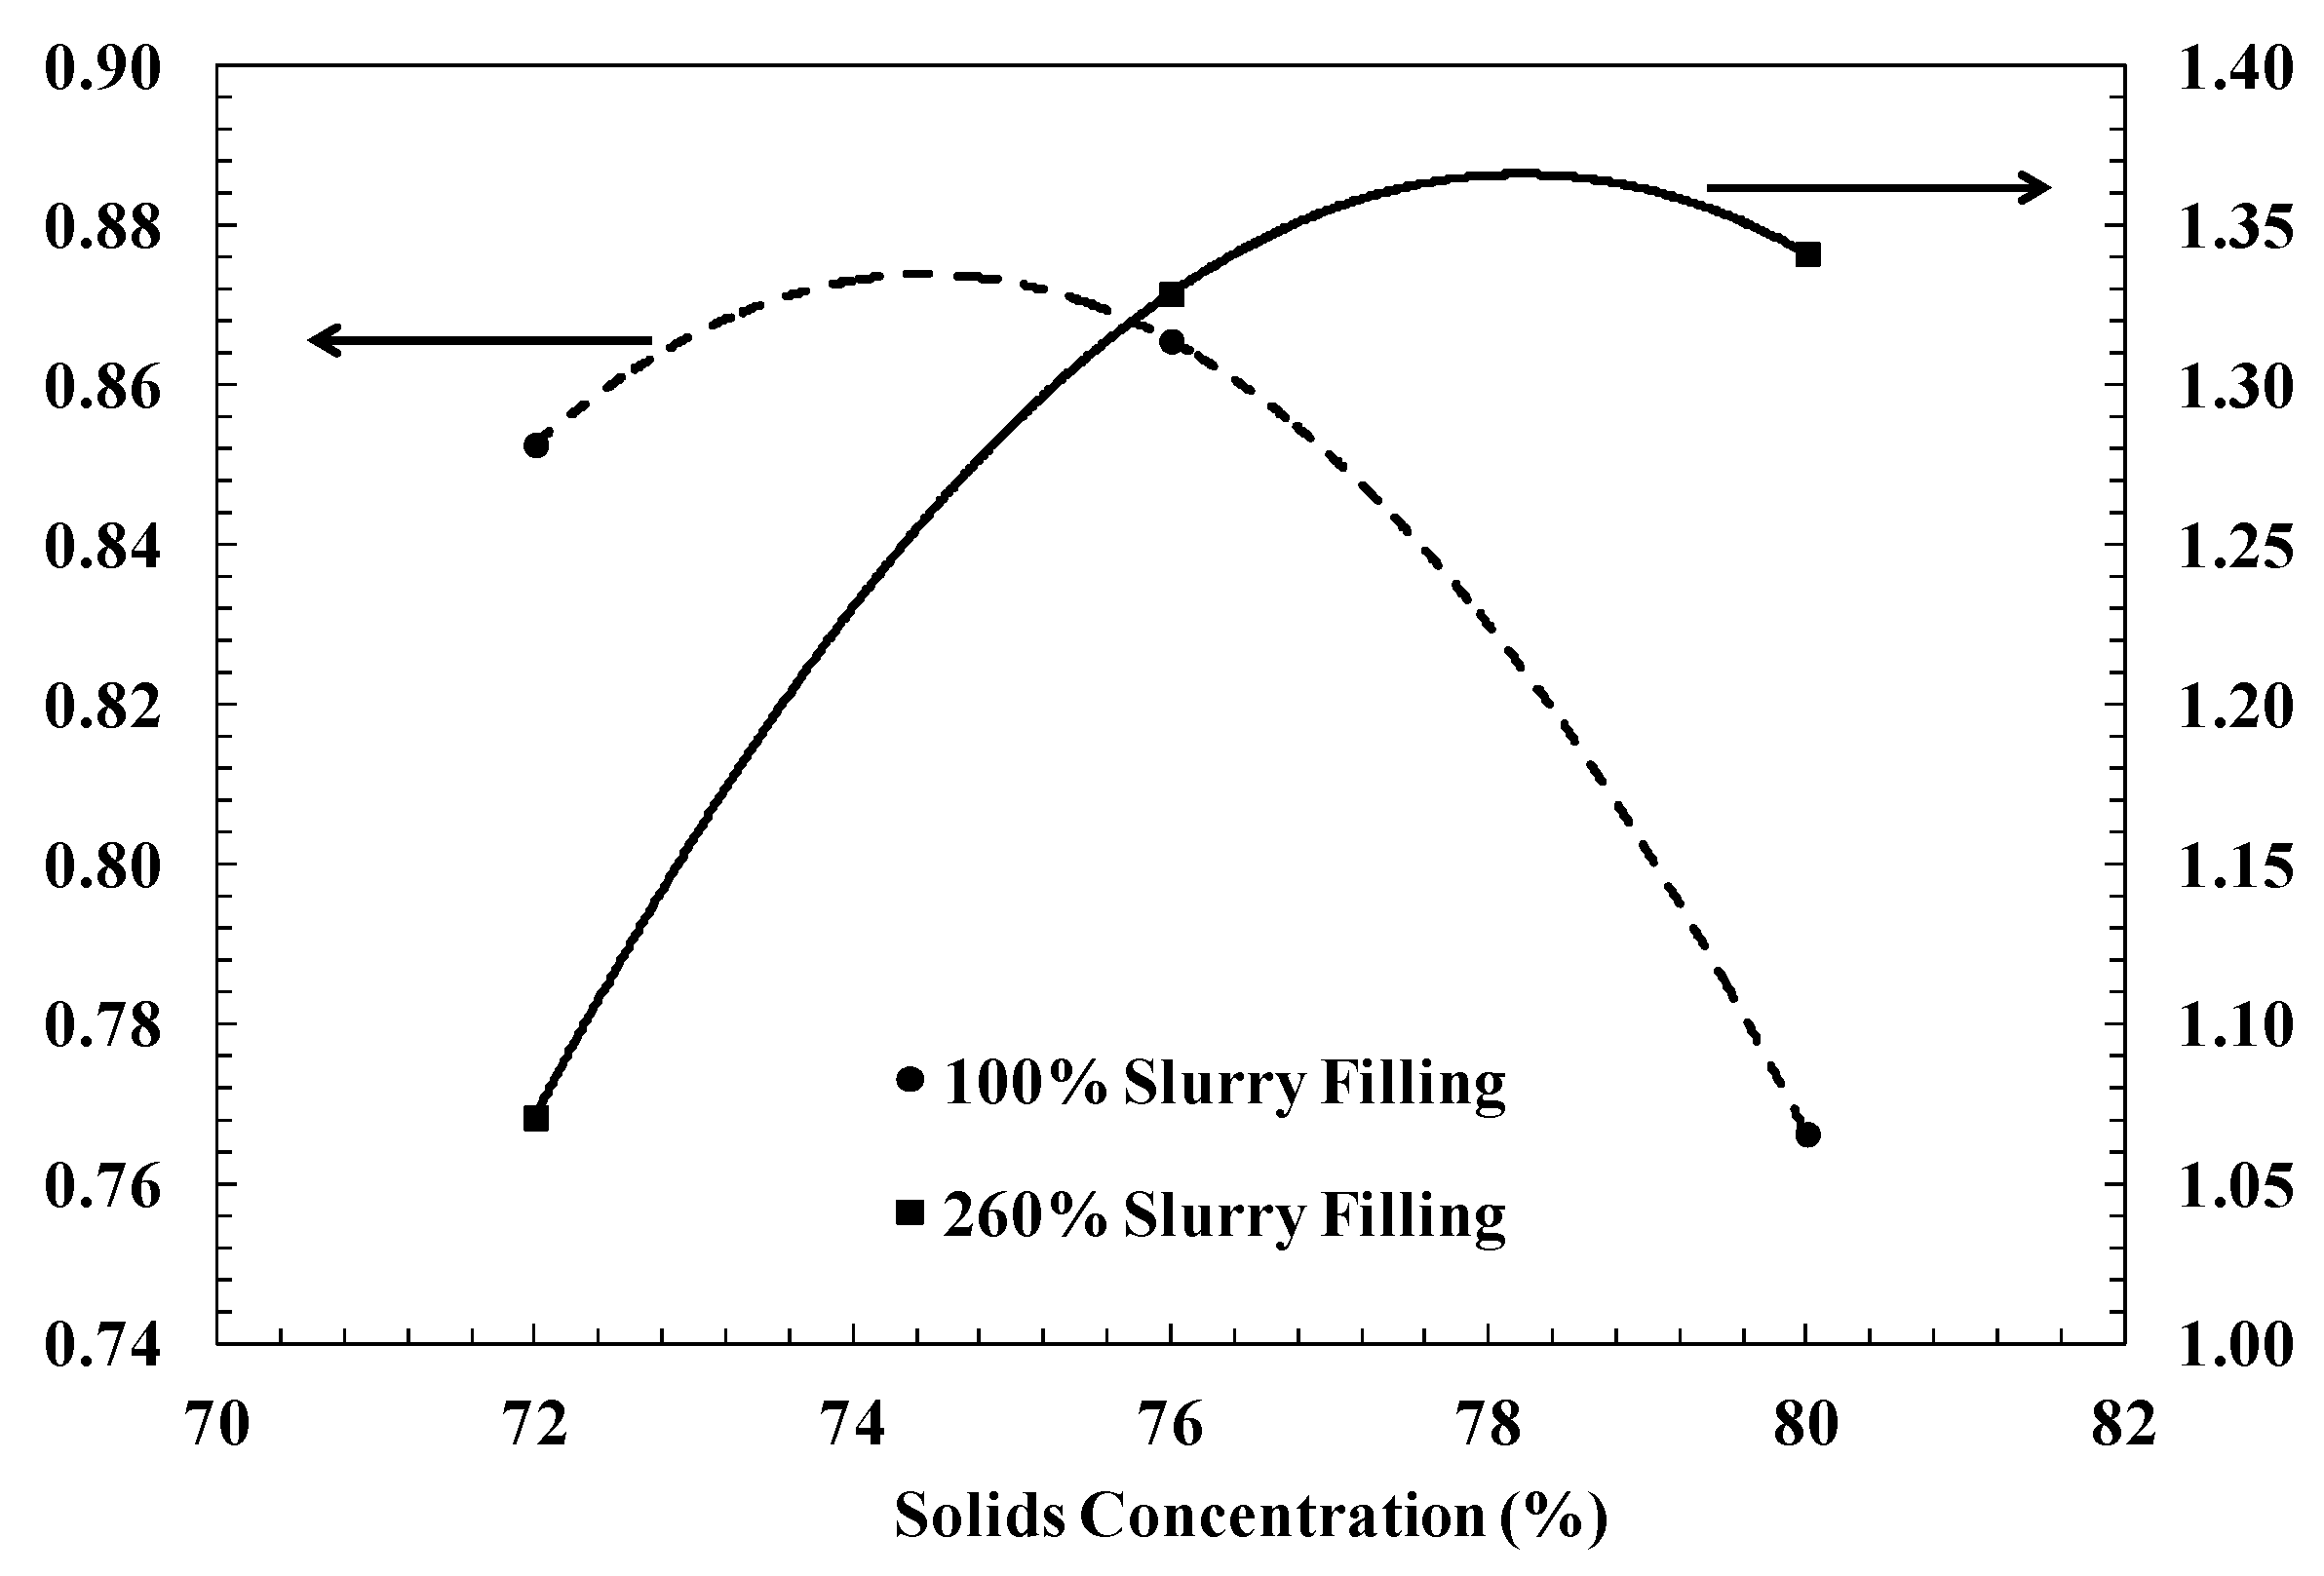
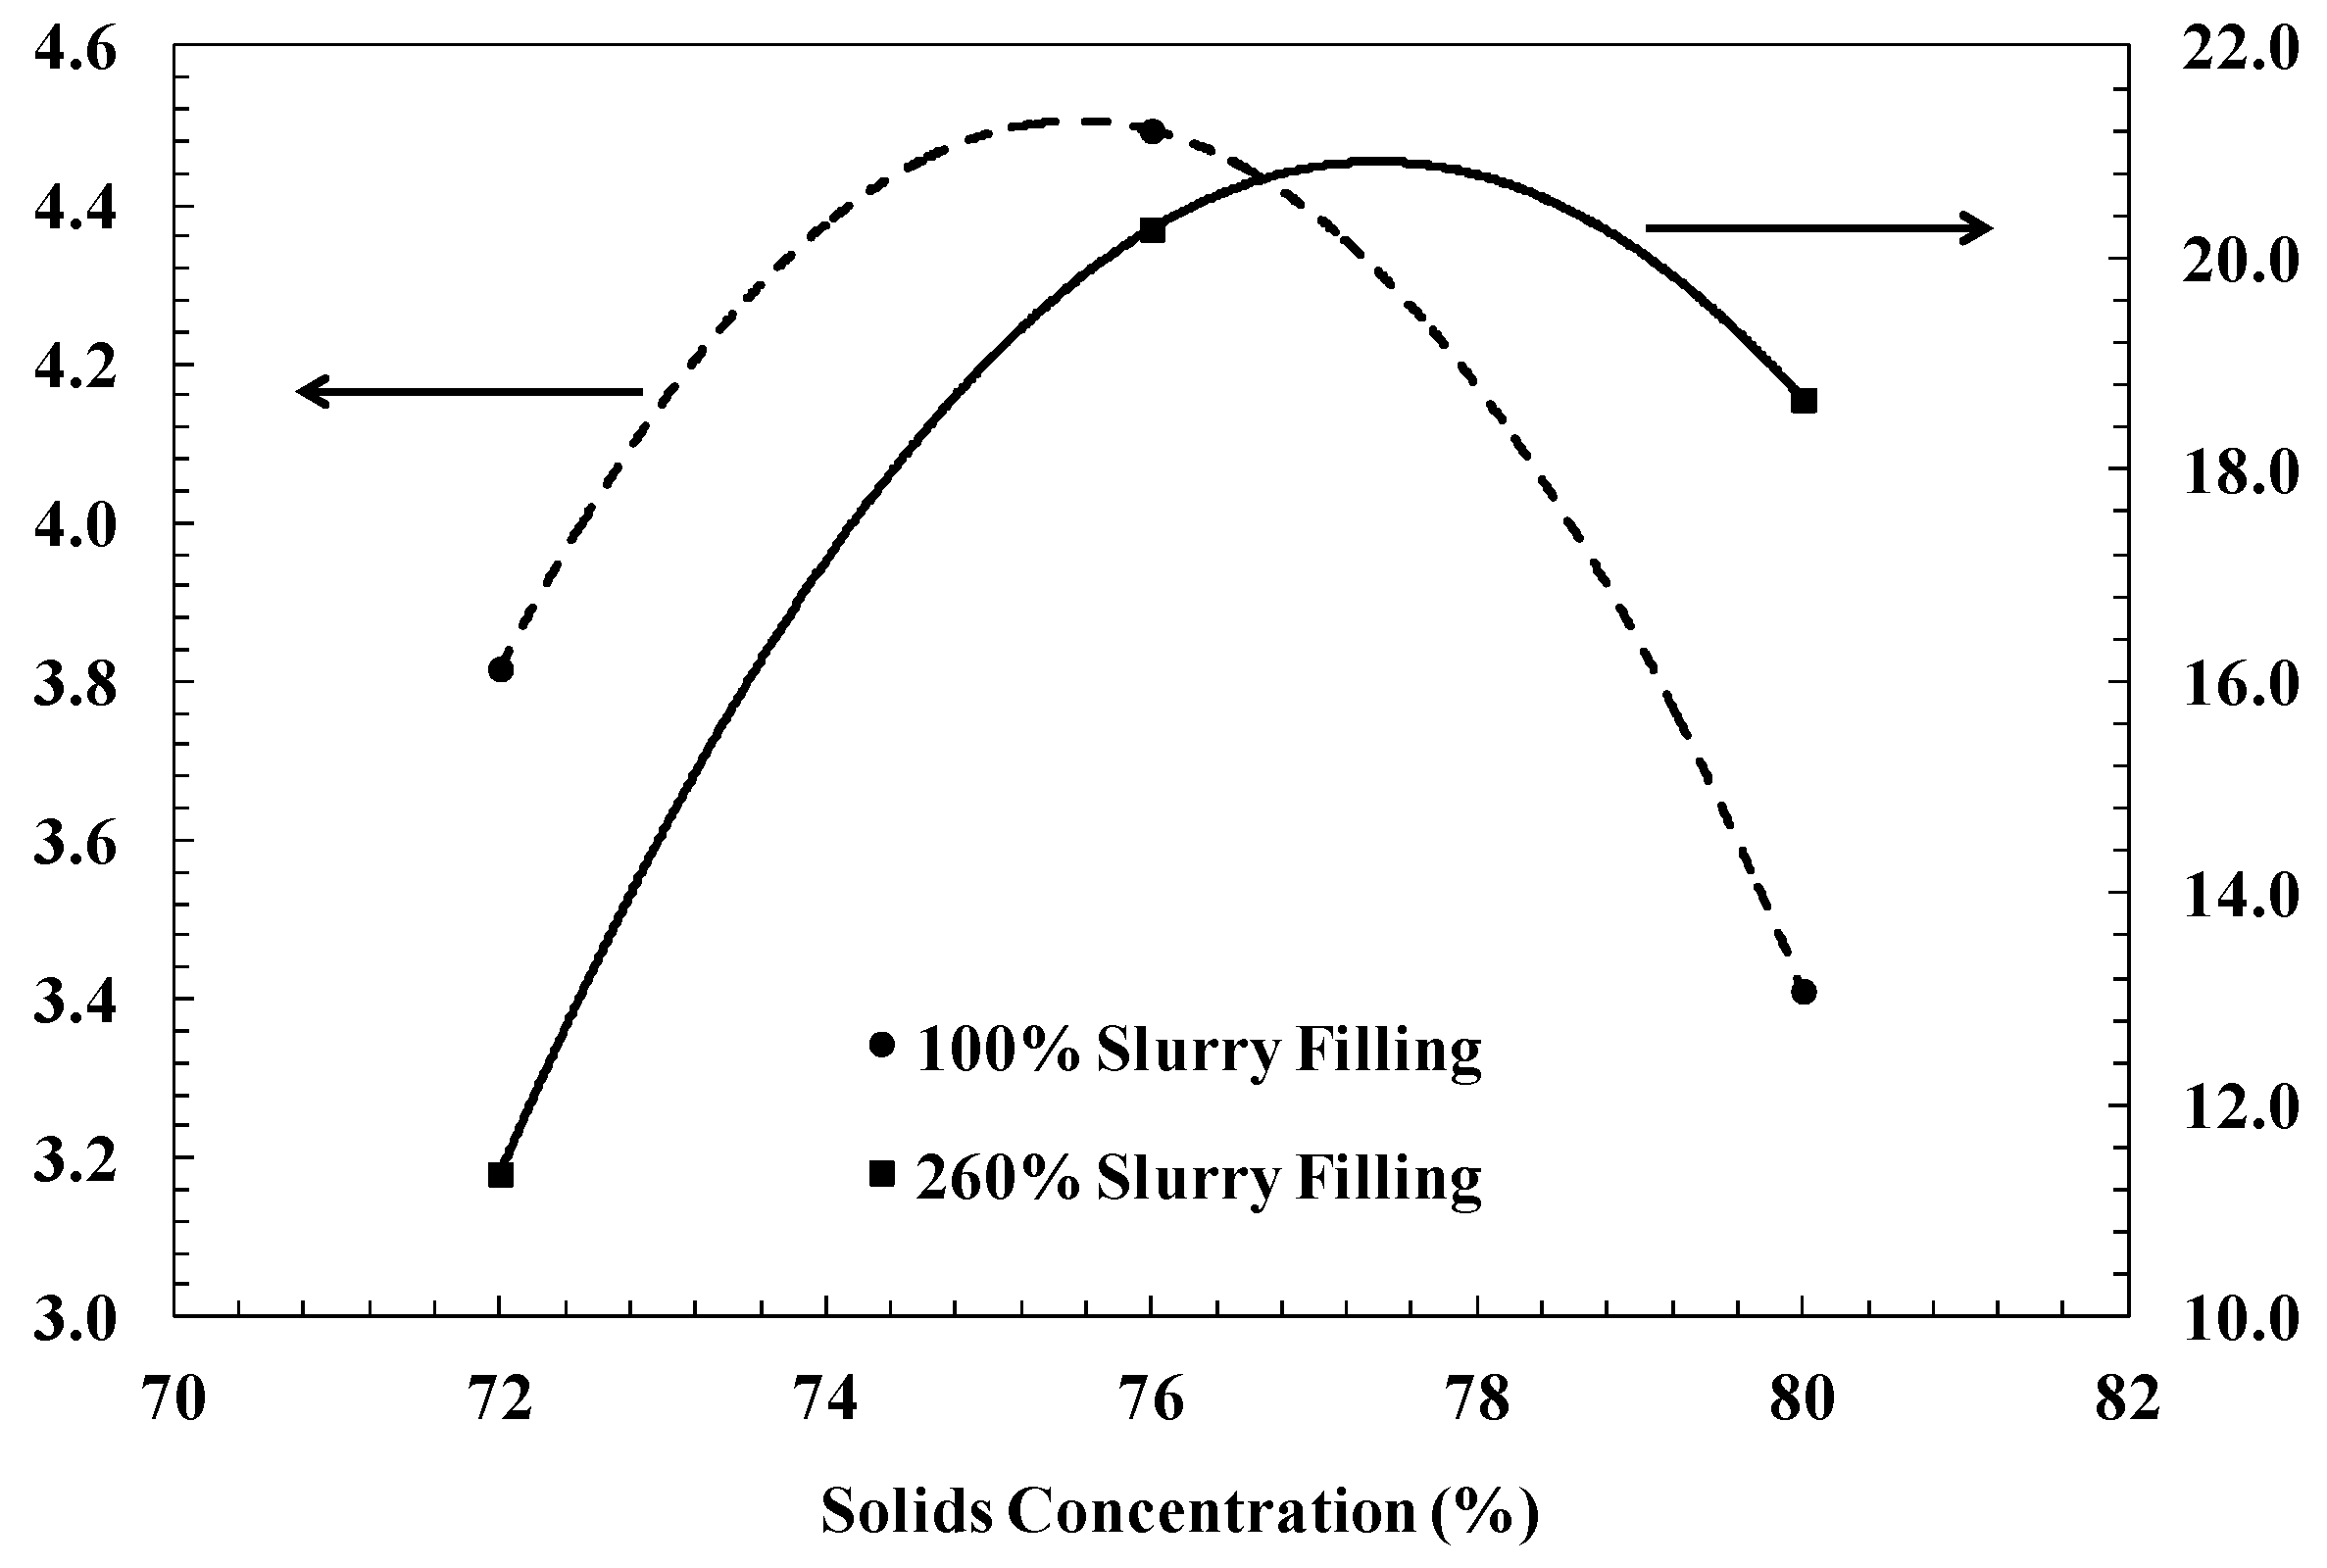
Table 2. The solids percentage in the slurry varied from 72 to 80% (in weight), whereas the voids fillings were 100% and 260%. The experiments ran for the set time, the product was discharged and filtered, and the torque was recorded. Size analyzes were then conducted by wet sieving.
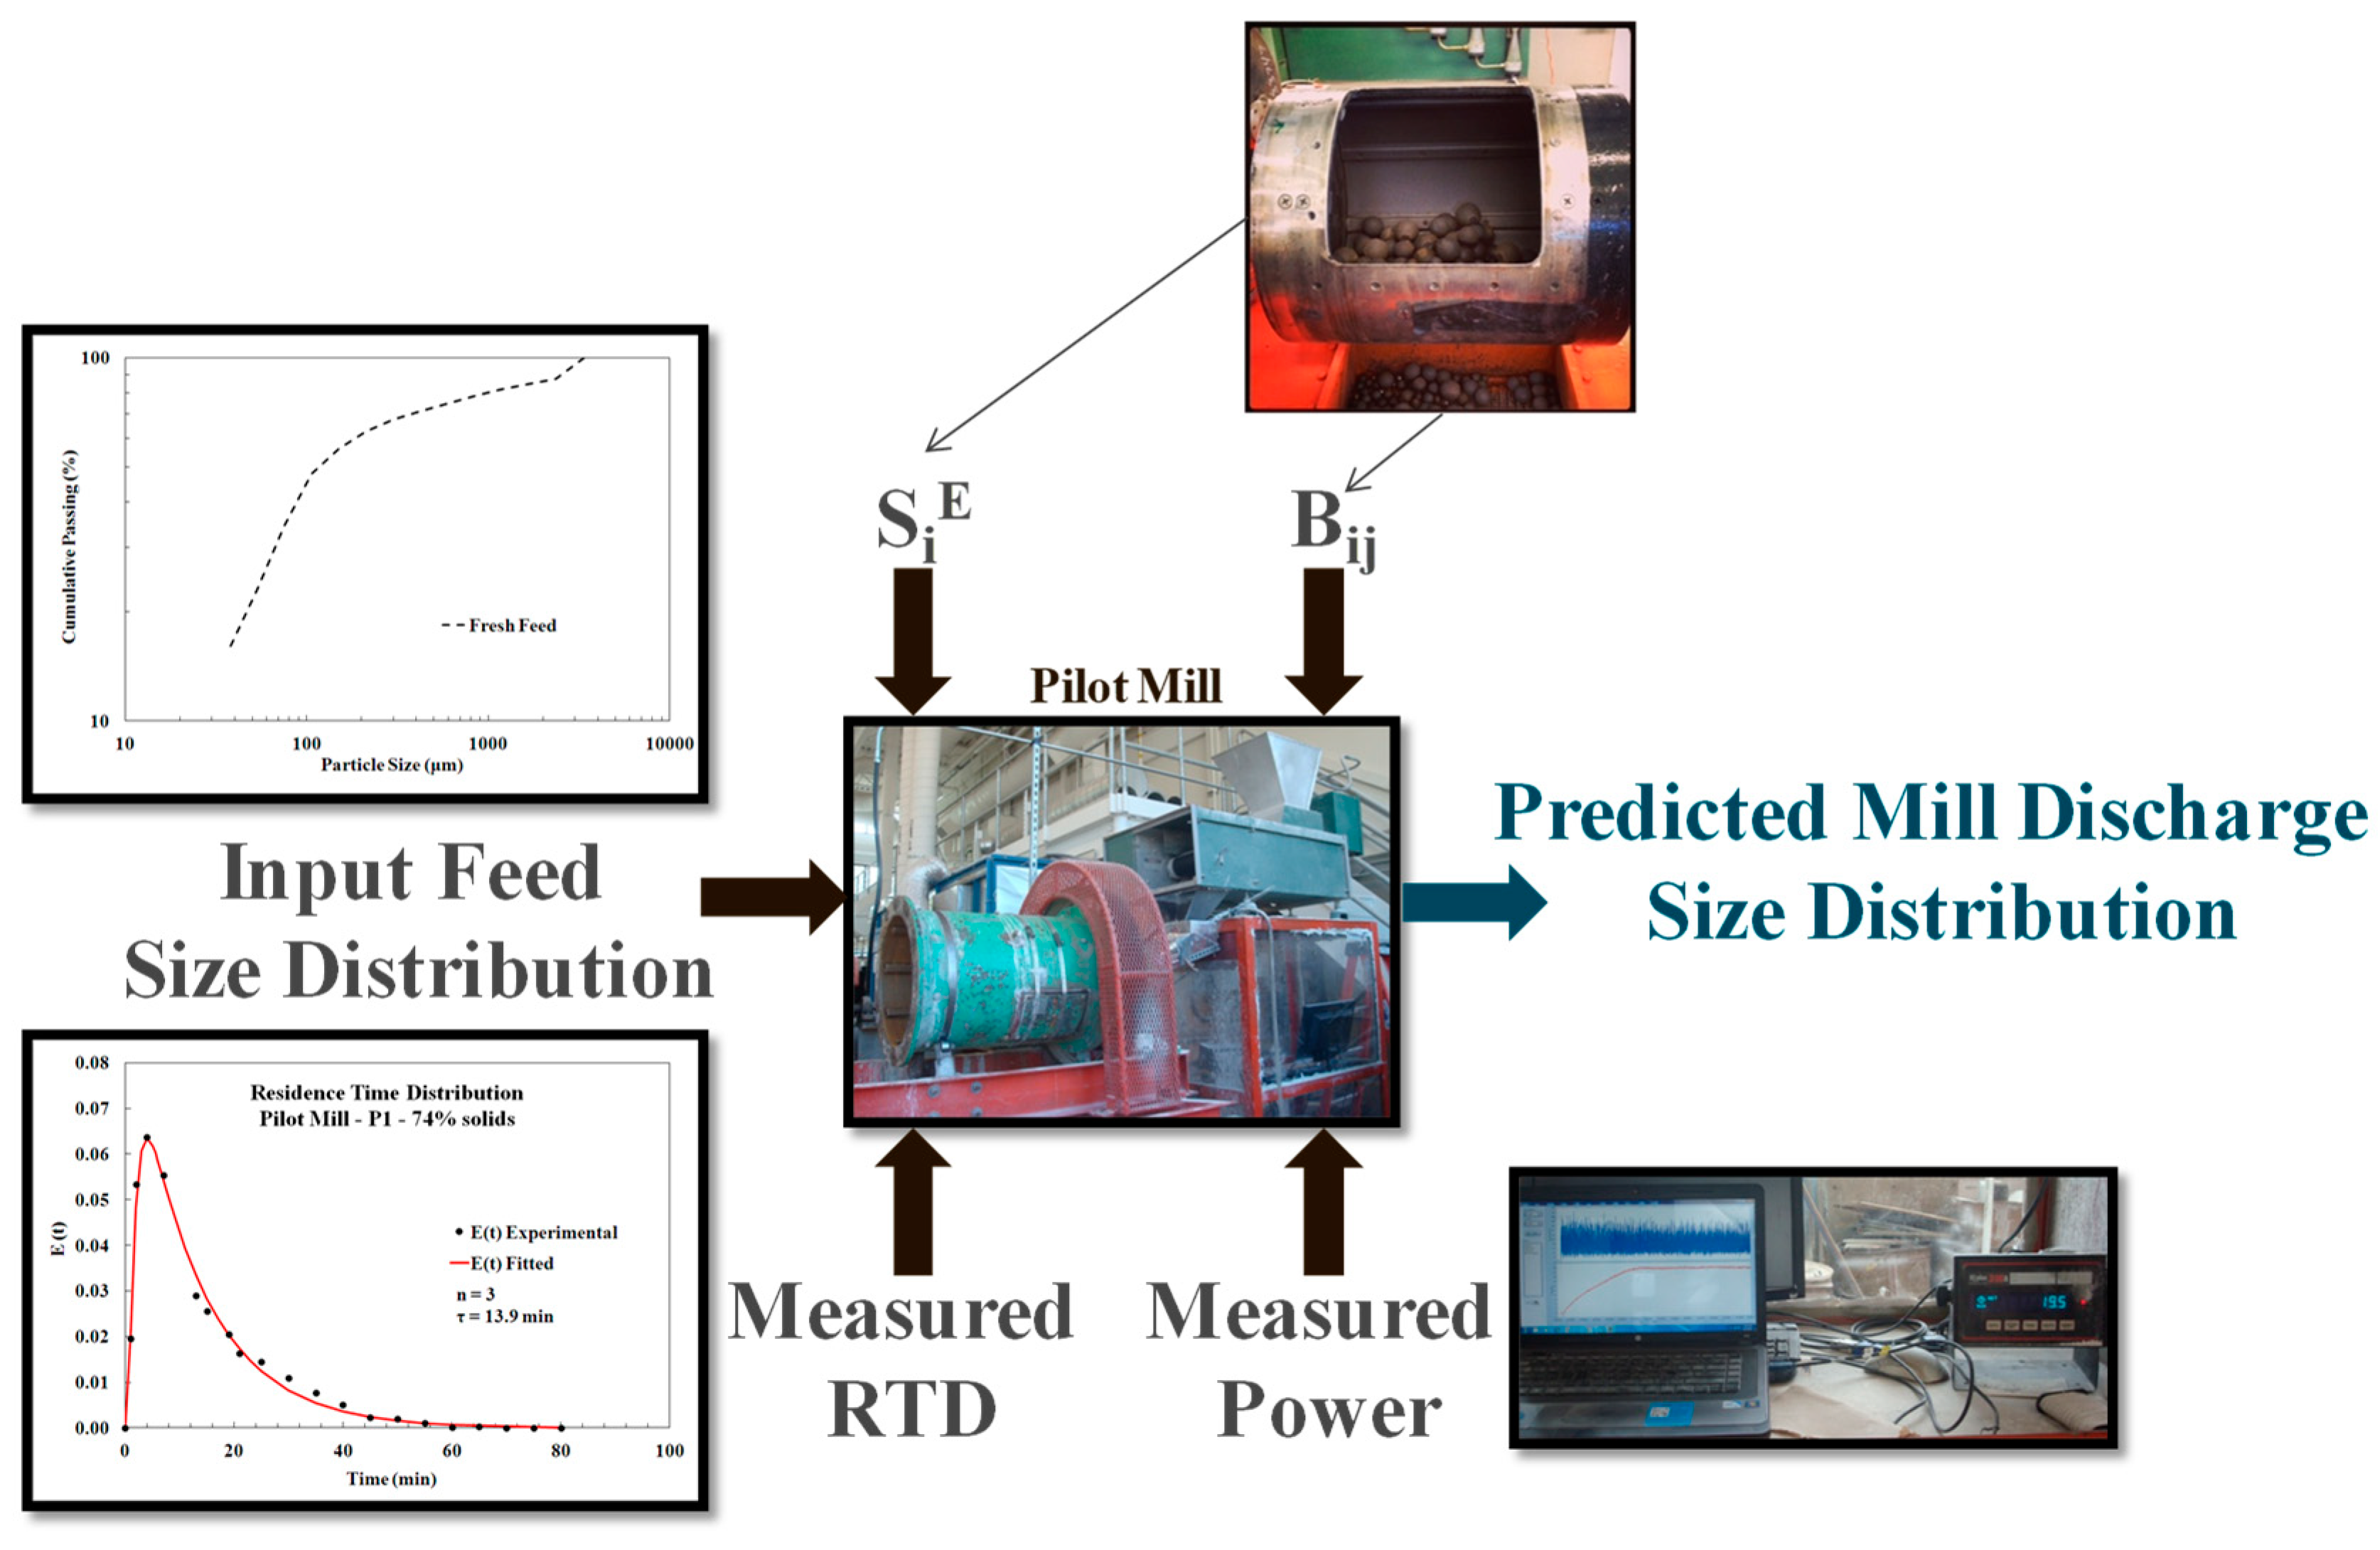
The pilot-scale mill consisted of a 41.6 cm diameter by 64.1 cm long cylindrical steel shell that was fitted with eight 13.0 mm width and 6.0 mm height lifters bars. The mill was fitted with two exchangeable discharge end-plates, allowing for overflow or grate discharge operation. The dry ore entered the mill through a variable speed conveyor belt at a fixed rate of 1 kg/min (0.06 t/h). The mill and the gearbox were supported by an L-shaped steel frame. Another steel frame next to the L-shaped frame supported the motor, the system of pulleys, and the torque sensor. Underneath these two frames was a triangular steel frame and a weighing system (Rice Lake™), which comprised three load sensors (Paramount™) that were anchored to the supporting concrete block that was located in the corners of the triangular frame. Hence, the triangular frame rested on the load sensors that were responsible for measuring the weight of the whole system (Figure 1), which allowed for an accurate estimate of the mill slurry mass during testing. The torque sensor was positioned between the motor and the gearbox, and measured the torque at the drive side of the gearbox and sent its electrical signal to a digital indicator. The power input to the mill was obtained by multiplying the recorded torque by the gear ratio and applying the appropriate corrections for losses. During the experiments, the torque and the reading on the load sensor (slurry hold-up) were recorded every two minutes. A feed water system, which was composed of a fixed tank near the mill, a pump, and a flow meter, was also part of the circuit, allowing for precise water flow rate control. Pilot scale experiments were carried out in open circuit with a ball load of 35% and a range of solids concentrations (74, 76, 77, 79, and 85% wt.) and with the mill fitted with both grate and overflow discharges. Slurry fillings were calculated while considering the slurry hold-up measured with the aid of the load cells, while the mill was operating under steady state conditions. After steady-state conditions were reached, the samples were collected for size analyzes by wet sieving and verification of solids concentration. The same ball size distribution was used in these tests (Table 2). Upon completion of each test, the solids hold up of the mill was measured.
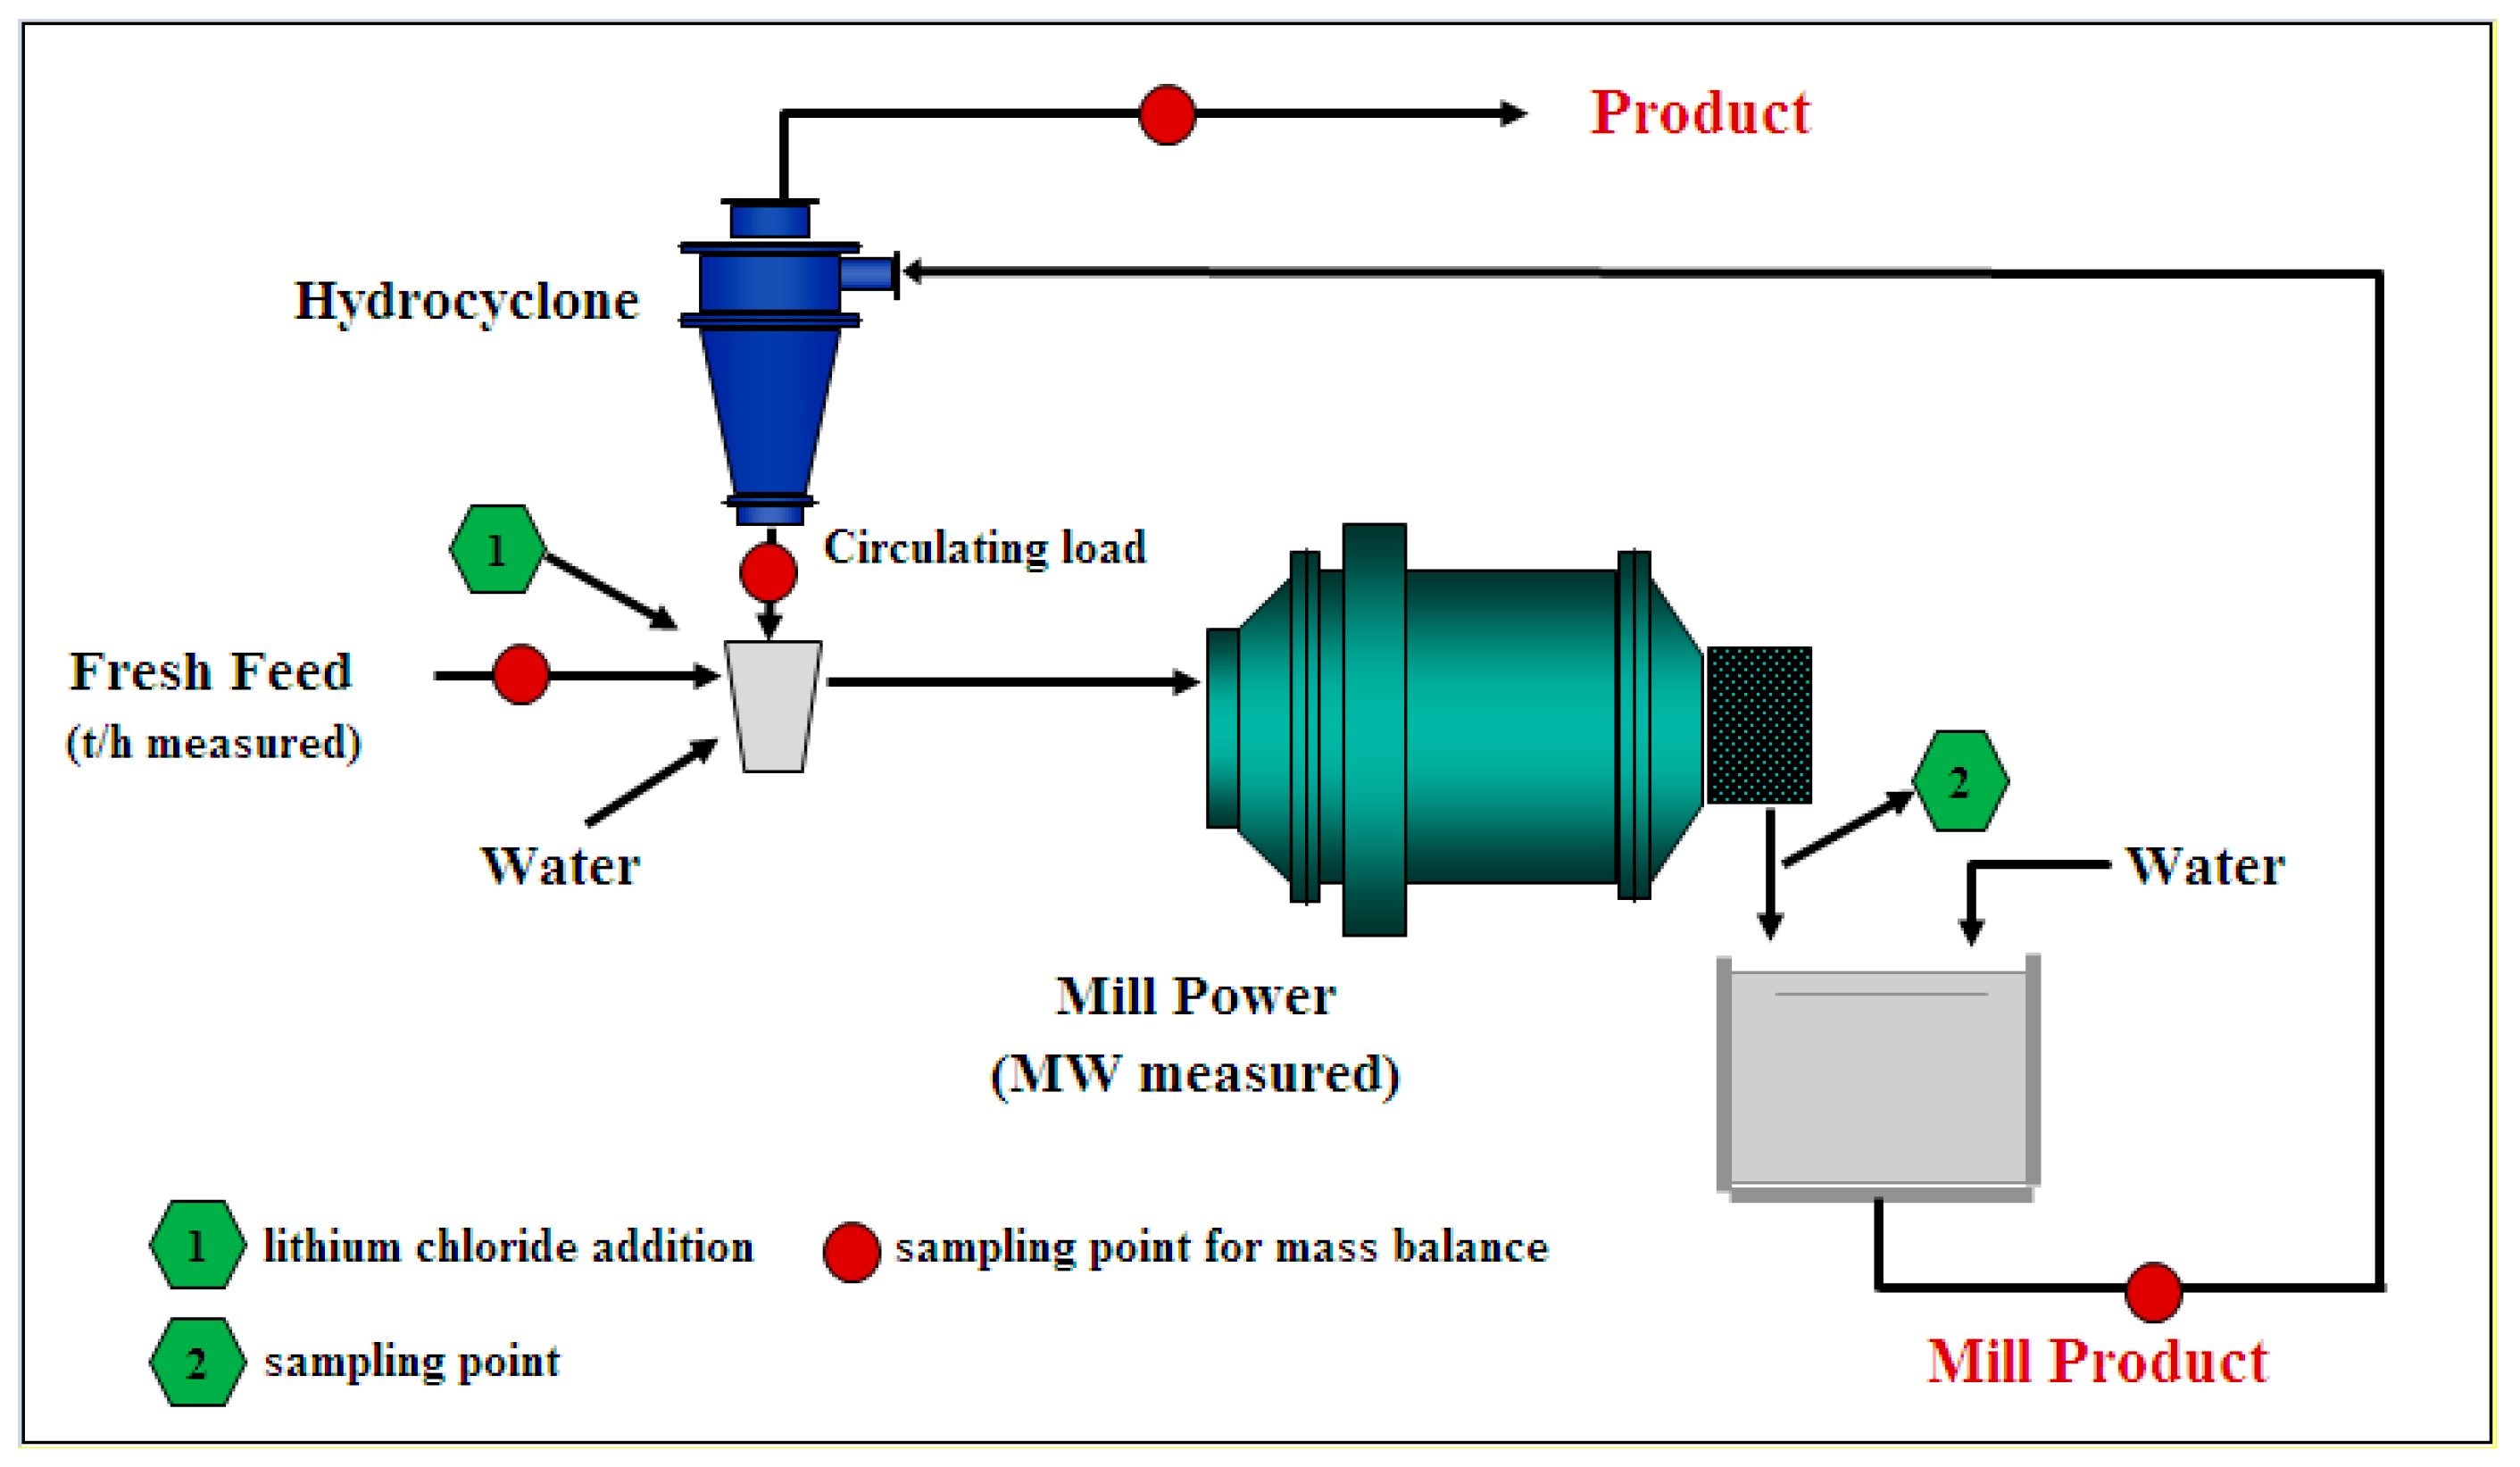
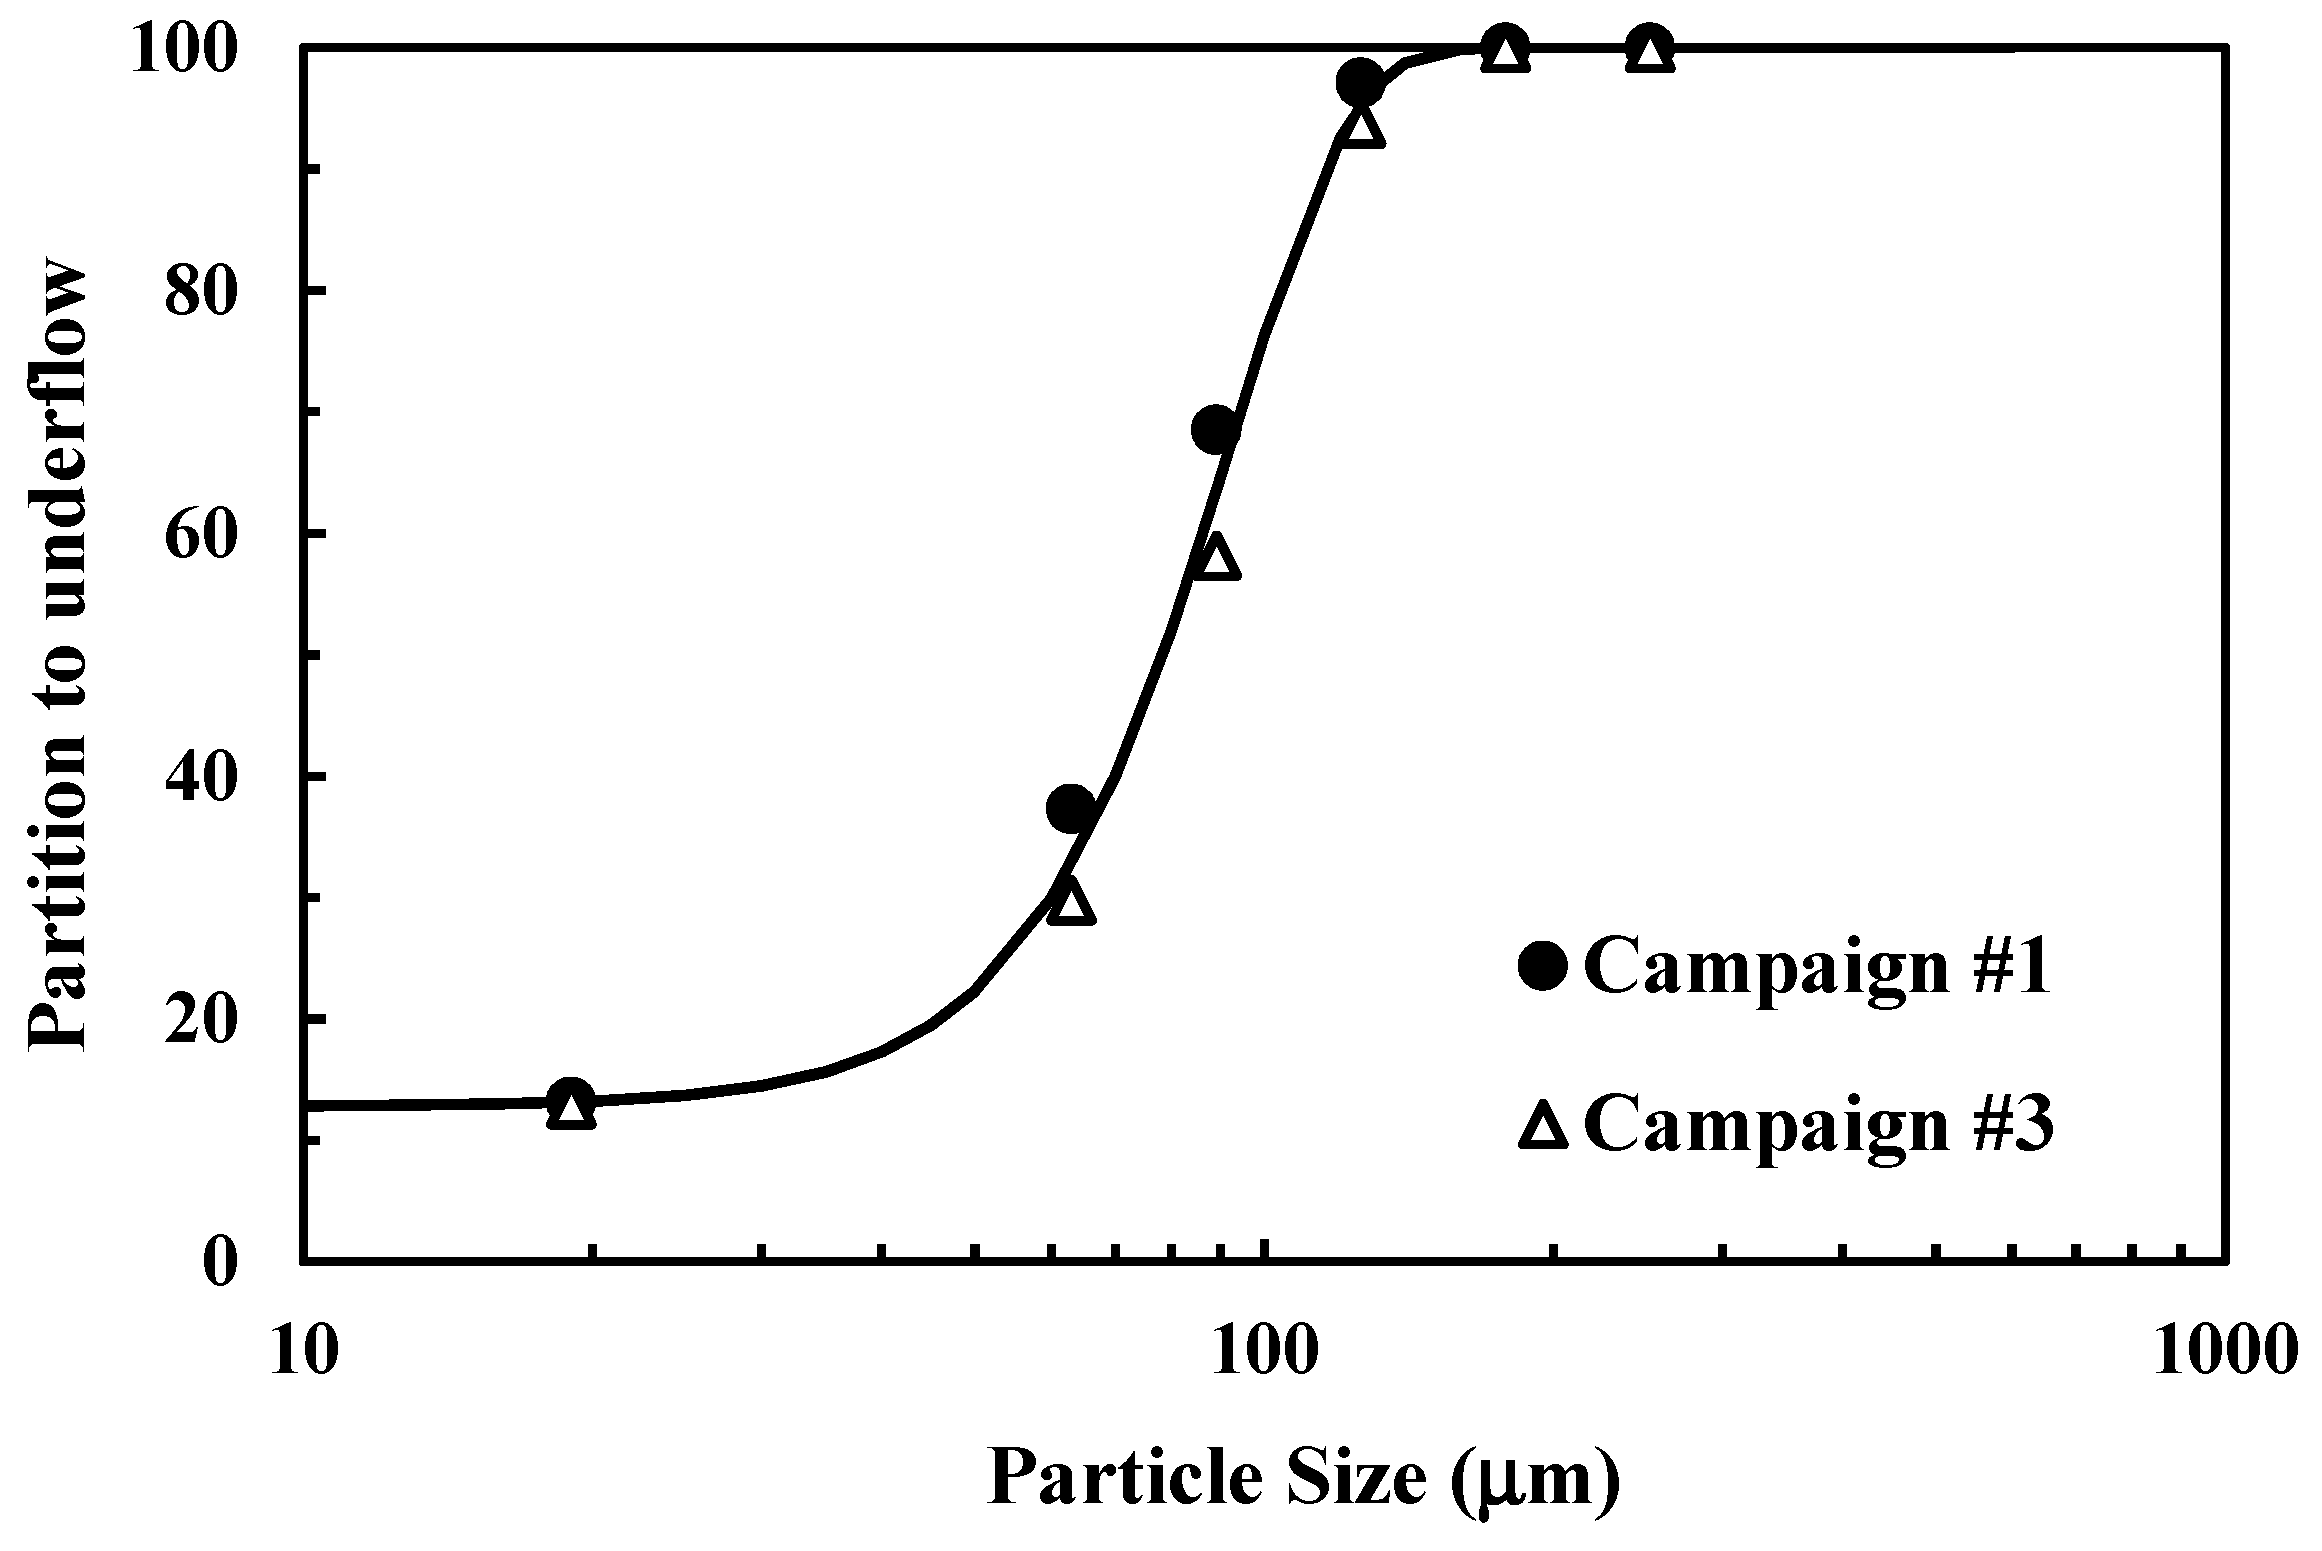
The continuous mill that was investigated in this work is installed in Vale’s pelletizing complex located in Vitória (Brazil) and has 5.2 m (17.1′) internal diameter, 10.6 m (34.8′) length, and is equipped with two 2.25 MW motors. The mill liners were made of rubber and their profile was bar-plate and the mill is equipped with overflow discharge. Three surveys were carried out with the mill operating under different solids concentrations. In each of these surveys, samples of the fresh feed, the overflow and underflow from the hydrocyclones, and the discharge of the ball mill were collected in 15 min increments for two hours during a period of stability of the circuit (Figure 2). Size analysis and solids concentration were measured of the composite samples, which were later mass-balanced. These sampling campaigns were carried out of the mill operating at total feed rates that only varied from 220 to 237 t/h, with the mill drawing from 3.38 to 3.46 MW of motor power. The inlet pressure of the feed of the hydrocyclones was maintained within the range from 0.8 to 1.1 kgf/cm2, while their feed percent solids was maintained at 61.5 ± 2%.
Residence time distributions of the liquid in both the pilot-scale and full-scale mills were measured while using the stimulus-response technique with lithium chloride as the tracer material in the inlet-fluid stream. The injection is the stimulus, while the response is the tracer concentration measured in the outlet stream. Analyzes of filtrates from the timed slurry samples were conducted while using a conductivity analyzer. In the case of the full-scale tests, 9.9 kg of lithium chloride that was dissolved in five liters of water were added to the sump that receives the underflow of the hydrocyclone cluster that feeds the ball mill and the timed samples were collected from the trommel underflow stream (Figure 2).
More details of the experimental systems and procedures may be found elsewhere [23].

4. Results and Discussions

4.1. Batch Grinding

Batch grinding tests with the narrow size samples (3350–2360 µm and 150–106 µm) that were conducted for short time durations (Figure 3) allowed for plotting the results as zero order production rates [3]. From grinding data after only one minute, the feed size breakage rate functions for the two sizes analyzed were obtained. Figure 4 shows these estimated cumulative breakage distribution functions, which demonstrates the non-normalizable form of the ore breakage pattern. This non-normalizable ore breakage pattern may be explained by the presence of silica in the ore, mainly in the coarse fraction, which characterizes a heterogeneous material. Such response may also be explained by the weak intergranular bonding among the individual grains that make up this type of iron ore [24], leading to a depletion of material in selected size ranges and the accumulation in others. The result is that the breakage distribution functions may not be normalized with respect to the feed-size material. As such, an estimation scheme that was based on interpolation between the two breakage distribution functions was proposed, given the difficulty of performing experiments with each size contained in the feed. Figure 5 compares the measured data to the interpolated results, which accounted for this non-normalizable character of the ore. Indeed, the non-normalizable breakage response has also been found in other materials, as evidenced from single-particle breakage data [25].
On the basis of the measured non-normalizable breakage function, the parameters in the selection function (Equation (4)) were estimated for the individual tests while using the “similar fineness of grind” method [8]. Through this method, batch grinding times that more closely corresponded to the specific grinding energy of the pilot-scale and industrial mills were selected for model fitting. Figure 6 gives an example, which demonstrates the good fit of model and experiments. In all cases, only two parameters of the polynomial selection function (Equation (4)), namely S1E and ζ1, were required to fit the data. The addition of more terms in Equation (4) did not improve the model fit to the data. This may be explained by the relatively fine size distribution of the feed in comparison to the ball size distribution.
Figure 7 presents a comparison of the estimated specific selection functions for selected tests, which demonstrates the effect of percent solids in the slurry for 100% of slurry filling. It shows that increasing the percent solids increases the breakage rates of the finer material and lowers the coarser, which partially contradicts the results from earlier studies [18,19]. The values of the two parameters S1E and ζ1 are now presented in Figure 8 and Figure 9, respectively. They show that the maximum values of both parameters are found to vary with slurry filling and slurry concentration. They also show some similarity with the results from earlier studies [18,19], but only at the higher slurry filling. Indeed, at the higher slurry filling studied, the lower percentage of solids will result in higher breakage rates for the finer particles. On the other hand, at a lower slurry filling, the higher solids concentration will result in higher breakage rates of the finer particles. This behavior indicated that the combination of these two variables has significant impact on the specific selection function, which was not clearly identified in earlier studies in the subject [18,19]. The optimal combination of these could contribute to improving grinding process performance.

4.2. Residence Time Distributions

The number of mixers-in-series was estimated from the RTD measured while using lithium chloride as tracer and the mixers-in-series models given by Equations (7)–(9). The least squares best fit parameters were estimated while using a code that was written in Matlab software. The comparison between experimental data and fitted RTD models for a selected pilot test is presented in Figure 10, while Figure 11 shows the result from the industrial mill. Parameters of the mixers in series models (Equations (7) and (8)) have been fit to data from the pilot-scale and full-scale tests, and Table 3 presents a summary of the model parameters. The results show that a direct relationship appears between the mean residence time and the solids concentration in the feed. The industrial mill was best modeled with one mixer and the data related with the closed circuit (points after 35 min. shown in Figure 11) were disregarded in this modeling, since the tracer returns to the mill via hydrocyclone underflow (Figure 2).
From Table 3, it is also evident that whenever overflow discharge was used, the slurry fillings were higher, ranging from 139 to 245%. The table also shows that the total residence time of the liquid (τ), from fitting the tracer data, was similar to the mean residence time of solids in the mill, as estimated from the ratio of final mass of solids in the mill and the feed flowrate of solids. This demonstrates the validity of using the residence time distribution measurements from the liquid to describe that of the solids for the mill in question.

4.3. Scale-Up from Batch to Pilot-Scale

The validation of a model is critical to know whether the simulation is an accurate representation of the real system considered. Comparing the simulation results to what is generally accepted in the real system carries out the validation. As such, to validate the use of the population balance model as a predictive model capable of optimizing a continuous mill, the breakage function and selection function parameters fitted to data from the batch mill were used to predict the performance of the pilot-scale mill for different percent solids and slurry fillings.
Figure 12 summarizes the approach that was used in simulation. The residence time distribution, the mill power, and the feed size distribution were required, in addition to the selection and breakage functions fitted to batch data, to predict the size distribution of the mill discharge. Table 3 summarizes the pilot mill operating conditions and the RTD model parameters.
A first attempt was made to predict the product size distributions from the pilot mill while using data collected in batch tests at equivalent percent solids in the slurry. However, the experimental and predicted product size distributions of the mill product differed for most of the tested conditions. The model predictions resulted in product size distributions that were finer than those that were obtained in the pilot mill experimental tests. This difference could potentially be attributed to liner design that influences the motion of the media and that could have caused a vertical shift in the selection function for any given percent solids. Another assumption is that this difference could be also attributed to the mismatch between the slurry filling levels that were used in the batch experiments and the actual values found in the pilot mill, which were in the range of 89 to 245% (Table 2), whereas the batch tests were carried out at either at 100% or 260% of slurry filling. The validity of the second one can be confirmed from the good correspondence between experimental and predicted results that are shown in Figure 13. In this test condition, the pilot mill was configured with grate discharge instead of overflow discharge. With this configuration, the slurry filling was approximately 89% under steady-state conditions. As such, the pilot mill discharge size distribution was predicted based on the specific selection function estimated when considering grinding data from a batch test that nearly matches the solids concentration (76%) and the slurry filling (100%) (Figure 6). In this case, the SiE was estimated based on the data from the feed, 16 and 20 min of grind to follow the similar fineness methodology [8], while using the specific selection function parameters ζ1E = 0.85 and S1E = 4.079 (kWh/t)−1.
Now analyzing pilot plant data gathered from a test at higher slurry filling (pilot test P3 at 79% solids and 245% of slurry filling, with overflow discharge), the discharge size distribution was predicted while using the specific breakage parameters that were estimated from the batch test condition with 80% solids and 260% of slurry filling. Figure 14 demonstrates the correspondence between the experimental and predicted results, once again showing that the slurry filling influenced grinding kinetics, besides material transport through the mill.

4.4. Scale-Up from Pilot to Industrial-Scale

The specific selection functions estimated based on batch experiments needed to be fitted on the basis of the pilot-scale experiments, since most slurry fillings tested in the batch mill were somewhat different from those tested in the pilot mill, as well as the industrial mill. As such, it has been assumed that the industrial mill operates with similar slurry filling to the pilot mill in the case of overflow discharge.
The parameters of the specific selection function were back-calculated by fitting the measured size distribution of the mill discharge from the pilot-scale tests, on the basis of the non-normalizable breakage function estimated from the batch tests (Figure 4). This resulted in the pairs of parameters ζ1* and S1E*, which varied as a function of slurry density, besides slurry filling, as shown in Table 4. It shows that the specific breakage rates curve becomes shallower, as slurry concentration increases, that is, the lower the specific breakage rates of the coarser material.
The parameters in Table 4 were then used to predict the discharge size distribution of the industrial mill, following the procedure schematically presented in Figure 15.
The residence time distribution, the mill power, and the feed size distribution were then required in each simulation. The RTD and the number of mixers-in-series were determined while following the same procedure used in the pilot mill experiments, as described previously.
In the simulations, the performance of the hydrocyclones was kept constant, equal to the average partition curve that was observed for the plant surveys (Figure 16). This assumption was considered as valid, since water addition to the hydrocyclone sump (Figure 2) would allow for maintaining the slurry concentration to the hydrocyclones feed constant and the number of spare hydrocyclones in the cluster would make it possible to compensate for any effect of increasing slurry flowrate in their inlet pressure. The closed circuit was simulated while using the Estimill program [5] when considering the partition curve estimated on the basis of data from the industrial mill sampling campaigns.
The quality of the iron ore pellet in the pelletizing process is directly related to the amount of fines that are contained in the mill product (mainly represented by the cumulative passing 45 microns) [26]. As such, the predictive capability of the PBM approach was assessed through comparison between the predicted amount of −45 microns in the discharge of the mill as a function of solids concentration in its feed and the values that were collected from the industrial surveys. It was chosen to analyze the mill discharge rather than the hydrocyclone overflow, since the circulating load in the simulations was very similar and the performance of the hydrocyclones was maintained constant, as is common in a closed-circuit configuration.
Full-scale industrial data were obtained from three sampling campaigns. The average predicted results from these three sampling campaigns and the experimental results are shown in Figure 17, demonstrating that the simulations provided similar results to the measured data. Figure 17 can be used to identify the optimal operating condition of the particular industrial mill when considering the iron ore type used in all experiments, which is in the range between 76 and 80 percent solids. This operational condition would be optimal for the pelletizing process, because the amount of −45 microns, which is used in the plant to characterize process performance, was the highest.
Now, keeping the product size constant at 40% passing 45 microns, the simulation results indicated that lowering the solids concentration in the mill from 83% (condition used in the industrial mill at the time of survey) to values between 76 and 80% would result in an increase in mill throughput of about 10% (Figure 18). An opposite behavior would be obtained for the specific energy consumption with a reduction in slurry density, given that mill power would be kept nearly constant. Martinovic et al. [18] at Carol Pellet Plant of the Iron Ore Company of Canada found similar results.
The good match between the experimental and predicted results demonstrates the validity of the PBM approach as a predictive method and also as a good optimization methodology for the industrial mill. The simulated results indicated that the mill operation between 76 and 80% solids (or 42 and 48% in volume) would lead to higher grinding efficiency, when considering the iron ore density about 4.34 g/cm3.

5. Conclusions

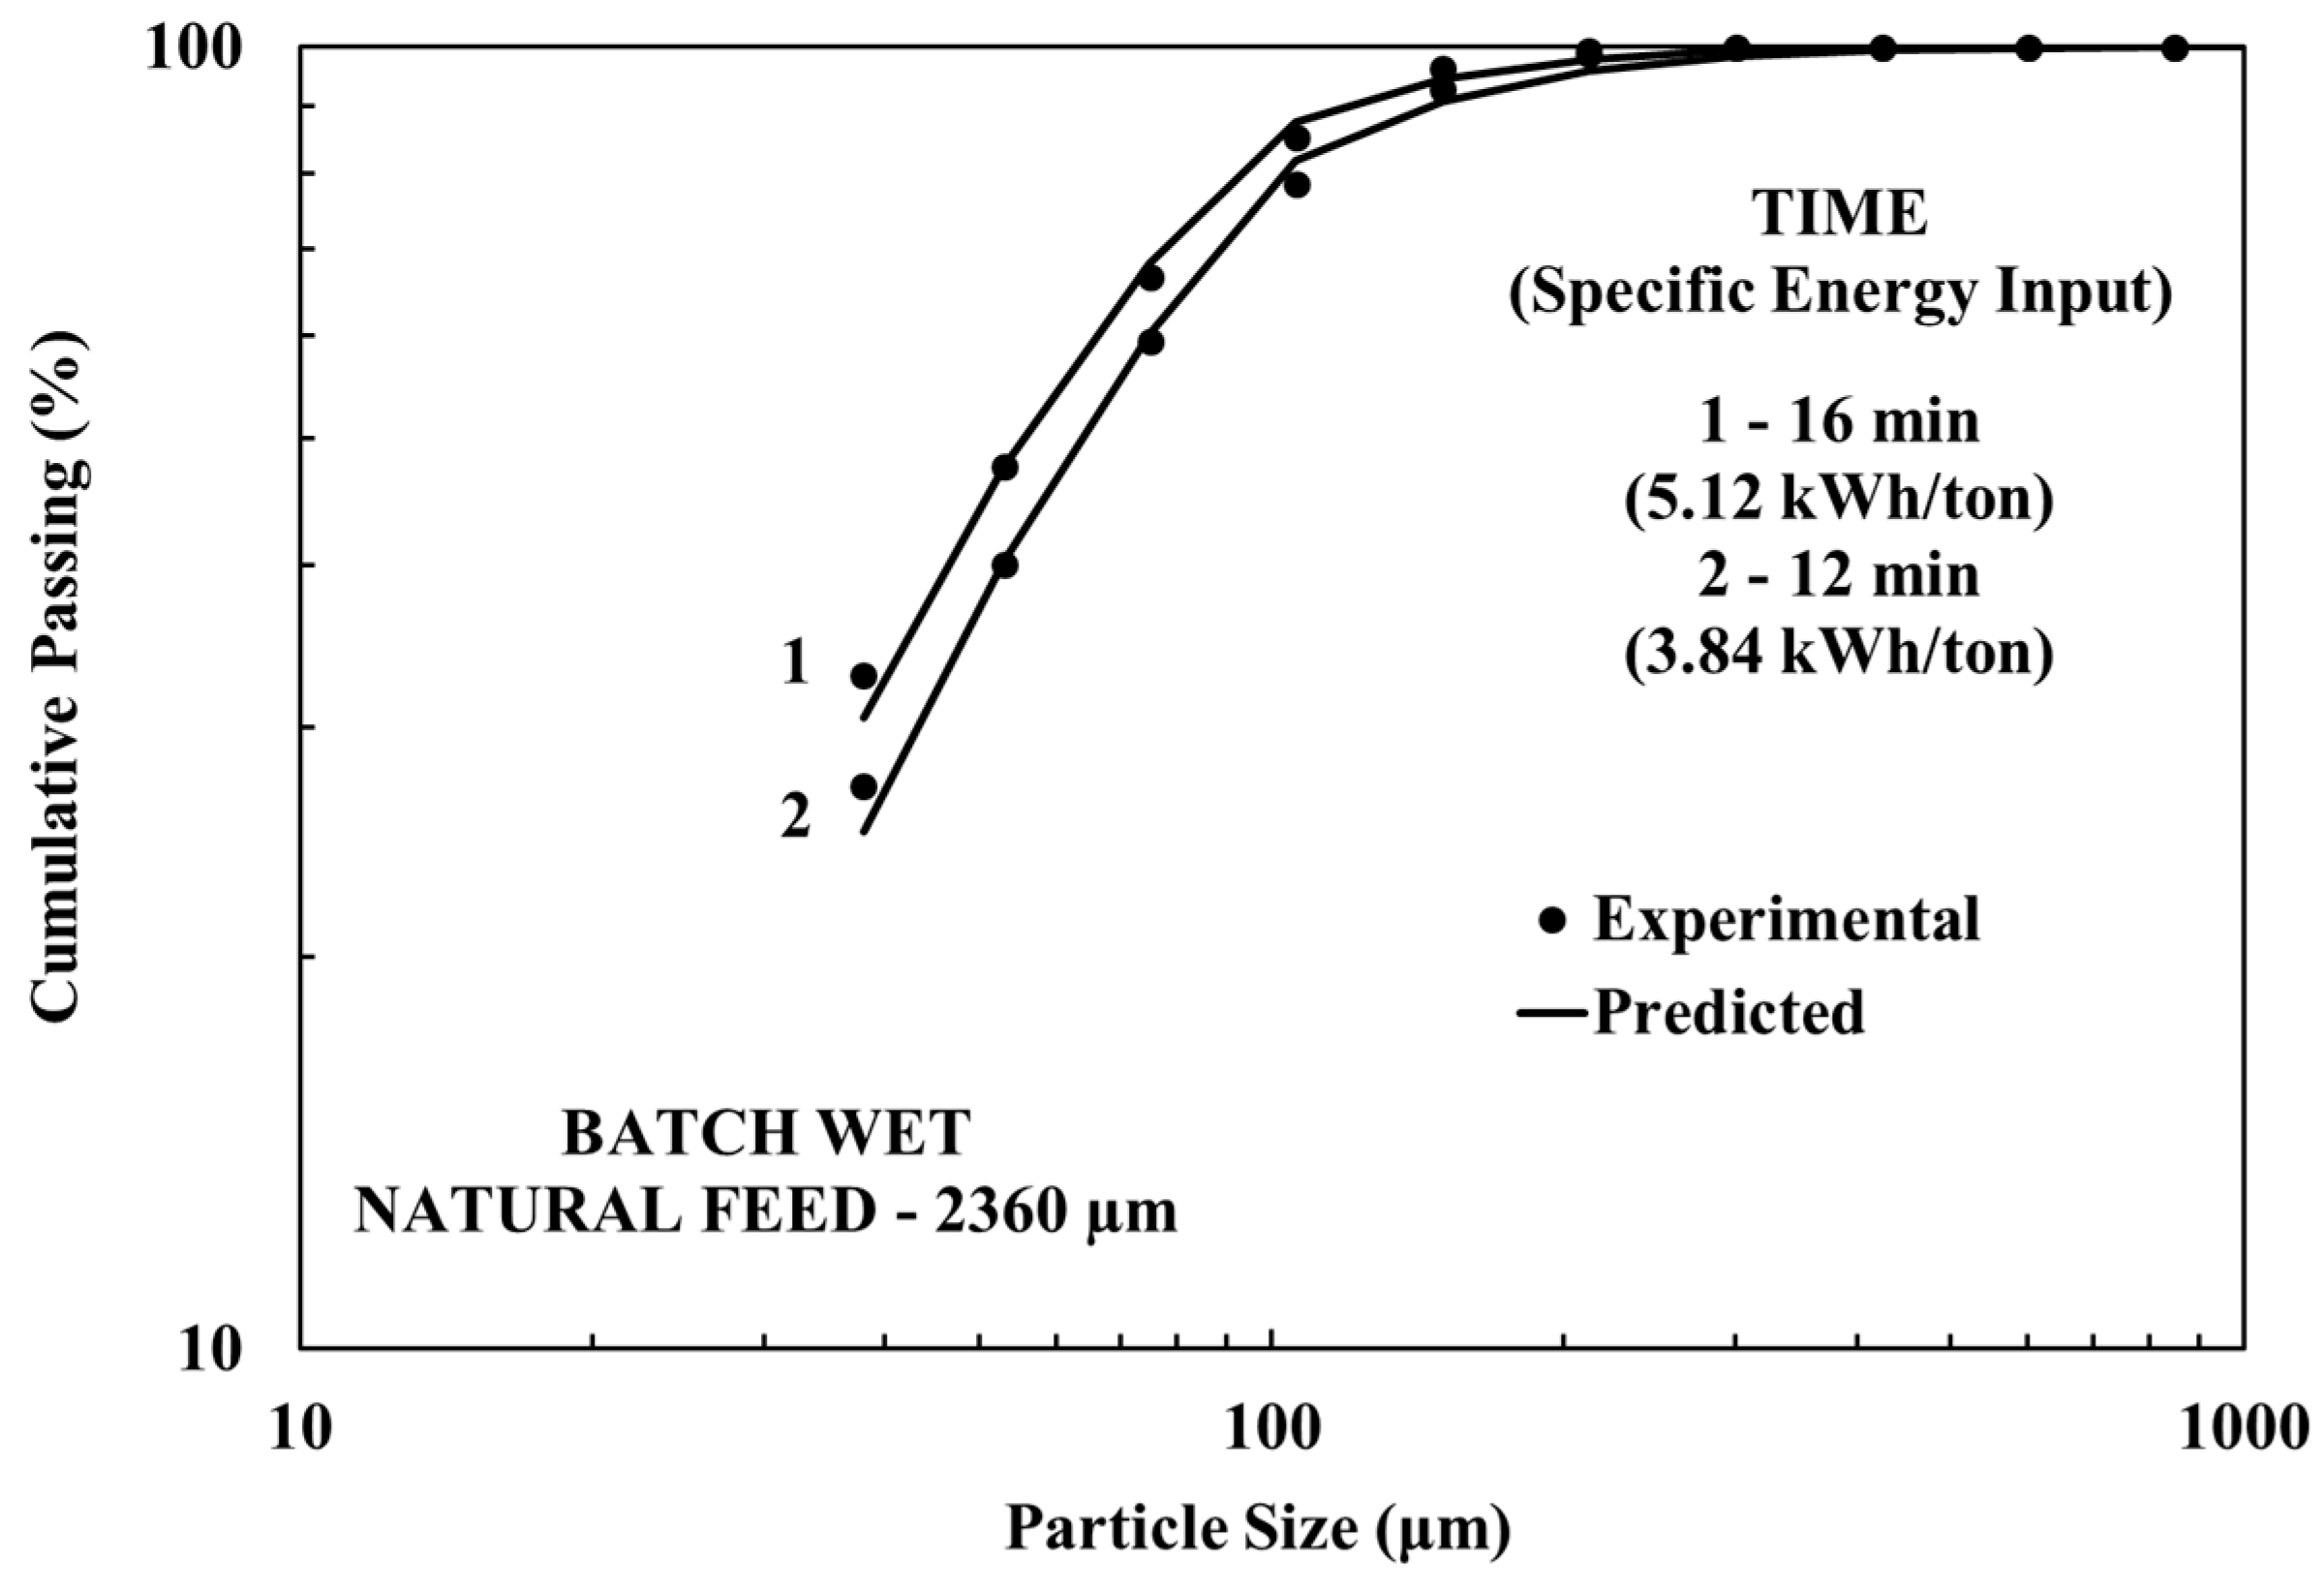
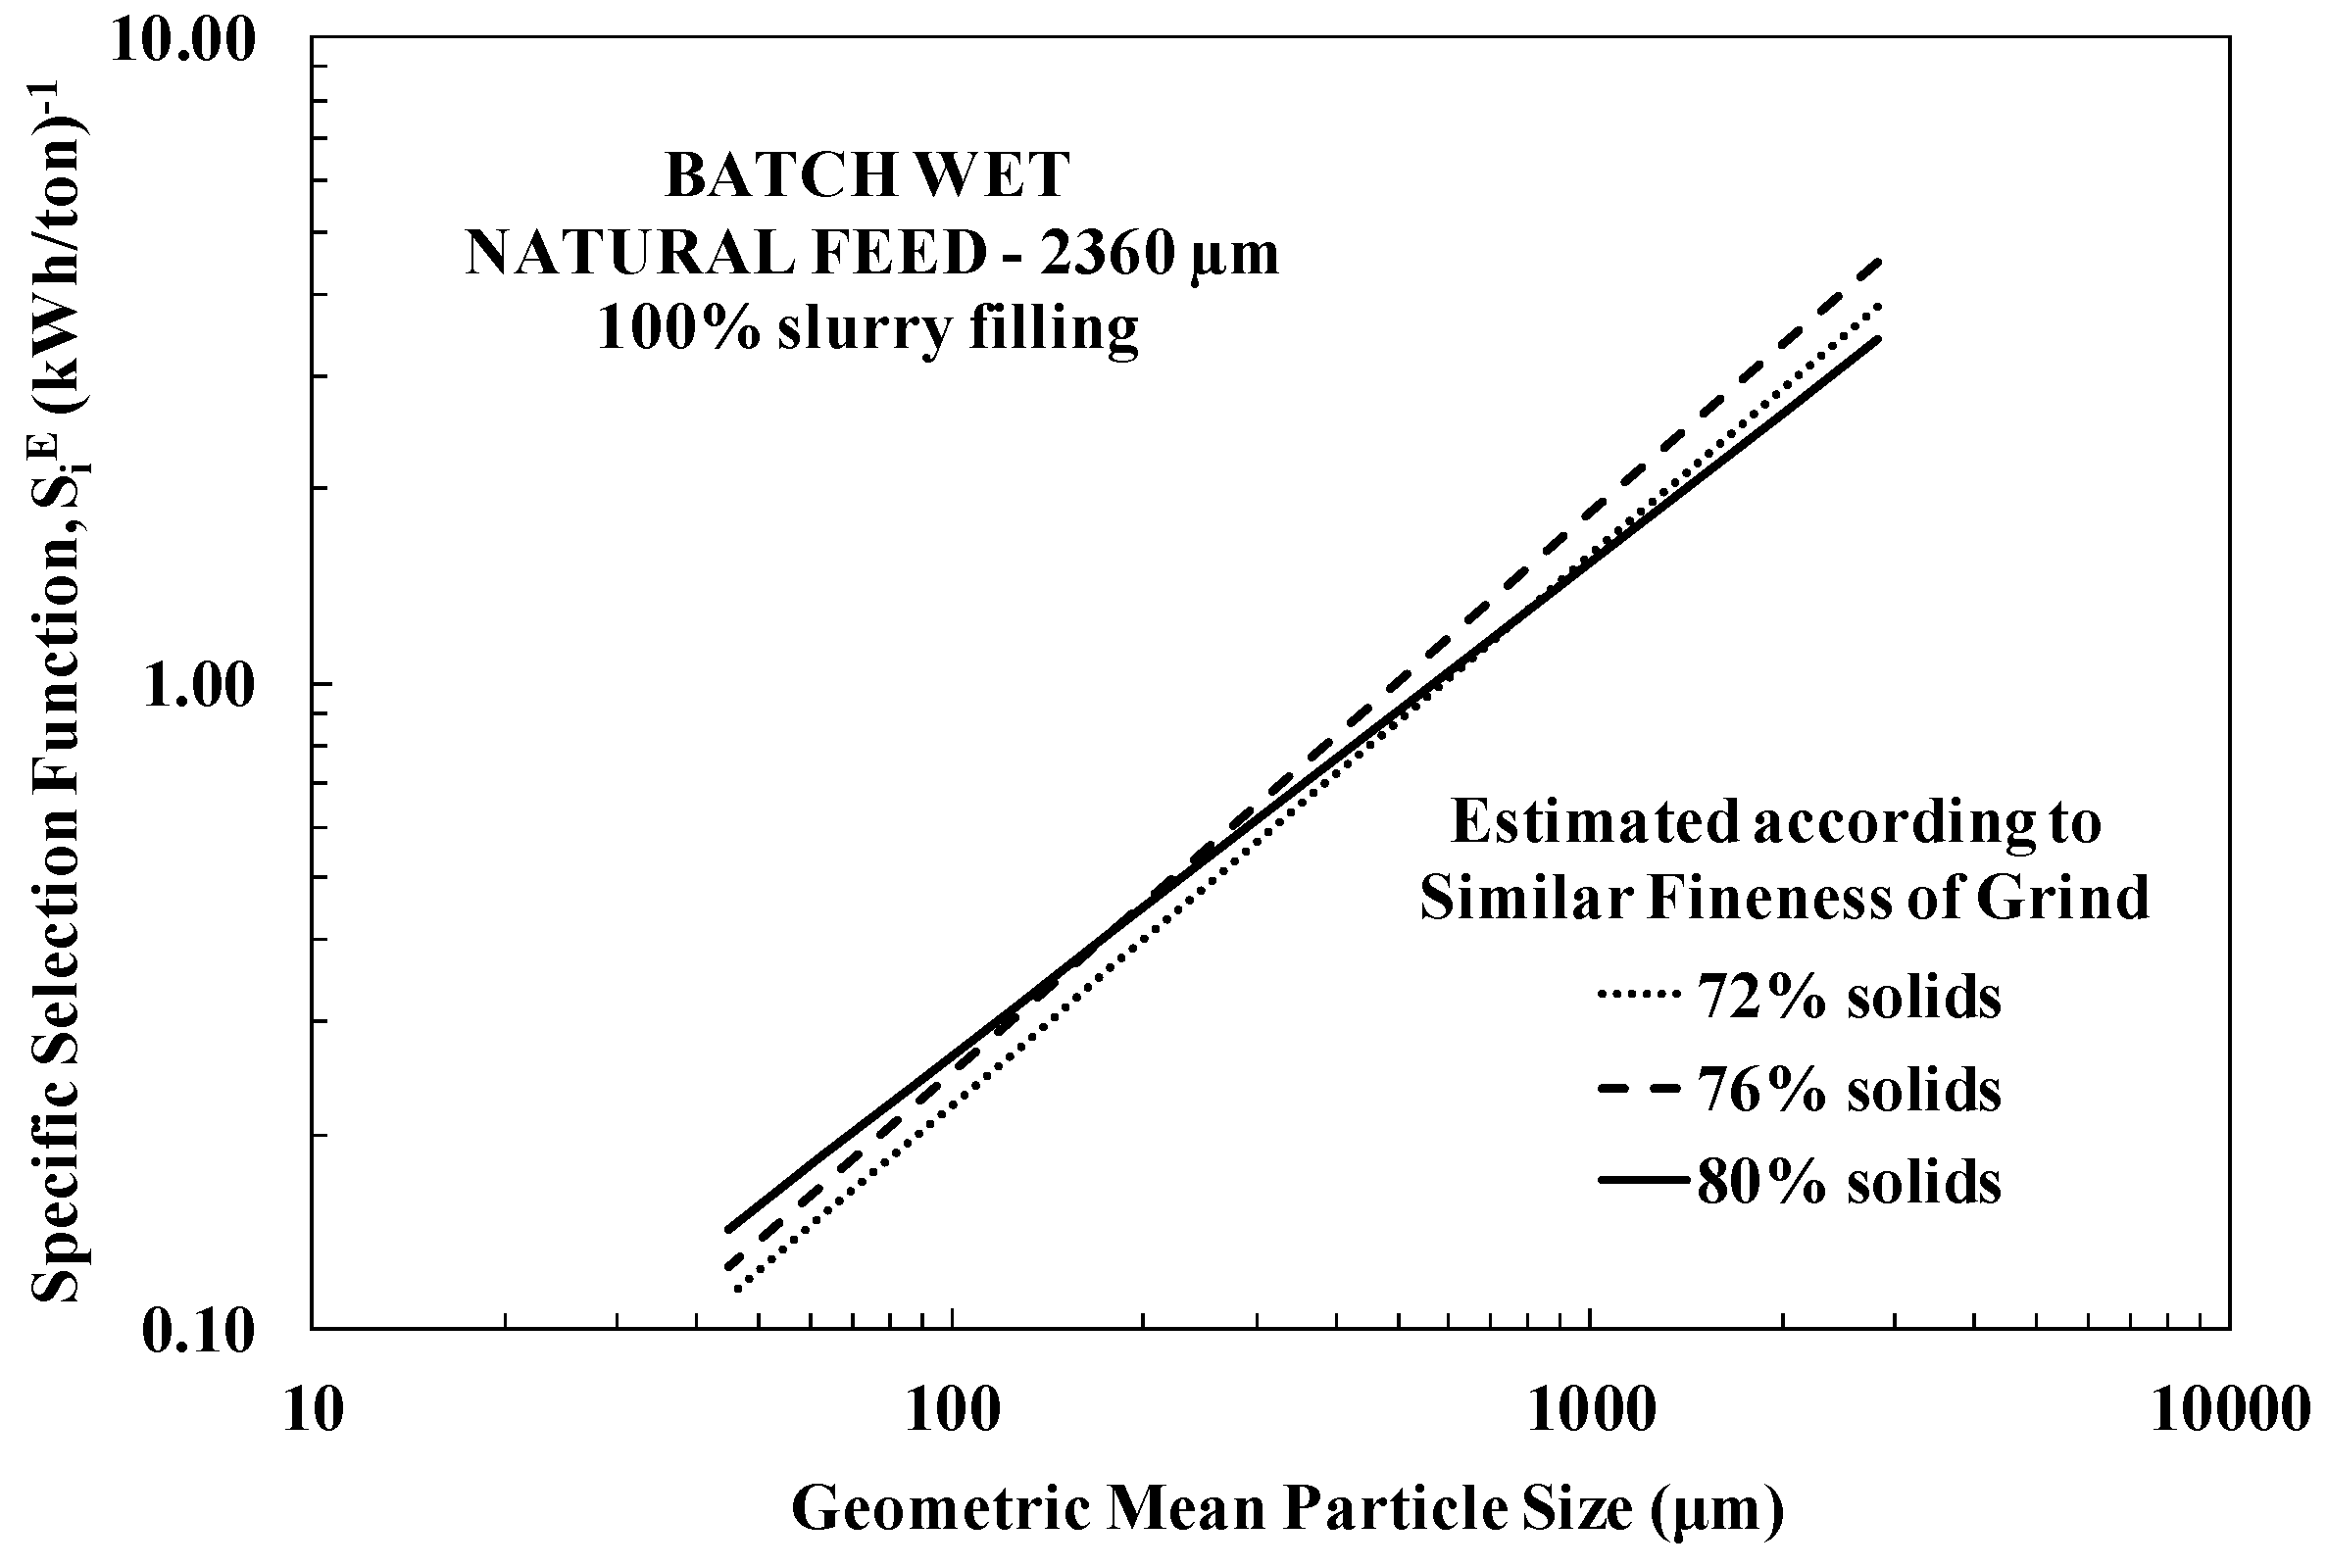
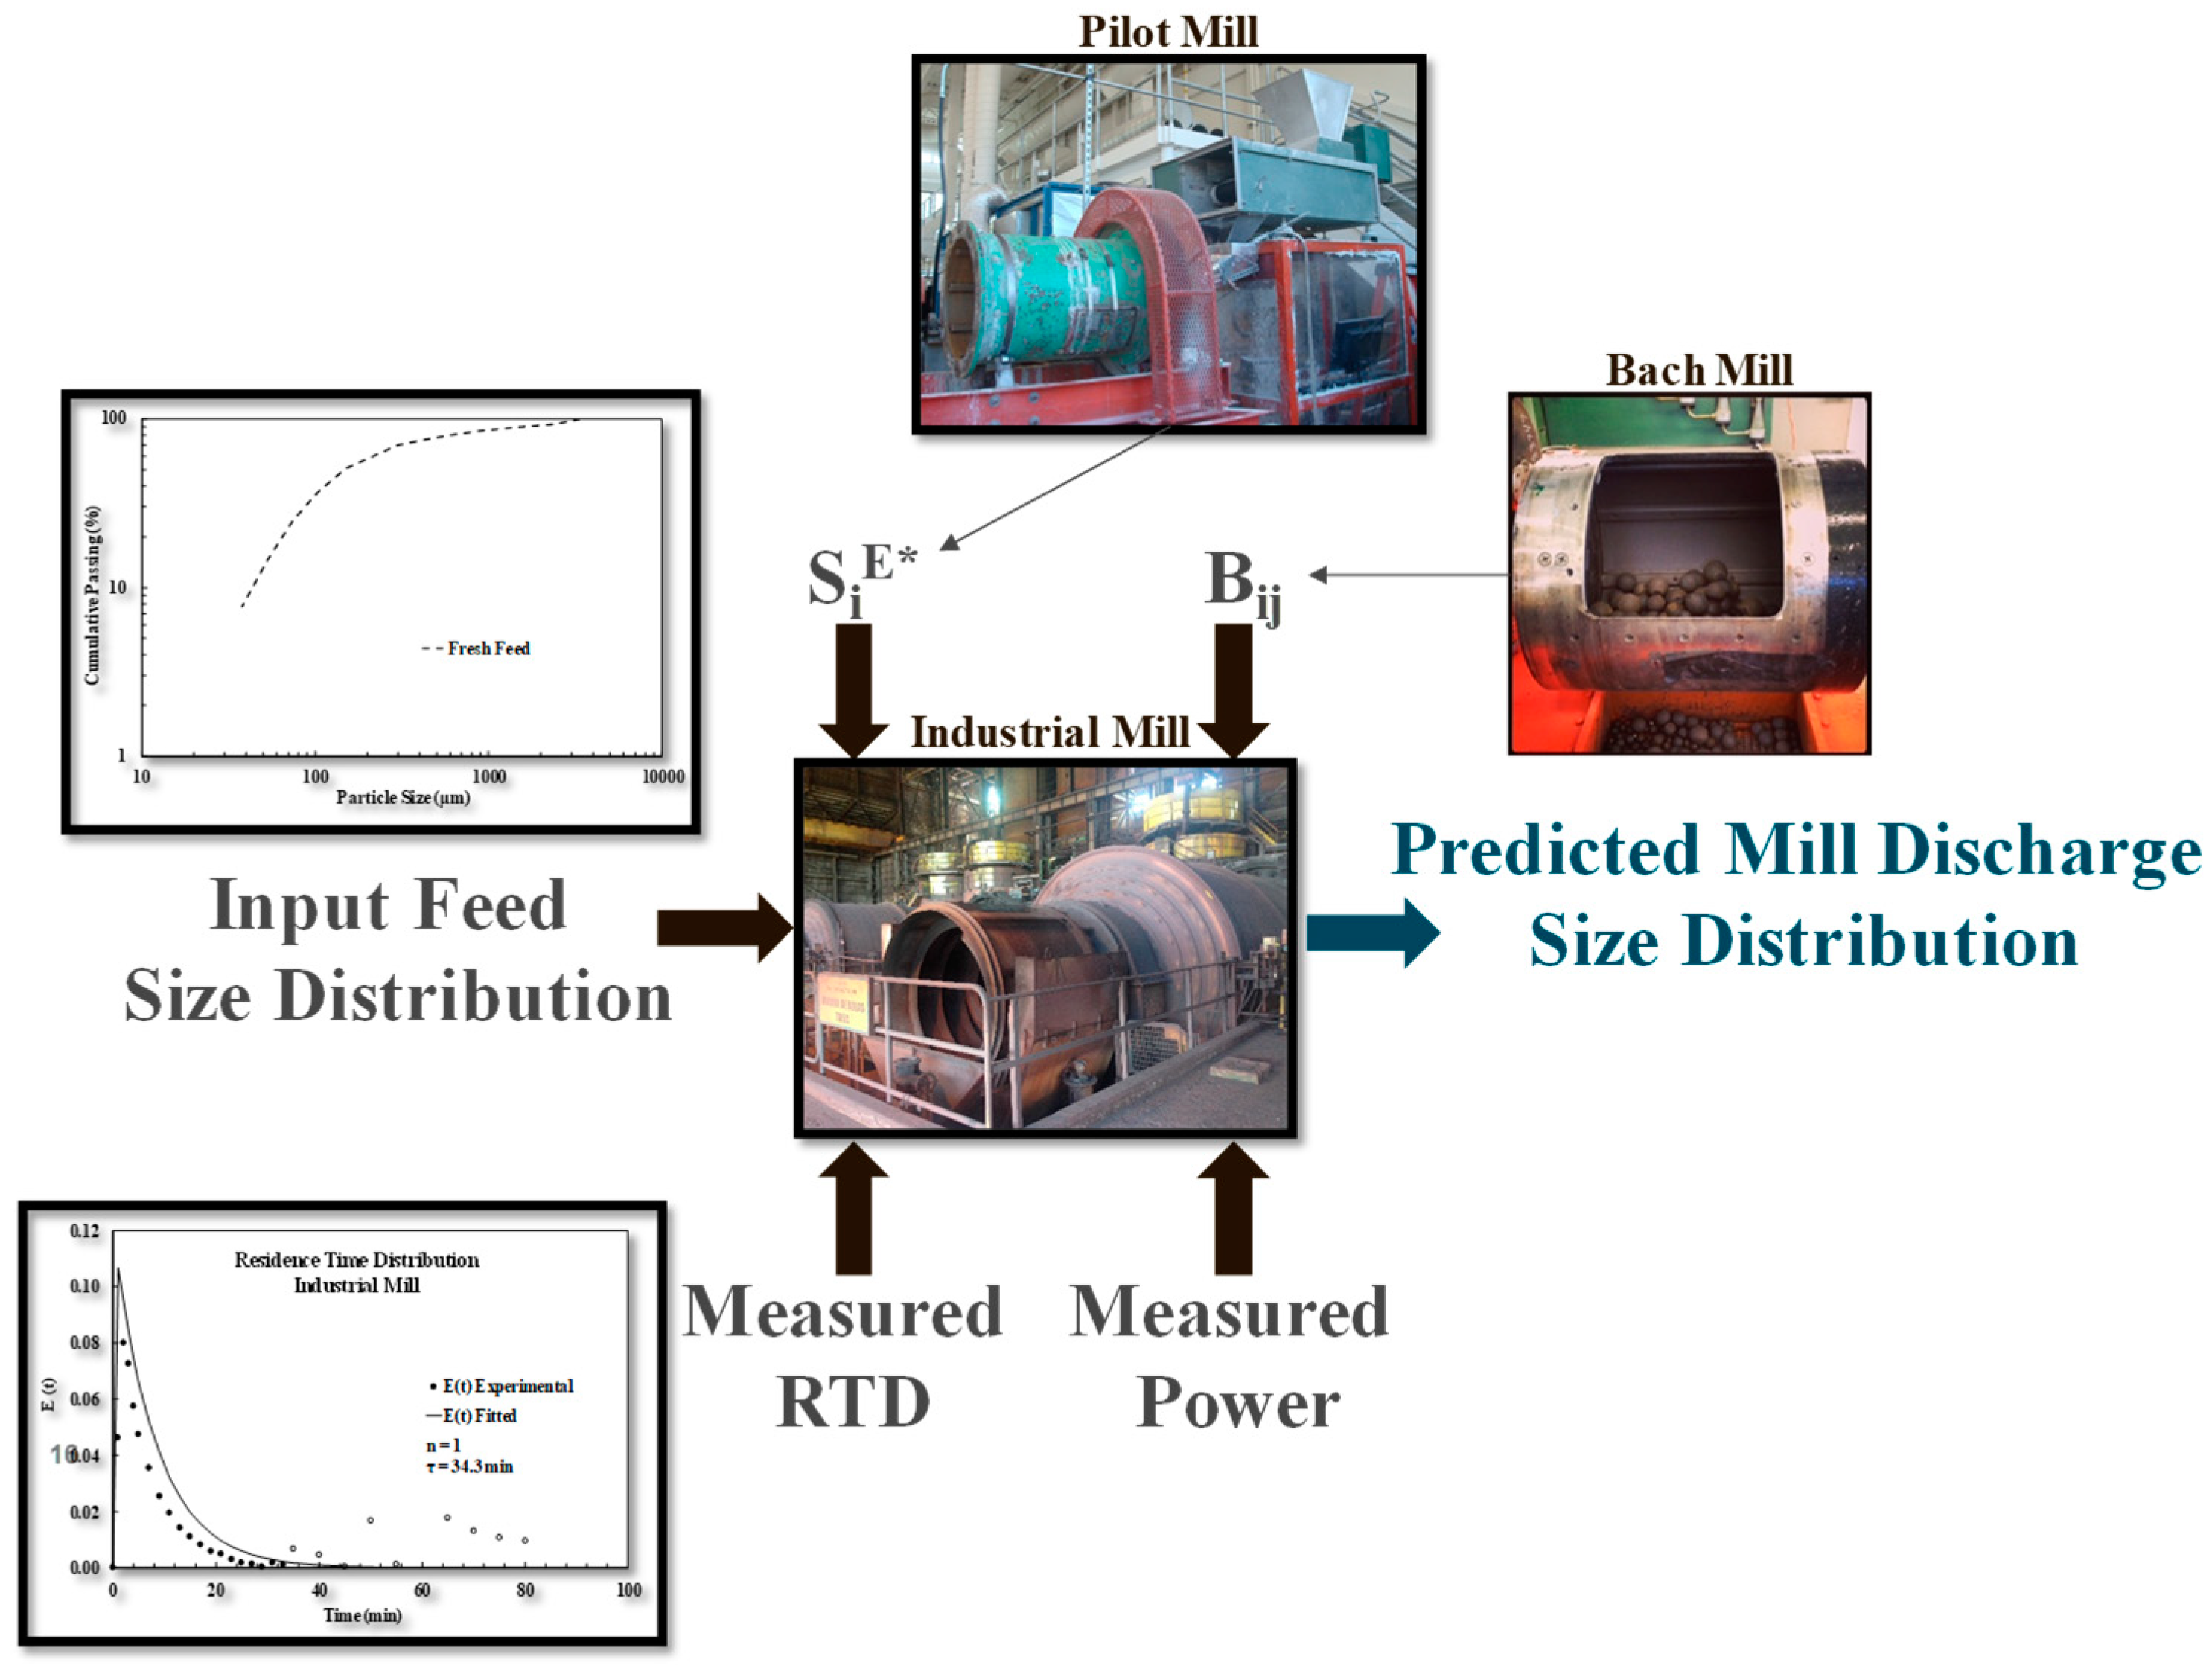
Fitting the population balance model of batch grinding to data from a 25.4 cm mill in size reduction of an iron ore from Brazil resulted in unusual breakage response, that is, non-normalizable breakage functions and breakage rate distributions that varied with slurry density and slurry filling. From these, as well as the residence time distribution, it was possible to predict the product size distributions from a pilot scale mill operating in an open circuit. However, this required matching not only the slurry density in both mills, but also the slurry filling.
Afterwards, the full-scale mill performance was also predicted while using the population balance model, but that required back-calculation of specific selection function parameters from the pilot-scale mill, so as to more closely match the slurry fillings in this mill to those expected in the industrial mill.
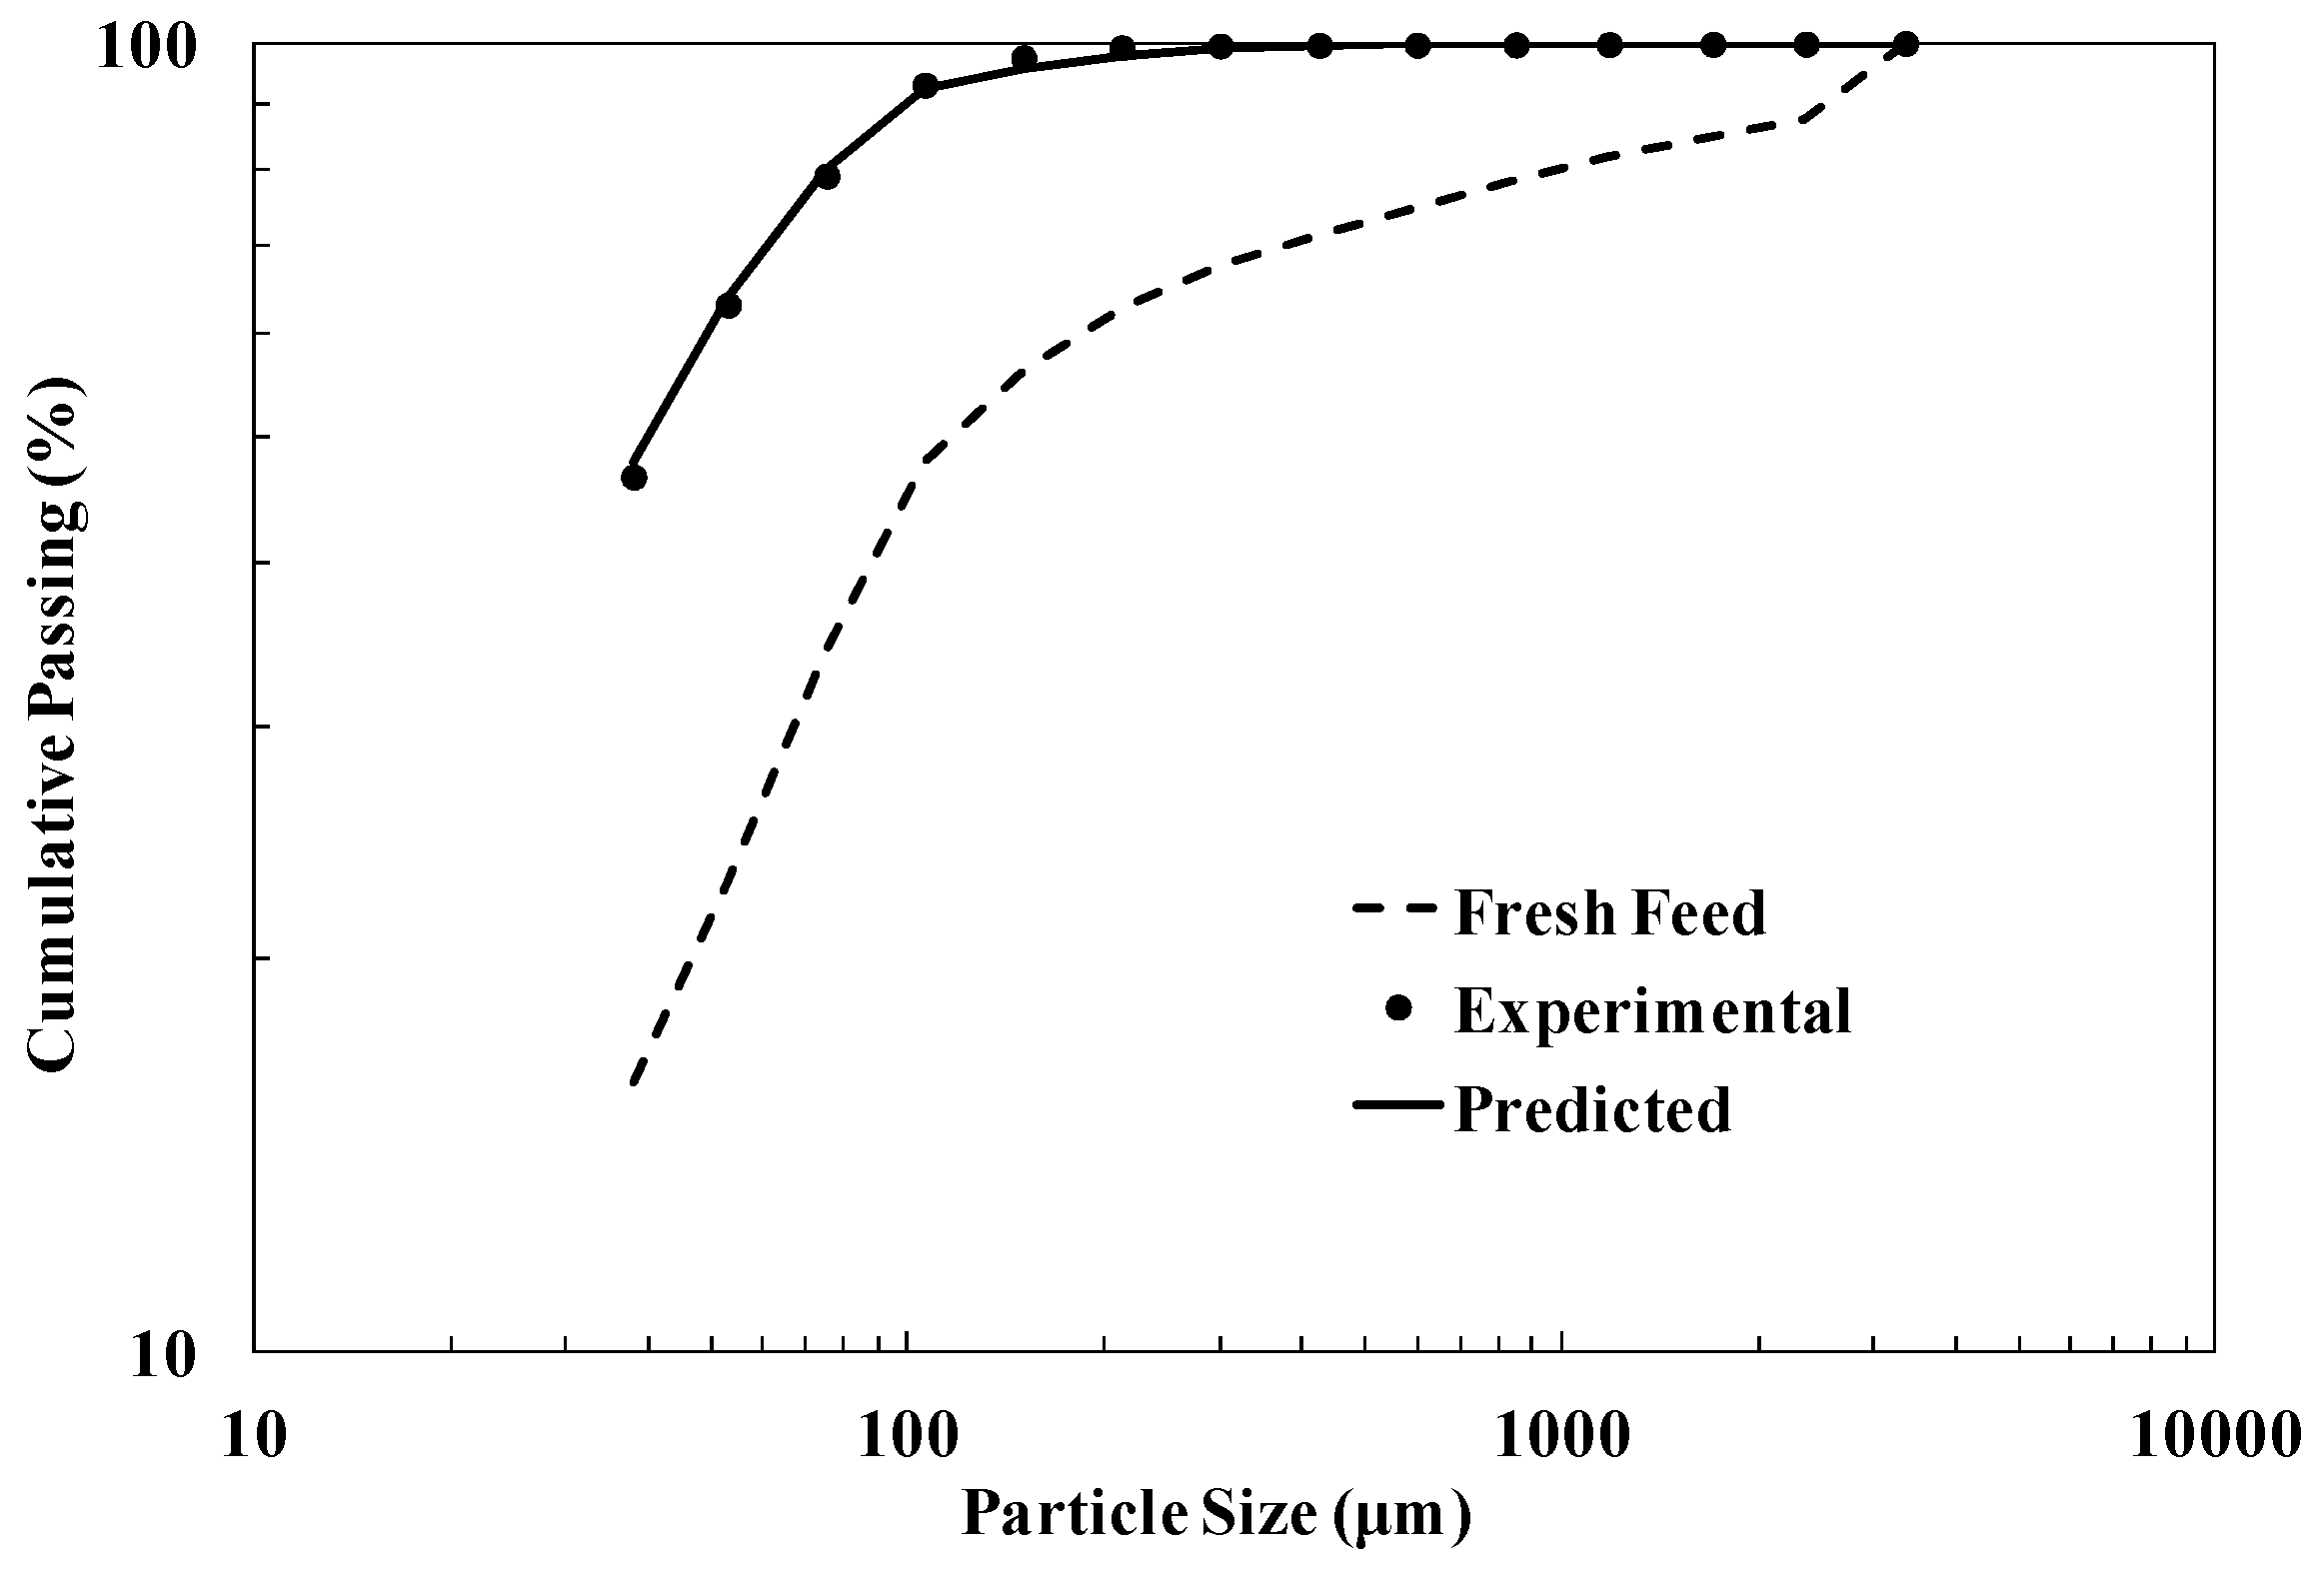
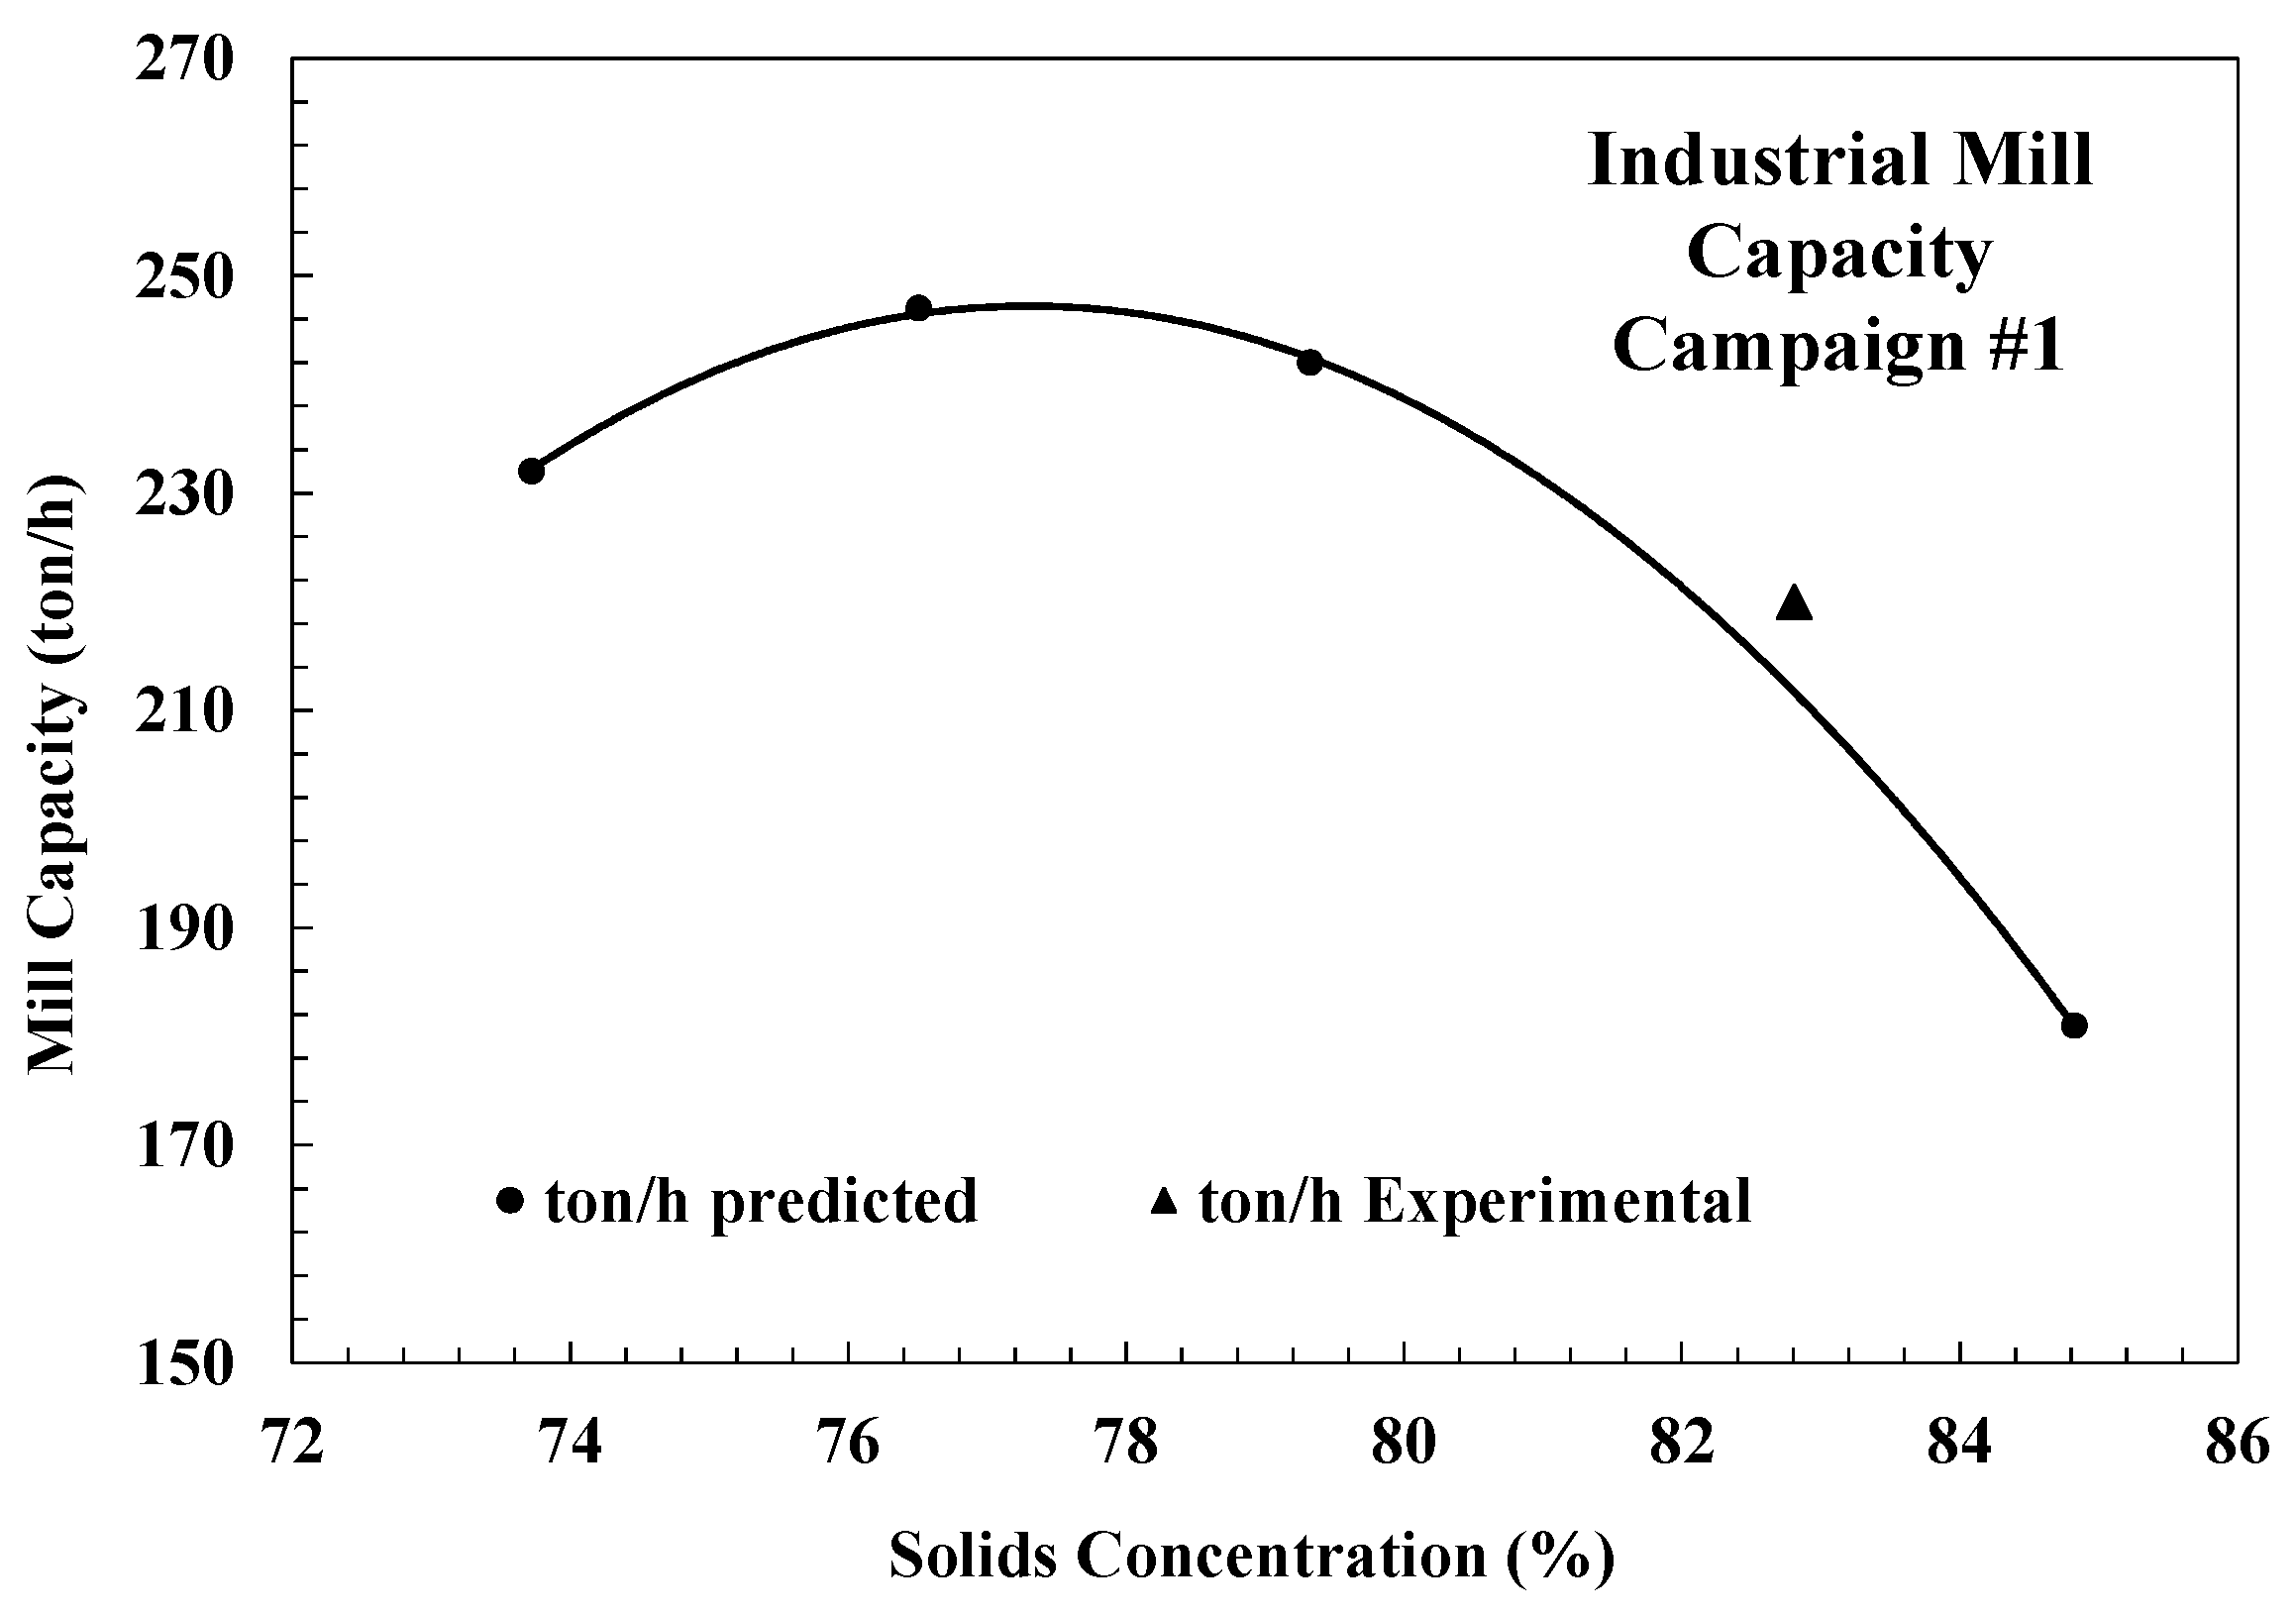
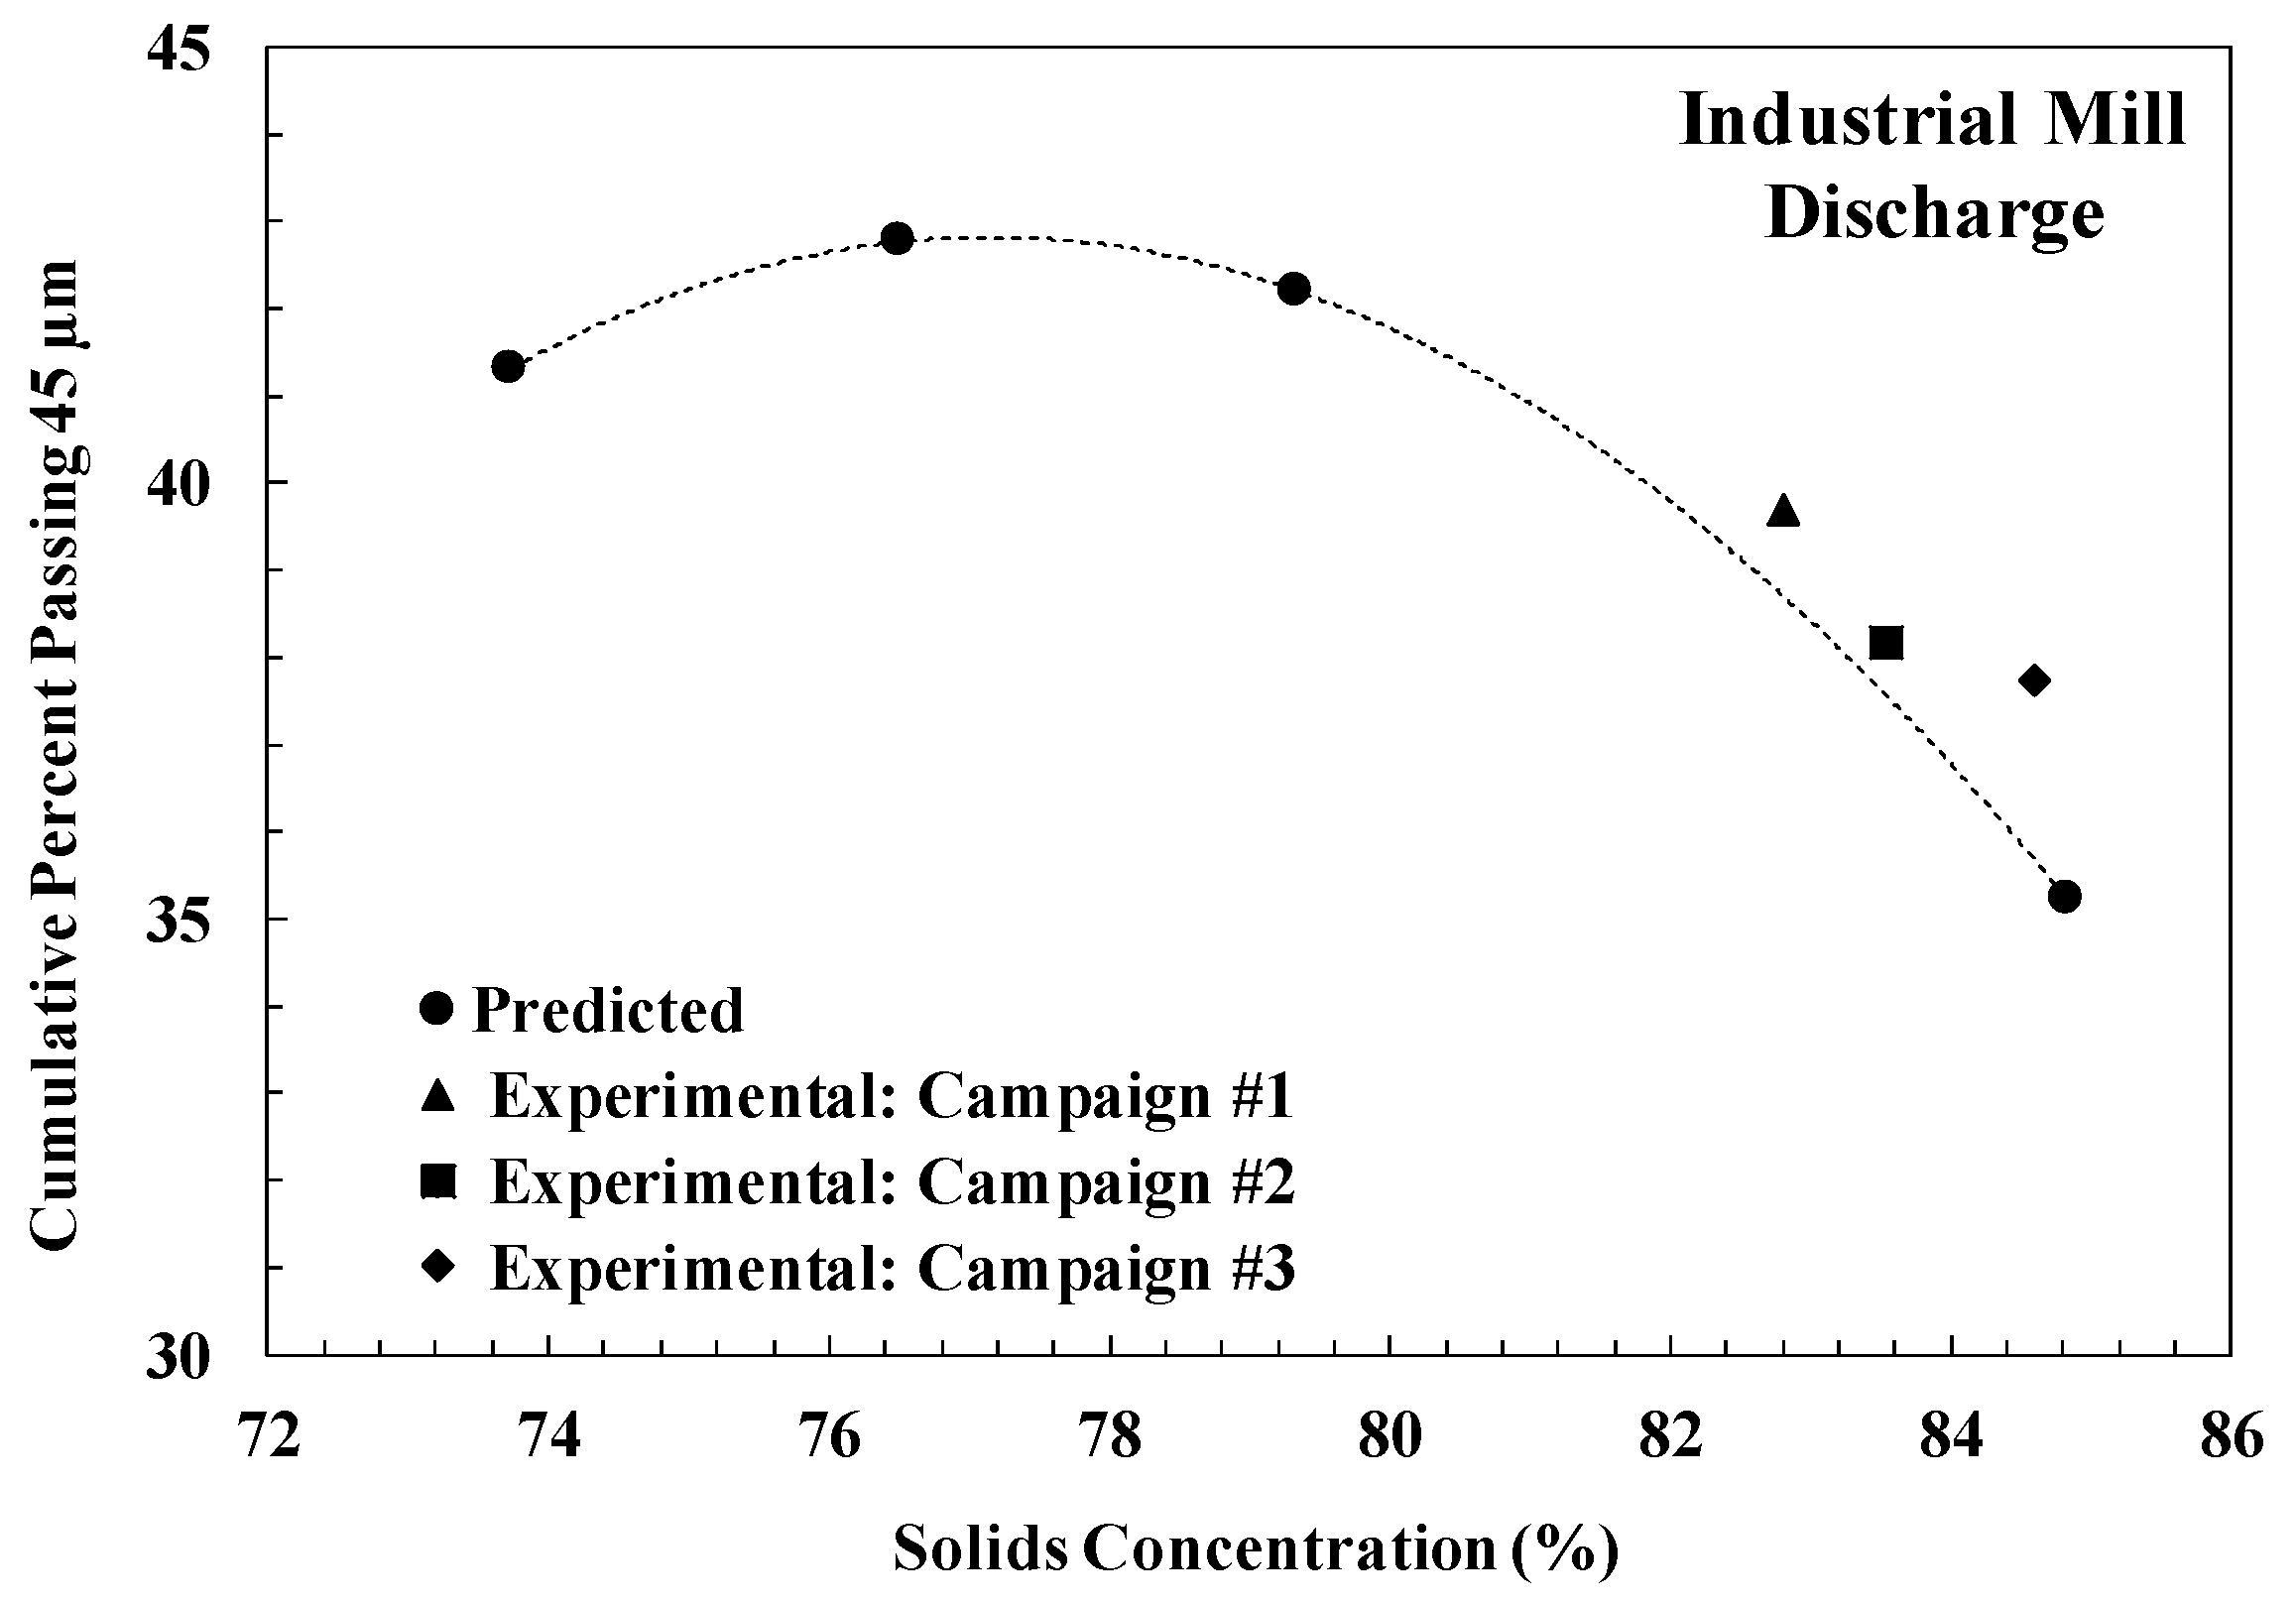
For a given size of particles contained in the mill discharge (40% passing 45 microns), the simulation results also indicated that reducing the percent solids in the industrial mill from the currently used 83% to a value between 76% and 80% would result in an increase in mill capacity of about 10%, and consequently decrease the specific energy consumption (kWh/ton) for the ore in question. Thus, the industrial mill performance could be optimized in terms of energy consumption.
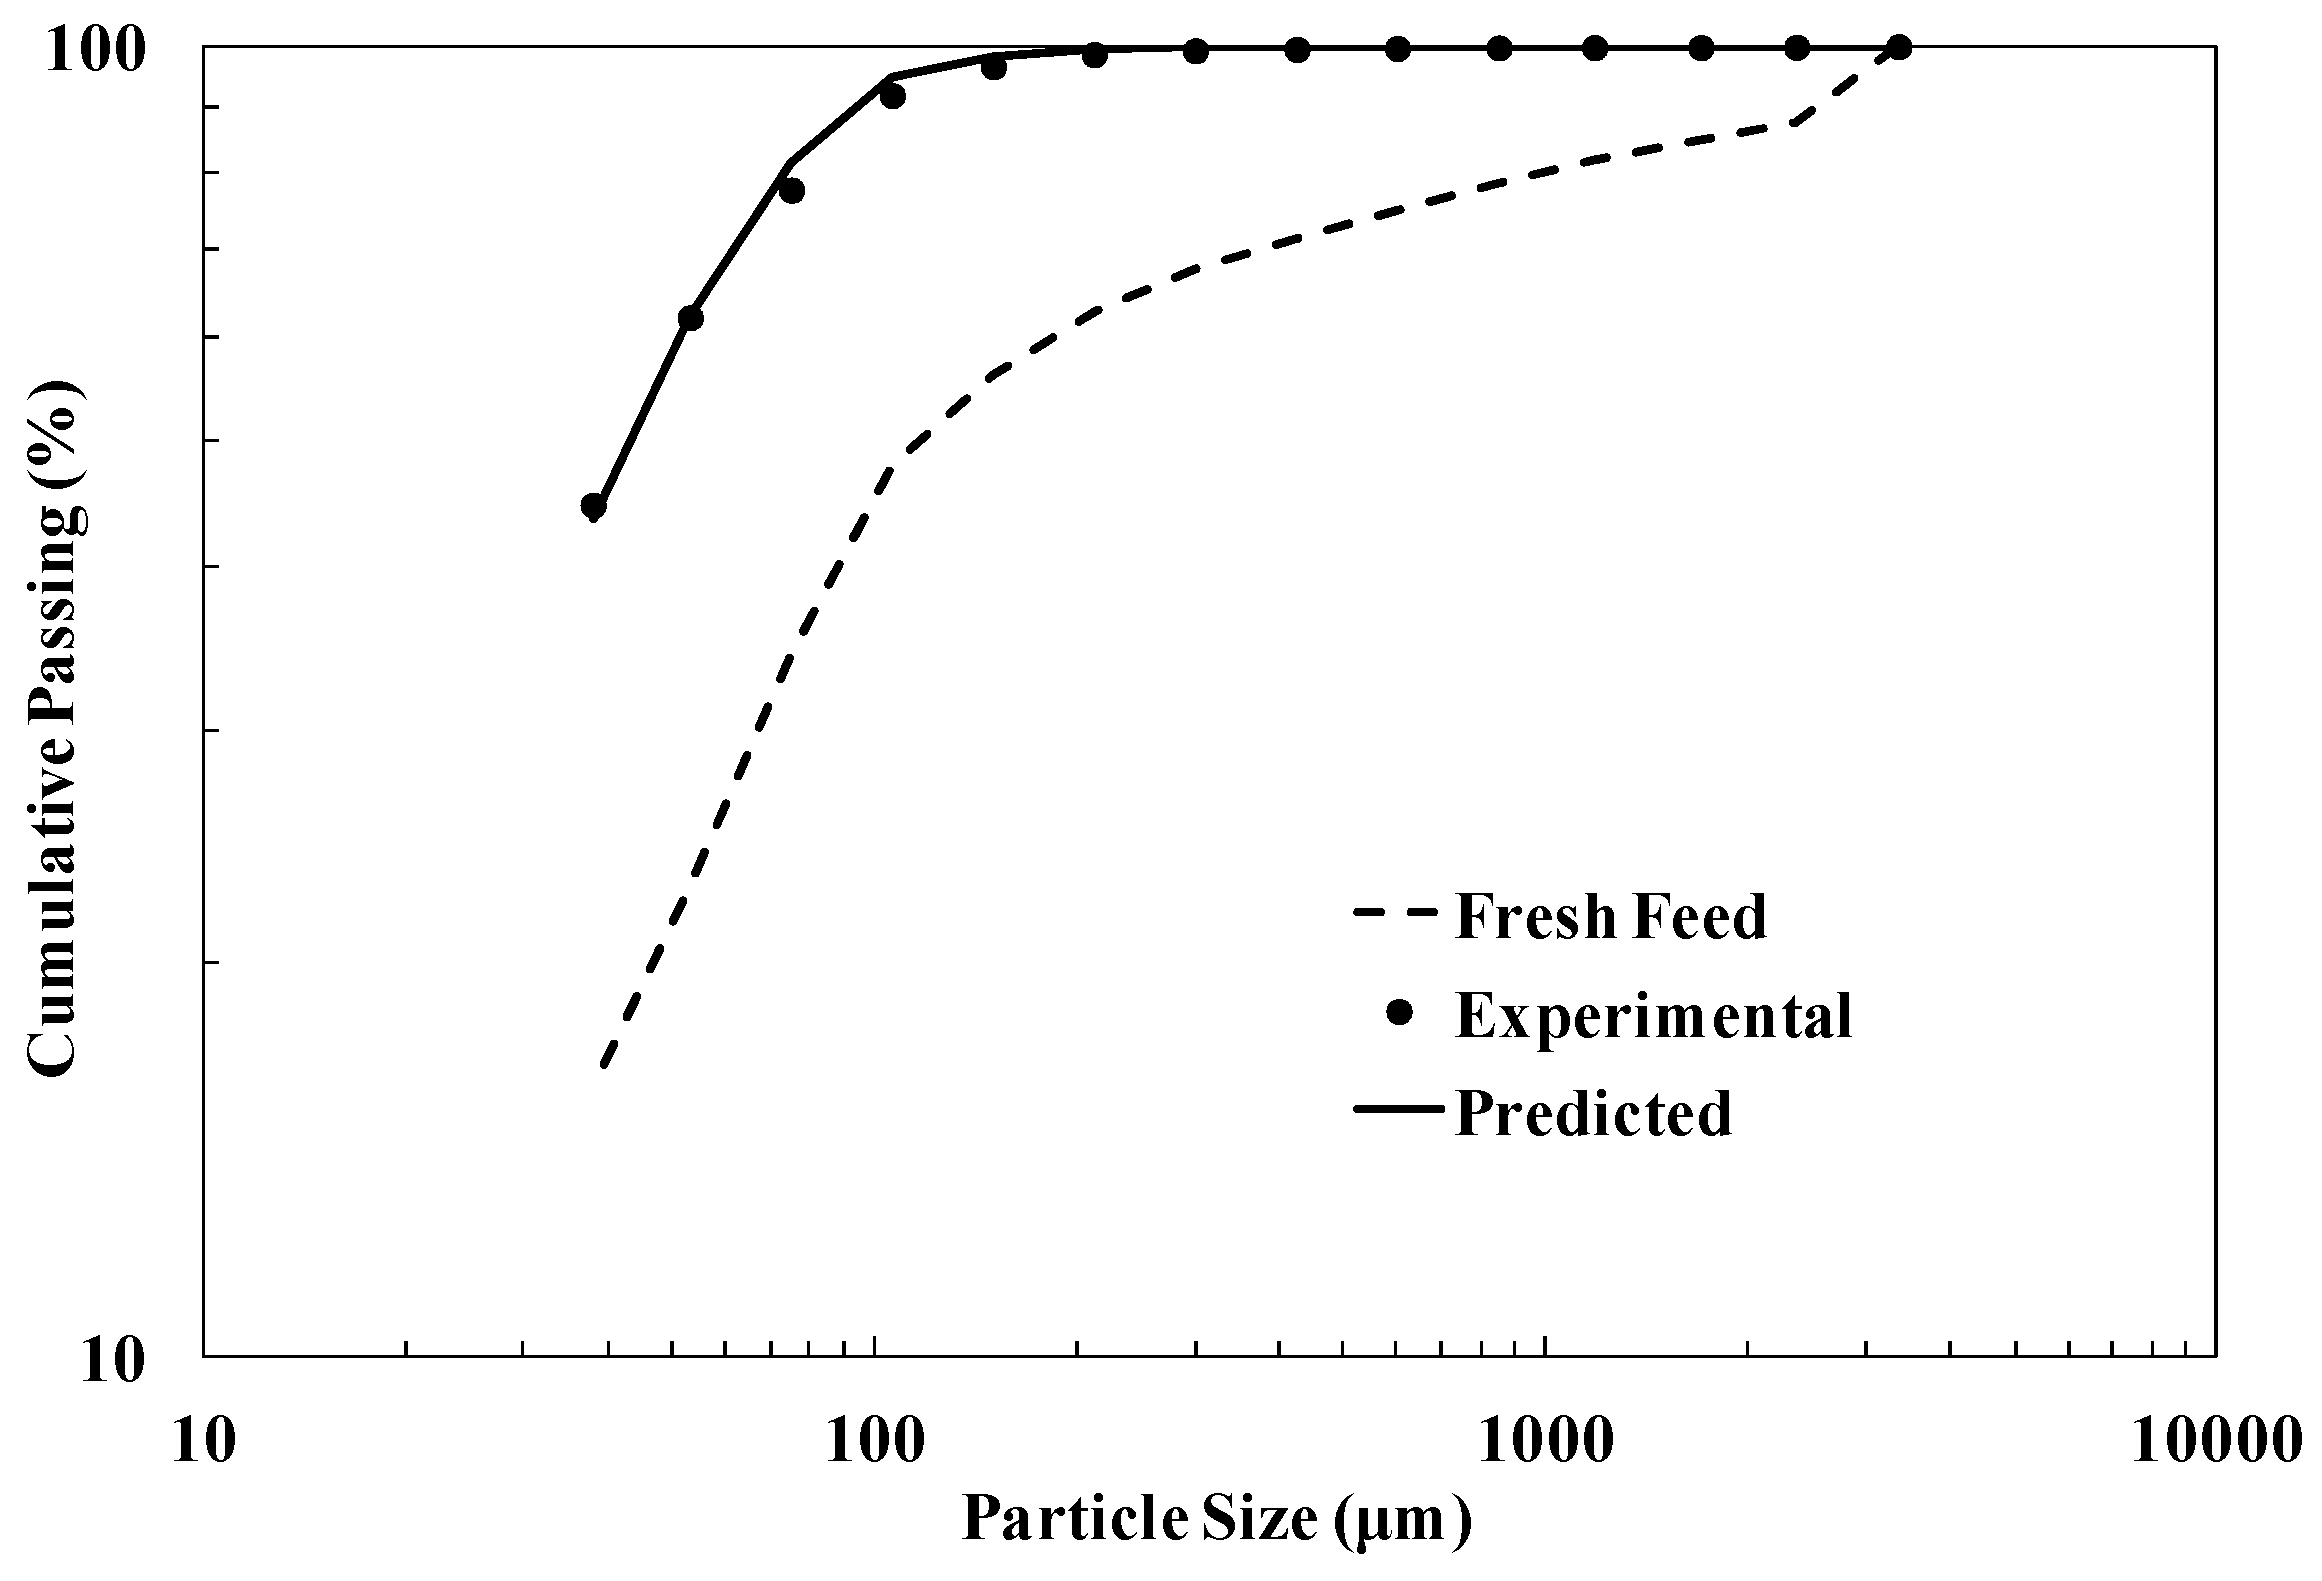
The good match between the experimental and predicted results, as shown in this study, demonstrates the applicability of the PBM approach as a predictive method and also for the grinding process optimization of a selected closed-circuit ball mill producing fines for pelletizing process.

Author Contributions

Conceptualization, P.M.C.F. and R.K.R.; methodology, P.M.C.F. and R.K.R.; investigation, P.M.C.F., R.K.R. and L.M.T.; Writing—Original Draft preparation, P.M.C.F. and L.M.T.; Writing—Review and Editing, P.M.C.F., R.K.R. and L.M.T.; supervision, R.K.R. and L.M.T.; funding acquisition, P.M.C.F.

Funding

This research was funded by Vale S.A. One of the authors (L.M.T.) would also like to thank the Brazilian Agencies CNPq (grant number 310293/2017-0) and FAPERJ (grant number E-26/203.024/2016) for continuum support to his research on the field.

Acknowledgments

The authors would like to thank Vale S.A. por permission to publish the work.

Conflicts of Interest

The authors declare no conflict of interest.

References

  1. Austin, L.G.; Gardner, R.P. Prediction of Size-Weight Distribution from Selection and Breakage Data; Rumpf, H., Behrens, D., Eds.; Proc. 1st European Symposium on Comminution; Verlag Chemie: Weinheim, Germany, 1962; pp. 232–248. [Google Scholar]
  2. Reid, K.J. A solution to the batch grinding equation. Chem. Eng. Sci. 1965, 20, 953–963. [Google Scholar] [CrossRef]
  3. Herbst, J.A.; Fuerstenau, D.W. The zero order production of fine sizes in comminution and its implications in simulation. Trans. SME-AIME 1968, 241, 538–548. [Google Scholar]
  4. Herbst, J.A.; Grandy, G.A.; Fuerstenau, D.W. Population Balance Models for the Design of Continuous Grinding Mills; Proc. X International Mineral Processing Congress; Institution of Mining and Metallurgy: London, UK, 1973; pp. 375–385. [Google Scholar]
  5. Herbst, J.A.; Rajamani, K.; Kinneberg, D.J. Estimill—A Program for Grinding Simulation and Parameter Estimation with Linear Models, Program Description and User Manual; University of Utah: Salt Lake City, UT, USA, 1977. [Google Scholar]
  6. Austin, L.G.; Klimpel, R.R.; Luckie, P.T. Process Engineering of Size Reduction: Ball Milling; Soc. Mining Engineers of AIME: New York, NY, USA, 1984. [Google Scholar]
  7. Austin, L.G. Understanding ball mill sizing. Ind. Eng. Chem. Res. 1973, 12, 121–129. [Google Scholar] [CrossRef]
  8. Siddique, M. A Kinetic Approach to Ball Mill Scale-Up for Dry and Wet Systems. Master’s Thesis, University of Utah, Salt Lake City, UT, USA, 1977. [Google Scholar]
  9. Herbst, J.A.; Fuerstenau, D.W. Scale-up procedure for continuous grinding mill design using population balance models. Int. J. Miner. Process. 1980, 7, 1–31. [Google Scholar] [CrossRef]
  10. Herbst, J.A.; Siddique, K.; Rajamani, K. Population balance approach to ball mill scale-up: Bench and pilot scale investigations. Trans. SME-AIME 1983, 272, 1945–1953. [Google Scholar]
  11. Herbst, J.A.; Lo, Y.C.; Rajamani, K. Population balance model predictions of the performance of large-diameter mills. Miner. Metall. Process. 1985, 2, 114–120. [Google Scholar] [CrossRef]
  12. Austin, L.G.; Julianelli, K.; Souza, A.S.; Schneider, C.L. Simulation of wet ball milling of iron ore at Carajas, Brazil. Int. J. Miner. Process. 2007, 84, 157–171. [Google Scholar] [CrossRef]
  13. Kown, J.; Jeong, J.; Cho, H. Simulation and optimization of a two-stage ball mill grinding circuit of molybdenum ore. Adv. Powder Technol. 2016, 27, 1073–1085. [Google Scholar] [CrossRef]
  14. Oliveira, A.L.; Tavares, L.M. Modeling and simulation of continuous open circuit dry grinding in a pilot-scale ball mill using Austin’s and Nomura’s models. Powder Technol. 2018, 340, 77–87. [Google Scholar] [CrossRef]
  15. Herbst, J.A.; Fuerstenau, D.W. Mathematical simulation of dry ball milling using specific power information. Trans. SME-AIME 1973, 254, 343–348. [Google Scholar]
  16. Herbst, J.A. Batch Ball Mill Simulation: An Approach for Wet Systems. Ph.D. Thesis, University of California, Berkeley, CA, USA, 1971. [Google Scholar]
  17. Kim, J.H. A Normalized Model for Wet Batch Ball Milling. Ph.D. Thesis, University of Utah, Salt Lake City, UT, USA, 1974. [Google Scholar]
  18. Martinovic, T.I.; Herbst, J.A.; Lo, Y.C. Optimization of regrinding ball mills at Carol pellet plant of the Iron Ore Company of Canada. Miner. Metall. Process. 1990, 7, 223–231. [Google Scholar]
  19. Samskog, P.O.; Bjorkman, J.; Herbst, J.A. Optimization of the grinding circuit at Kiruna Plant of LKAB using modeling and simulation techniques. Miner. Metall. Process. 1990, 7, 279–287. [Google Scholar]
  20. Austin, L.G.; Luckie, P.T. Methods for determination of breakage distribution parameter scale. Powder Technol. 1972, 5, 215–222. [Google Scholar] [CrossRef]
  21. King, R.P. Modeling and Simulation of Mineral Processing Systems, 1st ed.; Butterworth-Heinemann: Oxford, UK, 2001. [Google Scholar]
  22. Sepúlveda, J.E. Criterios para la selección, aplicación y evaluación de medios de molienda. In Proceedings of the I Encuentro Internacional de Procesamiento de Minerales, Antofagasta, Chile, 26–28 July 2006. [Google Scholar]
  23. Faria, P.M.C. Pellet feed grinding process optimization through simulation tools and mathematical modeling. Master’s Thesis, Universidade Federal do Rio de Janeiro, Rio de Janeiro, Brazil, 2015. [Google Scholar]
  24. Tavares, L.M. Role of Particle Microstructure in Comminution. In Proc. XXI International Mineral Processing Congress; Elsevier: Rome, Italy, 2000; Volume C, pp. C4-99–C4-106. [Google Scholar]
  25. Tavares, L.M.; Neves, P.B. Microstructure of quarry rocks and relationships to particle breakage and crushing. Int. J. Miner. Process. 2008, 87, 28–41. [Google Scholar] [CrossRef]
  26. Meyer, K. Pelletizing of Iron Ores; Springer-Verlag: Berlin, Germany, 1980. [Google Scholar]
Figure 1. Bench-scale mill (left) and pilot-scale continuous ball mill (right).
Minerals 09 00366 g001
Figure 2. Sampling points in the industrial mill circuit.
Minerals 09 00366 g002
Figure 3. Experimental product size distributions from batch test with material contained in 3350–2360 µm size range. Tests at 72% solids concentration, 100% of slurry filling, 40% of ball filling, and 68.3% of critical speed.
Minerals 09 00366 g003
Figure 4. Feed size cumulative breakage function for the two sizes analyzed for wet grinding in the 25.4 cm diameter mill.
Minerals 09 00366 g004
Figure 5. Experimental and interpolated breakage functions for wet grinding in the 25.4 cm diameter mill.
Minerals 09 00366 g005
Figure 6. Comparison of experimental product size distribution and “similar fineness of grind” prediction for batch grinding test at 76% of solids and 100% of slurry filling.
Minerals 09 00366 g006
Figure 7. Specific selection functions estimated according to similar fineness of grind considering the influence of percent solids for a slurry filling of 100% for the batch grinding mill.
Minerals 09 00366 g007
Figure 8. Relationship between solids concentration and ζ1 (y-axes) from batch tests carried out at different slurry fillings.
Minerals 09 00366 g008
Figure 9. Relationship between solids concentration and feed size specific selection function parameter S1E (t/kWh) (y-axes) from batch tests carried out at different slurry fillings.
Minerals 09 00366 g009
Figure 10. Comparison between experimental data and fitted residence time distribution (RTD) model for the liquid phase in pilot-scale test P1.
Minerals 09 00366 g010
Figure 11. Comparison between experimental data and fitted RTD model for the liquid phase in the industrial mill (void symbols have not been included in fitting the model, since they represent the influence of return of tracer to the mill feed via hydrocyclone underflow).
Minerals 09 00366 g011
Figure 12. Prediction methodology scheme for the pilot scale mill.
Minerals 09 00366 g012
Figure 13. Comparison between experimental and predicted size distribution for pilot plant test P5 (grate discharge) considering the selection function fitted from the batch test with 76% of solids concentration and 100% of slurry filling.
Minerals 09 00366 g013
Figure 14. Comparison between the experimental and predicted size distribution for pilot test P3 considering the selection function fitted from the batch test with 80% of solids concentration and 260% of slurry filling.
Minerals 09 00366 g014
Figure 15. Prediction methodology scheme for the industrial scale mill.
Minerals 09 00366 g015
Figure 16. Partition curve of the hydrocyclones, from two surveys in which the flows properly mass balanced.
Minerals 09 00366 g016
Figure 17. Cumulative passing in 45 µm of industrial mill discharge as a function of solids concentration—predicted and experimental results from industrial campaigns #1, 2, and 3.
Minerals 09 00366 g017
Figure 18. Predictions of industrial mill capacity (fresh feed throughput) as a function of percent solids for a product size of 40% passing 45 microns.
Minerals 09 00366 g018
Table 1. Summary of mill characteristics and operating conditions.
BenchPilotIndustrial
Mill diameter (m)0.2540.4165.2
Length (m)0.2920.64110.6
Ball filling (%)403531
Fraction of critical speed0.6830.6830.683
Mill speed (RPM)61.346.512.7
Table 2. Ball size distribution used in both batch grinding and continuous grinding experiments.
Ball Size (mm)Percentage (% by Weight)
30.037
25.447
17.014
12.72
Table 3. RTD model parameters and pilot mill power and slurry hold-up recorded during steady state conditions.
Test *Test ConditionsMean Solids Residence Time (min)RTD Model Parameters of Liquid (min)Mill Measurements
% Solids (wt.)Slurry Filling (%)ττ1τ2τ3Power (kW)Hold-Up (kg)
P17416713.513.912.11.00.80.6747
P27613917.717.315.91.4-0.6841
P37924520.620.319.60.60.030.5977
P48520440.539.619.819.8-0.6191
P577896.57.46.00.80.60.6027
* P1 to P4 were carried out using overflow discharge, whereas grate discharge was used in P5.
Table 4. Back-calculated specific selection function parameters used in plant scale mill prediction.
Pilot Test% Solids (wt.)Mill DischargeS1E* (kWh/ton)−1ζ1*
P174Overflow4.0550.872
P276Overflow4.1340.859
P379Overflow3.1720.791
P485Overflow0.8340.497

