Article

Recovery of Alkali from Bayer Red Mud Using CaO and/or MgO

1
School of Chemical Engineering and Technology, Tianjin University, Tianjin 300072, China
2
Key Laboratory of Green Process and Engineering, Institute of Process Engineering, Chinese Academy of Sciences, Beijing 100190, China
3
National Engineering Laboratory for Hydrometallurgical Cleaner Production Technology, Institute of Process Engineering, Chinese Academy of Sciences, Beijing 100190, China
4
National Engineering Research Center of Distillation Technology, Tianjin 300072, China
*
Author to whom correspondence should be addressed.
Minerals 2019, 9(5), 269; https://doi.org/10.3390/min9050269
Submission received: 29 March 2019 / Revised: 22 April 2019 / Accepted: 26 April 2019 / Published: 30 April 2019

Abstract

:
Recovering alkali from Bayer red mud is crucial for storage security, resource utilization and environmental protection. In this study, the addition of MgO and/or CaO was conducted to recover alkali from red mud with a hydrothermal method for the first time. A synergistic result with a residual Na2O/SiO2 weight ratio of 0.03 was obtained by adding the blend of CaO and MgO at an appropriate temperature. MgO was found to be more temperature-dependent than CaO when substituting Na2O from red mud due to their different hydration processes. The alkali recovery was controlled by a reaction at a temperature of <200 °C and by internal diffusion at a higher temperature for MgO, but controlled by internal diffusion for CaO in the whole temperature range studied. The formation of hydrotalcite-like compounds with a loose structure was verified with the help of XRD, FTIR, and SEM-EDS. It was proved that both the reaction kinetics and the characteristics of solid products have a significant influence on the recovery of alkali.

1. Introduction

Red mud is the solid waste emitted from the aluminum industry. China produced 69.02 million tons of alumina in 2017, with more than 100 million tons of red mud generated [1]. The pH of red mud ranges from 9.2 to 13.0 with an average value of 11.3 ± 1.0, and the high alkalinity of red mud is the primary reason for its classification as a hazardous material [2,3,4,5]. Although most alumina producers dispose of this residue in tailing dams [6], this is in no way a long-term solution considering the associated security, environmental and utilization problems [7,8,9,10].
Several processes have been proposed to neutralize the alkali in red mud, such as acids and acid gases neutralization, seawater neutralization, microbial neutralization and revegetation [4,8,11,12,13,14,15], among which seawater neutralization has been highly valued for the abundance and low cost of seawater. In the seawater neutralization process, the Ca- and Mg-rich brines play an important role in the reduction of pH and in the precipitation of hydroxide, carbonate or hydroxycarbonate minerals [13,16,17]. However, this method is only suitable for coastal areas.
In addition, leaching and recovering alkali from red mud has also been widely investigated, such as the soda-lime roasting process, solvent extraction process, calcification-carbonation method, and water leaching and hydro-chemical process [8,18,19,20]. The addition of lime has been widely studied because of its excellent performance in replacing Na2O, as well as its abundance and cheapness. In fact, the insoluble sodium mainly lies in cancrinite, and the sodium can be leached out from it only if the structure is broken down, or the included Na+ can be removed through the opening of the cancrinite structure. Therefore, the leaching process is based on the ion exchange between Ca2+ and Na+ [4]. There are many studies about leaching alkali from red mud with lime, including the industrial use of lime to remove alkali, such as the “Lime Bayer” process and the Sagin process [4]. Yang et al. and Luo et al. investigated the recovery ratio of alkali with the addition of lime under different conditions, and obtained the best recovery ratio of 80% [21,22]. Li et al. conducted a thermodynamic analysis of the calcification reaction and studied the calcification mechanism under different conditions focusing on the calcification-carbonation processes [23].
To summarize, CaO or MgO plays an essential part in alkali recovery and pH reduction of red mud because of its high efficiency, low cost and absence of secondary pollution, unlike Ca- and Mg-rich brines. However, few examples from the literature have systematically reported the differences in using CaO and/or MgO as additions to recover alkali from red mud. Venancio et al. added CaO/MgO before the carbonation, but only reported the change of pH [24].
In this study, the hydrothermal reaction using a different molar ratio of CaO/MgO blend to recover alkali was conducted at different temperatures to determine the alkali recovery capacity, and the best recovery efficiency reached 89.3% with a residual Na2O/SiO2 weight ratio (N/S) of 0.03. The reaction kinetics was regressed to ascertain the rate controlling step. Moreover, the detection of phase composition, infrared spectroscopy analysis and micro-zone analysis were used to study the differences in CaO/MgO dealkalization. This study can provide reference for the reaction mechanism investigations of alkali recovery from red mud based on ion exchange.

2. Materials and Methods

2.1. Materials

Calcium oxide (CaO, AR) and magnesium oxide (MgO, AR) were purchased from Beijing Chemical Industry Co. Ltd. and were used as received. Deionized water was used in all experiments. Red mud was supplied by Coalmine Alumina Co., Henan Province, China, dried overnight at 105 °C on the ground, and finally put through a 200-mesh sieve. The standard reference red mud was from Zhengzhou Light Metals Research Institute of CHINALCO, Henan Province, China. The flux (Li2B4O7:LiBO2 = 12:22) was purchased from Luoyang Tenai Laboratory Equipment Co., Ltd., Henan Province, China.

2.2. Experimental Methods

The experiments were carried out in 150 mL steel bomb reactors which were placed in a homogeneous bath furnace. The reactors were made of nickel metal, and the furnace was filled with glycerin when the temperature was ≤160 °C, while filled with a molten salt of 53 wt. % of KNO3, 40 wt. % of NaNO2, and 7 wt. % of NaNO3 when the temperature was higher than 160 °C. The agitation of the reaction was driven by the rotation of the steel bombs at a speed of 30 rpm and strengthened by the addition of nickel beads. The temperature of the furnace was controlled within ±0.5 °C.
For each experiment, 15 g red mud and a blend with a specific molar ratio of CaO to MgO (100%:0%, 90%:10%, 70%:30%, 50%:50%, 30%:70%, 10%:90% and 0%:100%) was added in each steel bomb reactor. The liquid to solid (L/S) weight ratio was fixed at 4:1, which was the same as in the latest literature focusing on alkali recovery of red mud [23]. The total amount of CaO and MgO in each bomb reactor was 0.056 mol and remained constant, with the CaO and/or MgO:Na2O molar ratio remaining at 4:1 [23,25]. The steel bomb reactors were then put in the furnace. The furnace was heated to 20 °C below the scheduled temperature in advance, and the start of the reaction was recorded upon reaching the experimental temperature. The steel bombs were removed after reaction for 3 h, and then quickly cooled in water. The solid cake and the filtrate were obtained by filtration. The obtained solids were washed by deionized water and dried in a laboratory oven at 105 °C for subsequent analysis.

2.3. Analytical Methods

The content of water-soluble sodium in the red mud was obtained by the titration method of the Pingguo alumina factory, Guangxi, CHALCO. The analysis process is shown as follows:
(a) An amount of 5 g red mud and 200 mL sodium chloride solution (0.1000 mol/L) were added in a 500 mL conical flask, and then the suspension was agitated for 15 min by a magnetic stirrer at an agitation speed of 300 rpm, before being filtrated.
(b) An amount of 100 mL liquid filtrate obtained by filtration was moved into a 250 mL conical flask, and the liquid was concentrated to about 50 mL, and heated in an electric furnace.
(c) Between six and eight drops of bromothymol blue were added into the concentrated liquid and then the liquid was rapidly titrated with hydrochloric acid (0.1000 mol/L). We stopped adding hydrochloric acid when the color changed from blue to yellow and recorded the volume (V, mL) of the hydrochloric acid used.
The content of water-soluble sodium in the red mud could be calculated through Equation (1):
Na 2 O   wt . %   =   0 . 1 × V 1000 × 200 100 × 62 2 × 100 5   =   0 . 124 × V
The chemical composition of the solids was determined by X-ray Fluorescence (XRF, ARL9800XP, Thermofisher, Waltham, MA, USA). The loss of sodium from the red mud could be obtained by the XRF measurement and calculation. The samples were pressed into disks before measurement: (1) the solid samples were finely ground and dried at 110 °C for 1 h; (2) 0.7000 g sample and 5.6000 g flux were mixed and melted into a disk with an automatic melting furnace (FLUXY10, Classise, Mississauga, Ontario, Canada). The disks were subsequently analyzed using the XRF instrument, operated at 30 kV and 80 mA. The elemental concentrations (Al2O3, Fe2O3, CaO, TiO2, SiO2, MgO, Na2O and K2O) were quantified based on the measurements of disks using the MVR software. Prior to the analysis of the samples, the XRF instrument was calibrated with standard reference red mud and the intensity–concentration working curve was made.
During the hydrothermal process, the silicon oxide would not be leached into the liquor, and the recovery ratio of alkali from the red mud could be calculated through Equation (2):
α   = ( 1 N N 0 ) × 100 %
where α was the recovery ratio of alkali, N was the N/S in the solid sample, and N0 was the N/S of the initial red mud.
X-ray diffraction patterns of the solids were identified from powder diffraction patterns (XRD, X’pert MPD Pro, PanAnalytical, Almelo, The Netherlands) recorded with Cu Kα (λ = 0.15408 nm) radiation. The structural investigation of solids was carried out by Fourier transform infrared spectroscopy (FTIR, T27-Hyperion-Vector22, Bruker, Bremen, Germany). The surface morphology of samples was detected by scanning electron microscopy (SEM, JSM-7001F, JEOL, Tokyo, Japan) with energy dispersive X-ray spectroscopy (EDS, Inca X-MAX, Oxford, UK).

3. Results and Discussion

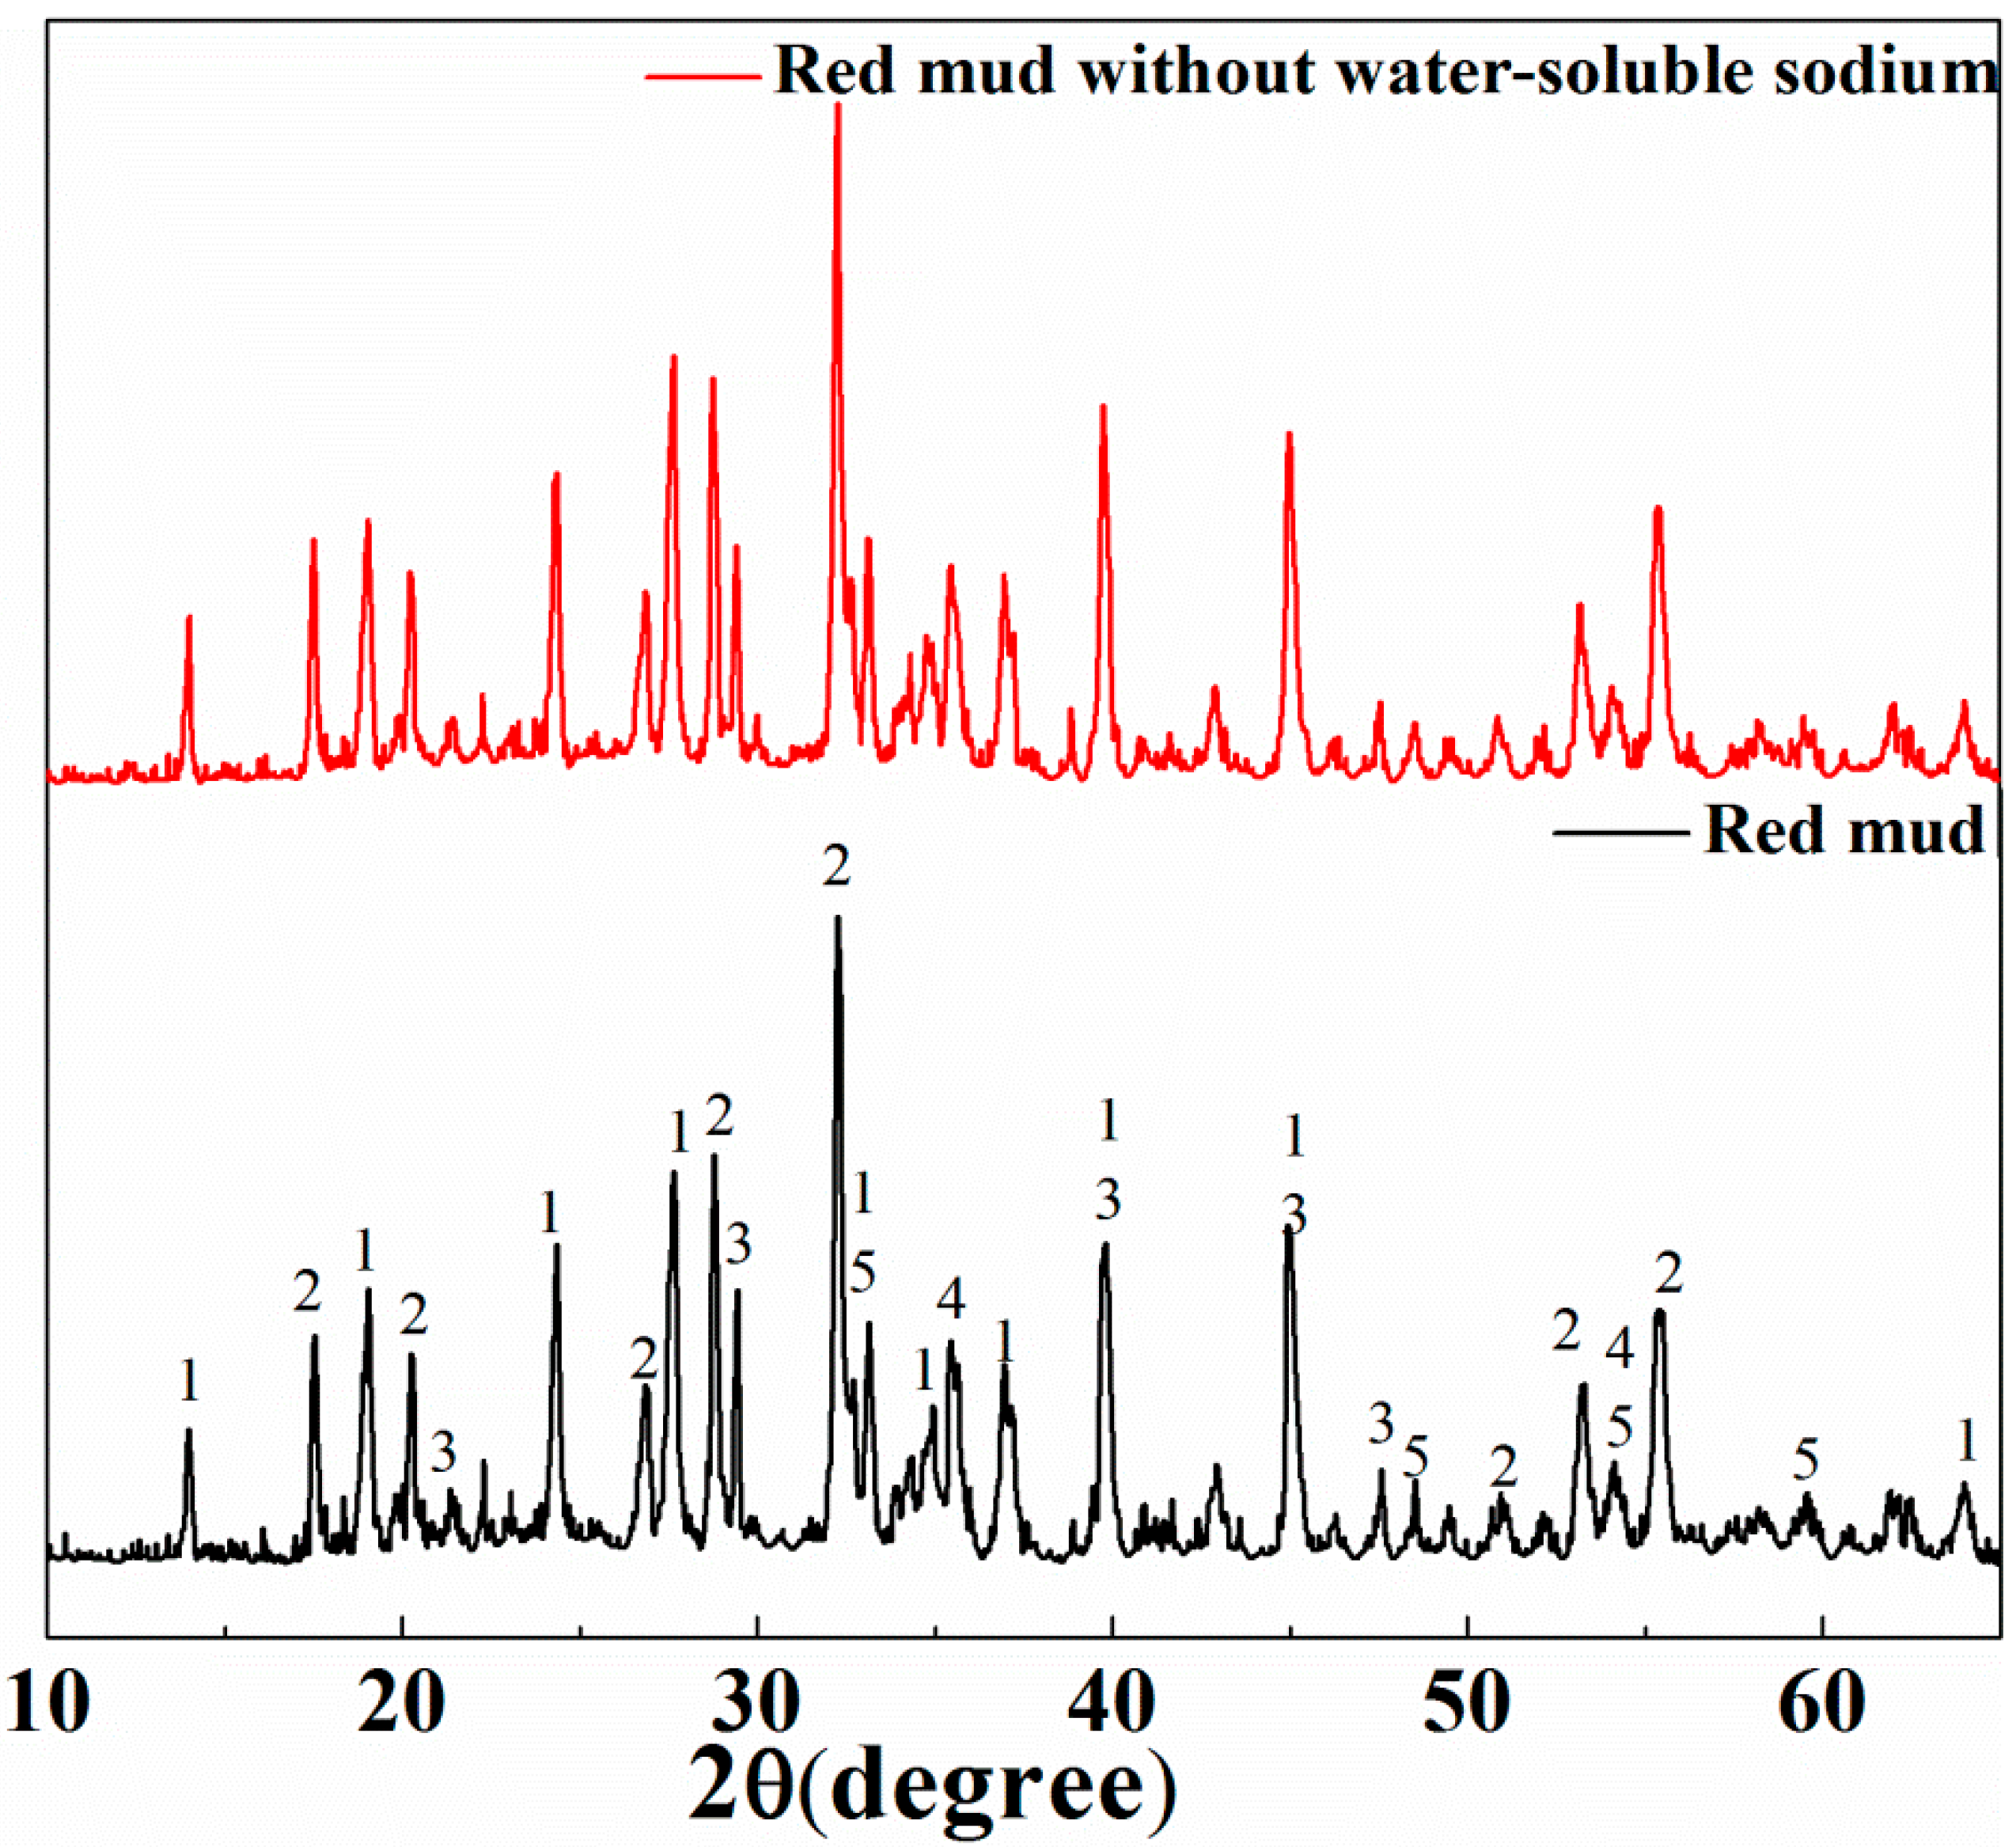
3.1. Characterization of Bayer Red Mud

From the X-ray diffraction patterns in Figure 1, Bayer red mud mainly consists of cancrinite (Na8(Si6Al6O24)(H0.88(CO3)1.44)(H2O)2), katoite (Ca2.93Al1.97Si0.64O2.56(OH)9.44), hematite (Fe2O3), perovskite (CaTiO3) and calcite (CaCO3). The main chemical composition of red mud is shown in Table 1 and Na2O accounts for 5.97 wt. % in the red mud. The content of water-soluble sodium in the red mud was obtained with the titration method as shown in Section 2.3, and the result showed that V equaled 0.95 mL, so the water-soluble sodium and water-insoluble sodium were calculated for 2.0 wt. % and 98.0 wt. % of the total sodium in the red mud, respectively. Besides, the X-ray diffraction pattern in Figure 1 shows no detectable changes after the removal of water-soluble sodium. It is thus inferred that most water-insoluble alkaline lies in the cancrinite. In Figure 2, it can be seen that the particles of the red mud show irregular appearance and the distribution of sodium atoms focuses on some specific particles, which is consistent with the previous assertion that most of the alkali lies in cancrinite.

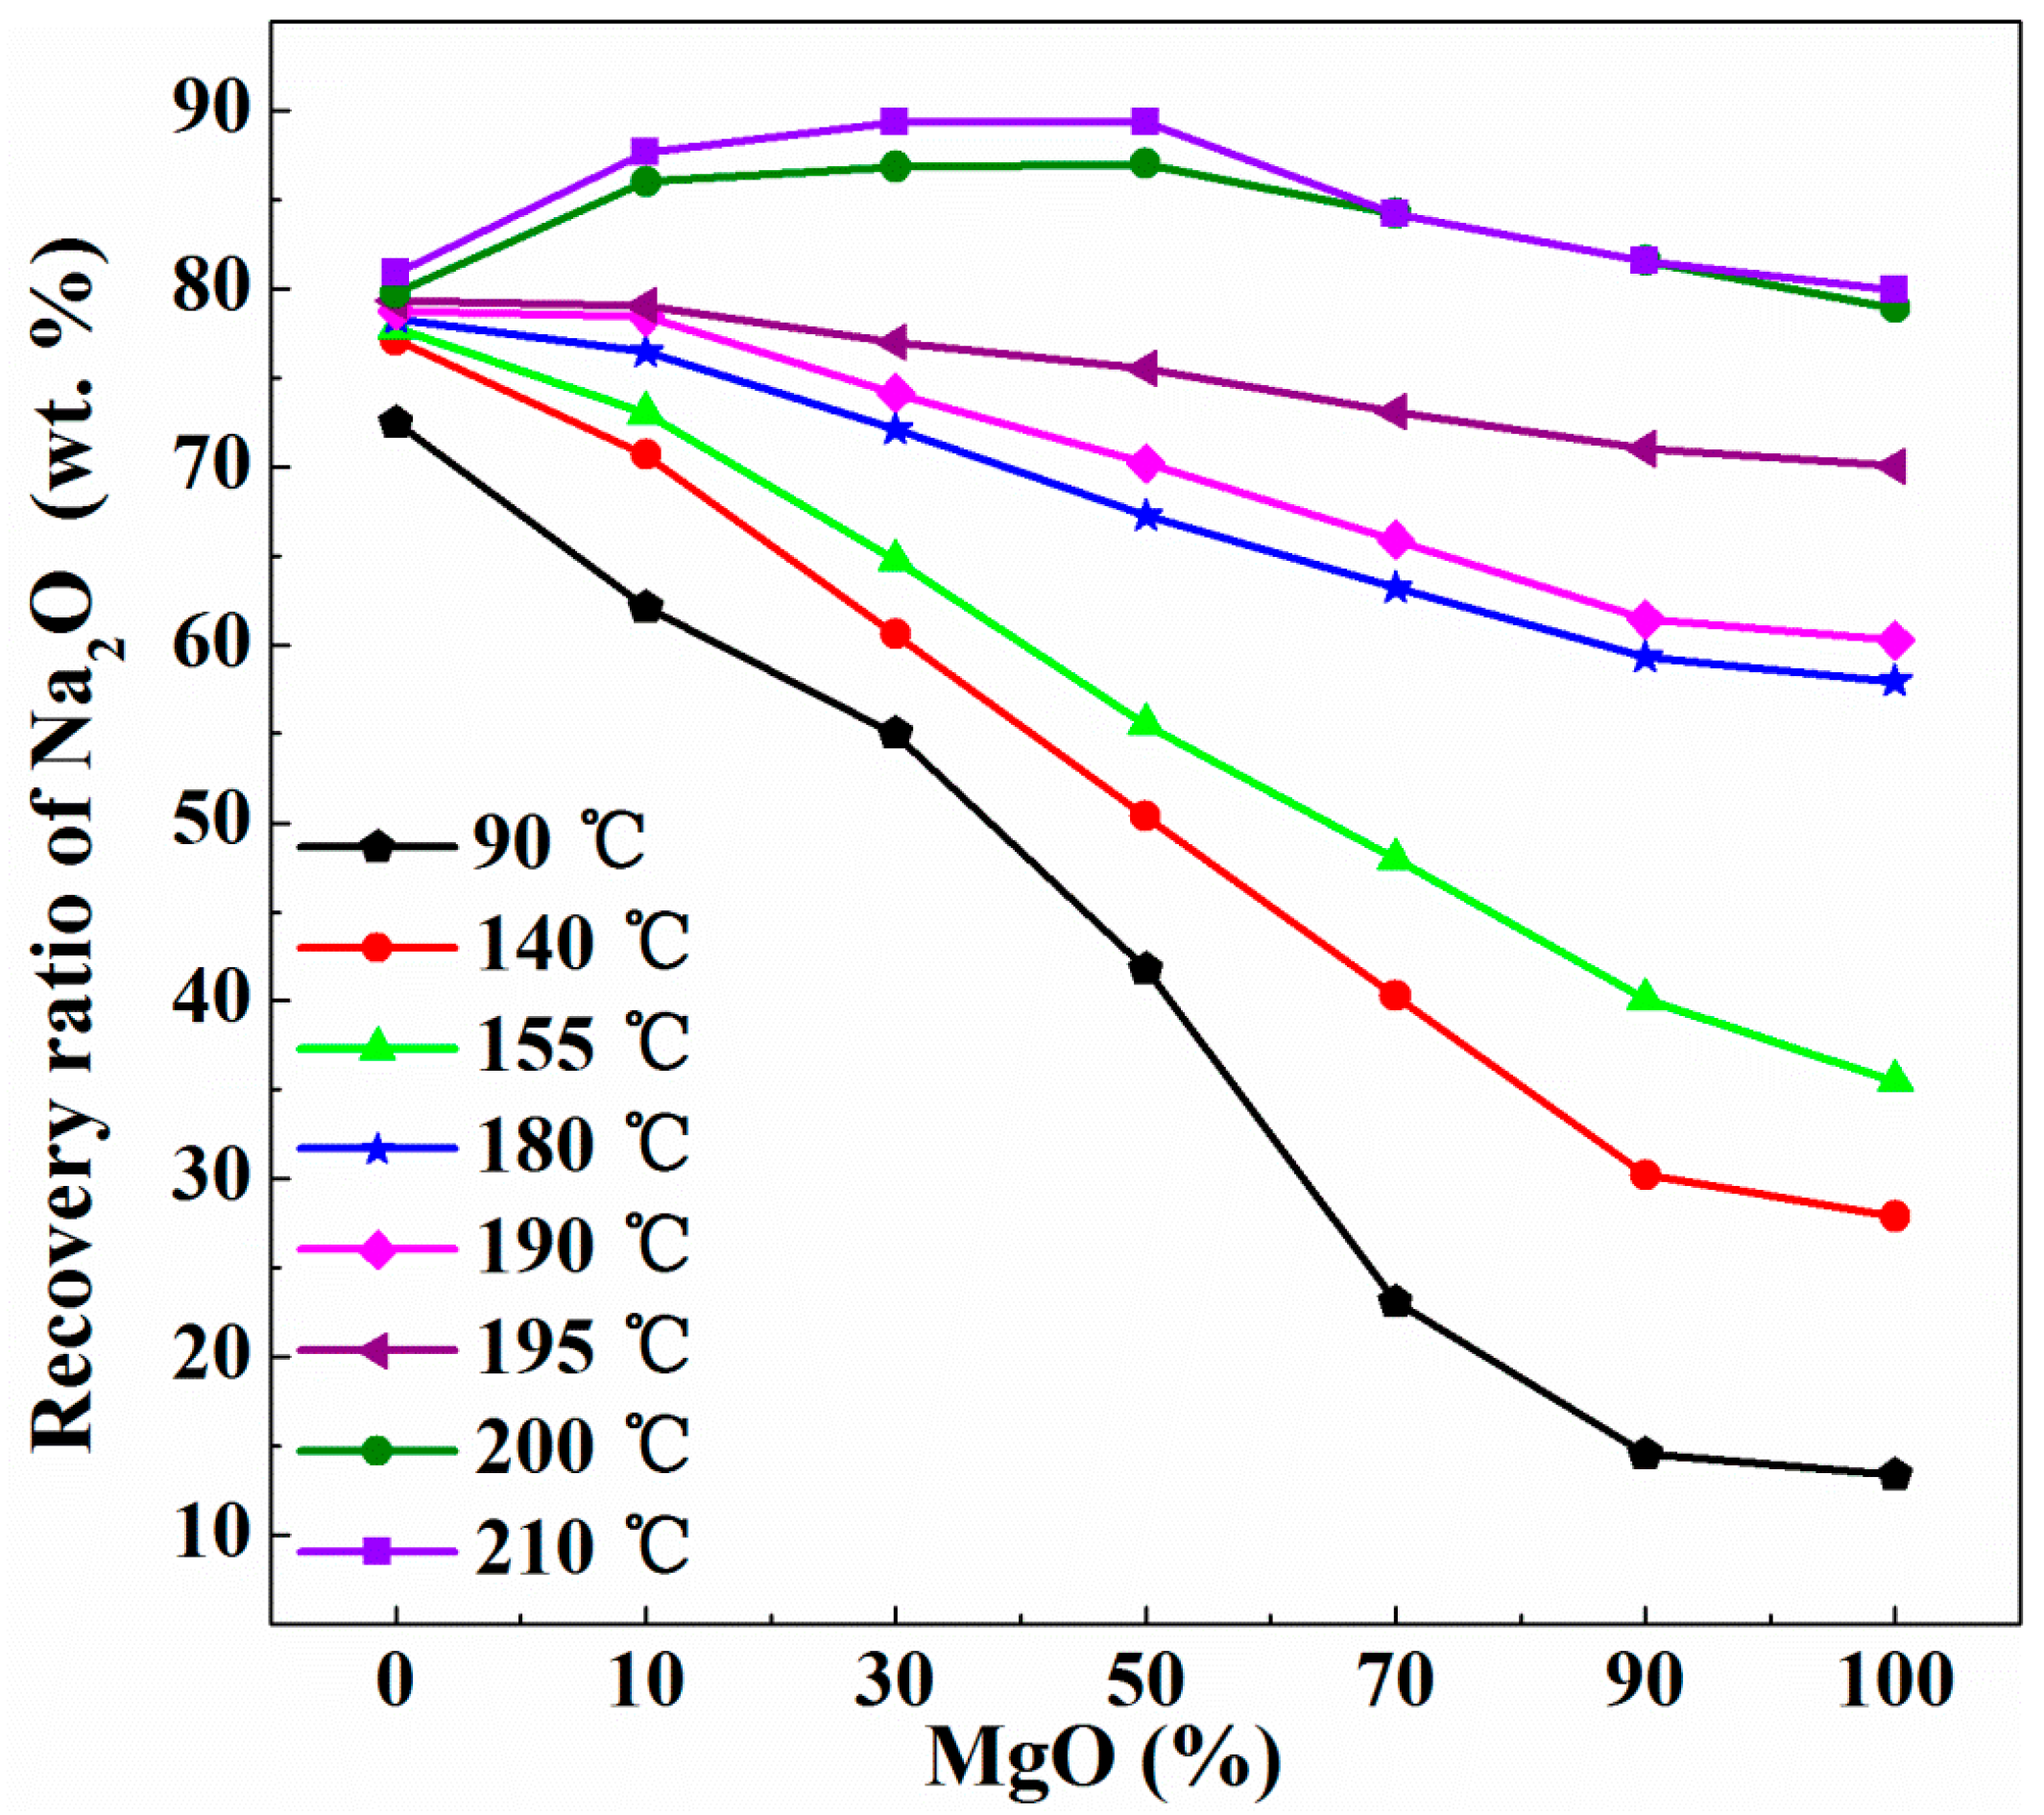
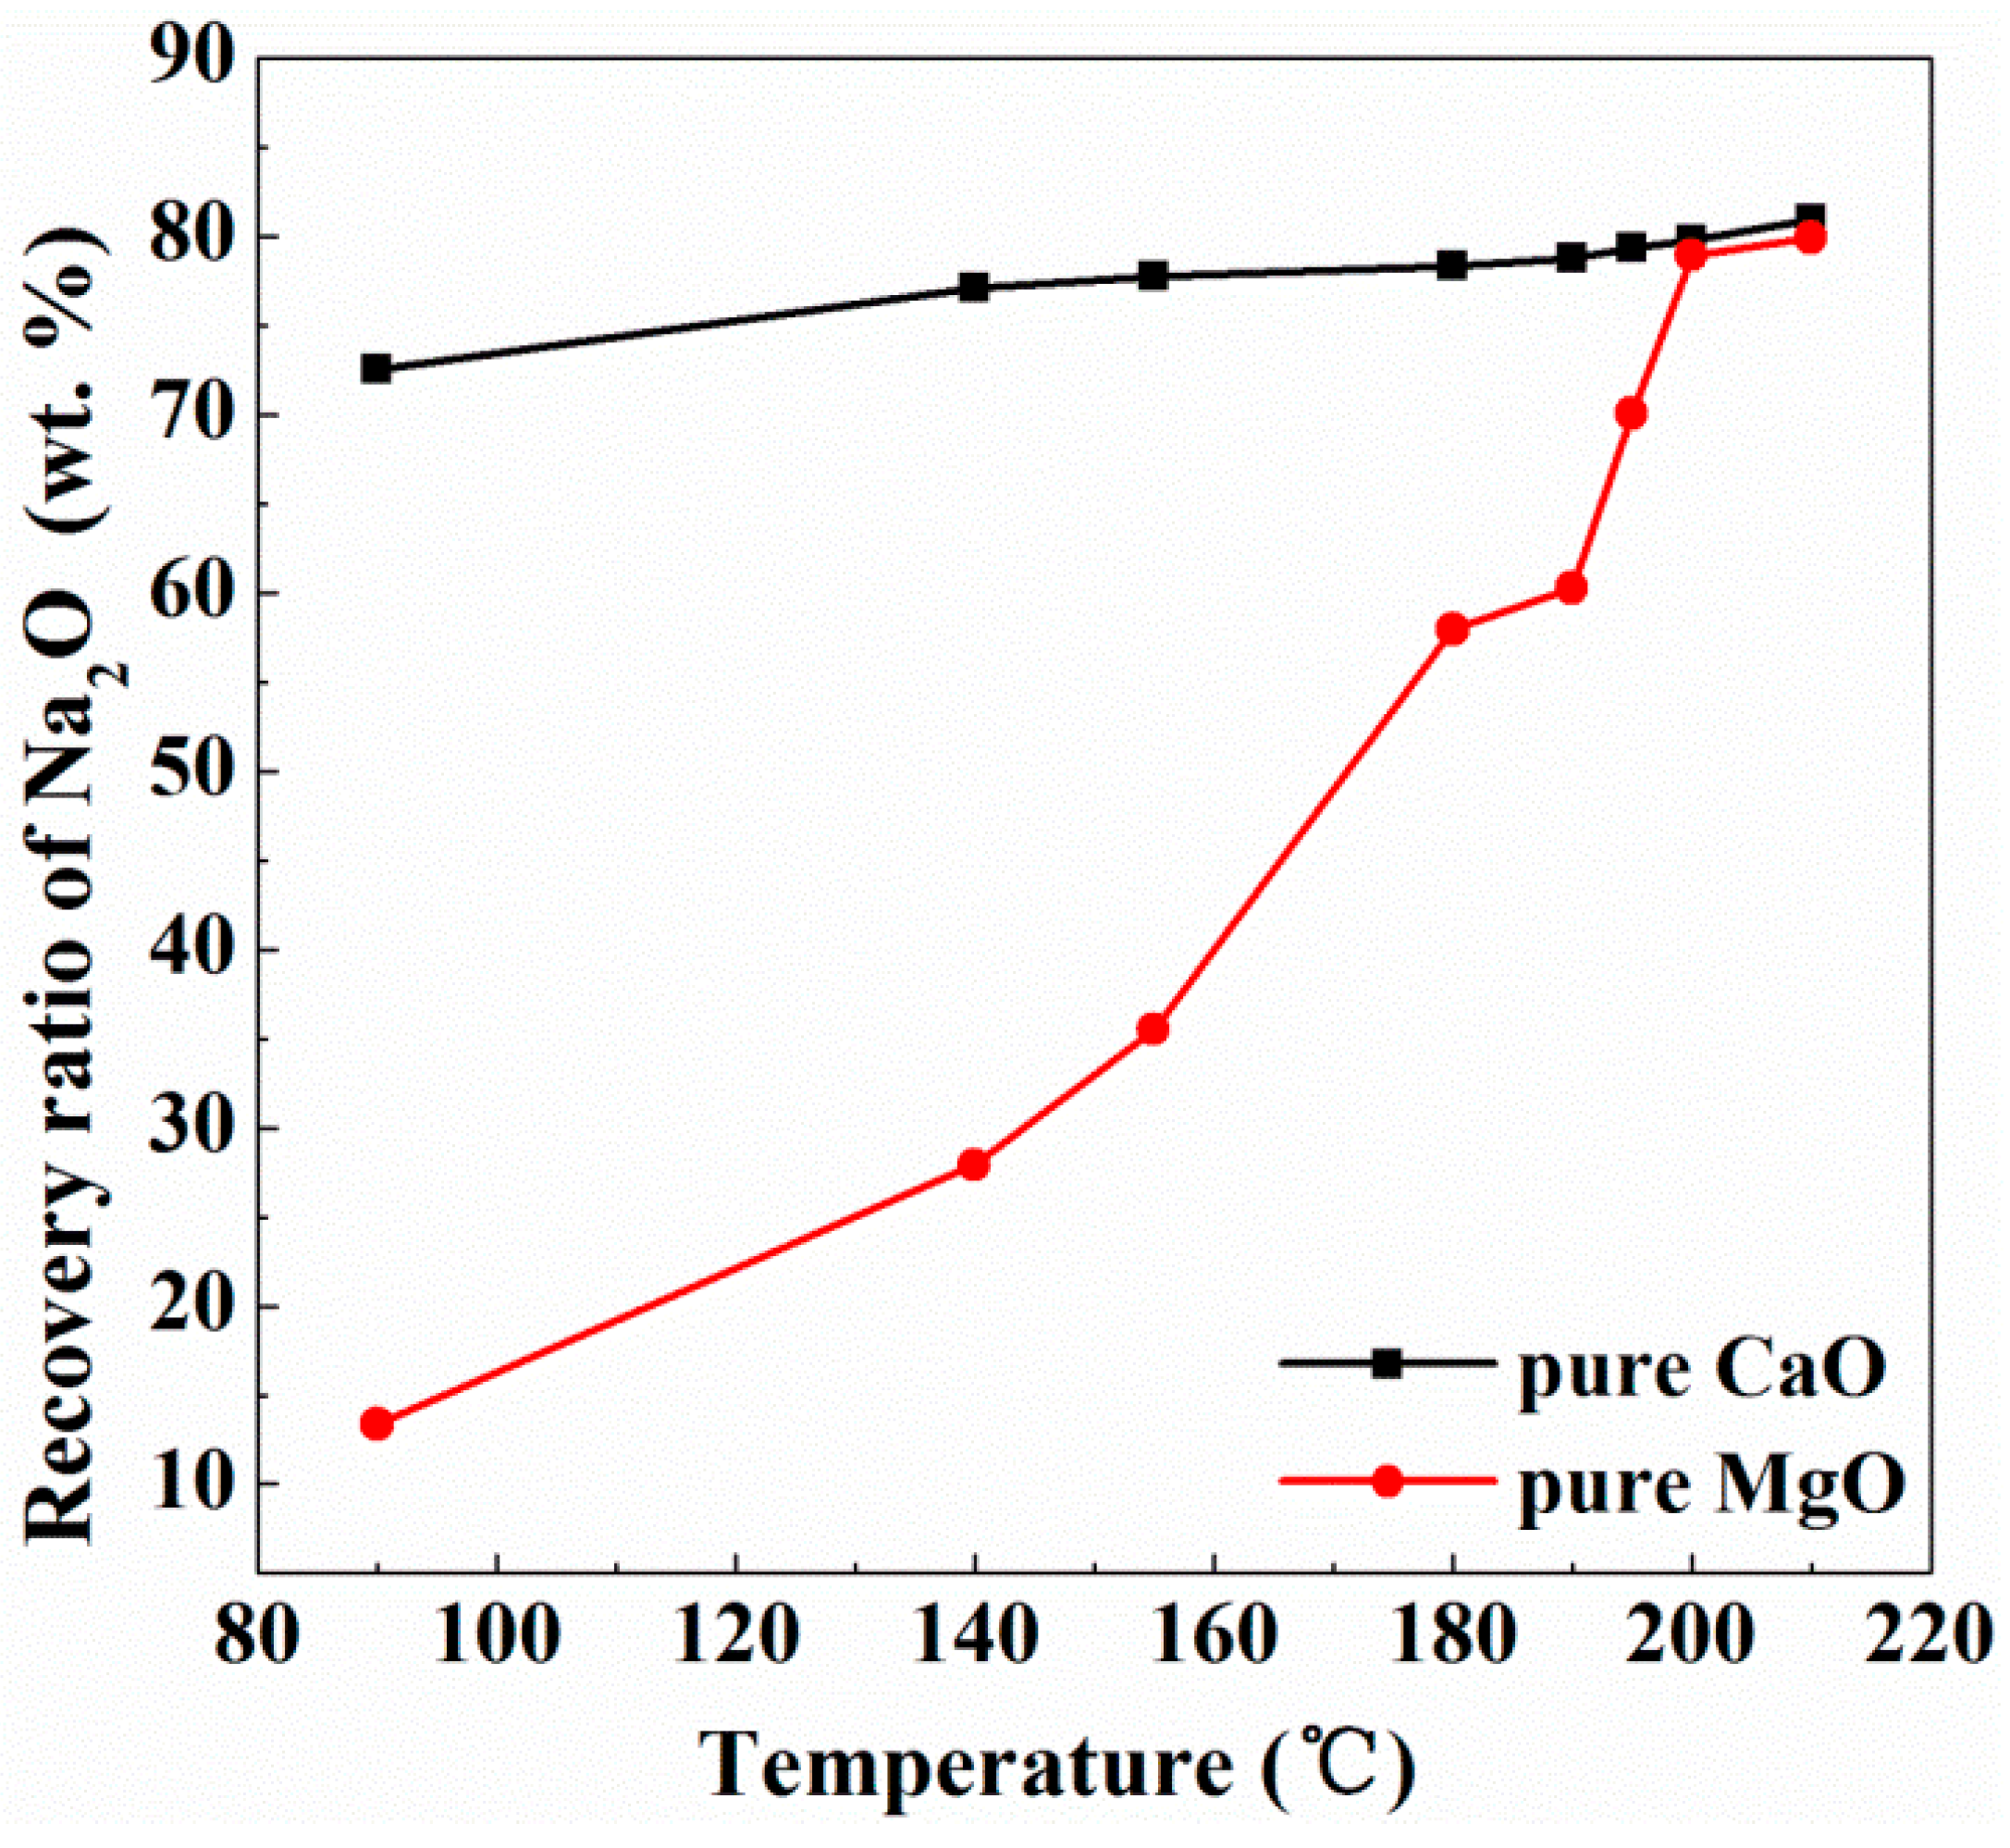
3.2. Recovery of Na2O Using CaO/MgO

The influence of temperature on alkali recovery efficiency was investigated. The results are illustrated in Figure 3 with pure CaO or MgO as an addition, and it is found that the recovery ratio of Na2O positively correlates with temperature. The recovery ratio increased smoothly from 72.5% to 80.9% in the temperature range of 90–210 °C with CaO as an addition, but more sharply from 13.4% to 78.9% when MgO was added from 90 °C to 200 °C, and then only improved to 79.9% when the temperature further increased to 210 °C. Although the recovery efficiencies of Na2O with CaO as an addition were always higher than those with MgO, the relative efficiency (MgO:CaO) increased from 18.5% to 98.8% when temperature increased from 90 °C to 210 °C. Moreover, the recovery efficiency was similar for both CaO and MgO at temperatures ≥200 °C.
Nevertheless, the recovery of sodium oxide shows a totally different rule with the blend of CaO and MgO as an addition, as shown in Figure 4. For instance, the recovery efficiency decreased with the increasing proportion of MgO when the temperature was lower than 200 °C. However, the recovery ratios of Na2O with 10% to 50% (molar ratio) MgO addition were higher than those of the single use of CaO or MgO when the temperature was higher than 200 °C, and the maximum was obtained at 50% MgO addition. The best recovery of Na2O was 89.3% in the experimental range, with N/S of 0.03 and only 0.64 wt. % Na2O left in the residue.

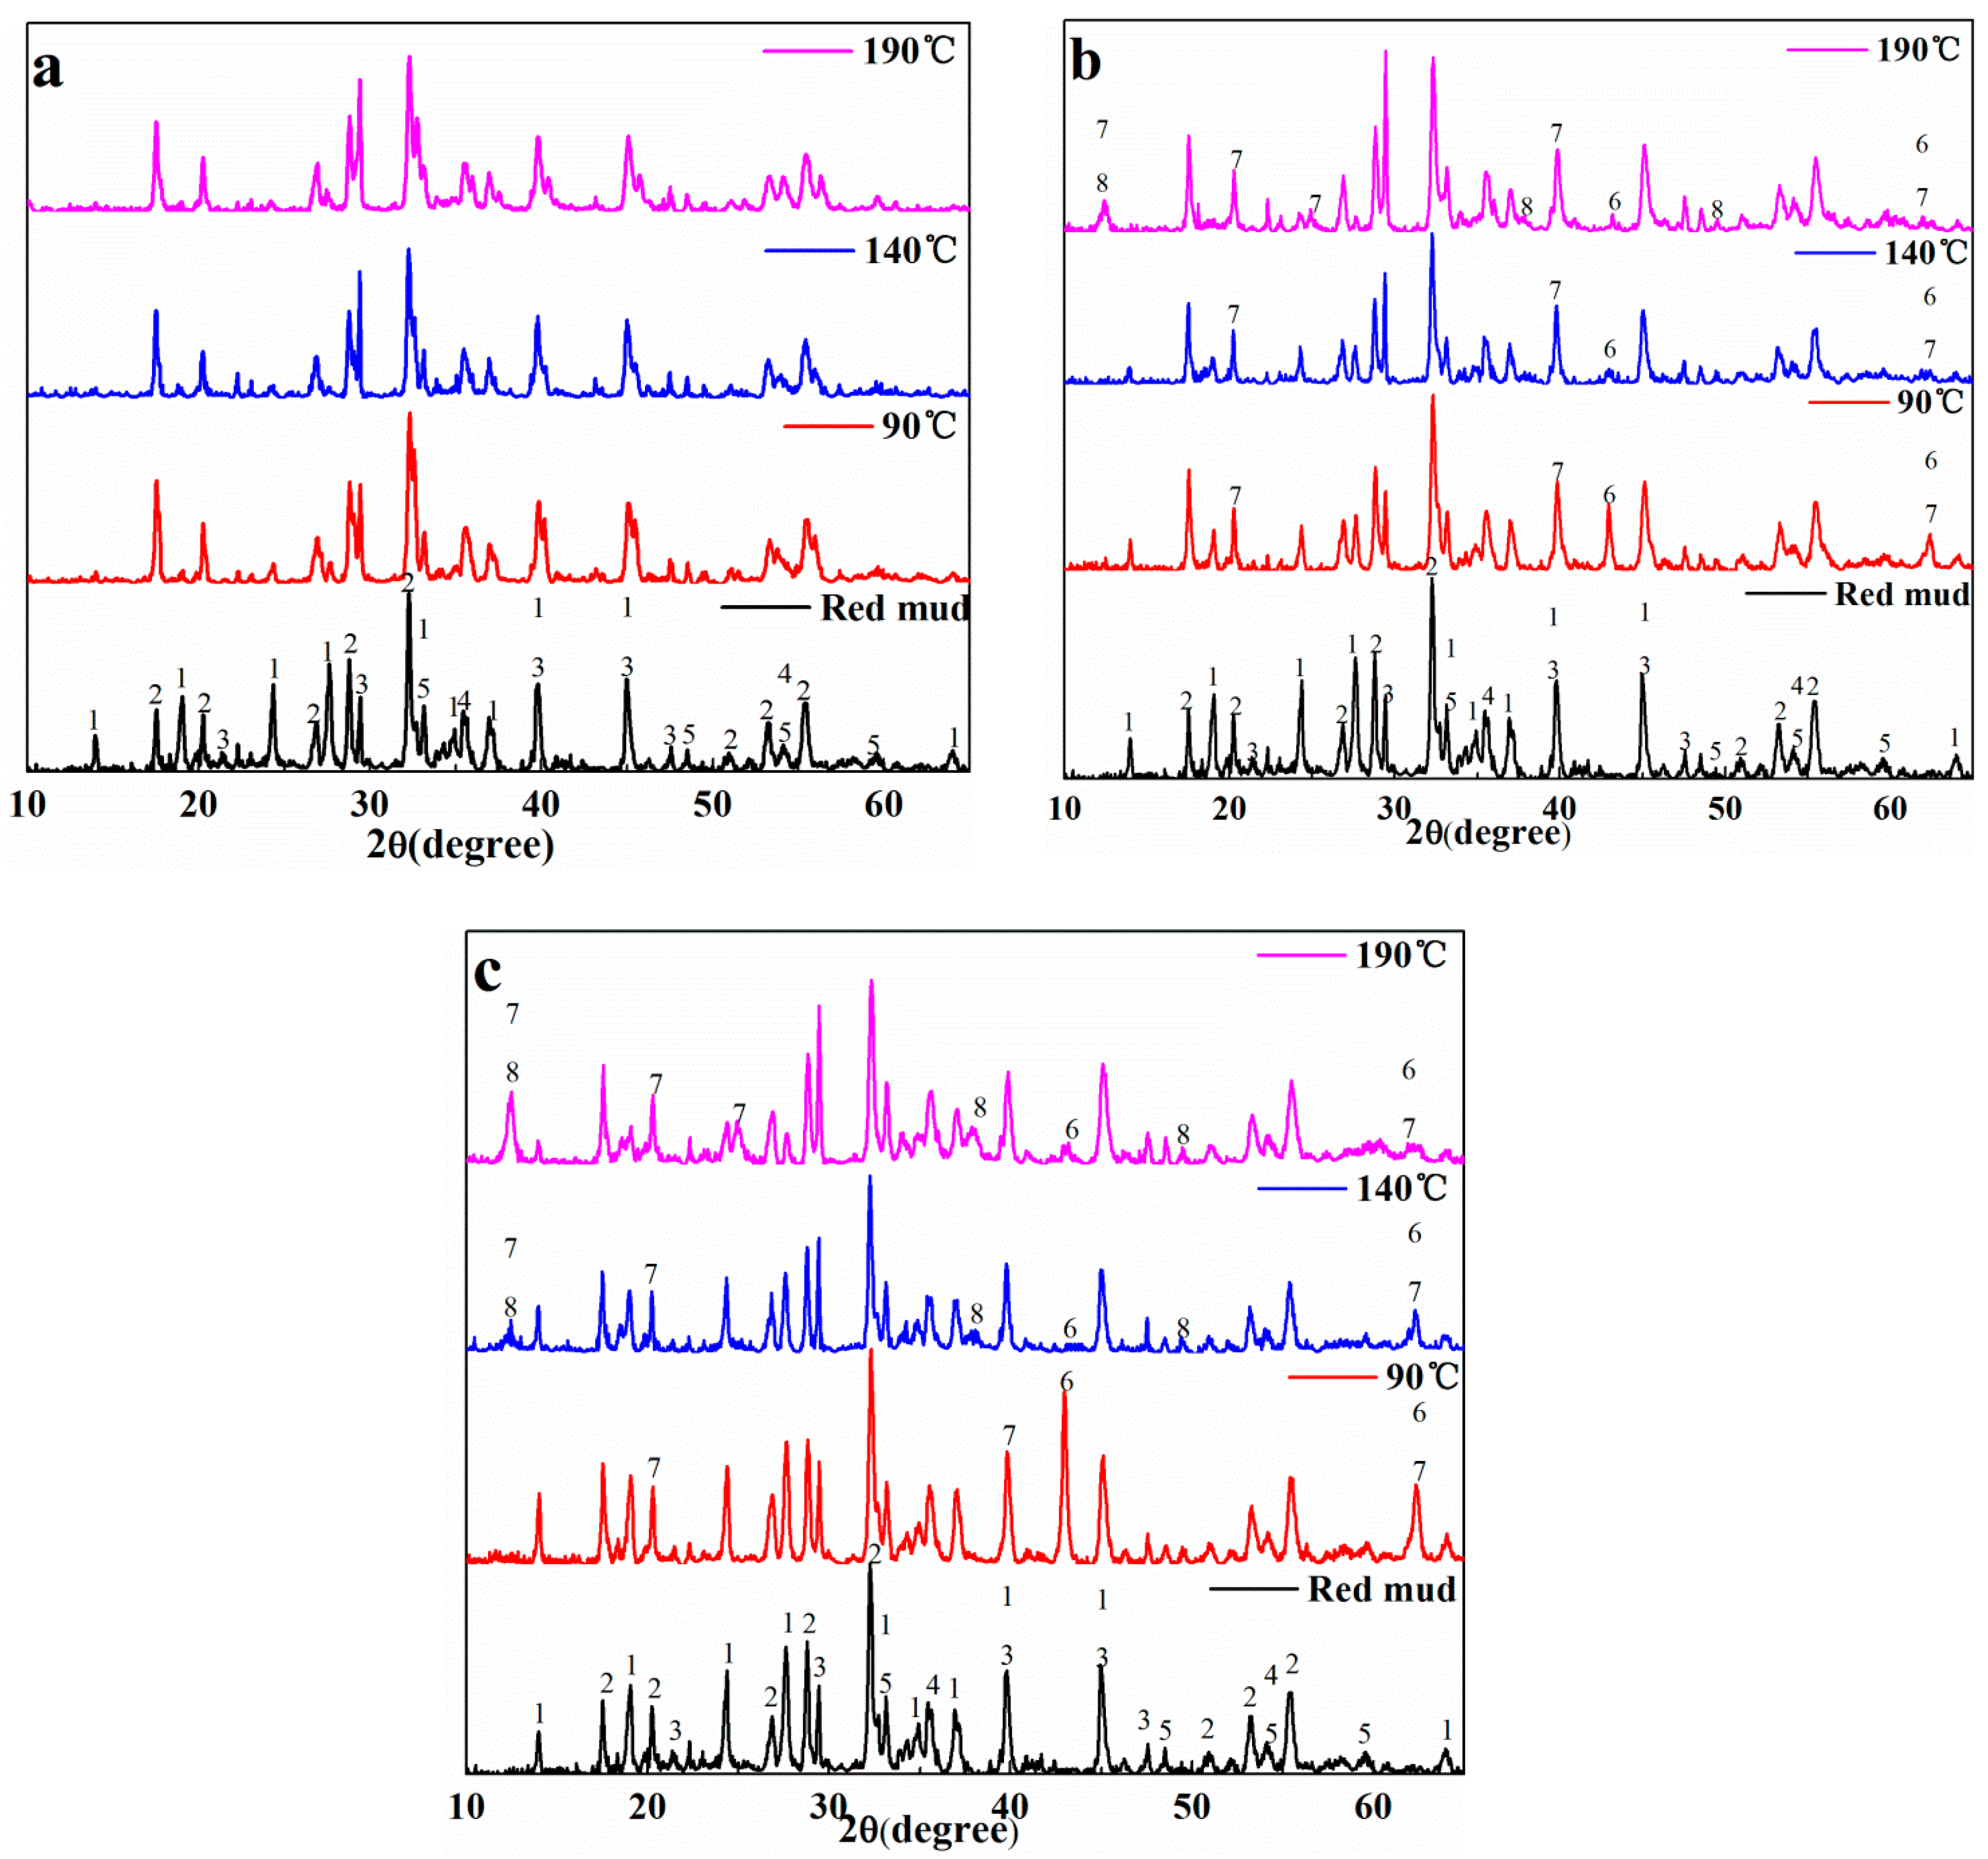
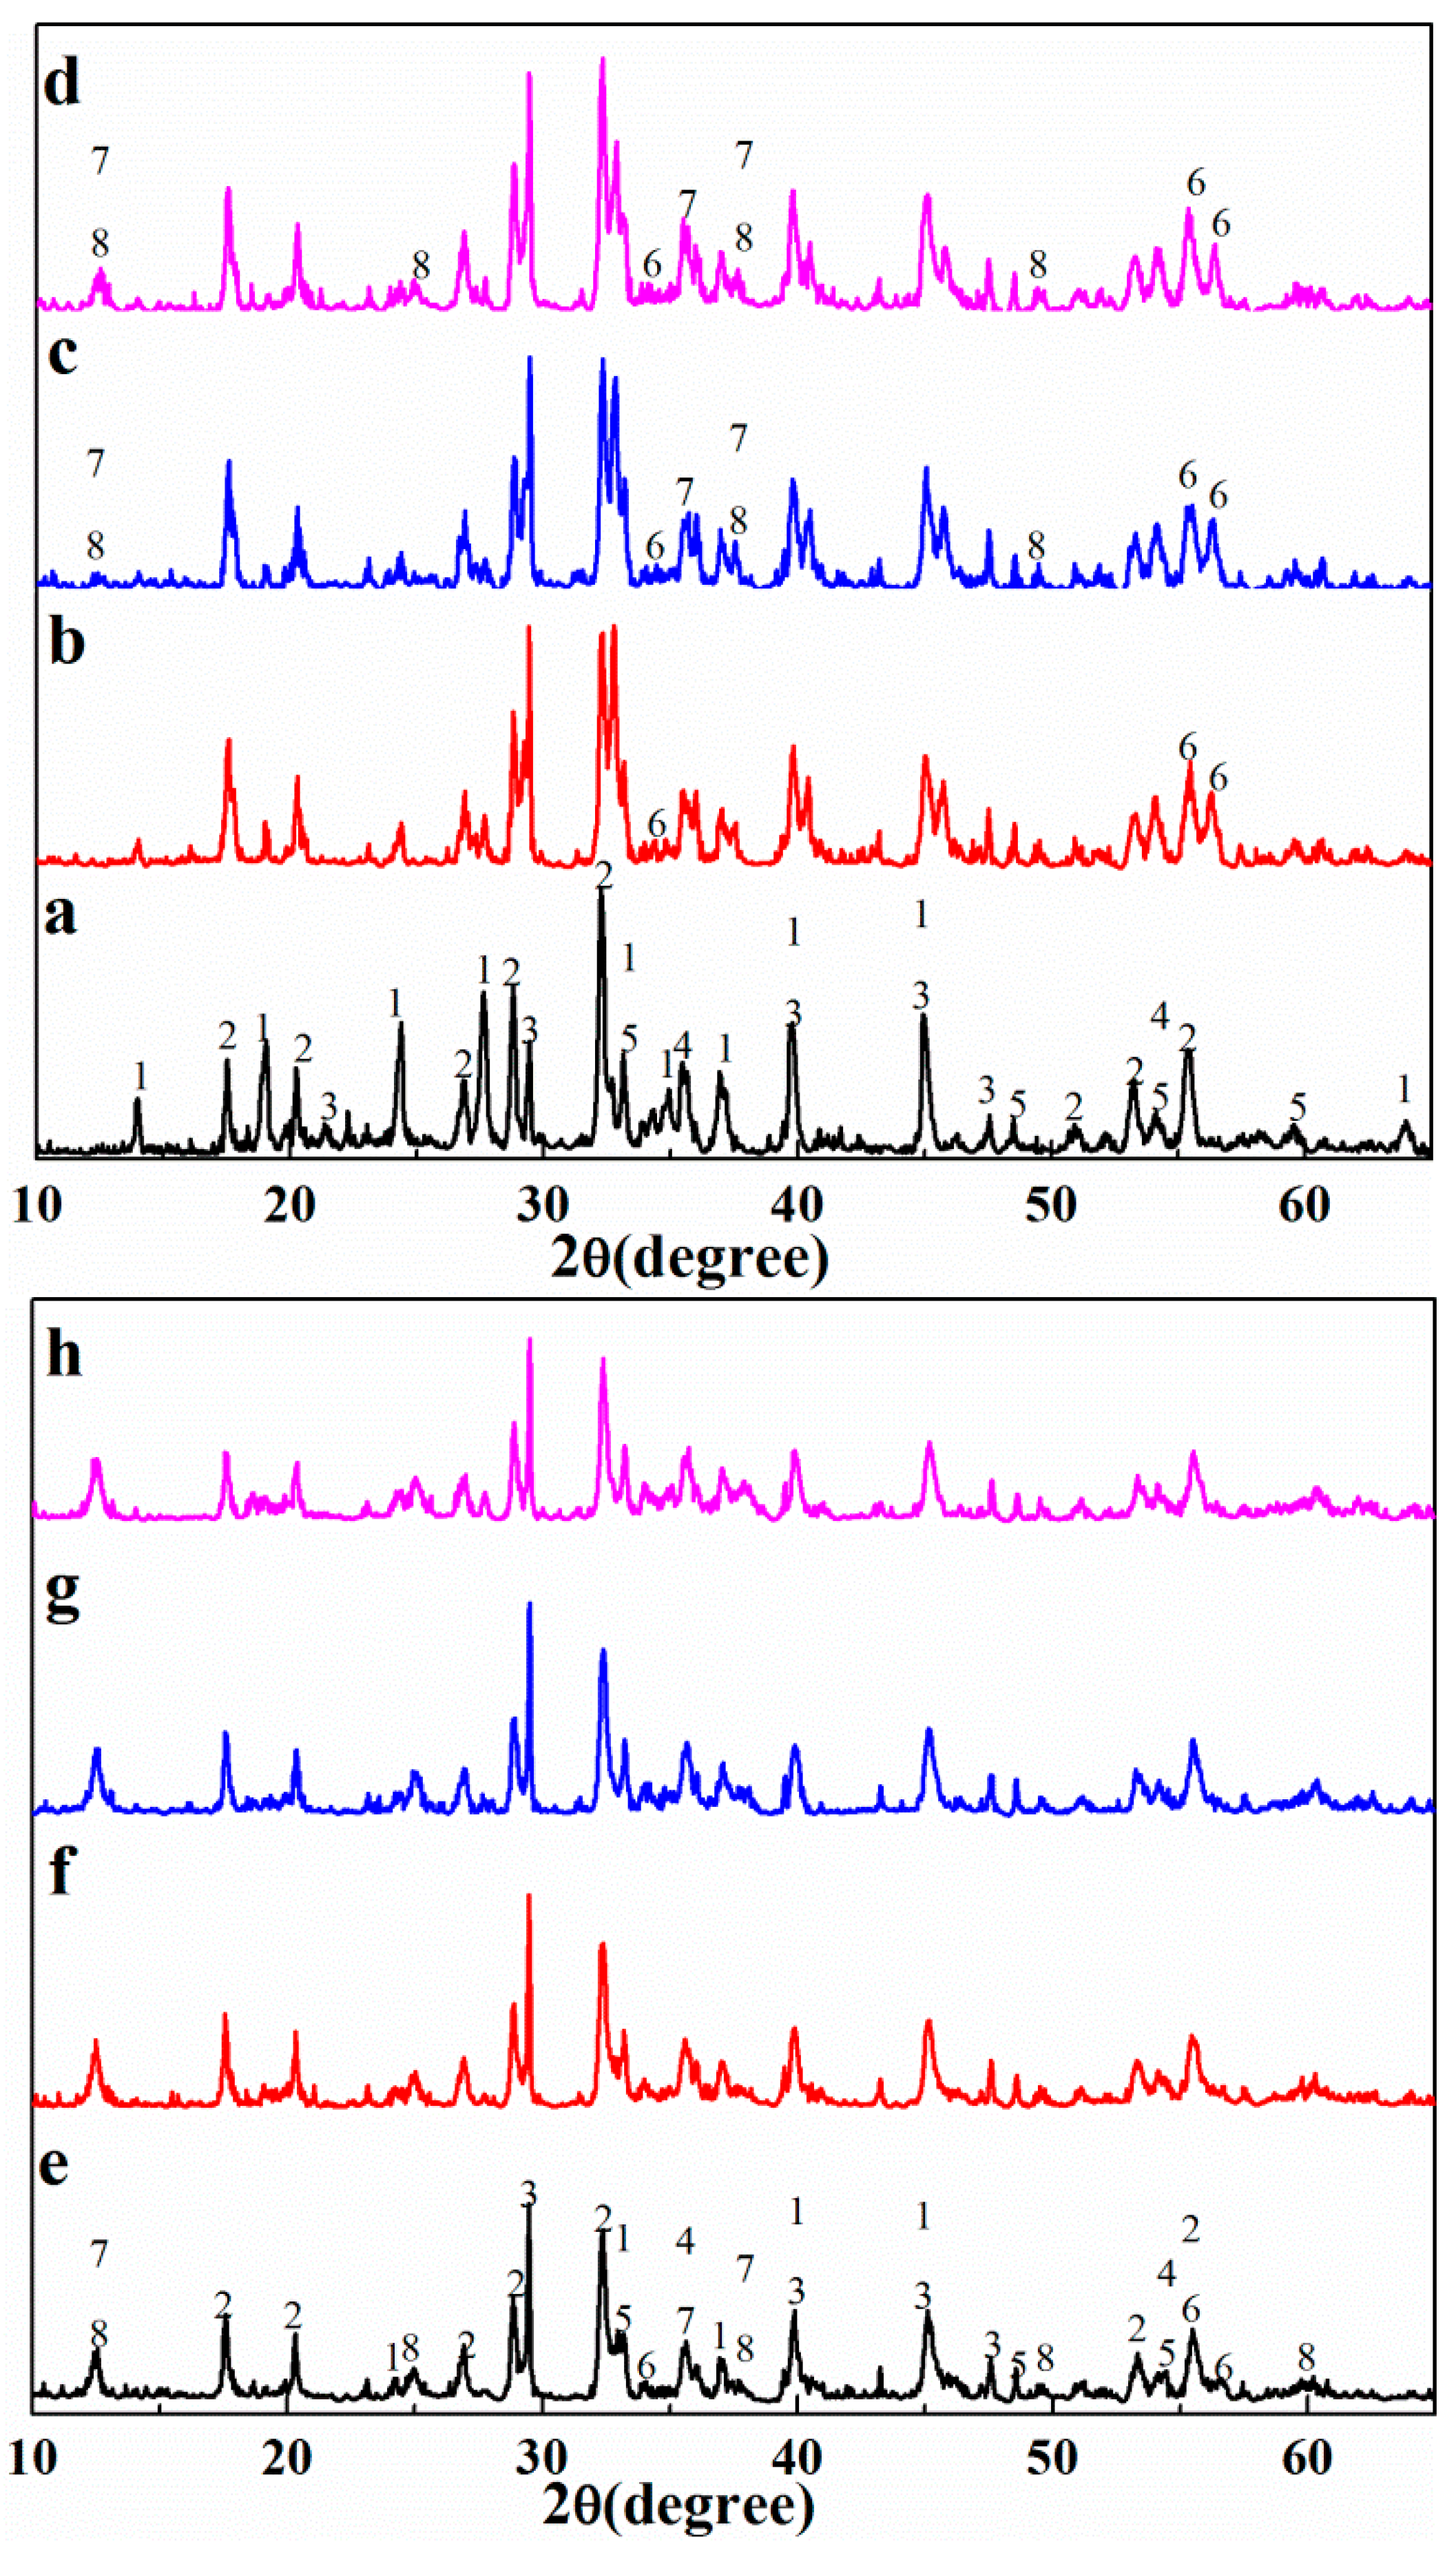
3.3. Phase Differences of CaO/MgO Substituting Na2O

As shown in Figure 5a, the dealkalization product bearing Ca is attributed to katoite with CaO as an addition [23]. However, as shown in Figure 5b,c, most residues bearing Mg are MgO and Mg(OH)2 with MgO as an addition at a temperature lower than 200 °C, indicating the incomplete hydration of MgO and the difficulty in leaching Na2O. In fact, temperature has been proven to play an important role in the hydration process of MgO [26,27]. As the alkali recovery was based on the ion exchange between Ca2+/Mg2+ and Na+ [23], the hydration of MgO and CaO to dissociate the ion was of great importance to the alkali recovery. The reaction kinetics will be discussed in Section 3.4. The XRD patterns in Figure 5 and Table 2 also show the appearance of (Mg4.5Al1.5)(Si2.5Al1.5)O10(OH)8 which is a kind of hydrotalcite-like compound and contributed to the sodium removal. The related reactions can be simplified as follows:
Na8(Si6Al6O24)(H0.88(CO3)1.44)(H2O)2 + CaO + H2O → Ca2.93Al1.97Si0.64O2.56(OH)9.44 + CaCO3 + Na+ + OH
Na8(Si6Al6O24)(H0.88(CO3)1.44)(H2O)2 + MgO + H2O → (Mg4.5Al1.5)(Si2.5Al1.5)O10(OH)8 + CO32− + Na+ + OH
When the temperature increases to 200 °C, the changes in XRD patterns are shown in Figure 6 and Table 3. New hydrotalcite-like compounds of Ca10Mg2Al4(SiO4)5(Si2O7)2(OH)4 and Mg3Si2O5(OH)4 appear when MgO is added. The relating reactions can be simplified as follows:
Na8(Si6Al6O24)(H0.88(CO3)1.44)(H2O)2 + MgO + H2O → Mg3Si2O5(OH)4 +Al(OH)4+ + CO32− + Na+ + OH
Na8(Si6Al6O24)(H0.88(CO3)1.44)(H2O)2+MgO+CaO+H2O → Ca10Mg2Al4(SiO4)5(Si2O7)2(OH)4 + Na+ + CO32− + OH

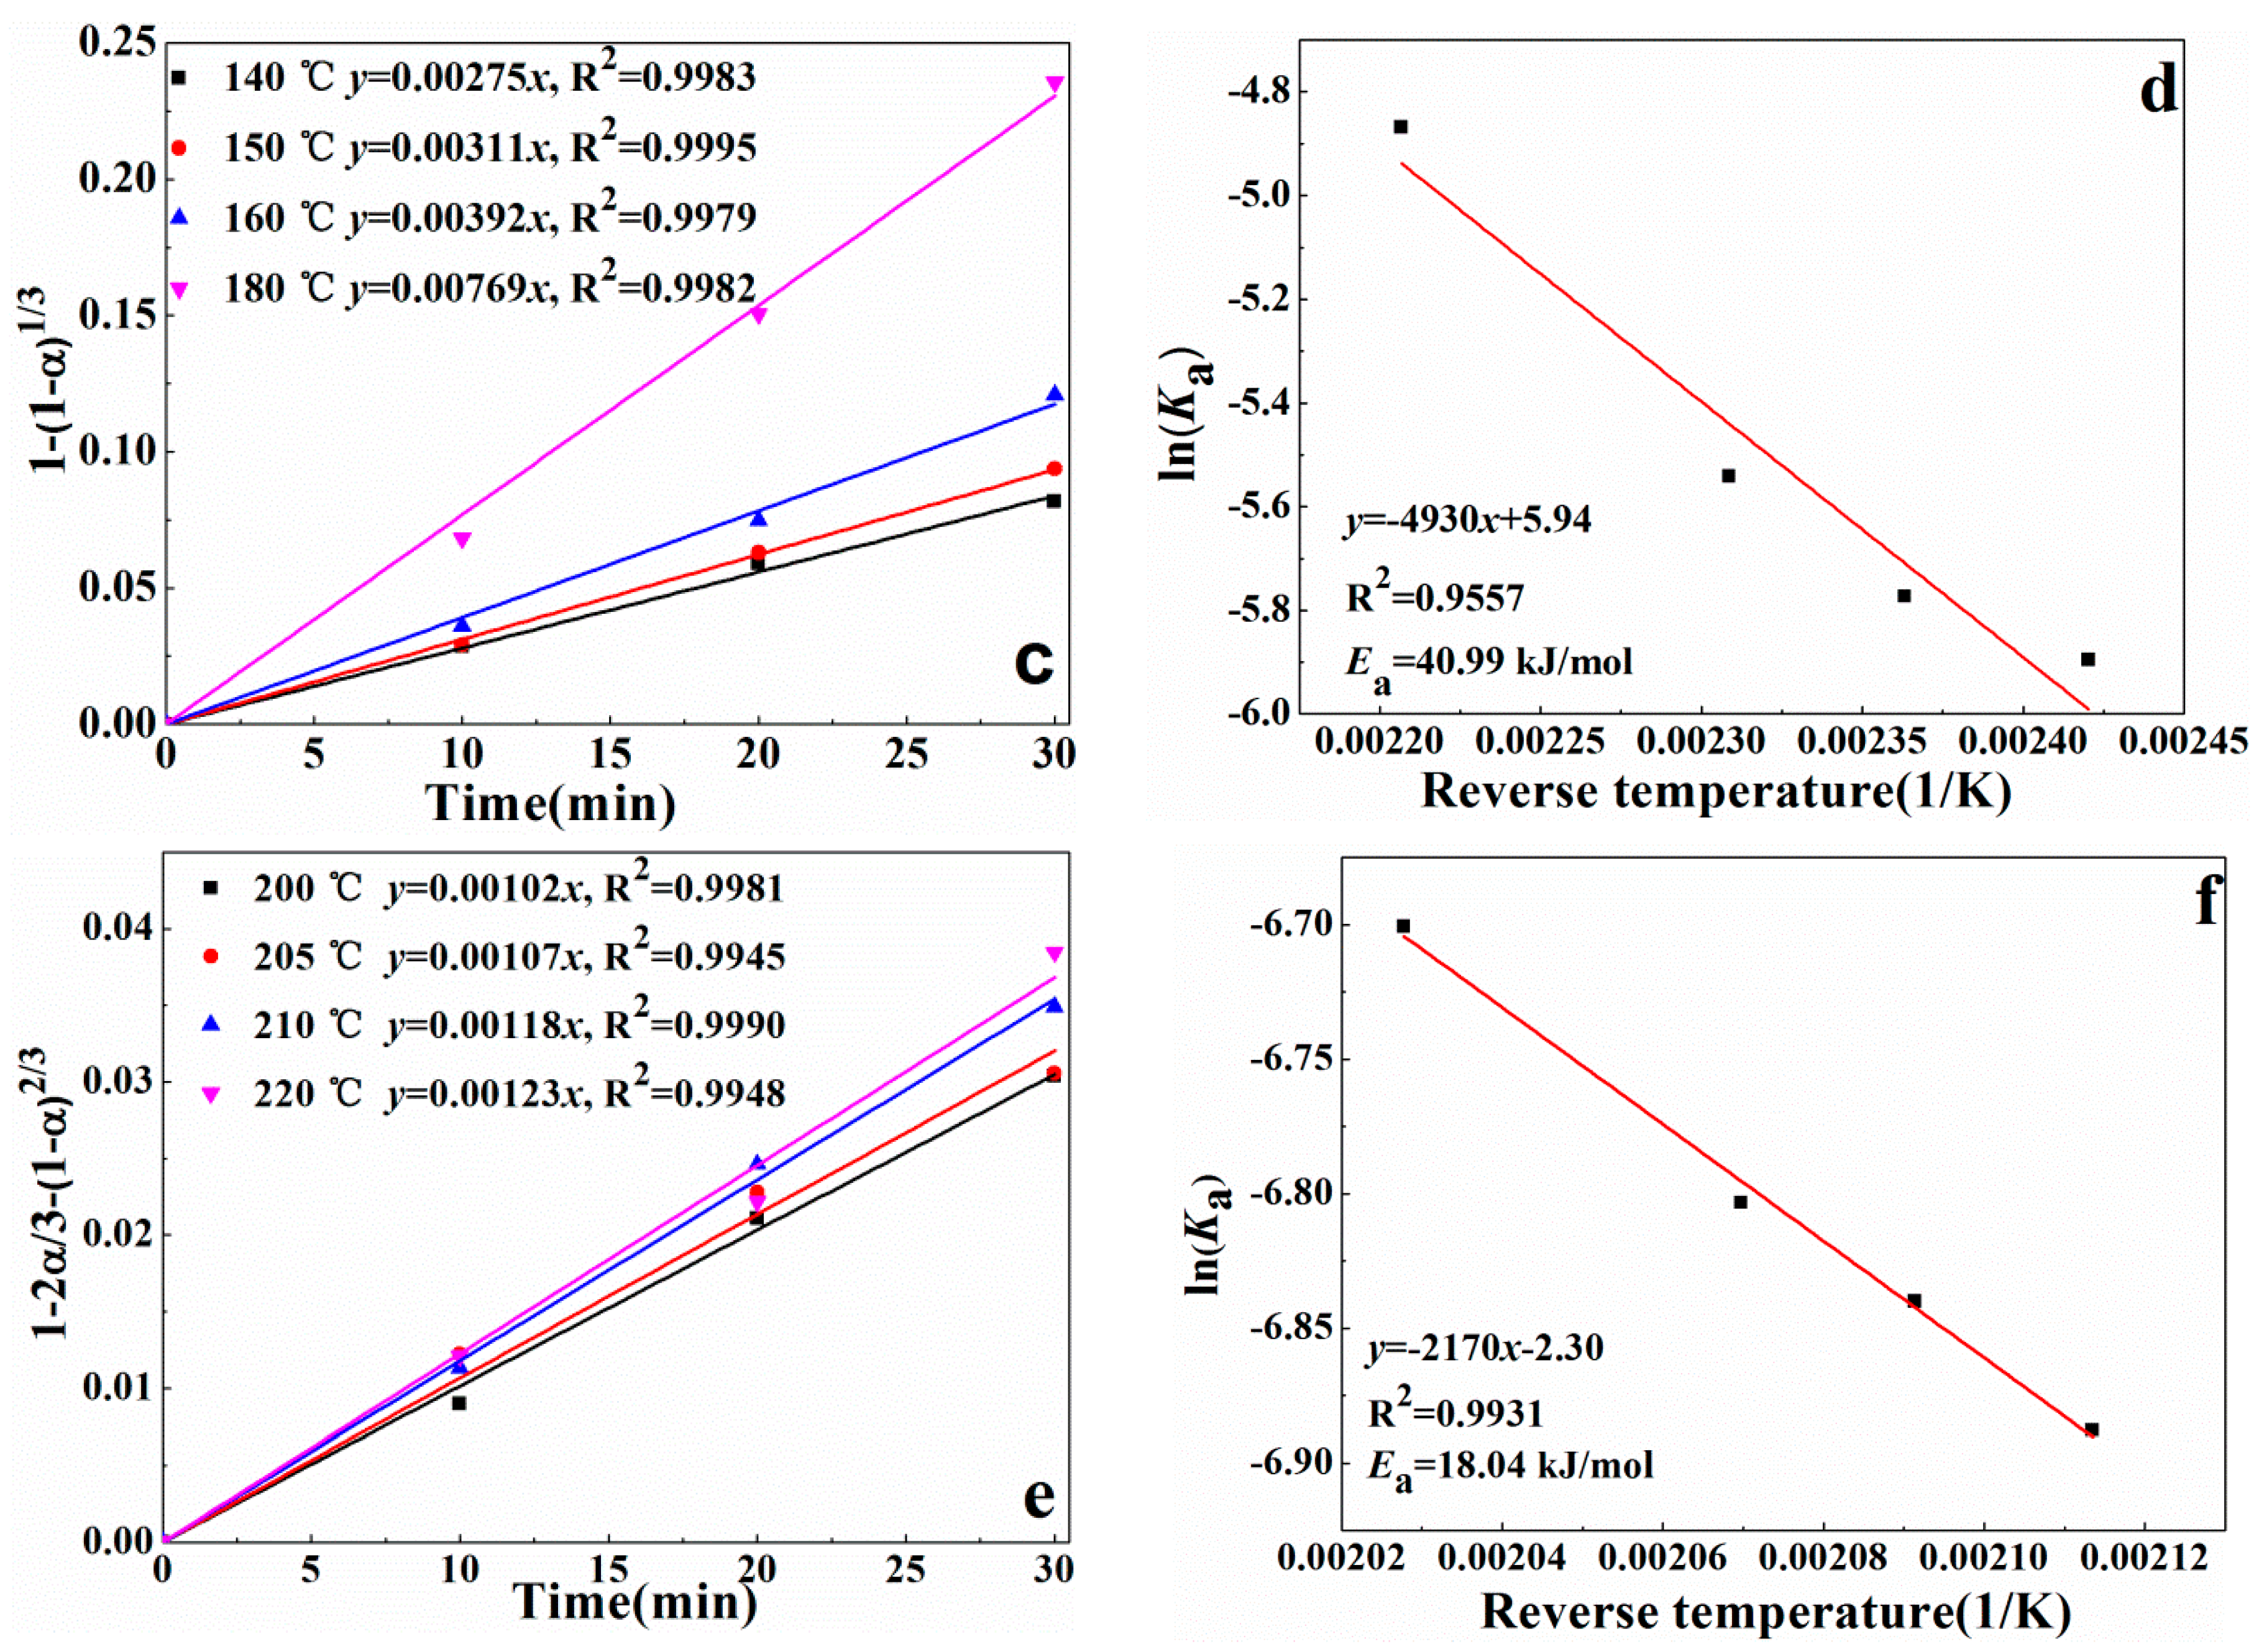
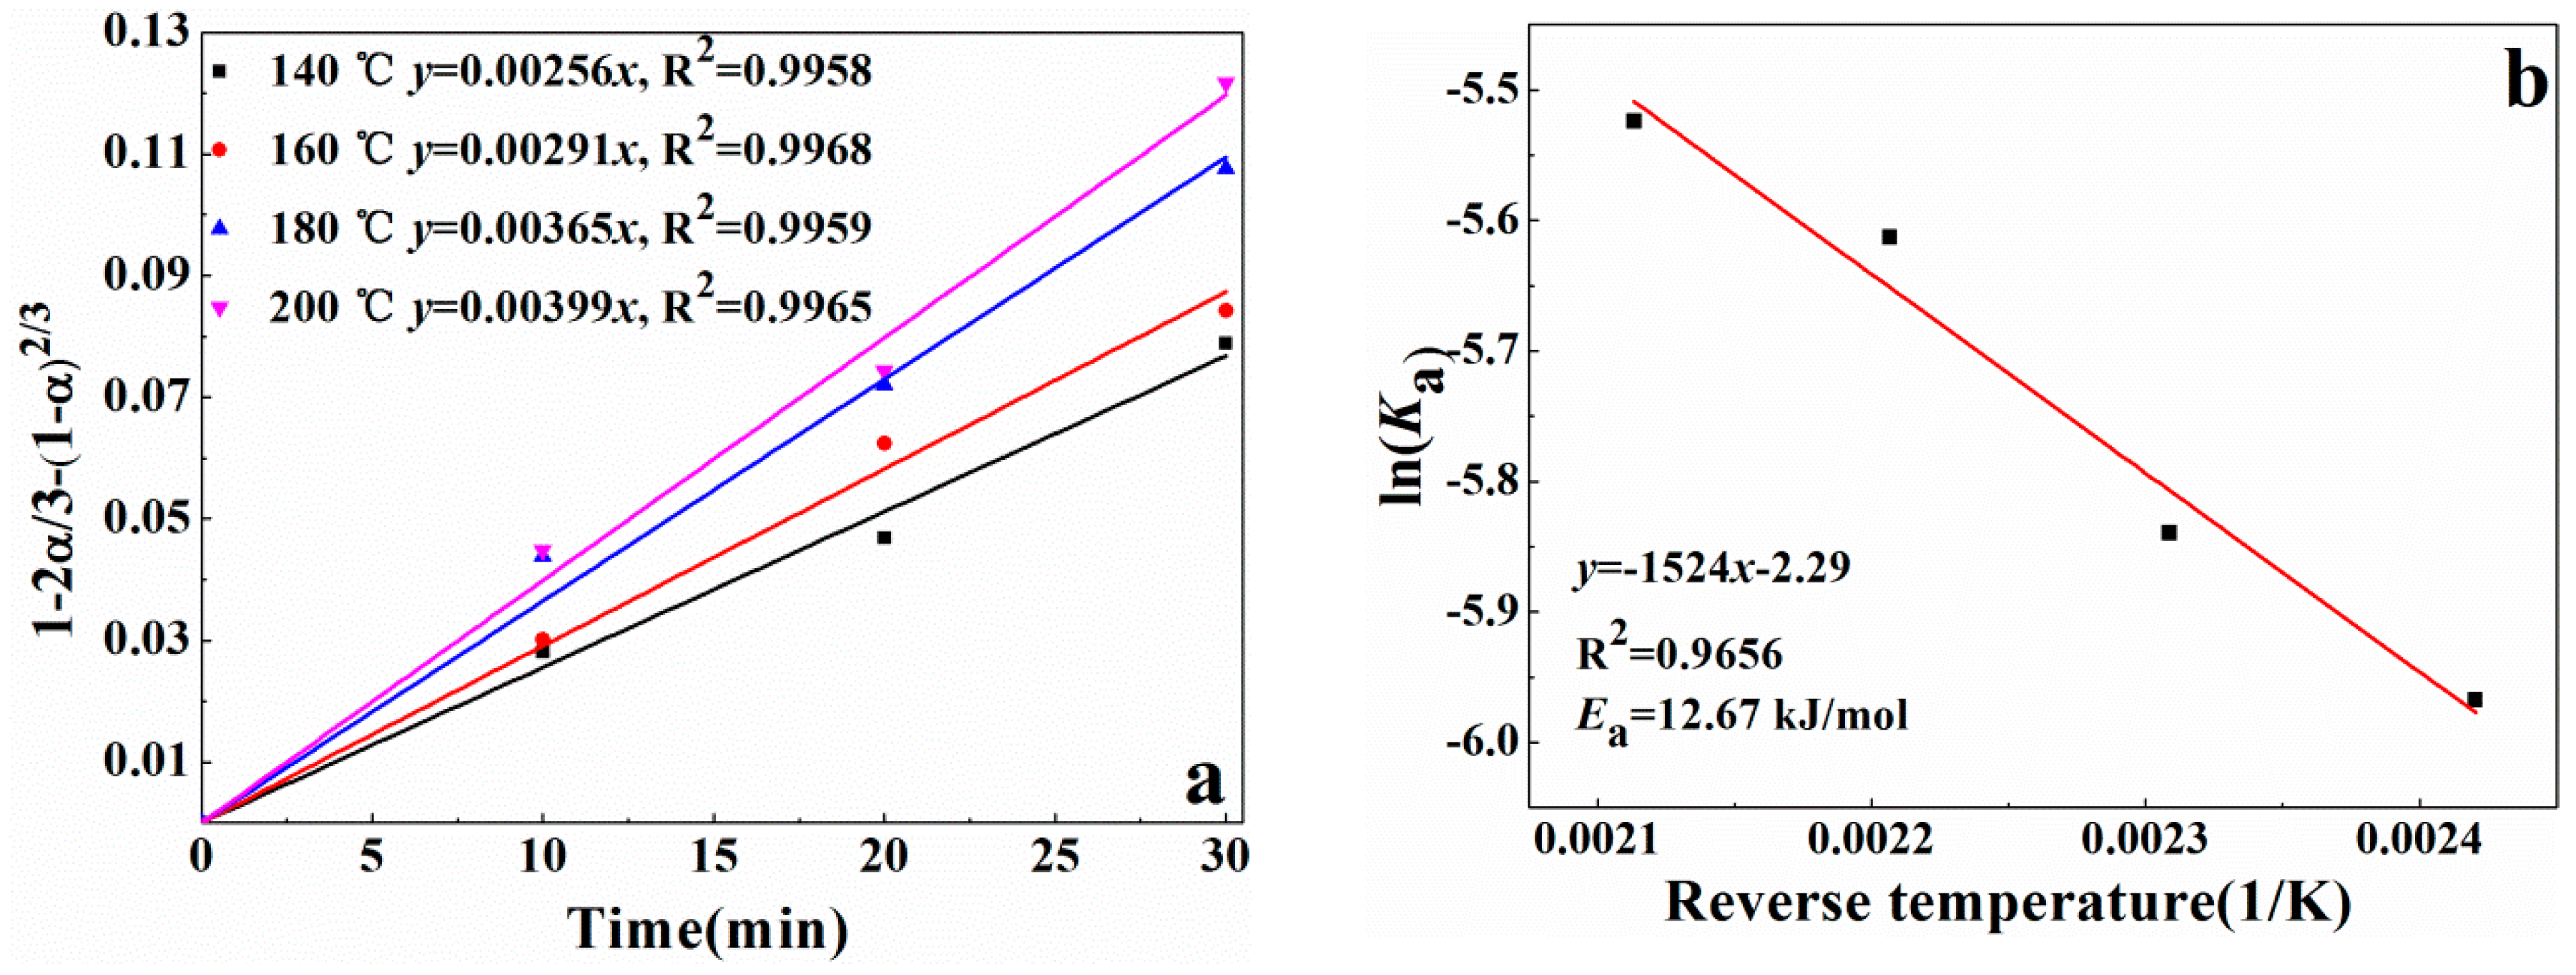
3.4. Reaction Kinetics of Alkali Recovery

The reaction kinetics has been implemented to express the alkali recovery process with CaO or MgO as an addition. According to the shrinking core model (SCM) [28,29], the kinetic equation of the heterogeneous reaction can be expressed as Equation (7) if the process is controlled by internal diffusion or as Equation (8) if controlled by chemical reaction:
k a t   =   1   2 3 α     ( 1     α ) 2 / 3
k b t   =   1     ( 1     α ) 1 / 3
where t represents the reaction time (min), α is the recovery ratio of Na2O (%), ka is the rate constant for the process of internal diffusion, and kb is the rate constant for the chemical reaction. The external diffusion was not considered because the reaction system was fully stirred.
As shown in Figure 7, a period of time of 30 min was used because the reaction was relatively fast. The alkali recovery process is controlled by internal diffusion with CaO as an addition and the activation energy is calculated to be 12.67 kJ/mol. In contrast, the recovery process with MgO as an addition is controlled by chemical reaction with an apparent activation energy of 40.99 kJ/mol when the temperature is lower than 200 °C, while this process is controlled by internal diffusion with an apparent activation energy of 18.04 kJ/mol when the temperature is higher than 200 °C. The supporting information showed the recovery ratio of alkali versus time (Supplementary Materials Tables S1 and S2) and the calculation of the CaO/MgO leaching reaction with the other SCM model (Figure S1) to show the differences.
The alkali recovery process can be principally divided into the following five steps: (1) the hydration of CaO/MgO; (2) the dissociation of Ca(OH)2/Mg(OH)2; (3) the diffusion of Ca2+/Mg2+ from the bulk solution to the Na+ detached site of cancrinite; (4) the ion exchange between Ca2+/Mg2+ and Na+; (5) the diffusion of Na+ to the bulk solution [28]. It can be speculated that the alkali recovery process with CaO as an addition may be controlled by the third step or the fifth step in this study based on a consideration of the hydration process, the obtained rate equation and the activation energy. In contrast, the process with MgO as an addition may be mostly controlled by the first step at low temperatures, and the rate equation together with the activation energy is consistent with the results of MgO hydration under similar conditions [27]. Therefore, as the MgO hydration rate increases with increasing temperature, the recovery ratio of Na2O with pure MgO as an addition also increases significantly.
As shown above, the alkali recovery process with MgO as an addition was controlled by internal diffusion, rather than by reaction at higher temperatures. Besides, for 30 minutes the extraction of alkali using MgO (Figure 7e) was much lower than when using CaO (as compared to Figure 7a), and it was because the hydration of MgO was relatively slow compared with CaO, so there was an induction period when using MgO. Moreover, as the solubility of calcium hydroxide is higher than that of magnesium hydroxide, the hydrolysis rate of magnesium hydroxide may be slower than that of calcium hydroxide. Theoretically, the cancrinite is hexagonal with the space group of P63 [23], and Mg2+ was easier to obtain through the openings as the radius of Mg2+ is smaller than that of Ca2+. However, the experimental results show that the recovery ratio does not increase monotonously with the increasing MgO proportion, as shown in Figure 4. It can be explained by the fact that the cancrinite transformed to hydrotalcite-like compounds bearing Mg, of which the lamellar structure as well as the loosened surface was conducive to the further substitution of Na+ [13,30]. However, the hydration of MgO was speculated to be much faster than the substitution reaction, together with the lesser usage of Me to exchange Na at high temperatures, leading to the increasing existence of Mg(OH)2 (or Ca(OH)2) on the surface of solid products upon further addition. This may in turn have prevented the diffusion of Na+ from the cancrinite to the bulk solution. As a result, the recovery efficiency decreased rather than increased when the addition proportion of MgO was higher than 50%.

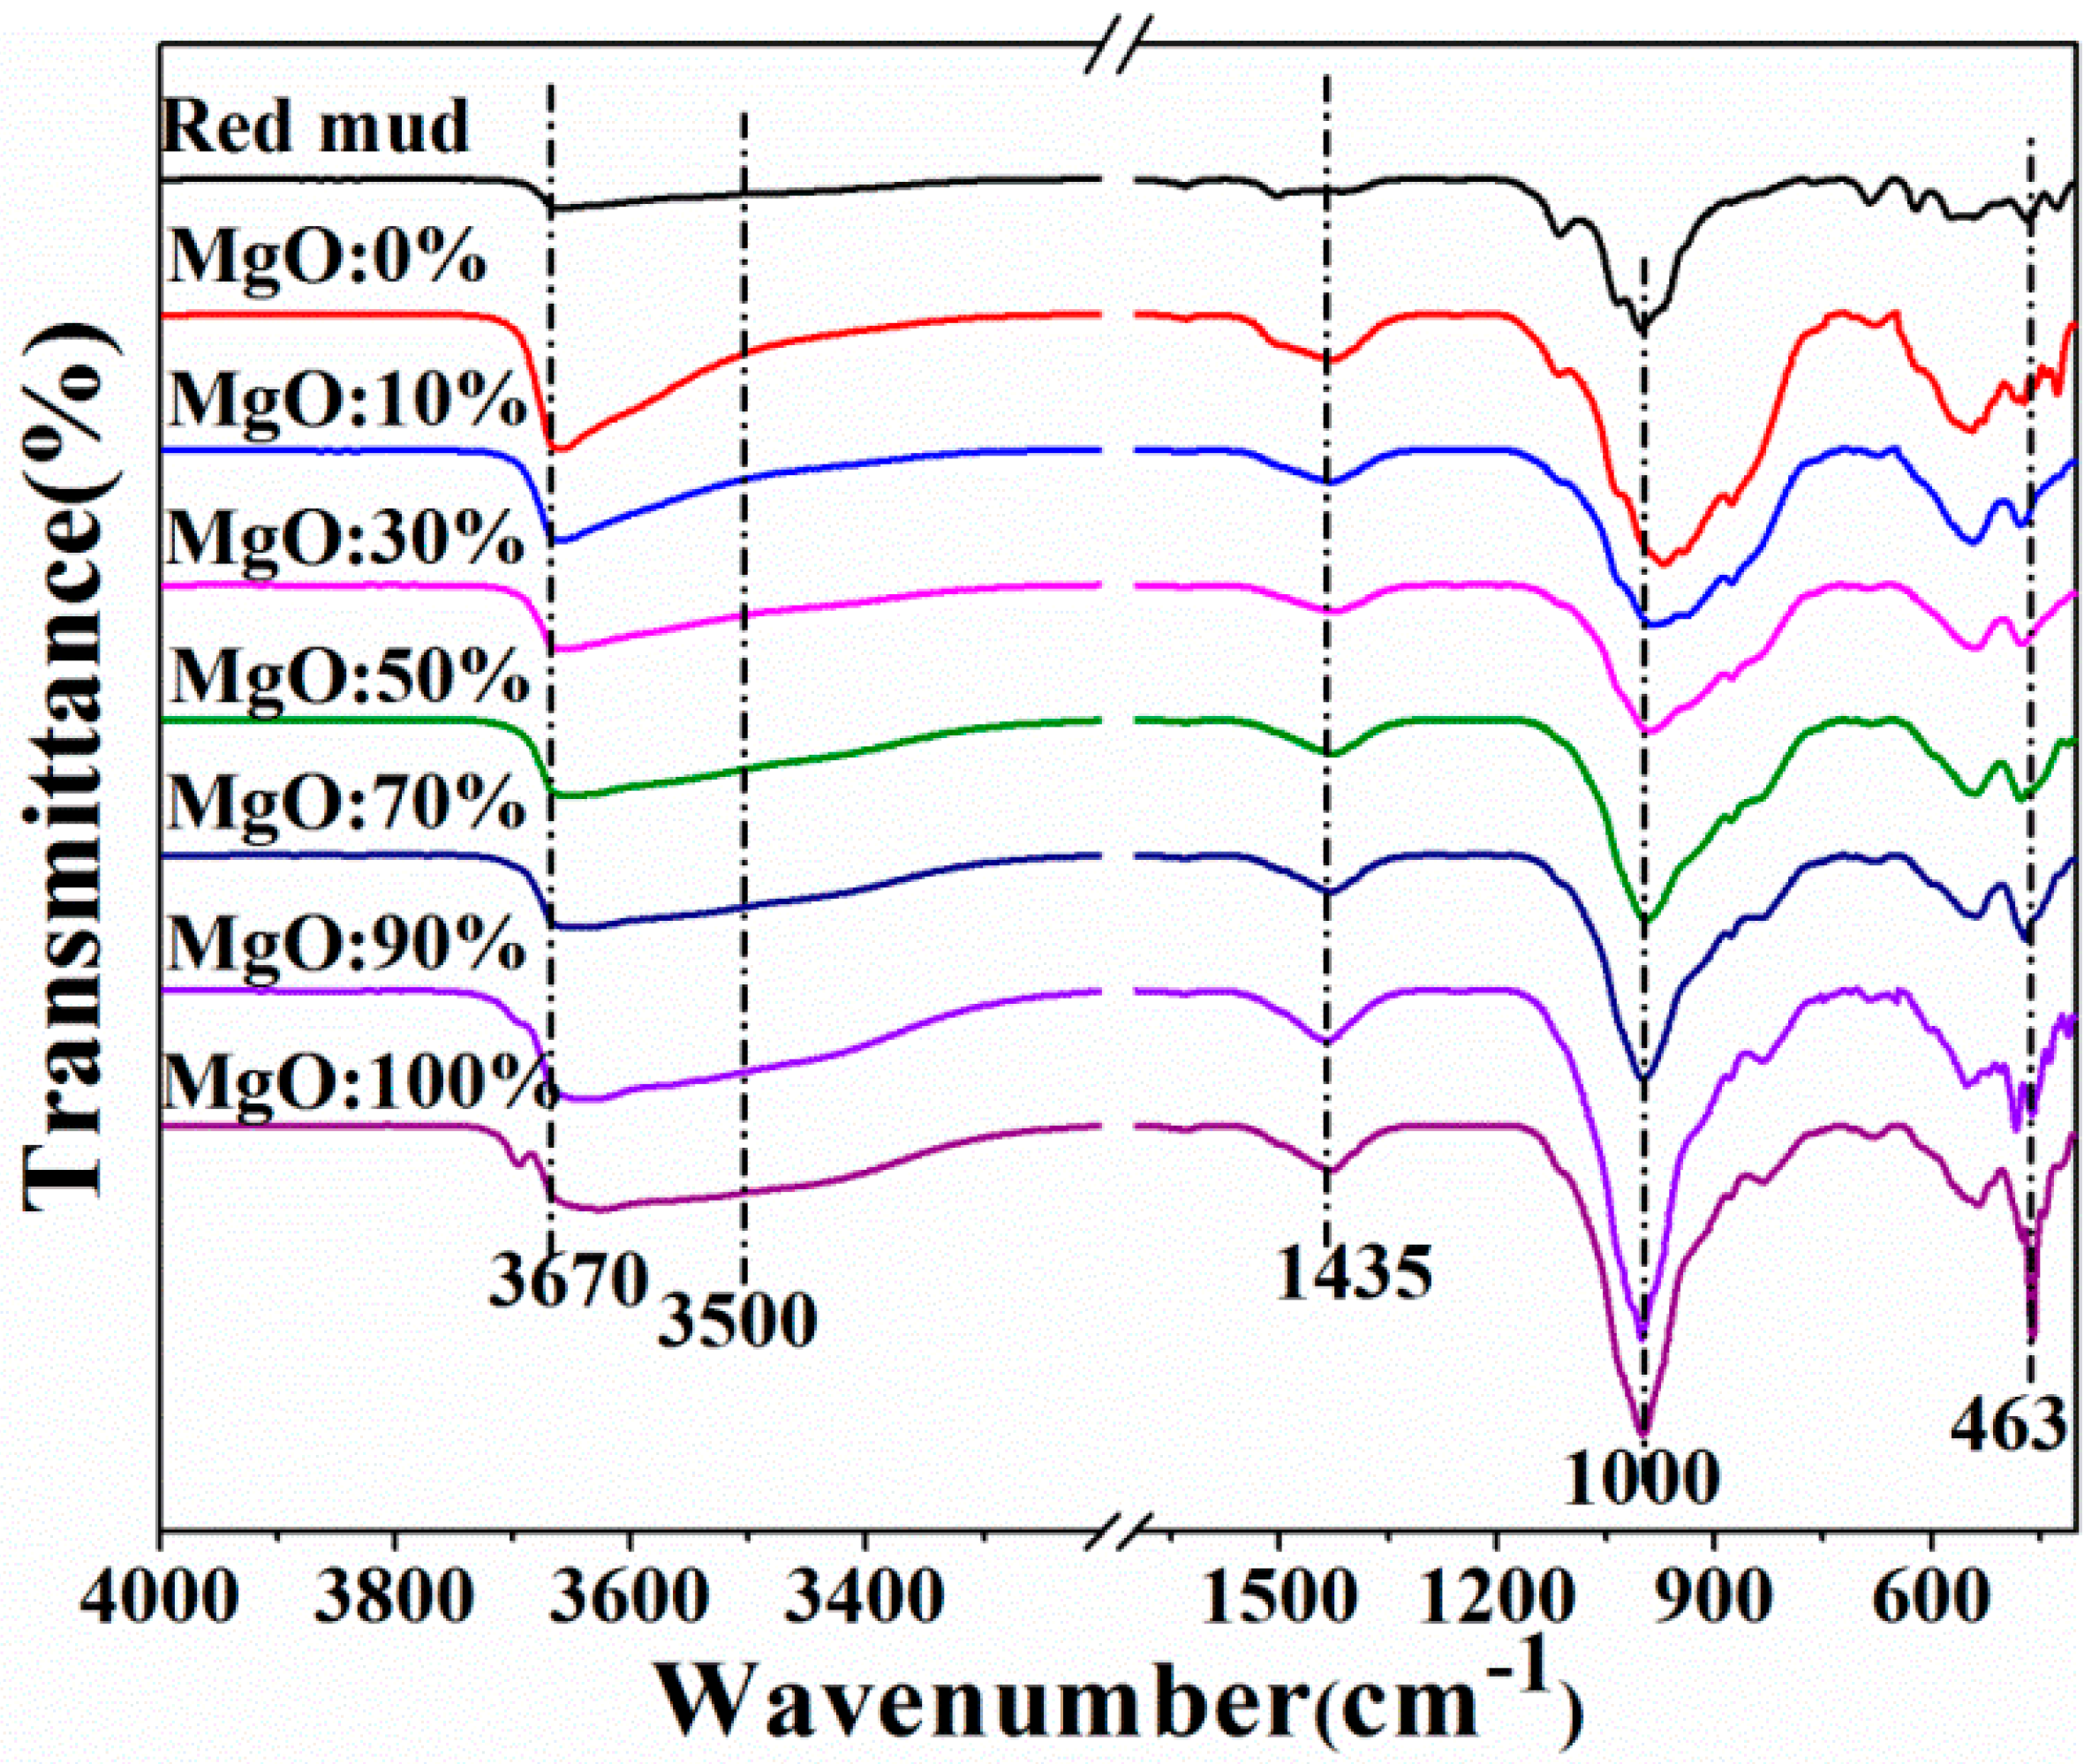
3.5. FTIR Spectra Analysis

To explore the frameworks and the valence-bond structures, the FTIR spectra of the red mud and all leached solid samples were collected in the range of 4000–400 cm−1 at room temperature. The results are shown in Figure 8.
The peaks around 3700–3500 cm−1 can be attributed to the vibration of CaO–H and AlO–H bonds in the solids [31], and the peak intensity shows a sudden increase with the addition of CaO, which is consistent with the phase changes. The broad absorption bands around 3500–3400 cm−1 can be attributed to the -OH stretching vibration of hydroxyl groups in layer structures [32]. Owing to the overlapping of Mg–OH and Al–OH bonds related with newly formed hydrotalcite-like structures, the bands in this region became stronger and broader with the increasing proportion of MgO. The peaks between 1500 and 1400 cm−1 are attributed to the overtone of Mg–O and Al–O lattice vibrations [33]. The absorption bands around 1000 cm−1 are generally assigned to the metal–oxygen skeletal stretching and bending vibration of hydrotalcite, and the peaks around 463 cm−1 can be attributed to Mg–O vibrations in the mixed Mg–Al oxide. The increasing intensity of these two peaks shows strong evidence of the production of hydrotalcite-like structures [34,35]. To sum up, the formation of hydrotalcite-like structures is proved by the significant changes in FTIR spectra.

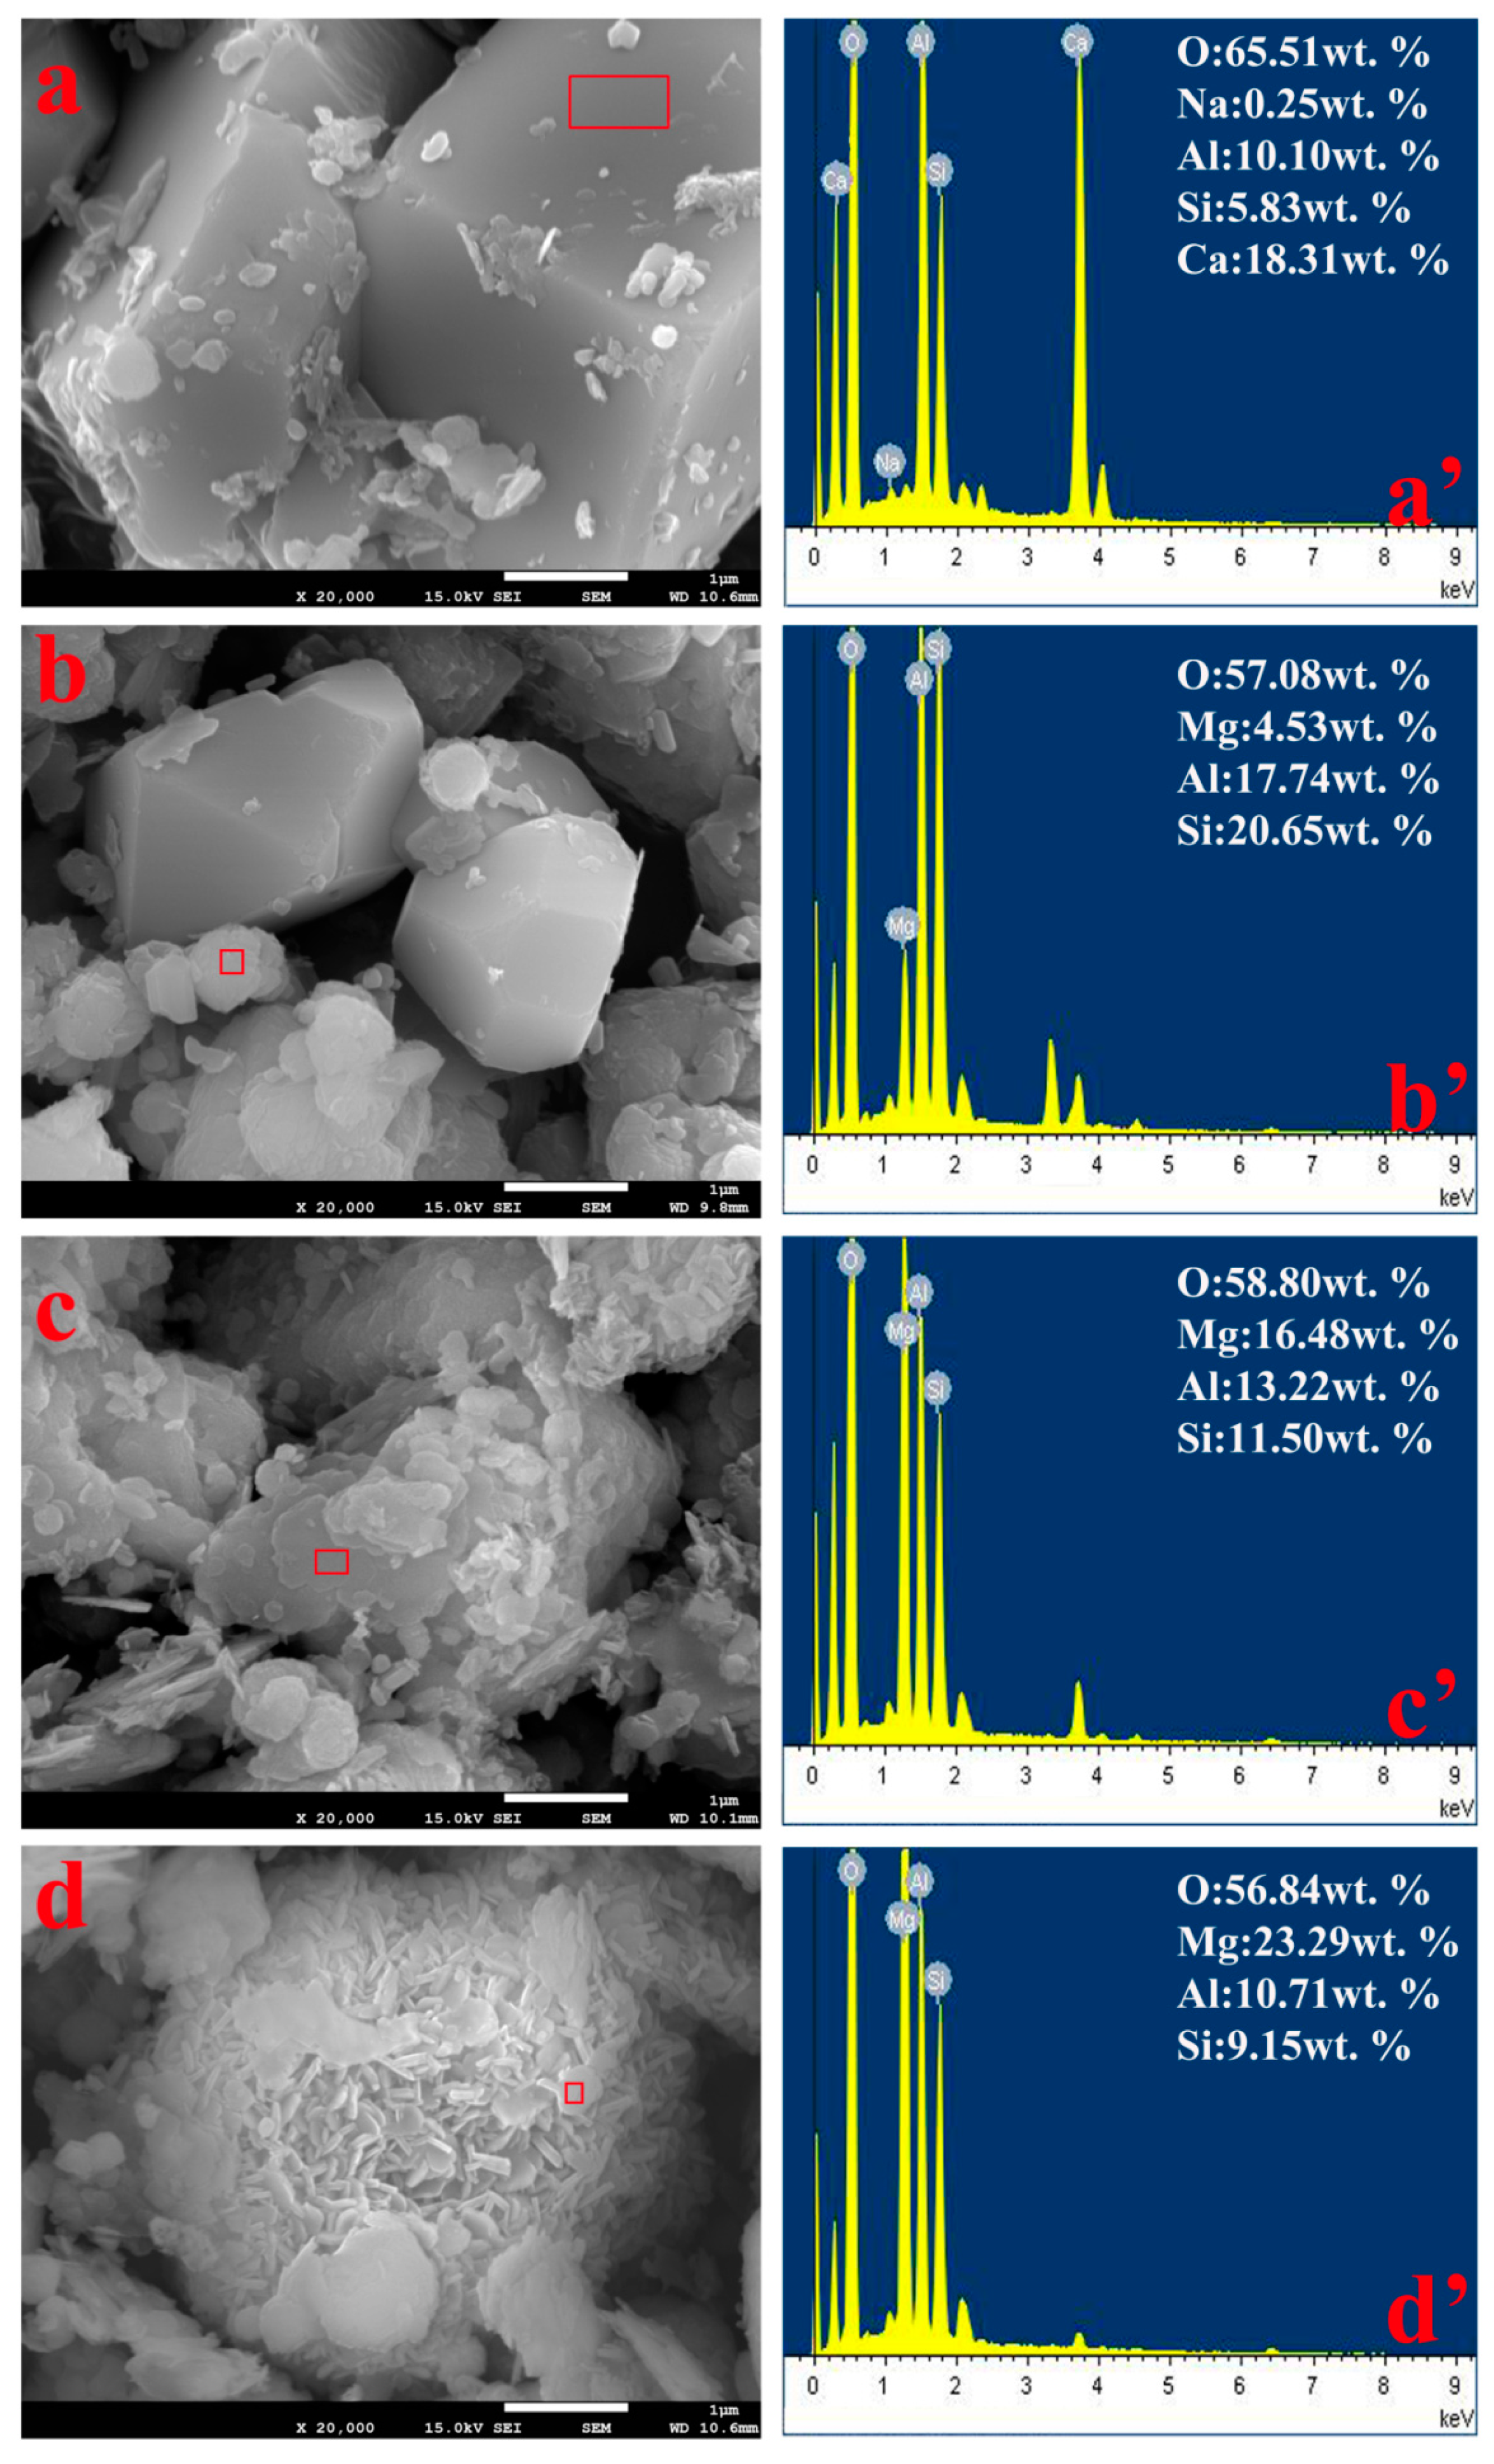
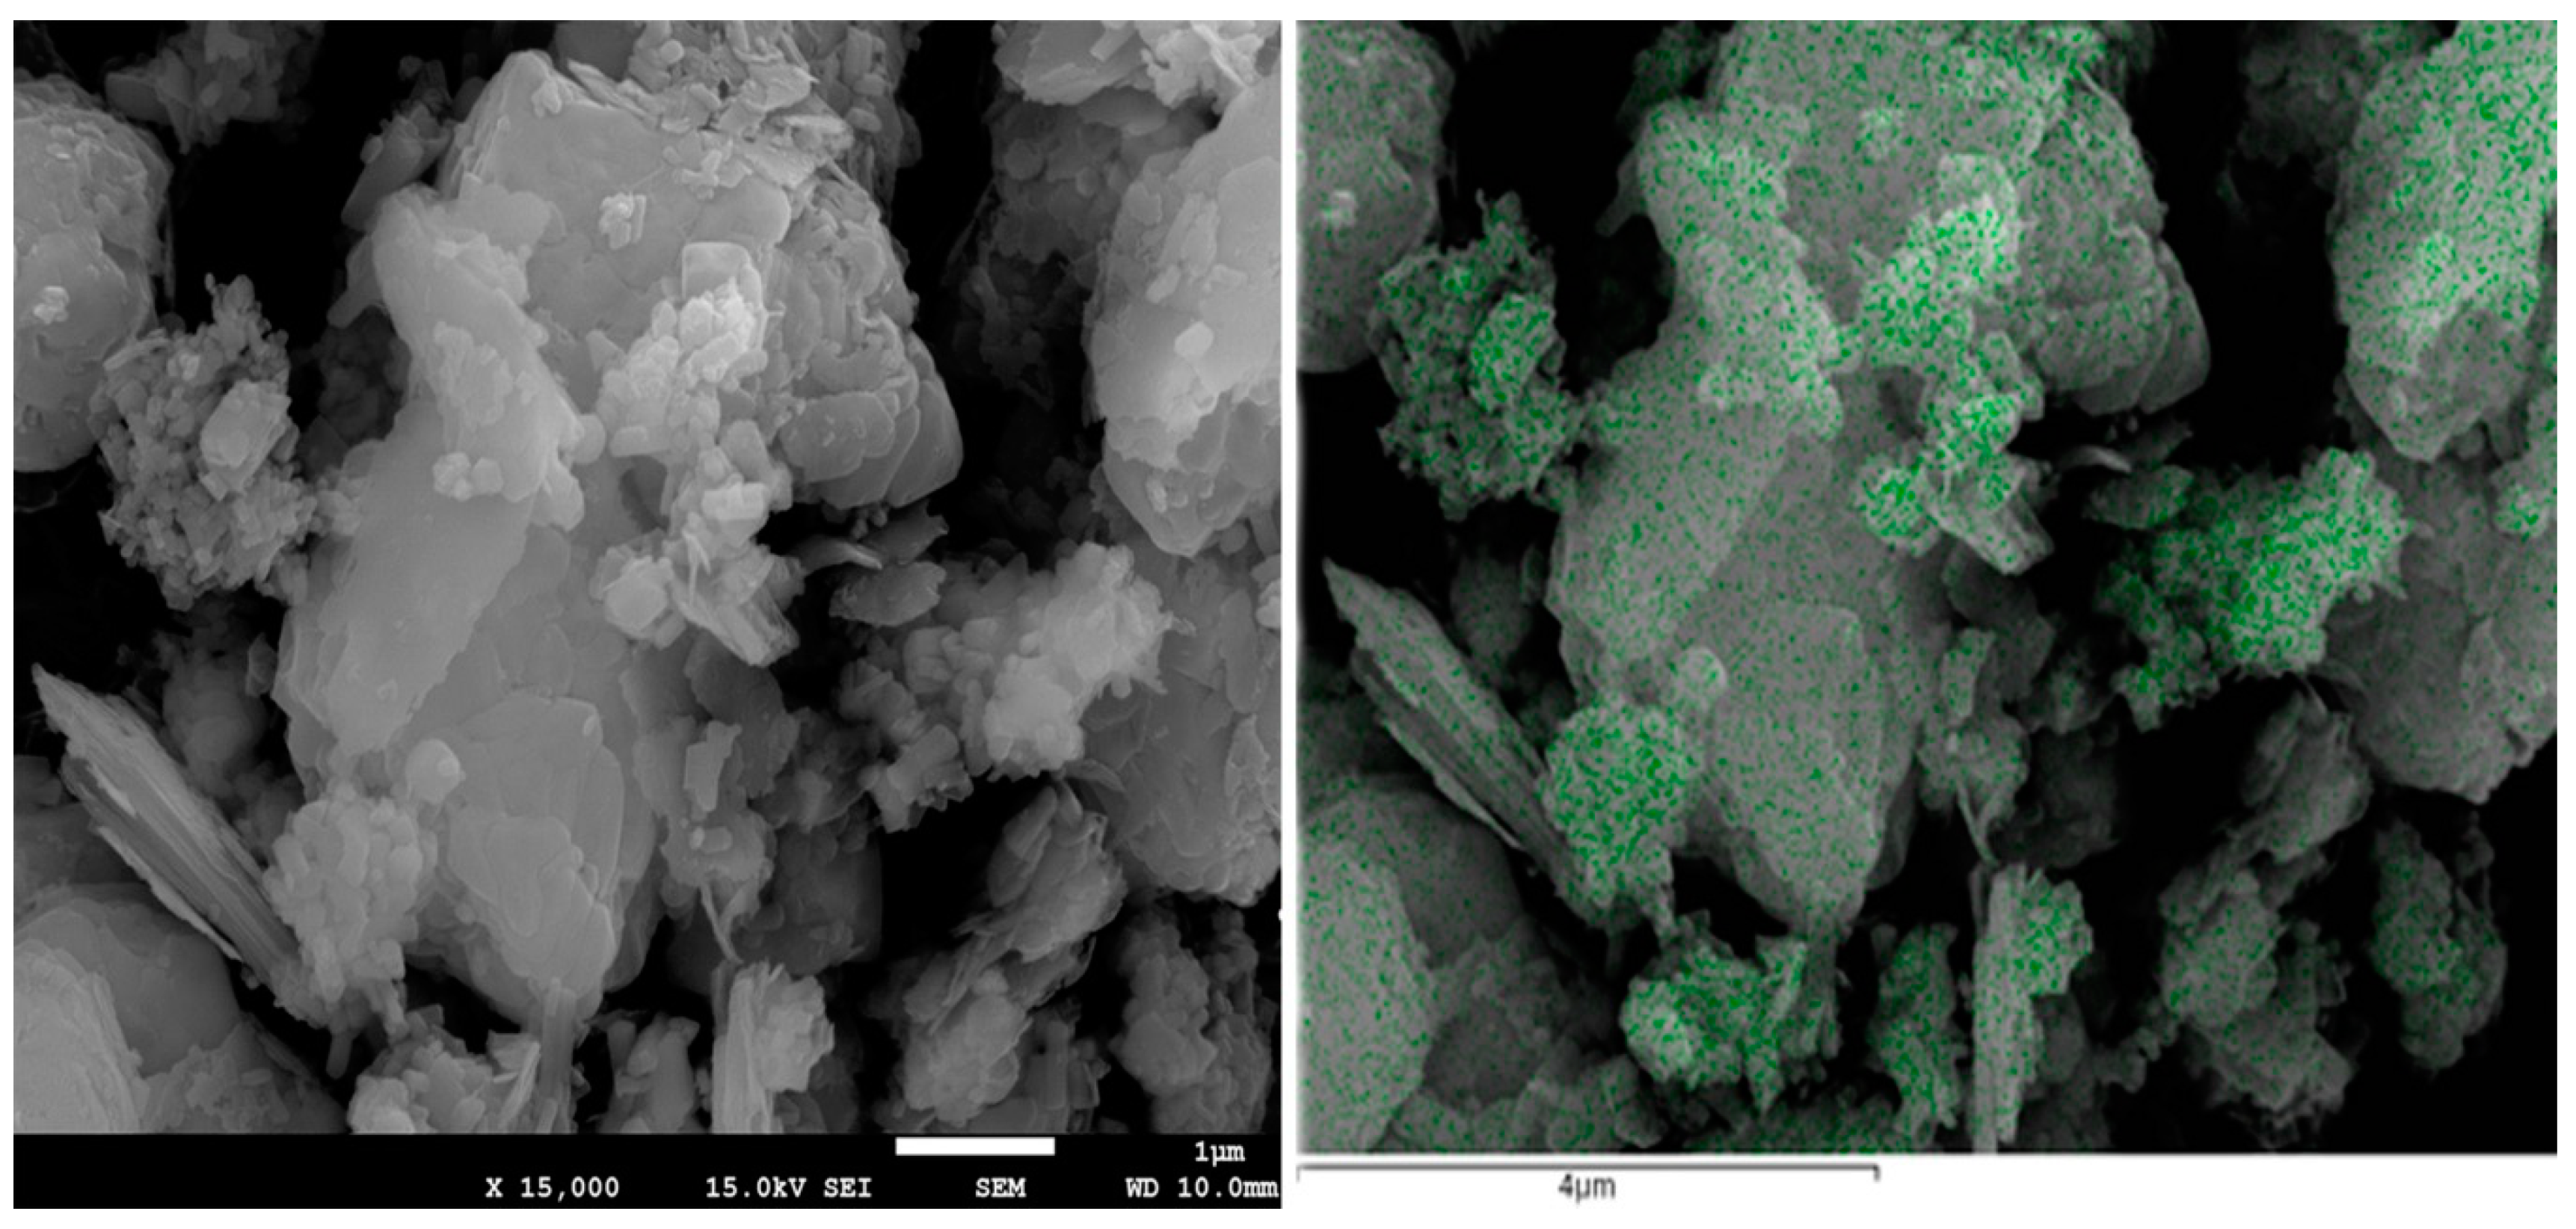
3.6. Solid Morphology

There are two types of appearance of solids after dealkalization at 200 °C, as shown in Figure 9. The polyhedral particles with a dense structure are verified to be Ca2.93Al1.97Si0.64O2.56(OH)9.44 by EDS analysis in Figure 9a’, and the dense structure further supports the speculation that the reaction is controlled by internal diffusion with CaO as an addition. Moreover, a small amount of Na was still detected. However, the solid products containing Mg show a lamellar appearance with a loose structure. For example, 30% MgO addition caused sporadical slakes distributed on the dense particles of calcium garnet, and more MgO addition led to the generation of more slakes and their aggregates. The lamellar and loose structures are consistent with the morphology of hydrotalcite-like structures which have been reported by other researchers [35].

4. Conclusions

Recovery of alkali from Bayer red mud was investigated systematically with CaO and/or MgO as additions for the first time. It was found that the blend of CaO and MgO had a better capacity to substitute alkali from the red mud when the temperature was no less than 200 °C. The highest Na2O recovery of 89.3% with N/S of 0.03 was obtained at 50% MgO addition at 200 °C. Moreover, MgO substitution to Na2O was found to be more temperature-dependent than that of CaO through different reaction mechanisms. The Na2O recovery process with MgO as an addition was controlled by reaction when the temperature was lower than 200 °C, but it was controlled by internal diffusion at a higher temperature. However, the process was always controlled by internal diffusion in the whole temperature range studied when CaO was used as an addition.
XRD analysis, FTIR analysis and SEM-EDS confirmed the hydrotalcite-like structure of solid products bearing Mg. To sum up, the recovery efficiency was the result of the reaction kinetics and the characteristics of solid products. This study can provide reference for the reaction mechanism investigation of alkali recovery from red mud based on ion exchange. It also provides a new idea for the treatment of red mud.

Supplementary Materials

The following are available online at https://www.mdpi.com/2075-163X/9/5/269/s1, Figure S1: Kinetic fitting of (a) the plots of [1   (1 α)1/3] versus time for CaO, (b) ln(Ka) versus temperature for CaO, (c) the plots of [1   2 3 α   (1   α)2/3] versus time for MgO lower than 200 °C, (d) ln(Ka) versus temperature for MgO lower than 200 °C, (e) the plots of [1   (1 α)1/3] versus time for MgO higher than 200 °C and (f) ln(Ka) versus temperature for MgO higher than 200 °C, Table S1: Recovery ratio (wt. %) of alkali extraction on time with pure CaO as addition under different temperatures, Table S2: Recovery ratio (wt. %) of alkali extraction on time with pure MgO as addition under different temperatures.

Author Contributions

Investigation, B.Z. and S.C.; Supervision, F.C.; Writing—original draft, B.Z.; Writing—review & editing, B.Z., S.C., F.C., F.Z. and Y.Z.

Funding

This research was funded by the National Natural Science Foundation of China (No. 51674233); the Henan Transfer Project of CAS Scientific and Technological Achievements (No. 2019103); the Guangxi Natural Science Foundation (No. 2016GXNSFEA380002); and the Shanxi Province Coal Based Low-carbon Technology Major Projects (No. MC2016-05).

Conflicts of Interest

The authors declare no conflict of interest.

References

  1. Chen, H.; Huo, Y.B.; Yuan, Y.; Shen, L.Y.; Xia, Y.Z.; Chai, Y.; Zhang, Q.; Wang, N.N. Regional statistics of alumina production in China from January to December 2017. China Alum. Mon. 2018, 230, 130–131. [Google Scholar]
  2. Roosen, J.; Van Roosendael, S.; Borra, C.R.; Van Gerven, T.; Mullens, S.; Binnemans, K. Recovery of scandium from leachates of Greek bauxite residue by adsorption on functionalized chitosan-silica hybrid materials. Green Chem. 2016, 18, 2005–2013. [Google Scholar] [CrossRef]
  3. Lehoux, A.P.; Lockwood, C.L.; Mayes, W.M.; Stewart, D.I.; Mortimer, R.J.G.; Gruiz, K.; Burke, I.T. Gypsum addition to soils contaminated by red mud: Implications for aluminium, arsenic, molybdenum and vanadium solubility. Environ. Geochem. Health 2013, 35, 643–656. [Google Scholar] [CrossRef] [PubMed]
  4. Smith, P. The processing of high silica bauxites-review of existing and potential processes. Hydrometallurgy 2009, 98, 162–176. [Google Scholar] [CrossRef]
  5. Shoppert, A.A.; Loginova, I.V.; Rogozhnikov, D.A.; Karimov, K.A.; Chaikin, L.I. Increased as adsorption on maghemite-containing red mud prepared by the alkali fusion-leaching method. Minerals 2019, 9, 60. [Google Scholar] [CrossRef]
  6. Power, G.; Grafe, M.; Klauber, C. Bauxite residue issues: I. Current management, disposal and storage practices. Hydrometallurgy 2011, 108, 33–45. [Google Scholar] [CrossRef]
  7. Klauber, C.; Gräfe, M.; Power, G. Bauxite residue issues: II. Options for residue utilization. Hydrometallurgy 2011, 108, 11–32. [Google Scholar] [CrossRef]
  8. Liu, Z.B.; Li, H.X. Metallurgical process for valuable elements recovery from red mud—A review. Hydrometallurgy 2015, 155, 29–43. [Google Scholar] [CrossRef]
  9. Enserink, M. Envrionment after red mud flood, scientists try to halt wave of fear and rumors. Science 2010, 330, 432–433. [Google Scholar] [CrossRef] [PubMed]
  10. Ning, G.; Zhang, B.; Liu, C.; Li, S.; Ye, Y.; Jiang, M. Large-scale consumption and zero-waste recycling method of red mud in steel making process. Minerals 2018, 8, 102. [Google Scholar] [CrossRef]
  11. Brunori, C.; Cremisini, C.; Massanisso, P.; Pinto, V.; Torricelli, L. Reuse of a treated red mud bauxite waste: Studies on environmental compatibility. J. Hazard. Mater. 2005, 117, 55–63. [Google Scholar] [CrossRef] [PubMed]
  12. Grafe, M.; Power, G.; Klauber, C. Bauxite residue issues: III. Alkalinity and associated chemistry. Hydrometallurgy 2011, 108, 60–79. [Google Scholar] [CrossRef]
  13. Hanahan, C.; McConchie, D.; Pohl, J.; Creelman, R.; Clark, M.; Stocksiek, C. Chemistry of seawater neutralization of bauxite refinery residues (red mud). Environ. Eng. Sci. 2004, 21, 125–138. [Google Scholar] [CrossRef]
  14. Rai, S.; Wasewar, K.L.; Agnihotri, A. Treatment of alumina refinery waste (red mud) through neutralization techniques: A review. Waste Manage. Res. 2017, 35, 563–580. [Google Scholar] [CrossRef]
  15. Qu, Y.; Li, H.; Wang, X.; Tian, W.; Shi, B.; Yao, M.; Zhang, Y. Bioleaching of major, rare earth, and radioactive elements from red mud by using indigenous chemoheterotrophic bacterium acetobacter sp. Minerals 2019, 9, 67. [Google Scholar] [CrossRef]
  16. Johnston, M.; Clark, M.W.; McMahon, P.; Ward, N. Alkalinity conversion of bauxite refinery residues by neutralization. J. Hazard. Mater. 2010, 182, 710–715. [Google Scholar] [CrossRef] [PubMed]
  17. Rai, S.; Wasewar, K.L.; Lataye, D.H.; Mukhopadhyay, J.; Yoo, C.K. Feasibility of red mud neutralization with seawater using Taguchi’s methodology. Int. J. Environ. Sci. Technol. 2013, 10, 305–314. [Google Scholar] [CrossRef]
  18. Li, R.B.; Zhang, T.G.; Liu, Y.; Lv, G.Z.; Xie, L.Q. Calcification-carbonation method for red mud processing. J. Hazard. Mater. 2016, 316, 94–101. [Google Scholar] [CrossRef] [PubMed]
  19. Zhang, Y.; Zheng, S.L.; Wang, X.H.; Du, H.; Fang, Z.Z.; Zhang, Y. Reactive extraction of sodium hydroxide from alkali solutions for the separation of sodium and aluminum - part I. effect of extractant. Hydrometallurgy 2015, 154, 47–55. [Google Scholar] [CrossRef]
  20. Zhong, L.; Zhang, Y.F.; Zhang, Y. Extraction of alumina and sodium oxide from red mud by a mild hydro-chemical process. J. Hazard. Mater. 2009, 172, 1629–1634. [Google Scholar] [CrossRef]
  21. Luo, Z.T.; Xiao, Y.L.; Zhang, L.; Wang, X.; Zheng, Y.R.; Yang, J.J. Multi-stage cycle dealkalization and alkali recovery process of red mud slurry. J. Univ. Jinan Sci. Technol. 2013, 27, 369–372. [Google Scholar]
  22. Yang, J.J.; Li, J.W.; Xiao, Y.L.; Luo, Z.T.; Han, Y.F. Research on dealkalization of sintering process red mud by lime process at normal atmosphere and mechanism thereof. Inorg. Chem. Ind. 2012, 44, 40–42. [Google Scholar]
  23. Li, R.B.; Li, X.L.; Wang, D.X.; Liu, Y.; Zhang, T.A. Calcification reaction of red mud slurry with lime. Powder Technol. 2018, 333, 277–285. [Google Scholar] [CrossRef]
  24. Venancio, L.C.A.; Souza, J.A.S.; Macedo, E.N.; Botelho, F.A.; de Oliveira, A.M.; Fonseca, R.S. Bauxite residue amendment through the addition of Ca and or Mg followed by carbonation. In Light Metals; Ratvik, A.P., Ed.; Springer International Publishing Ag: Phoenix, AZ, USA, 2017; pp. 53–59. [Google Scholar]
  25. Zheng, X.F.; Hu, J.; Jiang, M.; Xue, Z.X. Study on optimization of dealkalization process on adding lime to red mud produced by low temperature Bayer process. Light Metals 2010, 4, 21–23. [Google Scholar]
  26. Amaral, L.F.; Oliveira, I.R.; Salomao, R.; Frollini, E.; Pandolfelli, V.C. Temperature and common-ion effect on magnesium oxide (MgO) hydration. Ceram. Int. 2010, 36, 1047–1054. [Google Scholar] [CrossRef]
  27. Maryska, M.; Blaha, J. Hydration kinetics of magnesium oxide—Part 3. Hydration rate of MgO in terms of temperature and time of its firing. Ceram. Silikaty 1997, 41, 121–123. [Google Scholar]
  28. Li, X.F.; Ye, Y.Z.; Xue, S.G.; Jiang, J.; Wu, C.; Kong, X.F.; Hartley, W.; Li, Y.W. Leaching optimization and dissolution behavior of alkaline anions in bauxite residue. Trans. Nonferrous Met. Soc. China 2018, 28, 1248–1255. [Google Scholar] [CrossRef]
  29. Safari, V.; Arzpeyma, G.; Rashchi, F.; Mostoufi, N. A shrinking particle-shrinking core model for leaching of a zinc ore containing silica. Int. J. Miner. Process. 2009, 93, 79–83. [Google Scholar] [CrossRef]
  30. Couperthwaite, S.J.; Johnstone, D.W.; Millar, G.J.; Frost, R.L. Neutralization of acid sulfate solutions using bauxite refinery residues and its derivatives. Ind. Eng. Chem. Res. 2013, 52, 1388–1395. [Google Scholar] [CrossRef]
  31. Qu, J.; Zhong, L.H.; Li, Z.; Chen, M.; Zhang, Q.W.; Liu, X.Z. Effect of anion addition on the syntheses of Ca-Al layered double hydroxide via a two-step mechanochemical process. Appl. Clay Sci. 2016, 124, 267–270. [Google Scholar] [CrossRef]
  32. Heraldy, E.; Nugrahaningtyas, K.D.; Sanjaya, F.B.; Darojat, A.A.; Handayani, D.S.; Hidayat, Y. In effect of reaction time and (Ca plus Mg)/Al molar ratios on crystallinity of Ca-Mg-Al layered double hydroxide. In Proceedings of the 10th Joint Conference on Chemistry, Solo, Indonesia, 8–9 September 2015. [Google Scholar]
  33. Del Arco, M.; Martin, C.; Martin, I.; Rives, V.; Trujillano, R. A FTIR spectroscopic study of surface acidity and basicity of mixed Mg, Al-oxides obtained by thermal decomposition of hydrotalcite. Spectrochim. Acta Part A Mol. Spectrosc. 1993, 49, 1575–1582. [Google Scholar] [CrossRef]
  34. Kuśtrowski, P.; Sułkowska, D.; Chmielarz, L.; Rafalska-Łasocha, A.; Dudek, B.; Dziembaj, R. Influence of thermal treatment conditions on the activity of hydrotalcite-derived Mg–Al oxides in the aldol condensation of acetone. Micropor. Mesopor. Mat. 2005, 78, 11–22. [Google Scholar] [CrossRef]
  35. Olszówka, J.E.; Karcz, R.; Bielańska, E.; Kryściak-Czerwenka, J.; Napruszewska, B.D.; Sulikowski, B.; Socha, R.P.; Gaweł, A.; Bahranowski, K.; Olejniczak, Z.; et al. New insight into the preferred valency of interlayer anions in hydrotalcite-like compounds: The effect of Mg/Al ratio. Appl. Clay Sci. 2018, 155, 84–94. [Google Scholar] [CrossRef]
Figure 1. X-ray diffraction analysis of Bayer red mud (1—Na8Si6Al6O24(H0.88(CO3)1.44)(H2O)2; 2—Ca2.93Al1.97Si0.64O2.56(OH)9.44; 3—CaCO3; 4—Fe2O3; 5—CaTiO3).
Minerals 09 00269 g001
Figure 2. Morphology of the red mud (the green parts represent Na).
Minerals 09 00269 g002
Figure 3. Influence of temperature on the recovery ratio of Na2O using pure CaO/MgO (t = 3 h).
Minerals 09 00269 g003
Figure 4. Influence of blending MgO and CaO on the recovery ratio of Na2O (t = 3 h, % means the mole fraction of MgO addition).
Minerals 09 00269 g004
Figure 5. XRD patterns of solid products at temperatures <200 °C: (a) 0% MgO addition; (b) 50% MgO addition; (c) 100% MgO addition (1—Na8Si6Al6O24(H0.88(CO3)1.44)(H2O)2; 2—Ca2.93Al1.97Si0.64O2.56(OH)9.44; 3—CaCO3; 4—Fe2O3; 5—CaTiO3; 6—MgO; 7—Mg(OH)2; 8— (Mg4.5Al1.5)(Si2.5Al1.5)O10(OH)8); % means the mole fraction of MgO addition; only new phases are marked out while the same XRD pattern for the red mud is presented without labels in each figure for clarity).
Minerals 09 00269 g005
Figure 6. XRD patterns of the solid products at 200 °C: (a) Bayer red mud; (b) 0% MgO addition; (c) 10% MgO addition; (d) 30% MgO addition; (e) 50% MgO addition; (f) 70% MgO addition; (g) 90% MgO addition and (h) 100% MgO addition (1—Na8Si6Al6O24(H0.88(CO3)1.44)(H2O)2; 2—Ca2.93Al1.97Si0.64O2.56(OH)9.44; 3—CaCO3; 4—Fe2O3; 5—CaTiO3; 6—Ca10Mg2Al4(SiO4)5(Si2O7)2(OH)4; 7—Mg3Si2O5(OH)4; 8—(Mg4.5Al1.5)(Si2.5Al1.5)O10(OH)8); % means the mole fraction of MgO addition; only new phases are marked out while the same XRD pattern for the red mud is presented without labels in each figure for clarity).
Minerals 09 00269 g006
Figure 7. Kinetic fitting of (a) the plots of [1     2 3 α (1   α)2/3] versus time for CaO, (b) ln(Ka) versus temperature for CaO, (c) the plots of [1   (1 α)1/3] versus time for MgO lower than 200 °C, (d) ln(Ka) versus temperature for MgO lower than 200 °C, (e) the plots of [1     2 3 α     (1     α)2/3] versus time for MgO higher than 200 °C and (f) ln(Ka) versus temperature for MgO higher than 200 °C.
Minerals 09 00269 g007aMinerals 09 00269 g007b
Figure 8. FTIR spectra of solid samples at 200 °C.
Minerals 09 00269 g008
Figure 9. Morphologies of the solid products at 200 °C: (a-a’) 0% MgO addition; (b-b’) 30% MgO addition; (c-c’) 70% MgO addition and (d-d’) 100% MgO addition.
Minerals 09 00269 g009
Table 1. Main chemical composition of Bayer red mud measured by X-ray fluorescence.
ChemicalsAl2O3SiO2CaOFe2O3Na2OTiO2K2OMgON/S
Content (wt. %)24.4221.1218.478.145.974.561.530.750.28
Table 2. XRD patterns of solid products at temperatures <200 °C.
MgO%Temperature/℃MgOMg(OH)2(Mg4.5Al1.5)(Si2.5Al1.5)O10(OH)8
090xxx
140xxx
190xxx
5090x
140x
190
10090x
140
190
% means the mole fraction of MgO addition; only new phases in each sample are listed out; √: existence; x: nonexistence.
Table 3. XRD patterns of the solid products at 200 °C.
MgO%Ca10Mg2Al4(SiO4)5(Si2O7)2(OH)4Mg3Si2O5(OH)4(Mg4.5Al1.5)(Si2.5Al1.5)O10(OH)8
0xxx
10xx
30
50
70
90
100
% means the mole fraction of MgO addition; only new phases in each sample are listed out; √: existence; x: nonexistence.

