Influencing Factors and Mathematical Prediction of Shale Adsorbed Gas Content in the Upper Triassic Yanchang Formation in the Ordos Basin, China

 ,
, 
Abstract
1. Introduction
2. Samples and Experiments
2.1. Samples
2.2. Experiments
3. Results
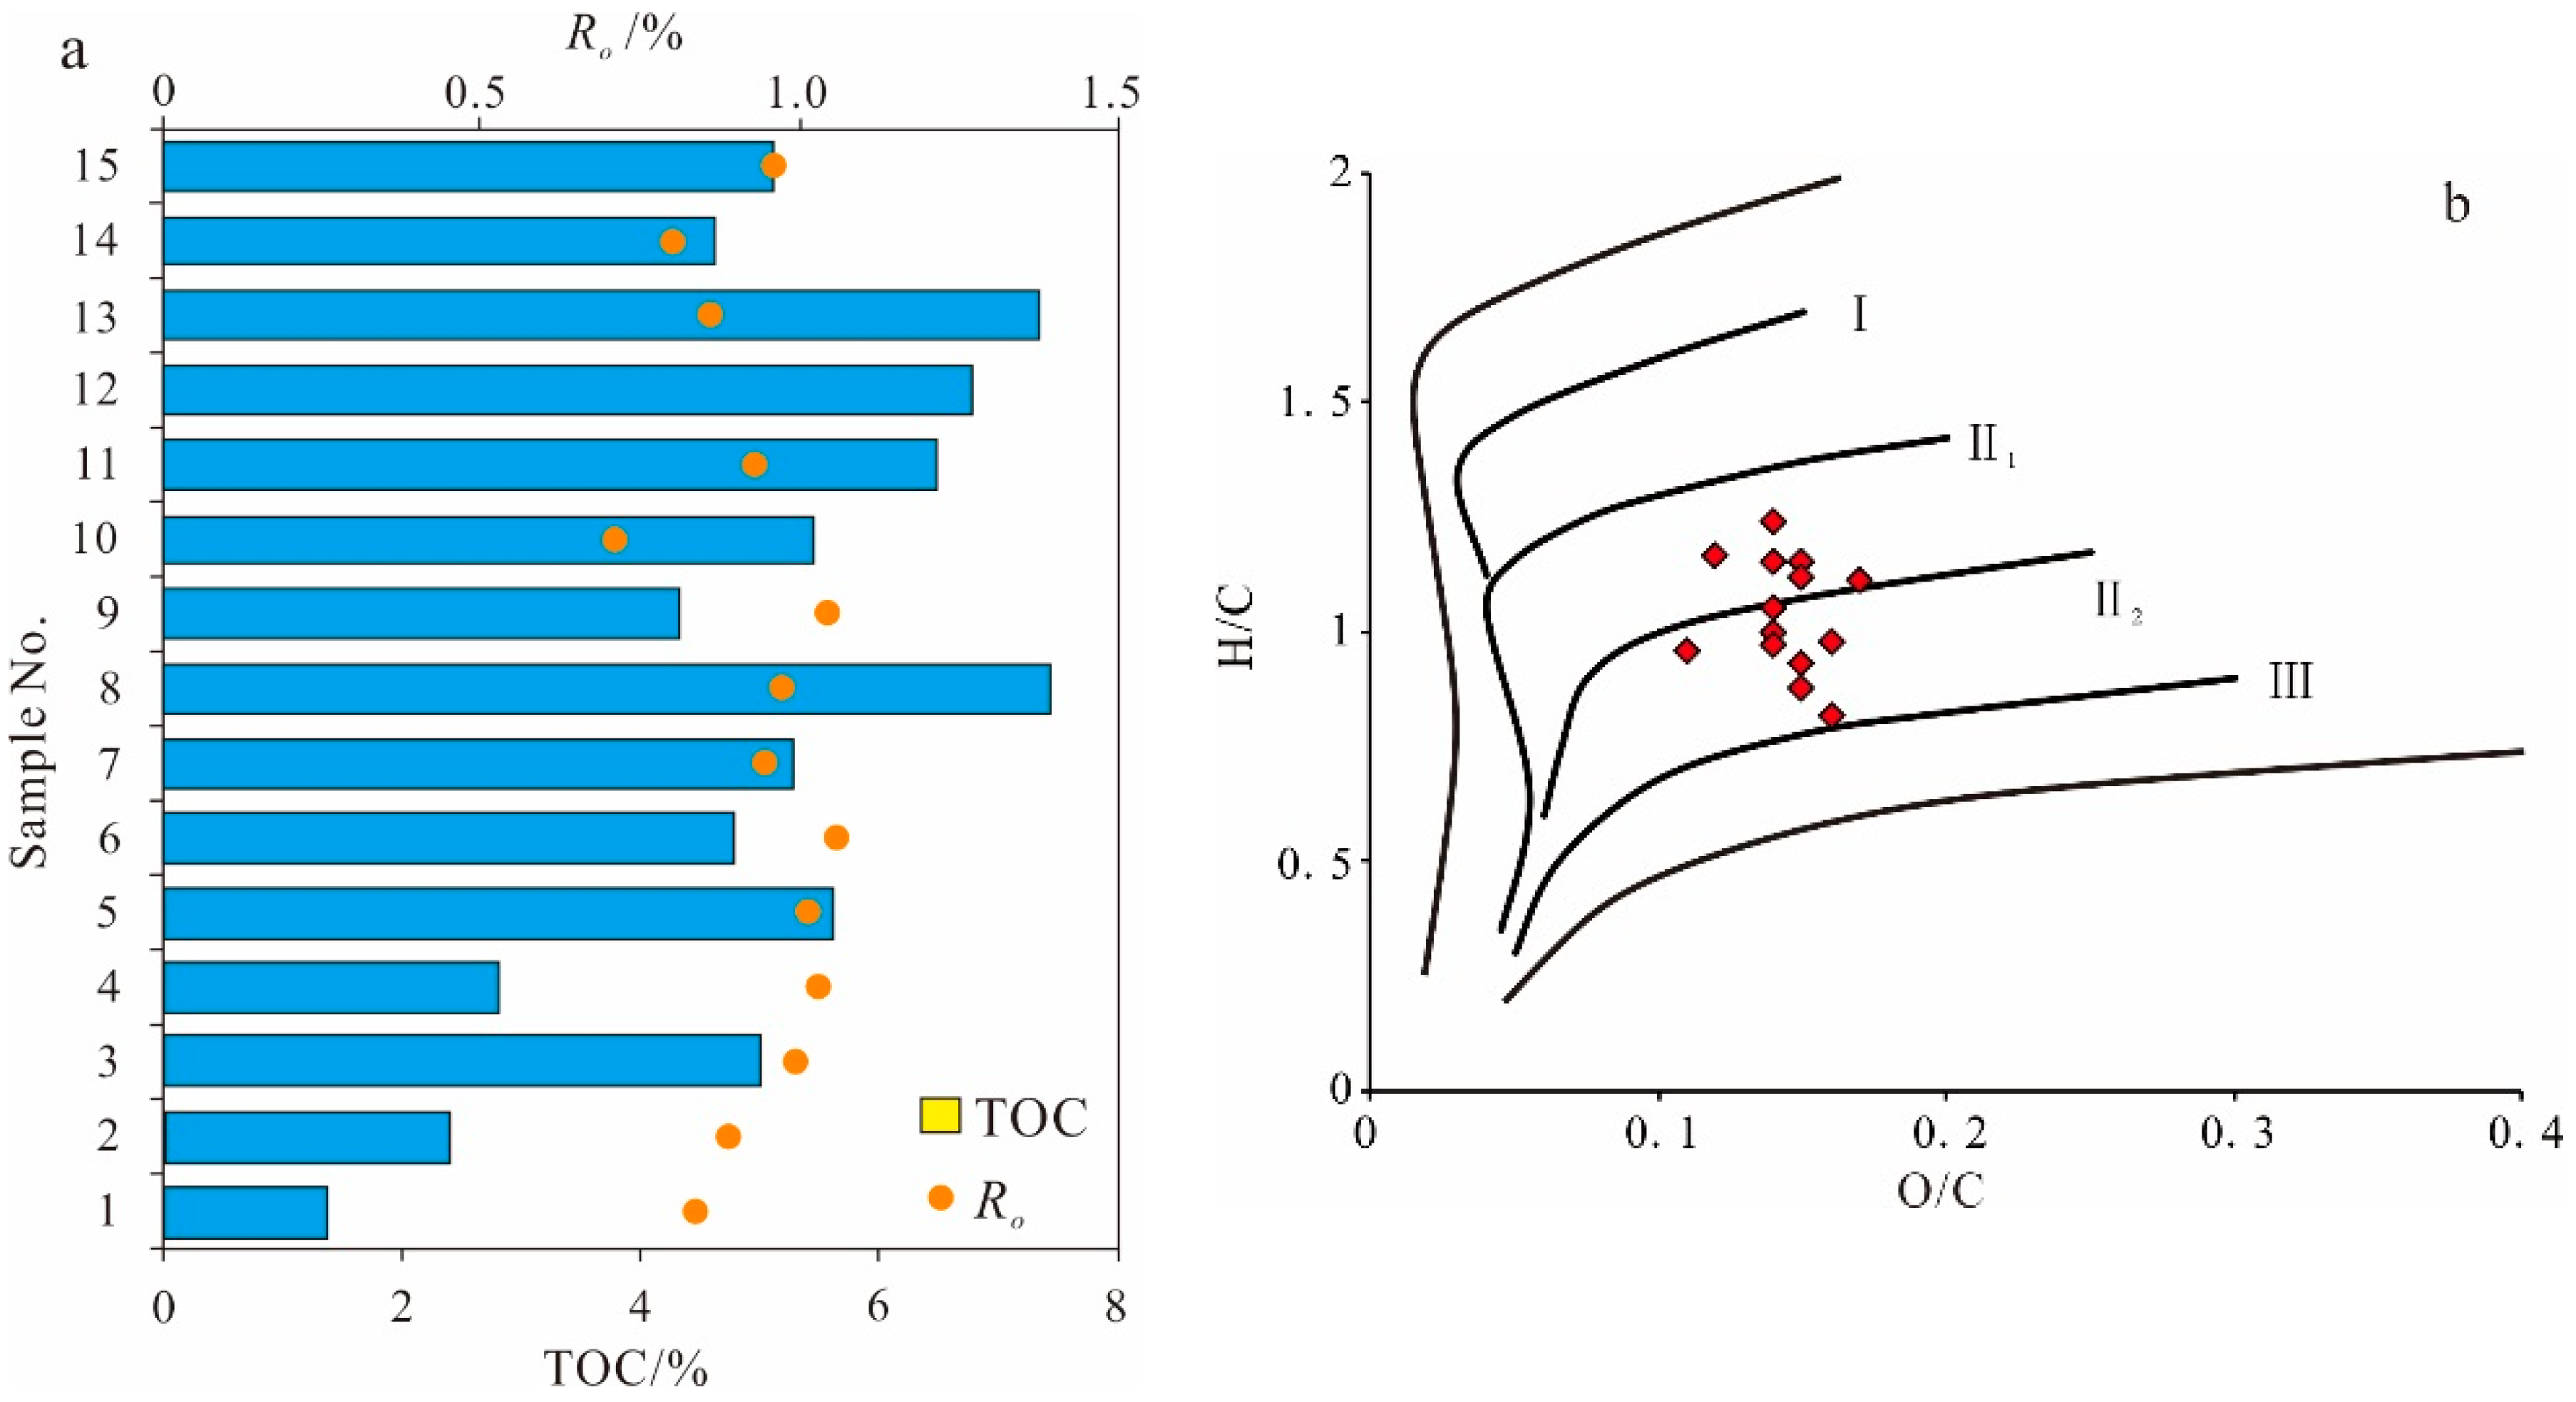
3.1. Organic Geochemistry Chracteristics
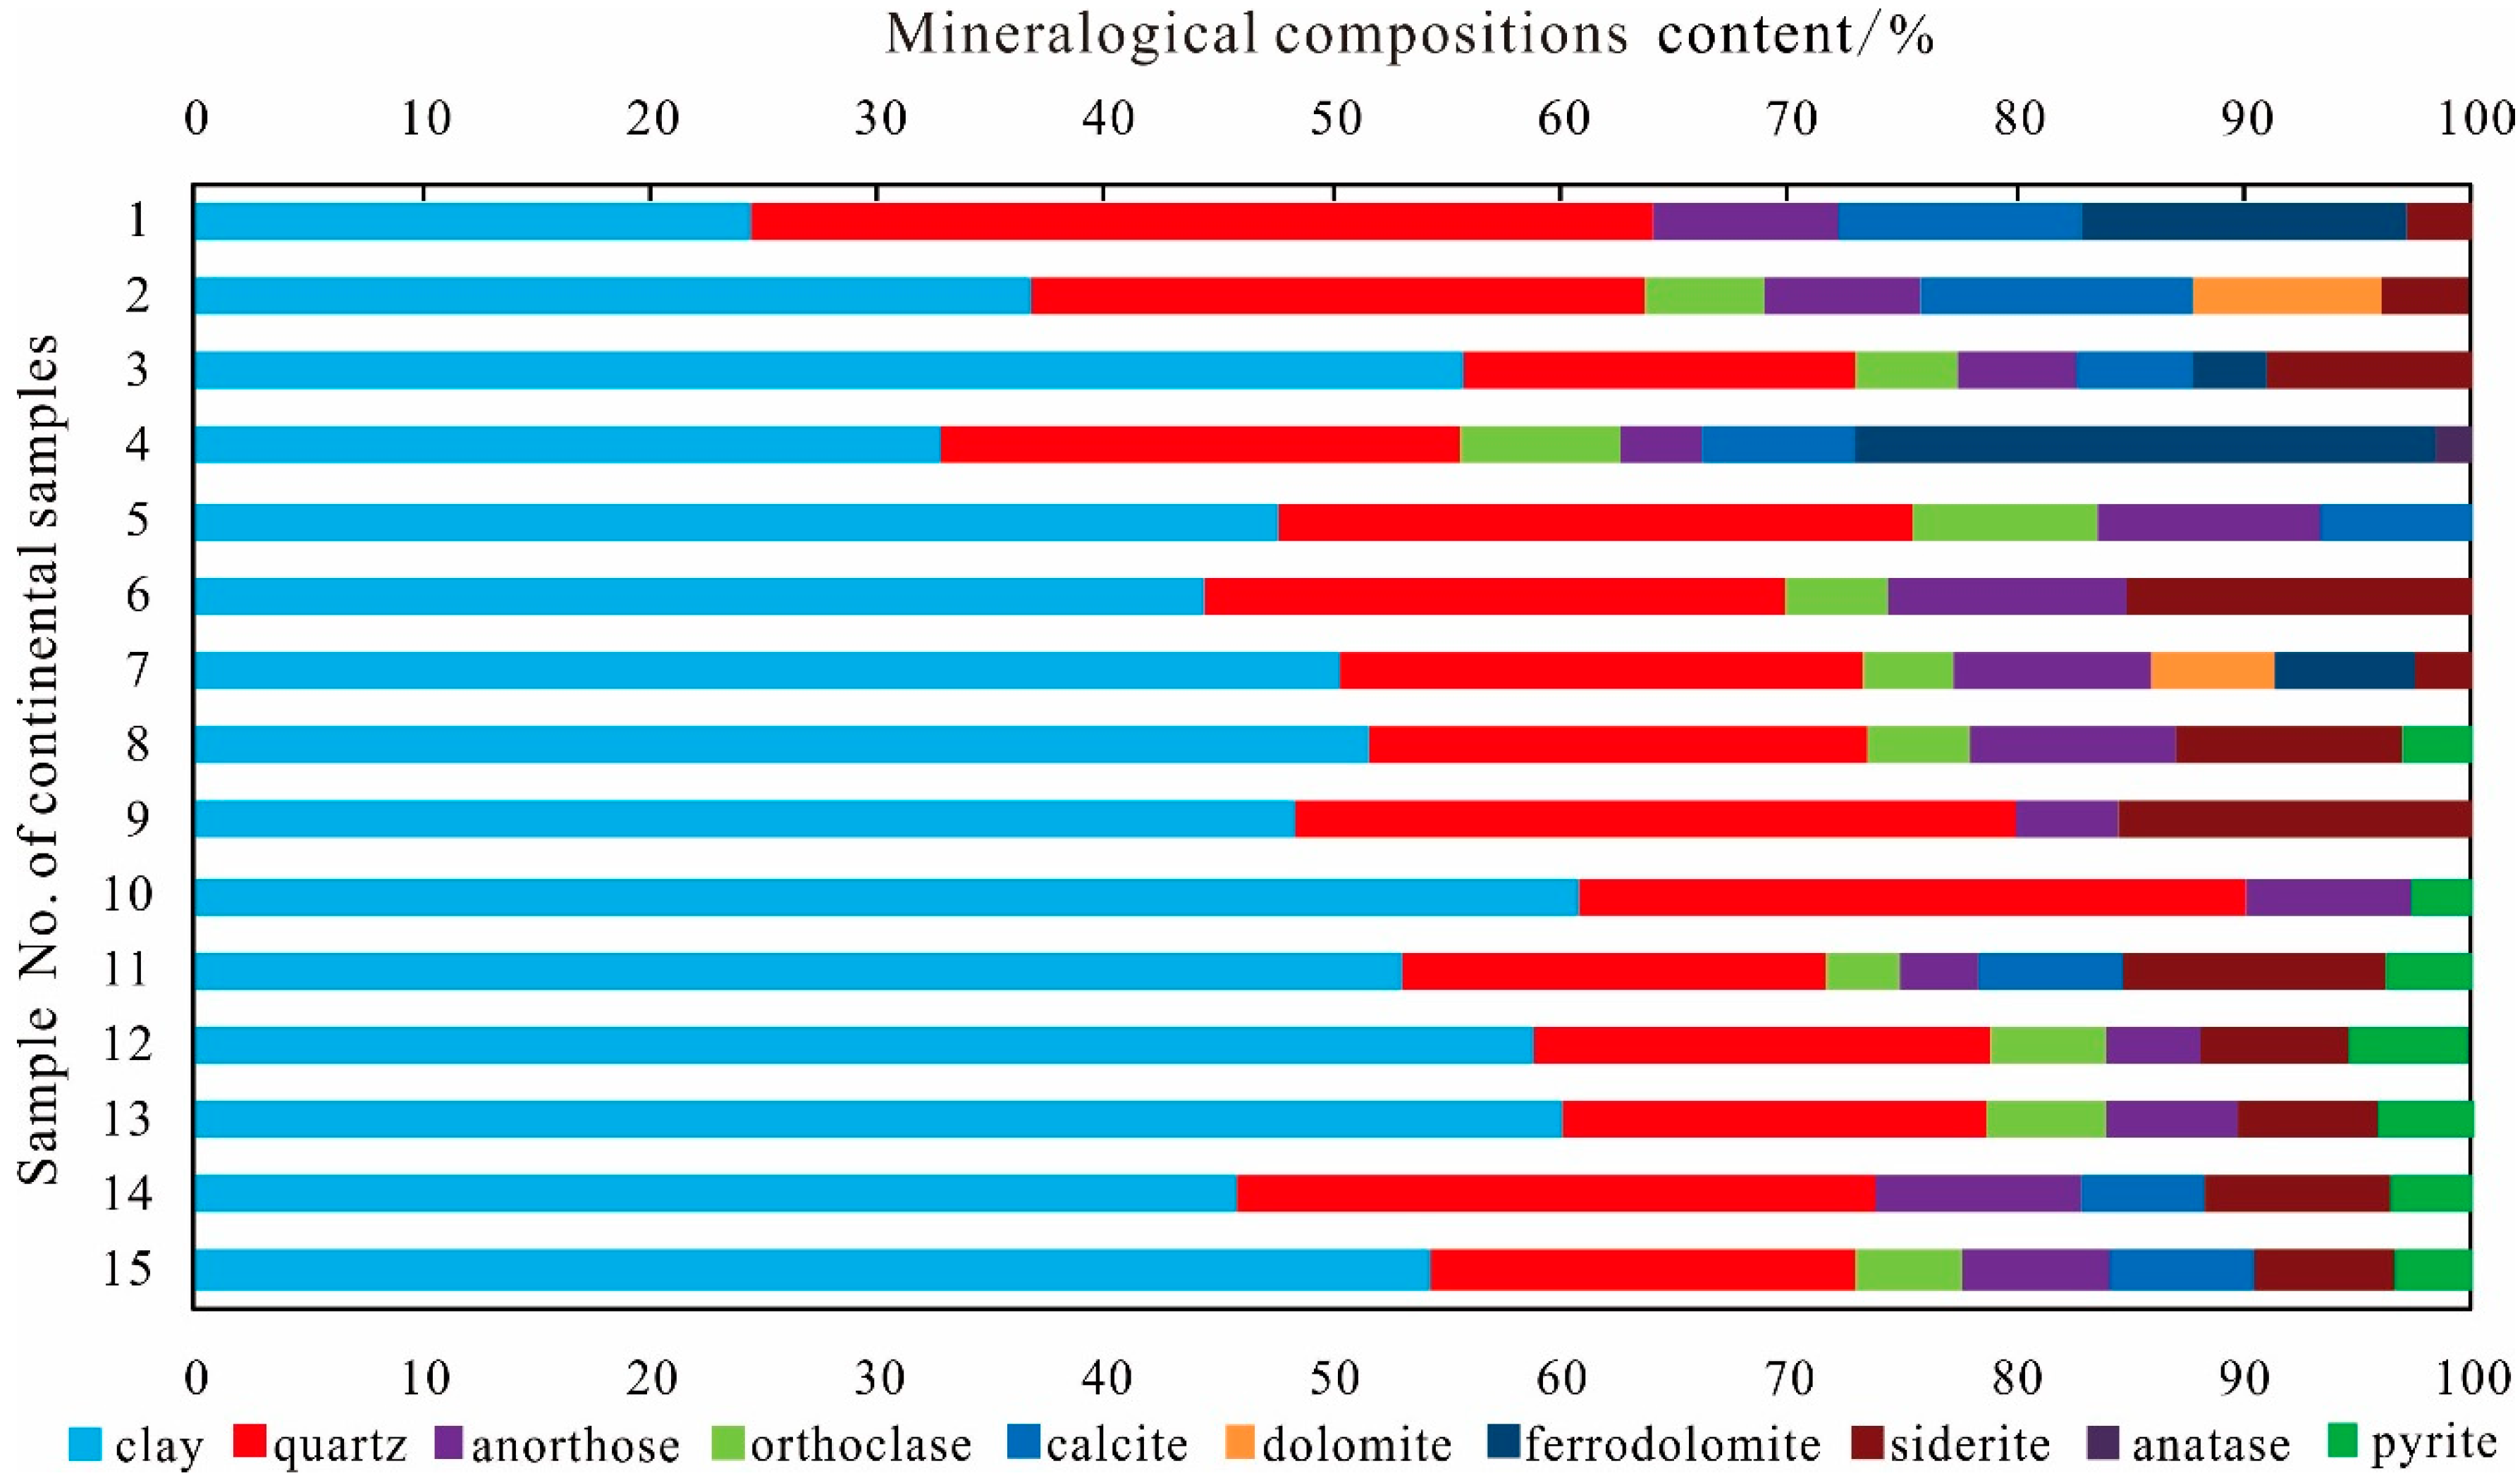
3.2. Mineral Compositions
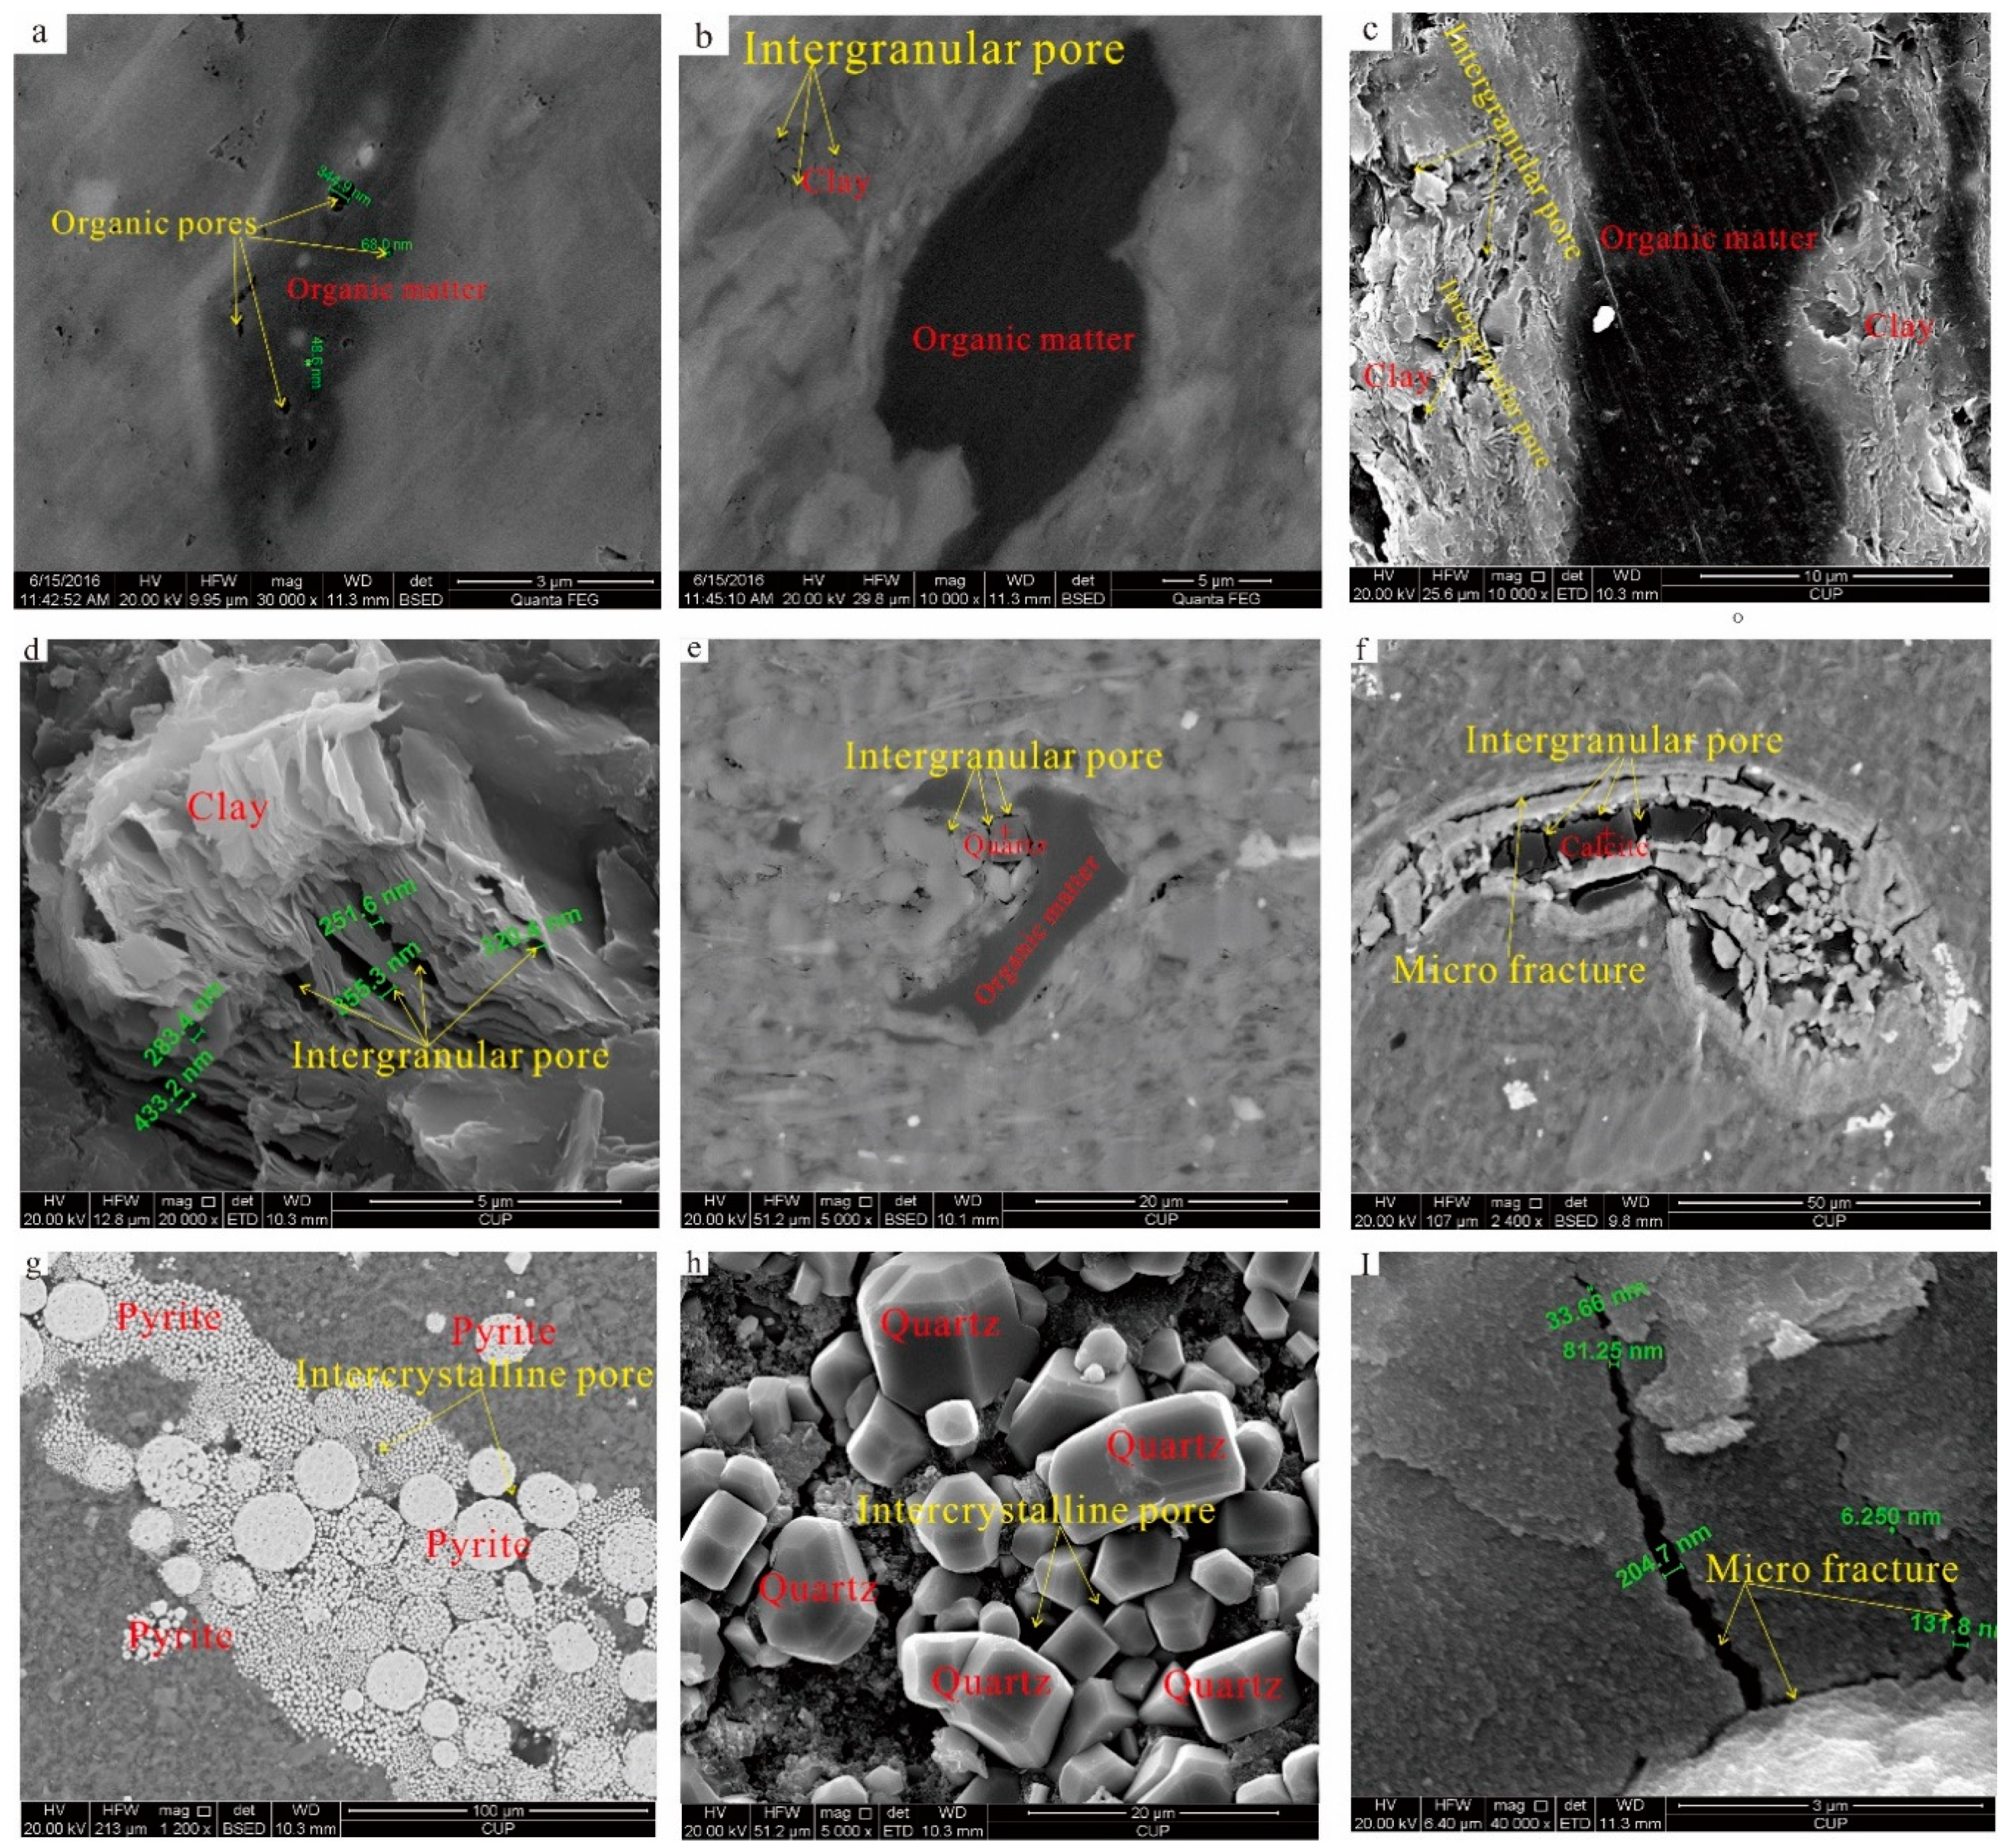
3.3. Pore Structure Characteristic
3.3.1. Pore Types
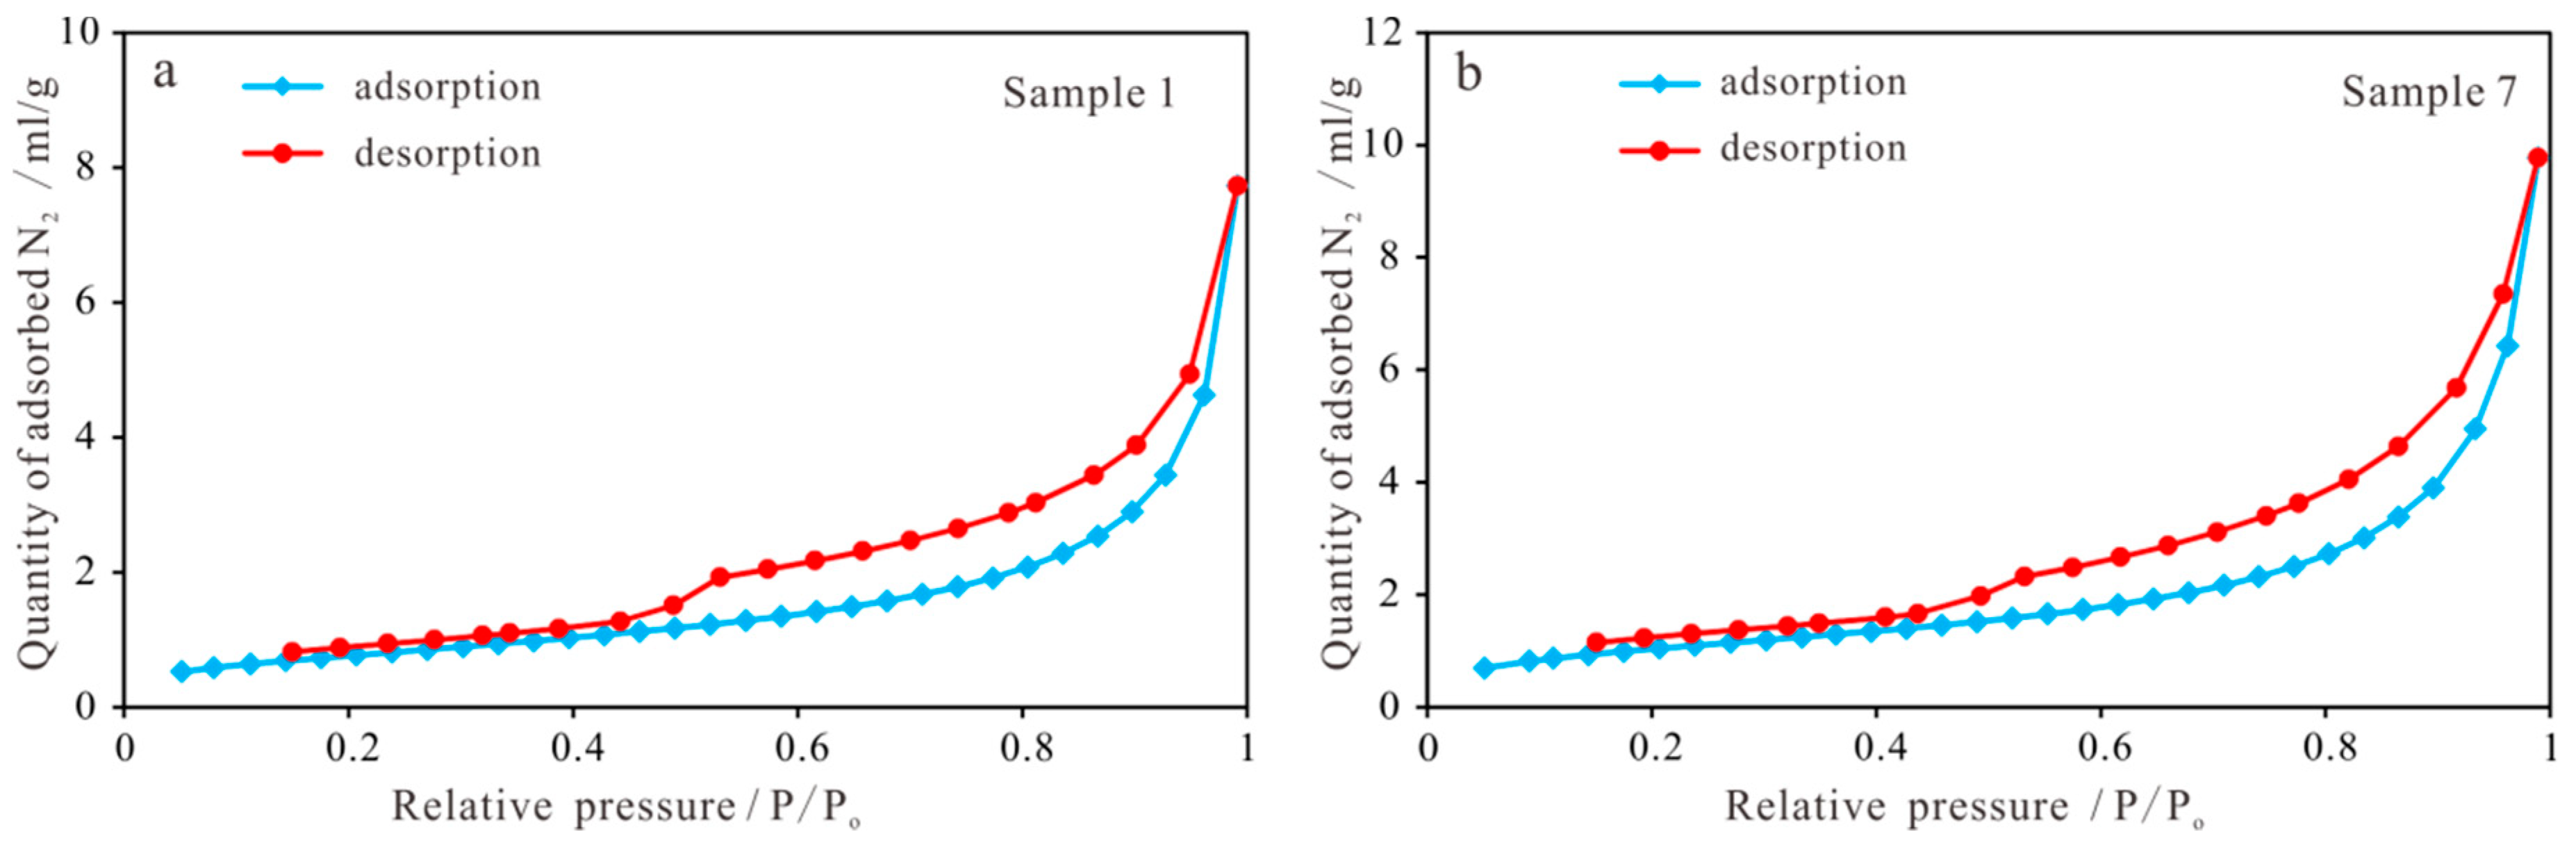
3.3.2. Pore Structure Parameters
3.4. Methane Adsorption Content
4. Discussions
4.1. Effect of Single Geological Factors on AGC
4.1.1. Geochemical Influence Factors
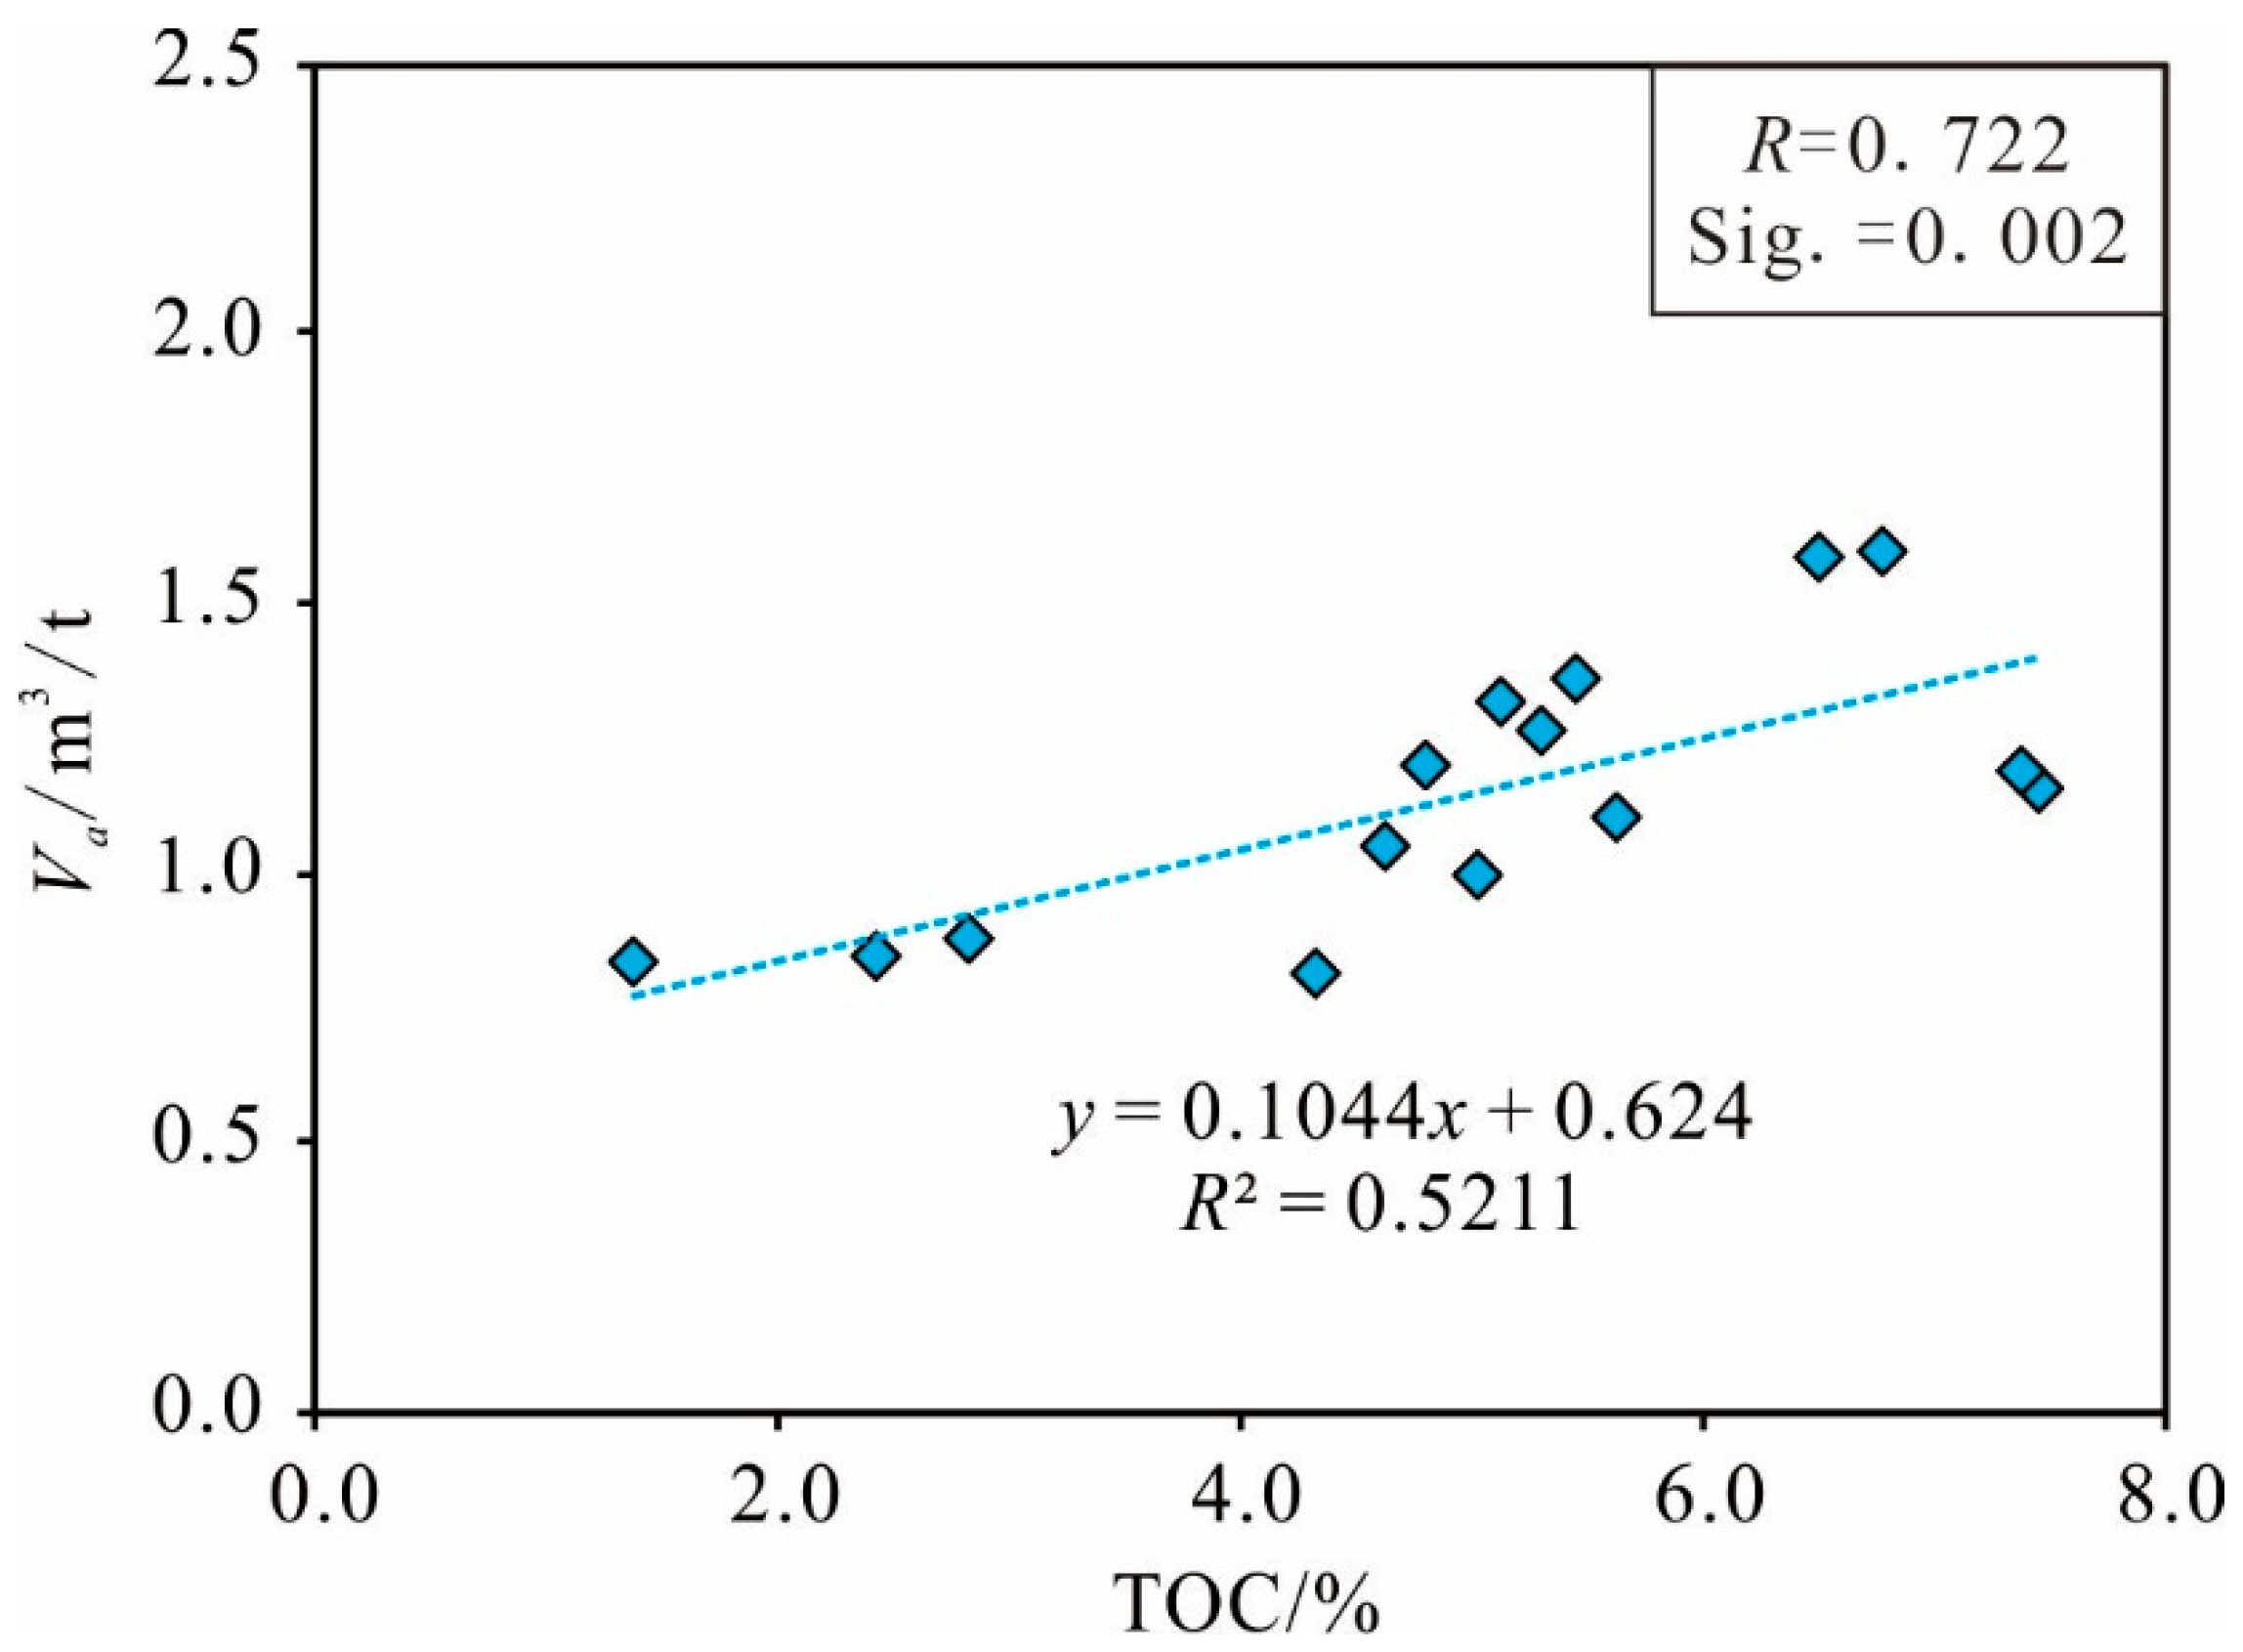
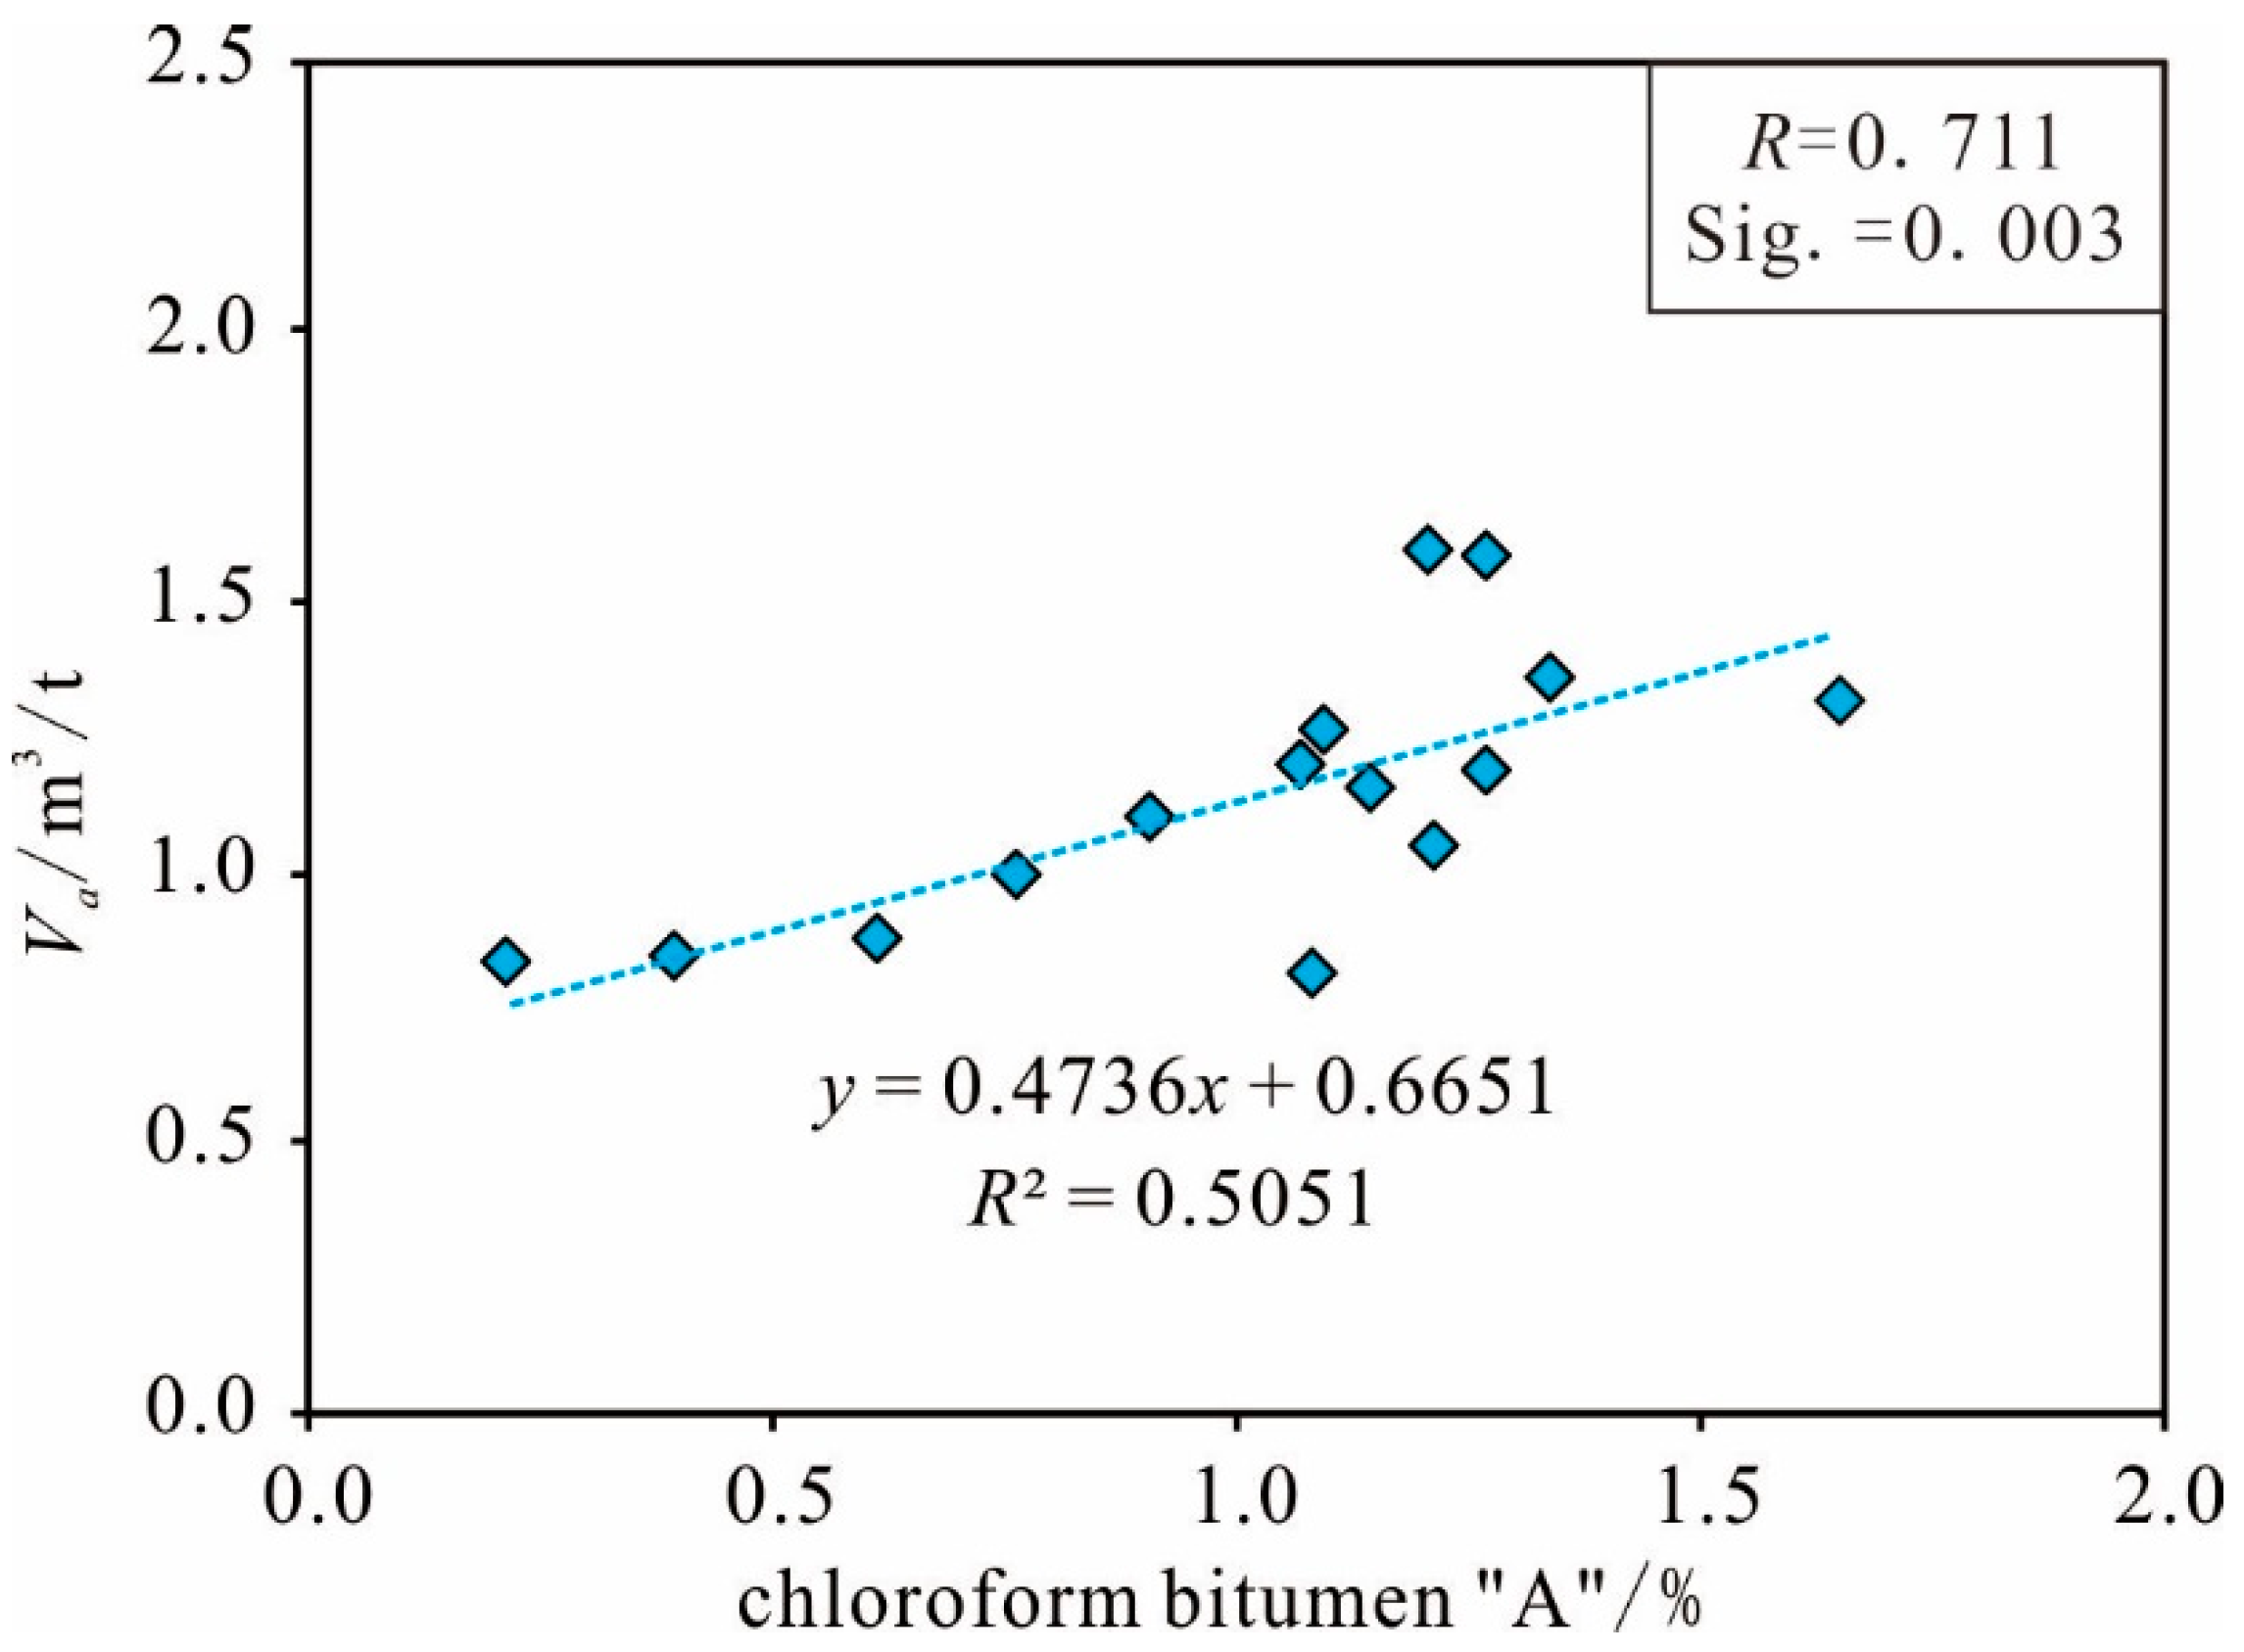
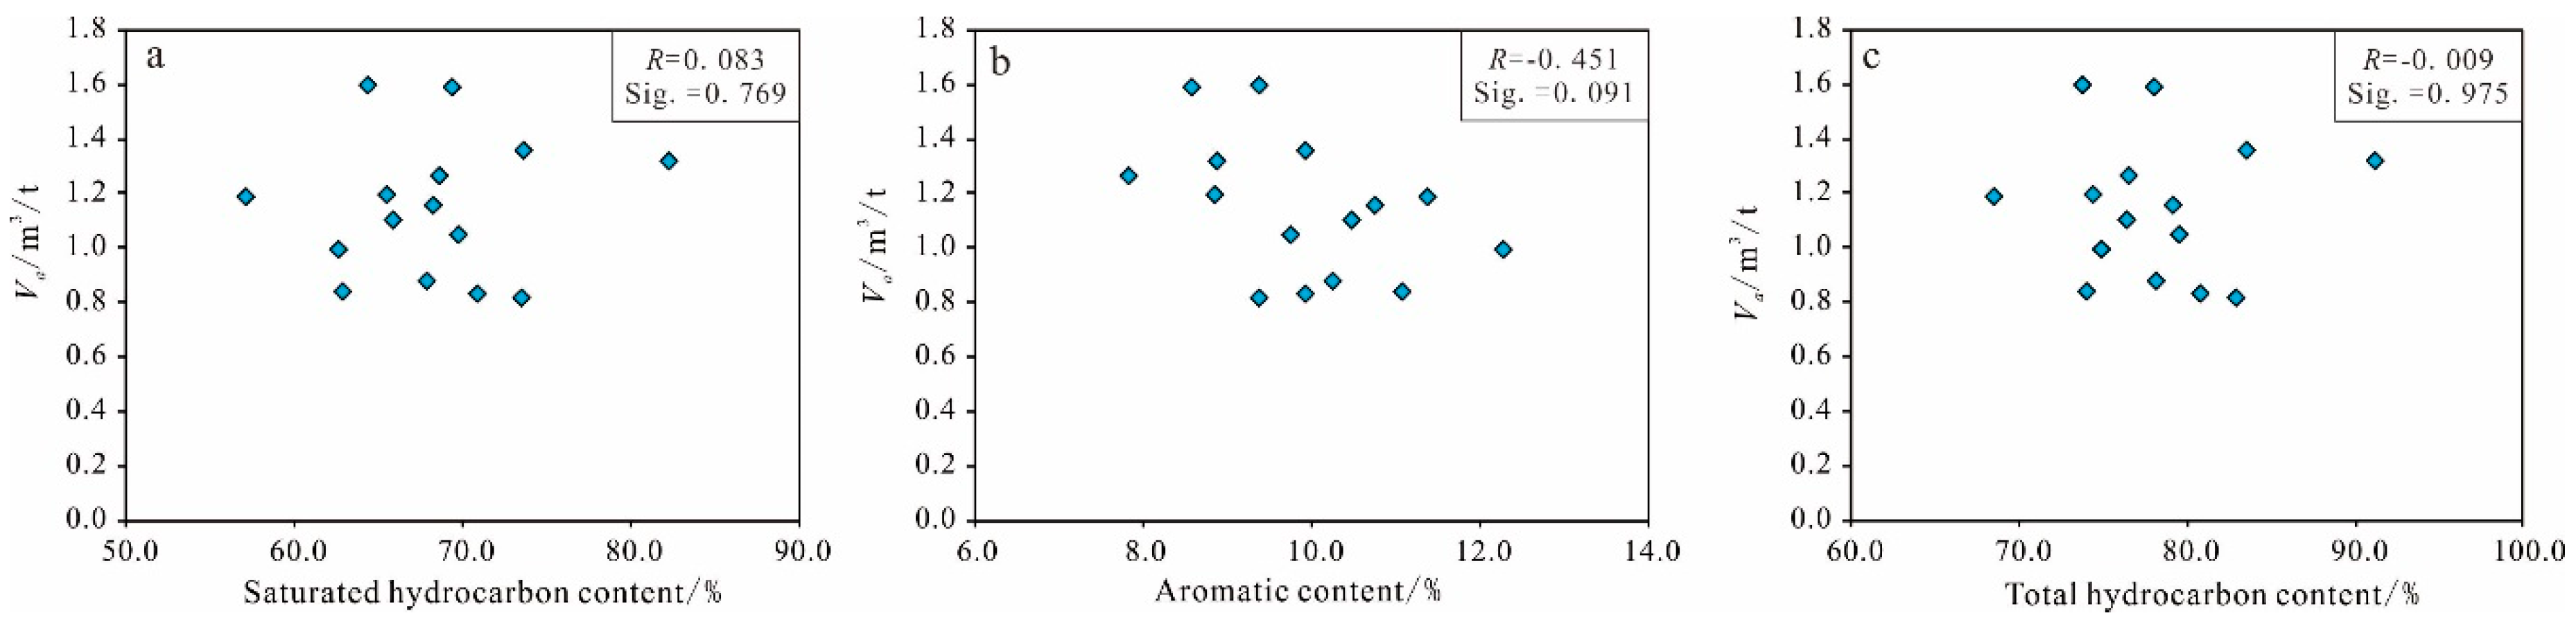
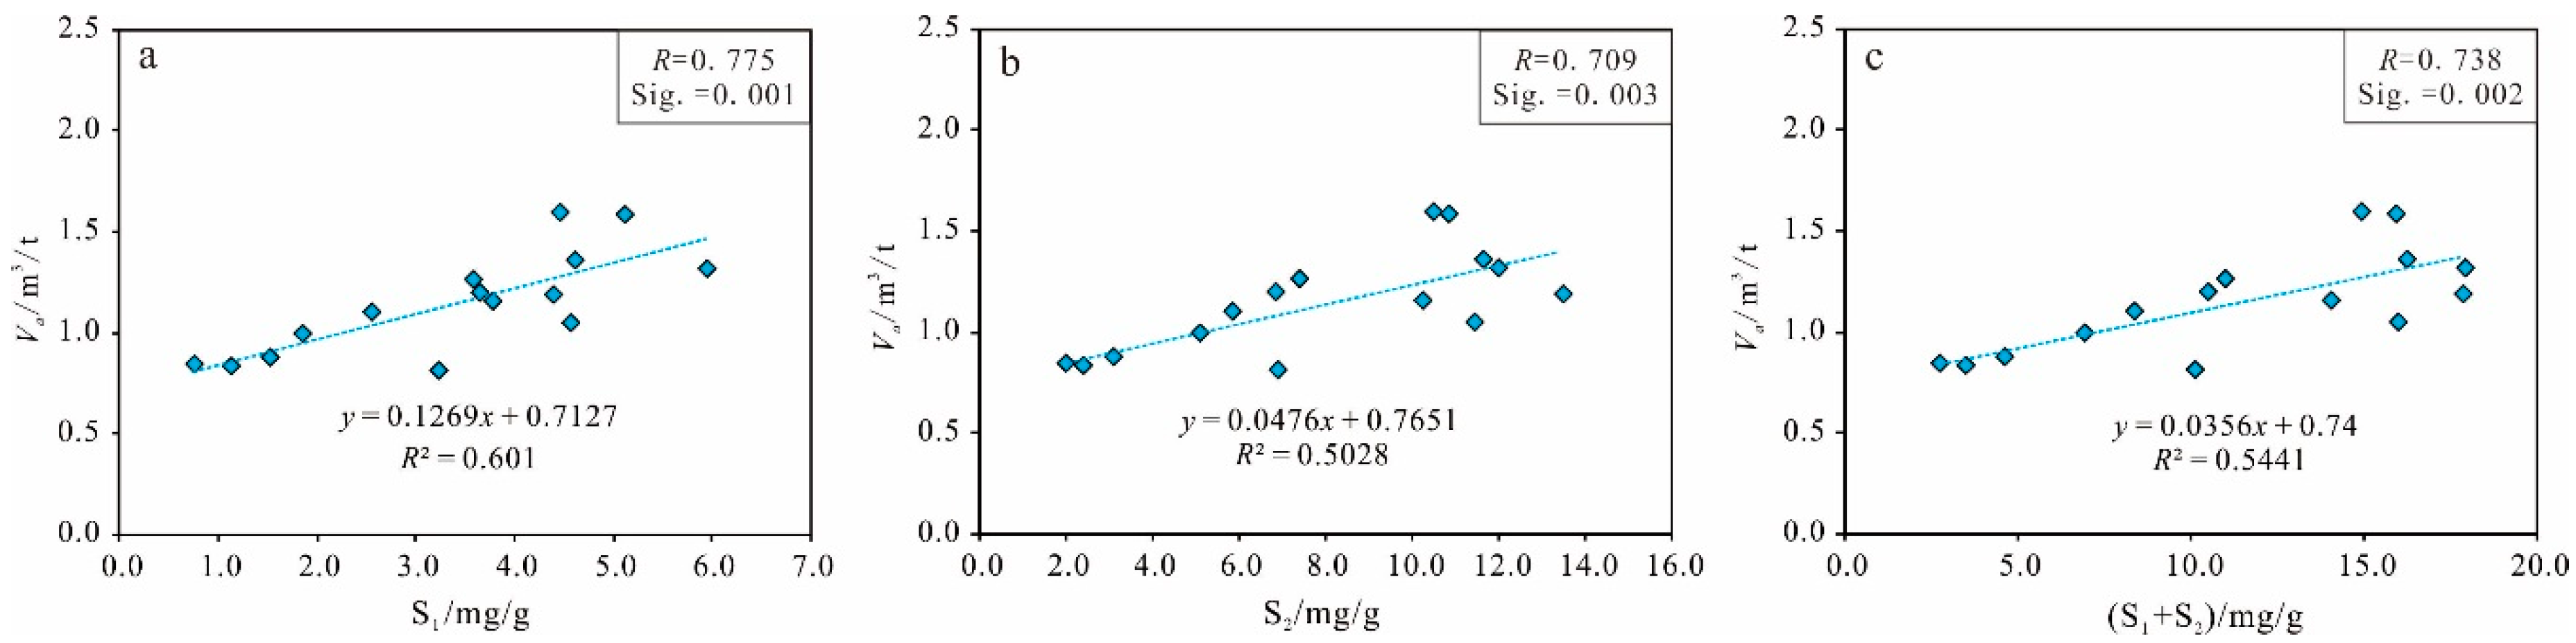
Organic Matter Abundance
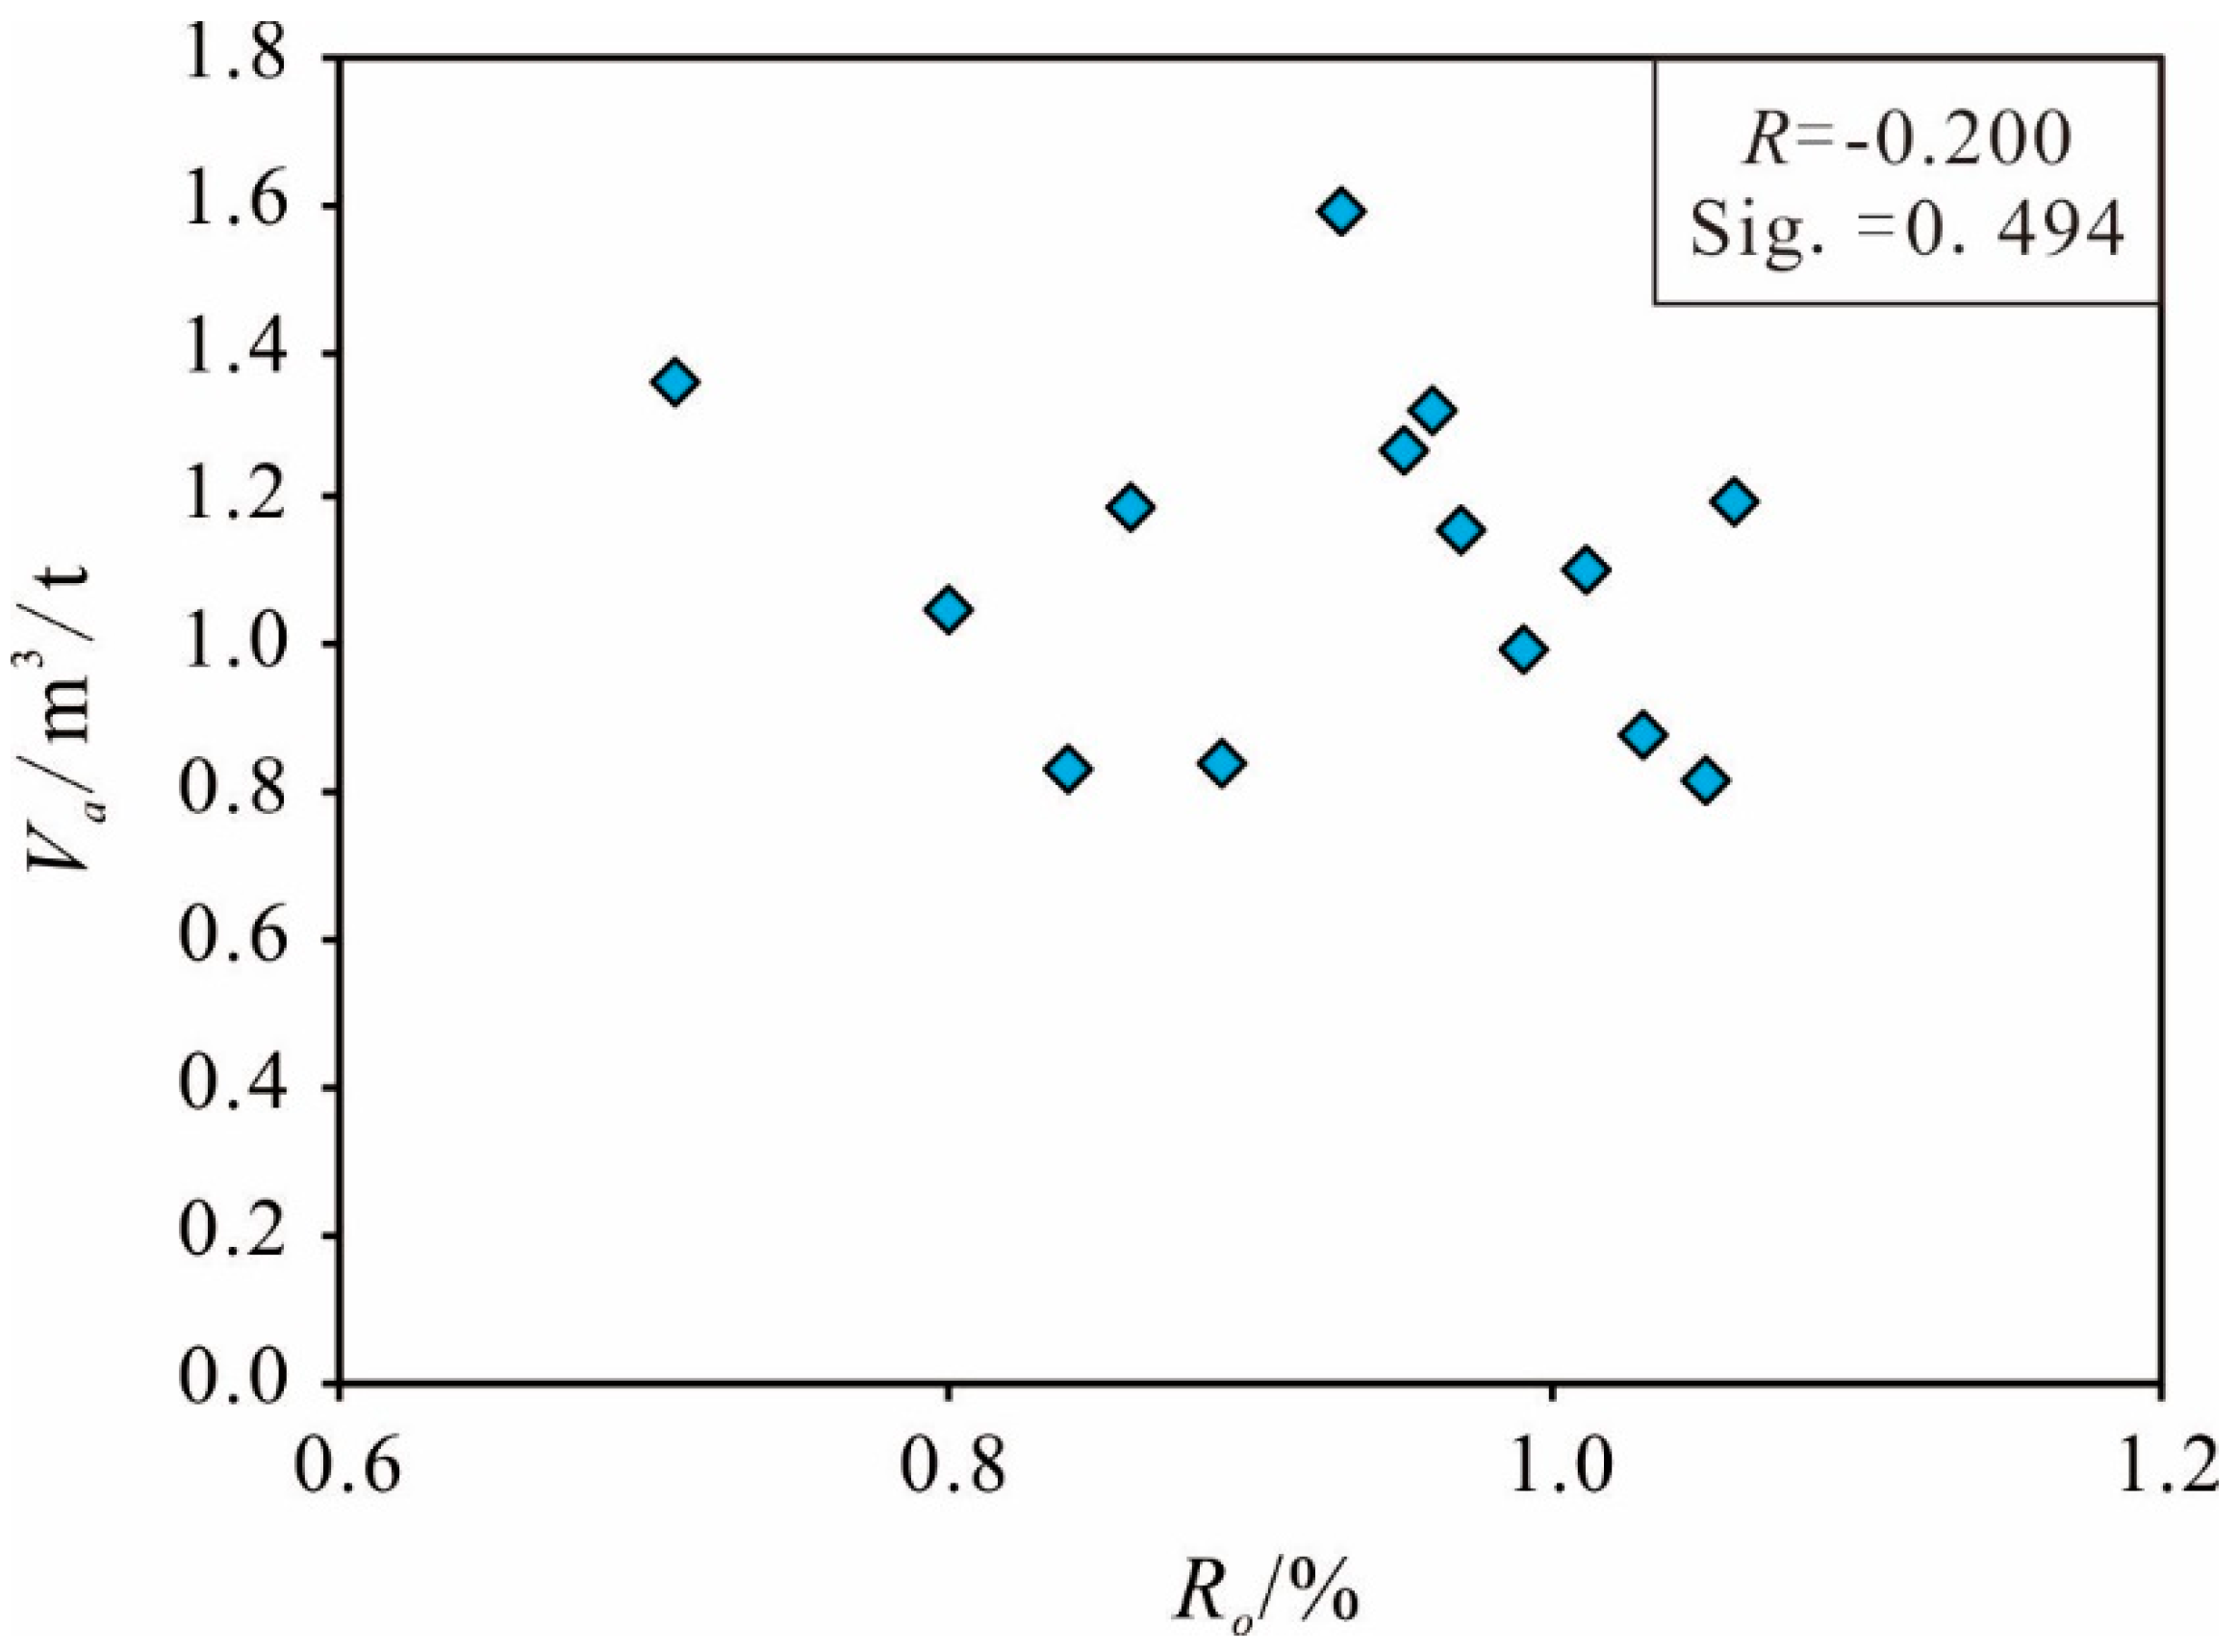
Organic Matter Maturity
4.1.2. Mineral Influence Factors
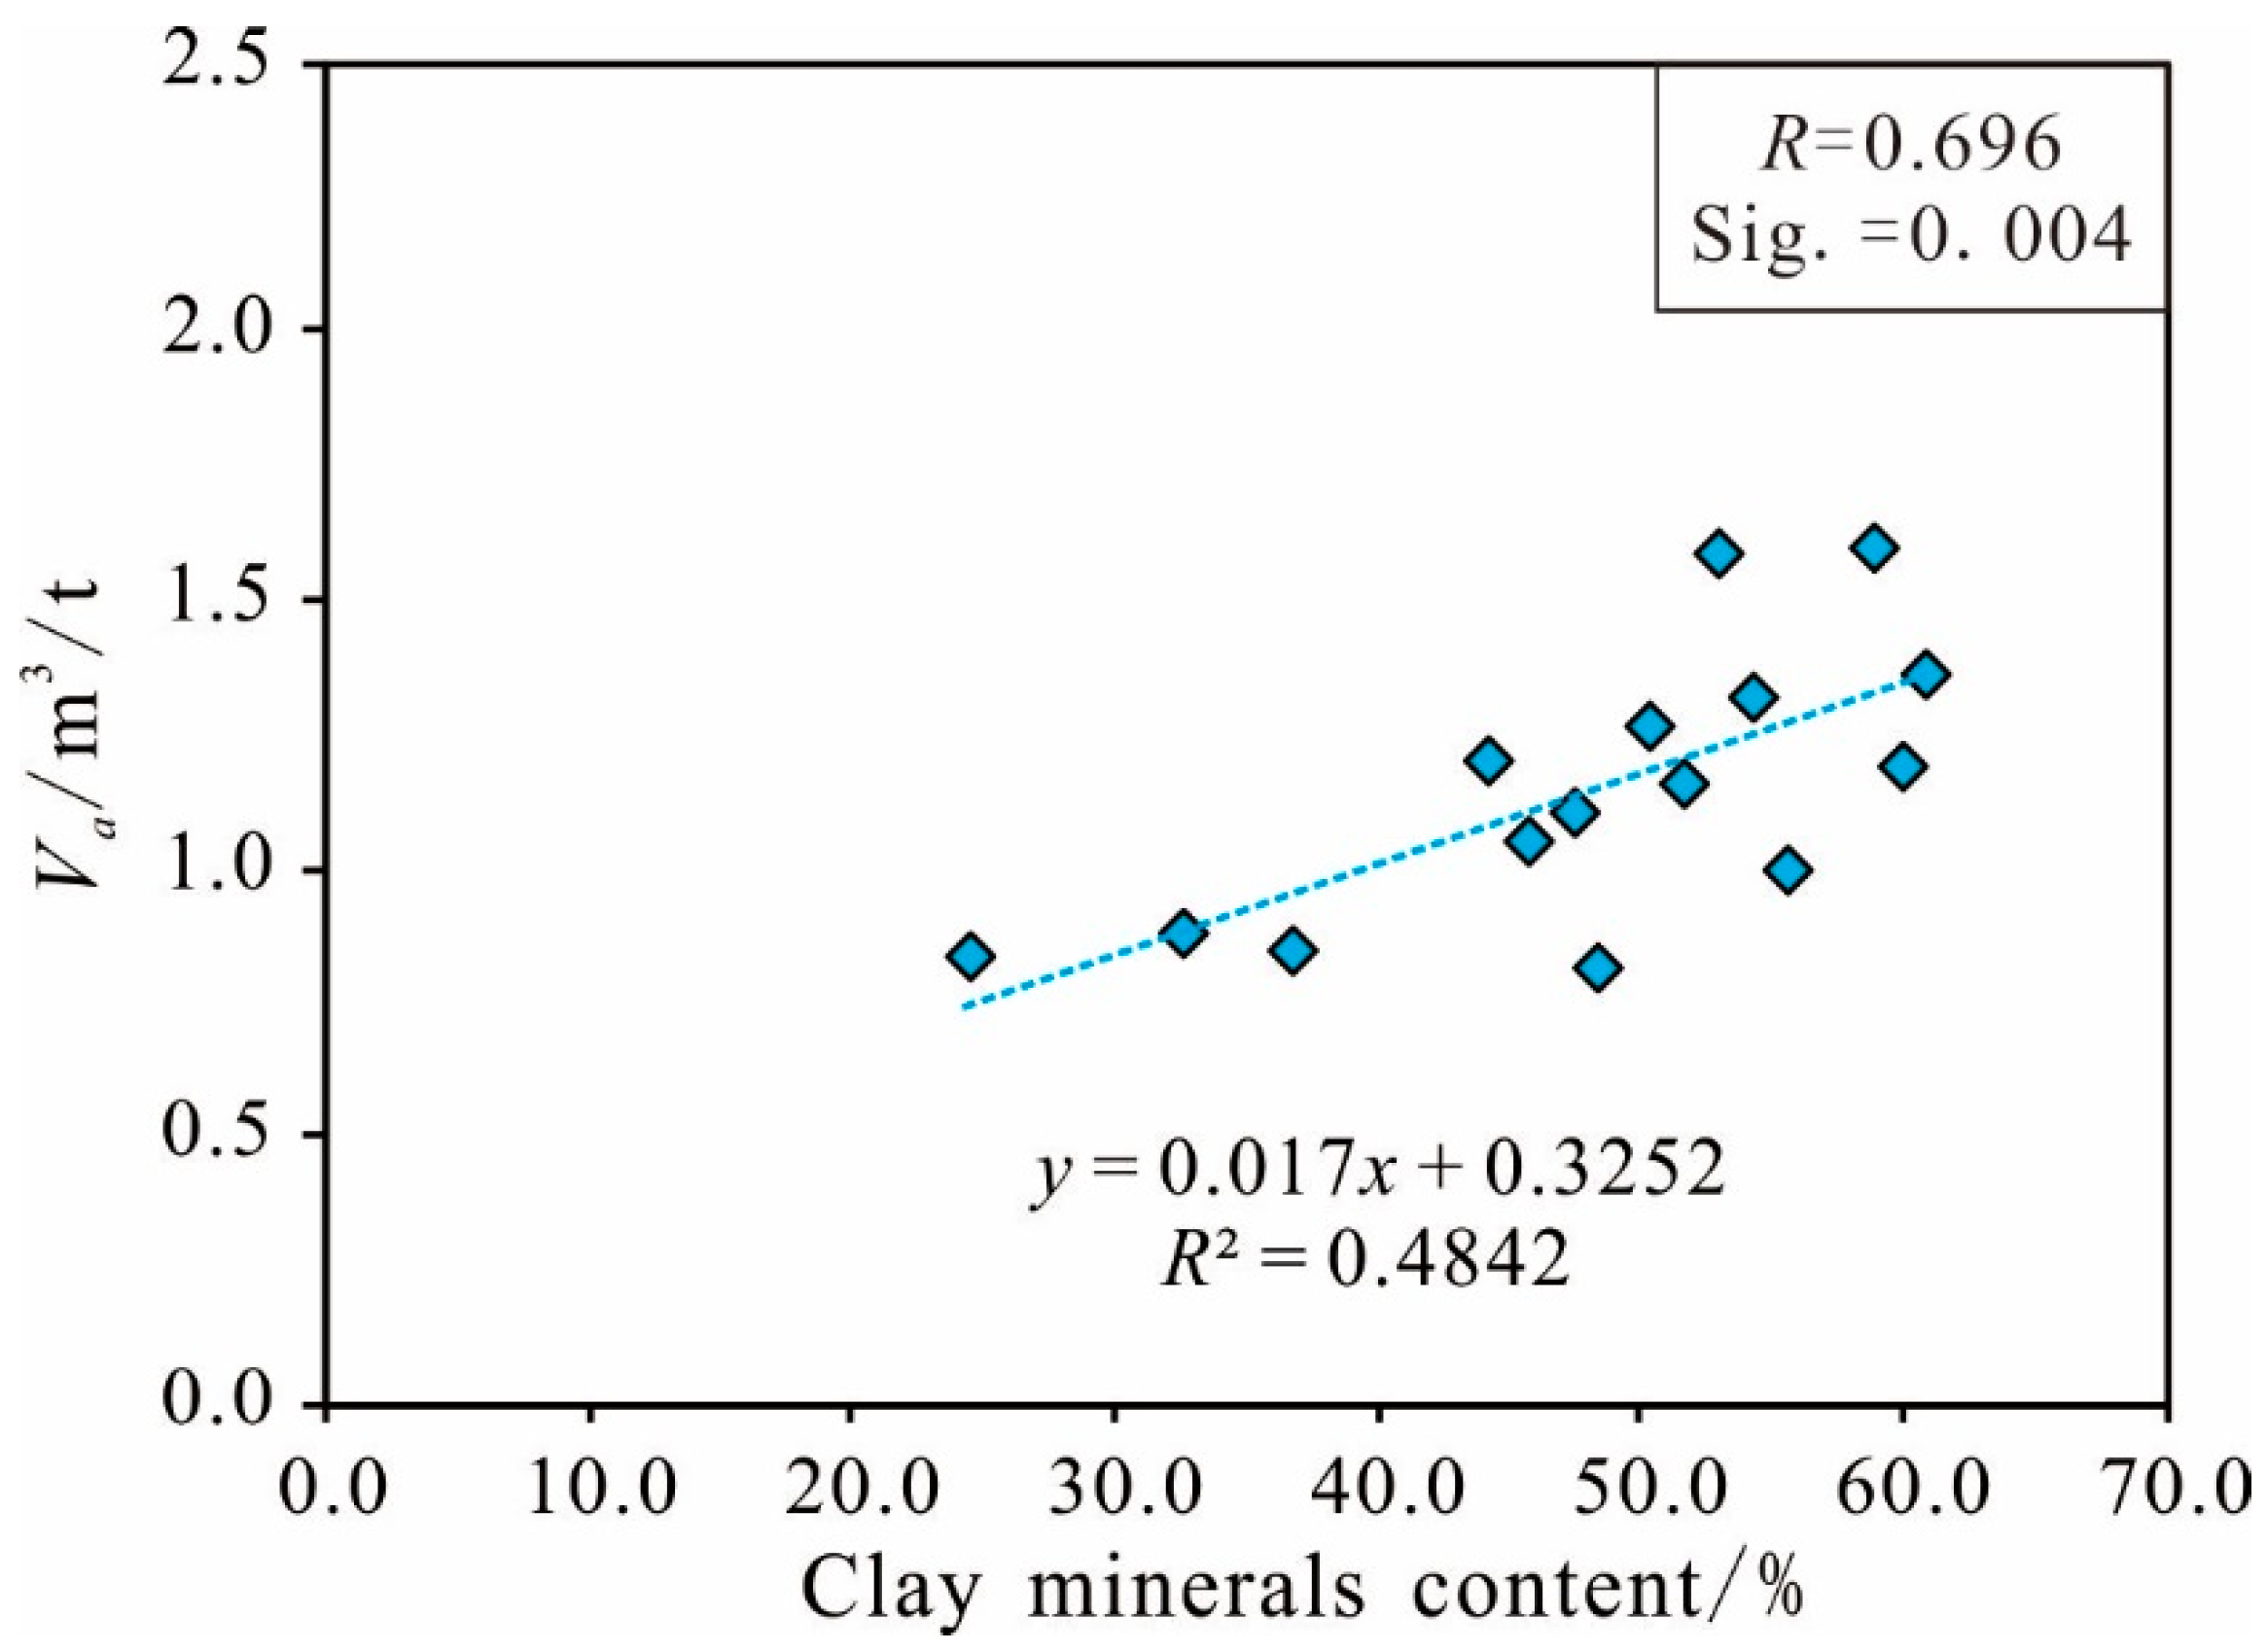
Clay Minerals Content
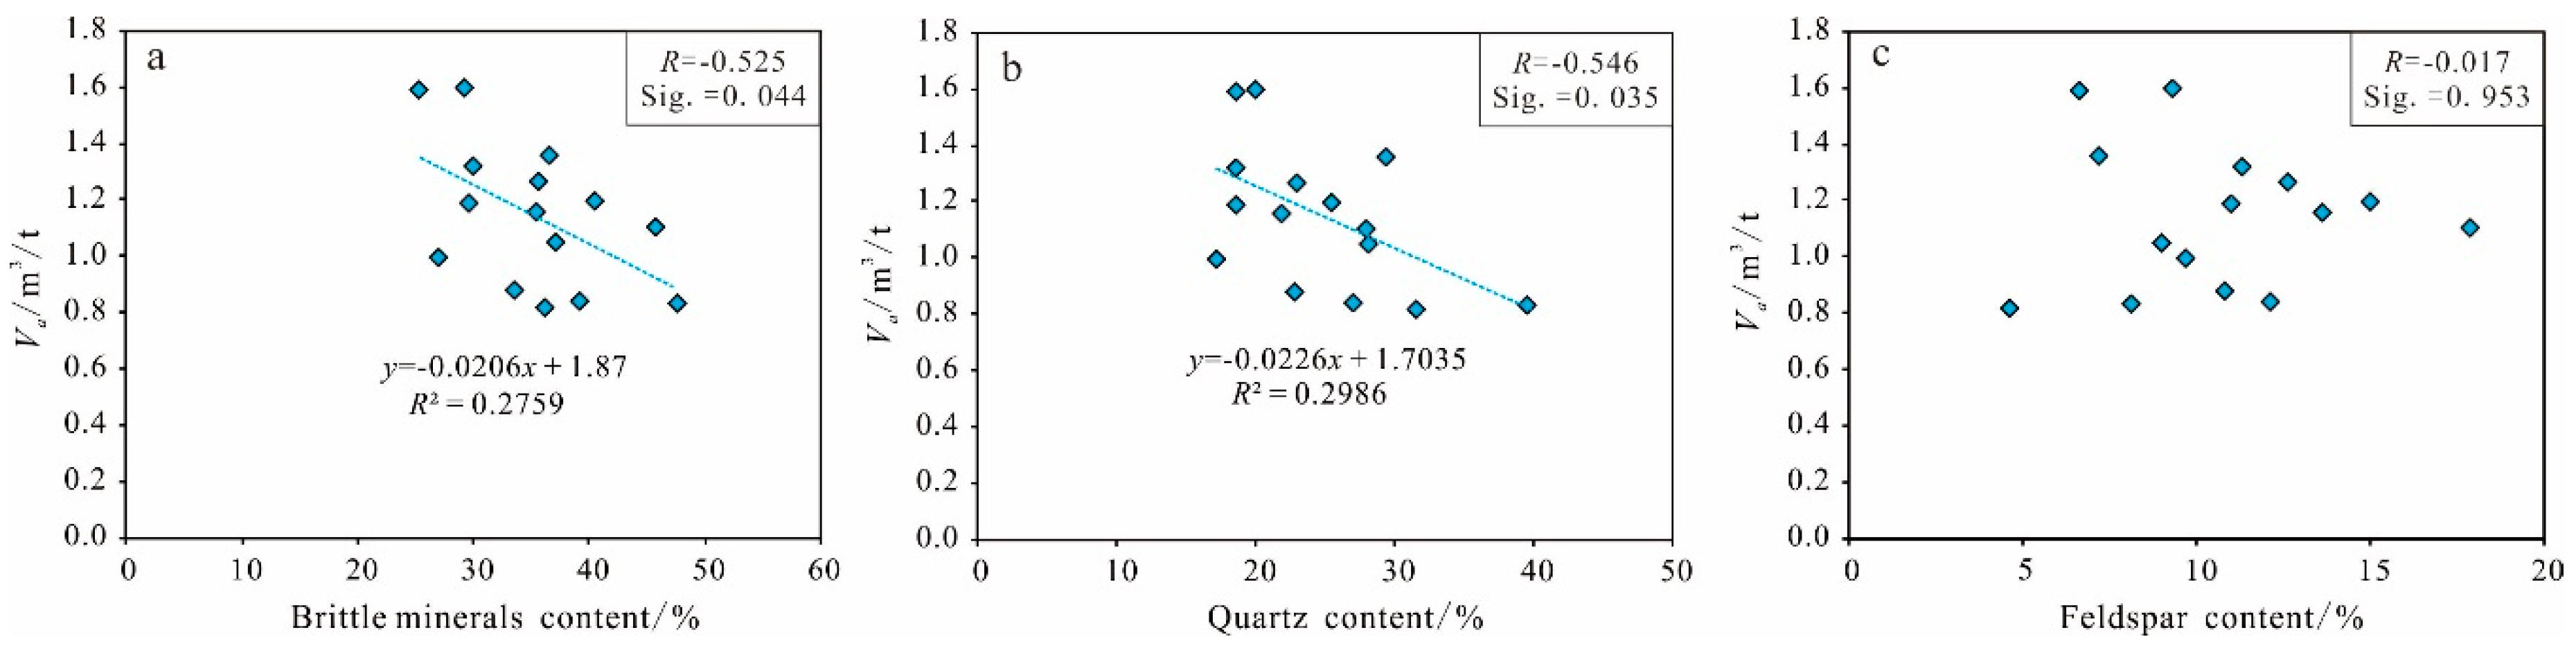
Brittle Mineral Content
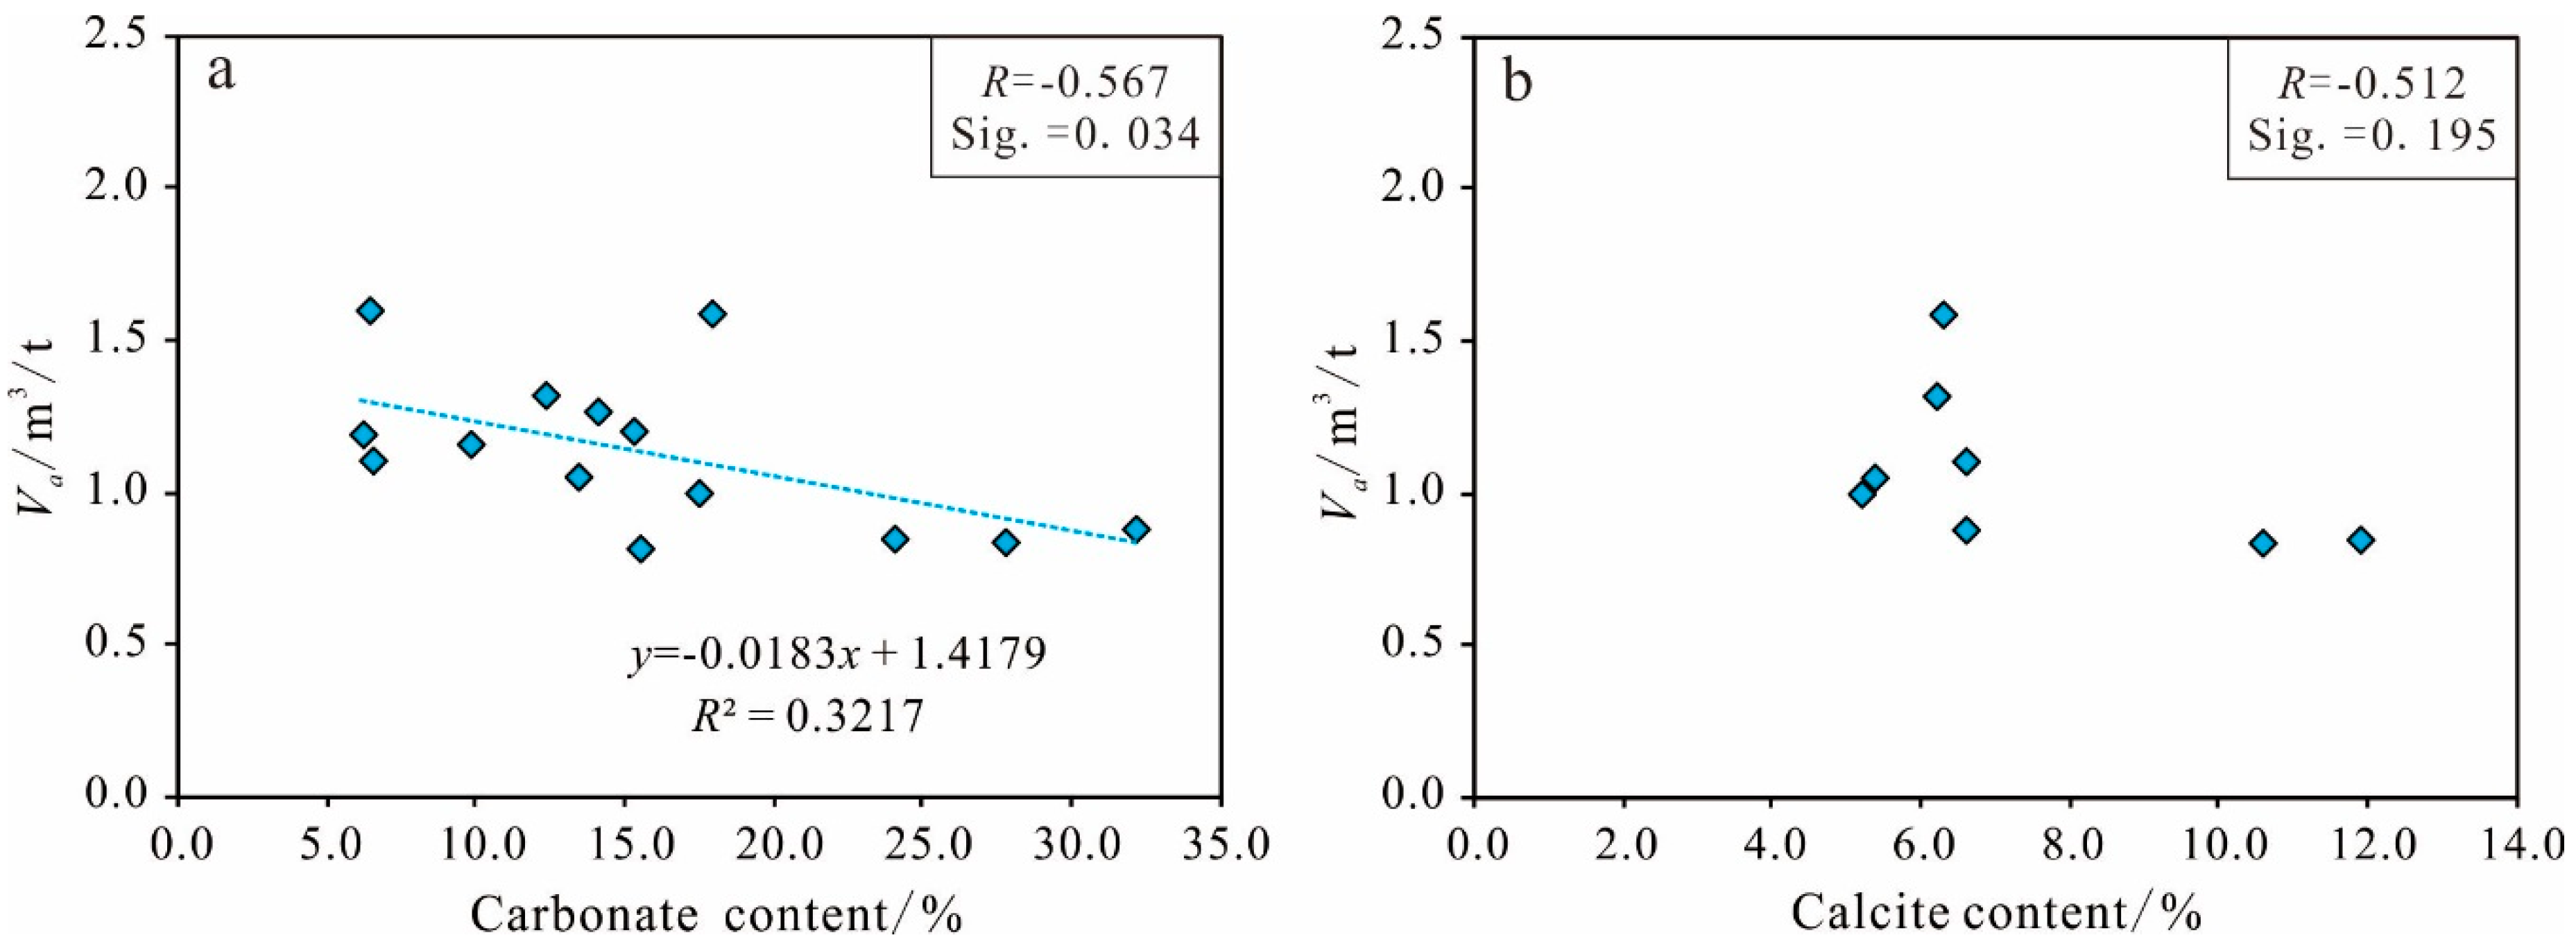
Carbonate Mineral Content
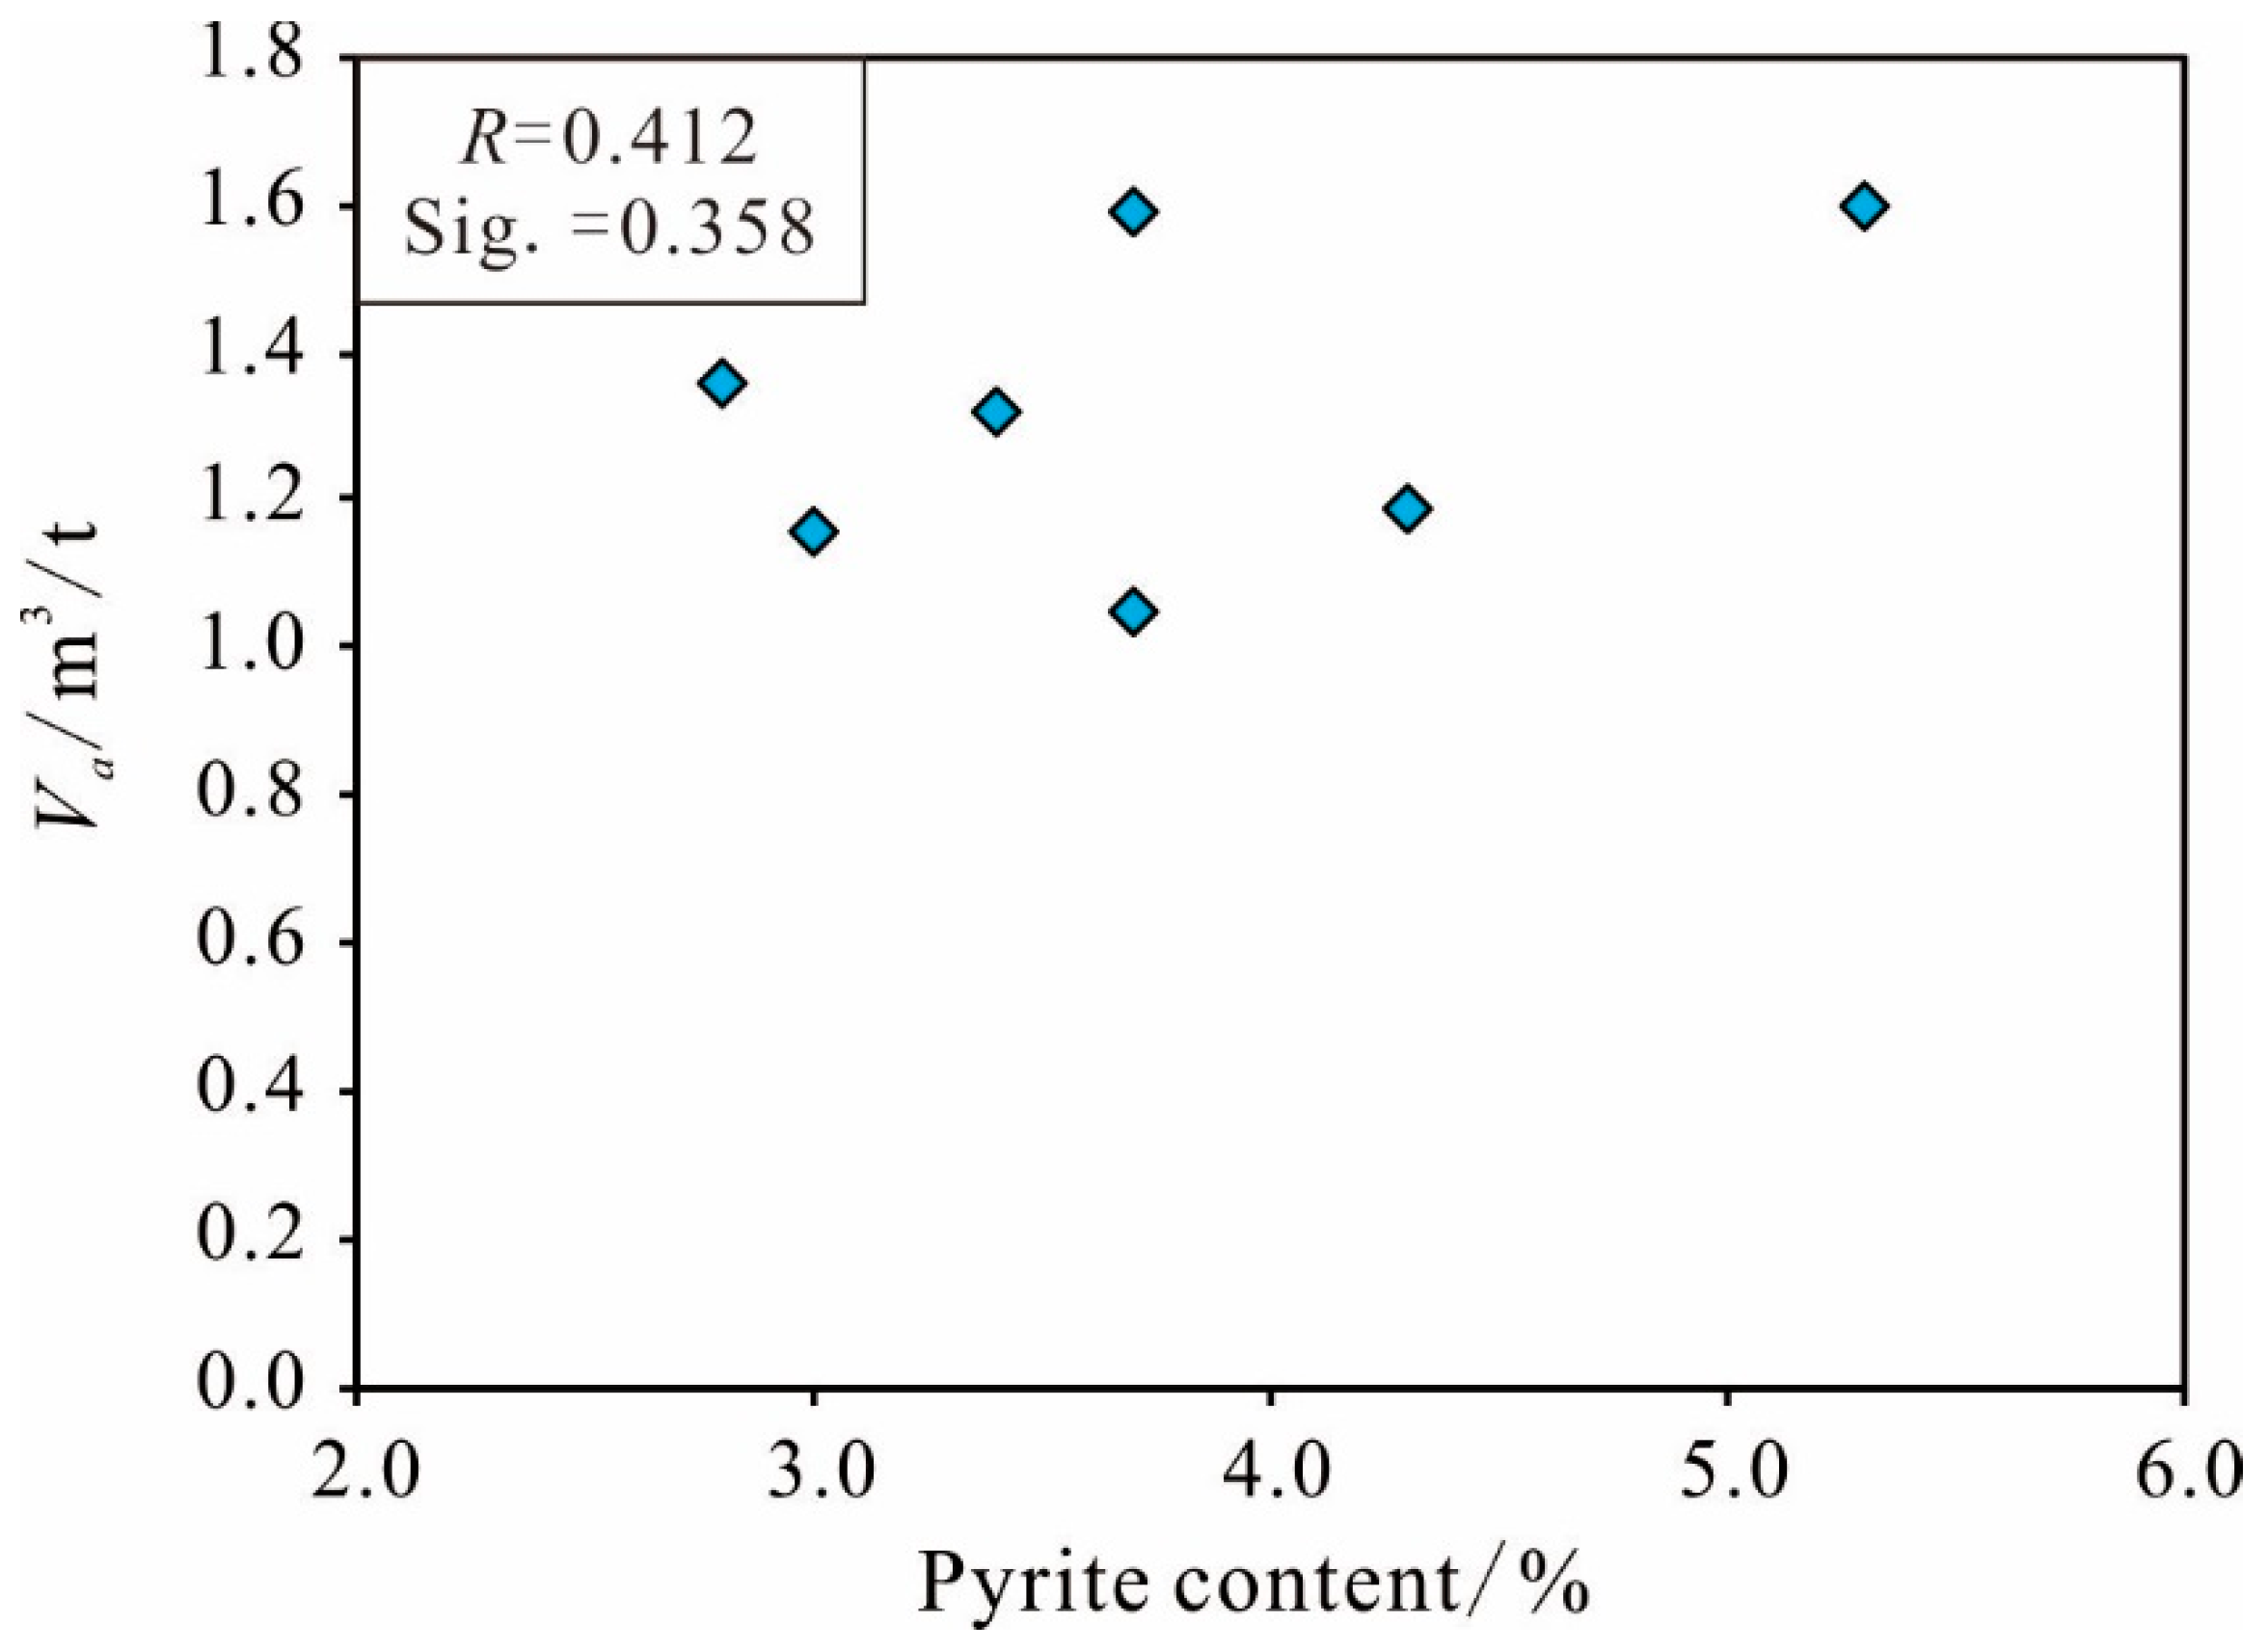
Other Mineral Content
4.1.3. Pore-Based Influence Factors
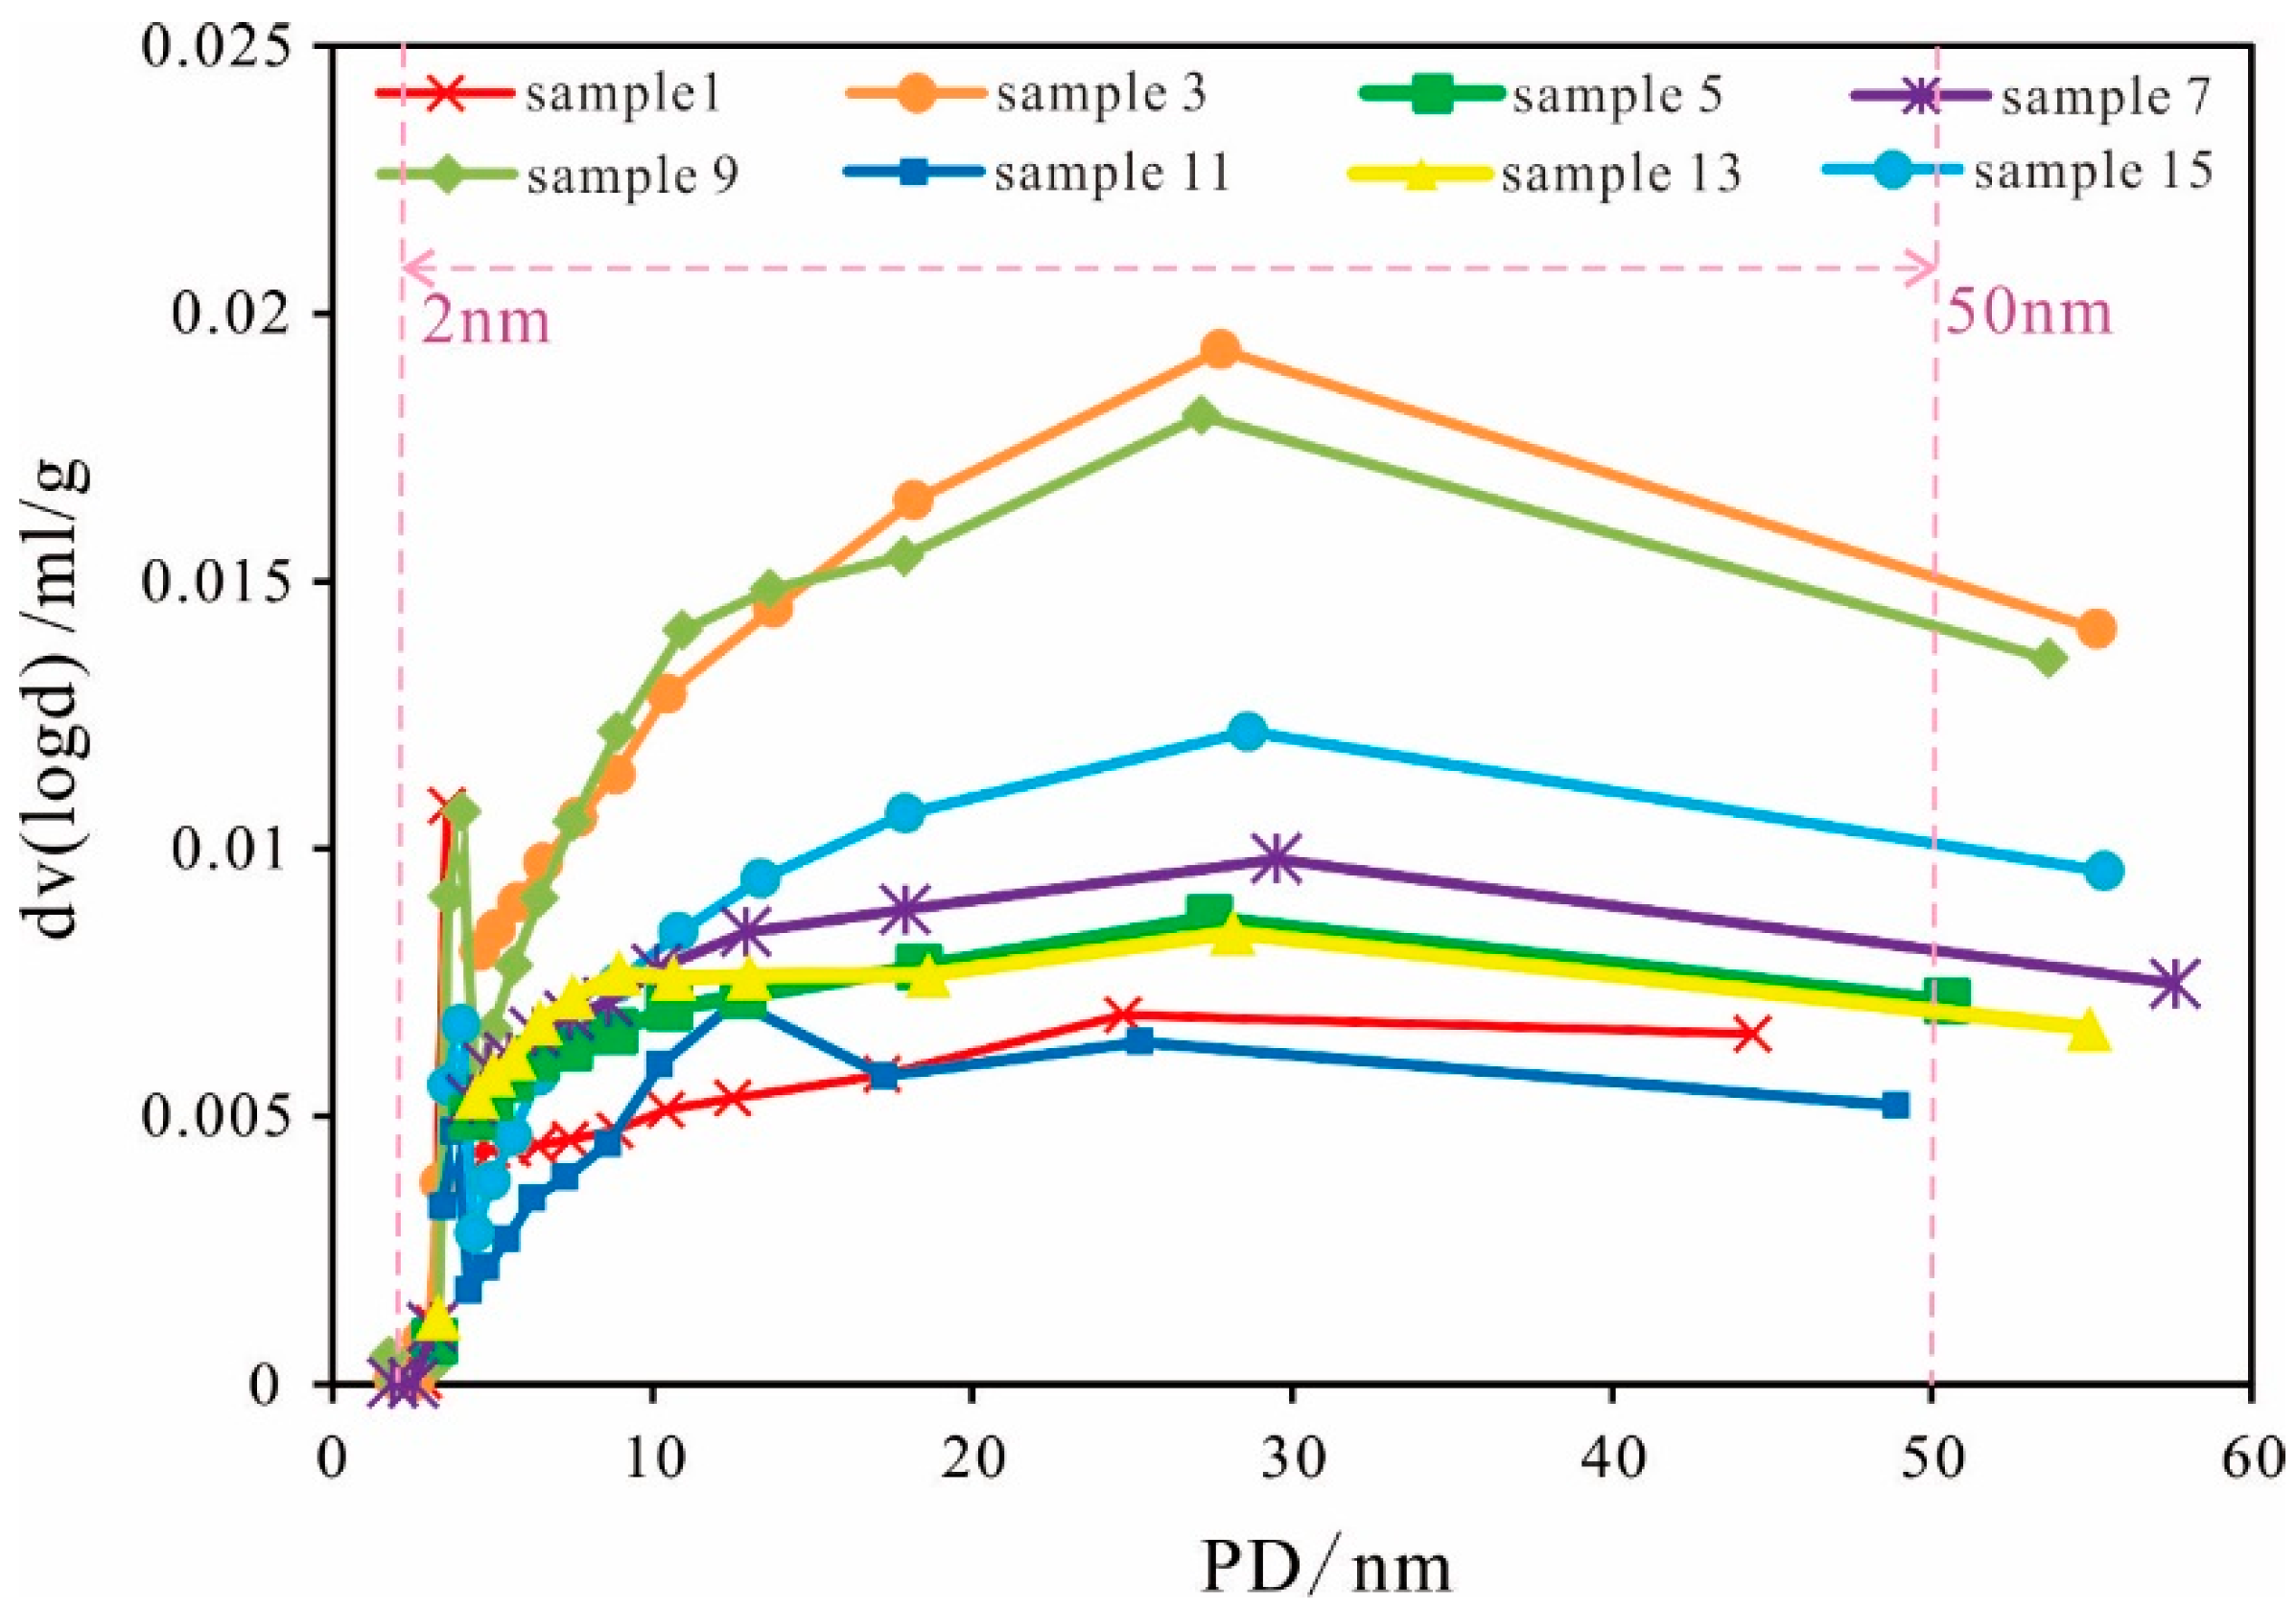
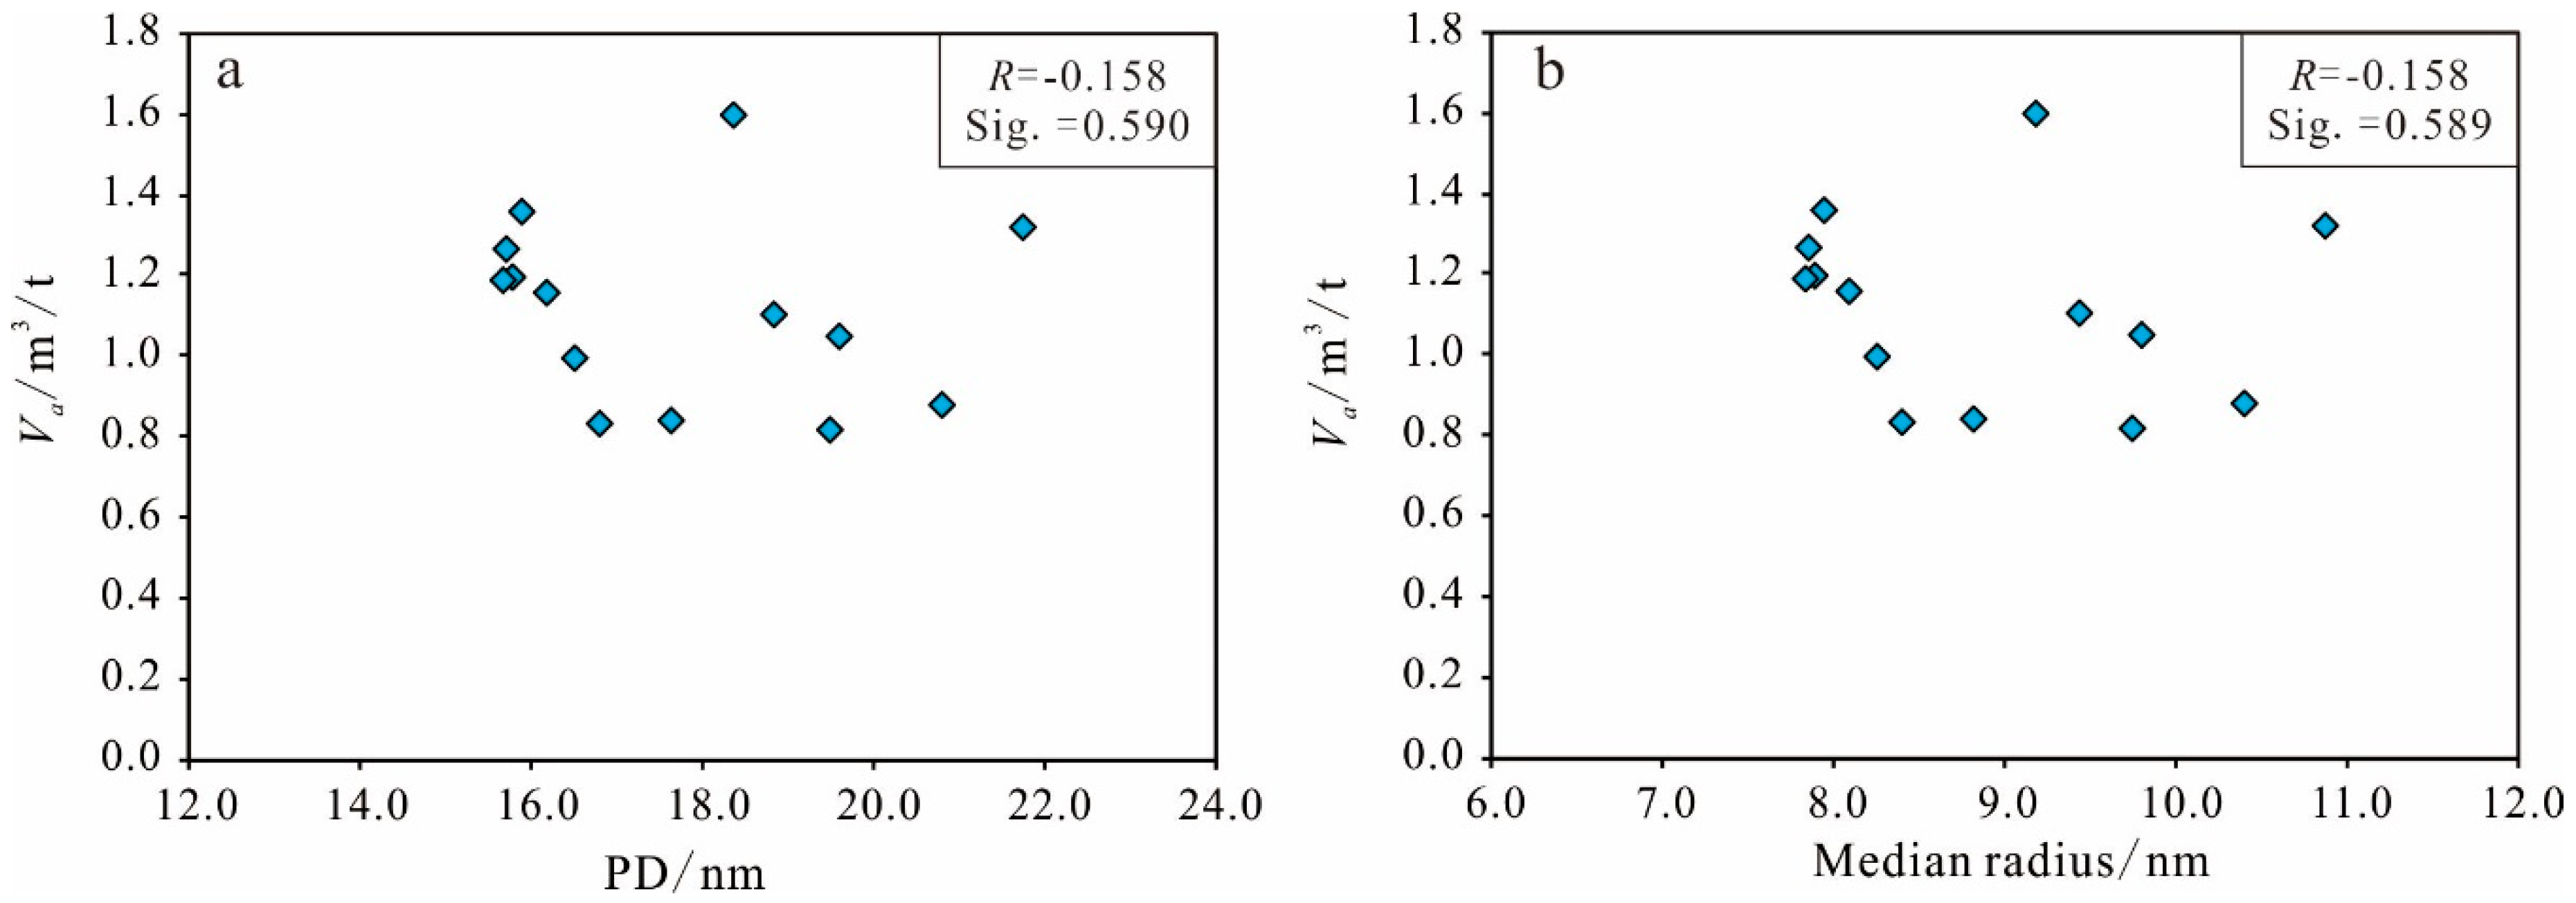
Pore Size Distribution
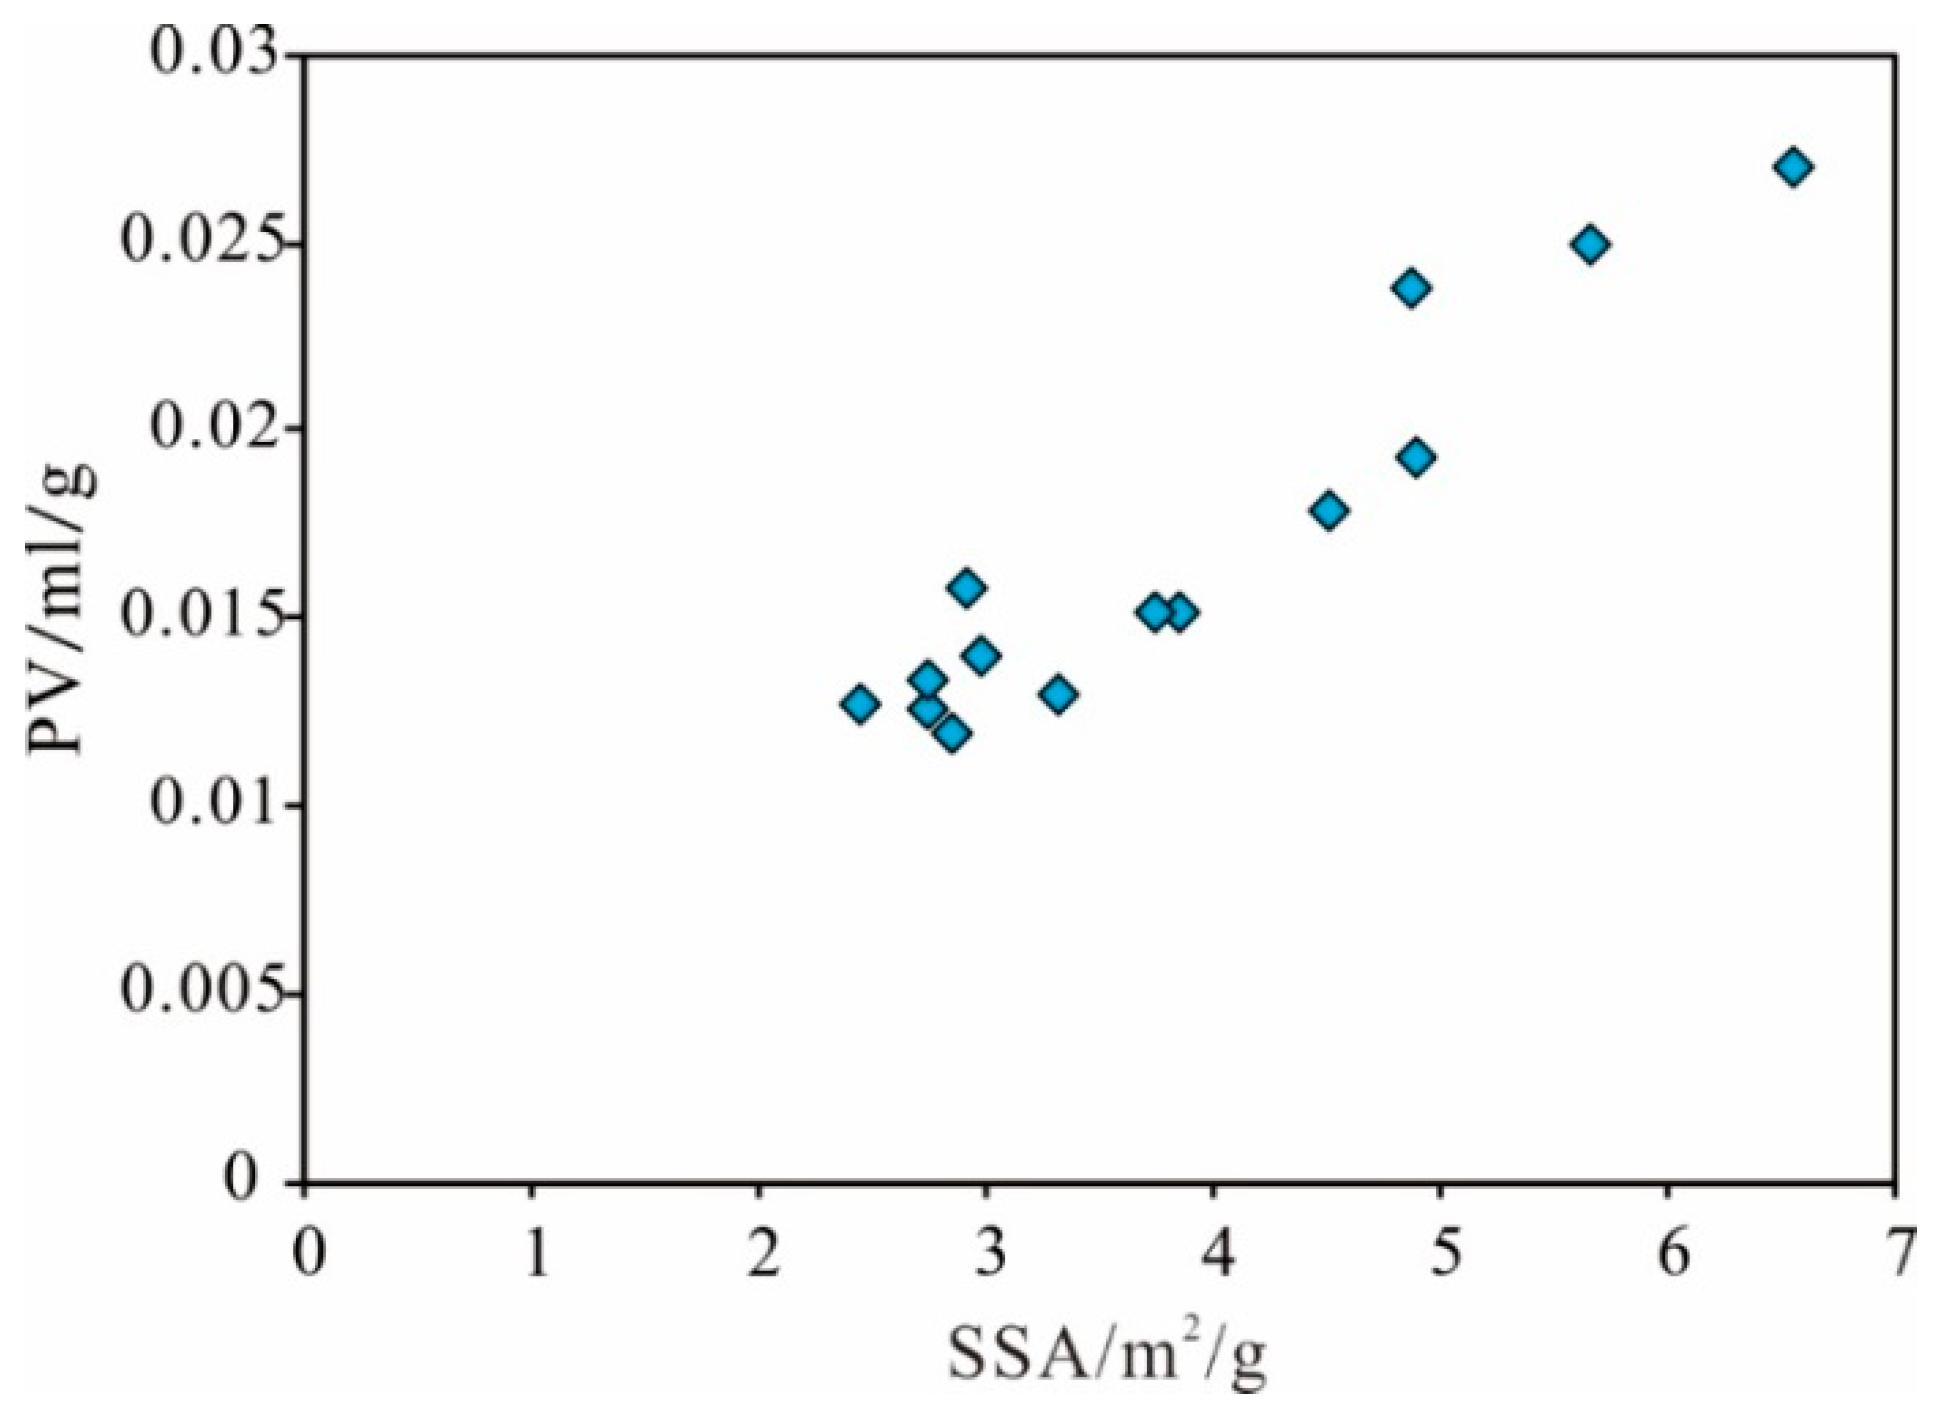
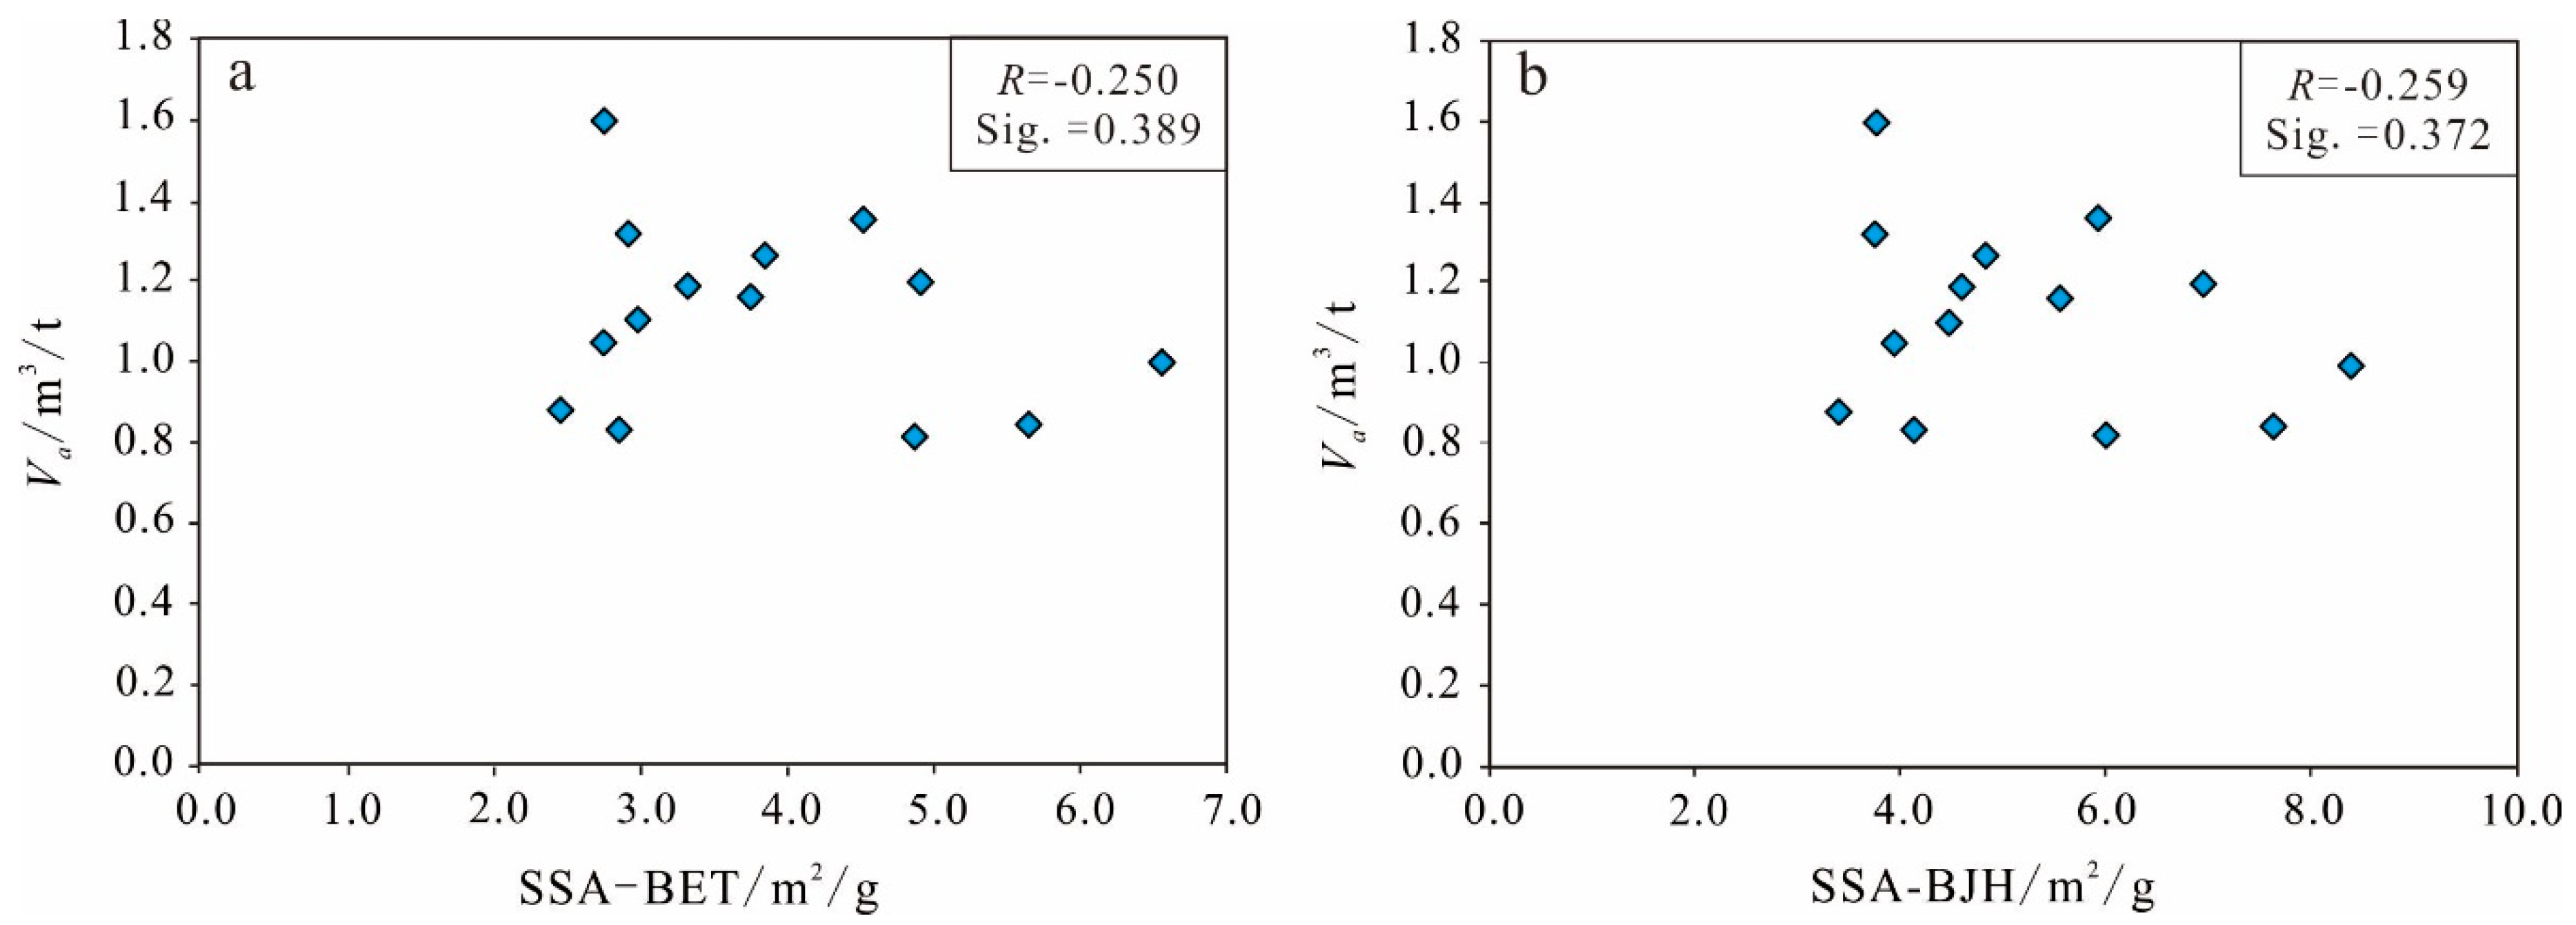
Specific Surface Area
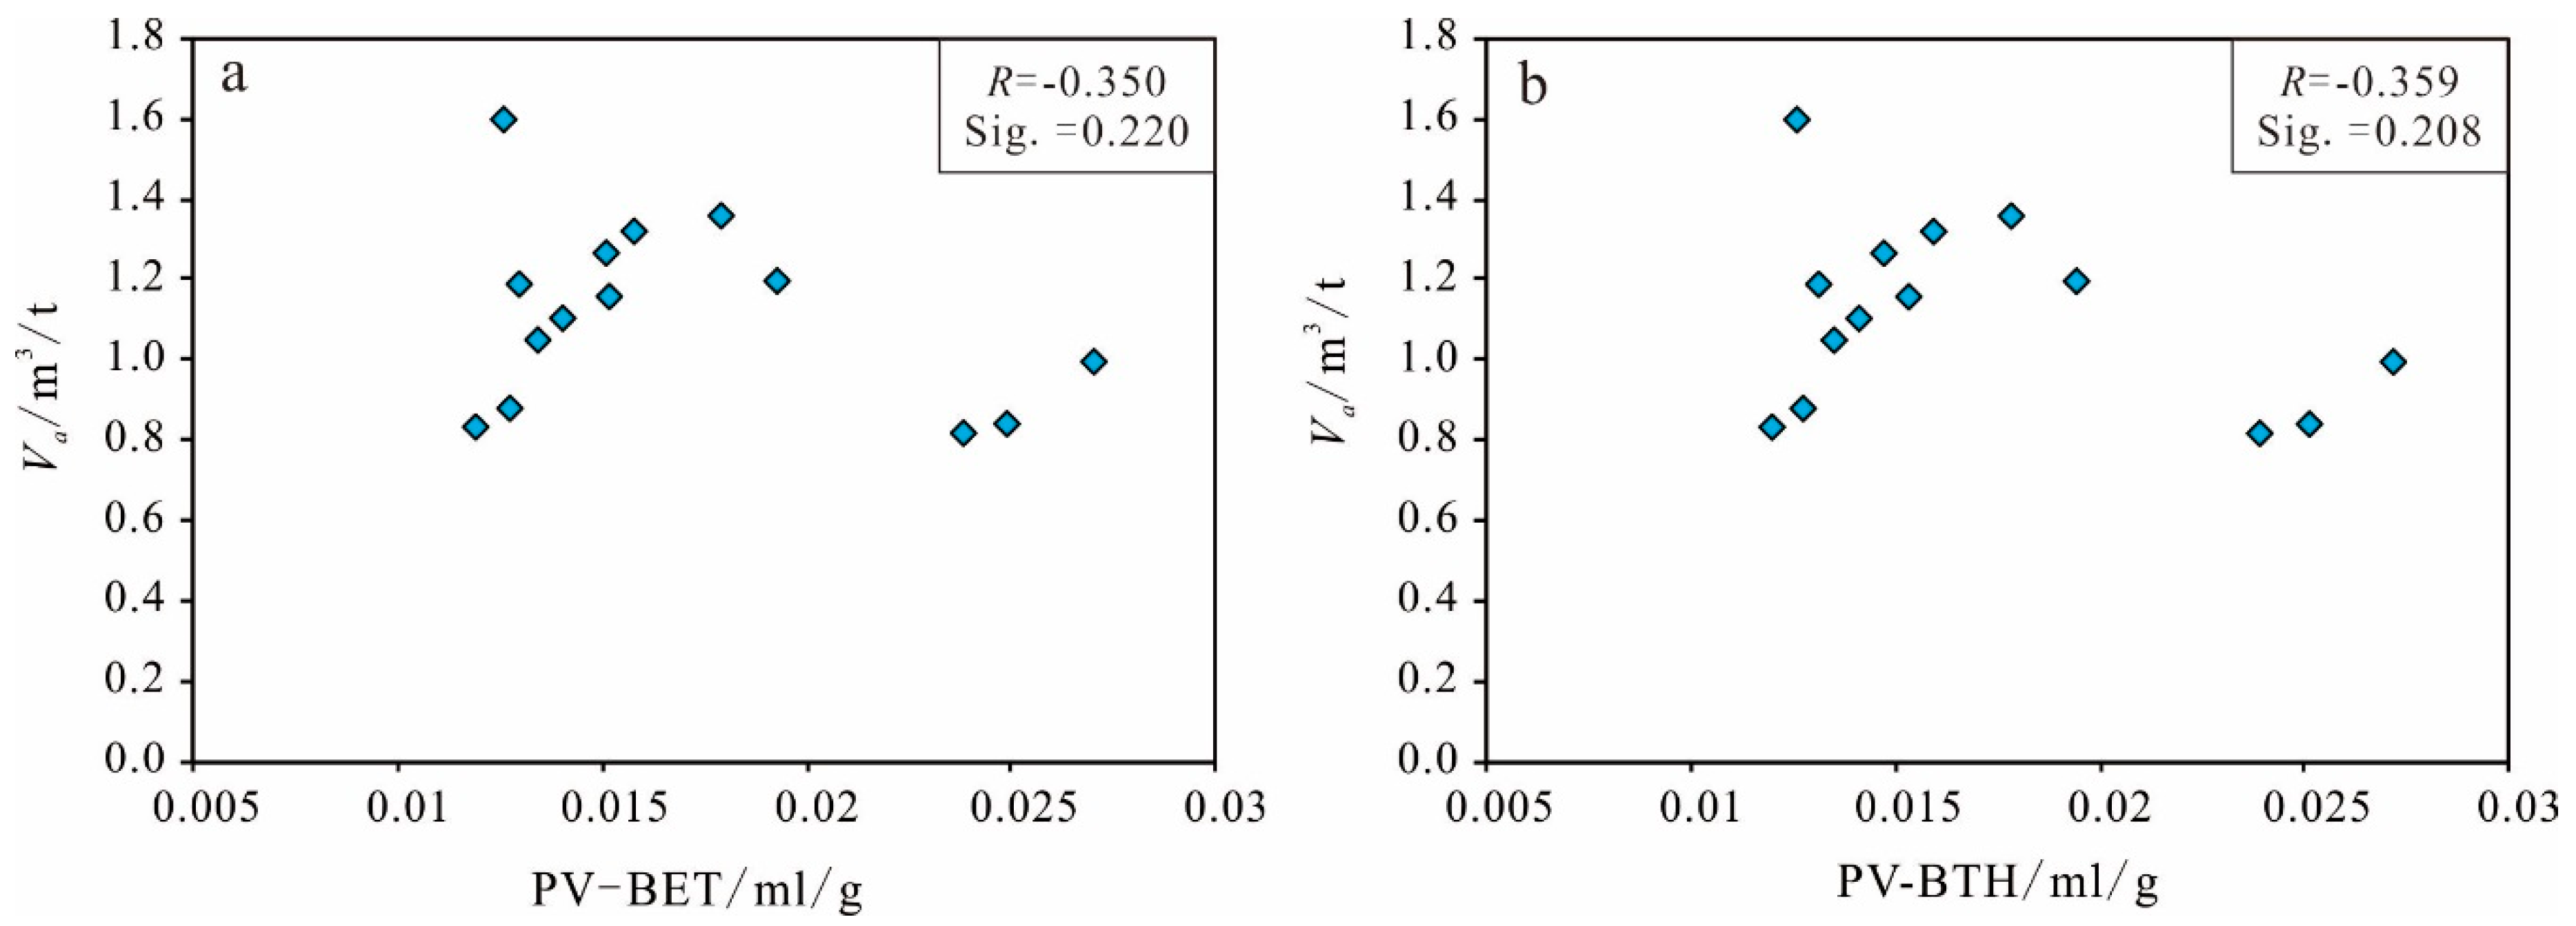
Pore Volume
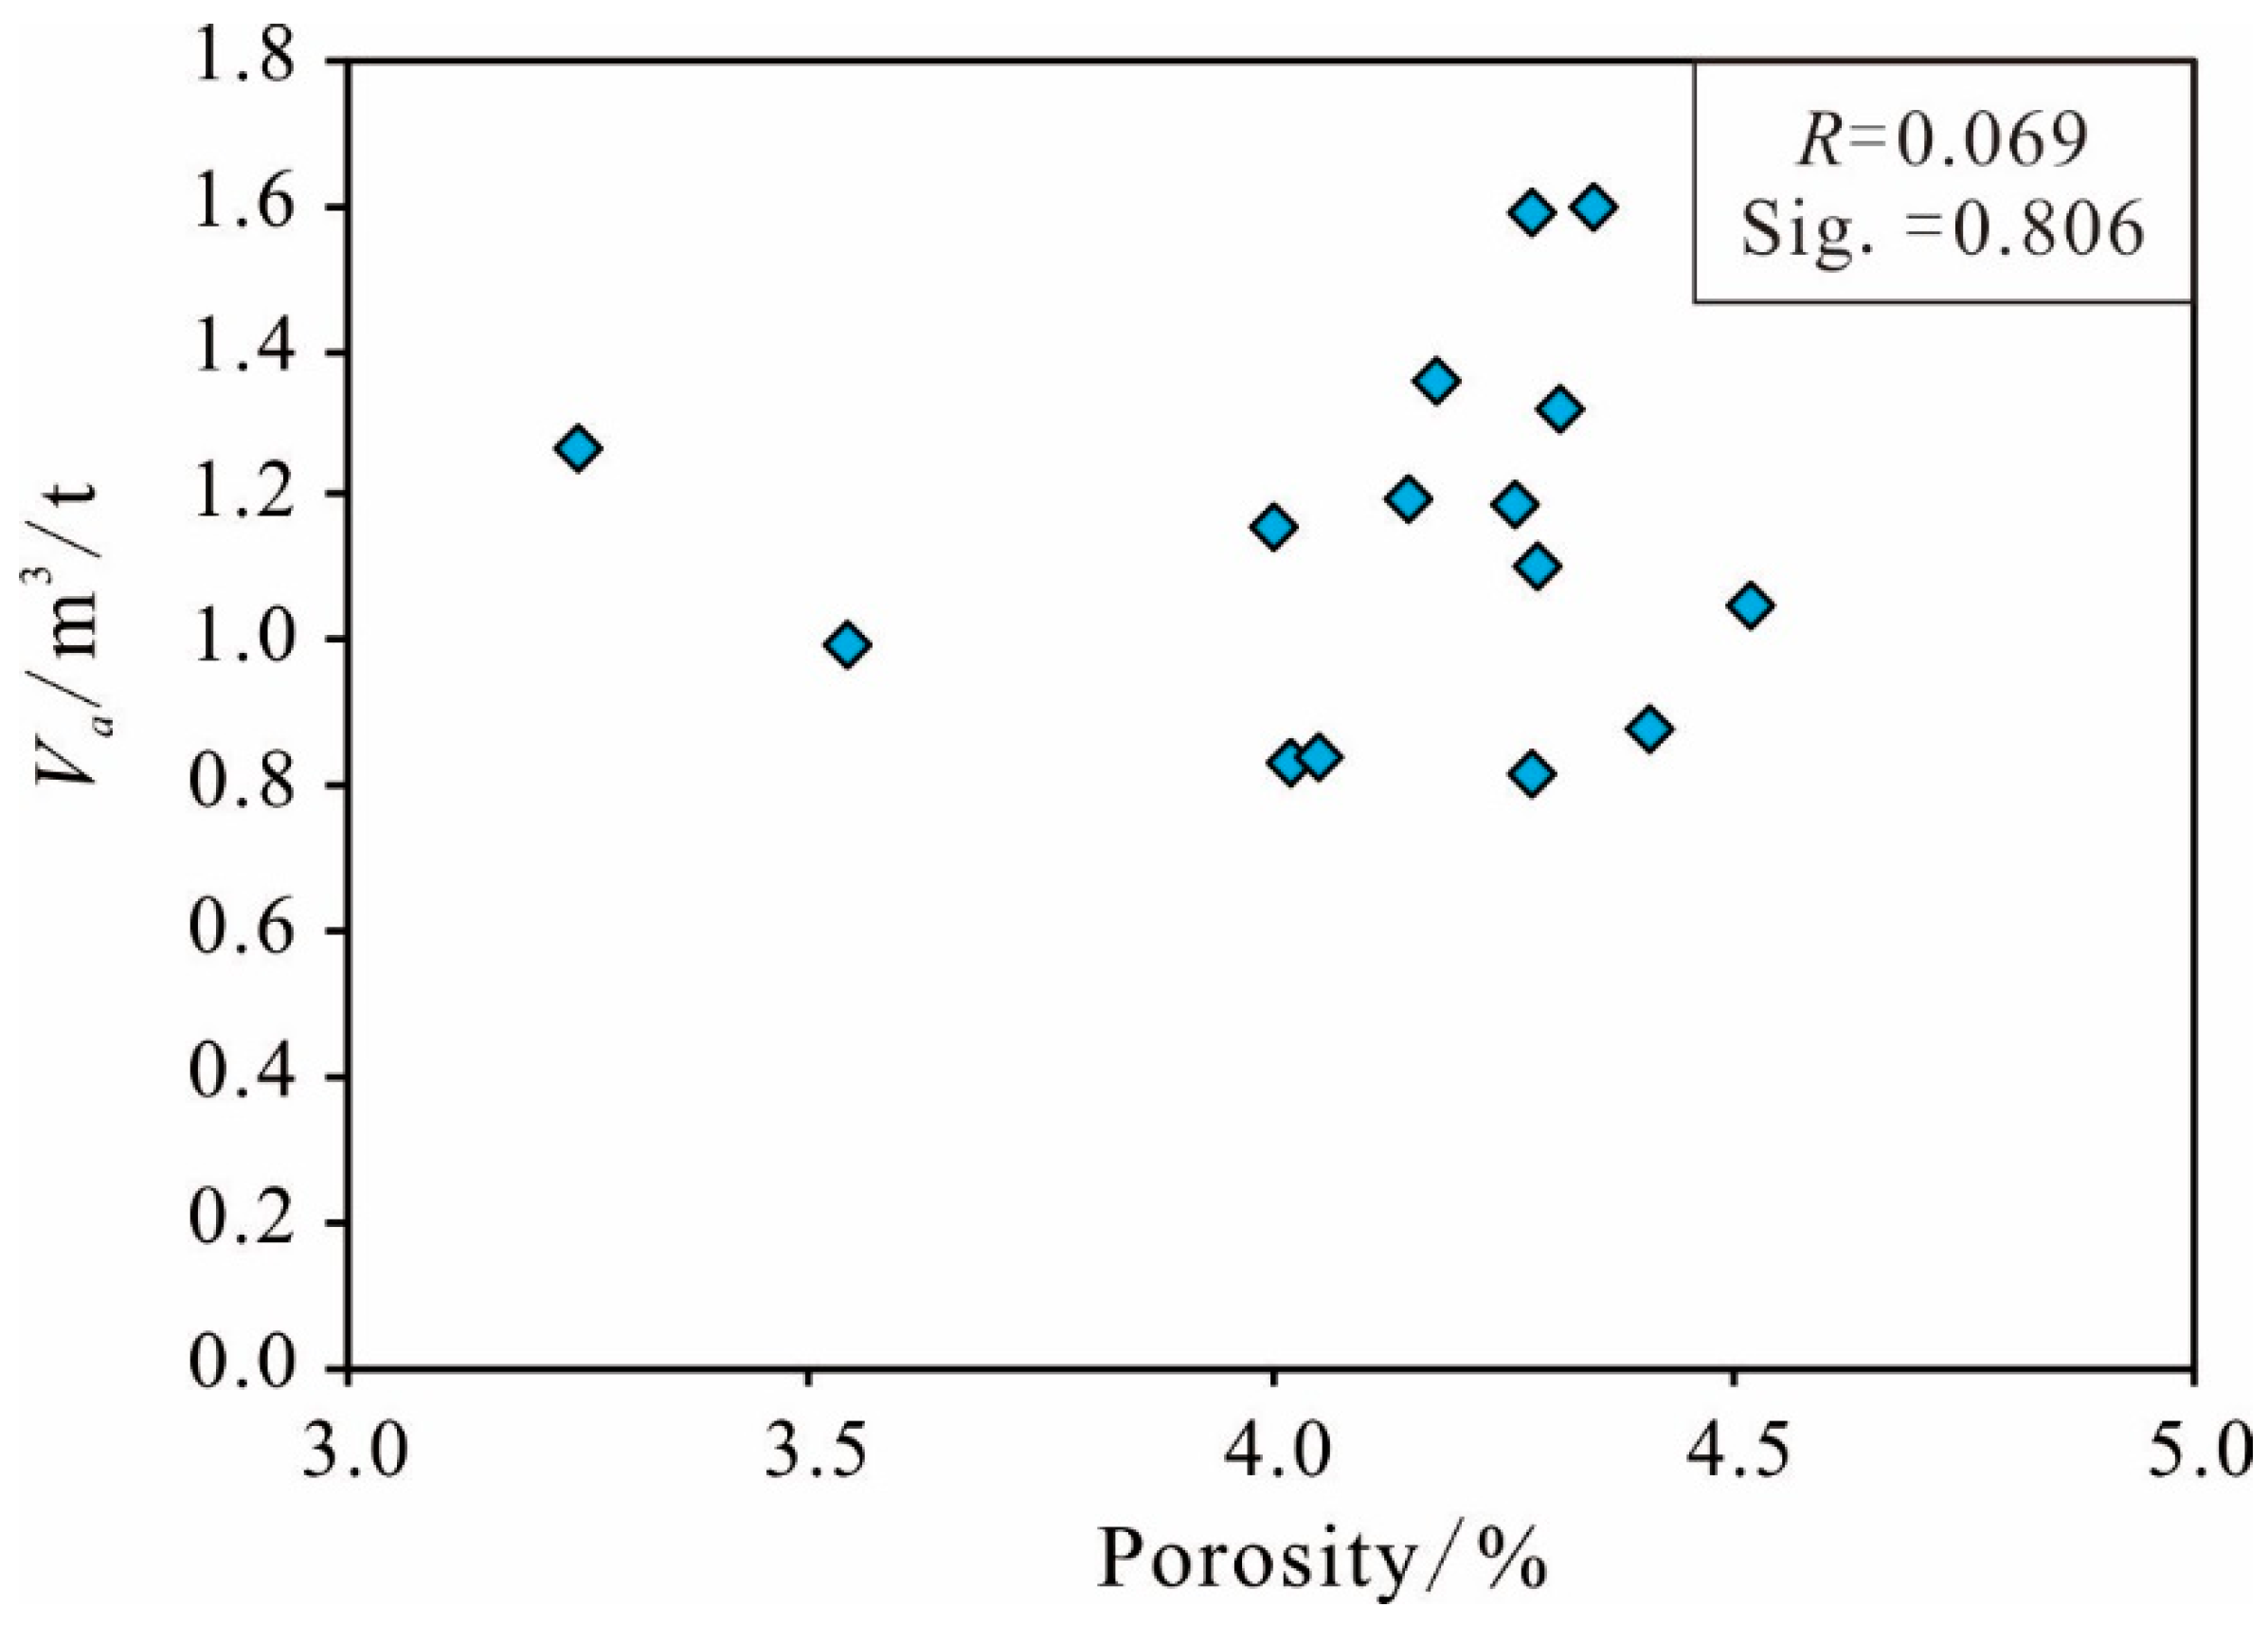
Porosity
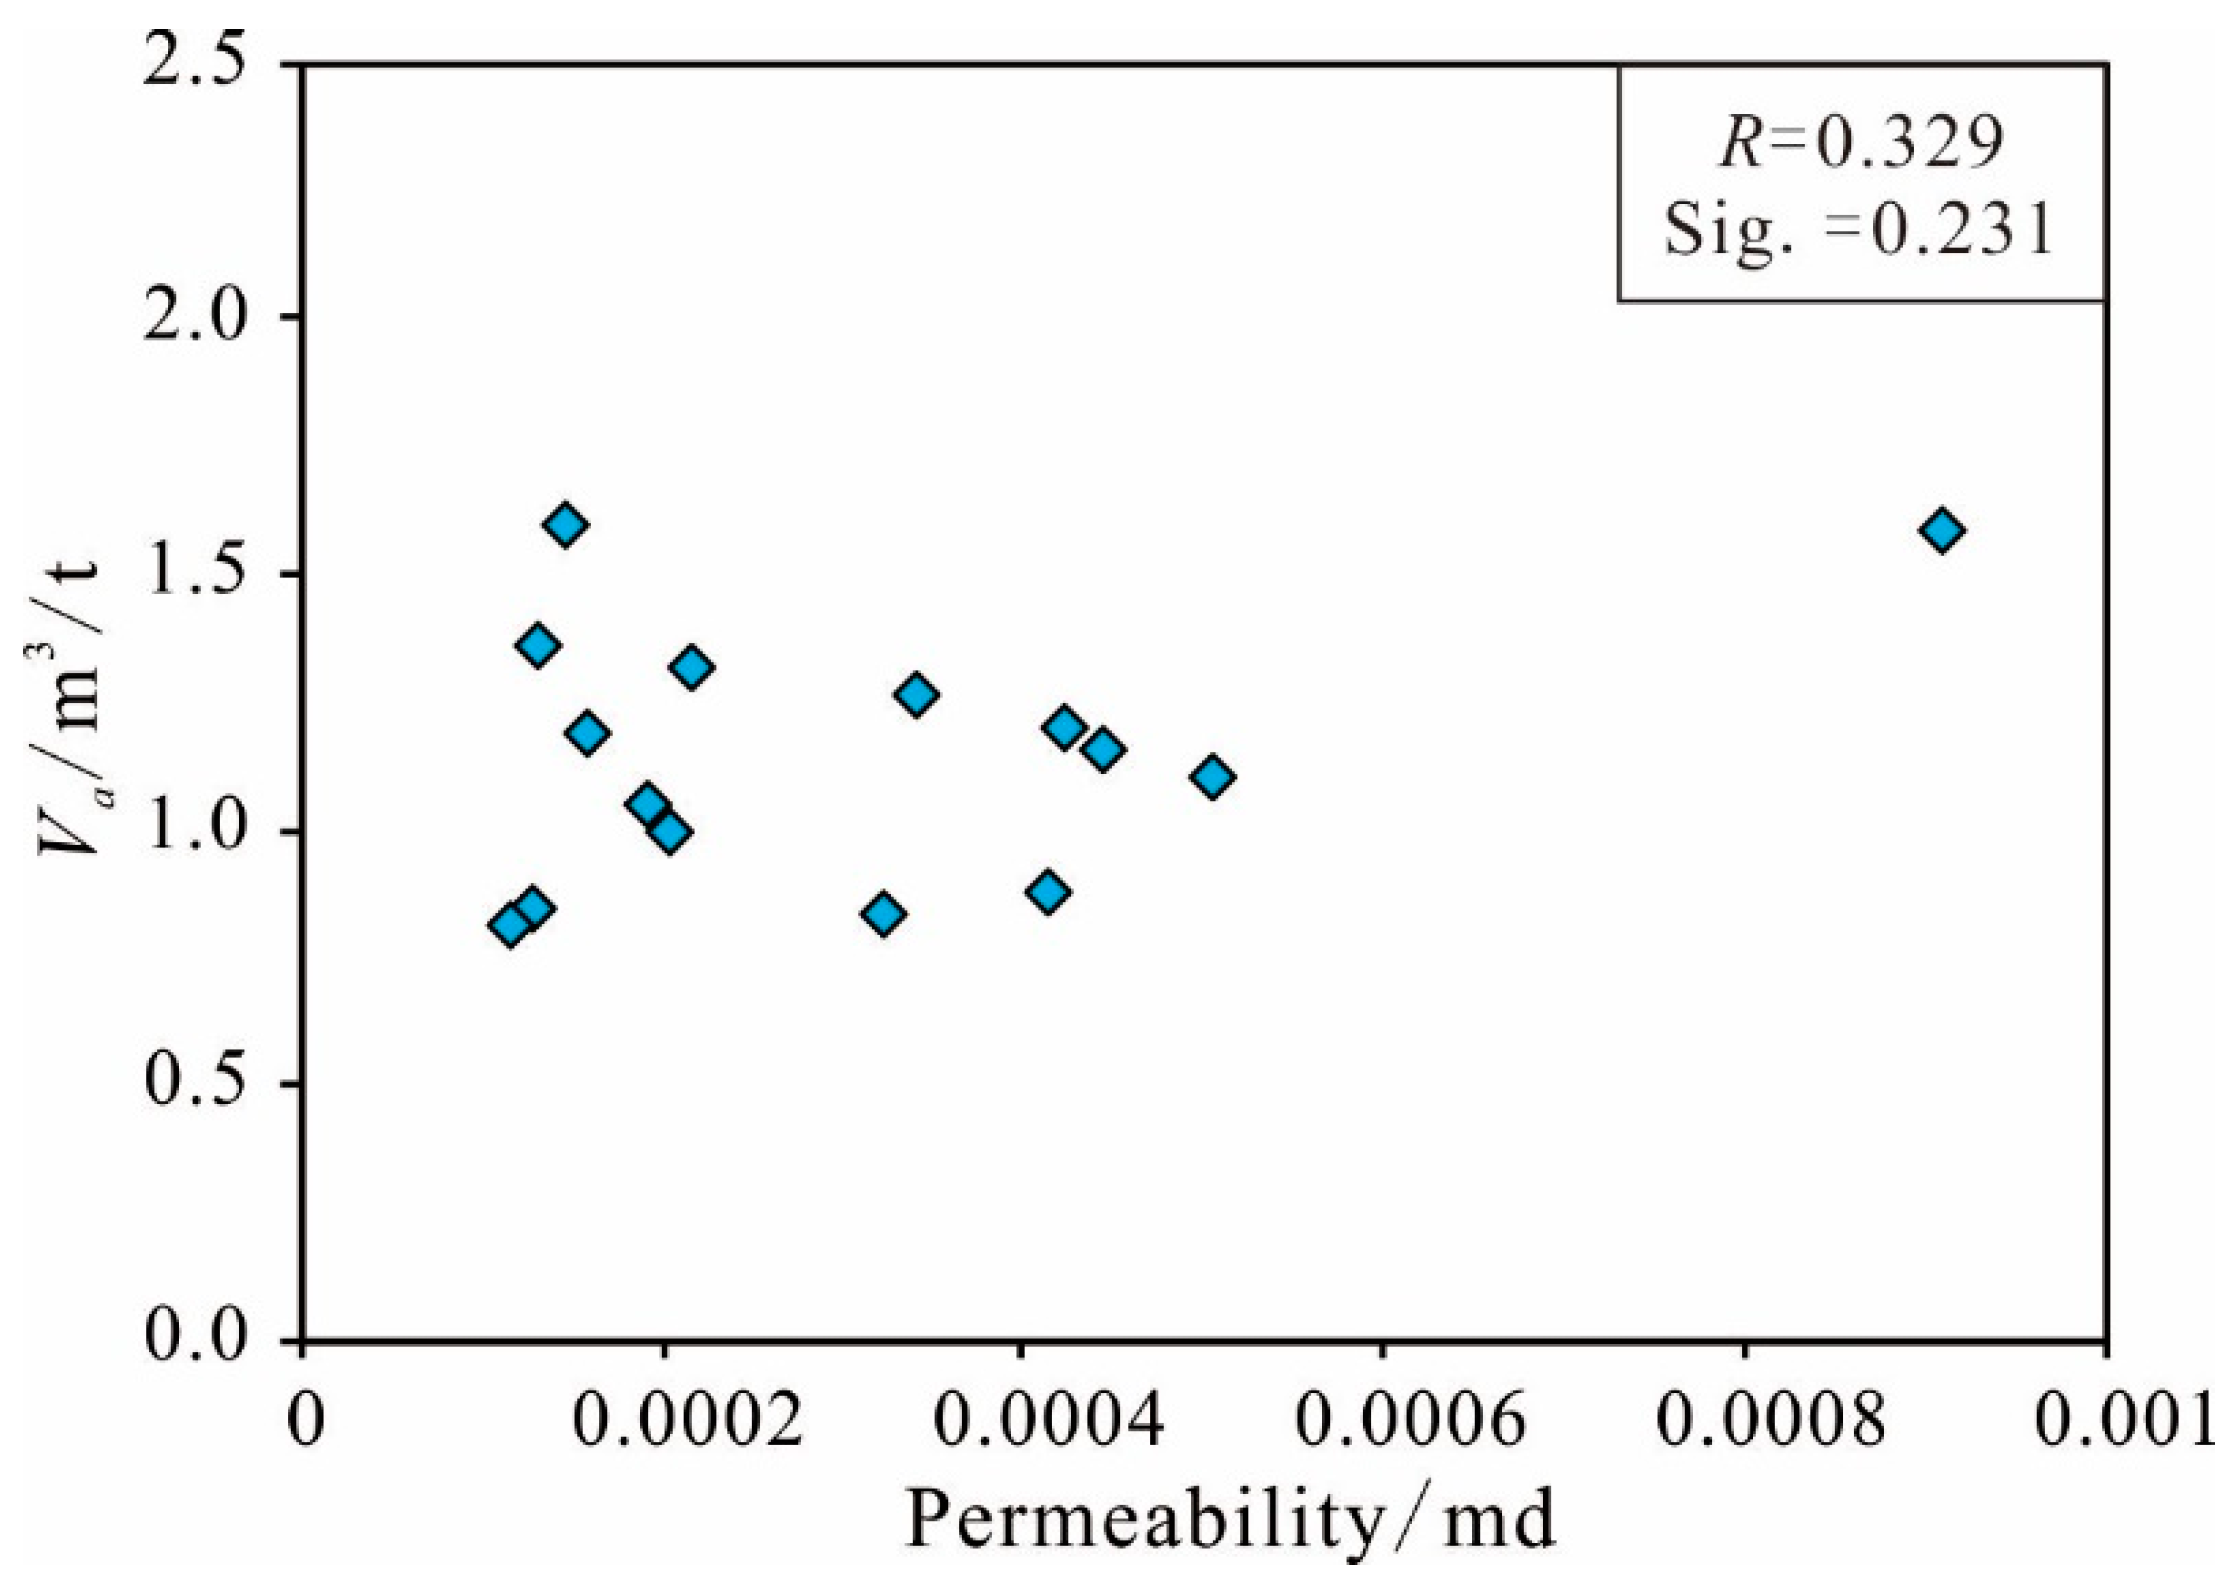
Permeability
4.1.4. External Influence Factors
Temperature
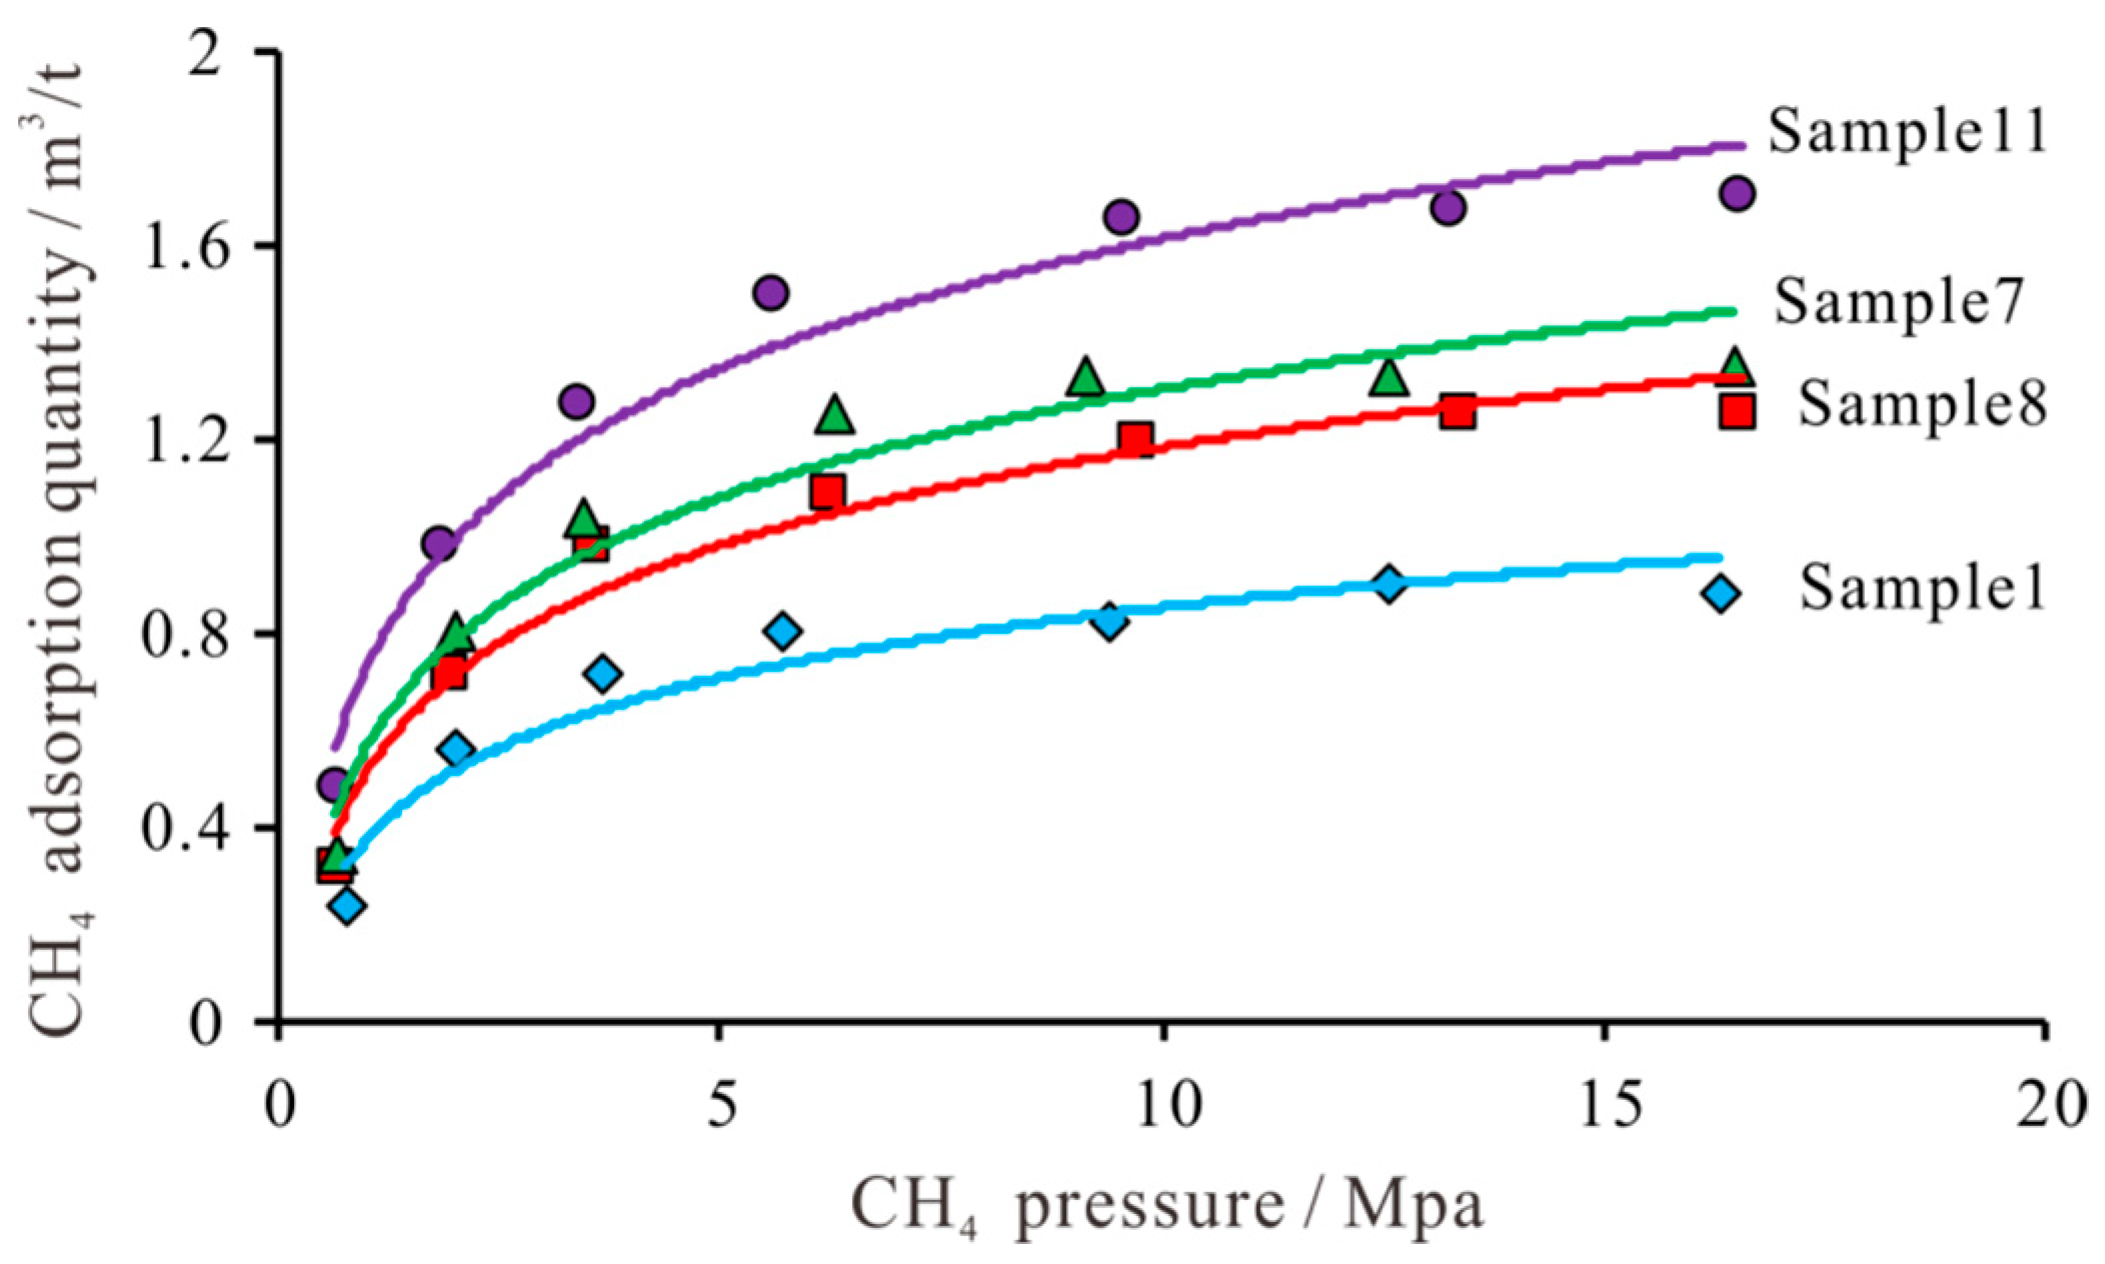
Pressure
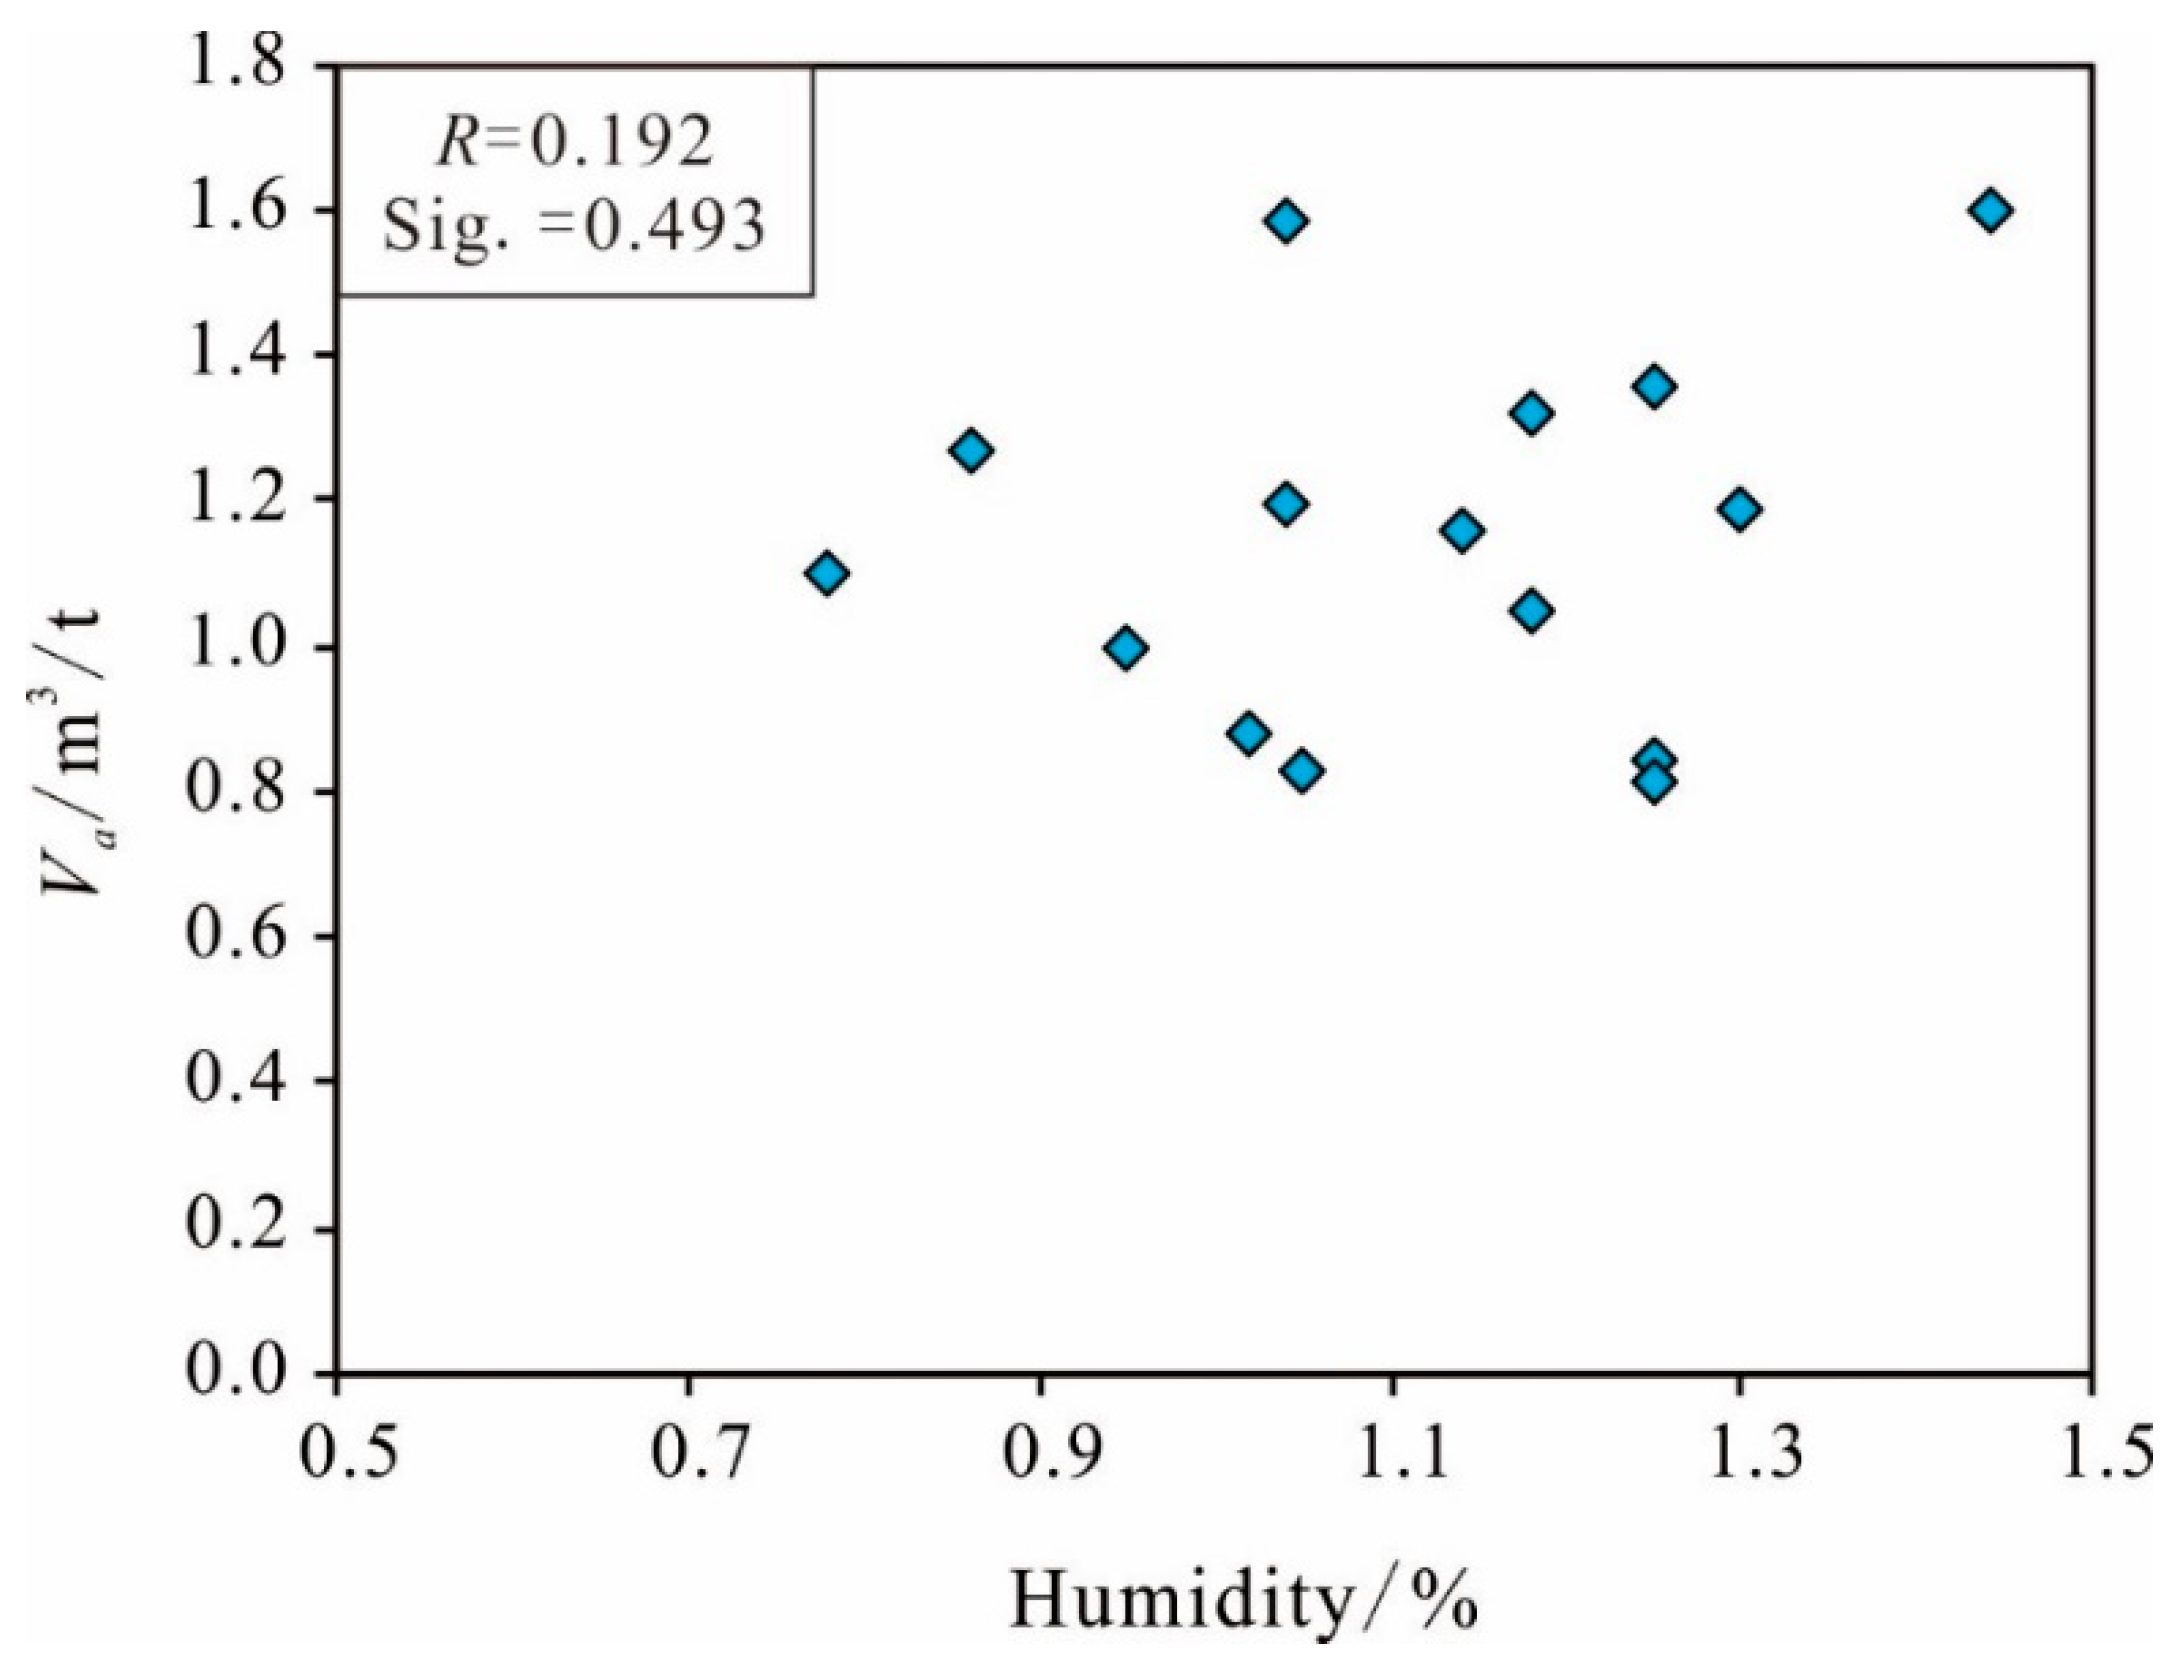
Humidity
4.2. Mathematical Prediction Model of AGC
4.2.1. Influence Factors Optimization
4.2.2. Establish Mathematical Prediction Model
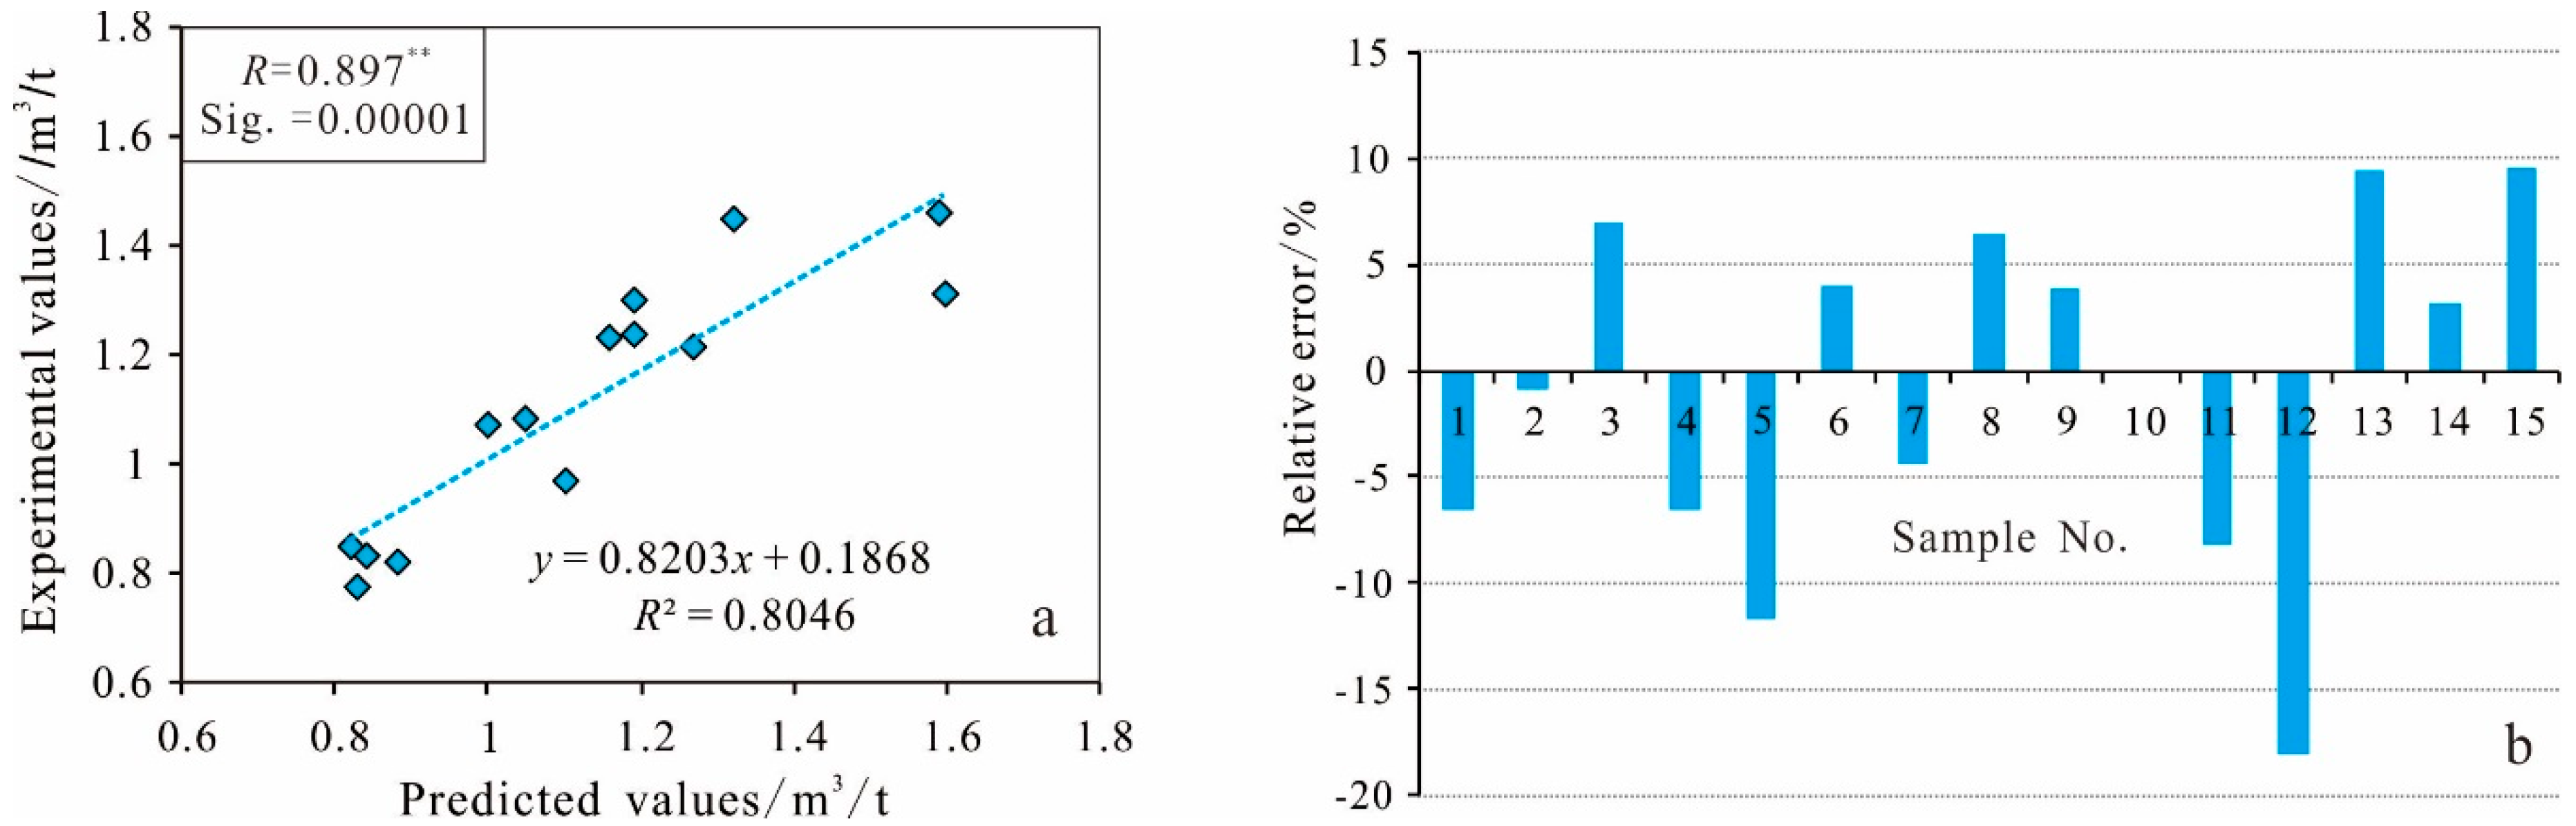
4.2.3. Reliability Test of the Prediction Model
4.3. Comprehensive Evaluation of Shale Gas Adsorption Capacity of Yanchang Formation
4.3.1. Comparison of AGC Obtained from Different Methods
4.3.2. Evaluation of Shale Gas Adsorption Capacity of Yanchang Formation
5. Conclusions
Author Contributions
Funding
Acknowledgments
Conflicts of Interest
References
- Curtis, J.B. Fractured shale gas systems. AAPG Bull. 2002, 86, 1921–1938. [Google Scholar] [CrossRef]
- Chanut, N.; Divoux, T.; Backov, R.; Kenvin, J.; Pellenq, R. Multiscale porosity measurements of Shale rocks using multiple gas adsorption and mercury intrusion porosimetry. Bull. Am. Phys. Soc. 2019. Available online: http://meetings.aps.org/Meeting/MAR19/Session/R23.9 (accessed on 26 April 2019).
- Fink, R.; Amann-Hildenbrand, A.; Bertier, P.; Littke, R. Pore structure, gas storage and matrix transport characteristics of lacustrine Newark shale. Mar. Petrol. Geol. 2018, 97, 525–539. [Google Scholar] [CrossRef]
- Xi, Z.; Tang, S.; Wang, J.; Yang, G.; Li, L. Formation and development of pore structure in marine-continental transitional shale from northern china across a maturation gradient: Insights from gas adsorption and mercury intrusion. Int. J. Coal. Geol. 2018, 200, 87–102. [Google Scholar] [CrossRef]
- Zheng, X.; Zhang, B.; Sanei, H.; Bao, H.; Meng, Z.; Wang, C.; Li, K. Pore structure characteristics and its effect on shale gas adsorption and desorption behavior. Mar. Petrol. Geol. 2019, 100, 165–178. [Google Scholar] [CrossRef]
- Zou, C.; Dong, D.; Wang, S.; Li, J.; Li, X.; Wang, Y.; Li, D.; Cheng, K. Geological characteristics and resource potential of shale gas in China. Petrol. Explor. Dev+. 2010, 37, 641–653, (In Chinese with English Abstract). [Google Scholar] [CrossRef]
- Gasparik, M.; Bertier, P.; Gensterblum, Y.; Ghanizadeh, A.; Krooss, B.M.; Littke, R. Geological controls on the methane storage capacity in organic-rich shales. Int. J. Coal Geol. 2013, 123, 34–51. [Google Scholar] [CrossRef]
- Guo, X.; Hu, D.; Wei, Z.; Li, Y.; Wei, X. Discovery and exploration of Fuling shale gas field. China Pet. Explor. 2016, 21, 24–37, (In Chinese with English Abstract). [Google Scholar] [CrossRef]
- Xing, J.; Hu, S.; Jiang, Z.; Wang, X.; Wang, J.; Sun, L.; Bai, Y.; Chen, L. Classification of controlling factors and determination of a prediction model for shale gas adsorption capacity: A case study of Chang 7 shale in the Ordos Basin. J. Nat. Gas Sci. Eng. 2018, 49, 260–274. [Google Scholar] [CrossRef]
- Li, Q.; Pang, X.; Tang, L.; Chen, G.; Shao, X.; Jia, N. Occurrence features and gas content analysis of marine and continental shales: A comparative study of Longmaxi formation and Yanchang formation. J. Nat. Gas Sci. Eng. 2018, 56, 504–522. [Google Scholar] [CrossRef]
- Zou, J.; Rezaee, R. A Prediction Model for Methane Adsorption Capacity in Shale Gas Reservoirs. Energies 2019, 12, 280. [Google Scholar] [CrossRef]
- Pang, Y.; Soliman, M.Y.; Deng, H.; Xie, X. Experimental and analytical investigation of adsorption effects on shale gas transport in organic nanopores. Fuel 2017, 199, 272–288. [Google Scholar] [CrossRef]
- Fianu, J.; Gholinezhad, J.; Hassan, M. Comparison of Temperature Dependent Gas Adsorption Models and their Application to Shale Gas Reservoirs. Energy Fuels 2018, 32, 4763–4763. [Google Scholar] [CrossRef]
- Jarvie, D.M.; Hill, R.J.; Ruble, T.E.; Pollastro, R.M. Unconventional shale-gas systems: The Mississippian Barnett Shale of north-central Texas as one model for thermogenic shale-gas assessment. AAPG Bull. 2007, 91, 475–499. [Google Scholar] [CrossRef]
- Ross, D.J.K.; Bustin, R.M. Shale gas potential of the Lower Jurassic Gordondale Member, northeastern British Columbia, Canada. Bull. Can. Petro. Geol. 2007, 55, 51–75. [Google Scholar] [CrossRef]
- Hao, F.; Zou, H.; Lu, Y. Mechanisms of shale gas storage: Implications for shale gas exploration in China. AAPG Bull. 2013, 97, 1325–1346. [Google Scholar] [CrossRef]
- Chen, L.; Zuo, L.; Jiang, Z.; Jiang, S.; Liu, K.; Tan, J.; Zhang, L. Mechanisms of shale gas adsorption: Evidence from thermodynamics and kinetics study of methane adsorption on shale. Chem. Eng. J. 2019, 361, 559–570. [Google Scholar] [CrossRef]
- Zhang, Q.; Liang, F.; Pang, Z.; Jiang, S.; Zhou, S.; Zhang, J. Lower threshold of pore-throat diameter for the shale gas reservoir: Experimental and molecular simulation study. J. Petrol. Sci. Eng. 2019, 173, 1037–1046. [Google Scholar] [CrossRef]
- Chalmers, G.R.L.; Bustin, R.M. Lower Cretaceous gas shales in northeastern British Columbia, Part I: Geological controlson methane sorption capacity. Bull. Can. Petrol. Geol. 2008, 56, 1–21. [Google Scholar] [CrossRef]
- Ross, D.J.K.; Bustin, R.M. Characterizing the shale gas resource potential of Devonian—Missippian stratainthe Western Canadased—Imentary basin: Application of an integrated formation evaluation. AAPG Bull. 2008, 92, 87–125. [Google Scholar] [CrossRef]
- Zhang, T.; Ellis, G.S.; Ruppel, S.C.; Milliken, K.; Yang, R. Effect of organic-matter type and thermal maturity on methane adsorption in shale-gas systems. Org. Geochem. 2012, 47, 120–131. [Google Scholar] [CrossRef]
- Montgomery, S.L.; Jarvie, D.M.; Bowker, K.A.; Pollastro, R.M. Mississippian Barnett Shale, Fort Worth basin, northecentral Texas: Gas-shale plays with multietrillion cubic foot potential. AAPG Bull. 2005, 89, 155–175. [Google Scholar] [CrossRef]
- Shao, X.; Pang, X.; Li, Q.; Wang, P.; Chen, D.; Shen, W.; Zhao, Z. Pore structure and fractal characteristics of organic-rich shales: A case study of the lower Silurian Longmaxi shales in the Sichuan Basin, SW China. Mar. Petro. Geol. 2017, 80, 192–202. [Google Scholar] [CrossRef]
- Yao, G.; Wang, X.; Du, H.; Yi, W.; Guo, M.; Xiang, R.; Li, Z. Applicability of USBM method in the test on shale gas content. Acta. Petrolei. Sinica. 2016, 37, 802–806, 814. [Google Scholar] [CrossRef]
- Huang, H.; Sun, W.; Xiong, F.; Chen, L.; Li, X.; Gao, T.; Jiang, Z.; Ji, W.; Wu, Y.; Han, J. A novel method to estimate subsurface shale gas capacities. Fuel 2018, 232, 341–350. [Google Scholar] [CrossRef]
- Wang, R.; Zhang, N.; Liu, X.; Wu, X.; Yan, J. Adsorption influence factors and characteristics of adsorption isotherm curve for shale to methane. Nat. Gas Geosci. 2015, 26, 580–591, (In Chinese with English Abstract). [Google Scholar] [CrossRef]
- Haul, R. Adsorption, Surface Area and Porosity. Zeitschrift Für Physikalische Chemie 1969, 63, 220–221. [Google Scholar] [CrossRef]
- Prausnitz, J.M.; Lichtenthaler, R.N.; de Azevedo, E.G. Solutions Manual for Molecular Thermodynamics of Fluid-Phase Equilibria, 3rd ed.; Prentice Hall: New York, NY, USA, 1998; p. 864. [Google Scholar]
- Gu, Y.; Ding, W.; Yin, S.; Yin, M.; Xiao, Z. Adsorption characteristics of clay minerals in shale. Petrol. Sci. Technol. 2018, 36, 108–114. [Google Scholar] [CrossRef]
- Guo, S. Experimental study on isothermal adsorption of methane gas on three shale samples from Upper Paleozoic strata of the Ordos Basin. J. Petrol. Sci. Eng. 2013, 110, 132–138. [Google Scholar] [CrossRef]
- Yu, W.; Sepehrnoori, K.; Patzek, T.W. Modeling gas adsorption in Marcellus shale with Langmuir and BET isotherms. SPE J. 2016, 21, 589–600. [Google Scholar] [CrossRef]
- Rezaee, M.R.; Slatt, R.M.; Sigal, R.F. Shale gas rock properties prediction using artificial neural network technique and multi regression analysis, an example from a north American shale gas reservoir. ASEG Ext. Abstr. 2007, 1, 1–4. [Google Scholar] [CrossRef]
- Nie, H.; Bao, S.; Gao, B.; Bian, R.; Zhang, P.; Wu, X.; Ye, X.; Chen, X. A study of shale gas preservation conditions for the lower Paleozoic in Sichuan Basin and its periphery. Earth Sci. Front. 2012, 19, 280–294, (In Chinese with English Abstract). [Google Scholar]
- Chen, Y.; Jiang, S.; Zhang, D.; Liu, C. An adsorbed gas estimation model for shale gas reservoirs via statistical learning. Appl. Energ. 2017, 197, 327–341. [Google Scholar] [CrossRef]
- Zhang, Y.; Zhang, M.; Yu, G.; Fang, Y.; Liu, Y.; Li, J. Calculating method of the individual well productivity for the shale gas reservoir. Pet. Geol. Oilfield Dev. Daqing 2017, 36, 161–164, (In Chinese with English Abstract). [Google Scholar]
- Tang, L.; Song, Y.; Li, Q.; Pang, X.; Jiang, Z.; Li, Z.; Tang, X.; Yu, H.; Sun, Y.; Fan, S.; et al. Quantitative evaluation of shale gas content in different occurrence states of the Longmaxi formation: A new insight from well JY-A in the Fuling Shale Gas Field, Sichuan Basin. Acta. Geol. Sin-Engl. 2019. [Google Scholar] [CrossRef]
- Song, L.; Martin, K.; Carr, T.R.; Ghahfarokhi, P.K. Porosity and storage capacity of Middle Devonian shale: A function of thermal maturity, total organic carbon, and clay content. Fuel 2019, 241, 1036–1044. [Google Scholar] [CrossRef]
- Wei, D.; Zhang, J.; Xuan, T.; Wei, X.; Li, Z.; Wang, C. Investigation of gas content of organic-rich shale: A case study from lower Permian shale in southern north China basin, central China. Geosci. Front. 2018, 9, 1. [Google Scholar] [CrossRef]
- Ji, K.; Guo, S.; Hou, B. A logging calculation method for shale adsorbed gas content and its application. J. Petrol. Sci. Eng. 2017, 150, 250–256. [Google Scholar] [CrossRef]
- Zhao, Z.; Tang, X.; Zhang, G. Experiment and significance of isothermal adsorption of coal on methane under higher temperature. Coal Geol. Explor. 2001, 29, 29–30, (In Chinese with English Abstract). [Google Scholar]
- Hickey, J.J.; Henk, B. Lithofacies summary of the Mississippian Barnett Shale Mitchell 2 T.P.; Simswell, Wise Country, Texas. AAPG Bull. 2007, 91, 437–443. [Google Scholar] [CrossRef]
- Zhao, T.; Li, X.; Ning, Z.; Zhao, H.; Zhang, J.; Zhao, W. Pore structure and adsorption behavior of shale gas reservoir with influence of maturity: A case study of Lower Silurian Longmaxi formation in China. Arab. J. Geosci. 2018, 11, 353. [Google Scholar] [CrossRef]
- Wang, H.; Qu, Z.; Yin, Y.; Bai, J.; Yu, B. Review of molecular simulation method for gas adsorption/desorption and diffusion in shale matrix. J. Therm. Sci. 2019, 28, 1–16. [Google Scholar] [CrossRef]
- Aringhieri, R. Nanoporosity Characteristics of Some Natural Clay Minerals and Soils. Clays Clay Miner. 2004, 52, 700–704. [Google Scholar] [CrossRef]
- Ji, L.; Zhang, T.; Milliken, K.L.; Qu, J.; Zhang, X. Experimental investigation of main controls to methane adsorption in clay-rich rocks. Appl. Geochem. 2012, 27, 2533–2545, (In Chinese with English Abstract). [Google Scholar] [CrossRef]
- Lu, X.C.; Li, F.C.; Watson, A.T. Adsorption measurements in Devonian Shales. Fuel 1995, 74, 599–603. [Google Scholar] [CrossRef]
- Schettler, P.D.; Parmoly, C.R. The measurement of gas desorption isotherms for Devonian shale. GRI Devonian Gas Shale Technol. Rev. 1990, 7, 4–9. [Google Scholar]
- Hu, A.; Pan, Y.; Tang, J. Experiment Reseach of Adsorption and NMR on the Noulding Coal. Clean Coal Tech. 2007, 13, 37–40, (In Chinese with English Abstract). [Google Scholar] [CrossRef]
- Raut, U.; Fama, M.; Teolis, B.D.; Baragiola, R.A. Characterization of porosity invapor-deposited amorphous solid water from methane adsorption. J. Chem. Phys. 2007, 127, 1–6. [Google Scholar] [CrossRef] [PubMed]
- Rexer, T.F.; Benham, M.J.; Aplin, A.C.; Thomas, K.M. Methane adsorption on shale under simulated geological temperature and pressure conditions. Energy Fuel 2013, 27, 3099–3109. [Google Scholar] [CrossRef]
- Hildenbrand, A.; Krooss, B.M.; Busch, A.; Gaschnitz, R. Evolution of methane sorption capacity of coal seams as a function of burial history—A case study from the Campine Basin, NE Belgium. Int. J. Coal Geol. 2006, 66, 179–203. [Google Scholar] [CrossRef]
- Sircar, S. Estimation of isosteric heats of adsorption of single gas and multicomponent gas mixtures. Ind. Eng. Chem. Res. 1992, 31, 1813–1819. [Google Scholar] [CrossRef]
- Xiong, F.; Jiang, Z.; Li, P.; Wang, X.; Bi, H.; Li, Y.; Moortgat, J. Pore structure of transitional shales in the Ordos Basin, NW China: Effects of composition on gas storage capacity. Fuel 2017, 206, 504–515. [Google Scholar] [CrossRef]
- Jiang, F.; Chen, D.; Chen, J.; Li, Q.; Liu, Y.; Shao, X.; Hu, T.; Dai, J. Fractal Analysis of Shale Pore Structure of Continental Gas Shale Reservoir in the Ordos Basin, NW China. Energy Fuel 2016, 30, 4676–4689. [Google Scholar] [CrossRef]
- Pollastro, R.M.; Jarvie, D.M.; Hill, R.J. Geologic framework of the Mississippian Barnett Shale, Barnett-Paleozoic total petroleum system, Bend arch-Fort Worth Basin, Texas. AAPG Bull. 2007, 91, 405–436. [Google Scholar] [CrossRef]
- Li, Y.; Nie, H.; Long, P. Development characteristics of organic rich shale and shale gas strategic constituency in China. Nat. Gas. Ind. 2009, 29, 115–118, (In Chinese with English Abstract). [Google Scholar]
- Civan, F.; Rai, C.S.; Sondergeld, C.H. Determining shale permeability to gas by simultaneous analysis of various pressure tests. SPE J. 2012, 17, 717–726. [Google Scholar] [CrossRef]
- Jia, B.; Tsau, J.; Barati, R. Experimental and numerical investigations of permeability in heterogeneous fractured tight porous media. J. Nat. Gas Sci. Eng. 2018, 58, 216–233. [Google Scholar] [CrossRef]
- Krevelen, D.W.V.; Nijenhuis, K.T. Properties of Polymers. In Advances in Polymer Science; Springer Nature: Basel, Switzerland, 2010. [Google Scholar]
- Rouquerol, J.; Avnir, D.; Fairbridge, C.W.; Everett, D.H.; Haynes, J.M.; Pernicone, N.; Unger, K.K. Recommendations for the characterization of porous solids (Technical Report). Pure. Appl. Chem. 1994, 66, 1739–1758. [Google Scholar] [CrossRef]
- Sing, K.S. Reporting physisorption data for gas/solid systems with special reference to the determination of surface area and porosity (Recommendations 1984). Pure appl. Chem. 1985, 57, 603–619. [Google Scholar] [CrossRef]
- Brunauer, S.; Emmett, P.H.; Teller, E. Adsorption of gases in multimolecular layers. J. Am. Chem. Soc. 1938, 60, 309–319. [Google Scholar] [CrossRef]
- Gregg, S.J.; Sing, K.S.W. Adsorption, Surface Area and Porosity; Academic Press: New York, NY, USA, 1992. [Google Scholar]
- Adamson, A.W. Physical Chemistry of Surfaces. Langmuir 1998, 14, 7271–7277. [Google Scholar] [CrossRef]
- Sander, R.; Pan, Z.; Connell, L.D.; Camilleri, M.; Grigore, M. Controls on CH4 Adsorption on Shales: Characterisation of Beetaloo Sub-Basin Gas Shales and Comparison to Global Shales. In SPE Asia Pacific Oil and Gas Conference and Exhibition; Society of Petroleum Engineers: Brisbane, Australia, 2018. [Google Scholar] [CrossRef]
- Liu, K.; Ostadhassan, M.; Zou, J.; Gentzis, T.; Rezaee, R.; Bubach, B.; Carvajal-Ortiz, H. Multifractal analysis of gas adsorption isotherms for pore structure characterization of the Bakken Shale. Fuel 2018, 219, 296–311. [Google Scholar] [CrossRef]
- Bi, H.; Jiang, Z.; Li, P.; Cheng, L.; Zeng, C.; Xu, Y. Adsorption characteristic and influence factors of Longmaxi shale in southeastern Chongqing. Nat. Gas. Geosci. 2014, 25, 302–310, (In Chinese with English Abstract). [Google Scholar] [CrossRef]
- Xu, Z.X.; Han, S.M.; Wang, Q.C. Characteristics of pyrite and its hydrocarbon significance of shale reservoir of Doushantuo Formation in middle Yangtze area. Lithol. Reserve. 2015, 27, 31–37, (In Chinese with English Abstract). [Google Scholar] [CrossRef]
- Zou, J.; Rezaee, R.; Liu, K. Effect of temperature on methane adsorption in shale gas reservoirs. Energy Fuels 2017, 31, 12081–12092. [Google Scholar] [CrossRef]
- Ambrose, R.J.; Hartman, R.C.; Campos, M.D.; Akkutlu, I.Y.; Sondergeld, C. New pore-scale considerations for shale gas in place calculation. In SPE Unconventional Gas Conference; Society of Petroleum Engineers: Pittsburgh, PA, USA, 2010. [Google Scholar]
- Zhang, X.; Lu, X.; Zhang, L.; Liu, Q. Occurrences of Shale Gas and Their Petroleum Geological Significance. Adv. Earth Sci. 2010, 6, 005, (In Chinese with English Abstract). [Google Scholar] [CrossRef]
- Nie, H.; Zhang, J.; Zhang, P. Shale gas reservoir characteristics of Barnett shale gas reservoir in Fort Worth Basin. Geol. Sci. Tech. Info. 2009, 28, 87–93, (In Chinese with English Abstract). [Google Scholar] [CrossRef]
- Li, J.; Wu, Q.; Jin, W.; Lu, J.; Nan, Z. Logging evaluation of free-gas saturation and volume content in Wufeng-Longmaxi organic-rich shales in the Upper Yangtze Platform, China. Mar. Petrol. Geol. 2019, 100, 530–539. [Google Scholar] [CrossRef]
- Rani, S.; Padmanabhan, E.; Prusty, B.K. Review of gas adsorption in shales for enhanced methane recovery and CO2 storage. J. Petrol. Sci. Eng. 2018, 175, 634–643. [Google Scholar] [CrossRef]
- Zhang, D.; Yang, T. An overview of shale-gas production. Acta Petrolei Sinica 2013, 34, 792–801, (In Chinese with English Abstract). [Google Scholar] [CrossRef]
- Duan, X.; Hu, Z.; Gao, S.; Shen, R.; Liu, H.; Chang, J.; Wang, L. Shale high pressure isothermal adsorption curve and the production dynamic experiments of gas well. Petrol. Explor. Dev. 2018, 45, 127–135. [Google Scholar] [CrossRef]
- Kenomore, M.; Hassan, M.; Malakooti, R.; Dhakal, H.; Shah, A. Shale gas production decline trend over time in the Barnett Shale. J. Petrol. Sci. Eng. 2018, 165, 691–710. [Google Scholar] [CrossRef]
- Mavor, M. Barnett Shale Gas-in-Place Volume Including Sorbed and Free Gas Volume. Southwest Section AAPG Convention. 1–4 March 2003. Available online: http://archives.datapages.com/data/ftworth/09/09025/09025.htm (accessed on 26 April 2019).


| Sample 1 | Sample 2 | Sample 3 | Sample 4 | Sample 5 | |||||
| H = 1.05% | H = 1.25% | H = 0.95% | H = 1.02% | H = 0.78% | |||||
| P (MPa) | CH4 (m3/t) | P (MPa) | CH4 (m3/t) | P (MPa) | CH4 (m3/t) | P (MPa) | CH4 (m3/t) | P (MPa) | CH4 (m3/t) |
| 0 | 0 | 0 | 0 | 0 | 0 | 0 | 0 | 0 | 0 |
| 0.79 | 0.24 | 0.71 | 0.29 | 0.66 | 0.29 | 0.77 | 0.27 | 0.66 | 0.32 |
| 2.04 | 0.56 | 2.10 | 0.50 | 1.97 | 0.58 | 2.04 | 0.56 | 1.93 | 0.69 |
| 3.66 | 0.72 | 3.66 | 0.66 | 3.48 | 0.77 | 3.68 | 0.77 | 4.28 | 0.98 |
| 5.72 | 0.80 | 5.80 | 0.80 | 5.75 | 0.93 | 6.18 | 0.88 | 6.35 | 1.04 |
| 9.42 | 0.82 | 9.63 | 0.90 | 9.41 | 1.04 | 9.44 | 0.90 | 9.44 | 1.12 |
| 12.59 | 0.90 | 13.35 | 0.90 | 13.09 | 1.09 | 13.28 | 0.90 | 12.59 | 1.17 |
| 16.31 | 0.88 | 16.52 | 0.90 | 16.54 | 1.07 | 16.38 | 0.96 | 16.55 | 1.19 |
| Sample 6 | Sample 7 | Sample 8 | Sample 9 | Sample 10 | |||||
| H = 1.04% | H = 0.86% | H = 1.14% | H = 1.25% | H = 1.25% | |||||
| P (MPa) | CH4 (m3/t) | P (MPa) | CH4 (m3/t) | P (MPa) | CH4 (m3/t) | P (MPa) | CH4 (m3/t) | P (MPa) | CH4 (m3/t) |
| 0 | 0 | 0 | 0 | 0 | 0 | 0 | 0 | 0 | 0 |
| 0.77 | 0.37 | 0.66 | 0.35 | 0.66 | 0.32 | 0.73 | 0.27 | 0.77 | 0.45 |
| 2.15 | 0.77 | 2.04 | 0.80 | 1.97 | 0.72 | 2.03 | 0.53 | 1.77 | 0.82 |
| 3.91 | 1.00 | 3.48 | 1.04 | 3.59 | 0.98 | 3.70 | 0.72 | 3.42 | 1.04 |
| 6.57 | 1.19 | 6.29 | 1.25 | 6.24 | 1.09 | 6.40 | 0.74 | 5.69 | 1.27 |
| 9.63 | 1.25 | 9.14 | 1.33 | 9.74 | 1.19 | 9.40 | 0.80 | 9.26 | 1.41 |
| 12.59 | 1.27 | 12.59 | 1.33 | 13.35 | 1.25 | 13.28 | 0.88 | 12.59 | 1.41 |
| 16.41 | 1.27 | 16.45 | 1.35 | 16.53 | 1.25 | 16.41 | 0.88 | 15.97 | 1.46 |
| Sample 11 | Sample 12 | Sample 13 | Sample 14 | Sample 15 | |||||
| H = 1.04% | H = 1.44% | H = 1.30% | H = 1.18% | H = 1.18% | |||||
| P (MPa) | CH4 (m3/t) | P (MPa) | CH4 (m3/t) | P (MPa) | CH4 (m3/t) | P (MPa) | CH4 (m3/t) | P (MPa) | CH4 (m3/t) |
| 0 | 0 | 0 | 0 | 0 | 0 | 0 | 0 | 0 | 0 |
| 0.66 | 0.48 | 0.68 | 0.42 | 0.73 | 0.35 | 0.79 | 0.35 | 0.73 | 0.42 |
| 1.87 | 0.98 | 1.89 | 1.00 | 1.93 | 0.74 | 2.04 | 0.66 | 2.04 | 0.82 |
| 3.44 | 1.27 | 3.63 | 1.35 | 3.59 | 0.98 | 3.53 | 0.85 | 3.53 | 1.04 |
| 5.63 | 1.50 | 6.33 | 1.57 | 6.38 | 1.14 | 6.38 | 1.04 | 6.38 | 1.22 |
| 9.57 | 1.65 | 9.30 | 1.62 | 9.76 | 1.19 | 9.76 | 1.09 | 9.83 | 1.35 |
| 13.28 | 1.67 | 13.28 | 1.70 | 12.59 | 1.25 | 13.08 | 1.12 | 13.28 | 1.41 |
| 16.55 | 1.70 | 16.67 | 1.70 | 16.26 | 1.30 | 16.31 | 1.12 | 16.95 | 1.43 |
| Factors | Va | TOC | S1 | S2 | S1 + S2 | “A” | Clm | Quartz | Bm | Cam | P | lnP | T |
|---|---|---|---|---|---|---|---|---|---|---|---|---|---|
| Va | 1 | 0.722** | 0.775** | 0.709** | 0.738** | 0.711** | 0.696** | −0.546* | −0.525* | −0.567* | 0.625* | 0.626* | 0.624* |
| TOC | 1 | 0.709** | 0.803** | 0.786** | 0.761** | 0.869** | −0.656** | −0.543* | −0.844** | 0.672** | 0.673** | 0.670** | |
| S1 | 1 | 0.939** | 0.969** | 0.965** | 0.725** | −0.434 | −0.495 | −0.651* | 0.942** | 0.942** | 0.941** | ||
| S2 | 1 | 0.995** | 0.916** | 0.799** | −0.453 | −0.514 | −0.741** | 0.915** | 0.915** | 0.914** | |||
| S1 + S2 | 1 | 0.942** | 0.787** | −0.453 | −0.515* | −0.724** | 0.935** | 0.935** | 0.933** | ||||
| "A" | 1 | 0.814** | −0.518* | −0.529* | −0.716** | 0.943** | 0.943** | 0.942** | |||||
| Clm | 1 | −0.636* | −0.643** | −0.825** | 0.702** | 0.703** | 0.701** | ||||||
| Quartz | 1 | 0.853** | 0.383 | −0.446 | −0.447 | −0.449 | |||||||
| Bm | 1 | 0.204 | −0.547* | −0.548* | −0.551* | ||||||||
| Cam | 1 | −0.616* | −0.617* | −0.614* | |||||||||
| P | 1 | 1.000** | 1.000** | ||||||||||
| lnP | 1 | 1.000** | |||||||||||
| T | 1 |
| Model | Variables Entered | Variables Removed | Method |
|---|---|---|---|
| 1 | T, quartz content, carbonate content, TOC, S1, clay mineral content, S2b | - | enter |
| 2 | - | Carbonate content | Backward (F-to-remove ≥ 0.1) |
| 3 | - | Clay mineral content | Backward (F-to-remove ≥ 0.1) |
| 4 | - | S2 | Backward (F-to-remove ≥ 0.1) |
| 5 | - | TOC | Backward (F-to-remove ≥ 0.1) |
| Model | R | R2 | Adjusted R2 | Standard Estimate Error |
|---|---|---|---|---|
| 4 | 0.885b | 0.783 | 0.686 | 0.14291 |
| Model | Unstandardized | Standardized | t | Significance | ||
|---|---|---|---|---|---|---|
| B | Standard error | β | ||||
| 4 | (constant) | 29.150 | 13.553 | 2.151 | 0.060 | |
| TOC | 0.026 | 0.037 | 0.187 | 0.707 | 0.497 | |
| S1 | 0.231 | 0.081 | 1.414 | 2.857 | 0.019 | |
| Qz | −0.011 | 0.009 | −0.267 | −1.241 | 0.246 | |
| T | −0.537 | 0.258 | −0.974 | −2.082 | 0.067 | |
| Method | Equation | Advantages | Disadvantages |
|---|---|---|---|
| CH4 isothermal adsorption experiment | Simple principle and mature application experience | Restricted by the economic factors and spatial variation | |
| Multi-factor regression analysis | Vary continuously, widely applied in areas with similar geological conditions. | Depend on data numbers, not applied to new exploration areas |
© 2019 by the authors. Licensee MDPI, Basel, Switzerland. This article is an open access article distributed under the terms and conditions of the Creative Commons Attribution (CC BY) license (http://creativecommons.org/licenses/by/4.0/).
Share and Cite
Tang, L.; Song, Y.; Jiang, Z.; Pang, X.; Li, Z.; Li, Q.; Li, W.; Tang, X.; Pan, A. Influencing Factors and Mathematical Prediction of Shale Adsorbed Gas Content in the Upper Triassic Yanchang Formation in the Ordos Basin, China. Minerals 2019, 9, 265. https://doi.org/10.3390/min9050265
Tang L, Song Y, Jiang Z, Pang X, Li Z, Li Q, Li W, Tang X, Pan A. Influencing Factors and Mathematical Prediction of Shale Adsorbed Gas Content in the Upper Triassic Yanchang Formation in the Ordos Basin, China. Minerals. 2019; 9(5):265. https://doi.org/10.3390/min9050265
Chicago/Turabian StyleTang, Ling, Yan Song, Zhenxue Jiang, Xiongqi Pang, Zhuo Li, Qianwen Li, Wei Li, Xianglu Tang, and Anliu Pan. 2019. "Influencing Factors and Mathematical Prediction of Shale Adsorbed Gas Content in the Upper Triassic Yanchang Formation in the Ordos Basin, China" Minerals 9, no. 5: 265. https://doi.org/10.3390/min9050265
APA StyleTang, L., Song, Y., Jiang, Z., Pang, X., Li, Z., Li, Q., Li, W., Tang, X., & Pan, A. (2019). Influencing Factors and Mathematical Prediction of Shale Adsorbed Gas Content in the Upper Triassic Yanchang Formation in the Ordos Basin, China. Minerals, 9(5), 265. https://doi.org/10.3390/min9050265