Article

Chemical and Petrographic Characterization of Stone and Glass Tesserae in the Nereid and Geometric Mosaics from the S. Aloe Quarter in Vibo Valentia–Calabria, Italy

1
Dipartimento di Biologia Ecologia e Scienze della Terra–ponte P, Bucci–Università della Calabria, 87036 Arcavacata, Italy
2
Soprintendenza Archeologia, Belle Arti e Paesaggio per la città metropolitana di Reggio Calabria e la Provincia di Vibo Valentia, Via Fata Morgana 3, 89125 Reggio, Italy
3
Laboratorio di restauro, Museo civico archeologico “Biagio Greco”, 81034 Mondragone, Italy
4
Laboratorio di Topografia Antica e Antichità Calabresi-ponte P, Bucci Università della Calabria, 87036 Arcavacata, Italy
*
Author to whom correspondence should be addressed.
Minerals 2019, 9(12), 729; https://doi.org/10.3390/min9120729
Submission received: 21 August 2019 / Revised: 21 November 2019 / Accepted: 23 November 2019 / Published: 26 November 2019

Abstract

:
Vibo Valentia’s S. Aloe quarter is an archaeological area which has three beautiful mosaic floors, dated between the centuries I BC and V AD. This work reports the results obtained on 22 glass and stone tesserae collected from the Nereid and Geometric mosaics during a recent restoration of the site. The analyses were carried out through a multi-analytical approach. The petrographic study of the stone tesserae was carried out using polarizing optical microscopy while the geochemical one was conducted using two micro-analytical techniques: the electron probe micro-analyzer with energy-dispersive X-ray spectrometry and a combination of laser ablation with inductively coupled plasma mass spectrometry for determining the major, minor, and trace element concentrations. The research highlights the use of different kinds of stones such as marble, volcanic, and sedimentary rocks. The glasses show the typical soda–lime–silica composition indicating the use of natron as a flux. The trace element concentrations prove the use of Pb-antimonates to create yellow glass. The bronze scrap was used to obtain the green color, while cobalt and copper were used to obtain different gradations of blue. These results confirm the high technological level reached by glassmakers in the Imperial Age, thus highlighting the importance of the S. Aloe archeological site.

1. Introduction

In the imperial period, private and public buildings were often decorated by mosaics, made of different kinds of materials, including pottery, stone, and glass.
Mosaics were considered luxury goods and, therefore, they were not available for everyone to have at home, especially if the tesserae were made of rare and expensive materials such as marble and/or colored glass [1]. Because of the difficulties in finding this material during the Roman age, glass was considered as precious as a gem or a semi-precious stone used to make jewels. For this reason, its production was exclusively for aristocrats.
Generally, glass tesserae were opaque and colored, and they probably represent the first example of the use of colorant and opacifier to change glass properties and to produce the desired effect [2,3].
In the various researches on Roman glasses [3,4,5,6,7,8,9,10,11,12], chemical analyses were carried out with the aim to establish the nature and provenance of the raw materials and to understand the glass production technique. The colorless Roman glass was essentially a mixture of three components: silica sand, lime, and natron―which is a soda rich mineral salt―used as a flux. The abundance of this sodium carbonate in some evaporitic basins, like those of the Wadi El Natrun valley in Egypt, was, probably, the reason of the existence of primary glass-making centers in Egypt and in the Near East [13,14]. The prevalent hypothesis about circulation and trade of this precious good is that a large mass of glass, produced in these primary glass-making factories, was broken up and redistributed for re-melting and re-working [15].
Scholars agree with the opinion that in the Roman time the colored opaque glass was produced in secondary workshops by adding colorants and opacifiers to the transparent base glass [3,4,9,10,13]. The production technique, employed in the Roman period for coloring and opacifying glass, is highlighted in the studies of the mosaic’s tesserae recovered in the archaeological site at West Clacton Reservoir, Dead Lane, Great Bentley, Essex [10]; in the Villa dei Quintili, Rome [3,9] and in the Villa del Casale di piazza Armerina–Sicily [4]. In addition, in the last study among the abovementioned ones, the chemical characterization of glass tesserae helped to recognize a subsequent restoration. Indeed, while the baths mosaics floor of Villa del Casale date to the fourth century AD, the chemical results allowed us to date some erratic glass tesserae to a span of time from the fifth to the ninth centuries AD [4].
The present research involves the study of the mosaics discovered in the archaeological area of S. Aloe quarter in Vibo Valentia. An analytical study of both stone and glass tesserae aims at characterizing their constituent materials and determining their state of preservation [16].
For this reason, the largest possible number of stone and glass tesserae were collected and studied. They were characterized by both minero-petrographic and chemical analyses. As concerns the stone tesserae, the main purpose of this work was to define their petrographic nature as well as the possible geographical–geological origin and provenance of the rocks used. On the other hand, the glass tesserae were analyzed in order to determine their composition with the aim of understanding how they were produced from a technological point of view. In spite of the high importance of the archaeological site, the materials used for these mosaics (glass and stones) had never been analyzed before, and so this research is aimed at obtaining information on the composite historical life of these important mosaics.

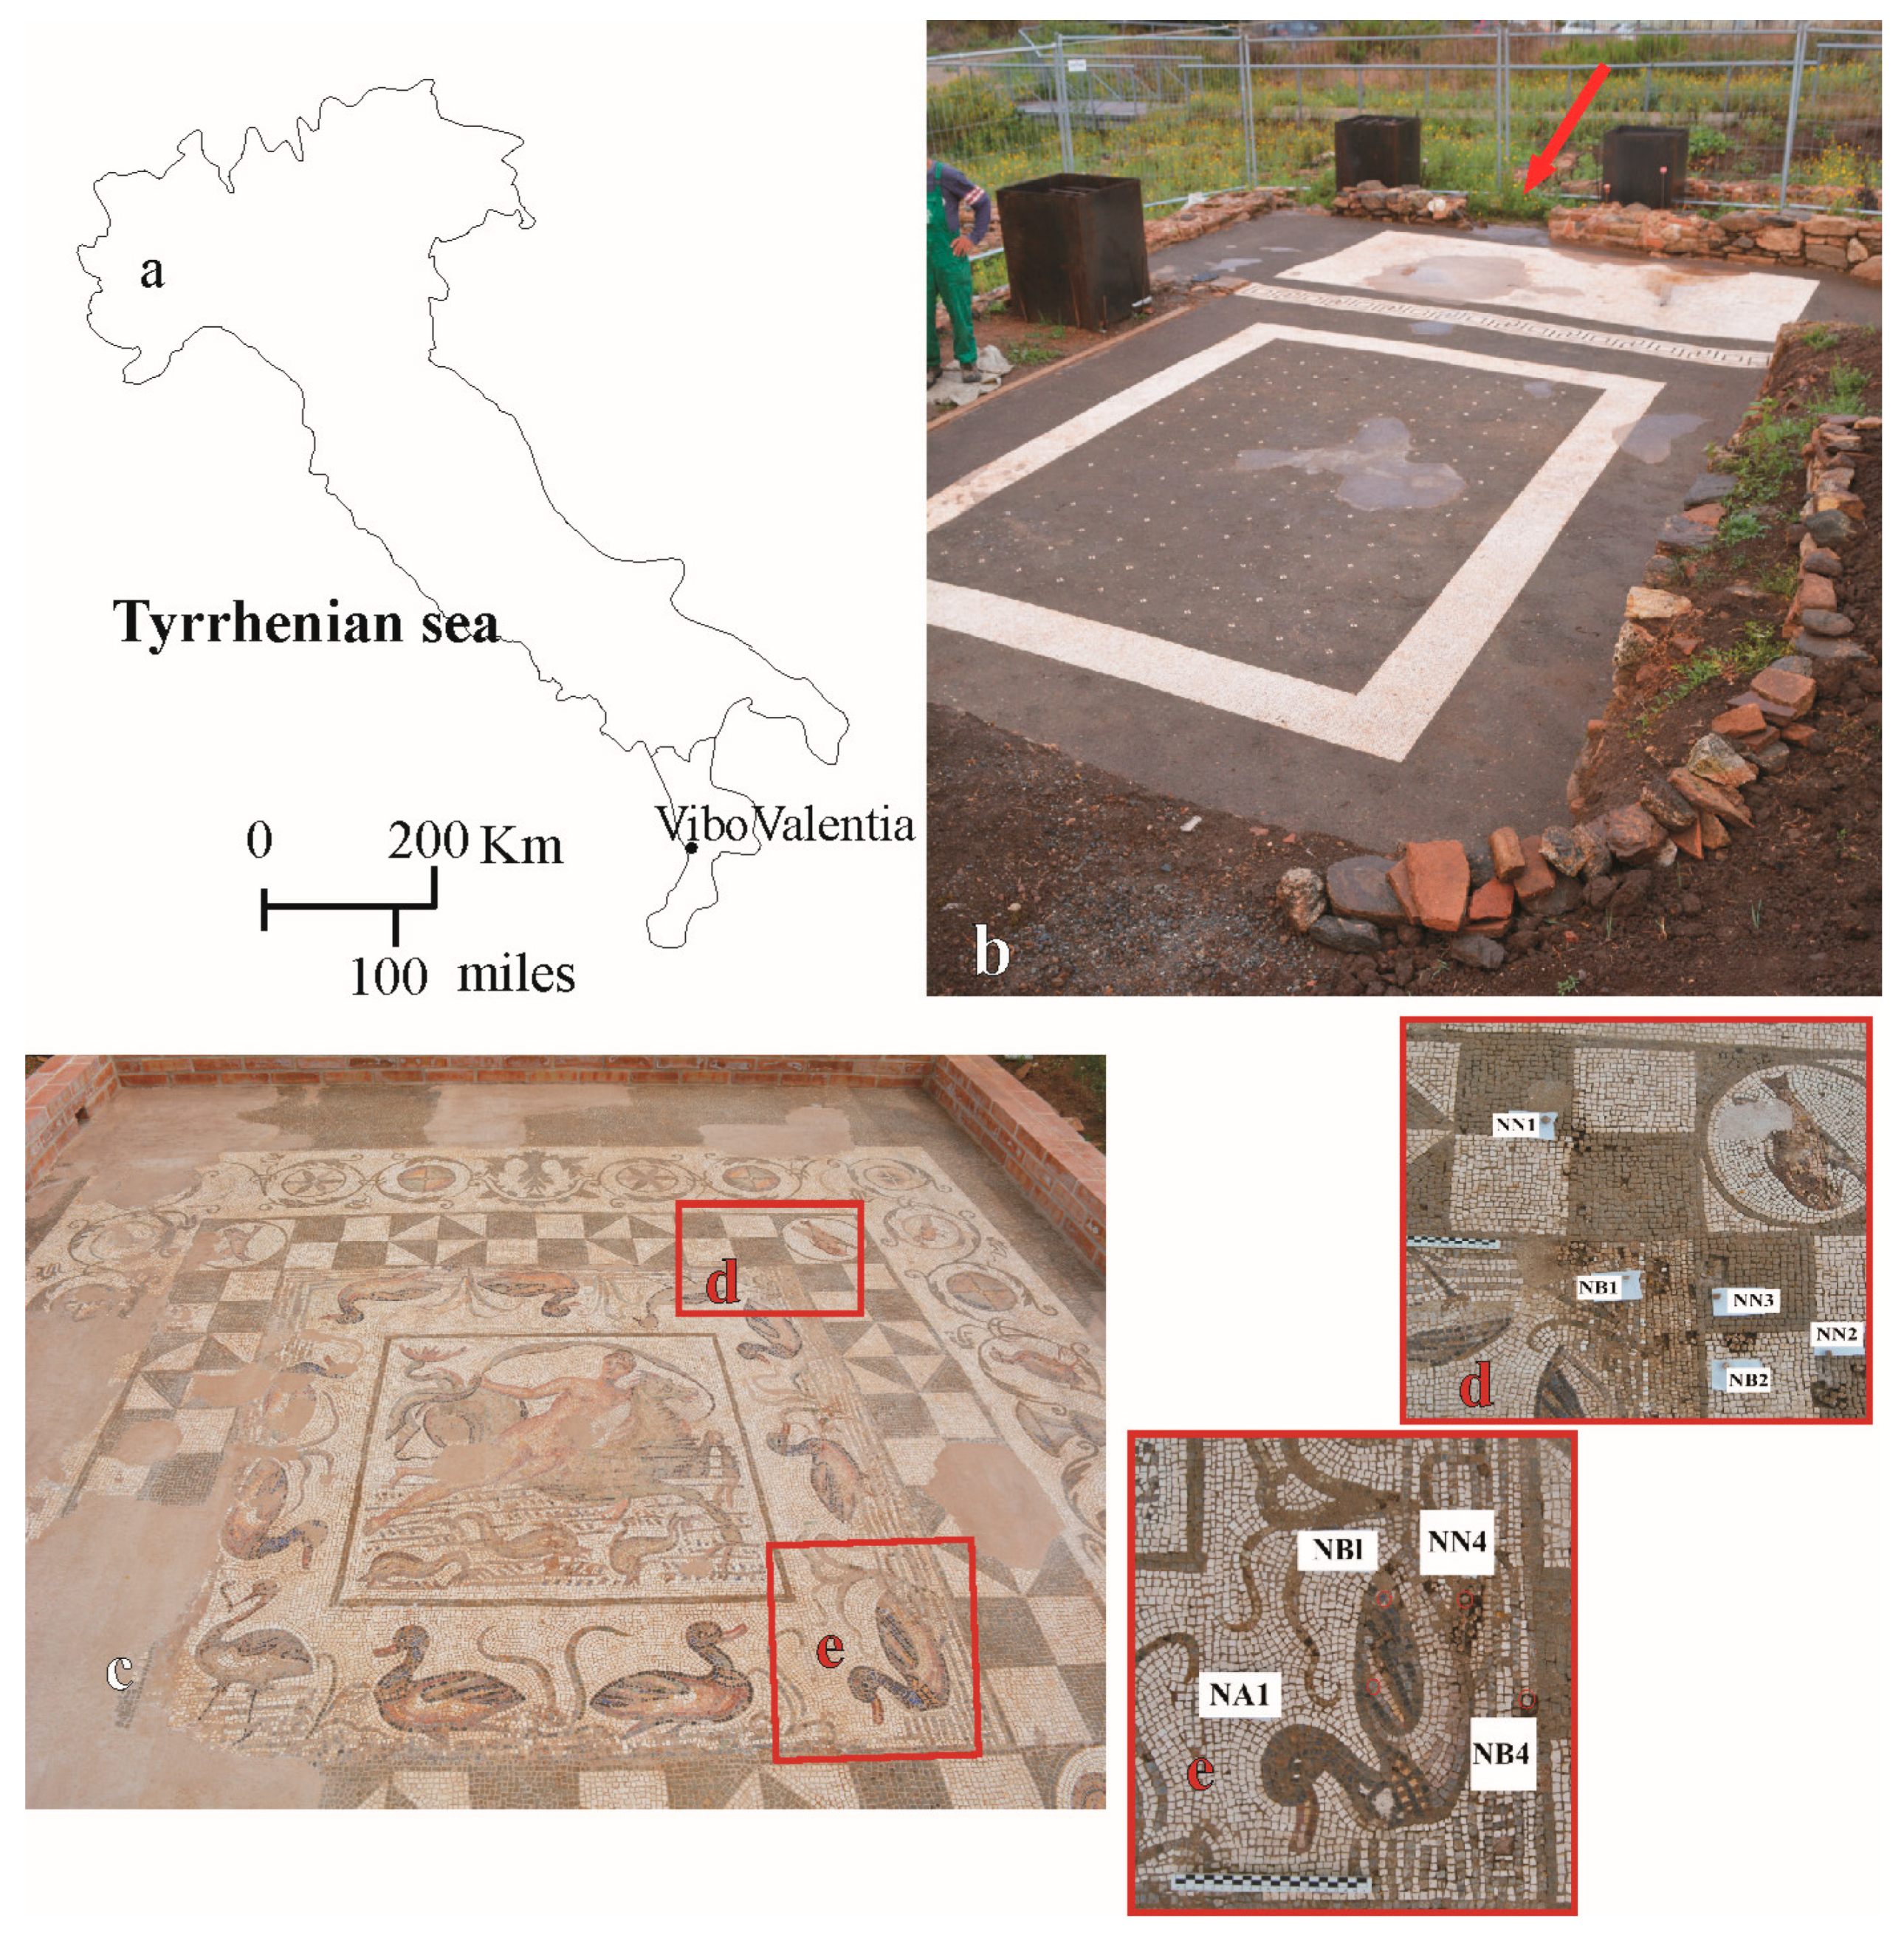
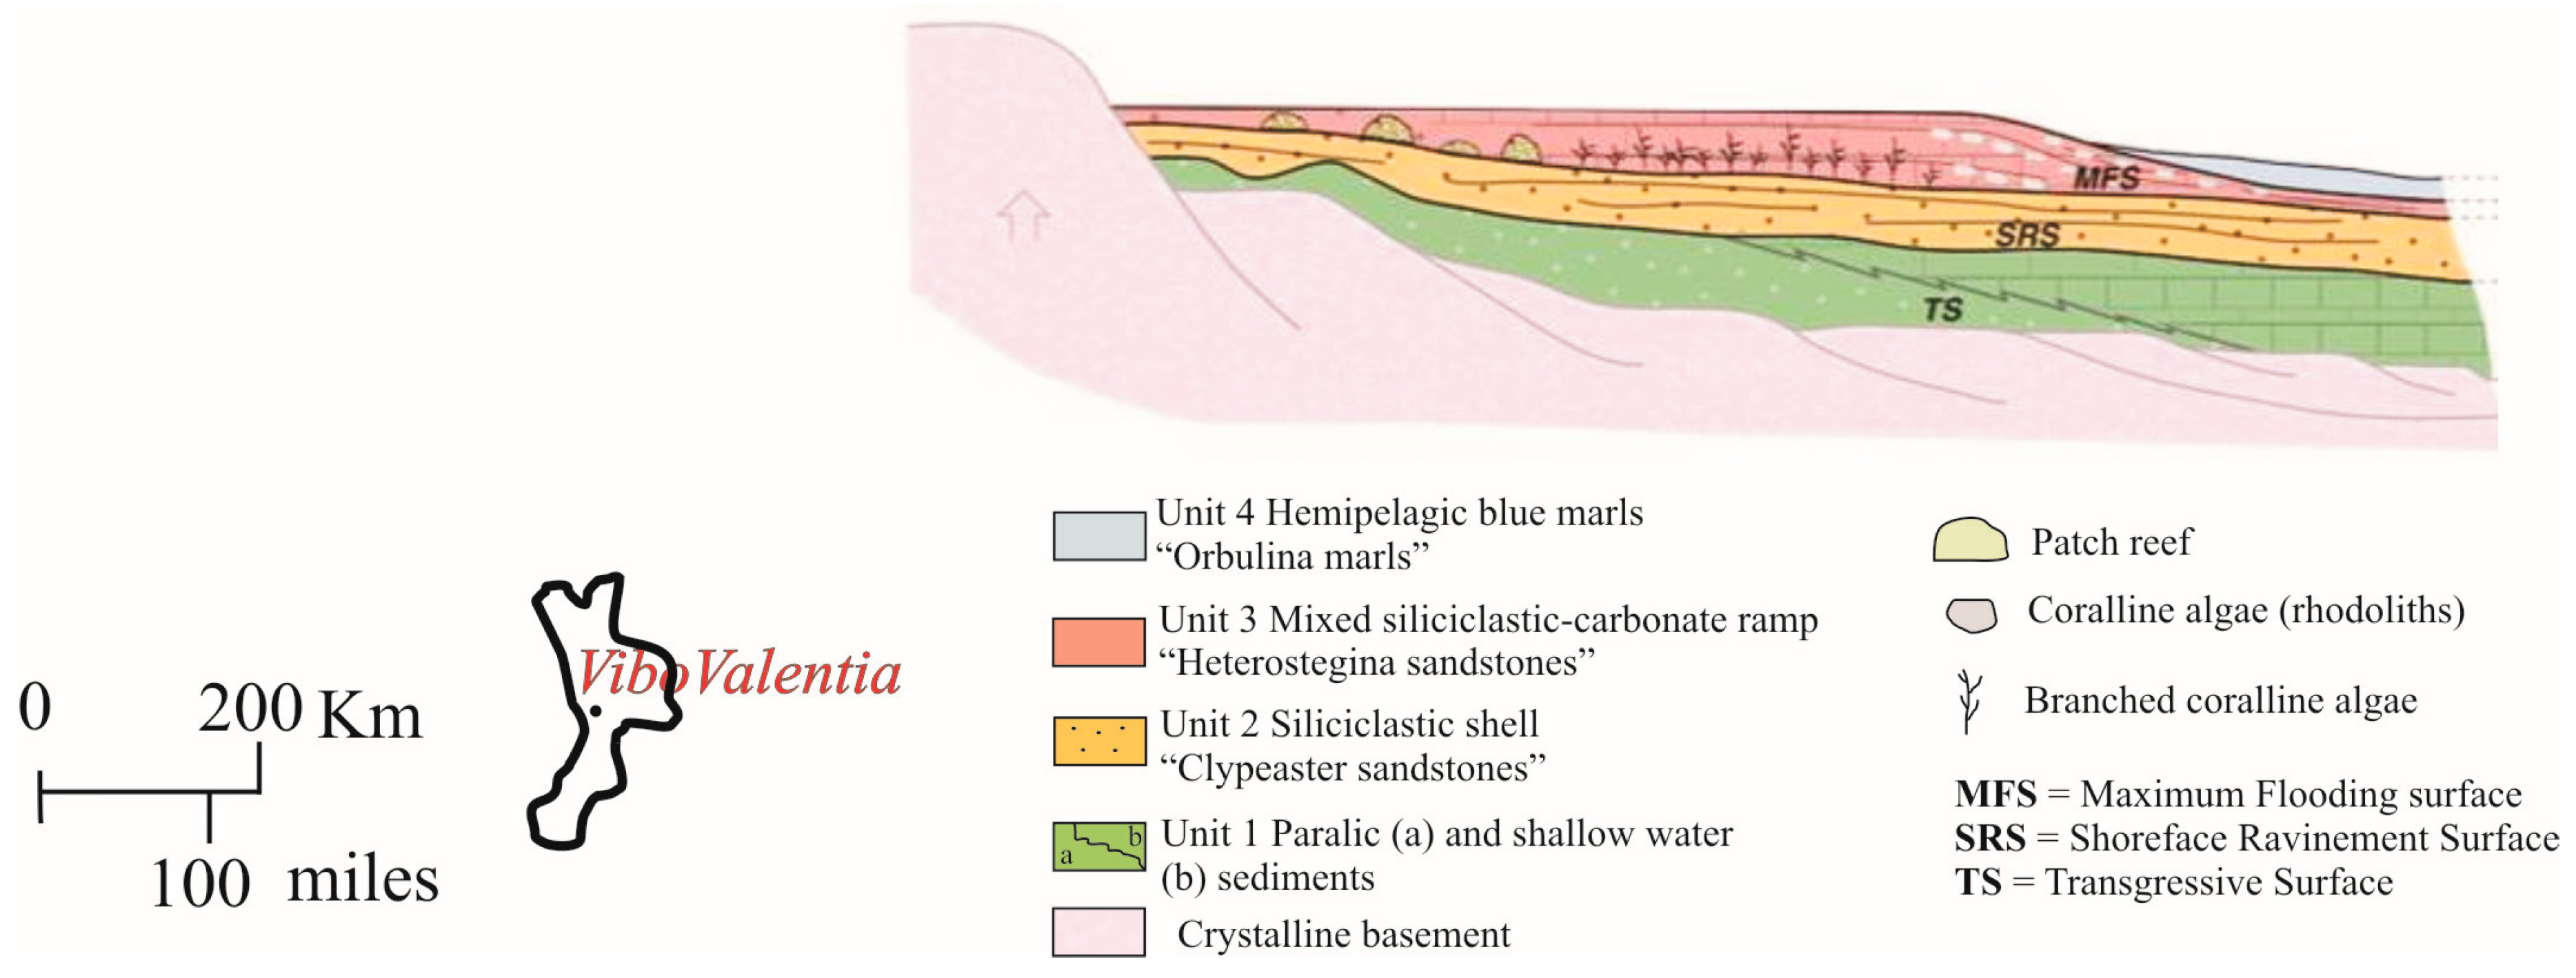
2. The Archaeological Site of the S. Aloe Quarter

Remains of prestigious houses (domus), streets, and an important thermal building, dating back to the period between the first century BC to the fifth century AD [17,18], were discovered in the archaeological area of the ancient city of Vibo Valentia–Calabria, Italy (Figure 1) [19,20,21]. The site covers about 30,000 square meters inside the S. Aloe quarter. The most important discoveries are related to the three beautiful polychrome mosaic floors, which were fortunately found in a good state of preservation.
“The mosaic with the emblem of the Nereid” came to light in 1982. The mosaic dates from the end of the II century AD [18]. It covers a square area of 4.00 m × 4.26 m and it is composed of both stone and glass tesserae of various kinds and colors (Table 1).
It depicts a naked Nereid (one of the mythical nymphs, daughter of Nereo) riding a hippocampus surrounded by three dolphins (Figure 1c). The emblem is framed with ducks and waders.
The right leg of the Nereid is immersed in the sea while her left foot touches the sea surface, and her grey-blue coat forms a thin arch above her head. Her hair is gathered into a high bun [19]. Long horizontal grey-blue colored lines draw the water where the hippocampus swims and from which three dolphins spring. There are no bright tones among the mosaic’s chromatic range; shades of grey and blue are used for depicting dolphins, waves, the Nereid’s mantle, and the hippocampus’ body. Different color gradations render the movement between light and shadow. The chromatic differences between the elements emerged and immersed in water are not highlighted. The emblem of the Nereid is inserted in a thin frame that separates it from a band decoration with wild ducks and a wader. A black and white checkered pattern delimits the frame with ducks and other animals. In the corners of the mosaic, four roundels are set with the same amount of fish and still lifes, all enclosed in an additional checkerboard frame.
A T-shaped floor was discovered to the north of the caldarium. It is composed of a mosaic with a black background littered with black and white stone tesserae and rare colored glasses (Table 1). It was dated between the II and III centuries AD [21].
The mosaic carpet, almost entirely preserved and restored to its original chromatic and stylistic splendor in 2008 [22], is organized in two spaces. The first one, next to the entrance (highlighted by a red arrow in the Figure 1b), includes a rectangular horizontal space composed of white tesserae and it covers an area of 4.50 m × 5.95 m. The second one, with a vertical development, includes a carpet of rectangular shape in which, on parallel vertical rows, a motif with white crosses develops and it covers an area of 6.70 m × 3.00 m. A band of white tesserae, adorned with swastikas and black squares, indicates the passage from one field to another of the mosaic. These characteristics allow us to define it as “geometric” (Figure 1b).
It is difficult to contextualize these mosaics, as no detailed information about the construction phases of the buildings is available [19,23].

3. Material and Methods

The sampling of the tesserae from the Nereid and the Geometric mosaics was conducted in summer 2018. The collection was conditioned by the sample availability. However, it was executed with the aim to take all the various colors and textures of stones and glass tesserae.
Eleven stone tesserae and ten glass tesserae were sampled from the Nereid mosaic. They were collected during the excavation phase, from parts of the flooring that were detached but certainly pertaining to the mosaic (Figure 1d,e).
As for the sampling of the Geometric one, only two glass tesserae were collected. Because the mosaic had been subjected to previous restoration, it was in a good state of preservation and the tesserae were firmly fixed. Therefore, in order to avoid any kind of damage, the stone tesserae were not collected.
All tesserae were labelled using an “N” as the first letter for the Nereid mosaic and a “G” for the Geometric one.
Table 1 lists all samples studied, separating the stone from the glass tesserae, and giving information about provenance (Nereid or Geometric), petrographic nature of the stone tesserae, and color of both stone and glass tesserae.
Different and complementary techniques were used with the aim to conduct a petrographic and chemical characterization of stone and glass tesserae. The petrographic study of stone tesserae was conducted by polarizing optical microscopy (POM) on polished cross-thin sections, using a Zeiss Axiolab Optical microscope equipped with a camera Zeiss AxioCam MRc, (Zeiss, Oberkochen, Germany), useful for acquiring photomicrographs.
After a preliminary observation using a stereomicroscope, the glass tesserae were cross-cut and then polished with diamond cloths. Samples were then fixed on slides, with the fresh side facing upward. Due to their small size, three or four samples were positioned on each slide.
To determine major and minor element concentrations, electron probe micro-analyzer with energy-dispersive X-ray spectrometry (EPMA/EDS) analyses were carried out using a JEOL-JXA 8230 (JEOL Ltd, Tokyo, Japan), equipped with an EDS–JEOL EX-94310FaL1Q spectrometer (JEOL Ltd, Tokyo, Japan). Before the EPMA/EDS analyses, the polished surfaces were covered by a carbon sputter coating. The EPMA/EDS was used under the following operating conditions for the image acquisition: acceleration voltage 15 kV, probe current at 10–20 nA, using a solid state detector (SSD), (JEOL Ltd, Akishima, Tokyo, Japan) and Everhart Thornley detector (SE, JEOL Ltd, Akishima, Tokyo, Japan); for chemical analyses: acceleration voltage 15 kV, probe current 10 nA, probe diameter 1 µm, standardless quantification was performed using a Quant Correction ZAF (Z = atomic number correction, A = absorption correction, F = fluorescence correction). Furthermore, to avoid the loss of Na and ensure the correct acquisition of other element concentrations, an acquisition time of 15 s was selected. The detection limits for most elements were about 0.4 wt %. The reliability of the results was verified by measuring the SRM610 500 ppm by NIST (National Institute of Standards and Technology) and the BCR 2G (Columbia River Basalt) by USGS (United States Geological Survey) glass reference materials.
The EMPA/EDS glass analyses were executed using a defocused beam (square areas of about 5 × 5 µm2) to avoid the loss of alkali. The analyses of micrometric crystals (ranging in size from 5 to 40 μm and sometimes dispersed within the glasses or, as accessory minerals, in the marble tessera NB4) were executed in spot manner to avoid the interference of glass and calcite compositions respectively.
Trace element concentrations in the glass tesserae were determined by LA–ICP–MS. Analyses were carried out using an Elan DRCe instrument (Perkin Elmer Inc., Waltham, MA, USA), connected to a New Wave UP213 Nd-YAG laser probe 213 nm (New Wave Research, Inc., Fremont, CA, USA). Samples were ablated by a laser beam in a cell, under a moderate flow of pure helium. Then, behind the cell, the ablated material was flushed in a continuous flow of a helium and argon mixture to the ICP system, where it was atomized and ionized for quantification in the mass spectrometer [24].
In this work, ablation was performed with spots of 50–80 microns, with a constant laser repetition rate of 10 Hz and fluence of about 20 J cm−2. The procedures for data acquisition were those normally used in the Mass Spectroscopy Laboratory of the Department of Biology, Ecology and Earth Sciences, University of Calabria (Italy) [3,25,26]. In particular, for all analyses a transient signal of intensity versus time was obtained for each element using a 60 s background level (acquisition of gas blanks) followed by 40 s of ablation and then 60 s of post-ablation at background levels. Data were transmitted to a PC and processed by the Glitter program. Three point analyses were carried out on each glass tessera selecting the portions without alterations. The detection limits for most elements were about 0.01 ppm. Calibration was performed on glass reference material SRM 612–50 ppm by the NIST (National Institute of Standards and Technology) in conjunction with internal standardization, applying SiO2 concentrations [27] from EPMA/EDS analyses. In order to evaluate possible errors within each analytical sequence, determinations were also made on the SRM 610–500 ppm by NIST and on BCR 2G by USGS glass reference materials as unknown samples, and element concentrations were compared with reference values from literature [28,29]. Table 2 lists the accuracies of all analyzed elements calculated as the relative difference from reference values [28].

4. Results and Discussion

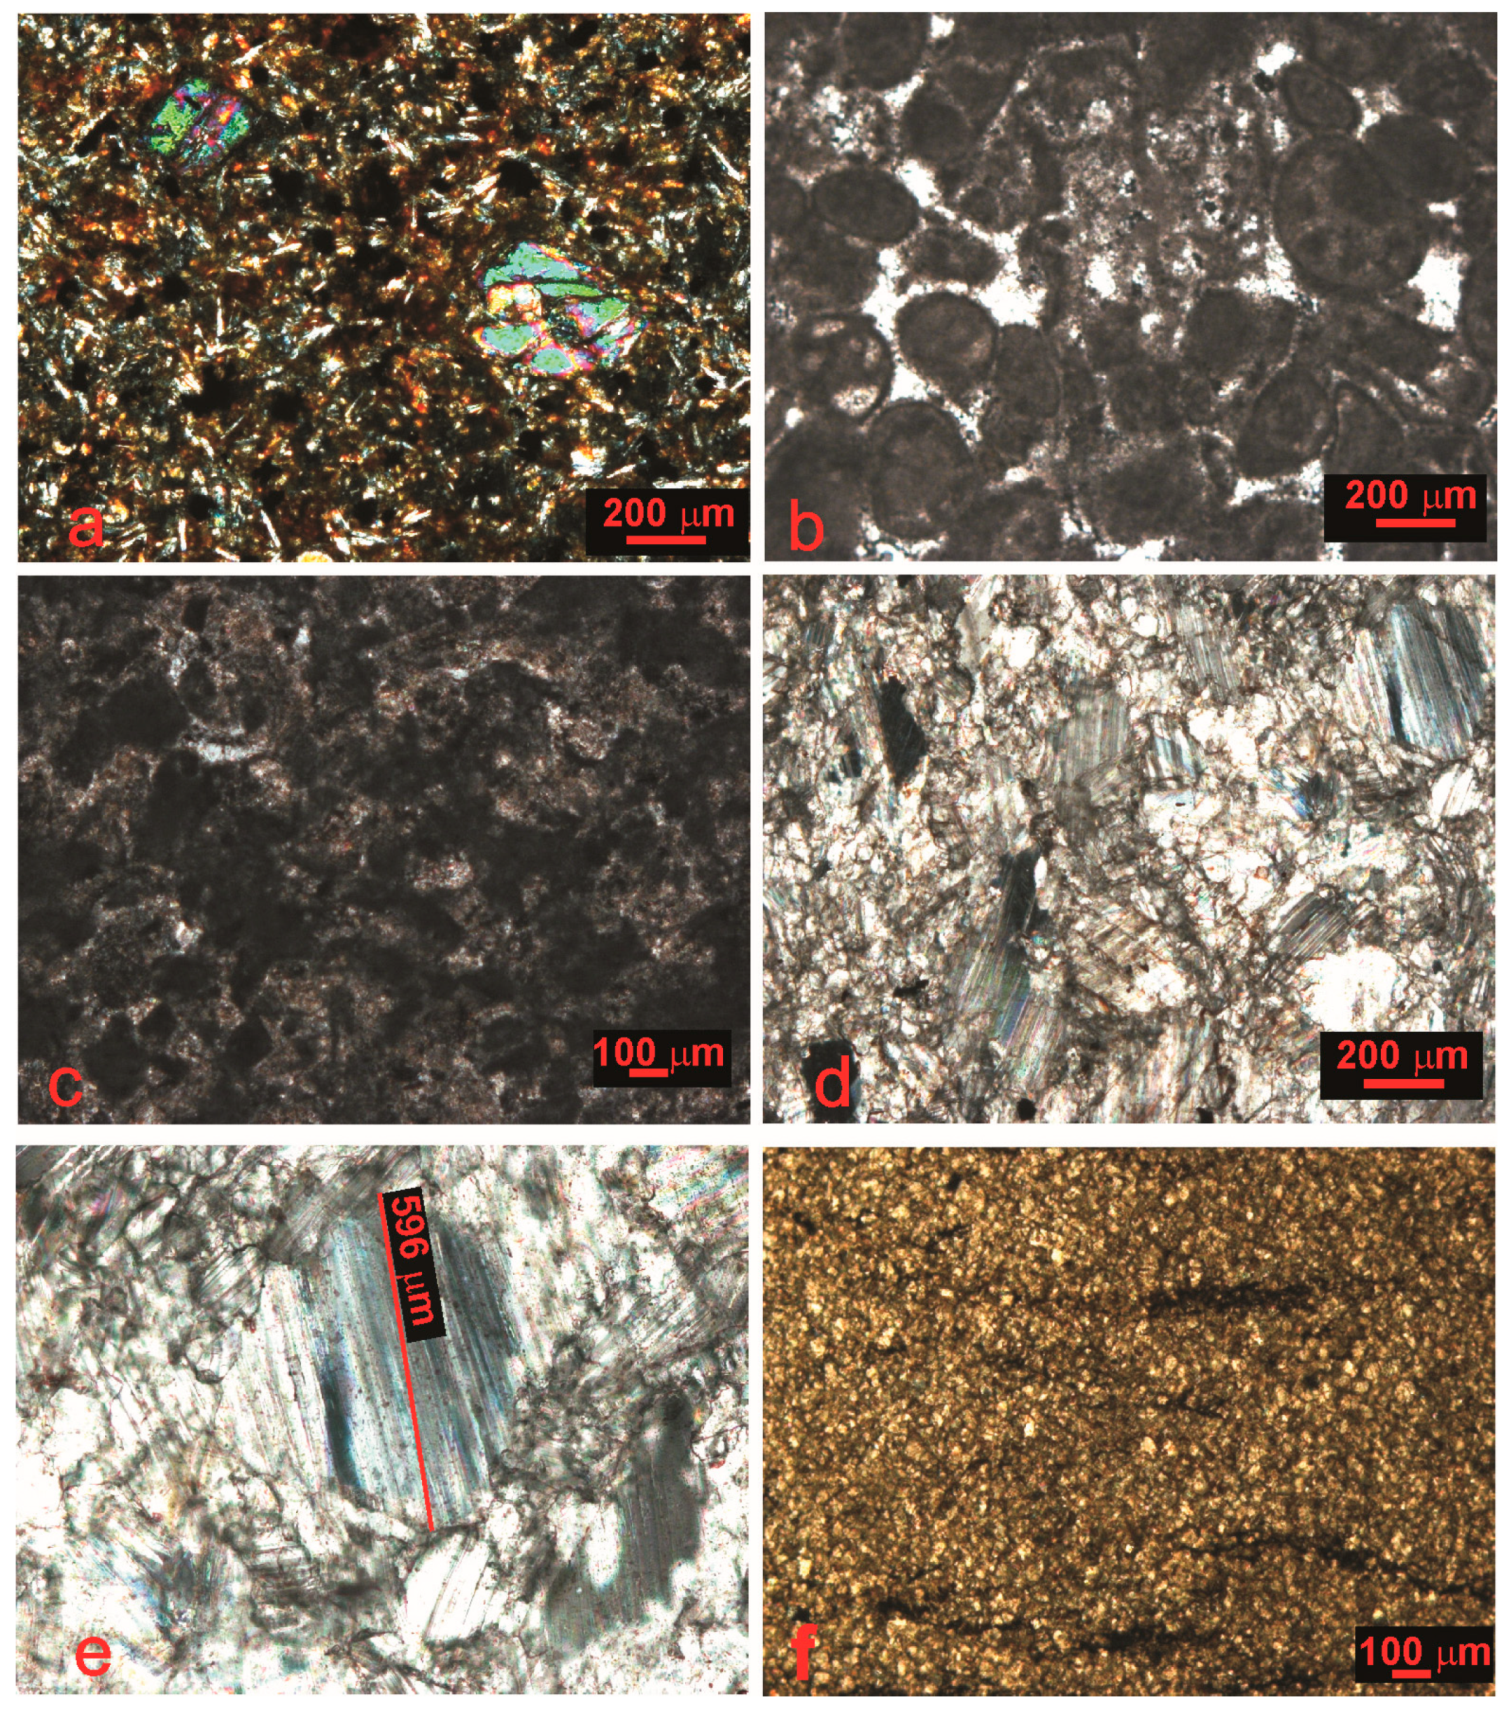
4.1. Petrographic Study

4.1.1. Results

Black Tesserae

Two of the four black tesserae NN1 and NN2 are fine-grained volcanic rocks. They show an intergranular fabric with microliths and rare phenocrysts of plagioclase and pyroxene. Resorbed olivine and oxide are recognizable only in the partially vitreous groundmass [30,31,32] (Figure 2a).
The microscopic study suggests that these tesserae may be classified as basalt or andesitic–basalt.
The other two tesserae NN3 and NN4 are sedimentary rocks.
NN3 is a biomicritic limestone [33]. This limeclast is highly oxidized, and with many unoriented microveins filled with microsparite.
NN4 is a microsparitic limestone [33]. This sample is highly altered with neoformation of ferruginous products totally pervading the entire limeclast.

White Tesserae

Three of the four white tesserae studied here (NB1, NB2 and NB3) are limestones.
NB1 sample is classified as an oolithic limestone with spar cement [33] (Figure 2b). NB2 and NB3 are structureless and unaltered and can be classified as peloidal limestones [34] (Figure 2c).
The fourth white stone tessera (NB4) is made of marble (Figure 2d,e).
The petrographic analysis indicates that the marble sample is characterized by a fine grain size calcite (eight measurements among the larger grains allow to obtain a maximum grain size (MGS) ranging from 0.6 to 0.8 mm), with curved and straight boundaries, and its crystals show evident traces of cleavage, while the texture is generally heteroblastic (Figure 2d,e).

Pinkish/Reddish Tesserae

NRR1 is a microsparitic limestone (Figure 2f). This sample is mainly unaltered even if some accessory phases or very rare opaque crystals occur, probably as a result of pyrite growth during the eodiagenetic processes of the source rock [35].
NRR2 is a micritic limestone lacking grains and bioclasts [33]. This finely-grained limeclast is unaltered and structureless and it has a fine pattern of veins, which are filled by a mosaic of coarser calcite crystals cutting the carbonate mud.

Greenish Tessera

NVR1 is a micritic limestone lacking grains and bioclasts [33]. This finely-grained limeclast is unaltered. It has retained some microlayering filled with iron oxides and/or hydroxides consisting of opaques which are difficult to identify under thin section only through polarizing optical microscope [36,37]. As a matter of fact, opaque minerals such as magnetite, ilmenite, pyrite, and hematite, are usually problematic grains [38], identified through microprobe analysis technique, aimed at their geochemical discrimination [39,40].

4.1.2. Discussion

The petrographic study highlights the extensive use of stone tesserae of sedimentary origin for the manufacturing of Nereid mosaic. It is quite difficult to precisely determine the places where all the stone tesserae were quarried, considering that near Vibo Valentia some sedimentary successions constituted by late Miocene silicoclastic and carbonate sediments outcrop, unconformably overlying the Hercynian crystalline basement rocks (Figure 3) [41,42]. However, it is possible to hypothesize that stones of local geological formations were used for the production of white, pinkish/reddish, greenish and black tesserae. On the contrary, the individuation of two basaltic/andesitic basalt and one marble tesserae―both rocks absent in the geology of the area―also indicate the use of extrabasinal raw material in the manufacture of the mosaic.
As concerns the marble provenance, considering the fact that white marbles were widely employed in antiquity and particularly during Roman times, numerous researches were focused on archaeometric surveys of ancient marbles. In general, over the past few decades numerous authors have suggested a multi-analytical approach to ascertain the provenance of such stone materials [43,44,45,46,47,48,49]. Among the distinctive properties of marbles, particularly discriminant is the variety of textural properties especially regarding the maximum grain size (MGS) of grains within a section.
A comparison among the values of MGS measured on the NB4 white marble tesserae and the MGS literature data for ancient white marble in the Mediterranean region is reported in Figure 4. The diagram variation of the MGS of classical marbles [44] is expressed as bars and boxes, with boxes comprising 70% of the total values, and each line within the boxes indicating the median. The black line in the diagram indicates the value of MGS (0.8 mm) measured in NB4 marble, showing that the sample falls within the Aphrodisias (Aydin), Carrara, Docimium (Afyon), Paros-1, Paros-2(3), and Pentelicon, areas [46,47,48,49,50]. However, considering that the average Carrara marble shows a homeoblastic texture and a fabric of “mosaic” type, with small to very small crystals, in some parts forming triple points at 120°, it is possible to exclude the Carrara provenance for NB4 tesserae [46,47,48,49,50].

4.2. Chemical Study

4.2.1. Stone Tesserae

White Tesserae

The EPMA/EDS results allowed the identification of accessory minerals, which are often small, sporadic, and difficult to be recognized by using only POM. The above-mentioned analyses indicate that calcite is the principal mineralogical phase, whereas quartz, muscovite, Ti-oxide, apatite, biotite, and Fe-sulphide are accessory minerals (Figure 5, Table 3).
These crystals are rounded and very tiny, ranging in size from 10 to 40 μm. Considering that the texture of the NB4 marble excludes a Carrara provenance, the accessory minerals allow the discrimination among Aphrodisias (Aydin), Docimium (Afyon), Paros, and Pentelicon possible provenance. As highlighted by Capedri et al., [46], the presence of albite, quartz, apatite, Fe-oxide, phengitic muscovite, and paragonite is typical of Aphrodisias (Aydin) marble; apatite, phengitic muscovite, and phlogopite are accessory phases of Paros sources; apatite, Fe-oxide, chlorite, kaolinite, pyrophyllite, muscovite, and dolomite are accessory minerals in the marble of Docimium (Afyon) [46]. On the contrary, quartz, muscovite, Ti, Fe, Mn, Cr–oxides, apatite, chlorite, Fe-sulphide, and subordinate dolomite can be found in Pentelicon source [46].
Therefore, considering the accessory minerals detected, it is possible to exclude Aphrodisias (Aydin), Docimium (Afyon), and Paros sources and it is possible to hypothesize that the marble tessera NB4 comes from the Greek area of Pentelicon.

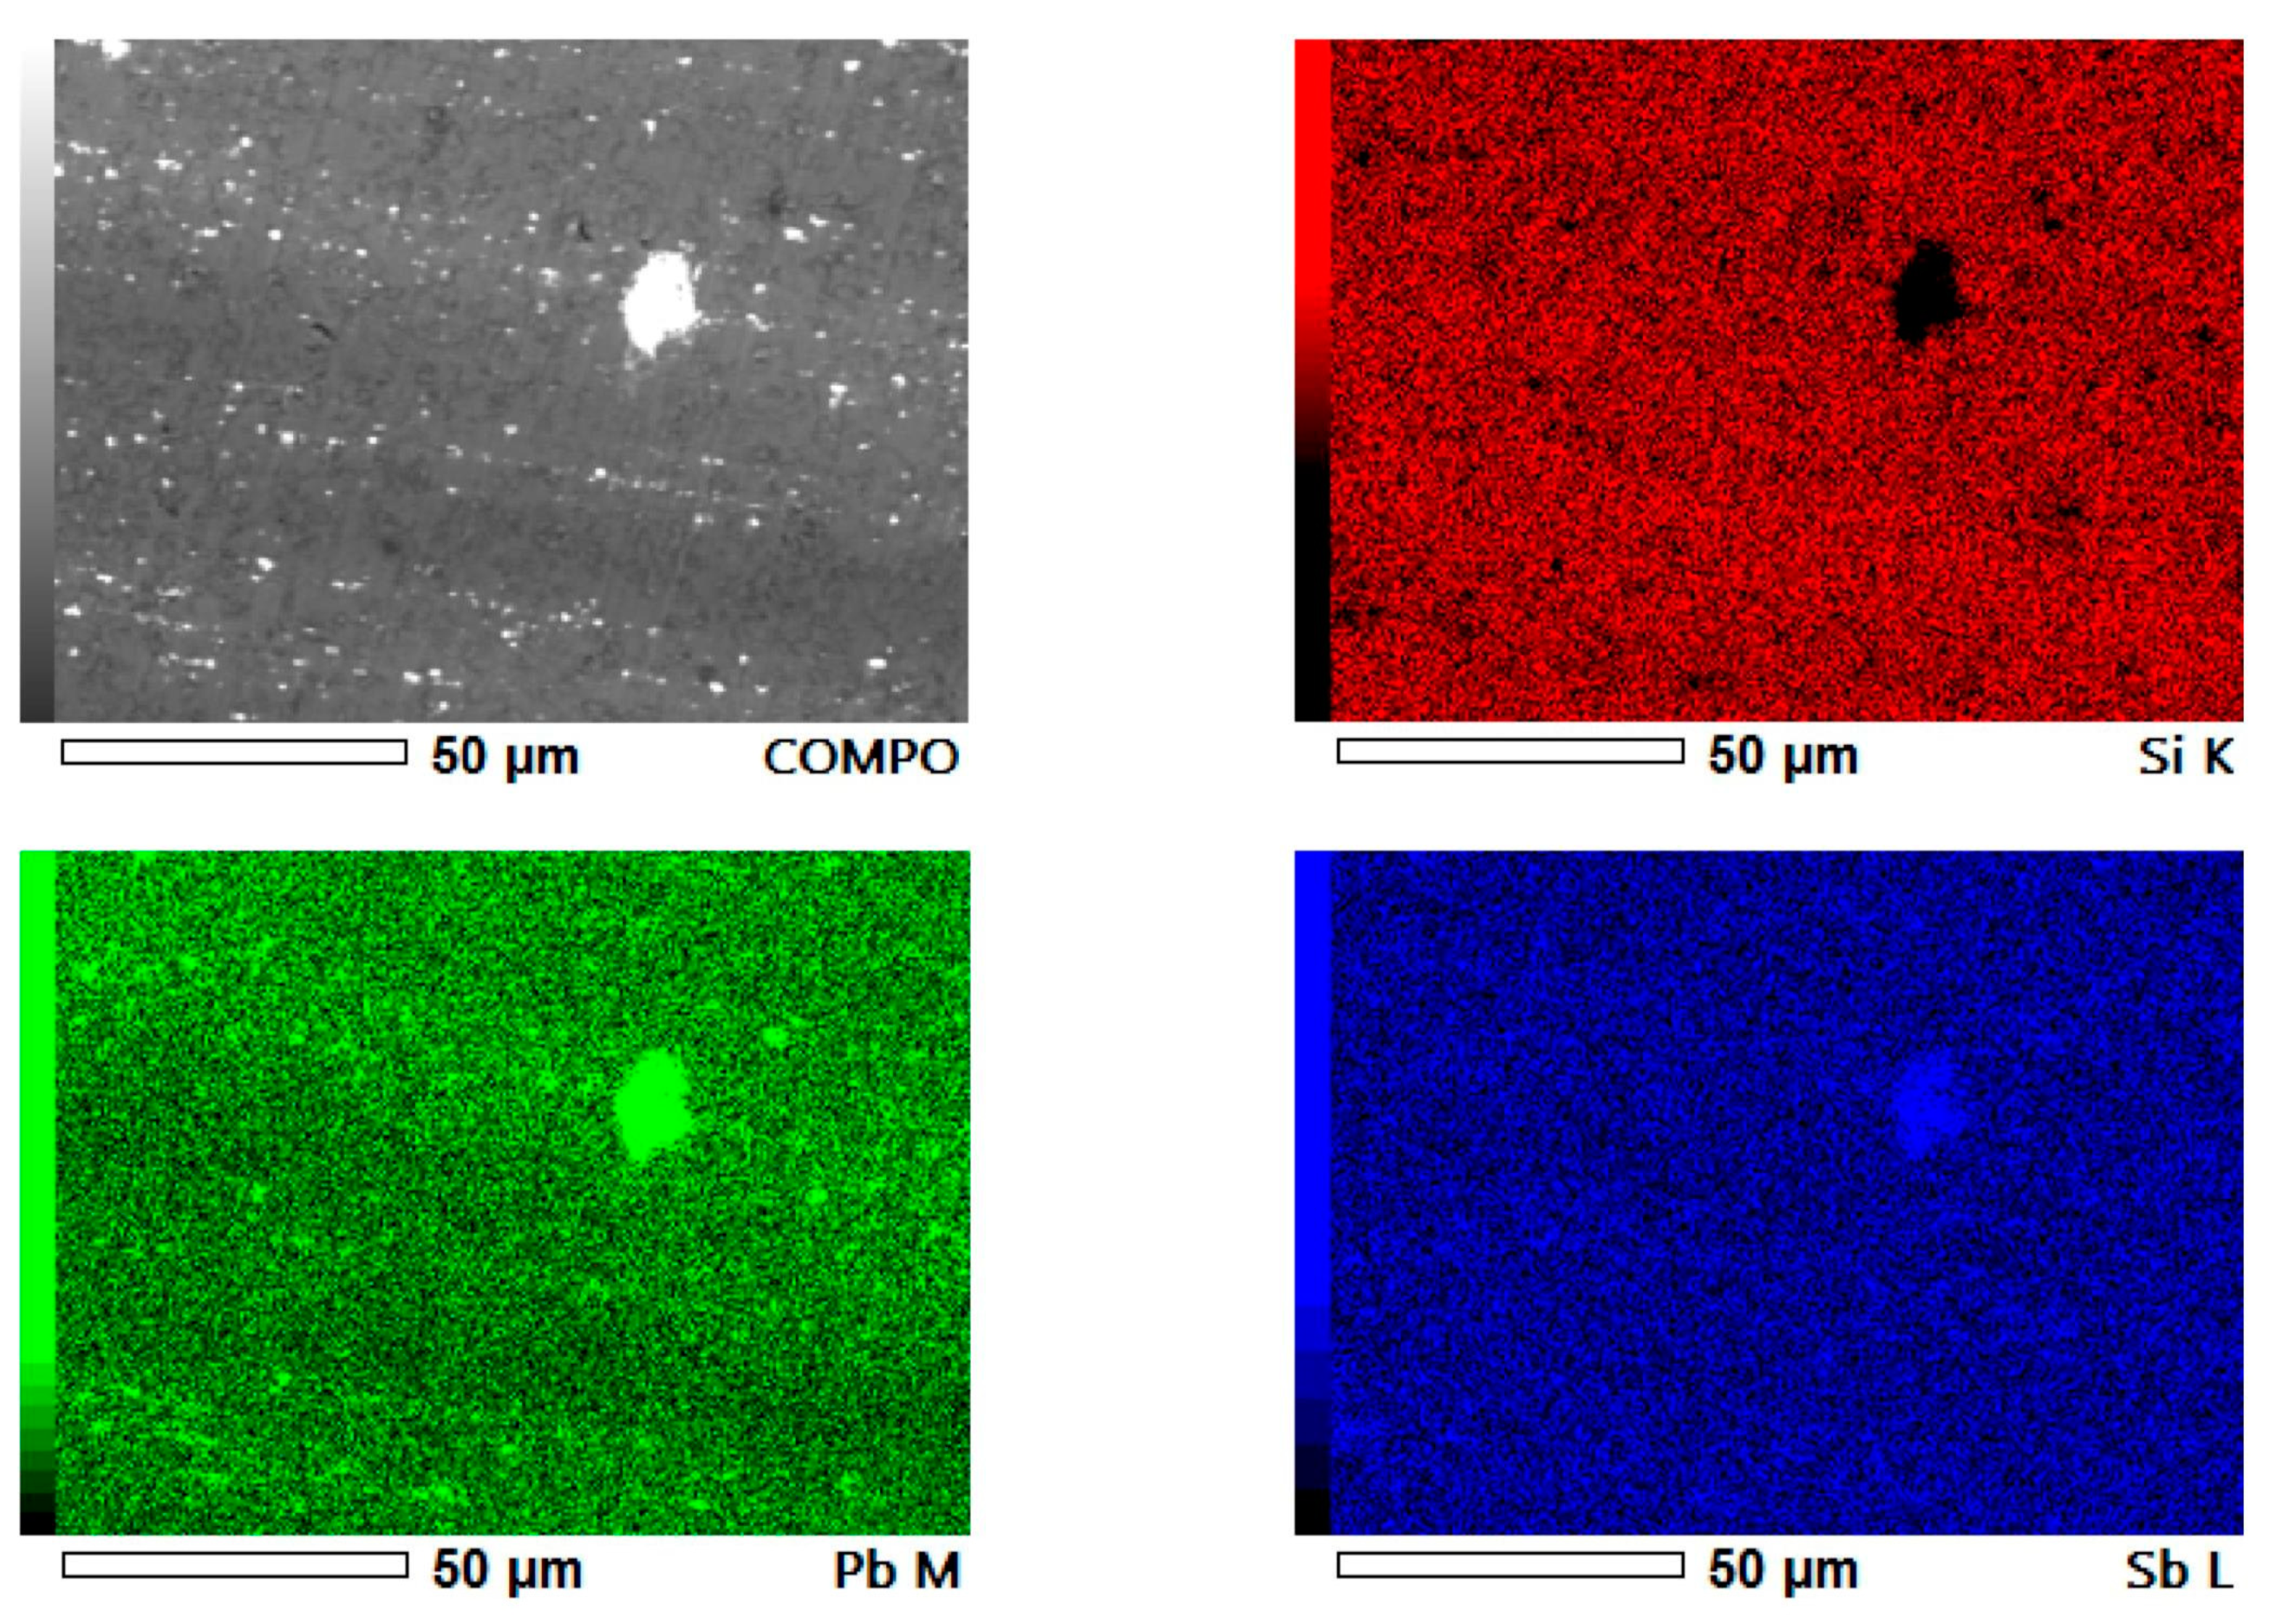
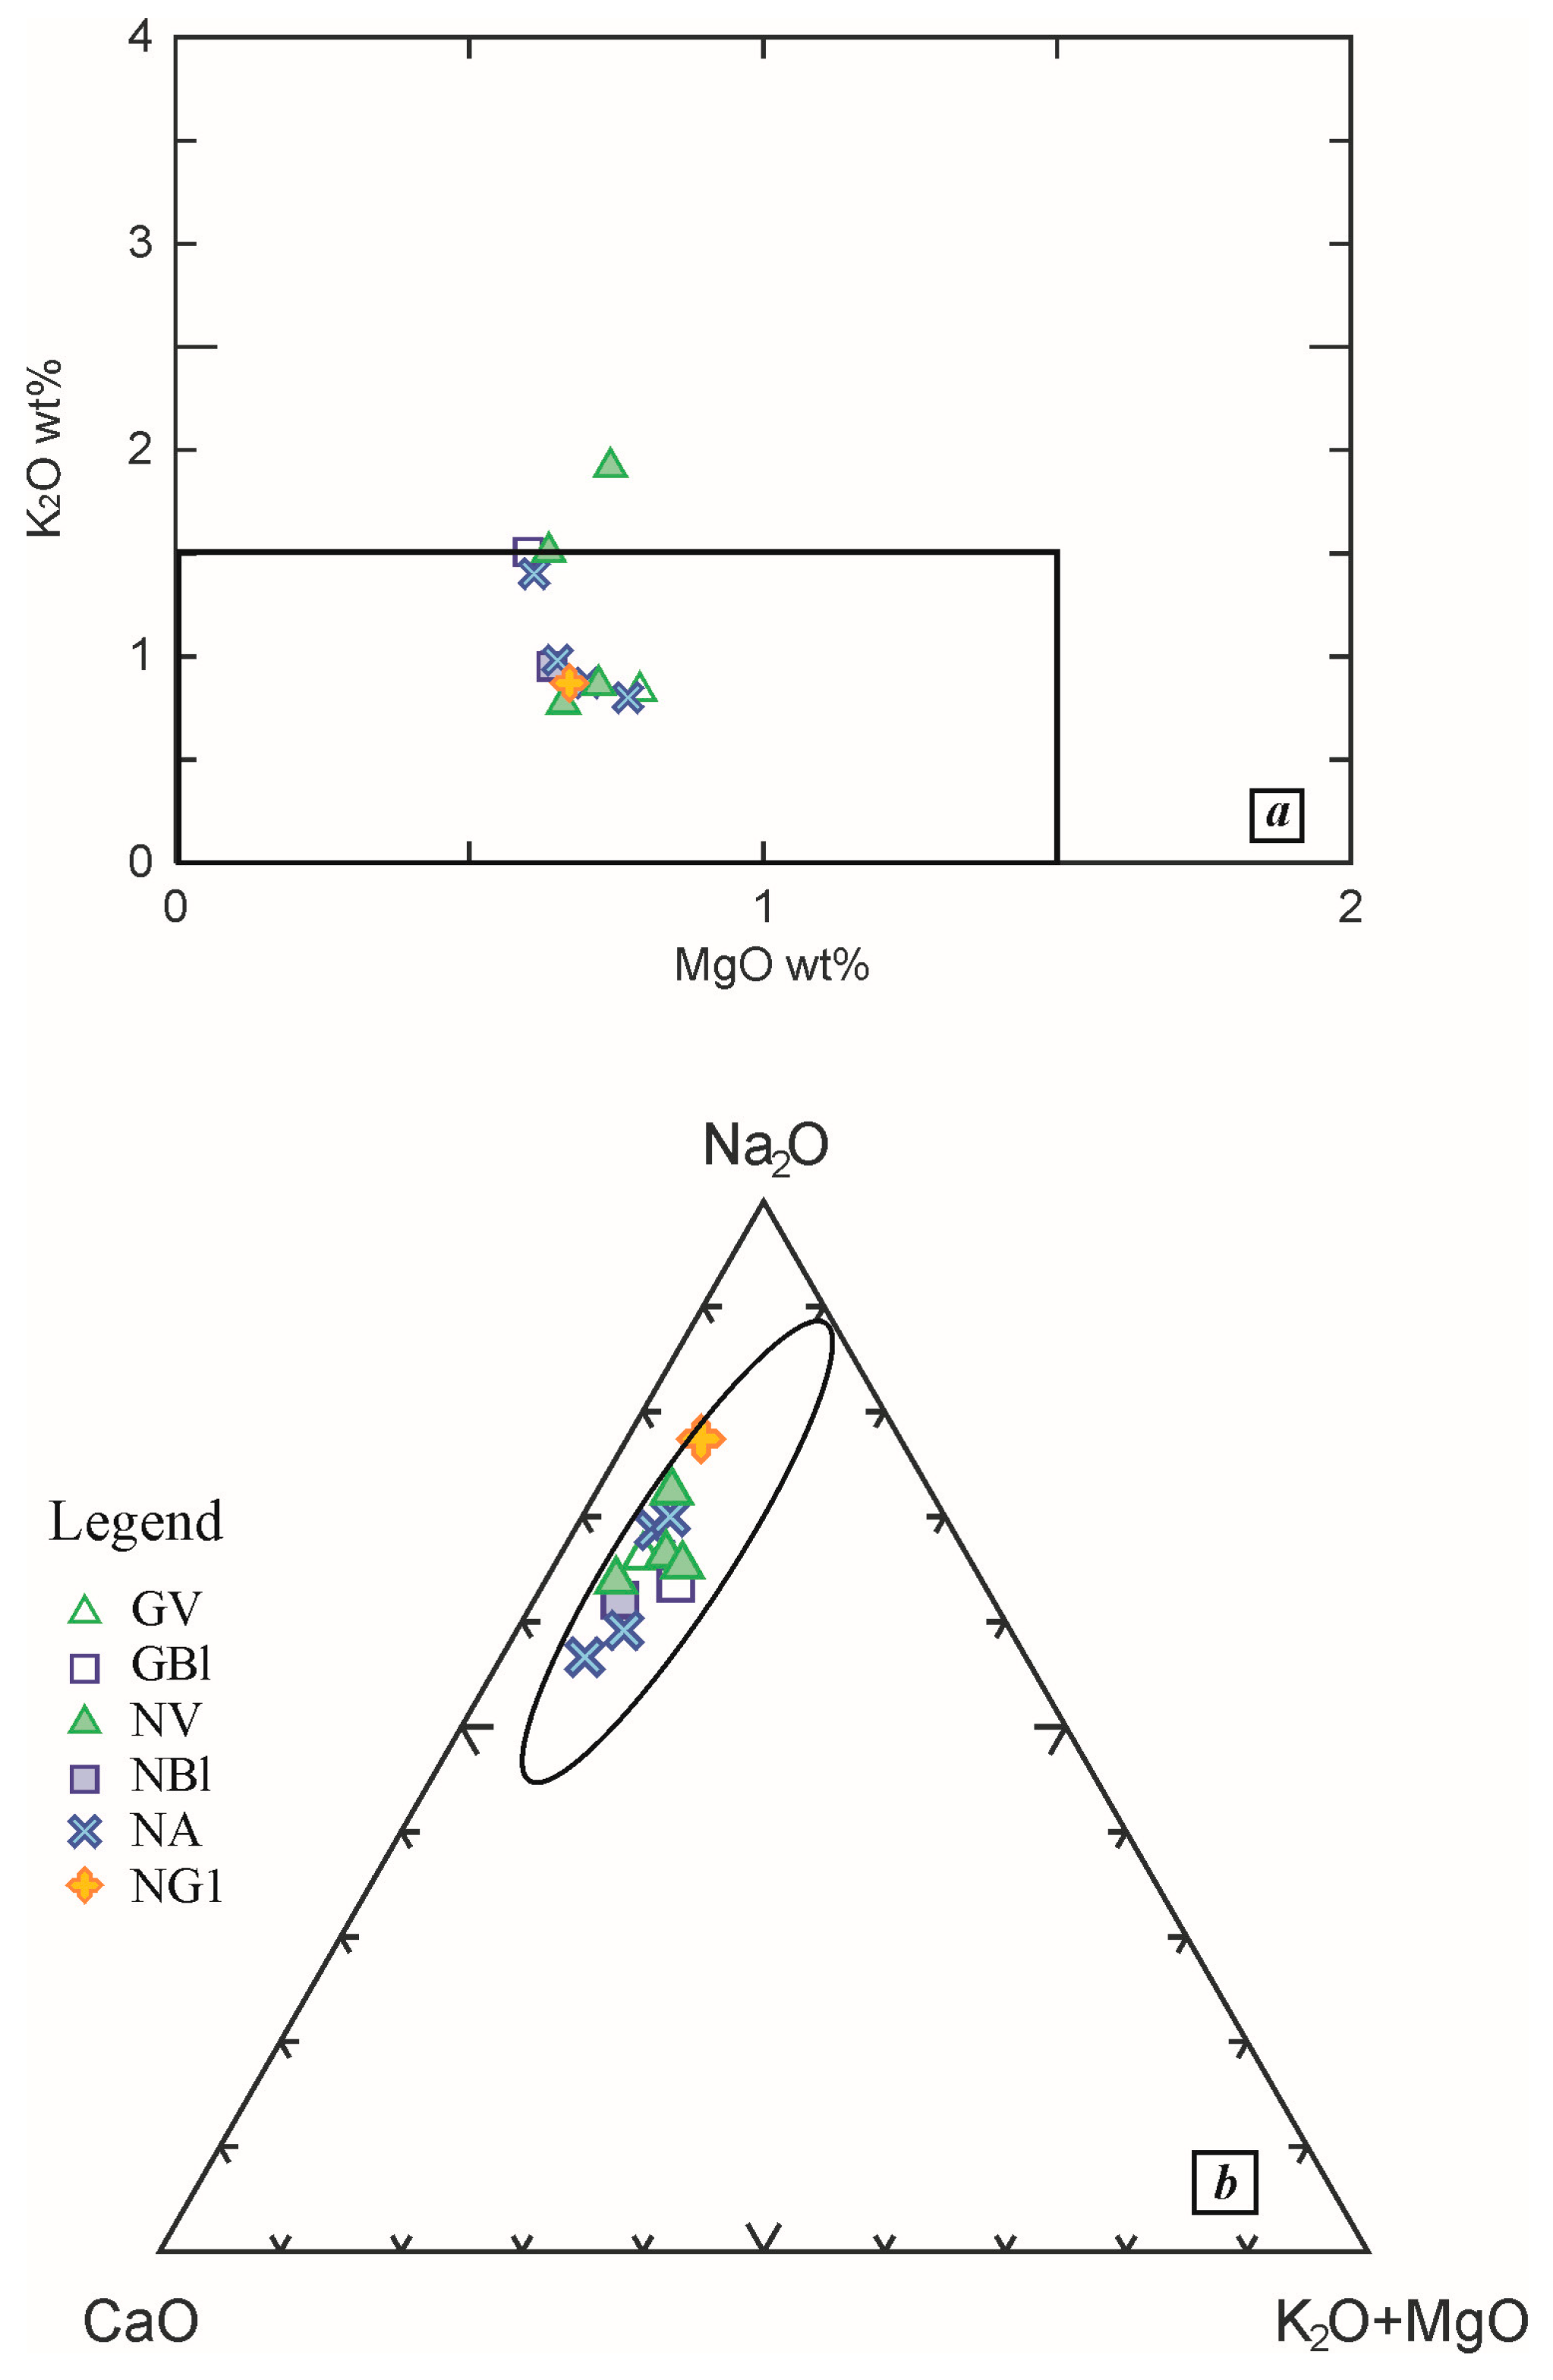
4.2.2. Glass Tesserae

Major and Minor Elements
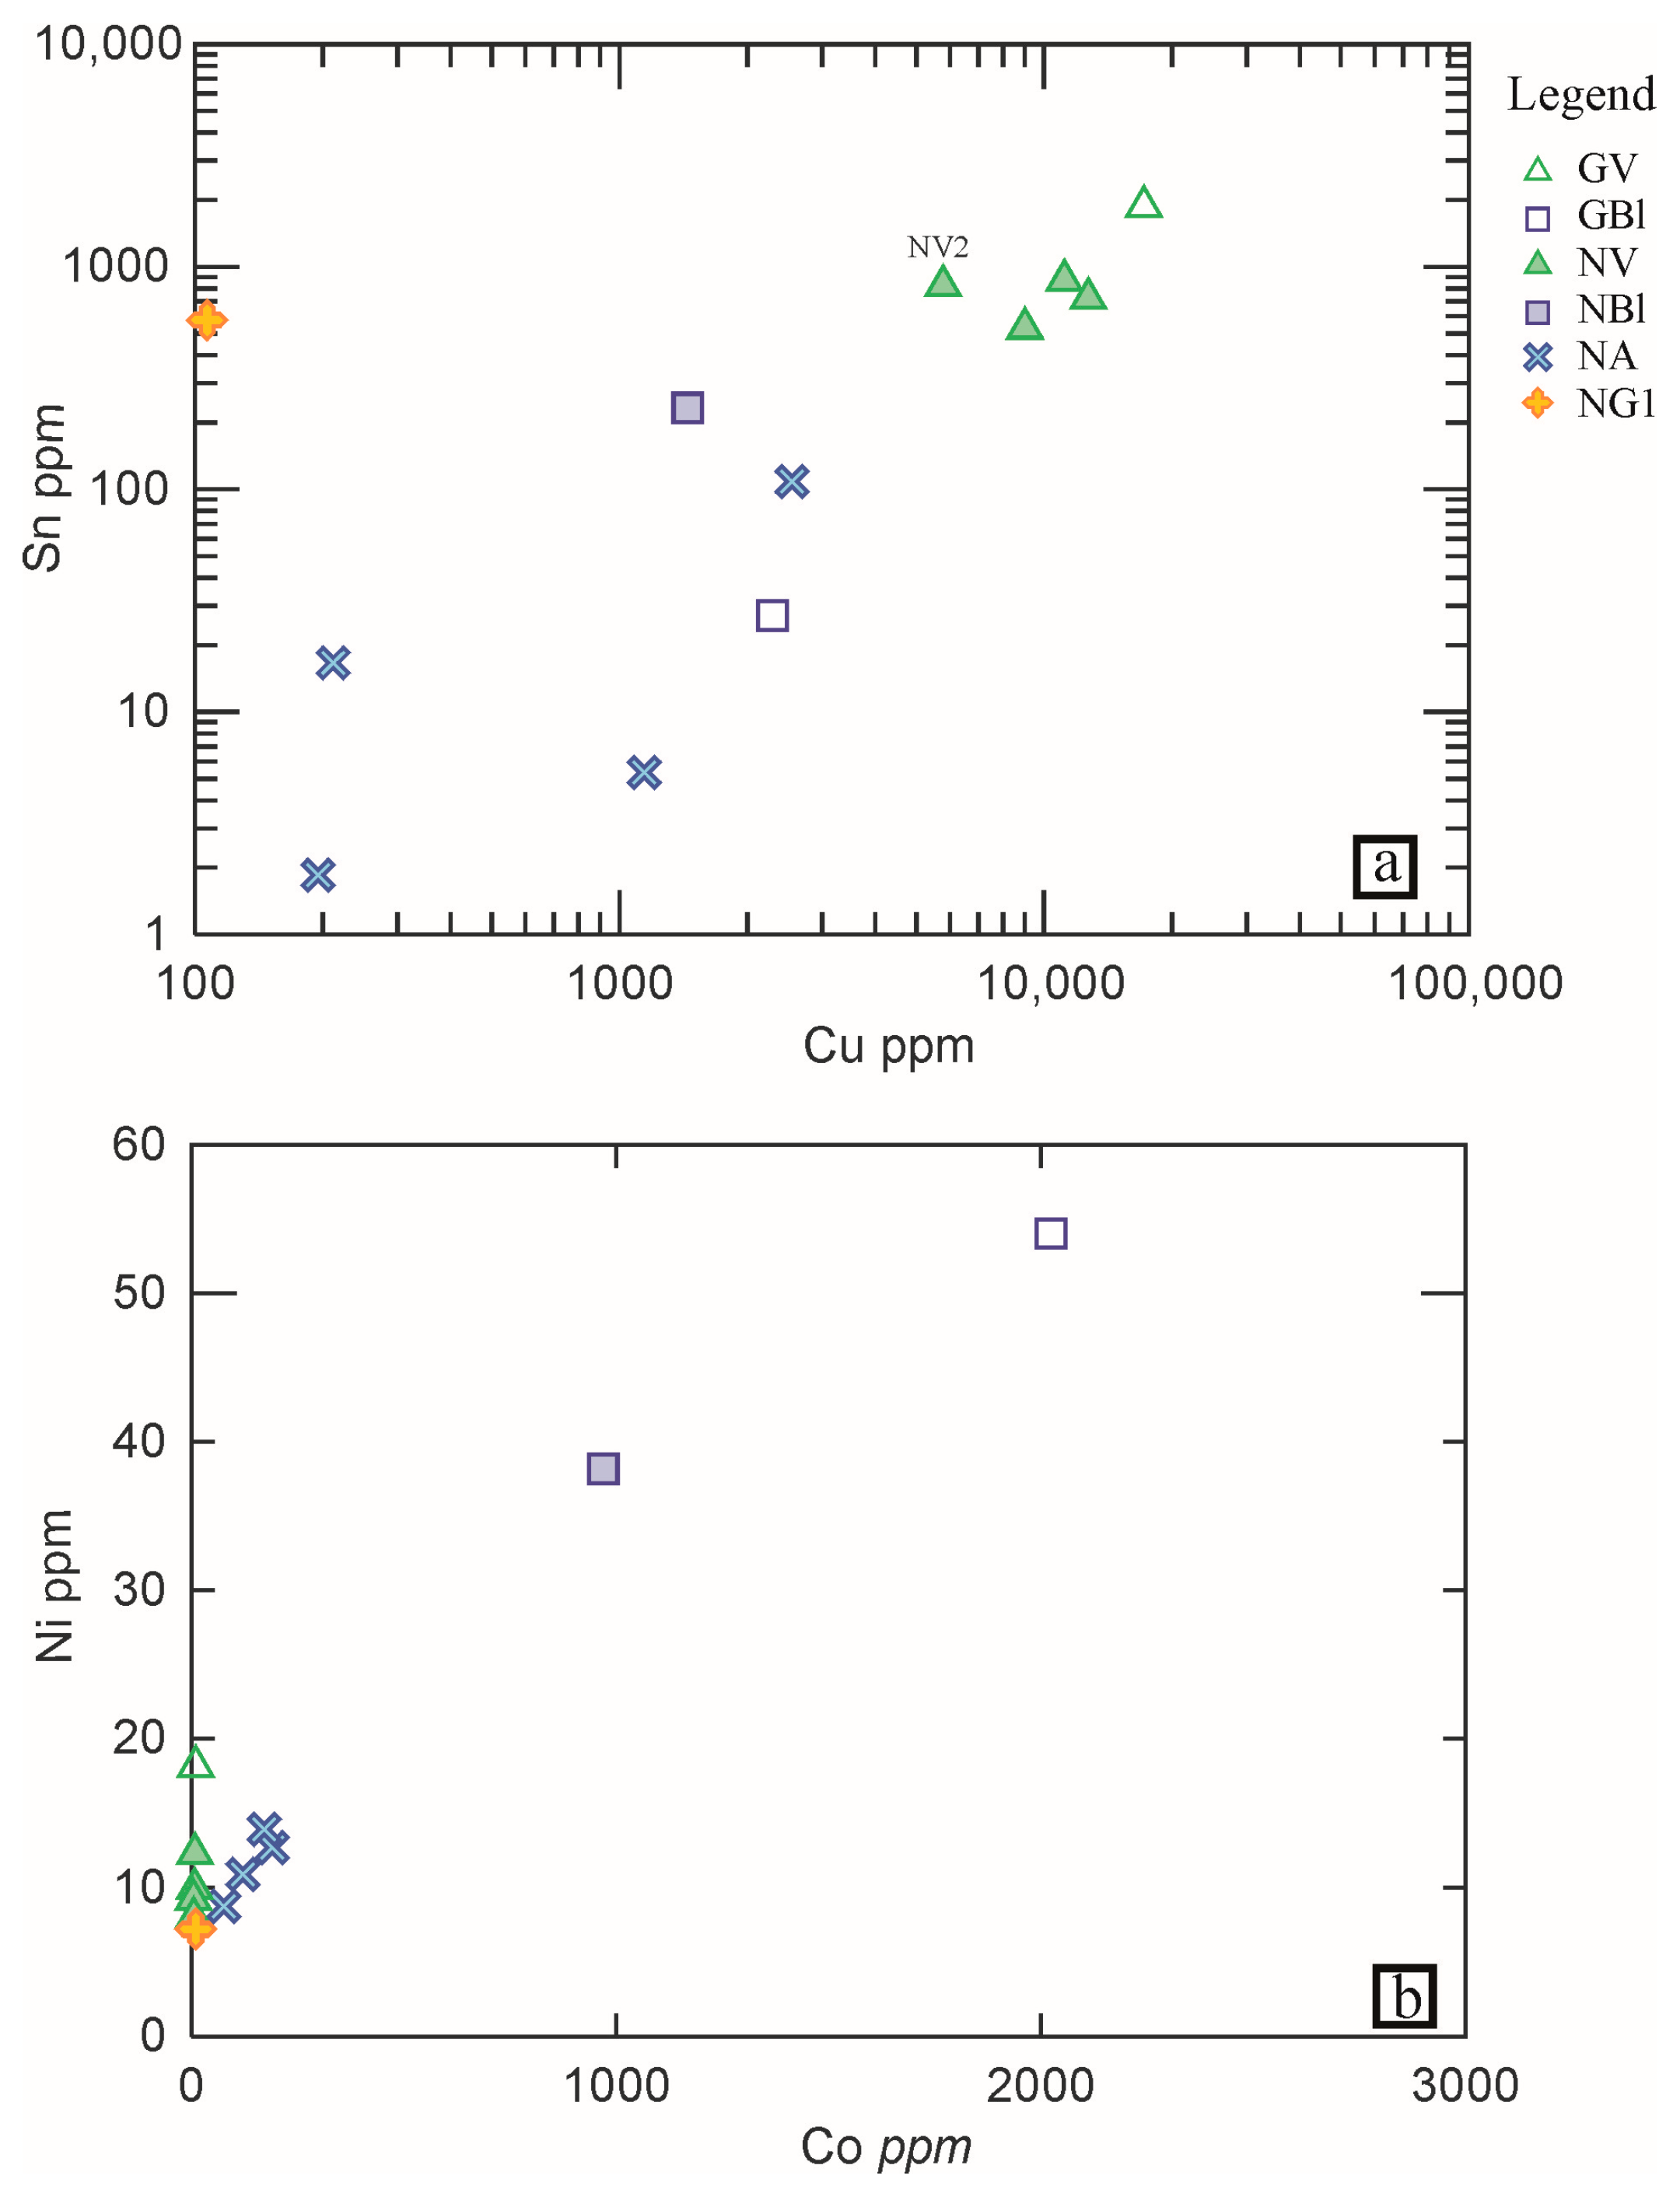
The results of EPMA/EDS analyses on the twelve glass tesserae are reported in wt % of the oxides in Table 4.
As suggested in previous studies [4], to detect the base glass compositions, the content of colorants and opacifiers, i.e., copper and lead (see the next paragraph for discussion) was subtracted from the composition of the tesserae and the remaining oxides were normalized to 100% (Table 5).
All the samples analyzed are soda–lime–silica glasses with SiO2 content ranging between 68.5 and 73.6 wt %, Na2O from 12.6 and 19.4 wt % and CaO from 4.1 to 8.3 wt %. The Al2O3 content varies between 1.9 to 3.2 wt %. The levels of CaO and Al2O3 roughly match the ratio found in typical Roman glasses, suggesting the use of sands containing feldspar as impurities, and, as a consequence, the use of a common silica source site [51]. MgO, K2O, and FeO are lower than 1.5 wt % with the exception of the NV4 sample with K2O of 1.88 wt % and GBl with K2O of 1.57 wt% and FeO with 1.85 wt %. The low contents of MgO and K2O (Figure 6a) suggest that natron (a sodium carbonate mineral) was used as a flux for all samples according to the typical Roman production technology [5,6,7]. The rectangle drawn in Figure 6a indicates the area where Natron glasses plot. The presence of Cl (ClO varying from 1 to 2.8 wt % and SO3 (0.08 to 0.3 wt %) is due to natron which contains NaCl and Na2SO4 as contaminants [13].
The data were plotted in the ternary diagram for the normalized concentration of Na2O, CaO, and K2O + MgO (Figure 6b) which allow the identification of the alkali source used as a flux in the glass production [52,53].
In this study, the glass tesserae plot in the silica–soda–lime glass area, regardless of their provenance, thus highlighting a typical Roman production (Figure 6).
The concentrations of major elements in glass reflect variations in the proportions of the two major raw materials mixed by the glassmakers. Therefore, the overall homogeneity of our samples is comparable to the compositional glass groups within later Roman glass [8,14], suggesting the use of similar sand sources and highly standardized glass manufacture procedures.
Regarding the PbO contents (Table 4), samples GBl, NV1, NV2, NV4, and NGl show concentrations higher than 1 wt %, the NBl tessera contains 0.42 wt % PbO, and for the remaining samples, the values of PbO are below the detection limit of EPMA/EDS. The Pb contents were also measured by LA–ICP–MS (see the next paragraph for discussion).

Trace Elements

The results of LA–ICP–MS analyses are listed in Table 6.
The values of manganese, copper, and lead are reported in both Table 4 and Table 6. Before giving information about the trace elements analysis results, it is fundamental to re-state that the EMPA/EDS detection limits do not allow to determine an element’s concentration when it is below 0.4 wt %. As a consequence, for this study, it has been necessary to carry out analyses also using LA–ICP–MS. In detail, as for Mn, when comparing the concentrations of GBl tesserae obtained by using both EMPA/EDS and LA–ICP–MS, it is possible to observe a good agreement between the two data (MnO = 0.76 wt % by EMPA/EDS, recalculated MnO = 0.73 wt % by LA–ICP–MS). The comparison of Cu and Pb concentrations show some differences and, in general, the PbO, concentrations obtained by LA–ICP–MS are underestimated. This is because the two methods differ in many ways: in their information depth, in lateral resolution, in sensitivity (detection limit) and in the level of non-destructiveness. In general, the results obtained by using EMPA/EDS must be preferred for major and minor elements, while the results obtained by LA–ICP–MS must be preferred for trace elements analyses i.e., when the concentrations are below 1000 ppm (see also Angelini et al. [54] and reference therein).
In the present study, the values of PbO obtained by EMPA/EDS (when detected) are higher than 3 wt %―only the PbO of the tessera NBl is 0.42 wt %―therefore they must be preferred to the corresponding concentrations obtained by LA–ICP–MS.
The contents of trace elements and, in particular, Sr, Zr, and Ba values are related to the characteristics of the sand used for glass production. Generally, low zirconium (about 60 ppm) and high strontium (about 400 ppm) indicate the use of Mediterranean coastal sand [5]. In addition, the content of barium, which enters in the structure of alkali feldspars as a vicariant of potassium, is related to the content of alkali feldspars in the sand [7,55]. All glass tesserae have low zirconium (ranging from 26 to 60 ppm), high strontium (from 282 to 486 ppm) and barium, ranging from 138 to 270 ppm, suggesting that beach sand with different amounts of alkali feldspars was used in their production.
The glass samples show different shades of colors (blue, light blue, dark and light green, green/turquoise, and yellow; Table 1) in relation to the introduction of transition metals into the glassy matrix, sometimes combined in various concentrations and oxidation states [9]. Common colorants were cobalt oxide for dark blue, iron oxide for green, blue or amber and copper oxide (CuO) for turquoise, blue or green [10]. In the twelve tesserae studied, copper and cobalt are the two main coloring ions identified for blue/light blue and shades of green. In fact, the colors of glass are strictly correlated to their concentrations.
Copper is the main coloring agent in the green samples with increasing content from the Nereid mosaic green tesserae to the Geometric mosaic one (from 5789 to 17,189 ppm).
The blue colors are produced using copper and cobalt. Indeed, the blue and light blue tesserae show high values of both elements. In the two blue-colored tesserae (NBl and GBl), Co and Cu contents are higher than in the other samples.
As for the two blue tesserae, the higher concentrations of copper and cobalt were measured in the sample GBl of the Geometric mosaic (Co = 2024 ppm and Cu = 2293). The light blue tesserae of the Nereid mosaic (NA1, NA2, NA3, NA4) contain smaller amounts of copper and cobalt compared to the blue ones (Table 6). The NA2 sample has the highest Co and Cu content overall (Co = 189 ppm and Cu = 2548 ppm).
Considering the relation between Cu and Sn (see the diagram Cu vs. Sn in Figure 7a), the shades of green and blue/light-blue colors are probably related to the presence of Cu2+ ions in the glass network [9,10,11]―introduced in the batch by the addition of bronze or bronze scraps during glass production―as suggested by the relative percentages of copper and tin of 99%–90.2% and 1%–9.8%. Only two tesserae collected from the Nereid mosaic (NBl blue and NV2 green) show different Cu–Sn relative percentages (86%–87.5% and 14%–12.5%).
As regards the cobalt source, the correlation with the Ni content in the blue and light-blue tesserae (Figure 7b) suggests the probable use of a cobalt ore containing nickel, such as skutterudite as a coloring agent [3,10,11].
As for the glass opacity, all the tesserae show high contents of antimony, which acts as an opacifier. The specific nature of antimonates varies in chemical composition from calcium antimonates to lead antimonates. Considering the lead content, the tesserae can be divided into high lead (HPb) including the green, blue and yellow tesserae, and low lead (LPb) for the light-blue tesserae. The PbO content reaches a peak of 7.85 wt % (Table 4) in the yellow tessera NG1, which also shows high Ti (807 ppm), Sn (574 ppm), and Sb (11215) values (Table 6). The lead and antimony high concentrations in the NG1 sample are related to the presence of lead antimonate Pb2Sb2O7 microcrystals that vary in size and shape, and are homogenously distributed in the glass, as it is clearly distinguishable in the Si–Pb–Sb maps (Figure 8).
Lead and antimony act not only as opacifiers but also as colorants [12]. Indeed, lead antimonates Pb2Sb2O7 are responsible for the yellow color of the tesserae.
Additionally, the green (NV1, NV2, NV3, and NV4) tesserae show high concentrations of Pb and Sb, confirming, as demonstrated in previous studies [10], that lead antimonate is present in Roman opaque green glass.
In addition, the presence of lead antimonate suggests that the mosaic’s tesserae were produced by Roman glassmakers with a deep technological knowledge of the material’s properties. Previous studies [9,10,11,12,56] showed that if antimony and lead compounds such as galena (PbS) and stibnite (Sb2S) were added directly to a natron base glass, the lead oxide dissolved and calcium antimonate crystallized instead of lead antimonate. To avoid the dissolution of lead oxide, the glassmakers at first produced a glass mass (corpo) containing the yellow opacifier, which was successively added to the base glass to obtain a homogeneous mixture.
High concentrations of lead and antimony were also measured in the two blue tesserae (GBl and NBl). However, the chemical study by EPMA/EDS highlights the presence of microcrystals of calcium antimonate (ranging in size from 5 to 20 μm) (Figure 9), suggesting that in these tesserae the base glass reacted with antimony and lead compounds and calcium antimonates precipitated.
The light-blue tesserae (NA1, NA2, NA3, and NA4) are different from the others, as they contain high concentrations of antimony and low content of lead. Calcium-antimonates (Ca2Sb2O7 or CaSb2O6) were used to opacify light-blue tesserae as testified by the little crystals detected by EPMA (Figure 9). The presence of these crystals suggests that the introduction of antimony as stibnite (Sb2S3) or antimony oxide, produced them by reacting with calcium from the soda–lime–silica glass itself [8].

5. Conclusions

The petrographic and geochemical approach for the study of the two mosaic’s tesserae is a powerful tool to obtain information about raw materials and glass-working techniques.
The results obtained on the stone and glass tesserae collected in the Nereid and Geometric mosaics in the archaeological area of S. Aloe quarter in Vibo Valentia have shown that:
(1)
The white, pinkish/reddish and black tesserae are all made of stones. The majority of them are limestones, except for one white tessera constituted by marble, probably of Greek provenance (Pentelicon) and two black tesserae made of volcanic rocks;
(2)
The blue/ light-blue, yellow tesserae are made of glass;
(3)
The green tesserae are made of two types of materials: stone and glass.
Although it is quite difficult to determine the quarrying places of the stone tesserae, it is possible to hypothesize that stones of local sedimentary formations were employed. The use of different varieties of stones for the flooring of this ancient Roman domus, testifies the greatness of this archaeological site. In addition, the results on the provenance of the marble support the hypothesis that this material comes from the Greek area, remarking the importance of the S. Aloe quarter.
The glass tesserae were used for those colors that were not readily available among stones, such as the analyzed blue/light-blue, shades of green and yellow tesserae. The analyses of the glass suggest the use of natron as a flux according to the Roman tradition. In particular, the coloring agents are bronze and cobalt for the blue /light-blue and green tesserae, and the lead antimonate for yellow.
All the tesserae were also opacified using lead and calcium antimonates, testifying that the glasses were produced by experienced Roman glassmakers with a deep technological knowledge of the material’s properties.
The geochemical study of glass tesserae provides important information about their production techniques and the provenance of the raw materials used in their preparation. This means that the S. Aloe quarter has a relevant significance while studying Calabrian archaeological sites.

Author Contributions

Conceptualization, E.F., M.D., M.M. and A.T.G.; Formal analysis, D.B., E.L.P. and M.M.; Investigation, D.B., E.F. and E.L.P.; Project Administration, D.B.; Resources, M.M., M.D. and F.S.; Supervision, D.B.; Validation, D.B.; Writing-original draft, D.B., E.F., E.L.P., M.M., and M.D.; Writing-review & editing, D.B.

Funding

This research received no external funding.

Acknowledgments

The authors are sincerely grateful to three anonymous reviewers, who deeply contributed to improve this paper through their comments and suggestions.

Conflicts of Interest

The authors declare no conflict of interest.

References

  1. Rotella, A.M. Il parco archeologico in località S. In Aloe a Vibo Valentia: Problematiche di Tutela e di Fruizione tra Nuove Scoperte e Vecchi Scavi; Consenso Publishing: Corigliano-Rossano (CS), Italy, 2009; Volumes 3–4, pp. 178–191. [Google Scholar]
  2. Ricciardi, P.; Colomban, P.; Tournie, A.; Macchiarola, M.; Ayed, N. A non-invasive study of Roman Age mosaic glass tesserae by means of Raman spectroscopy. J. Archaeol. Sci. 2009, 36, 2551–2559. [Google Scholar] [CrossRef]
  3. Barca, D.; Basso, E.; Bersani, D.; Galli, G.; Invernizzi, C.; La Russa, M.F.; Lottici, P.P.; Malagodi, M.; Ruffolo, S.A. Vitreous tesserae from the calidarium mosaics of the Villa dei Quintili, Rome. Chemical composition and production technology. Microchem. J. 2016, 124, 726–735. [Google Scholar] [CrossRef]
  4. Verità, M.; Lazzarini, L.; Tesser, E.; Antonelli, F. Villa del Casale (Piazza Armerina, Sicily): Stone and glass tesserae in the baths floor mosaics. Archaeol. Anthrop. Sci. 2017, 11, 373–385. [Google Scholar] [CrossRef]
  5. Silvestri, A. The coloured glass of Iulia Felix. J. Archaeol. Sci. 2008, 35, 1489–1501. [Google Scholar] [CrossRef]
  6. Silvestri, A.; Molin, G.; Salviulo, G. Roman and Medieval glass from the Italian area: Bulk characterisation and relationships with production technology. Archaeometry 2005, 47, 797–816. [Google Scholar] [CrossRef]
  7. Silvestri, A.; Molin, G.; Salviulo, G. The colourless glass of Iulia Felix. J. Archaeol. Sci. 2008, 35, 331–341. [Google Scholar] [CrossRef]
  8. Foster, H.E.; Jackson, C.M. The composition of ‘naturally coloured’ late Roman vessel glass from Britain and the implications for models of glass production and supply. J. Archaeol. Sci. 2009, 36, 189–204. [Google Scholar] [CrossRef]
  9. Basso, E.; Invernizzi, C.; Malagodi, M.; La Russa, M.F.; Bersani, D.; Lottici, P.P. Characterization of colorants and opacifiers in roman glass mosaic tesserae through spectroscopic and spectrometric techniques. J. Raman Spectrosc. 2014, 45, 238–245. [Google Scholar] [CrossRef]
  10. Paynter, S.; Kearns, T. West Clacton Reservoir, Great Benteley, Essex: Analysis of Glass Tesserae; Research Department Report Series no 44; English Heritage: London, UK, 2011. [Google Scholar]
  11. Silvestri, A.; Tonietto, S.; Molin, M.; Guerriero, P. The palaeo-Christian glass mosaic of St. Prosdocimus (Padova, Italy): Archaeometric characterisation of tesserae with antimony- or phosphorus-based opacifiers. J. Archaeol. Sci. 2012, 39, 217. [Google Scholar] [CrossRef]
  12. Verità, M.; Maggetti, M.; Saguì, L.; Santopadre, P. Colors of Roman glass: An investigation of the yellow sectilia in Gorga collection. J. Glass Studies 2013, 55, 21–34. [Google Scholar]
  13. Shortland, A.J. Evaporites of the Wadi Natrun: Seasonal and annual variation and its implication for ancient exploitation. Archaeometry 2006, 46, 497–516. [Google Scholar] [CrossRef]
  14. Freestone, I.C. The Provenance of Ancient Glass through Compositional Analysis. Mater. Res. Soc. Symp. Proc. Mater. Res. Soc. 2005, 852, OO8.1.1–OO8.1.14. [Google Scholar] [CrossRef]
  15. Freestone, I.C.; Pointing, M.; Hughes, M.J. The origins of Byzantine glass from Maroni Petrera, Cyprus. Archaeometry 2002, 44, 257–272. [Google Scholar] [CrossRef]
  16. Gambino, F.; Borghi, A.; d’Atri, A.; Gallo, L.M.; Ghiraldi, L.; Giardino, M.; Martire, L.; Palomba, M.; Perotti, L.; Macadam, J. TOURinSTONES: A Free Mobile Application for Promoting Geological Heritage in the City of Torino (NW Italy). Geoheritage 2019, 11, 12019. [Google Scholar] [CrossRef]
  17. Arslan, E. Vibo Valentia. In Enciclopedia dell’Arte Antica II Supplemento; Treccani: Roma, Italy, 1997; Volume VII, p. 1162. [Google Scholar]
  18. Sogliani, F. Repertorio delle fonti scritte per la ricostruzione della vicenda insediativa di Vibo Valentia tra Tarda Antichità e medioevo, Sulle tracce della Storia; Studi in onore di Vincenzo Nusdeo nel decennale della scomparsa; D’Andrea, M., Ed.; ADHOC: Vibo Valentia, Italy, 2012; pp. 271–335. [Google Scholar]
  19. Faedo, L. Aspetti della cultura figurativa in età romana. In Storia Della Calabria Antica. 2. Età Italica e Romana; Settis, S., Ed.; Gangemi: Roma, Italy, 1994; pp. 601–605. [Google Scholar]
  20. Iannelli, M.T.; Guzzo, P.G.; Gaglianese, G.; Minniti, B.; Rotella, A.M.; Vivacqua, P. Hipponion tra la seconda metà del IV e la fine del III sec. a.C.: Ricostruzione topografica alla luce di nuove scoperte. In Enotri e Brettii in Magna Grecia Modi e Forme di Interazione Culturale; De Sensi Sestito, G., Mancuso, S., Eds.; Rubettino: Soveria Mannelli (CZ), Italy, 2017; Volume II, pp. 397–510. [Google Scholar]
  21. Rotella, A.M. L’indagine archeologica nel quartiere romano di S. Aloe. In Hipponion Vibo Valentia Monsleonis. I volti della città; Iannelli, M.T., Ed.; Laruffa: Reggio Calabria, Italy, 2014; pp. 117–134. [Google Scholar]
  22. Harrys Reyes, F.; Miranda, L. Il restauro di due mosaici pavimentali nel parco archeologico di S. Aloe a Vibo Valentia, Collana Esperide; Consenso Publishing: Corigliano-Rossano (CS), Italy, 2009; Volumes 3–4, pp. 168–177. [Google Scholar]
  23. Sangineto, A.B. Scavi Nell’abitato Romano di Vibo Valentia, in Annali della Scuola Normale di Pisa; All’insegna del Giglio: Firenze, Italy, 1989; Volume S. III, 19, pp. 833–843. [Google Scholar]
  24. Gunther, D.; Heinrich, C.A. Enhanced sensitivity in laser ablation-ICP mass spectrometry using helium-argon mixtures as aerosol carrier. J. Anal. Atom. Spectrom. 1999, 14, 1363–1368. [Google Scholar] [CrossRef]
  25. Barca, D.; Abate, M.; Crisci, G.M.; De Presbiteris, D. Post-Medieval glass from the castle of Cosenza, Italy: Chemical characterization by LA-ICP-MS and SEM-EDS. Periodico Mineral. 2009, 78, 49–64. [Google Scholar] [CrossRef]
  26. Barca, D.; Lucarini, G.; Fedele, F. Provenance of obsidian artefacts from the WāDī ATH- THAYYILAH 3 Neolithic site (eastern Yemen plateau) by LA-ICP-MS. Archaeometry 2012, 54, 603–622. [Google Scholar] [CrossRef]
  27. Fryer, B.J.; Jackson, S.E.; Longerich, H.P. The design, operation and role of the laser ablation microprobe coupled with an inductively coupled plasma-mass spectrometer (LAM-ICP-MS) in the earth sciences. Can. Mineral. 1995, 33, 303–312. [Google Scholar]
  28. Gao, S.; Liu, X.; Yuan, H.; Hattendorf, B.; Gunther, D.; Chen, L.; Hu, S. Determination of forty-two major and trace elements in USGS and NIST SRM glasses by laser ablation-inductively coupled plasma mass spectrometry. Geostandard Newslett. 2002, 26, 181–196. [Google Scholar] [CrossRef]
  29. Pearce, N.J.G.; Perkins, W.T.; Westgate, J.A.; Gorton, M.T.; Jackson, S.E.; Neal, C.R.; Chenery, S.P. A compila- tion of new and published major and trace element data for NIST SRM 610 and SRM 612 glass reference materials. Geostandard Newslett. 1997, XXI, 114–115. [Google Scholar]
  30. Marsaglia, K.M. Petrography and provenance of volcaniclastic sands recovered from the Izu-Bonin Arc, Leg 126. Proceedings of the Ocean Drilling Program. Sci. Results 1992, 126, 139–154. [Google Scholar]
  31. Marsaglia, K.M. Basaltic island sand provenance. In Processes Controlling the Composition of Clastic Sediments; Johnsson, M.J., Basu, A., Eds.; Geological Society of America Bulletin: Boulden, CO, USA, 1993; Volume 284, pp. 41–65. [Google Scholar]
  32. Morrone, C.; De Rosa, R.; Le Pera, E.; Marsaglia, K.M. Provenance of volcaniclastic beach sand in a magmatic-arc setting: An example from Lipari island (Aeolian archipelago, Tyrrhenian Sea). Geol. Mag. 2017, 154, 804–828. [Google Scholar] [CrossRef]
  33. Folk, R.L. Practical petrographic classification of limestones. Bull. Am. Assoc. Petrol. Geol. 1959, 43, 1–38. [Google Scholar]
  34. Dunham, R.J. Classification of carbonate rocks according to depositional texture. In Classification of Carbonate Rocks; Ham, W.E., Ed.; The American Association of Petroleum Geologists: Tulsa, OK, USA, 1962; Volume 1, pp. 108–121. [Google Scholar]
  35. Worden, R.H.; Armitage, P.J.; Butcher, A.R.; Churchill, J.; Csoma, A.; Hollis, C.; Lander, R.; Omma, J. Petroleum reservoir quality prediction: Overview and contrasting approaches from sandstone and carbonate communities. In Reservoir Quality of Clastic and Carbonate Rocks: Analysis, Modelling and Prediction; Worden, R.H., Ed.; Geological Society: London, UK, 2018; p. 435. [Google Scholar] [CrossRef]
  36. Andò, S.; Garzanti, E. Raman spectroscopy in heavy-mineral studies. In Sediment Provenance Studies in Hydrocarbon Exploration and Production; Scott, R.A., Smyth, H.R., Morton, A.C., Richardson, N., Eds.; Geological Society: London, UK, 2013; Volume 386, pp. 395–412. [Google Scholar]
  37. Le Pera, E.; Morrone, C. Heavy minerals distribution and provenance in modern beach sands of Campania, Italy. Rend. Online Soc. Geol. It. 2018, 45, 136–140. [Google Scholar] [CrossRef]
  38. Morton, A.C.; Johnsson, M.J. Factors influencing the composition of detrital heavy mineral suites. In Holocene Sands of the Apure River Drainage Basin, Venezuela. In Processes Controlling the Composition of Clastic Sediments; Johnsson, M.J., Basu, A., Eds.; Geological Society of America: Boulder, CO, USA, 1993; Volume 284, pp. 171–185. [Google Scholar]
  39. Basu, A.; Molinaroli, E. Provenance characteristics of detrital opaque Fe-Ti oxides minerals. J. Sediment. Petrol. 1989, 59, 922–934. [Google Scholar]
  40. Basu, A.; Molinaroli, E. Reliability and application of detrital Fe-Ti oxide minerals in provenance determination. Geol. Soc. Lond. Special Publ. 1991, 57, 55–65. [Google Scholar] [CrossRef]
  41. Caracciolo, L.; Gramigna, P.; Critelli, S.; Calzona, A.B.; Russo, F. Petrostratigraphic analysis of a LateMiocene mixed siliciclastic–carbonate depositional system (Calabria, Southern Italy): Implications for Mediterranean paleogeography. Sediment. Geol. 2013, 284/285, 117–132. [Google Scholar] [CrossRef]
  42. Rao, A.; Gramigna, P.; Neri, C. Aspetti sedimentologici e biostratigrafici della sezione neogenica di Piscopio nell’area del M.te Poro, Vibo Valentia (Calabria). Geol. Romana 2007, 40, 147–161. [Google Scholar]
  43. Attanasio, D.; Armiento, G.; Brilli, M.; Emanuele, M.C.; Platania, R.; Turi, B. Multimethod marble provenance determinations: The Carrara marbles as a case study for the combined use of isotopic, electron spin resonance and petrographic data. Archaeometry 2000, 42, 257–272. [Google Scholar] [CrossRef]
  44. Belfiore, M.C.; Ricca, M.; La Russa, M.F.; Ruffolo, S.A.; Galli, G.; Barca, D.; Malagodi, M.; Vallefuoco, M.; Sprovieri, M.; Pezzino, A. Provenance study of building and statuary marbles from the Roman archaeological site of “Villa dei Quintili” (Rome, Italy). Ital. J. Geosci. 2016, 135, 236–249. [Google Scholar] [CrossRef]
  45. Gorgoni, C.; Lazzarini, L.; Pallante, P.; Turi, B. An updated and detailed mineropetrographic and C-O stable isotopic reference database for the main Mediterranean marbles used in antiquity. In Fifth International Conference of the Association for the Study of Marble and Other Stones in Antiquity, Museum of fine arts, Boston, U.S.A., June 1998; Herrmann, J.J., Herz, N., Newman, R., Eds.; Archetype Publications: London, UK, 2002; pp. 1–25. [Google Scholar]
  46. Capedri, S.; Venturelli, G. Accessory minerals as tracers in the provenancing of archaeological marbles, used in combination with isotopic and petrographic data. Archaeometry 2004, 46, 517–536. [Google Scholar] [CrossRef]
  47. La Russa, M.F.; Ruffolo, S.A.; Ricca, M.; Ricci, S.; Davidde, B.; Barca, D.; Capristo, V. A multidisciplinary approach to the study of underwater artefacts: The caseof a Tritone Barbato marble statue (Grotta Azzurra, Island of Capri, Naples). Per. Mineral. 2013, 82, 101–111. [Google Scholar]
  48. Miriello, D.; Malagodi, M.; Ruffolo, S.A.; La Russa, M.F.; Crisci, G.M.; Pezzino, A.; Galluccio, R.; Barca, D.; Marasco, E. Diagnostic, deterioration and provenance of stone materials from the Jefferson Page tomb (Non-Catholic Cemetery of Rome, Italy). Environ. Earth Sci. 2010, 60, 829–836. [Google Scholar] [CrossRef]
  49. Ricca, M.; La Russa, M.F.; Ruffolo, S.A.; Davidde, B.; Barca, D.; Crisci, G.M. Mosaic marble tesserae from the underwater archaeological site of Baia (Naples, Italy): Determination of the provenance. Eur. J. Mineral. 2014, 26, 323–331. [Google Scholar] [CrossRef]
  50. Ricca, M.; Belfiore, C.M.; Ruffolo, S.A.; Barca, D.; Alvarez De Buergo, M.; Crisci, G.M.; La Russa, M.F. Multi-analytical approach applied to the provenance study of marbles used as covering slabs in the archaeological submerged site of Baia (Naples, Italy): The case of the “Villa con ingresso a protiro”. Appl. Surface Sci. 2015, 357, 1369–1379. [Google Scholar] [CrossRef]
  51. Freestone, I.C. Chemical analysis of “raw” glass fragments. In Excavation of Chartage, The Circular Harbour; Hurst, H.R., Ed.; Oxford University Press: Oxford, UK, 1994; Volume II. [Google Scholar]
  52. Gratuze, B. Etude des Perles Protohistoriques en Verre du Tumulus de Courtesoult (Haute-Saône); IRAMAT, Institute de Recherche sur les Archéomatériaux, Centre Ernest Babelon, CNRS: Orléans, France, 2004. [Google Scholar]
  53. Hellemans, K.; Cagno, S.; Bogana, L.; Janssens, K.; Mendera, M. LA-ICP-MS labels early medieval Tuscan finds from Siena and Donoratico s late natron glass. J. Archaeol. Sci. Rep. 2019, 23, 844–853. [Google Scholar] [CrossRef]
  54. Angelini, I.; Gratuze, B.; Artioli, G. Glass and other vitreous materials through history. EMU Notes Mineral. 2019, 20, 87–150. [Google Scholar]
  55. Fisher, K.; Puchelt, H. Barium. In Handbook of Geochemistry, Elements Kr (36) to Ba (56); Wedepohl, K.H., Ed.; Springer: Berlin, Germany, 2009; pp. 56A1–56O2. [Google Scholar]
  56. Lahlil, S.; Biron, I.; Galoisy, L.; Morin, G. Rediscovering ancient glass technologies through the examination of opacifier crystals. J. Appl. Phys. A Mater. Sci. Process. 2008, 92, 109–116. [Google Scholar] [CrossRef]
Figure 1. (a) Vibo Valentia in Calabria region (Italy); (b) geometric mosaic. The red arrow indicates the entrance; (c) Nereid mosaic; (d,e) details of sampling.
Minerals 09 00729 g001
Figure 2. Generic microphotographs in thin section of stone tesserae from the Nereid mosaic, obtained by polarized optical microscopy: (a) basalt NN1 crossed polars; (b) oolithic limestone NB1; (c) peloidal limestone NB2; (d) marble NB4 crossed polars; (e) detail of marble NB4 crossed polars; (f) microsparitic limestone NRR1.
Minerals 09 00729 g002
Figure 3. Simplified stratigraphic section showing the main outcropping source rocks of the Valentia study area (modified from Caracciolo et al., [41]). Crystalline basement rocks are mainly tonalites; Unit 3 might have acted as source rock for the carbonate sedimentary mosaic tesserae.
Minerals 09 00729 g003
Figure 4. Diagram of maximum grain sizes (MGS) in the NB4 sample compared with bibliographic data about the Mediterranean marbles [45]. Notes: Paros-1 = Parian marble from Stephani; Paros-2(3) = Parian marble from Lefkes; Paros-4 = Parian marble from Karavos; Thasos-2 = Thasian marble from Aliki (Thasos-C); Thasos-3 = Thasian marble from Saliara and Cape Vathy (Thasos-D).
Minerals 09 00729 g004
Figure 5. Backscattered-electron images of accessory phases (quartz, muscovite, Fe-sulphide, apatite, and biotite) in marble tessera NB4. The white bar indicates 10 μm for the upper images and 100 μm for the lower images. Yellow squares indicate the area where analyses were carried out the by electron probe micro-analyzer with energy-dispersive X-ray spectrometry (EPMA/EDS).
Minerals 09 00729 g005
Figure 6. (a) Binary diagram MgO vs K2O. The rectangle within the diagram indicates the area of glasses produced by Natron as a flux. (b) Ternary plot CaO-Na2O-K2O + MgO. The tesserae plot in the area of silica–soda–lime glass typical of the period between the 1st millennium BC and the 1st millennium AD [52,53].
Minerals 09 00729 g006
Figure 7. (a) Binary diagram Cu vs. Sn (log scale); (b) binary diagram Co vs. Ni.
Minerals 09 00729 g007
Figure 8. Sb, Si, Pb distribution map in the NG1 yellow tessera from the Nereid mosaic. The distribution of these elements highlights the presence of lead antimonate Pb2Sb2O7 microcrystals.
Minerals 09 00729 g008
Figure 9. Back-scattered images illustrating the calcium-antimonate opacifying crystals distribution, (a,b) in GBl blue tessera, and (c,d) in NA3 light-blue tessera. In image (c) the red arrow indicates the three holes produced by LA–ICP–MS analyses.
Minerals 09 00729 g009
Table 1. List of the examined tesserae collected in the Nereid and Geometric mosaics sites inside the archaeological area of the S. Aloe quarter in Vibo Valentia.
Stone Tesserae Nereid MosaicOpaque Glass Tesserae Nereid Mosaic
LabelColorTypeLabelColor
NB1WhiteOolithic limestoneNA1, NA2, NA3, NA4Light blue
NB2, NB3WhitePeloidal limestoneNBlBlue
NB4White MarbleNV1, NV4Dark green
NN1, NN2BlackBasalt/andesitic–basaltNV2Light green
NN3 BlackBiomicritic limestoneNV3Green/turquoise
NN4BlackMicrosparitic limestoneNG1Yellow
NRR1PinkishMicrosparitic limestoneOpaque Glass Tesserae Geometric mosaic
NRR2ReddishMicritic limestoneLabelColor
NVR1GreenishMicritic limestoneGBlBlue
---GVGreen
Table 2. Analyses of BCR-2G by USGS * and NIST SRM610 standard glass (in ppm); Std = standard deviation. Comparison between literature data [28] and results from the present study.
BCR-2GNIST-SRM610
Gao et al. [28] This Study (1)Accuracies (2) Gao et al. [28] This Study (1)Accuracies (2)
ConcentrationsStd Concentrations Std ConcentrationsStdConcentrationsStd
Ti 13,005 1081 13,5123633.89 434 9422 11−2.76
V 425 7 4187.7−1.65 442 5453 72.49
Cr 17 2 15.90.2−6.47 404 7412 5 1.98
Mn 1463 23 145624.6−0.48 435 5427 7−1.84
Co 38 1 37.11.4−2.37 405 5417 8 2.96
Cu 18 1 16.70.9−7.22 430 11421 12−2.09
Ni 12.7 0.9 11.90.2−6.30 445 12428 10−3.82
Rb 513 490.6−3.92 431642721−0.93
Sr 3216 3334.93.74 497551974.43
Y 312 301.2−3.23 4507479106.44
Zr 1678 1656.8−1.20 439743416−1.14
Nb 10.90.6 110.90.92 420544365.48
Sn 2.4 0.4 2.30.1−4.17 400 10412 8 3
Sb 0.51 0.87 0.480.03−5.88 377 2738513 2.12
Ba 64114 63512.5−0.94 4256445134.71
Pb 10.90.5 11.30.163.67 4137 442197.02
* USGS = United States Geological Survey. (1) Values determined by LA–ICP–MS. Mean values of 12 determinations; (2) Accuracies were calculated on data from Gao et al. [28].
Table 3. Accessory phases in the Nereid NB4 marble tessera. The analyses were conducted by EPMA/EDS. Concentrations are in wt %.
OxidesQuartzMuscoviteTi-OxideApatiteBiotiteElementsFe-Sulphide
SiO210050.10.8-45.4--
TiO2-1.399.2----
Al2O3-34.5--23.2Fe62.5
FeO----3.4--
MgO-2.0--17.5--
CaO---54.4---
Na2O-0.48-----
K2O-11.6--10.6--
P2O5---44.9---
ClO---0.7---
SO3-----S37.5
Table 4. Major and minor element concentrations in wt % of oxides determined by EPMA/EDS.
SamplesSiO2Al2O3FeOMnOMgOCaONa2OK2OSO3ClOCuOPbOTotal
GV69.72.760.56-0.786.1515.20.810.291.941.84-100
GBl70.03.111.780.760.574.8412.11.500.001.29-3.9699.9
NBl73.32.41--0.646.8813.90.950.201.34-0.42100
NA172.82.370.63-0.708.3212.90.870.181.33--100
NA272.62.51--0.775.8116.20.800.231.08--100
NA372.12.470.67-0.617.2513.41.400.281.78--100
NA473.12.23--0.655.1115.70.980.291.91--100
NV166.62.56--0.695.2017.50.830.282.23-4.09100
NV267.92.41--0.636.9914.80.730.071.55-4.96100
NV369.91.890.56-0.646.1616.41.530.292.71--100
NV466.42.58--0.725.9716.21.820.272.84-3.1499.9
NG165.31.98--0.623.8117.90.800.191.58-7.85100
Table 5. Composition of base glass in wt % of oxides normalized to 100% without CuO and PbO.
SamplesSiO2Al2O3FeOMnOMgOCaONa2OK2OSO3ClO
GV71.02.810.57-0.796.2715.40.830.31.98
GBl72.93.241.850.790.605.0412.61.57-1.34
NBl73.62.43--0.646.9113.90.950.201.34
NA172.82.370.63-0.708.3212.90.870.181.33
NA272.62.51--0.775.8116.20.800.231.08
NA372.12.470.67-0.617.2513.41.400.281.78
NA473.12.23--0.655.1115.70.980.291.91
NV169.42.67--0.725.4218.30.860.32.33
NV271.42.54--0.667.3615.50.770.081.63
NV369.91.890.56-0.646.1616.41.530.292.71
NV468.62.66--0.746.1616.81.880.282.93
NG170.82.15--0.674.1319.40.870.211.71
Table 6. Trace element concentrations in ppm determined by LA–ICP–MS. Each concentration is the average value of three analyses. Std = standard deviation.
ElementsGVStdGBlStdNBlStdNA1StdNA2StdNA3StdNA4StdNV1StdNV2StdNV3StdNV4StdNG1Std
Ti49039.733827.73339.9437724.153123.932722.253422.986525955821.46745677638.380742.1
V18.61.6313.81.1112.80.7513.51.42180.648.060.6013.71.1412.11.1624.51.4113.31.1215.11.3115.30.94
Cr14.71.26151.058.110.63n.d.-n.d. *-59.53.408.200.7722.822.6515.61.7313.31.0110.70.9116.71.51
Mn33142535633514172024.63018197334929813751282441101.38145111151021921255120146672.21768145
Co9.790.83202419596934.612110.01894.4617112.475.93.347.240.588.110.554.480.374.930.339.680.93
Cu17,1891235229391145043.219518.42548241114511221210.6011,164487578930512,716115790164691072.29
Ni18.10.9254.04.0438.22.6210.90.9512.71.2813.90.438.70.619.920.7212.31.089.180.967.960.617.20.65
Rb10.580.894.870.145.740.236.450.1211.80.935.630.527.030.3210.81.2213.90.2012.21.2012.40.588.520.67
Sr37327.329121.83528.724633435425.137132.63246.3441236.648627.041947.942214.82825.14
Y6.380.414.600.426.160.257.860.465.790.516.530.795.350.245.990.577.290.556.040.396.010.164.660.14
Zr45.72.2425.82.0430.30.7335.031.2445.753.9030.31.5448.001.8057.94.29483.31596.7060.13.0257.32.84
Nb1.70.070.820.081.110.101.560.132.090.121.430.081.760.162.280.222.110.191.770.122.110.151.890.13
Sn186512127.12.4723212.261.850.151086.265.350.4616.60.97868958207271878.852818.457465
Sb235681.742,303210325,051232514,494121822,536150226,178145823,509827.54760065329902996084496751440811,2151042
Ba21119.121589.971835.252708.911961.8318719.91619.8317112.32545.3116014.61667.313812.9
Pb11,212102216,810133259603201255.92213810717013.6114269.1922,723238729,27915914621564218781569580942220
* n.d. = not determined.

