Article

Effect of Carbon on the Volume of Solid Iron at High Pressure: Implications for Carbon Substitution in Iron Structures and Carbon Content in the Earth’s Inner Core

1
Geophysical Laboratory, Carnegie Institution of Washington, 5251 Broad Branch Road, N.W., Washington, DC 20015, USA
2
School of Science, Wuhan University of Technology, Wuhan 430070, China
3
Center for Advanced Radiation Sources, University of Chicago, Chicago, IL 60637, USA
*
Author to whom correspondence should be addressed.
Minerals 2019, 9(12), 720; https://doi.org/10.3390/min9120720
Submission received: 15 October 2019 / Revised: 8 November 2019 / Accepted: 16 November 2019 / Published: 20 November 2019
(This article belongs to the Special Issue Mineral Physics—In Memory of Orson Anderson)

Abstract

:
Understanding the effect of carbon on the density of hcp (hexagonal-close-packed) Fe-C alloys is essential for modeling the carbon content in the Earth’s inner core. Previous studies have focused on the equations of state of iron carbides that may not be applicable to the solid inner core that may incorporate carbon as dissolved carbon in metallic iron. Carbon substitution in hcp-Fe and its effect on the density have never been experimentally studied. We investigated the compression behavior of Fe-C alloys with 0.31 and 1.37 wt % carbon, along with pure iron as a reference, by in-situ X-ray diffraction measurements up to 135 GPa for pure Fe, and 87 GPa for Fe-0.31C and 109 GPa for Fe-1.37C. The results show that the incorporation of carbon in hcp-Fe leads to the expansion of the lattice, contrary to the known effect in body-centered cubic (bcc)-Fe, suggesting a change in the substitution mechanism or local environment. The data on axial compressibility suggest that increasing carbon content could enhance seismic anisotropy in the Earth’s inner core. The new thermoelastic parameters allow us to develop a thermoelastic model to estimate the carbon content in the inner core when carbon is incorporated as dissolved carbon hcp-Fe. The required carbon contents to explain the density deficit of Earth’s inner core are 1.30 and 0.43 wt % at inner core boundary temperatures of 5000 K and 7000 K, respectively.

1. Introduction

Carbon (C) has been considered as one of the light elements to account for the density deficit of the Earth’s core based on emerging evidence from cosmological, seismic, geochemical, and mineral physics data [1,2,3,4]. If the Earth’s inner core were crystallized from a carbon-bearing core, either iron (Fe) carbide or Fe with interstitial carbon would be a candidate for the solid inner core. Whether the inner core crystallizes into an Fe carbide or Fe with interstitial carbon phase depends on the eutectic composition at inner core boundary (ICB) as well as the bulk carbon content in the Earth’s core [2,5,6]. For an Fe carbide core, the Fe7C3 phase has been proposed as a leading candidate because its properties at high pressure can reconcile with several seismic observations, including matching the observed density, sound velocity and Poisson’s ratio [4,7,8]. On the other hand, thermodynamic calculations of the Fe-C system at the ICB condition based on experimental data at high pressure suggest that if the bulk carbon content is less than 2.24 wt % in the core, a metallic Fe core with interstitial carbon, instead of Fe carbide, would be expected [2].
Interstitial carbon under solubility limit in its host lattice would not change the crystal structure of the host metal. Although it is still debated that whether Fe in the inner core would be in a body-centered cubic (bcc) [9,10] or hexagonal close-packed structure (hcp), the hcp-Fe is commonly accepted as the stable phase in the core [11,12,13]. The elastic properties of hcp-Fe can also provide a plausible explanation for the observed elastic anisotropy of the inner core [14,15]. The interstitial carbon in Fe would have an effect on the density and elastic properties of Fe at high pressure. Theoretical results show that interstitial carbon in hcp-Fe increases the compressional wave velocity, decreases the shear wave velocity, with enhanced seismic anisotropy. Furthermore, only 1–2.5 wt % of carbon is needed to match the density deficit of the inner core depending on the geotherm profile of the core [16]. However, there have been no experimental data on the effect of carbon on the density and elastic properties of hcp-Fe at high pressure. The current modeling of the Fe-C phase diagram at high pressure assumes that the behavior of carbon in the hcp-Fe structure is similar to that in the bcc- or fcc-Fe [2,5]. Such an assumption needs to be further examined by experiments in the stability field of hcp-Fe. Recent melting experiments on the Fe-C binary system showed that carbon content in the solid Fe remains 1 wt % up to 255 GPa [6]. The authors estimated the density of Fe with 1 wt % carbon by assuming a linear density change between pure Fe, Fe3C and Fe7C3 because of the lack of data on the density of Fe with interstitial carbon. Such a linear interpolation could lead to a large uncertainty in the estimated carbon content.
In this study, we directly determined the density of Fe with dissolved carbon at high pressure to evaluate the relationship between the carbon content and the inner core density deficit. We have determined the equations of state of pure Fe and two Fe-C alloys with 0.31 and 1.37 wt % interstitial carbon up to 135 GPa. The experiments with multiple samples in the same sample chamber under the neon pressure medium provide high precision data that allow systematic evaluation of the carbon effect on the elastic properties and density of hcp-Fe. Using the new data together with previously published thermoelastic parameters for hcp-Fe, we placed constraint on the maximum carbon content in the inner core by comparing the density profiles between our mineral physics model and the seismic observation.

2. Experimental Method

2.1. Sample Synthesis

We used the commercial standard reference materials from National Institute of Standards and Technology (NIST), 19H basic electric steel (Fe with 0.2 wt % carbon, Fe-0.2C) and 5m Cast Iron (Fe with 2.59 wt % carbon, Fe-2.59C), and pure Fe powder (Alfa Aesar, Haverhill, MA, USA, 99.5%) as starting materials for the synthesis of Fe-C alloys with 0.31 wt % carbon (denoted as Fe-0.31C) and 1.37 wt % carbon (denoted as Fe-1.37C). It should be noted that the carbon content in the commercial NIST reference materials were measured in bulk, and they were not homogeneous in the micron scale, which needed further high pressure-temperature treatments. The Fe-0.31C sample was homogenized and sintered from the NIST Fe-0.2C, while Fe-1.37C sample was synthesized from mixed pure Fe and Fe-2.59C with a 1:1 ratio. The starting materials were loaded into an MgO capsule with crushable MgO spacers and sintered using piston cylinder apparatus at 1 GPa and 1150 °C at the Geophysical Laboratory. The temperature was measured with a type-C (W-5%Re vs. W-26%Re) thermocouple for all the experiments. Samples were heated at a rate of 100 °C/min to the set temperature and kept for at least 24 hours to ensure the sample homogeneity.

2.2. Carbon Analytical Procedure

The synthesized samples with a cylinder shape were cut into two pieces using a diamond saw. For each sample, one of the pieces was mounted into resin epoxy and polished with 0.05 µm Al2O3 gel on a lapidary wheel using water as lubricant. After a desirable polished surface was achieved, samples were cleaned using ethanol and then coated with Ir with a thickness of 100 nm. The samples were analyzed using electron probe microanalyzer (EMPA, JEOL 8530F, Akishima, Tokyo) at the Geophysical Laboratory with 12 keV accelerating voltage and 30 nA current. The EMPA is equipped with an LDE6L crystal for high-precision carbon analysis. We also employed cold finger for all the carbon analyses, which reduced the carbon contamination in the vacuum chamber by half compared to that of without cold finger [17,18]. The standards were also coated with Ir with a thickness of 100 nm to keep X-ray absorptions uniform. The on-peak time was 10 second and off-peak time was 5 s for the carbon analysis. NIST pure Fe, synthetic Fe3C (6.7 wt % C) and Fe7C3 (8.43 wt % C) were used as standards for carbon. The typical peak to background ratio for the C Kα was about 14.
The Fe3C standard was synthesized in a piston cylinder apparatus using a half inch assembly with BaCO3 pressure cell, crushable MgO spacers, and graphite furnace at the Geophysical Laboratory. A pure Fe wire ran in presence of excess carbon was loaded in a graphite capsule and kept at 2 GPa and 1200 °C for 51 h. The Fe7C3 standard was synthesized using a multi-anvil apparatus at the University of Michigan [8], with the mixture of fine Fe and excess graphite powers loaded into an MgO capsule and heated to 1200 °C at 14 GPa for 7 h.

2.3. Diamond Anvil Cell and Synchrotron X-ray Diffraction Experiements

For X-ray diffraction (XRD) experiments, high-pressure conditions up to 135 GPa were generated using a symmetric diamond anvil cell (DAC) with a pair of 350 µm flat or 150–250 µm beveled culet diamonds. The bulk samples were cut into pieces with dimensions of approximately 25 µm × 30 µm × 7 µm or 10 µm × 10 µm × 5 µm using a tungsten carbide knife. Rhenium gaskets were pre-indented to a thickness of 40 µm or 25 µm using the opposing diamonds. Holes of 180 µm or 80 µm were drilled in the center of the pre-indented area. Three samples (pure Fe, Fe-0.31C, and Fe-1.37C) were loaded in the sample chamber, separated with spaces filled with neon pressure medium. A small Au flake was also loaded as a pressure calibrant. Neon served as an additional pressure calibrant and a hydrostatic pressure medium [19].
Angle-dispersive synchrotron XRD measurements were performed at 13-IDD GSECARS beamline at the Advanced Photon Source (APS), Argonne National Laboratory (ANL). The incident X-ray beam had a monochromatic wavelength of 0.3344 Å and a full width at half maximum of 5 µm × 5 µm. At each pressure point, the X-ray diffraction images of pure Fe, Fe-0.31C, Fe-1.37C and Au were recorded for an exposure time of 20–50 s. Data were collected at an interval of 1–2 GPa up to 45 GPa for the first run (1st RUN) and 10–15 GPa interval up to 135 GPa for the second run (2nd RUN). The XRD images were integrated using the software Dioptas [20]. The diffraction patterns were analyzed using the Crystallography Data Analysis software (GSAS) [21] to obtain the lattice parameters at different pressures.

3. Results

Iron adopts different packing types upon heating or compression: bcc at ambient condition, fcc upon heating, and hcp upon compression. The speciation of carbon in Fe depends on carbon concentration, pressure, and temperature. The carbon solubility in the bcc-Fe was relatively low compared to that of the case in fcc-Fe due to the large distance between Fe atoms. The maximum carbon solubility in bcc-Fe was less than ~0.022 wt % at ambient pressure and temperature. In fcc-Fe, the maximum carbon solubility was as high as 2.14 wt % at ambient pressure [22], and slightly decreased with increasing pressure [23]. For example, at 1 GPa and 1150 °C, which was the synthesis condition in this study, the maximum carbon dissolved in fcc-Fe is ~2.0 wt %. By a rapid quenching of carbon dissolved fcc-Fe, the carbon stayed in the interstitial site of the lattice to form a bct (body-centered tetragonal) structure, which is a deformed bcc structure [24]. In order to obtain a homogeneous sample with a high carbon concentration, the quenched samples with a bct structure were synthesized and loaded into the diamond anvil cells for further high-pressure experiments. In this study, the results showed that the bct structure transformed to hcp structure at ~14–16 GPa at room temperature, which was slightly higher than the pressure of the bcc to hcp phase transition.
Back scattered electron (BSE) images of our polished samples (Figure S1) showed chemical homogeneity without any quench textures for the entire recovered sample, which was important to extract a tiny sample with the same composition for the DAC experiments. The inhomogeneous samples and samples with quenched texture as shown in BSE images were excluded from further analysis and DAC experiments (Figure S2). We randomly sampled at least 40 points on each sample for the carbon analysis. With the insertion of the cold finger, measurements of the pure Fe standard for carbon always yielded ~0.2 wt % carbon, which was taken as the background and corrected accordingly for the carbon analysis of the alloys. The background corrected counts for the carbon Kα peak showed a linear relationship with the concentrations of carbon in the standards. We used this calibration curve to determine the carbon contents in the samples, yielding 0.31(± 0.03) wt % and 1.37(± 0.06) wt % carbon for the synthesized samples used in the DAC experiments (Figure S1).
We loaded pure Fe, Fe-0.31C, and Fe-1.37C into one sample chamber to obtain high-precision data for comparison. XRD patterns were measured for each sample with a 1–2 GPa interval in the first run. The XRD patterns for the C-bearing samples were consistent with a bct-Fe structure based on peaks broadening comparing to those of pure Fe (Figure 1c). The bct structure was a slightly distorted bcc structure with a diverged c axis. It is usually difficult to measure the c axis from powder diffraction data because of peak overlap [24]. Figure 1a shows the (110) peak of bcc phase for pure Fe (Fe-0C), Fe-0.31C, and Fe-1.37C at 2.3 GPa, which had the highest relative peak intensity in the XRD pattern. In Figure 1a,c, the intensity of each spectrum was normalized to one to better compare the peak shifts. Furthermore, the full XRD patterns are shown in Figure 1c,d. Generally, the peaks shifted to the higher angle side with increasing pressure and reducing lattice parameters. We only calculated the lattice constant a for bct-Fe using (110) and (200) peaks since other peaks used to calculate c axis were difficult to be identified (Figure 1c). At 2.3 GPa, comparing the peak positions of Fe (Fe-0C), Fe-0.31C, and Fe-1.37C, the Fe-1.37C had the smallest a, and Fe-0C—the largest a lattice parameter (Figure 1a). This trend continued up to 14.4 GPa before the hcp phase transition (Figure S3).
We observed the structure transformation in Fe-0C, Fe-0.31C, and Fe-1.37C to hcp structure started at ~16 GPa and was completed at ~20 GPa. Figure 1b shows the (002) and (101) peaks of iron in its hcp structure for Fe-0C, Fe-0.31C and Fe-1.37C at 32.5 Gpa. The (111) peak of solid neon is also shown. We used the neon (111) peak as a primary pressure calibrant above 16 GPa in order to compare the subtle difference in pressure within the sample chamber. With solidification of neon at high pressure, the samples were under a quasi-hydrostatic condition that supports slight deviatoric stress. The measured pressure gradient from the center to the edge within the sample chamber was within 2 GPa at the highest experimental pressure, indicated by the small shift of the neon peaks. In Figure 1b, the slight shift in neon (111) peak among the diffraction patterns of Fe-0C, Fe-0.31C, and Fe-1.37C clearly showed a non-hydrostatic condition in the samples chamber. Fe-1.37C was under the highest pressure (33.1 GPa), and Fe-0C, under the lowest pressure (31.7 GPa). In the meantime, we found that the lattice parameters for hcp-Fe-1.37C were the largest, while the lattice parameters for hcp-Fe-0C were the smallest. The results indicated that the unit cell volume in the hcp structure increased with increasing carbon content under the same pressure (Figure 2a).
Tables S1 and S2 list the compression data for pure Fe, Fe-0.31C and Fe-1.37C in bct and the hcp structure. The pressure vs. volume data for hcp-Fe were used to fit to the third-order Birch–Murnaghan (3BM) equation of state (EoS) [25]:
P = 3 K 0 2 [ ( V 0 V ) 7 3 ( V 0 V ) 5 3 ] { 1 + 3 4 ( K 0 4 ) [ ( V 0 V ) 2 3 1 ] }
where P is the pressure (GPa); V0 and V are the unit-cell volumes (Å3) at ambient conditions and high pressures, respectively; K0 and K0′ are the bulk modulus (GPa) and its pressure derivative at 300 K, respectively. The fitting results for hcp-Fe were shown in Table 1 and the calculated isothermal compression curves for pure Fe, Fe-0.31C and Fe-1.37C in hcp phase are shown in Figure 2.
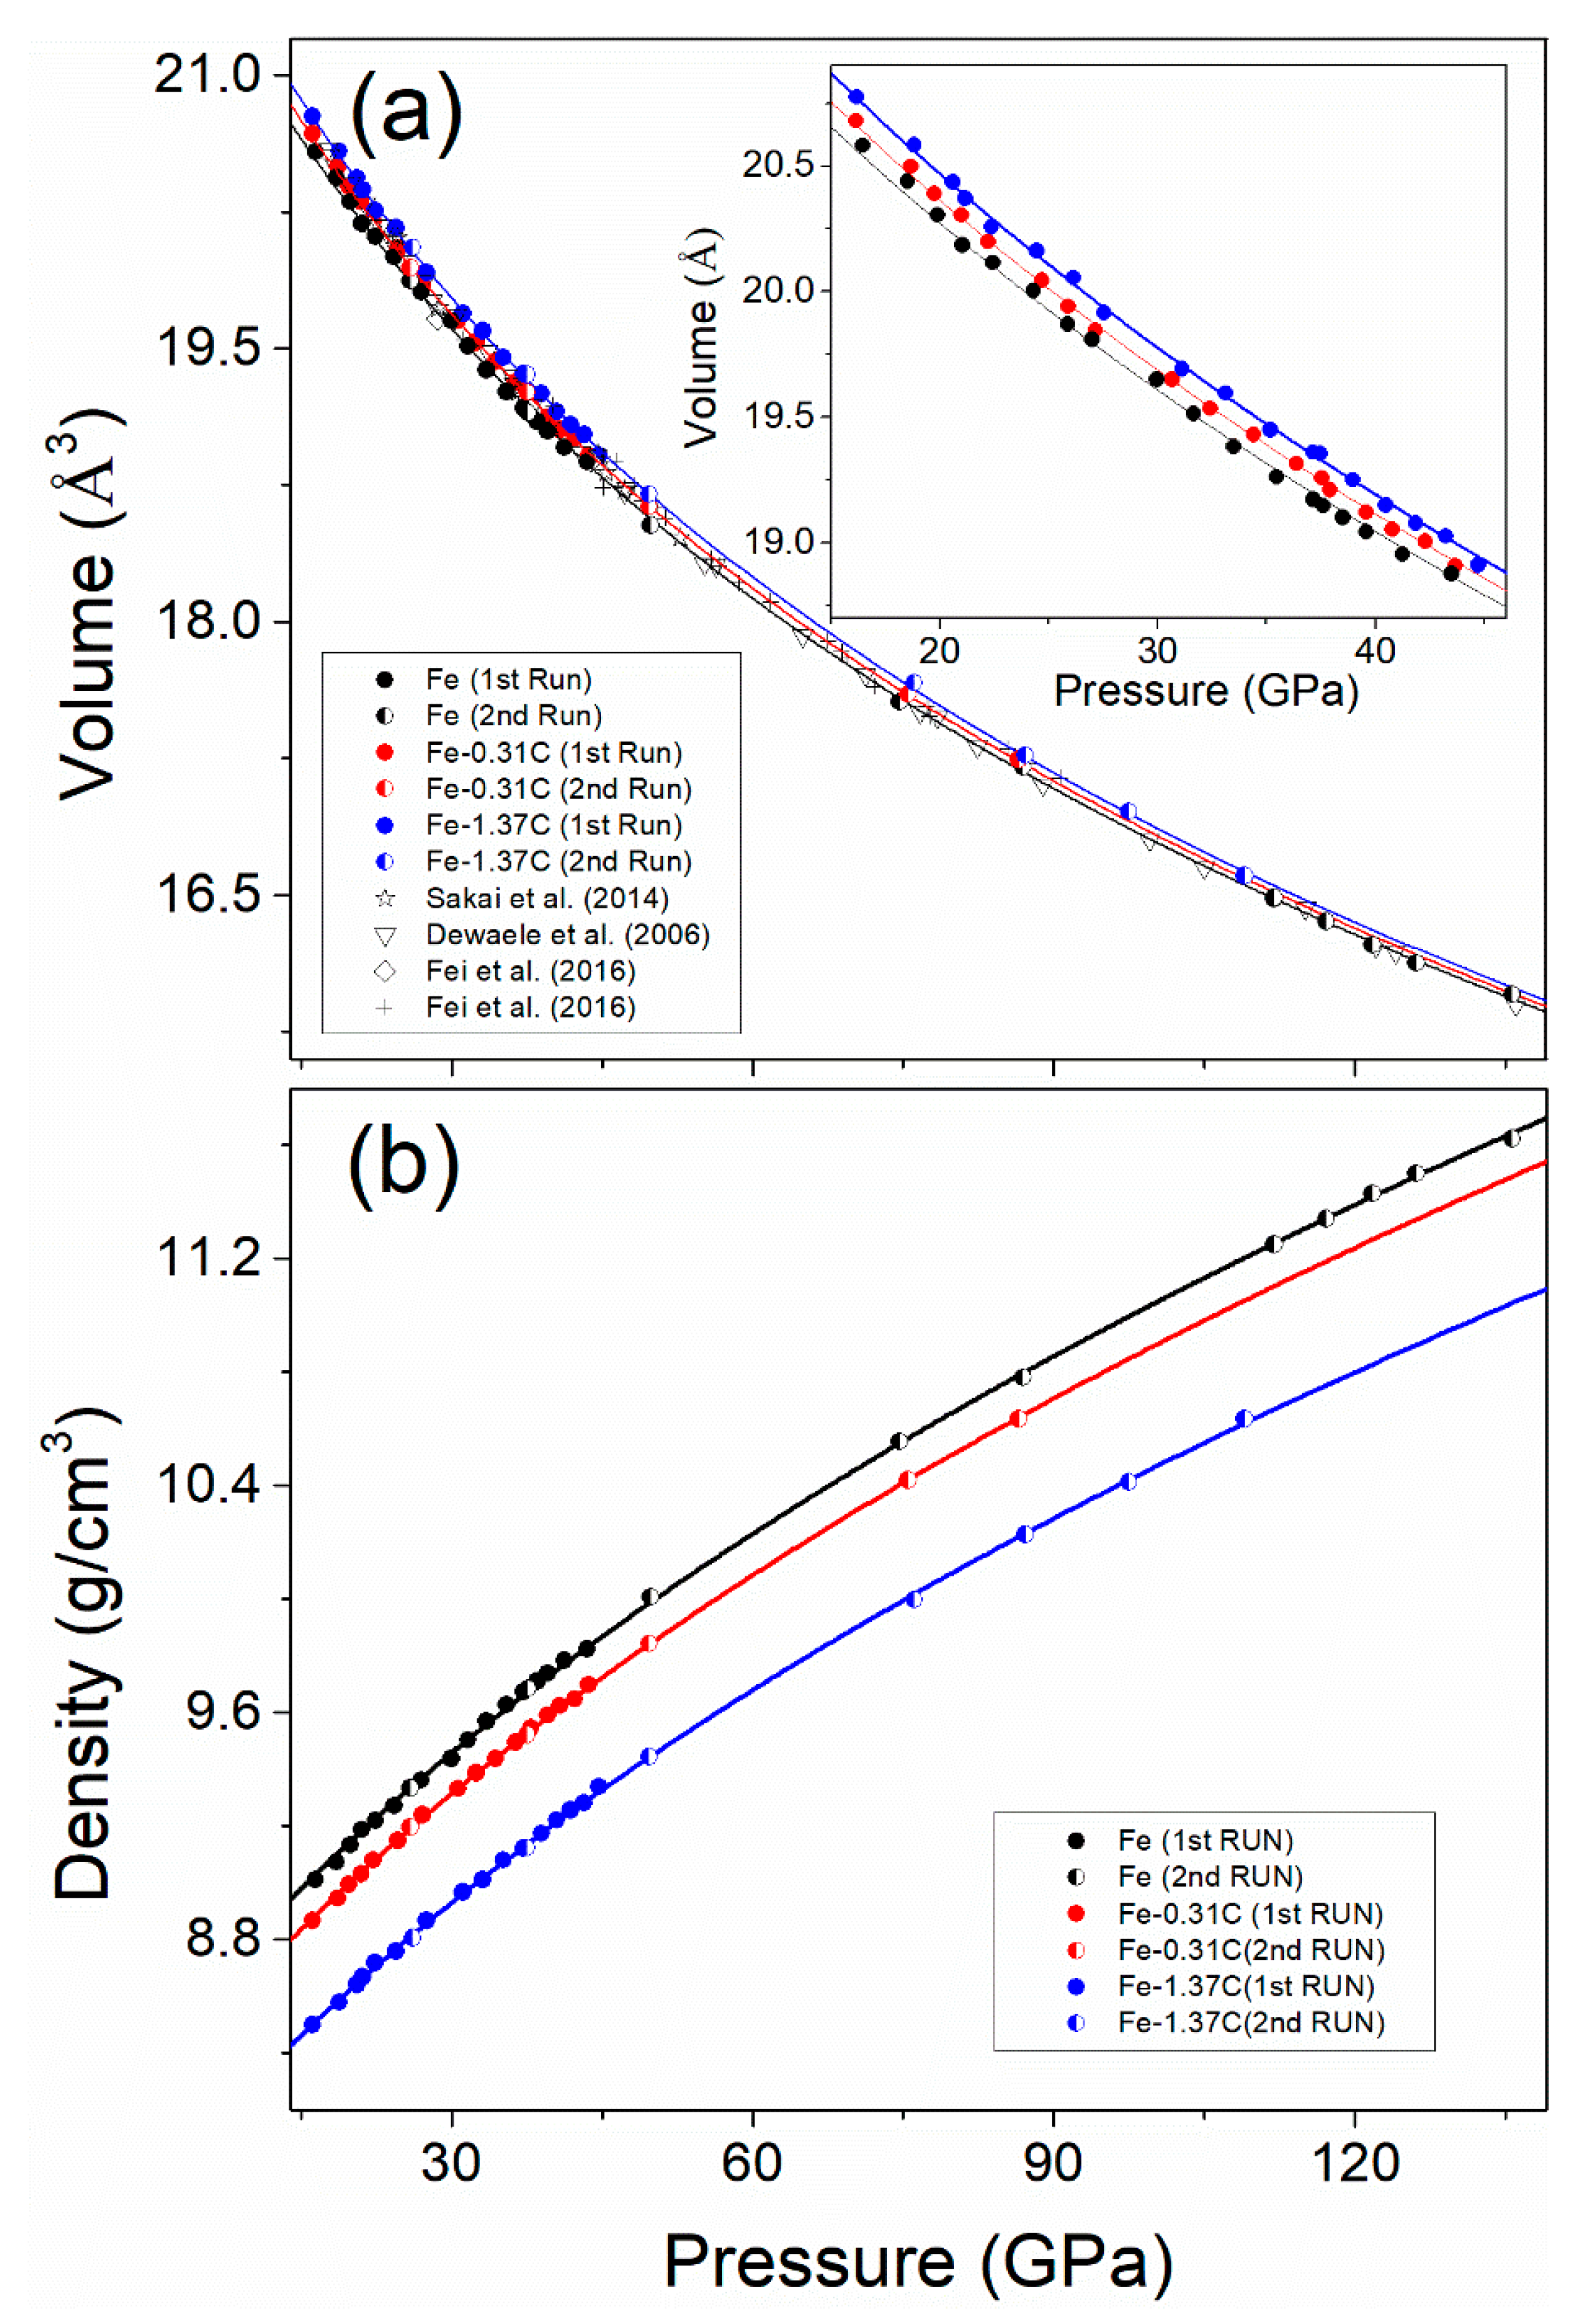
Figure 2a shows the compression curves for hcp-Fe, Fe-0.31C and Fe-1.37C up to ~135 GPa. The trend of PV relation of pure Fe was in a good agreement with selected previous results [26,27,28] up to 135 GPa. The slightly offset of the absolute values of the volume for pure Fe may have been caused by using a different pressure calibrant or pressure medium in each experimental study. Because of the covariance between V0, K0 and K0′, determination of V0 of the high-pressure phase was difficult. In previous experimental studies, V0 differed from 22.15 to 22.43 Å3, K0′ differed from 4.5 to 5.8, and K0 varied from 156 to 202 GPa [26,27,28,29,30,31,32]. Here we used fixed K0′ = 4.79 [27] for EoS fitting to systematically compare the EoS parameters for pure Fe, Fe-0.31C, and Fe-1.37C in this study. The volume at ambient V0 calculated from 3BM EoS is 22.24(4), 22.26(3), and 22.44(3) Å3 for pure Fe, Fe-0.31C and Fe-1.37C, respectively. Without constraining the K0′, we obtained V0 = 22.26(6), K0 = 169.7(5.2) and K0′ = 5.19(16) for pure Fe, V0 = 22.37(4), K0 = 168.9 (4.8) and K0′ = 5.19(14) for Fe-0.31C, and V0 = 20.37(6), K0 = 182.2(4.2) and K0′ = 4.68(17) for Fe-1.37C. The fitting results were summarized in Table 1. The fitting results showed that Fe with more interstitial carbon would have a larger unit cell volume at the same pressure up to ~135 GPa. The magnitude of increase remained the same over the pressure range of the study because the compression curves were almost parallel (Figure 2a). Figure S4 shows the unit cell volumes of the hcp phase at ambient conditions as a function of carbon content. Contrary to the volume–carbon content relation for the bcc phase in previous studies [2], the unit cell volume of hcp-Fe increased with increasing carbon content. This is the first experimental determination of the effect of carbon on the volume in the hcp structure that invalidates the common assumption that hcp and bcc iron have similar effect with respect to the interstitial carbon on the unit cell volume [2] as shown in Figure S4. The assumption may have significant effect on the calculated phase relations in the Fe-C system at high pressure, particularly in terms of the carbon solubility at very high pressure.
The effect of interstitial carbon on the density is critical to estimate the carbon content in the Earth’s inner core. The density as a function of pressure for hcp-Fe-C alloys are shown in Figure 2b. The results show that the density of Fe with 1.37 wt % of carbon was 5.6% smaller than that of the pure Fe with hcp structure. Due to the volume expansion, interstitial carbon in the hcp structure enhanced the density contrast between the pure iron and Fe-C alloy. First principle calculations using the projector augmented wave (PAW) method also showed a density decrease with additional interstitial carbon in the Fe lattice. Huang et al. (2005) reported that the density of Fe with 1.3 wt % of carbon was 8.7% smaller than that of the pure Fe [33], while others yielded a smaller density decrease [16,34]. For example, Caracas (2017) showed that 1 wt % added carbon would decrease the density of hcp-Fe by about 2.8%, while Li et al. (2018) showed that density of Fe with 1.4 wt % carbon dropped by 2.4% [16,34].

4. Discussion

4.1. Carbon Substitution Mechanism

As shown in the BSE images as well as the EMPA results (Figure S1), the carbon concentration in Fe samples was distributed homogenously, which indicated no other carbon-bearing phases existing in these samples. Thus, the carbon atoms added into Fe must be as an either interstitial or substitutional solid solution, which mostly depends on the atomic size factor. The interstitial solid solution is commonly found in Fe at ambient conditions because the atomic radius of Fe is ~1.7 times larger than the radius of carbon atoms. Carbon atoms fill the holes in the Fe lattice, occupying either octahedral sites (O-sites) or tetrahedral sites (T-sites) [22]. It has been suggested that interstitial carbon energetically prefers to occupy the O-sites in bcc-Fe instead of T-site at ambient conditions [38], where the O-site is nearly twice larger than the T-site. Upon compression, the carbon atom may change its atomic environment in order to become energetically favorable. Theoretical calculations show that when the pressure exceeds 300 GPa, the interstitial carbon atoms in bcc-Fe energetically occupy the T-site instead of the O-site [33], which, however, has not been validated by experiments yet. Changing of the carbon occupancy-site may result in a change of physical properties of the carbon-bearing host. For example, carbon atoms would exert tensile strains on the surrounding crystal lattice to contract the lattice if the carbon atoms occupy the holes that are larger than atomic radius of the carbon atoms; conversely, if the carbon atoms are larger than the holes of the host Fe, the carbon atoms would impose compressive strains in their vicinity, which would expand the volume of the lattice [22]. Increasing interstitial carbon content results in a decrease in unit-cell volume of bcc-Fe [2], which is consistent with the metallurgy study [22]. In this study, we showed that carbon expands both the a-axis and c-axis as well as the unit-cell volume of the hcp-Fe. The experimental results in this study, for the first time, revealed that carbon in hcp-Fe and bcc-Fe have an opposite effect on molar volume. The results may imply a change in the local environment for carbon atoms. One explanation could be that the carbon atoms enter the smaller T-site in hcp-Fe upon compression, resulting in the expansion of the unit cell because of the imposed compressive strains in the vicinity.
Another explanation for the carbon-induced volume change in hcp-Fe is that carbon atoms substitute the Fe atoms to form a substitutional solid solution instead of an interstitial solid solution. The substitutional solid solution commonly occurs in Fe-Si alloys. Both theoretical and experimental results show that Fe-Si alloys with hcp structure always have a larger unit-cell volume comparing to that of the pure hcp-Fe [39,40]. On the other hand, theoretical calculation shows that the hcp phase containing ∼6 at. % of substitutional carbon becomes more stable than that with the same amount of interstitial carbon at pressures above 280 GPa [33]. However, there is no report for the volume difference between the interstitial and substitutional carbon-bearing hcp-Fe. Further experimental analysis to detect the local environment of carbon in hcp-Fe have to be done to better understand the substitution mechanism of carbon in the hcp-Fe at high pressure.
Interstitial atoms in solid Fe would lock the dislocation movements and enhance the strength of the solid Fe, which has been extensively studied in the steel industry [41]. The ability of a metal to plastically deform depends on the ability of dislocations to move. In bcc-Fe, increasing interstitial carbon content increases the hardness and strength of the Fe in the carbon content range of 0.35–1.86 wt %. Both tensile and compressive strain field interactions between dislocations and interstitial atoms result in the restriction of dislocation movements. The environmental change of carbon in Fe, due to the phase transition from bcc to hcp could affect the movement of the dislocation, which would have significant implications for the deformation of Earth’s inner core. Thus, further studies on the flow of dislocation for Fe with interstitial or substitutional carbon at high pressure would be necessary for the interpretation of the seismic anisotropy of Earth’s interior.

4.2. Anisotropic Axial Compressibility in the hcp-Fe Phase

As shown in Figure 3a, the axial compression data for a and c axes were fitted by the modified Birch–Murnaghan EoS equations:
P = 3 K x 2 [ ( x 0 x ) 7 ( x 0 x ) 5 ] { 1 + 3 2 ( K x 4 ) [ ( x 0 x ) 2 1 ] }
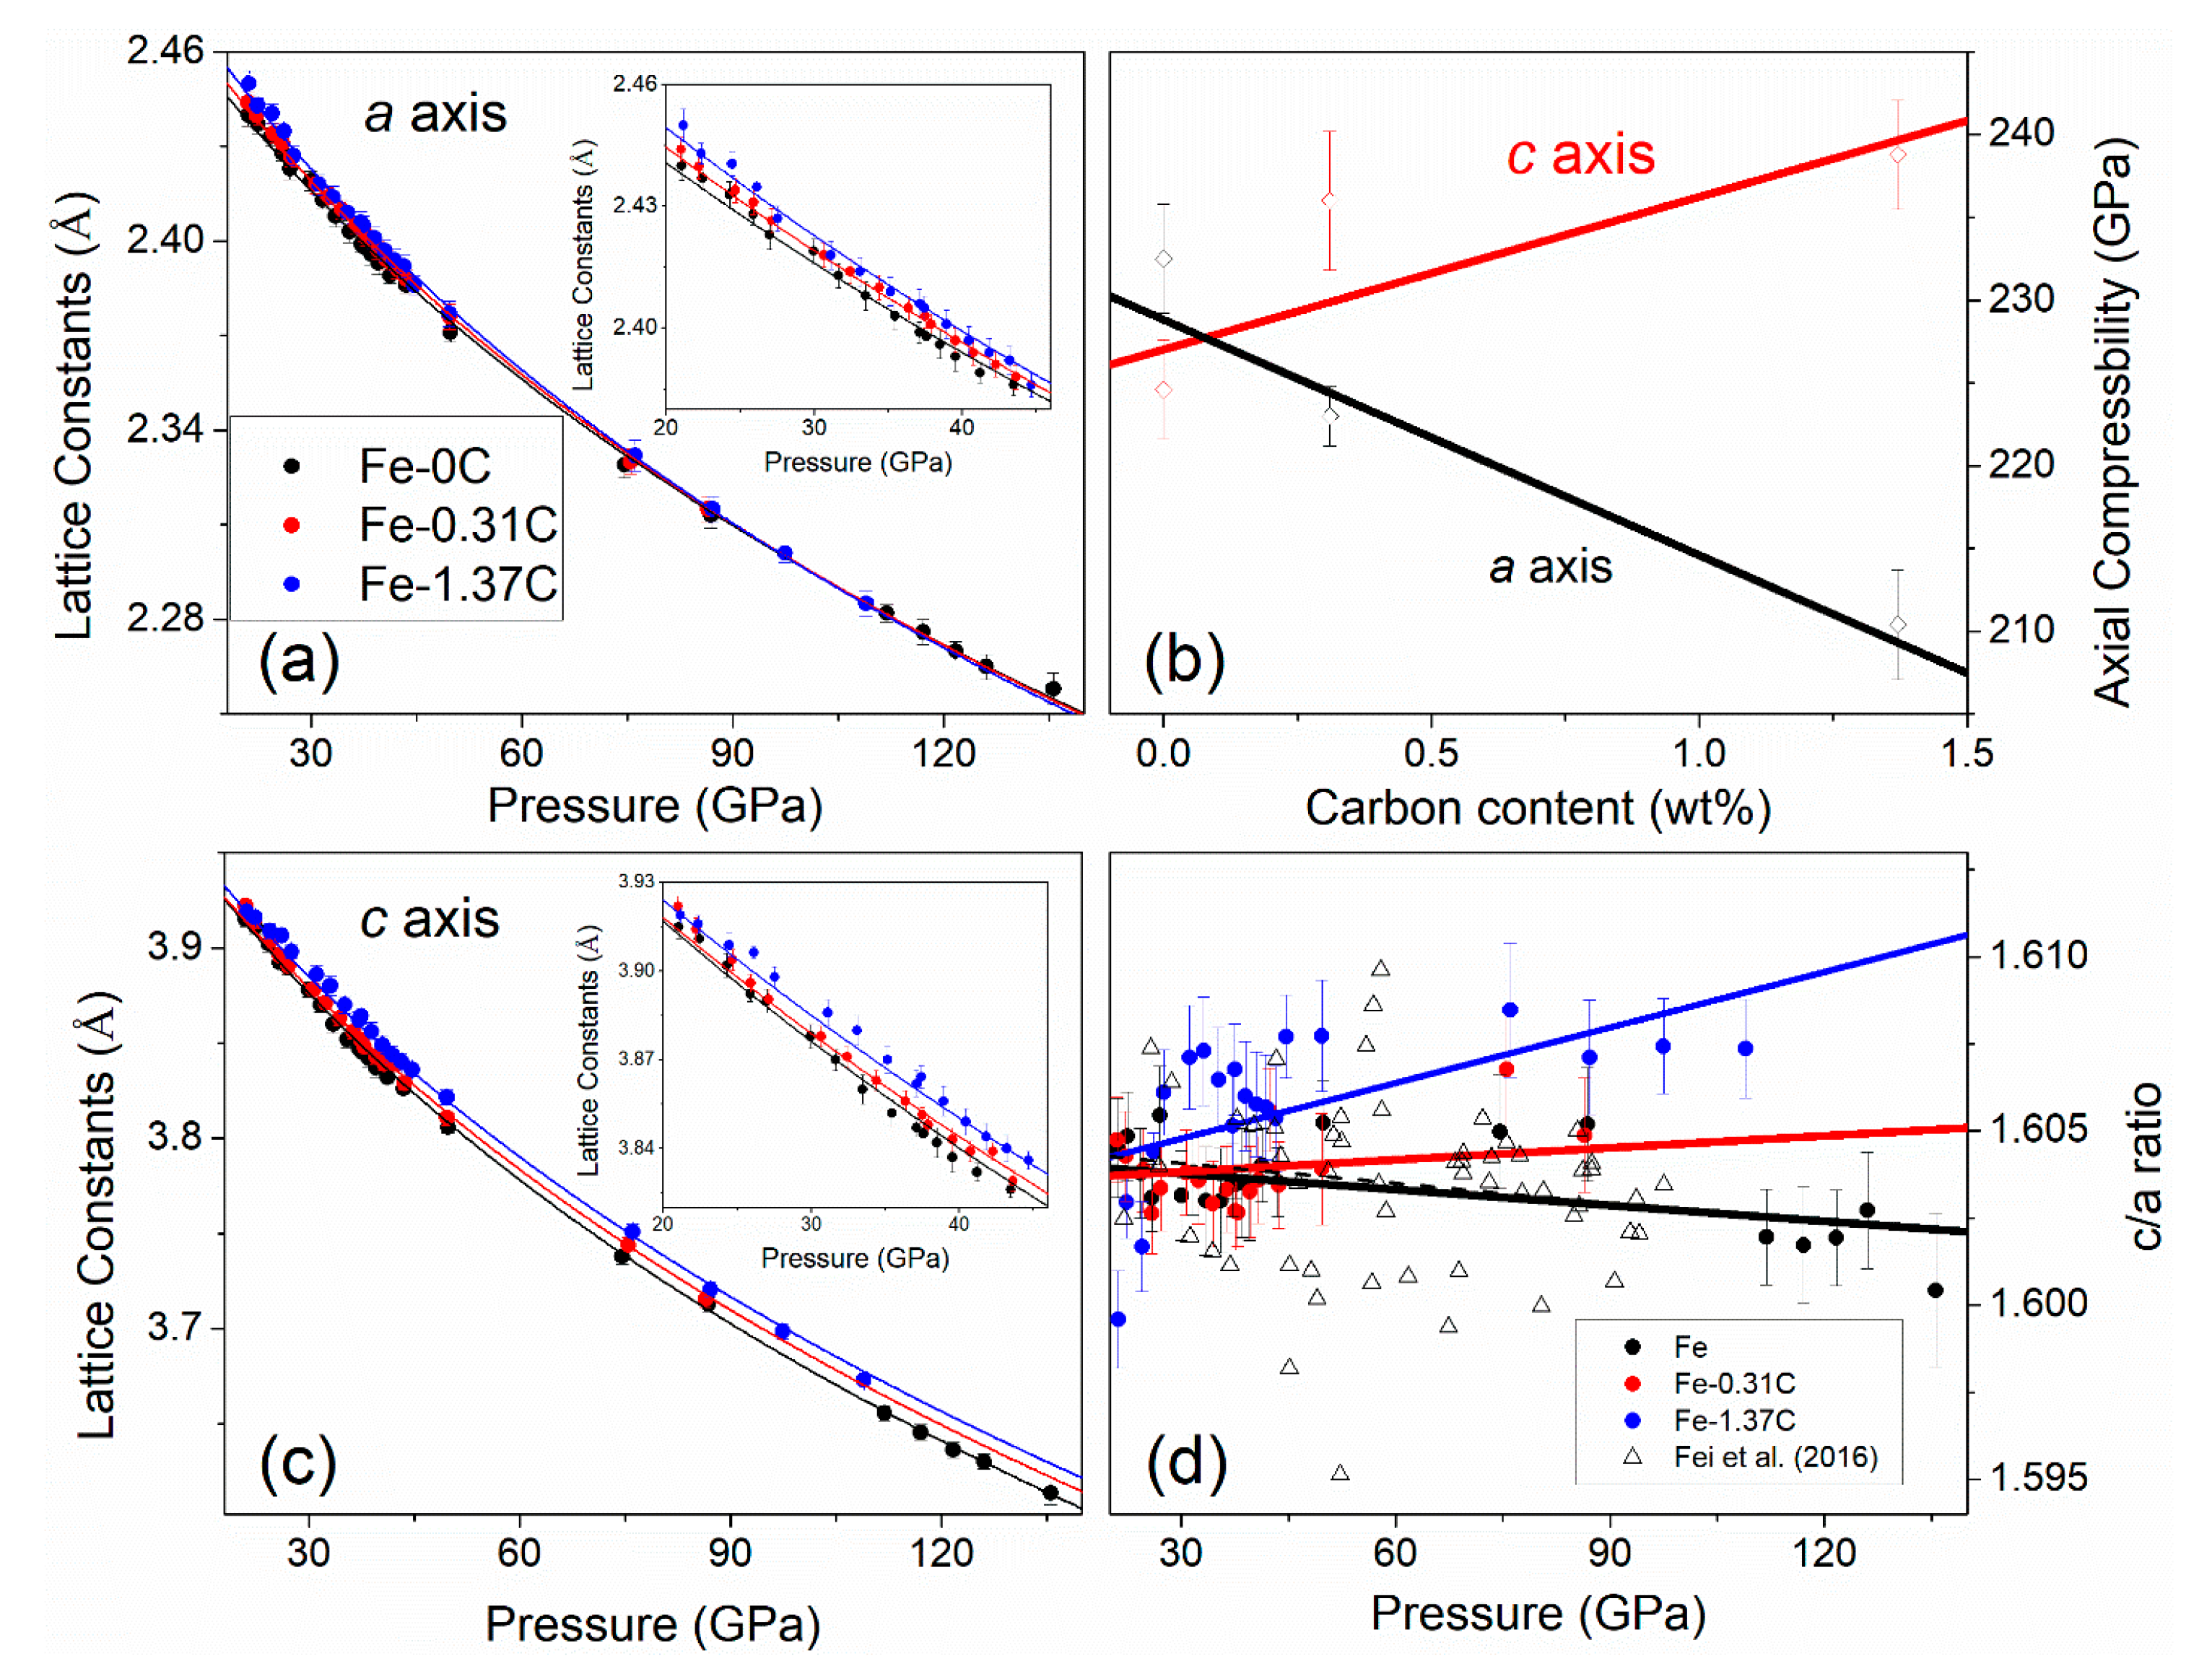
where x0 and x represent the lattice constant a or c (Å) at ambient and high-pressure conditions, Kx and K x represent the axis compressibility (GPa) and its pressure derivative at 300 K, respectively. To avoid the tradeoff between K x and K x , we fixed K x at 4 in order to compare the K x systematically with carbon effects. The fitting yielded Ka for Fe-0C, Fe-0.31C and Fe-1.37C were 232.5(3.6), 223.0(2.7) and 210.4(3.7) GPa, respectively. The result showed that the a axis becomes more compressible with the increasing carbon content. For the c axis, the fitting yielded Kc for Fe-0C, Fe-0.31C and Fe-1.37C was 224.6(3.3), 236.0(4.8) and 238.8(3.9) GPa, respectively, indicating that Fe-1.37C had the least compressible c axis and Fe-0C had the most compressible c axis (Figure 3b). The results showed that the alloying carbon can increase the anisotropy of the hcp-Fe crystal structure.
It has been observed that strong seismic anisotropy exists in the Earth’s inner core, with longitudinal waves travelling ~3% faster along the polar axis than in the equatorial plane [42], which can be attributed to the preferred orientation of hcp-Fe with strong single-crystal elastic anisotropy. The question is widely debated on whether the a axis or c axis of hcp-Fe is parallel to the Earth’s equatorial plane. Some studies reported that preferential alignment of the a axis of hcp-Fe in the equatorial plane is the most plausible explanation for the observed compressional wave travel time anomalies or seismic anisotropy in the inner core [43,44]. However, polycrystalline plasticity simulations for pure hcp-Fe found that initially random polycrystal become preferentially oriented with their c axes parallel to the equatorial plane, which can explain the observed seismic anisotropy [45]. Our results showed that Ka > Kc for pure Fe with the a axis being 3.4% less compressible than the c axis, which is also consistent with previous theoretical calculations with C11 < C33 for hcp-Fe since C11 and C33 associated purely with compressional stresses and strains along the a and c axis, respectively [35]. With increasing carbon content to 1.37 wt %, the axial compressibility reversed to Kc > Ka with the c axis being 13.5% less compressible than the a axis, indicating that interstitial carbon in hcp-Fe could affect the direction of fast travelling waves in the Earth’s inner core. It implied that if Fe with interstitial carbon presents in the Earth’s core, the crystals preferentially oriented with the a axis parallel to the equatorial plane would reconcile the seismic observation, which behaves in an opposite way compared to that of the pure Fe. On the other hand, carbon can enhance seismic anisotropy as increasing carbon content (Figure 2b) with the fastest axis of compressional wave velocity propagation along the c axis. This contradicts the theoretical calculations, which showed that the fastest axis of compressional wave velocity propagation tilted away from the c axis of Fe [16]. Further experiments should investigate the deformation mechanism in the hcp-Fe with interstitial carbon and the effects of interstitial substituted carbon on the seismic anisotropy in the Earth’s core to resolve the contradiction.
The c/a axial ratio of preferentially aligned crystals of hcp-Fe can be also related to the anisotropy of the Earth’s inner core [46]. In theoretical calculations, the c/a axial ratio serves as an input to calculate the elastic moduli or to model the core anisotropy, which has previously been done in the case of pure hcp-Fe [35,36]. Previous studies have shown that the c/a ratio in hcp-Fe is closely related to pressure, temperature, and composition, which always increases with increasing temperature, but this effect is strongest at low pressure, and becomes weaker with increasing pressure. Some studies reported a trend of the c/a ratio of hcp-Fe decreasing with increasing pressure [26,27,28,31], while others observed a weak trend or even no trend [32,47,48,49]. The value of c/a ratio typically ranges from 1.60 to 1.61 over experimental pressures. Our results show that the c/a ratio for pure Fe was ~1.600–1.605 with a decreasing trend up to 135 GPa (Figure 3d), which is consistent with some of the previous studies. There have been studies on the effect of light elements on the c/a ratio of the hcp-Fe [46]. For example, adding 2.8 mol % sulfur to Fe-Ni alloy lowers the c/a ratio by ~0.005 [50]. In this study, it has been observed that carbon also has an effect on the c/a ratio of the hcp-Fe. The c/a ratio for Fe-0.31C and Fe-1.37C is ~1.603–1.607 and 1.607 to 1.610, respectively, and adding 1.37 wt % of carbon in the hcp-Fe would increase the c/a ratio by 0.005–0.007 at high pressures. The experimentally determined c/a ratio for pure Fe, Fe-0.31C and Fe-1.37C as a function of pressure has been linearly fitted to examine the pressure effect (Figure 3d). The results show that contrary to pure Fe, the c/a ratio of Fe-C had an increasing trend with increasing pressure, which implied an enhanced anisotropy of hcp-Fe with increasing carbon content.

4.3. Density Deficit of Earth’s Inner Core

Incorporation of carbon in metallic iron can significantly reduce the density of hcp-Fe, providing a solution for the observed density deficit of the core if carbon is the dominant light element in the Earth’s core. Due to the limited pressure and temperature range of the experimental data, thermoelastic modelling and extrapolation are needed to determine the carbon effect on the density under core conditions. Using the derived elastic moduli, the density of the hcp-Fe, Fe-0.31C, and Fe-1.37C at 300 K together with previously determined thermoelastic parameters, we can model the density of carbon-bearing Fe along an adiabatic geotherm by determining the thermal pressures based on the Debye model:
P t h =   P     P 300 K = γ v i b V 300 T C V , v i b d T + γ e V 300 T C V e d T
where P300K is the reference pressure at 300 K from this study, V is the unit cell volume (Å3), γ v i b is the vibrational Grüneisen parameter, γ e is the electronic Grüneisen parameter, C V , v i b is the vibrational specific heat ( Jkg 1 K 1 ) and C V e is the electronic specific heat ( Jkg 1 K 1 ). Because there are no measured thermoelastic parameters for carbon-bearing hcp-Fe, we adopted the parameters (Table S3) from the pure hcp-Fe derived from combined static PVT data up to 200 GPa and 1795 K [27] and dynamic Hugoniot data [51] for the calculations. To test the reliability of the modelling, we calculated the density profile for pure-Fe along the adiabatic geotherm with a fixed ICB temperature of 6000 K (TICB = 6000 K), which is comparable to that reported by Fei et al. (2016) within the experimental uncertainties [27] (Figure 4). The calculated density profile for Fe-1.37C plotted below that of the Preliminary Reference Earth Model (PREM) for the inner core, indicating that less than 1.37 wt % carbon in the inner core was required to explain the density deficit.
With the established pressure–density relations for pure Fe, Fe-0.31C and Fe-1.37C along the geotherm with the fixed TICB of 5000, 6000 and 7000 K, we can estimate the carbon content that can reconciled the density deficit in the Earth’s inner core depending on the thermal profile of the core. Using the Debye thermoelastic model (f) as described in Equation (3), we calculated the density of pure Fe ( d F e ), Fe-0.31C ( d F e - 0.31 C ), and Fe-1.37C ( d F e - 1.37 C ) as a function of pressure alone the geotherm:
d F e = f F e ( P ,   T ) ,
d F e - 0.31 C = ( 1 0.31 % ) d F e + 0.31 % Δ d 0.31 ,
d F e - 1.37 C = ( 1 1.37 % ) d F e + 1.37 % Δ d 1.37
where Δ d 0.31 and Δ d 1.37 represent density deviation from the density profile of pure Fe for Fe-0.31C and Fe-1.37C, respectively, which represent the carbon effect on the density of hcp-Fe. Using the PREM density profile ( d P R E M ) as the constraint, we performed least-squares regression to determine the carbon content through:
d P R E M = ( 1 x ) d F e + x Δ d x
where x is the predicted carbon content in the Earth inner core. The results yielded the carbon content x = 1.30(8)% with TICB = 5000 K, x = 0.95(5)% with TICB = 6000 K, and x = 0.43(13)% with TICB = 7000 K, which provided the best match to the density profile of PREM at inner core condition (Figure 4). Our results showed that on the basis of density constraint alone, incorporation of 0.43–1.30 wt % carbon in the inner core is sufficient to account for the inner core density deficit depending on the thermal profile. Previous results on the melting of Fe-C binary system showed that the carbon solubility in the solid Fe would remain a constant value of 1 wt % up to 255 GPa [6]. If this is the case and carbon is the only light element in the Earth’s inner core, ~6000 K would be a good estimation of the inner core boundary temperature.
Considering the carbon partitioning between liquid and solid Fe, D C l i q u i d / s o l i d 2 , in the Fe-C binary system at inner core boundary conditions [2], the outer core would contain ~0.86–2.60 wt % carbon based solely on partitioning data. The determined carbon content in the outer core would be less than the recently determined eutectic composition of Fe-C system, which is 3 wt % carbon at the inner core boundary [6]. Thus, we would expect a hcp-Fe phase with dissolved carbon instead of Fe carbide crystallize at the inner core boundary. Previous studies have suggested that 1.7–3.8 wt % carbon is necessary to account for the density deficit [52,53] in the Earth’s outer core, which is comparable with our estimations for the carbon content in the Earth’s outer core. The amount of carbon would be reduced if other light elements also exist in the inner core. Sound velocity could provide additional constraint on the carbon content in the core. Theoretical calculations show that interstitial carbon increases compressional seismic wave velocity, while decreases shear wave velocity [16]. On the other hand, Li et al. (2018) inferred that the decreasing sound velocities and density of hcp-Fe with dissolved carbon cannot simultaneously match PREM, which has not been validated experimentally [34]. Thus, the sound velocity measurement of hcp-Fe with dissolved carbon, not only iron carbides, at high pressures would be essential for understanding the role of carbon in the solid inner core.

Supplementary Materials

The following are available online at https://www.mdpi.com/2075-163X/9/12/720/s1, Figure S1: Carbon analysis for recovered Fe-C samples by electron microprobe; Figure S2: Back scattered electron images for unsuccessful synthesis runs; Figure S3: The length of lattice constant a as a function of pressure for Fe, Fe-0.31C, and Fe-1.37C; Figure S4: Unit cell volume of bcc- and hcp-Fe as a function of carbon content at ambient condition; Table S1: Compression data for pure-Fe, Fe-0.31C and Fe-1.37C in bct structure using Au as the pressure calibrant; Table S2: Compression data for pure-Fe, Fe-0.31C and Fe-1.37C in hcp phases using Ne as the pressure calibrant; Table S3: Thermoelastic parameters used for modeling the density of hcp-Fe, Fe-0.31C and Fe-1.37C along an adiabatic geotherm with TICB = 5000, 6000 and 7000 K.

Author Contributions

Conceptualization, J.Y. and Y.F.; methodology, J.Y., Y.F., E.G. and V.B.P.; formal analysis, J.Y. and X.H.; writing, J.Y. and Y.F.; all authors contribute review and editing.

Funding

This work was funded by an National Science Foundation (NSF) grant (EAR-1619868 to Y.F.). GSECARS was supported by the National Science Foundation (EAR-0622171) and U.S. Department of Energy (DE-FG02-94ER14466) under contract DE-AC02-06CH11357. APS was supported by Department of Energy Basic Energy Sciences Program (DOE-BES), under contract DE-AC02-0611357.

Acknowledgments

The authors thank Zhixue Du for their assistance with the X-ray diffraction experiments at 13ID-D, GSECARS. The authors also thank Megan Duncan and Emma Bullock for their guidance of carbon analysis.

Conflicts of Interest

The authors declare no conflict of interest.

References

  1. Buchwald, V.F. Handbook of Iron Meteorites: Their History, Distribution, Composition, and Structure; University of California Press: Berkeley, CA, USA, 1975. [Google Scholar]
  2. Fei, Y.; Brosh, E. Experimental study and thermodynamic calculations of phase relations in the Fe–C system at high pressure. Earth Planet. Sci. Lett. 2014, 408, 155–162. [Google Scholar] [CrossRef]
  3. Wood, B.J. Carbon in the core. Earth Planet. Sci. Lett. 1993, 117, 593–607. [Google Scholar] [CrossRef]
  4. Prescher, C.; Dubrovinsky, L.; Bykova, E.; Kupenko, I.; Glazyrin, K.; Kantor, A.; McCammon, C.; Mookherjee, M.; Nakajima, Y.; Miyajima, N. High Poisson’s ratio of Earth’s inner core explained by carbon alloying. Nat. Geosci. 2015, 8, 220. [Google Scholar] [CrossRef]
  5. Lord, O.; Walter, M.; Dasgupta, R.; Walker, D.; Clark, S. Melting in the Fe–C system to 70 GPa. Earth Planet. Sci. Lett. 2009, 284, 157–167. [Google Scholar] [CrossRef]
  6. Mashino, I.; Miozzi, F.; Hirose, K.; Morard, G.; Sinmyo, R. Melting experiments on the Fe–C binary system up to 255 GPa: Constraints on the carbon content in the Earth’s core. Earth Planet. Sci. Lett. 2019, 515, 135–144. [Google Scholar] [CrossRef]
  7. Chen, B.; Li, Z.; Zhang, D.; Liu, J.; Hu, M.Y.; Zhao, J.; Bi, W.; Alp, E.E.; Xiao, Y.; Chow, P. Hidden carbon in Earth’s inner core revealed by shear softening in dense Fe7C3. Proc. Natl. Acad. Sci. USA 2014, 111, 17755–17758. [Google Scholar] [CrossRef]
  8. Liu, J.; Li, J.; Ikuta, D. Elastic softening in Fe7C3 with implications for Earth’s deep carbon reservoirs. J. Geophys. Res. Solid Earth 2016, 121, 1514–1524. [Google Scholar] [CrossRef]
  9. Belonoshko, A.B.; Ahuja, R.; Johansson, B. Stability of the body-centred-cubic phase of iron in the Earth’s inner core. Nature 2003, 424, 1032. [Google Scholar] [CrossRef]
  10. Belonoshko, A.B.; Lukinov, T.; Fu, J.; Zhao, J.; Davis, S.; Simak, S.I. Stabilization of body-centred cubic iron under inner-core conditions. Nat. Geosci. 2017, 10, 312. [Google Scholar] [CrossRef]
  11. Tateno, S.; Hirose, K.; Ohishi, Y.; Tatsumi, Y. The structure of iron in Earth’s inner core. Science 2010, 330, 359–361. [Google Scholar] [CrossRef]
  12. Mao, H.-k.; Shu, J.; Shen, G.; Hemley, R.J.; Li, B.; Singh, A.K. Elasticity and rheology of iron above 220 GPa and the nature of the Earth’s inner core. Nature 1998, 396, 741. [Google Scholar] [CrossRef]
  13. Stixrude, L.; Cohen, R. High-pressure elasticity of iron and anisotropy of Earth’s inner core. Science 1995, 267, 1972–1975. [Google Scholar] [CrossRef] [PubMed]
  14. Karato, S.-I. Inner core anisotropy due to the magnetic field—Induced preferred orientation of iron. Science 1993, 262, 1708–1711. [Google Scholar] [CrossRef] [PubMed]
  15. Song, X. Anisotropy of the Earth’s inner core. Rev. Geophys. 1997, 35, 297–313. [Google Scholar] [CrossRef]
  16. Caracas, R. The influence of carbon on the seismic properties of solid iron. Geophys. Res. Lett. 2017, 44, 128–134. [Google Scholar] [CrossRef]
  17. Dasgupta, R.; Walker, D. Carbon solubility in core melts in a shallow magma ocean environment and distribution of carbon between the Earth’s core and the mantle. Geochim. Cosmochim. Acta 2008, 72, 4627–4641. [Google Scholar] [CrossRef]
  18. Robaut, F.; Crisci, A.; Durand-Charre, M.; Jouanne, D. Practical aspects of carbon content determination in carburized steels by EPMA. Microsc. Microanal. 2006, 12, 331–334. [Google Scholar] [CrossRef]
  19. Fei, Y.; Ricolleau, A.; Frank, M.; Mibe, K.; Shen, G.; Prakapenka, V. Toward an internally consistent pressure scale. Proc. Natl. Acad. Sci. USA 2007, 104, 9182–9186. [Google Scholar] [CrossRef]
  20. Prescher, C.; Prakapenka, V.B. DIOPTAS: A program for reduction of two-dimensional X-ray diffraction data and data exploration. High Press. Res. 2015, 35, 223–230. [Google Scholar] [CrossRef]
  21. Toby, B.H. EXPGUI, a graphical user interface for GSAS. J. Appl. Crystallogr. 2001, 34, 210–213. [Google Scholar] [CrossRef]
  22. Callister, W.D.; Rethwisch, D.G. Materials Science and Engineering: An Introduction; John Wiley & Sons: New York, NY, USA, 2007; Volume 7. [Google Scholar]
  23. Walker, D.; Dasgupta, R.; Li, J.; Buono, A. Nonstoichiometry and growth of some Fe carbides. Contrib. Mineral. Petrol. 2013, 166, 935–957. [Google Scholar] [CrossRef]
  24. Lu, Y.; Yu, H.; Cai, X.; Rong, Y.; Sisson, R.D. Martensite lattice parameter measured by modern X-ray Diffraction in Fe-C alloy. In Proceedings of the 23rd International Federation of Heat Treatment and Surface Engineering Congress (IFHTSE 2016), Savannah, GA, USA, 18–21 April 2016. [Google Scholar]
  25. Birch, F. Finite elastic strain of cubic crystals. Phys. Rev. 1947, 71, 809. [Google Scholar] [CrossRef]
  26. Sakai, T.; Takahashi, S.; Nishitani, N.; Mashino, I.; Ohtani, E.; Hirao, N. Equation of state of pure iron and Fe0.9Ni0.1 alloy up to 3 Mbar. Phys. Earth Planet. Inter. 2014, 228, 114–126. [Google Scholar] [CrossRef]
  27. Fei, Y.; Murphy, C.; Shibazaki, Y.; Shahar, A.; Huang, H. Thermal equation of state of hcp-iron: Constraint on the density deficit of Earth’s solid inner core. Geophys. Res. Lett. 2016, 43, 6837–6843. [Google Scholar] [CrossRef]
  28. Dewaele, A.; Loubeyre, P.; Occelli, F.; Mezouar, M.; Dorogokupets, P.I.; Torrent, M. Quasihydrostatic equation of state of iron above 2 Mbar. Phys. Rev. Lett. 2006, 97, 215504. [Google Scholar] [CrossRef] [PubMed]
  29. Boehler, R.; Santamaría-Pérez, D.; Errandonea, D.; Mezouar, M. Melting, density, and anisotropy of iron at core conditions: New X-ray measurements to 150 GPa. J. Phys. Conf. Ser. 2008, 121, 022018. [Google Scholar] [CrossRef]
  30. Dubrovinsky, L.; Saxena, S.; Tutti, F.; Rekhi, S.; LeBehan, T. In situ X-ray study of thermal expansion and phase transition of iron at multimegabar pressure. Phys. Rev. Lett 2000, 84, 1720. [Google Scholar] [CrossRef]
  31. Yamazaki, D.; Ito, E.; Yoshino, T.; Yoneda, A.; Guo, X.; Zhang, B.; Sun, W.; Shimojuku, A.; Tsujino, N.; Kunimoto, T. P-V-T equation of state for ε-iron up to 80 GPa and 1900 K using the Kawai-type high pressure apparatus equipped with sintered diamond anvils. Geophys. Res. Lett. 2012, 39. [Google Scholar] [CrossRef]
  32. Mao, H.; Wu, Y.; Chen, L.; Shu, J.; Jephcoat, A.P. Static compression of iron to 300 GPa and Fe0.8Ni0.2 alloy to 260 GPa: Implications for composition of the core. J. Geophys. Res. Solid Earth 1990, 95, 21737–21742. [Google Scholar] [CrossRef]
  33. Huang, L.; Skorodumova, N.; Belonoshko, A.B.; Johansson, B.; Ahuja, R. Carbon in iron phases under high pressure. Geophys. Res. Lett. 2005, 32. [Google Scholar] [CrossRef]
  34. Li, Y.; Vočadlo, L.; Brodholt, J.P. The elastic properties of hcp-Fe alloys under the conditions of the Earth’s inner core. Earth Planet. Sci. Lett. 2018, 493, 118–127. [Google Scholar] [CrossRef]
  35. Steinle-Neumann, G.; Stixrude, L.; Cohen, R.E. First-principles elastic constants for the hcp transition metals Fe, Co, and Re at high pressure. Phys. Rev. B 1999, 60, 791. [Google Scholar] [CrossRef] [Green Version]
  36. Vočadlo, L.; Dobson, D.P.; Wood, I.G. Ab initio calculations of the elasticity of hcp-Fe as a function of temperature at inner-core pressure. Earth Planet. Sci. Lett. 2009, 288, 534–538. [Google Scholar] [CrossRef]
  37. Sha, X.; Cohen, R. First-principles thermal equation of state and thermoelasticity of hcp Fe at high pressures. Phys. Rev. B 2010, 81, 094105. [Google Scholar] [CrossRef] [Green Version]
  38. Williamson, G.; Smallman, R. X-ray evidence for the interstitial position of carbon in α-iron. Acta Crystallogr. 1953, 6, 361–362. [Google Scholar] [CrossRef] [Green Version]
  39. Komabayashi, T.; Pesce, G.; Morard, G.; Antonangeli, D.; Sinmyo, R.; Mezouar, M. Phase transition boundary between fcc and hcp structures in Fe-Si alloy and its implications for terrestrial planetary cores. Am. Mineral. J. Earth Planet. Mater. 2019, 104, 94–99. [Google Scholar] [CrossRef]
  40. Fischer, R.A.; Campbell, A.J.; Caracas, R.; Reaman, D.M.; Heinz, D.L.; Dera, P.; Prakapenka, V.B. Equations of state in the Fe-FeSi system at high pressures and temperatures. J. Geophys. Res. Solid Earth 2014, 119, 2810–2827. [Google Scholar] [CrossRef]
  41. Goldschmid, H.J. Interstitial Alloys; Springer: Berlin, Germany, 2013. [Google Scholar]
  42. Morelli, A.; Dziewonski, A.M.; Woodhouse, J.H. Anisotropy of the inner core inferred from PKIKP travel times. Geophys. Res. Lett. 1986, 13, 1545–1548. [Google Scholar] [CrossRef]
  43. Lincot, A.; Merkel, S.; Cardin, P. Is inner core seismic anisotropy a marker for plastic flow of cubic iron? Geophys. Res. Lett. 2015, 42, 1326–1333. [Google Scholar] [CrossRef] [Green Version]
  44. Antonangeli, D.; Merkel, S.; Farber, D.L. Elastic anisotropy in hcp metals at high pressure and the sound wave anisotropy of the Earth’s inner core. Geophys. Res. Lett. 2006, 33. [Google Scholar] [CrossRef]
  45. Buffett, B.; Wenk, H.-R. Texturing of the Earth’s inner core by Maxwell stresses. Nature 2001, 413, 60. [Google Scholar] [CrossRef] [PubMed]
  46. Fischer, R.A.; Campbell, A.J. The axial ratio of hcp Fe and Fe–Ni–Si alloys to the conditions of Earth’s inner core. Am. Mineral. 2015, 100, 2718–2724. [Google Scholar] [CrossRef]
  47. Jephcoat, A.P.; Mao, H.; Bell, P.M. Static compression of iron to 78 GPa with rare gas solids as pressure-transmitting media. J. Geophys. Res. Solid Earth 1986, 91, 4677–4684. [Google Scholar] [CrossRef]
  48. Ma, Y.; Somayazulu, M.; Shen, G.; Mao, H.-K.; Shu, J.; Hemley, R.J. In situ X-ray diffraction studies of iron to Earth-core conditions. Phys. Earth Planet. Inter. 2004, 143, 455–467. [Google Scholar] [CrossRef]
  49. Ono, S.; Kikegawa, T.; Hirao, N.; Mibe, K. High-pressure magnetic transition in hcp-Fe. Am. Mineral. 2010, 95, 880–883. [Google Scholar] [CrossRef]
  50. Sakai, T.; Ohtani, E.; Kamada, S.; Terasaki, H.; Hirao, N. Compression of Fe88.1Ni9.1S2.8 alloy up to the pressure of Earth’s inner core. J. Geophys. Res. Solid Earth 2012, 117. [Google Scholar] [CrossRef]
  51. Brown, J.; Fritz, J.; Hixson, R. Hugoniot data for iron. J. Appl. Phys. 2000, 88, 5496–5498. [Google Scholar] [CrossRef]
  52. Nakajima, Y.; Imada, S.; Hirose, K.; Komabayashi, T.; Ozawa, H.; Tateno, S.; Tsutsui, S.; Kuwayama, Y.; Baron, A.Q. Carbon-depleted outer core revealed by sound velocity measurements of liquid iron–carbon alloy. Nat. Commun. 2015, 6, 8942. [Google Scholar] [CrossRef] [Green Version]
  53. Morard, G.; Andrault, D.; Antonangeli, D.; Nakajima, Y.; Auzende, A.; Boulard, E.; Cervera, S.; Clark, A.; Lord, O.; Siebert, J. Fe–FeO and Fe–Fe3C melting relations at Earth’s core–mantle boundary conditions: Implications for a volatile-rich or oxygen-rich core. Earth Planet. Sci. Lett. 2017, 473, 94–103. [Google Scholar] [CrossRef] [Green Version]
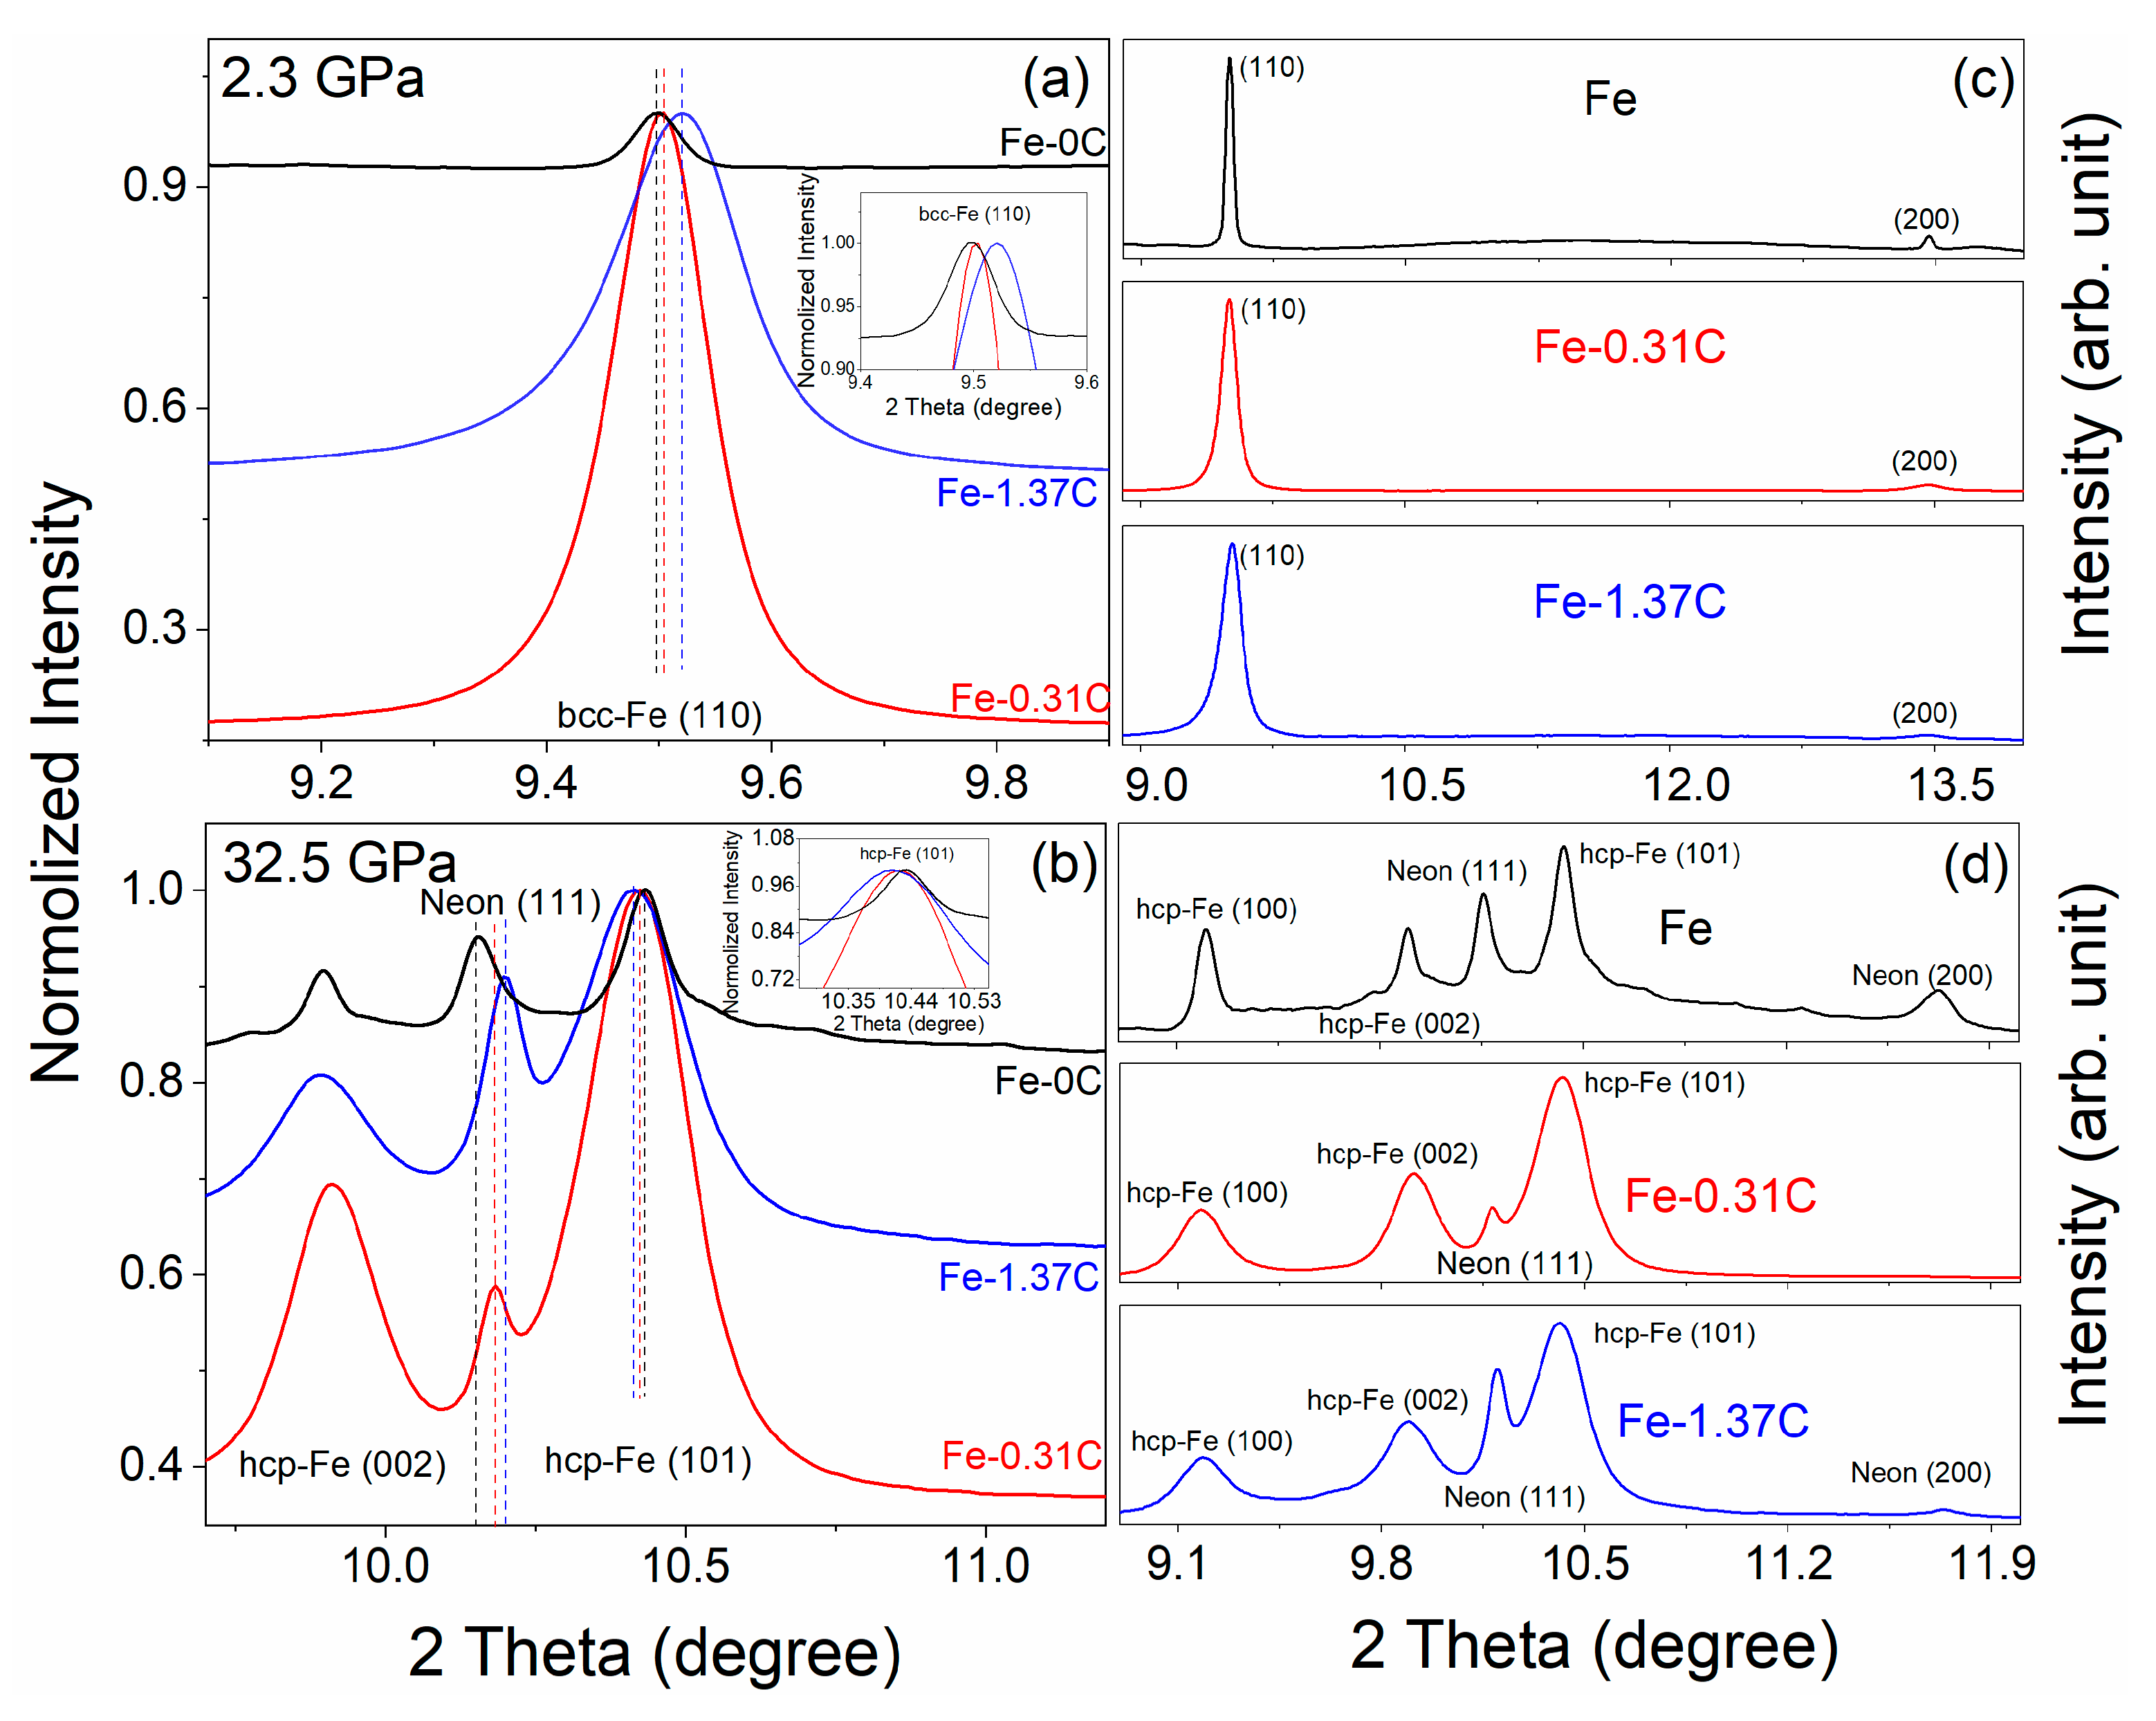
Figure 1. Representative X-ray diffraction (XRD) patterns for Fe-C samples in (a,c) selected peaks and full XRD patterns of the body-centered tetragonal (bct) structure at 2.3 GPa and (b,d) selected peaks and full XRD pattern of hcp structure at 32.5 GPa, using Au as first-order pressure calibrant. Insert in (a) shows the zoom-in of the (110) peak of body-centered cubic (bcc)-Fe and (b) zoom-in of (101) and (002) peaks of hcp-Fe. Fe-0C (pure Fe), Fe-0.31C, Fe-1.37C, and Au are loaded in the same sample chamber using neon as the pressure medium. Black, red and blue curves are for Fe-0C, Fe-0.31C and Fe-1.37C, respectively. Neon (111) peak shift in each pattern for Fe-0C, Fe-0.31C and Fe-1.37C under 32.5 GPa indicates non-hydrostatic pressure in the sample chamber, with Fe-0C under lowest pressure, and Fe-1.37C under highest pressure. Vertical dash lines are plotted to show the center of each peak and for comparison of peak shift.
Minerals 09 00720 g001
Figure 2. Compression curves for Fe-C samples. (a) Pressure and volume relation (PV) of hcp-Fe with 0, 0.31 and 1.37 wt % of carbon; (b) pressure and density relation (Pρ) of hcp-Fe with 0, 0.31 and 1.37 wt % of carbon. Au was used as the pressure calibrant below 15 GPa, while neon peaks were used as the pressure calibrant above 15 GPa. Solid symbols represent data from the 1st RUN and half-open symbols represent data from the 2nd RUN; the PV and Pρ relations were fitted using a third-order Birch–Murnaghan equation of state using combined data from 1st and 2nd RUN; black, red and blue curves are for Fe-0C, Fe-0.31C and Fe-1.37C, respectively.
Minerals 09 00720 g002
Figure 3. Compression of lattice constants a and c of the hcp-Fe with 0, 0.31 and 1.37 wt % of carbon. (a,c) The lattice constants of the a and c axes as a function of pressure; the experimental data were fitted by modified Birch–Murnaghan equation of state (EoS, see text for more detail); black, red and blue curves are for Fe-0C, Fe-0.31C and Fe-1.37C, respectively; inserts in (a,c) shows the zoomed plots from 20–45 GPa collected from 1st RUN; (b) the axial compressibility as function of carbon content; lines are linearly fitting of the data; (d) c/a ratio of hcp-Fe with 0, 0.31, and 1.37 wt % of carbon as a function of pressure; lines in (b,d) are linear fittings of the data.
Minerals 09 00720 g003
Figure 4. The calculated densities of hcp-Fe with 0, 0.31 and 1.37 wt % of carbon along the adiabatic geotherm with fixed temperatures of 5000, 6000 and 7000 K at the inner core boundary (TICB), compared with density profile of the core from PREM. Black, red and blue solid lines represent the density profile of pure Fe, Fe-0.31C and Fe-1.37C, respectively. The grey shaded area represents the propagated uncertainties for extrapolated density. The green line is the literature data for pure Fe along the adiabatic geotherm with a fixed temperature of 6000 K at the inner core boundary (Fei et al., 2016 [27]). The orange line represents the density profile of PREM seismic model. The dashed magenta line represent the modeled densities of Fe contains 1.30(7) 0.95 (5) and 0.43(10) wt % carbon at 5000, 6000, and 7000 K of TICB that can reconcile the density profile of the PREM.
Minerals 09 00720 g004
Table 1. Elastic parameters for hcp-structure of Fe and Fe-C alloys in this and previous studies.
CompositionsV03)ρ (g/cm3)K0 (GPa)K0
This study
Fe22.24(4)8.392187.3(1.3)4.79(fixed)
Fe22.26(6)8.332169.7(5.2)5.19(16)
Fe-0.31C22.26(3)8.242182.8(1.0)4.79(fixed)
Fe-0.31C22.37(4)8.197168.9(4.8)5.19(14)
Fe-1.37C22.44(3)7.881177.6(1.2)4.79(fixed)
Fe-1.37C20.37(6)7.895182.2(4.2)4.68(17)
Calculation (Fe)
Non-magnetic, Steinle-Neumann et al., (1999) [35]20.459.0692924.4
Steinle-Neumann et al., (1999) [35]21.108.7902095.2
Vočadlo et al., (2009) [36]20.86(4)8.891237.8(4)4.8
Non-magnetic, Huang et al., (2005) [33]20.529.03852894.46
Non-magnetic, Sha and Cohen (2010) [37]20.189.1912964.4
Calculation (Fe-1.3C)
Huang et al., 2005 [33]21.468.2542914.34
Experiments (Fe)
Fei et al. (2016) [27]22.427(fixed)8.270(fixed)172.7(1.4)4.79
Fei et al. (2016) [27]22.1858.360(24)191.4(5.3)4.52(8)
Yamazaki et al. (2012) [31]22.158.373202(7)4.5(2)
Mao et al. (1990) [32]22.35(2)8.298165(4)5.33(90)
Dubrovinsky et al. (2000) [30]22.408.280156(4)5.81
Boehler et al. (2008) [29]22.46(4)8.258160(6)5.6(2)
Dewaele et al. (2006) [28]22.438.269165(fixed)4.97(4)