Article

The Source, Distribution, and Sedimentary Pattern of K-Rich Brines in the Qaidam Basin, Western China

1
Key Laboratory of Comprehensive and Highly Efficient Utilization of Salt Lake Resources, Qinghai Institute of Salt Lakes, Chinese Academy of Sciences, Xining 810008, China
2
Qinghai Provincial Key Laboratory of Geology and Environment of Salt Lakes, Xining 810008, China
3
University of Chinese Academy of Sciences, Beijing 100049, China
*
Authors to whom correspondence should be addressed.
Minerals 2019, 9(11), 655; https://doi.org/10.3390/min9110655
Submission received: 23 August 2019 / Revised: 17 October 2019 / Accepted: 24 October 2019 / Published: 25 October 2019

Abstract

:
Potash plays an important role in agricultural production. The Qaidam Basin (QB) in western China is a typical inland evaporite basin, which contains an abundance of K-rich brines, including shallow brines (i.e., surface brines and intercrystalline brines) in salt lakes and deep brines (i.e., pore brines and oilfield brines) in the strata. Significant studies on these brines have been reported; however, the integrated studies on sources of K, its distribution, and the sedimentary pattern of the two brine types are still inadequate. In this study, the K+ concentrations of sixty-four intercrystalline brines from the Qarhan Salt Lake (QSL), the largest playa in the QB, are presented. After combining those results with the major ionic compositions of river waters and deep K-rich brines, and the K+ concentrations of shallow brines in the QB, we concluded that: (1) The K of brines in the QSL is mainly from the high–flux K input by rivers which gain K from silicate weathering, while the “ancient Qaidam Lake” contributed little K to the QSL; (2) the large K flux supplied by rivers, the appropriate concentration degree, and the mixing of river waters and spring waters, cooperatively account for the highest K concentrations of brines in the QSL in the QB. The different river K recharges in different sections and isolated depressions are responsible for uneven K+ concentrations of brines in the QSL. (3) The deep brines are mainly distributed in the western QB. The K source of pore brines is from the interaction of pore water with the overlying evaporite layer. While the K in oilfield brines may be meteoric water, salt dissolution, the mixing of hydrothermal fluids, and the conversion of clay minerals to K-feldspar may consume K in the oilfield brines.

1. Introduction

Potassium (K) is an indispensable element for biological organisms [1]. Potash (a potassium compound) contains potassium in a water-soluble form and is used as chemical feedstock and in agricultural fertilizers [2]. Most of the giant potash deposits in the world exist in marine basins, such as the Saskatchewan potash deposit in Canada [3] and the potash deposit in the Zechstein Basin in Germany [2], while few are in the continental basins.
The Qaidam Basin (QB) in western China (Figure 1) is a typical terrestrial evaporite basin, which contains 28 saline lakes and playas with an area of ~30,000 km2. Over the past several decades, many efforts have been directed toward investigating valuable elements (K, B, Li, etc.) [4,5,6,7,8,9] and evaluating the resource exploitation potential of salt lakes [10,11,12,13]. An abundance of shallow, K-rich brines, including the surface brines and intercrystalline brines, occur in these salt lakes (Figure 1 and Figure 2), making the QB the largest potash fertilizer production base in China at present. In recent years, geological explorations have also reported that deep K-rich brines, including pore brines and oilfield brines, exist in the western QB (Figure 1 and Figure 2) [13,14,15,16,17,18,19,20,21], which are of great importance for the future supply of potash fertilizers in China. All these shallow (including surface brines and intercrystalline brines) and deep brines (including pore brines and oilfield brines) in the QB have reached up to the industrial requirements (K+ > 1.5 g/L for brines) in China [22]. Similarly, K reserves in the deep brines (pore brines and oilfield brines) are comparable to those of shallow brines (surface brines and intercrystalline brines) in the QB (Figure 3b); therefore, both these brines in the QB have great exploitation prospects. However, integrated studies and reviews focusing on the sources of K, and the distribution and sedimentary pattern of K-rich brines occurring in salt lakes and strata in the whole QB, are inadequate.
Here, sixty-four intercrystalline brines from the Qarhan Salt Lake (QSL) were collected and analyzed for the K+ concentrations. Combining those results with the major ionic compositions of 102 river waters, 12 pore brines, and 54 oilfield brines, and the K+ concentrations of 13 surface brines and 42 intercrystalline brines from different salt lakes in the QB, this study aimed to (i) identify the fluxes and sources of K in the brines, and (ii) elucidate the distribution and sedimentary pattern of different types of K-rich brines in the QB. This study is important for understanding the formation of potash deposits in terrestrial evaporite basins.

2. Description of the Study Area

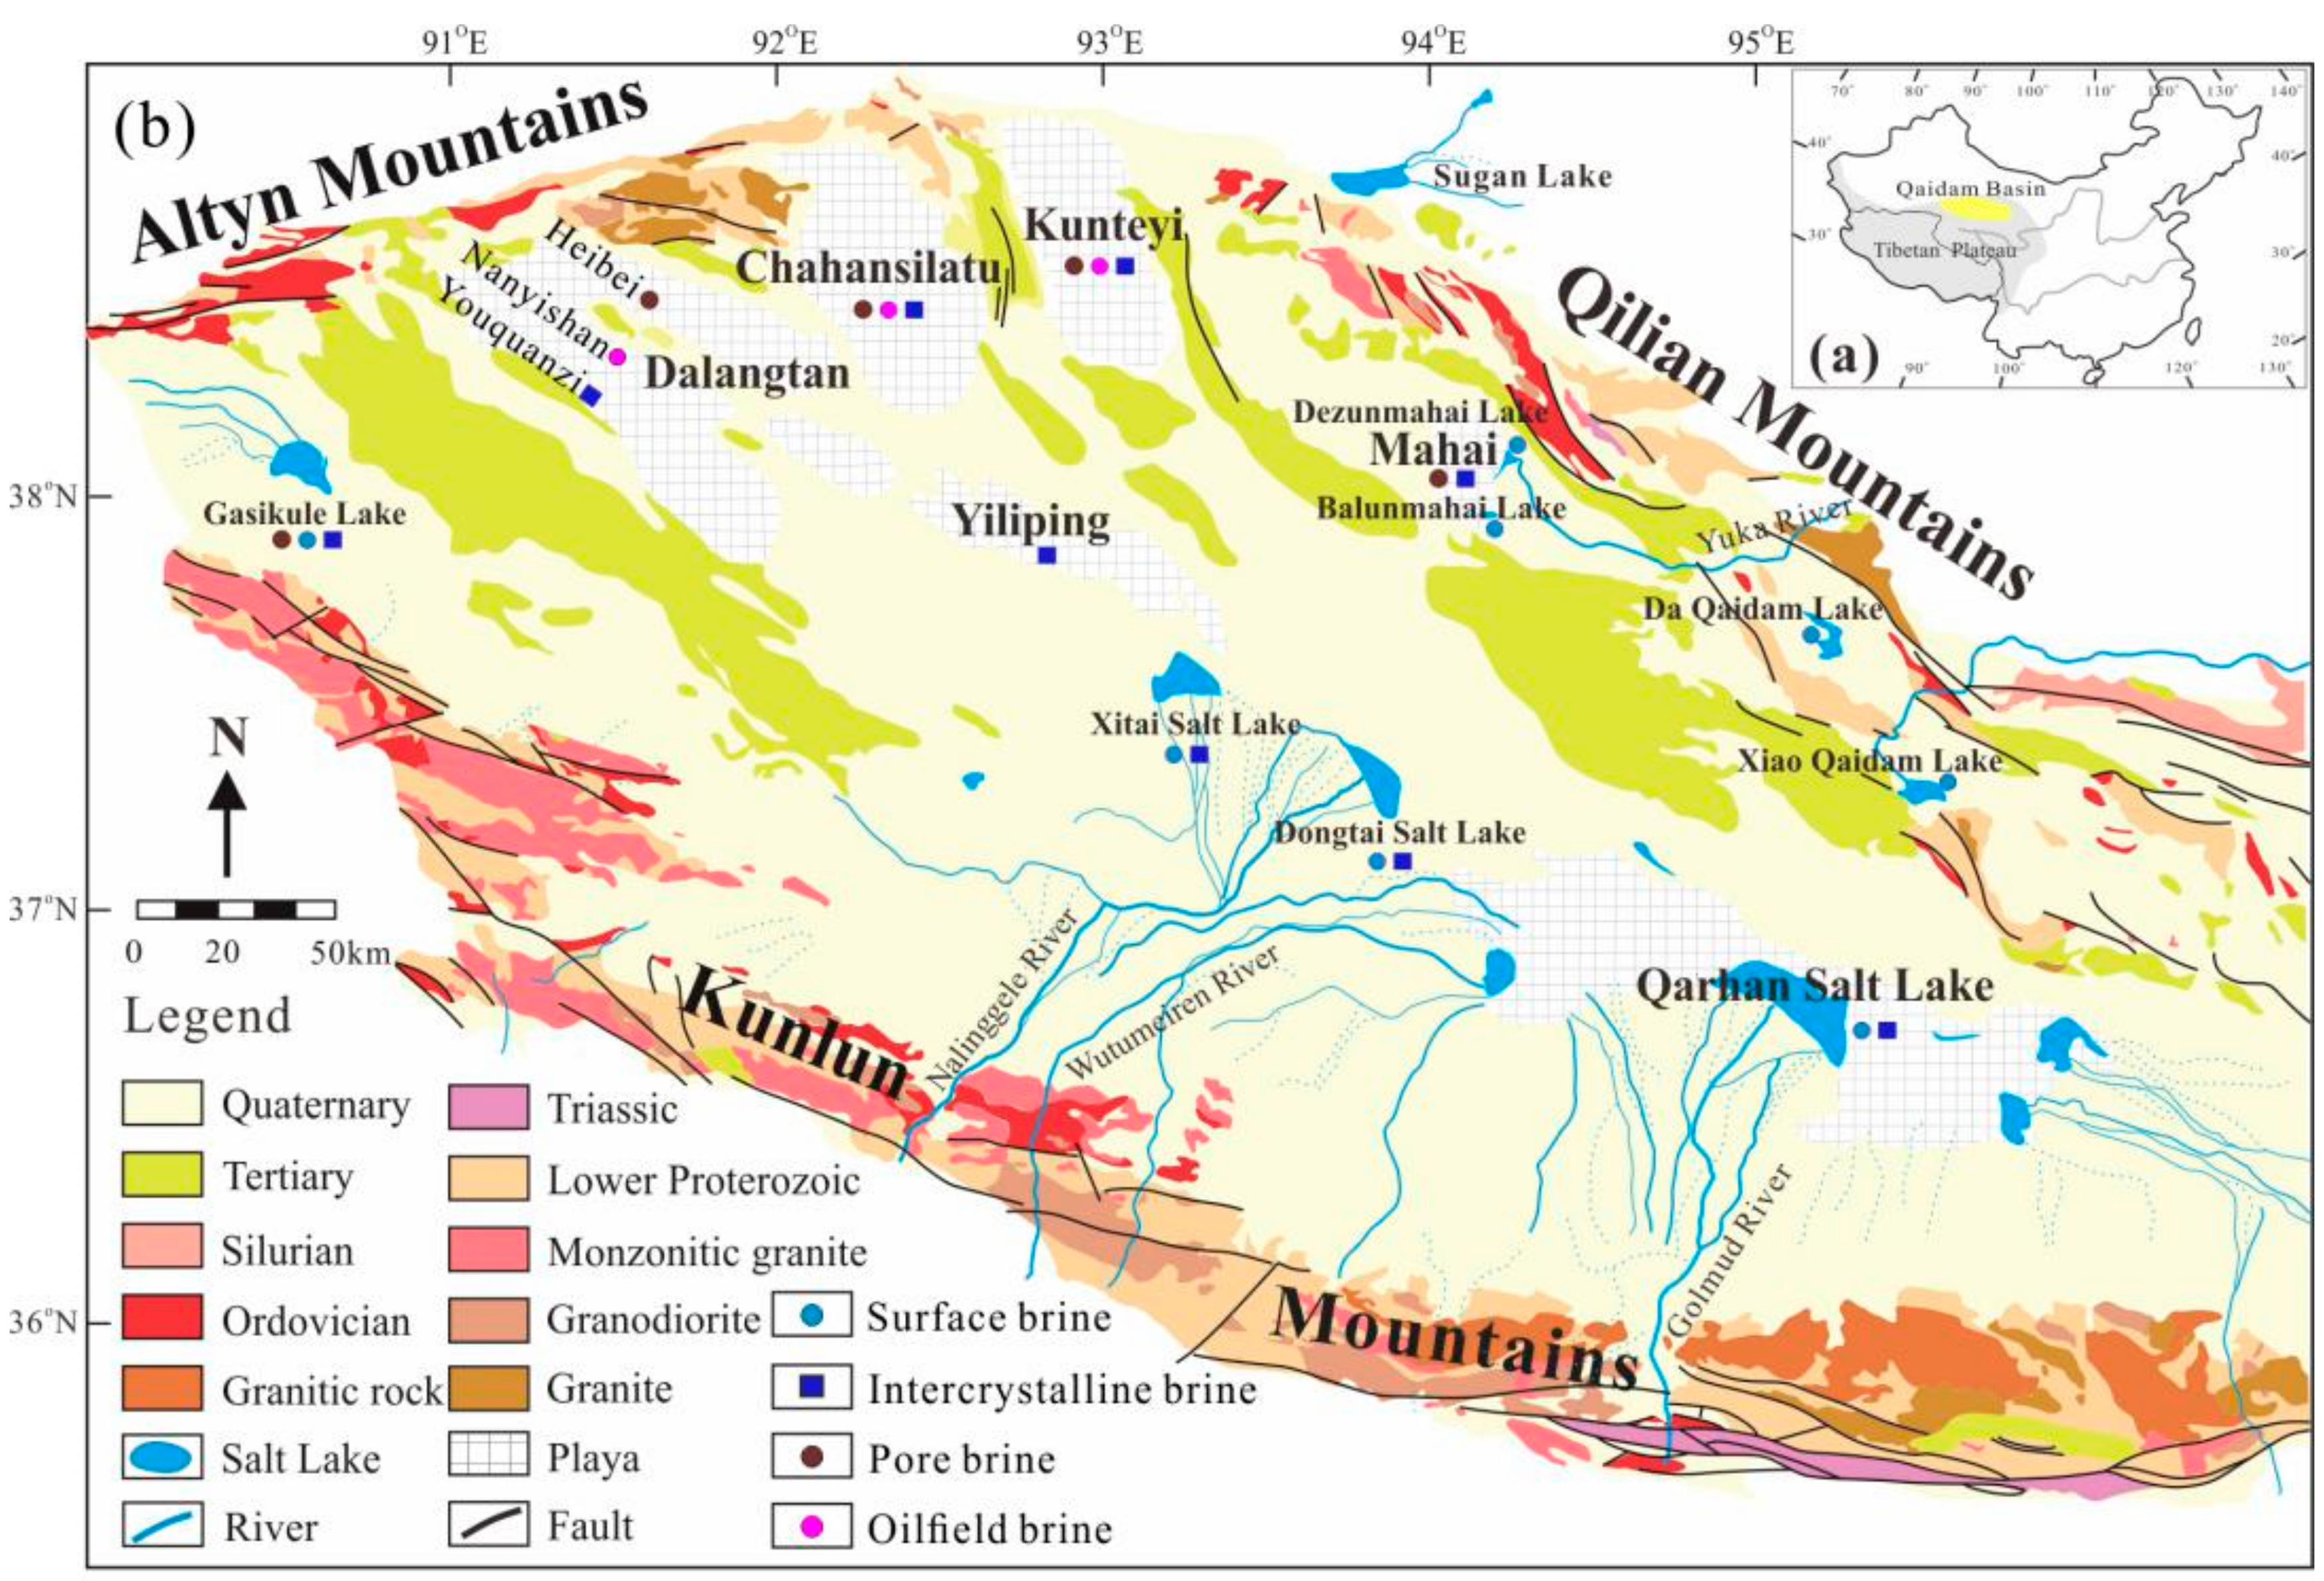
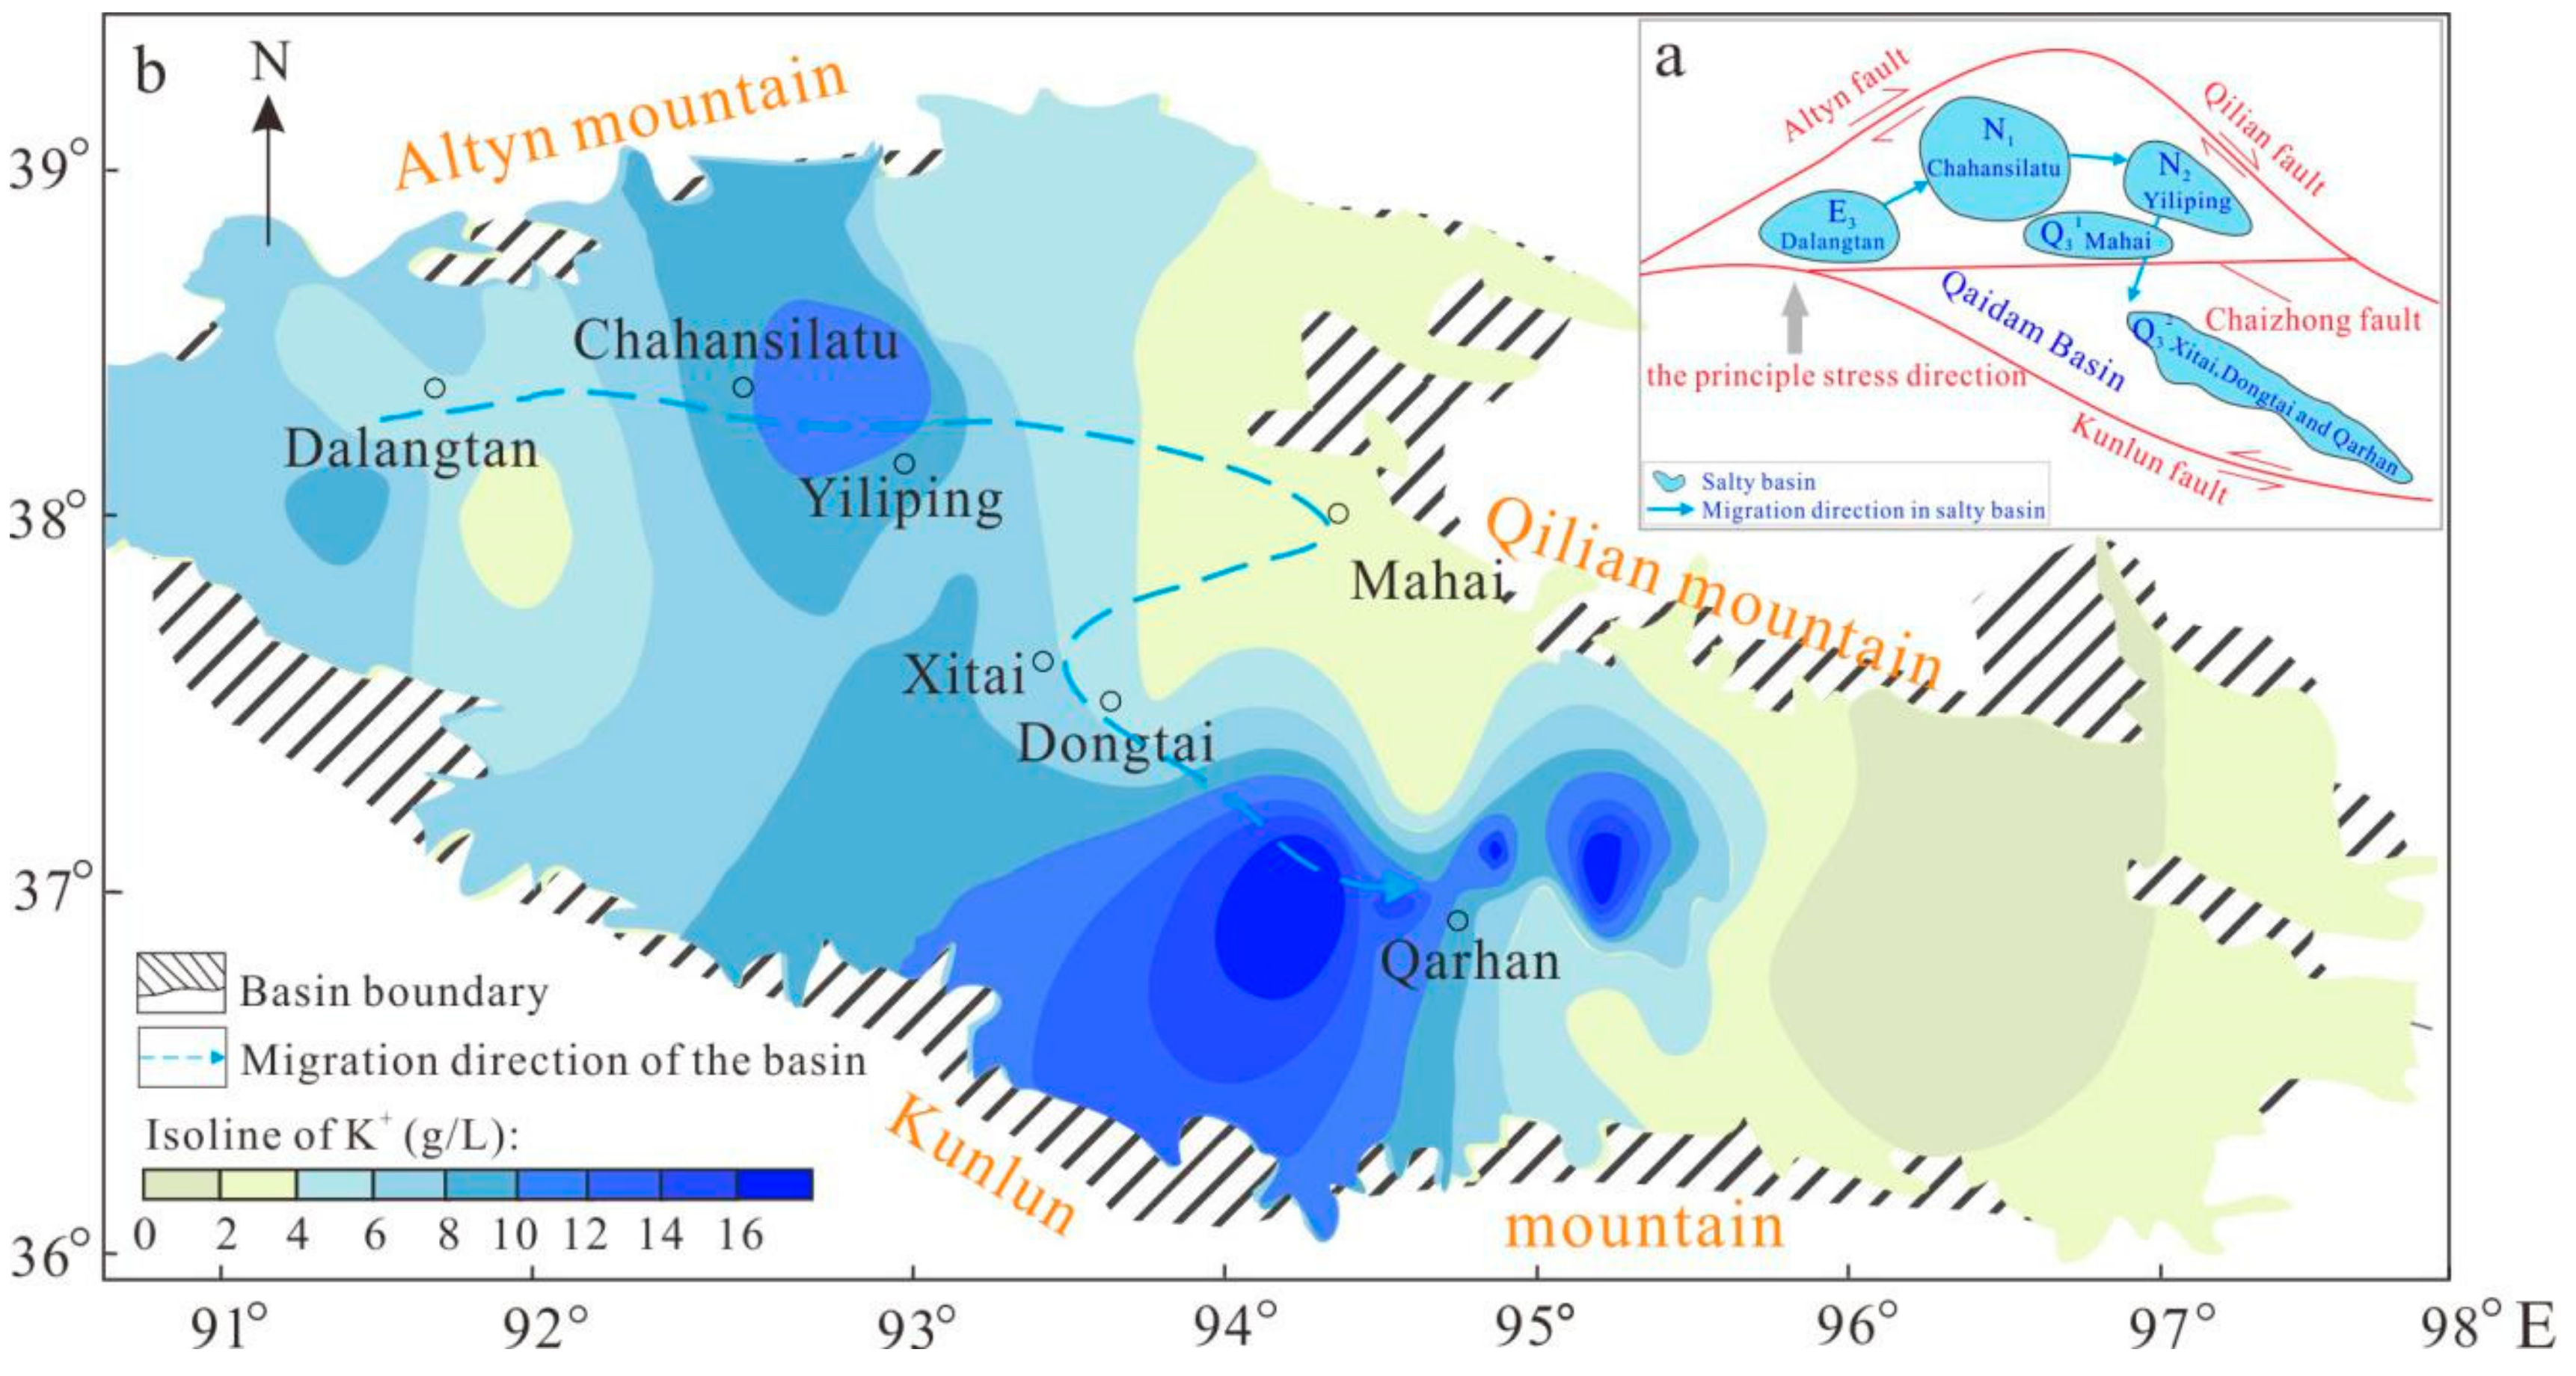
2.1. Geological Setting of the QB

The QB (35°55′–39°10′ N, 90°00′–98°20′ E), located in the northern part of the Qinghai-Tibetan Plateau, is a closed, fault–depressed basin with an irregular diamond shape (Figure 1). Three high mountains surround the basin, Qilian Mountain to the northeast, Altun Mountain to the northwest, and Kunlun Mountain to the south (Figure 1b). The embryonic QB formed during the Indosinian movement, and experienced major tectonic evolution during the Mesozoic [23,24]. Over 16,000 m of Mesozoic–Cenozoic sediments overlie the basement of the QB, which is composed by Paleozoic granites and Proterozoic–Paleozoic metamorphic rocks [25]. The combined presence of ambient high mountains (altitudes >4000 m) and a low basin (altitudes ranging 2600–3200 m) in the QB favors the formation of salt deposits [4,7]. Thus, more than 20 salt lakes and an abundance of salt–brine resources are distributed throughout the basin [4].
Three large salt lake regions are present, from northwest to southeast in the western, middle, and eastern QB, respectively (Figure 1b). The Kunteyi, Chahansilatu, and Dalangtan playas in the western QB formed during the Neogene–early Pleistocene and are supplied by the waters from the Altun Mountain [4]. Only few surface saline lakes, such as Jiahu and Gasikule lakes, exist in this region. In the north side of the middle QB are the the Niulang, Balunmahai, and Dezunmahai salt lakes, and Mahai playa, which receive river water from the Qilian Mountain, whereas on the south side of the middle QB, the Yiliping playa, and Xitai and Dongtai salt lakes occur, and are fed by the Nalenggele River, originating from the Kunlun Mountain (Figure 1b). Similarly, in the north side of the eastern QB, rivers rising from the Qilian Mountain feed the Da Qaidam and Xiao Qaidam salt lakes; and in the south side of the eastern QB, the QSL, which is the largest playa in the QB, is fed by the Kunlun Mountain river system and formed during the late Pleistocene [25,26,27,28,29].
In the western part of the QB, deep pore brines, which occurred in the early Pleistocene strata (i.e., sand and gravel layers) at depths of 206–900 m, were also revealed in the Dalangtan–Heibei depression and the Kunteyi depression [13,17]. These brines spread to an area greater than 1000 km2 with a length over 100 km and a width of 8–16 km. The KCl reserves of these brines are ~3.5 × 10⁸ t [13]. In addition, oilfield brines occur in many tectonically–controlled anticlines, including the Nanyishan, Youshashan, Youdunzi, Youquanzi, and Xiaoliangshan anticlines in the Dalangtan playa, western QB, in the Paleocene–Oligocene strata (i.e., limestone, marlite and mudstone). These brines are usually Ca–Cl type brines, enriched in trace elements (B, Li, Br, Rb, Cs, etc.) and buried at the depth of >500 m with temperatures close to 100 °C [16]. K reserves of different types of brines in different regions in the QB are shown in Figure 3b.

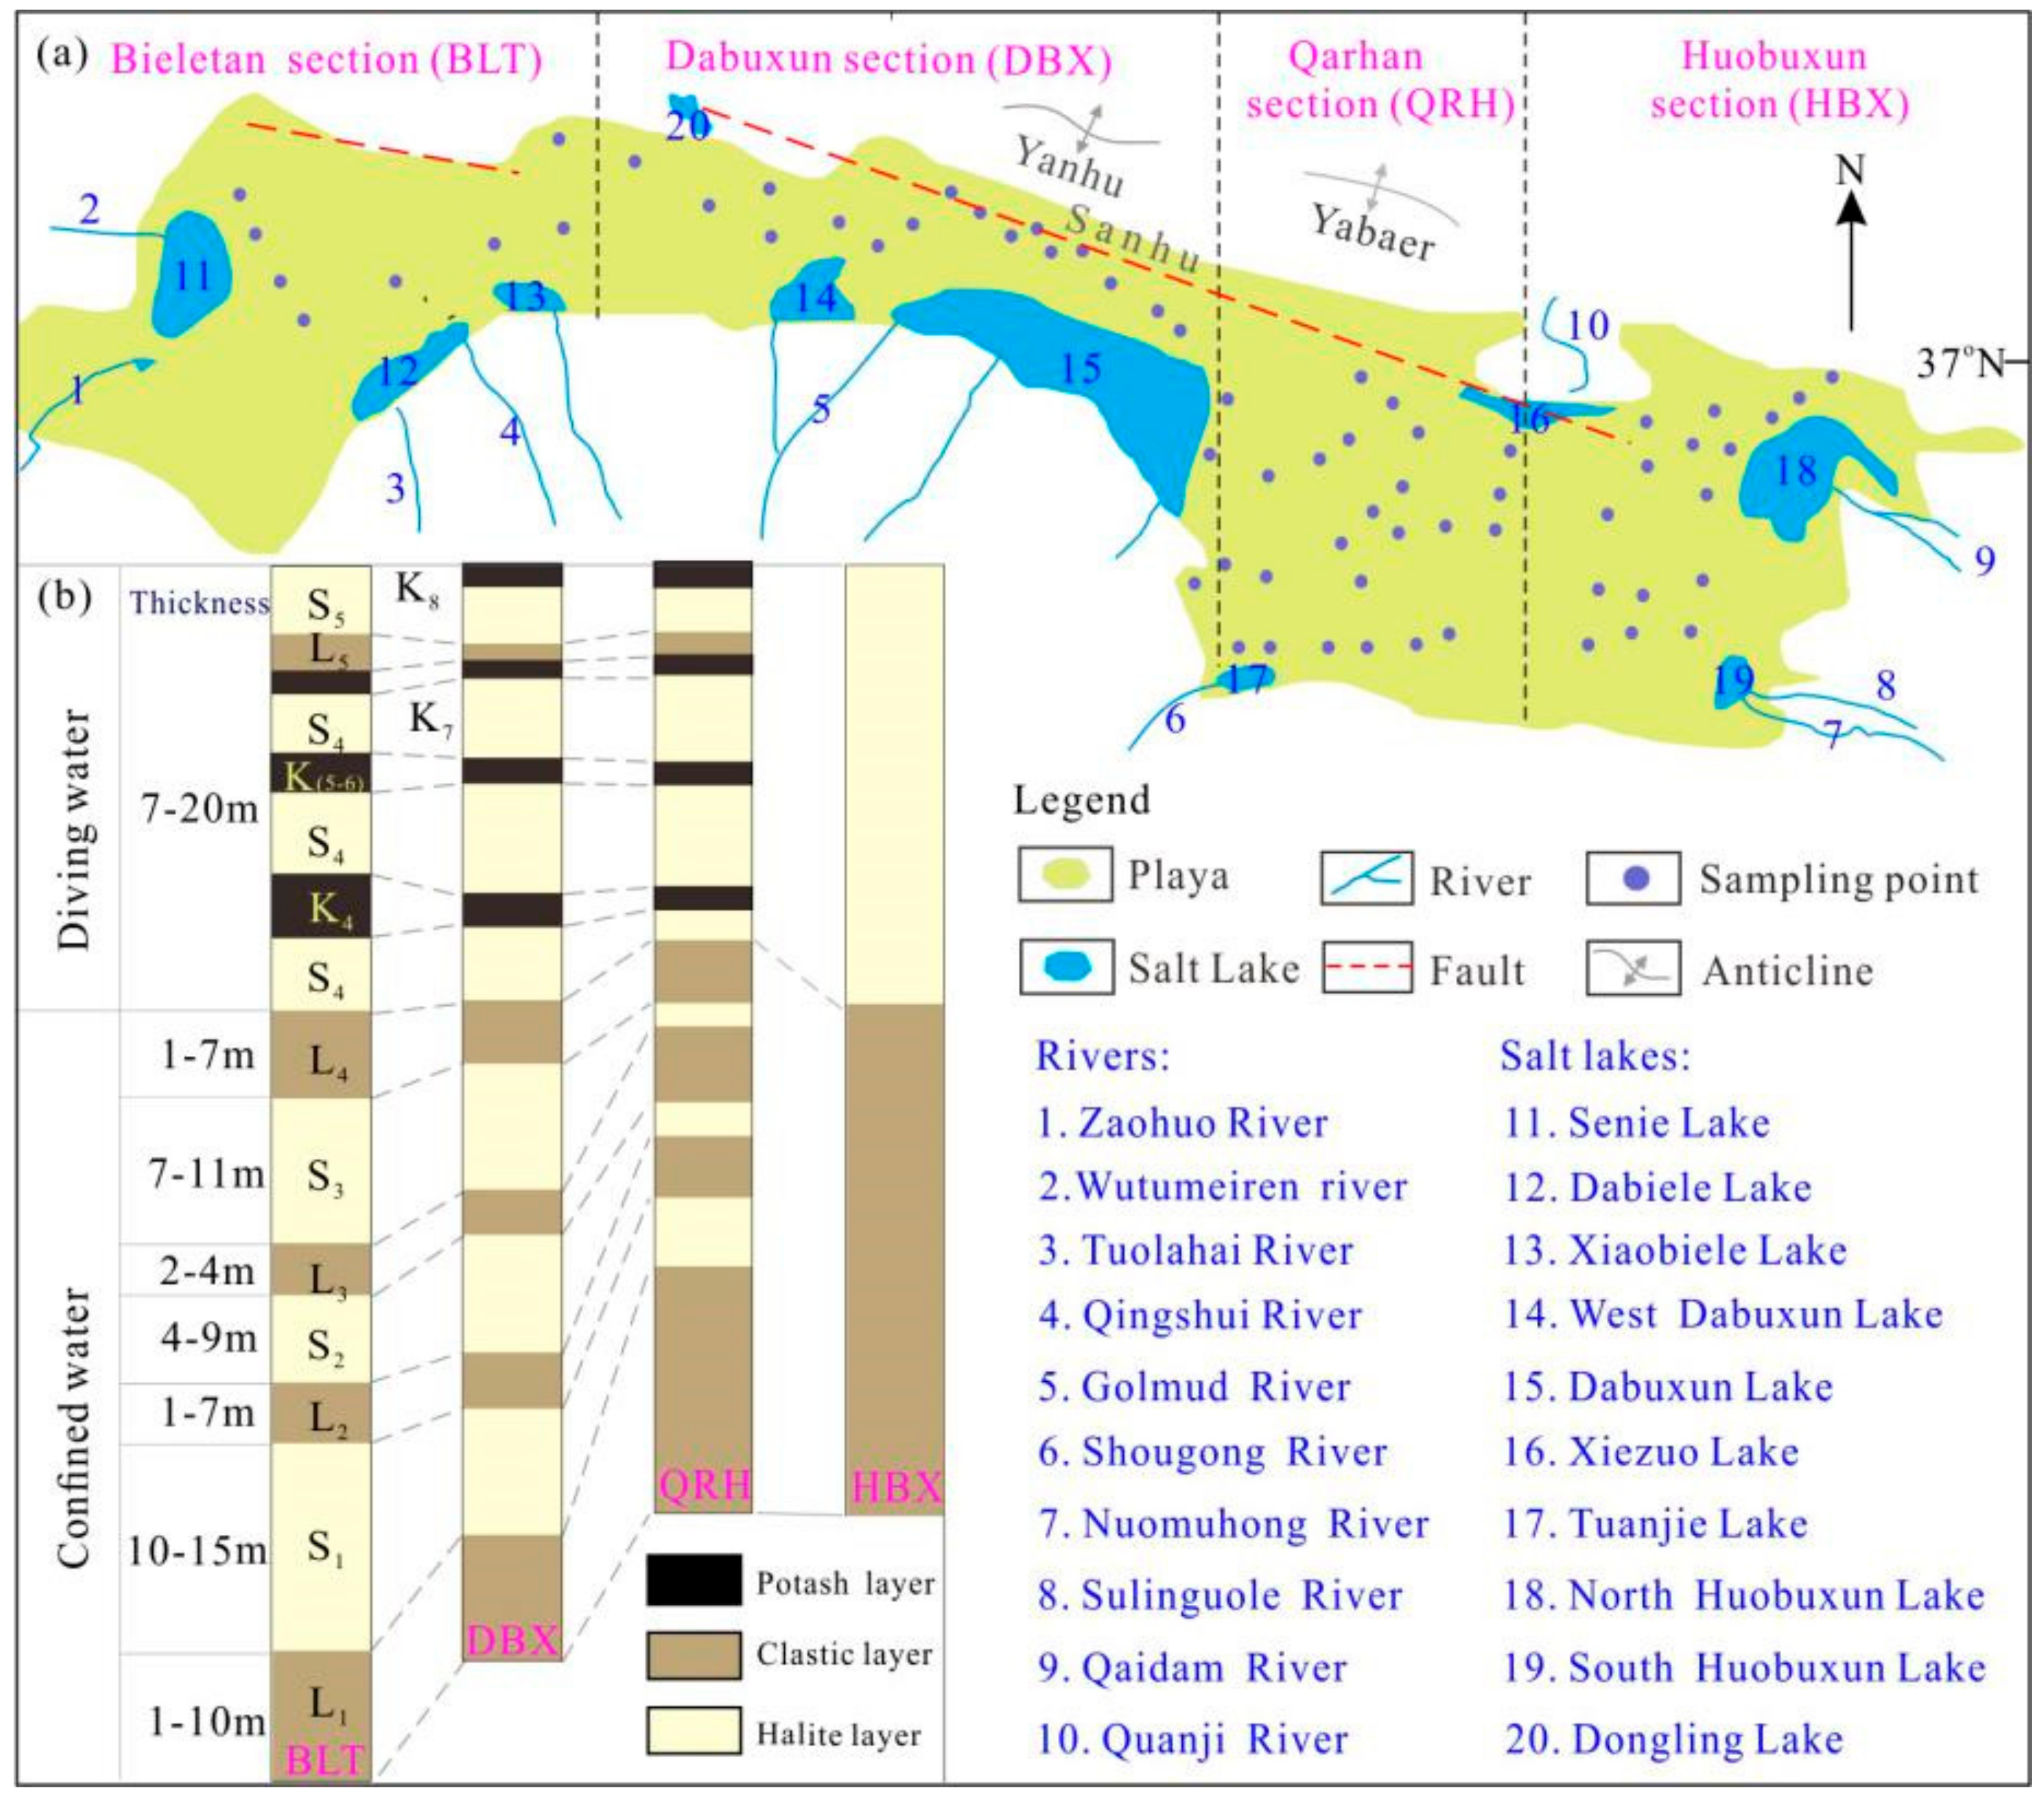
2.2. Geological Setting of the QSL

The QSL (36°37′36′′–37°12′33′′ N, 93°42′36′′–96°14′35′′ E), with a total area of 5856 km2, is the largest playa in the eastern QB (Figure 1b and Figure 4). It spans ~168 km from east to west and 20 to 40 km from north to south [4]. At the end of the late Pleistocene, a long scorpion-shaped structure, including the Yanhu and Yabaer anticlines, was formed from the neotectonic movement and the lake basin was formed [30]. Currently, the QSL is located in the Cenozoic subsidence belt of the QB [31]. The southern and northern margins of the QSL are controlled by the Chanan and Sanhu compresso–shear deep faults [30], respectively.
Springs and rivers are the two main inflows replenishing the QSL [9,27,32,33]. The springs emerge along the fault in the north of the QSL and contain abundant Ca2+ and virtually no HCO3. Meanwhile, there are ten main rivers (Wutumeiren, Zaohuo, Tuolahai, Qingshui, Golmud, Shougong, Nuomuhong, Qaidam, Sulinguole, and Quanji rivers) flowing into the lake [9] (Figure 4). Of them, the Golmud river, with a discharge of 7.98 × 10⁸ m3/y, is the largest river [7]. The rivers’ waters are enriched in SO42−, Cl, and Na+, but are poor in Ca2+. The range of K+ concentrations of the rivers is 2.7–122.2 mg/L (average 19.5 mg/L), which is much higher than the world’s average river water (3.9 mg/L [7]).
The QSL contains ten surface salt lakes and a large area of playa (Figure 4). The salt lakes, including Senie, Dabiele, Xiaobiele, Dabuxun, West Dabuxun, Tuanjie, Xiezuo, North Huobuxun, and South Huobuxun lakes, exist in the margin of the playa where perennial or seasonal river recharge. All of the salt lakes are formed by the mixing of rivers and springs in different proportions [27,32,33]. For example, the Senie Lake, and Dabiele and Dabuxun lakes are mainly fed by rivers and form Cl–SO4 type waters, while the Xiezuo and Dongling lakes contain Ca–Cl type brines because they are mainly supplied by the springs. The playa is divided into the Bieletan, Dabuxun, Qarhan, and Huobuxun sections from west to east based on geological and mineral characteristics (Figure 4). Five halite-dominated evaporitic layers (S1–S5), are separated by clastic-dominated layers (L1–L5), deposited in the QSL. The thickness of the salt-bearing layer gradually decreases from 55 to 65 m in the easternmost Bieletan section to 15–25 m in the westernmost Huobuxun section (Figure 4). The solid K-bearing minerals (mainly sylvite (KCl) and carnallite (KCl·MgCl2·6H2O)) in the QSL can be divided into two types according to its appearance: layered and disseminated [7]. The layered K-bearing minerals are mainly enriched in the S4 (K4–K7) and S5 (K8) and distribute in the eastern three sections (Figure 4), while the disseminated K-bearing minerals are present throughout the QSL from S1 to S5 [7]. An abundance of K-rich intercrystalline brines occur in the playa. The total reserves of KCl in the QSL are 5.4 × 10⁸ t [34], making it the largest modern potash deposit in the world and maintaining the largest potash fertilizer production base in China [4,35].

3. Materials and Methods

3.1. Sample Collection and Analytical Method

A total of 64 intercrystalline brine samples from the QSL were collected in this study, including 7 in the Bieletan section, 17 in the Dabuxun section, 27 in the Qarhan section, and 13 in the Huobuxun section (Figure 4). The samples were collected in 500-mL polyethylene plastic bottles which were cleaned by dilute hydrochloric acid in the laboratory and rinsed with sample water. Then, the sample was filtered with a 0.45 μm polypropylene membrane for analysis.
The K+ concentrations of samples were determined by gravimetric methods through precipitation of potassium tetraphenylborate at the Qinghai Institute of Salt Lakes, Chinese Academy of Sciences [36]. Our experiments followed these instructions: Firstly, put 10 mL of each sample into a 100 mL beaker. Add 0.5 mL methyl red and appropriate amount of 0.05 M HCl to make the solution acidic. Then, add excess 1% sodium tetraphenylborate (NaB(C6H5)4) solution to fully precipitate the K+. After that, filter the precipitated potassium tetraphenylborate (KB(C6H5)4) and place it in an oven to dry at 105 °C. Finally, weigh the precipitate and calculate the K+ concentration. Equation (1) is as follows:
K+ = W × 0.1091 × 10⁶/V
where W is the weight of the precipitate and V is the sample volume. The analysis error was less than 0.5%.

3.2. Data Analysis Methods

3.2.1. Flux Calculation

To quantitatively calculate the total K supplying by rivers to the QSL, water–solute balance Equation (2) was applied in this study:
W = Q × C
where ∑W is the annual K input into the QSL by each river; Q is many years’ average runoff for each river; C is the average concentration of K+ in each river.

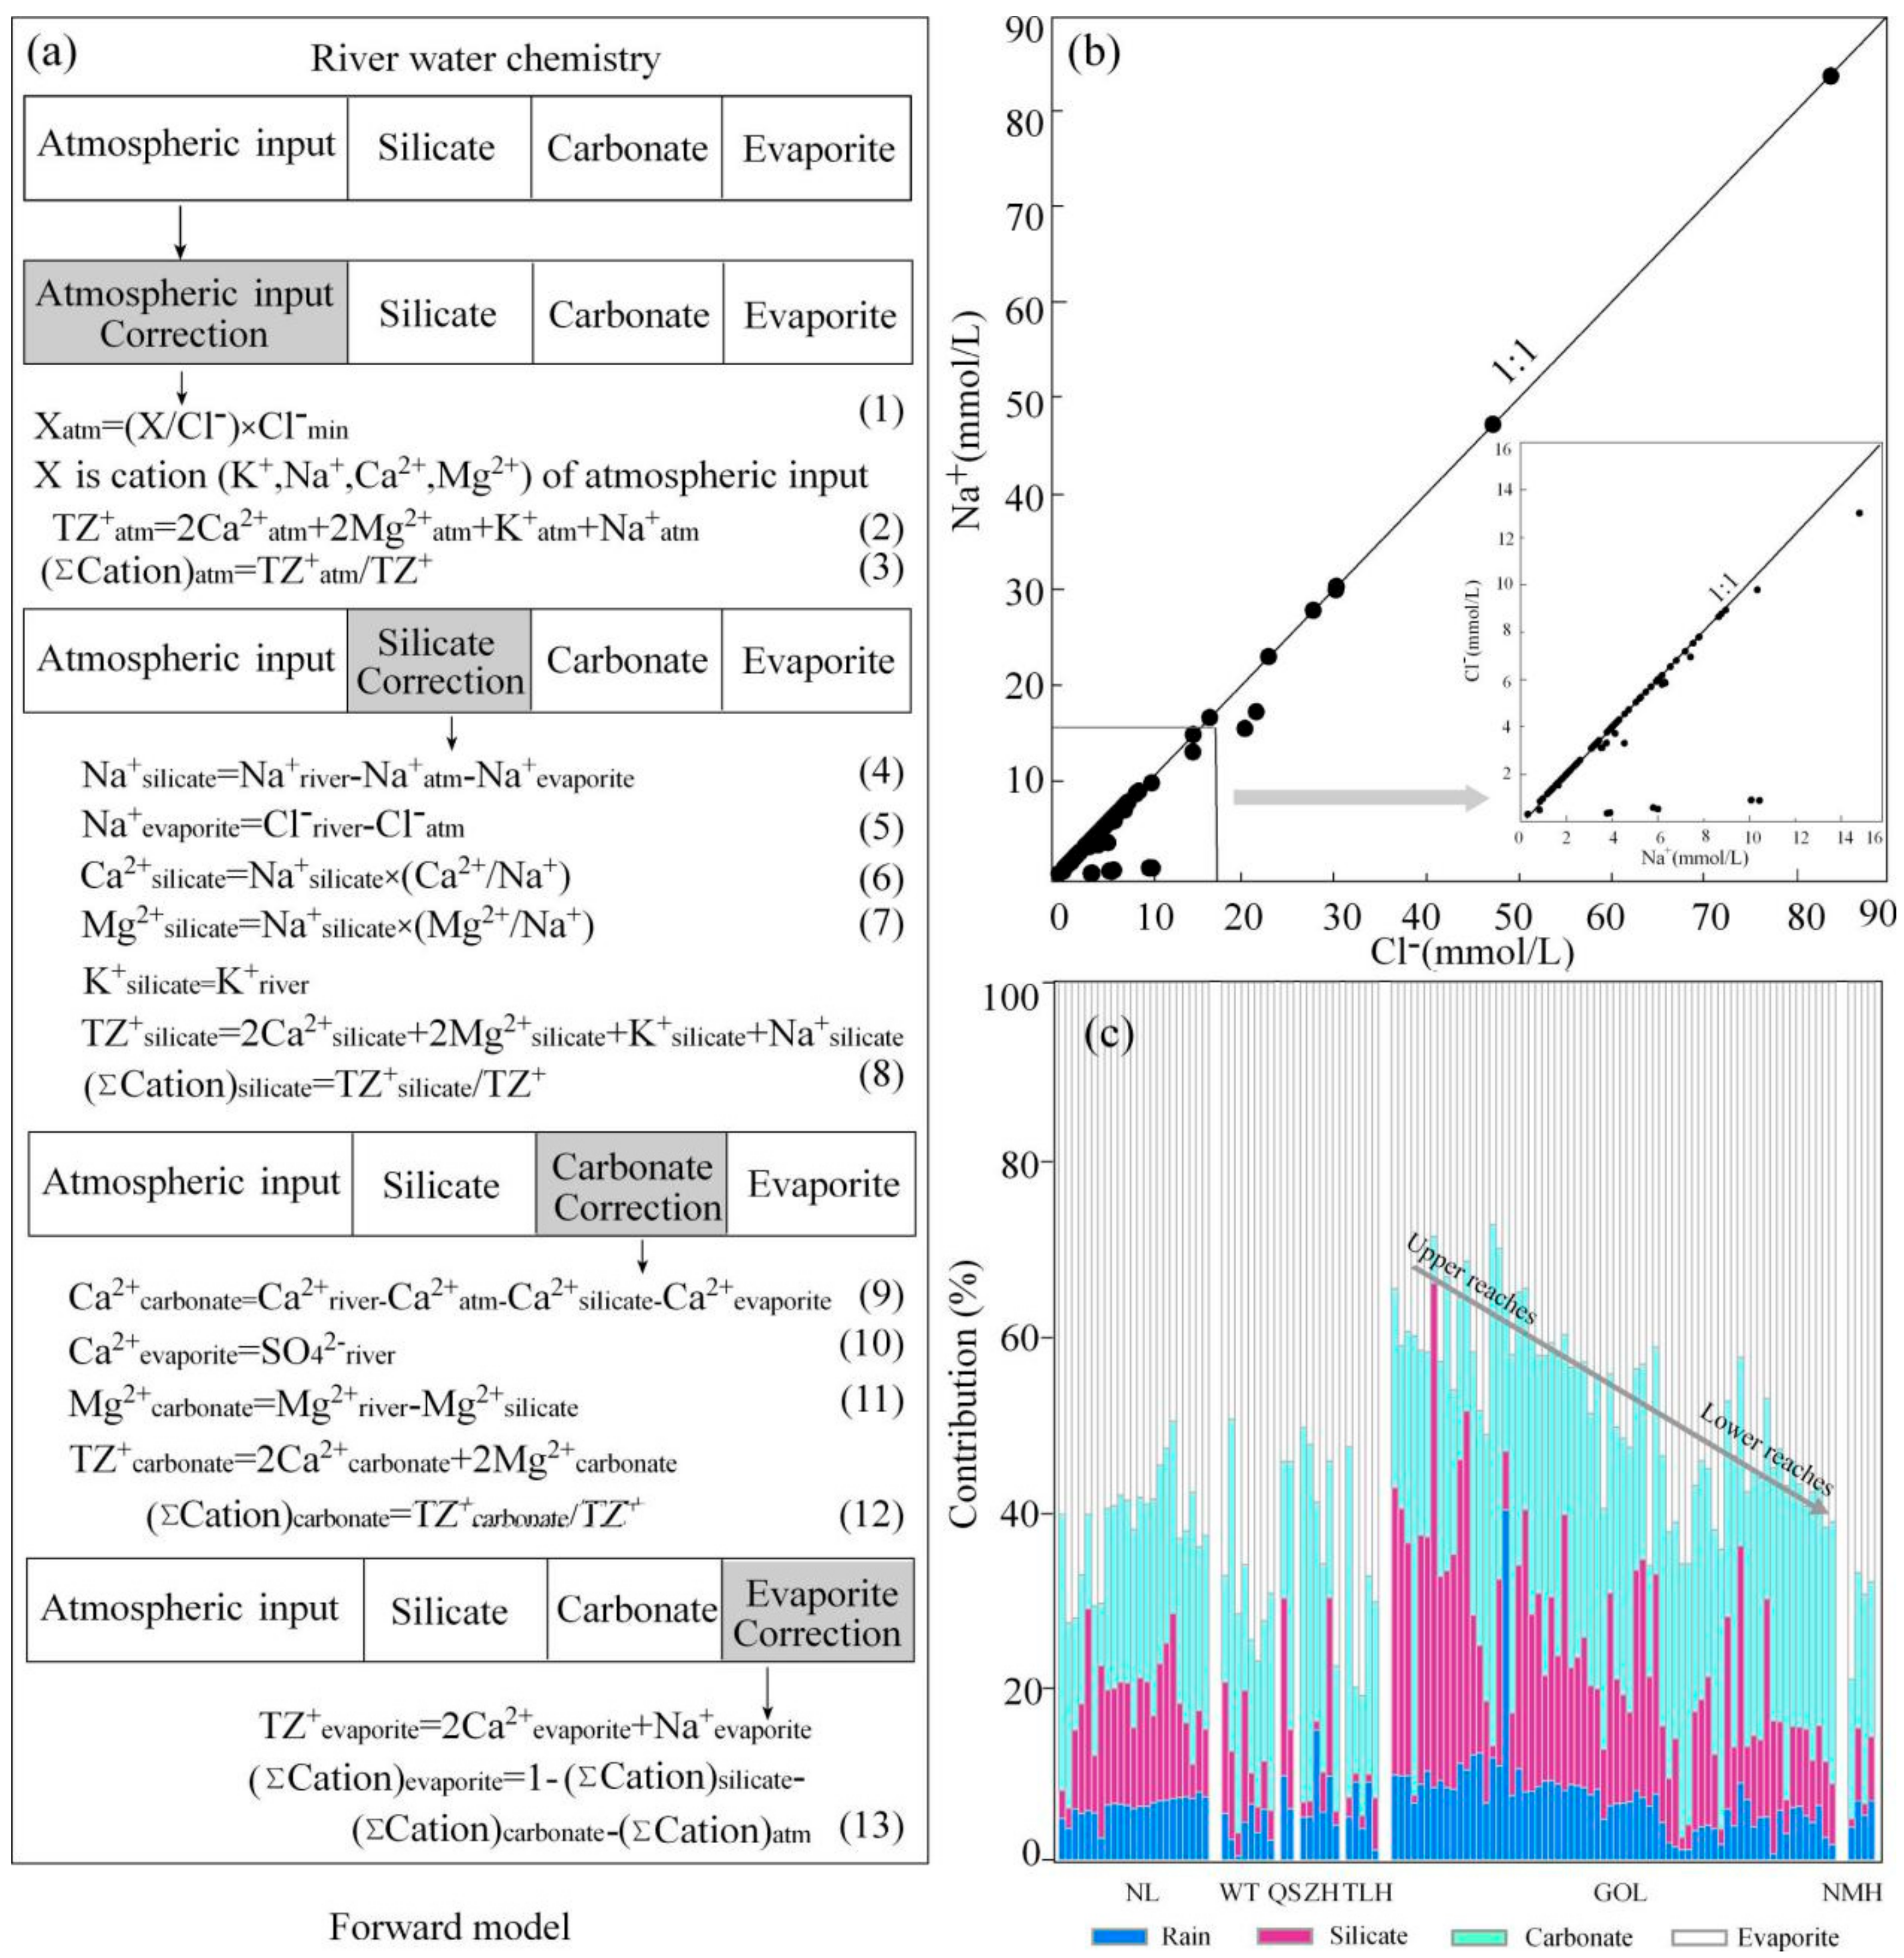
3.2.2. Forward Model to Quantify the Contribution of Different Sources to the Solutes of River Waters

The possible sources of solutes in river waters mainly include the atmospheric water, rock (carbonate and silicate) weathering, and evaporite dissolution [37,38,39]. To identify how each of the above-mentioned sources contribute to the major ions in rivers, the forward model was applied. This model obtains the results by calculating the proportion of cationic charge derived from each source to the total major cation loads (TZ+, meq/L) (TZ+ = Na+ + K+ + 2Mg2+ + 2Ca2+, the unit of Na+, K+, Mg2+ and Ca2+: mmol/L) [40,41,42,43]. The outline of this model is shown in Figure 5a and the detailed calculation process is as follows.
Atmospheric input: the portion of the major elements carried by atmospheric water was calculated first according to the first equation in Figure 5a [44], where Xatm is the corrected K+, Na+, Ca2+, or Mg2+ concentration, of rainwater. (X/Cl)atm is the (K+, Na+, Ca2+, and Mg2+)/Cl ratio in atmospheric water. Clmin is the lowest concentration in atmospheric water. The total cations from atmospheric water (TZ+atm) can be written as formula (2) in Figure 5a. Then, the percentage of total cations from the atmospheric water (∑Cation)atm can be obtained (formula (3) in Figure 5a).
Silicate weathering: the silicate weathering can contribute K+, Na+, Ca2+, and Mg2+ cations to river water. Na+ in the rivers is mainly from the atmospheric water, silicate weathering, and halite dissolution. According to mass balance, Na+ provided by silicate weathering (Na+silicate) can be estimated as Na+ in rivers (Na+river) minus the Na+ from atmospheric water (Na+atm) and evaporites (Na+evaporite) (formula (4) in Figure 5a). Assuming that all Cl in rivers corrected for atmospheric input (Clriver − Clatm) was from the dissolution of halite in the study area, another equation (formula (5) in Figure 5a) can be obtained and used to calculate the Na+silicate. All K+ in rivers are assumed from the silicate weathering (K+silicate = K+river); Ca2+ and Mg2+ provided by the silicate (Ca2+silicate and Mg2+silicate) are calculated assuming they are released to river waters in a fixed proportion relative to Na+silicate [45,46] (formulas (6) and (7) in Figure 5a). After that, the percentage of total cations from the silicate weathering (∑Cation)silicate was obtained (formula (8) in Figure 5a).
Carbonate weathering: the carbonate weathering mainly provides Ca2+ and Mg2+ to rivers. Assuming all SO42- in rivers after correction for rainwater are from the dissolution of gypsum, then, Ca2+ provided by the carbonate (Ca2+carbonate) can be calculated by formula (9) in Figure 5a. Mg2+ provided by the carbonate (Mg2+carbonate) can be expressed as formula (11) based on mass balance. After that, the contribution of carbonate weathering was obtained (formula (12) in Figure 5a).
Evaporite dissolution: Evaporites mainly supply Na+ and Ca2+ to rivers. The percentage of total cations from the evaporite dissolution is calculated by the formula (13) in Figure 5a.

4. Results

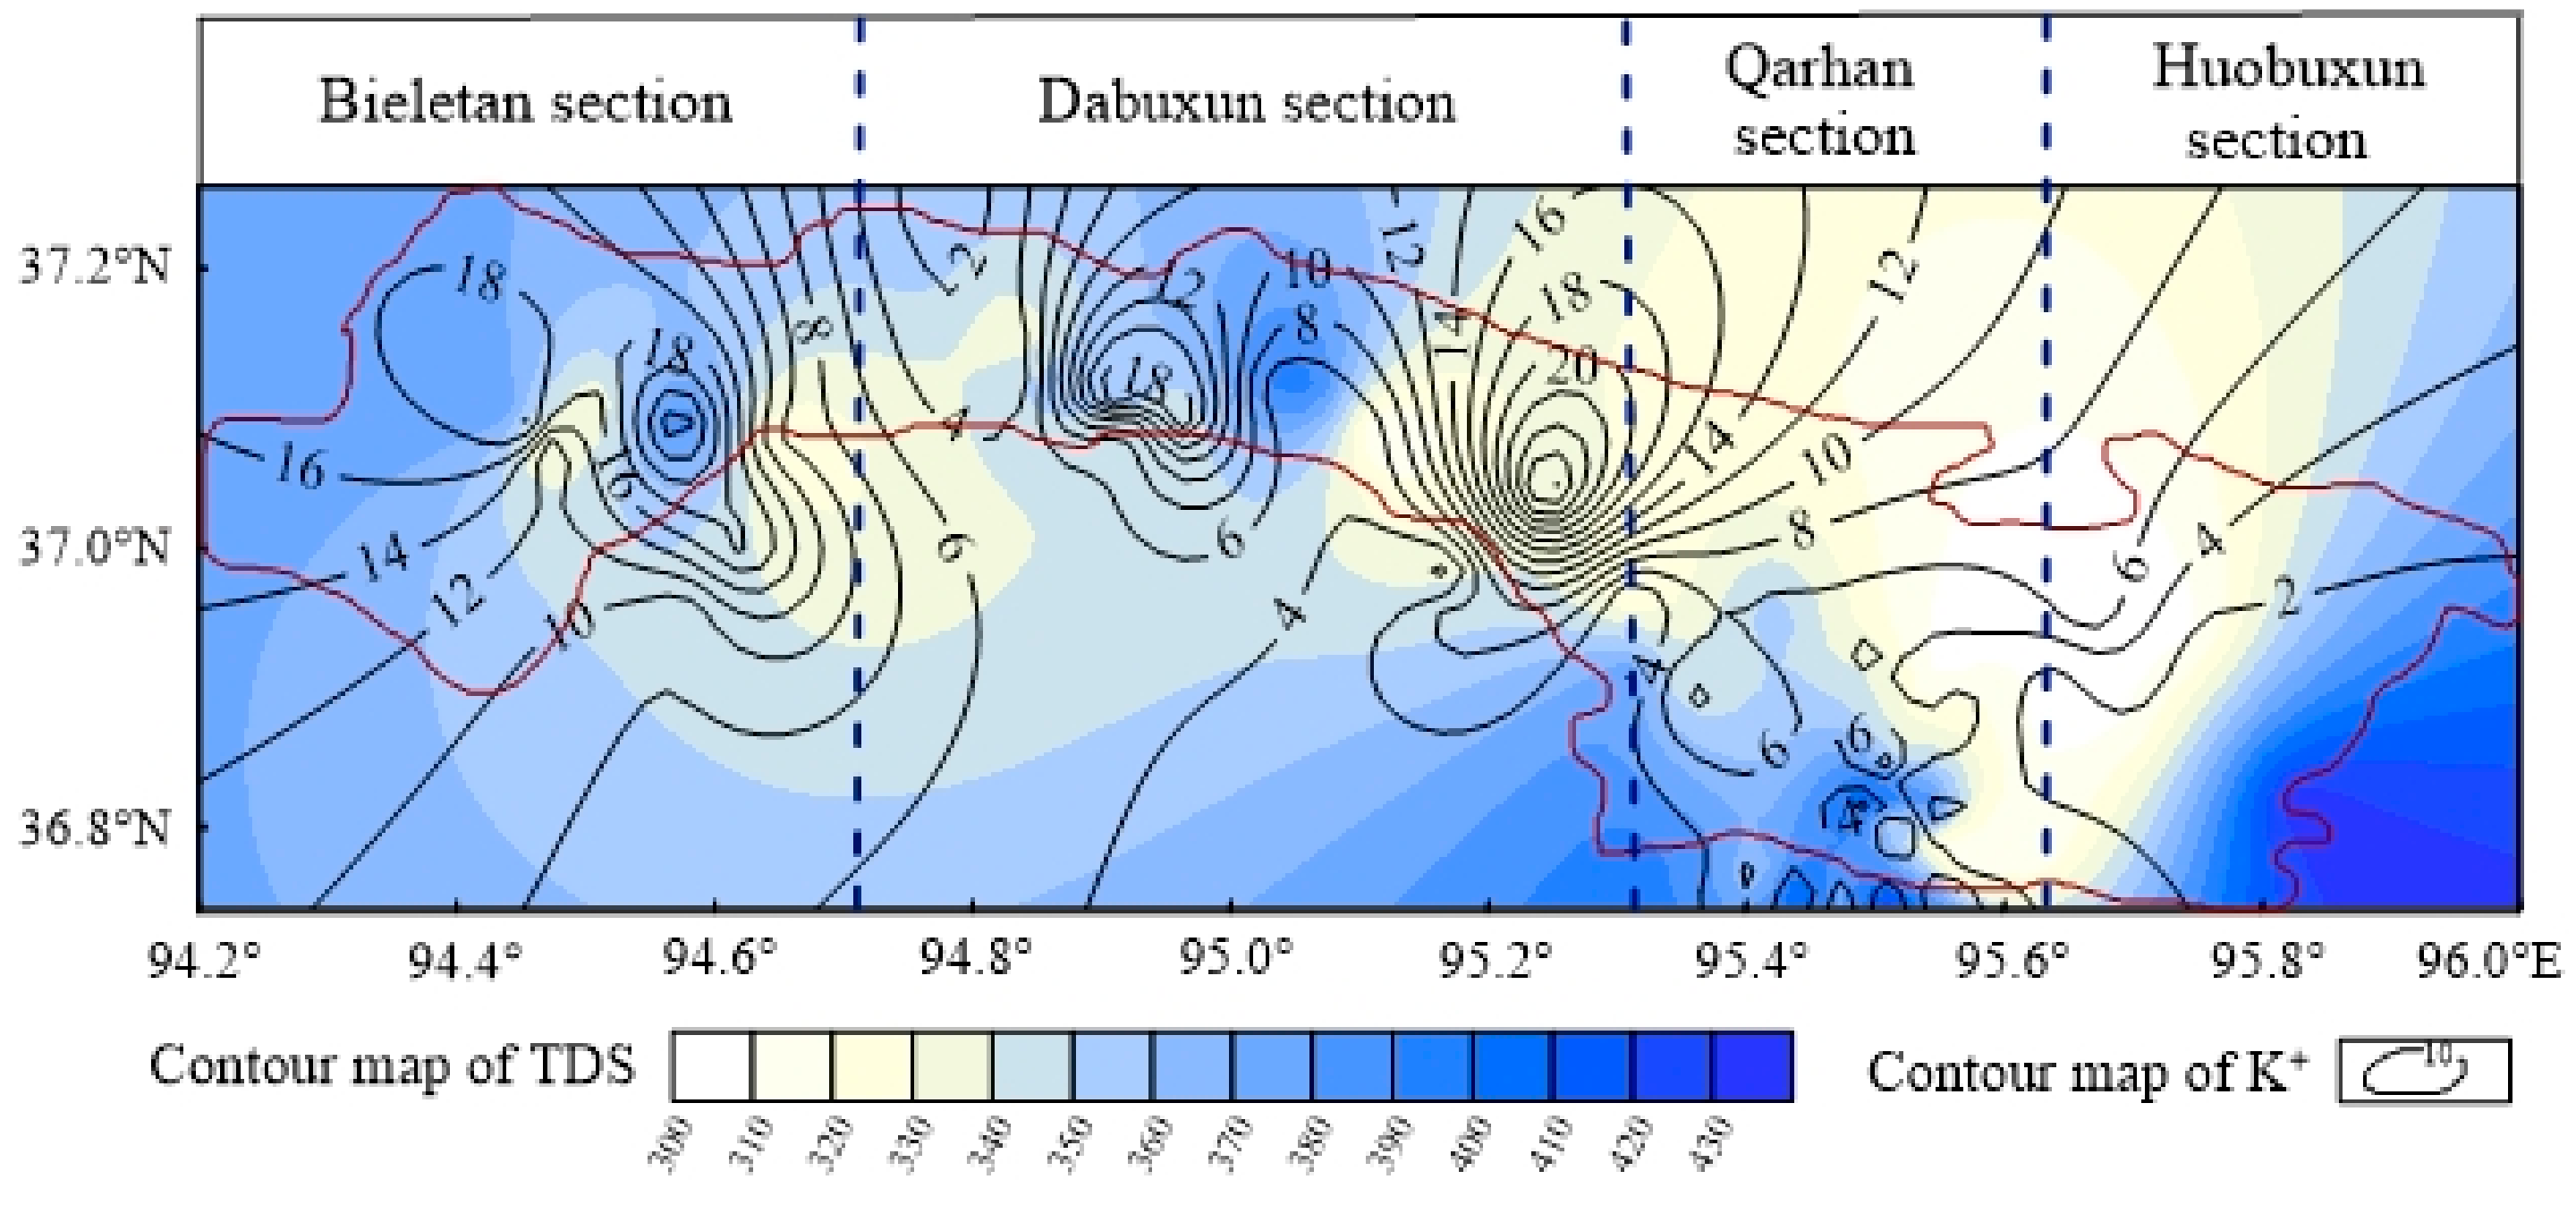
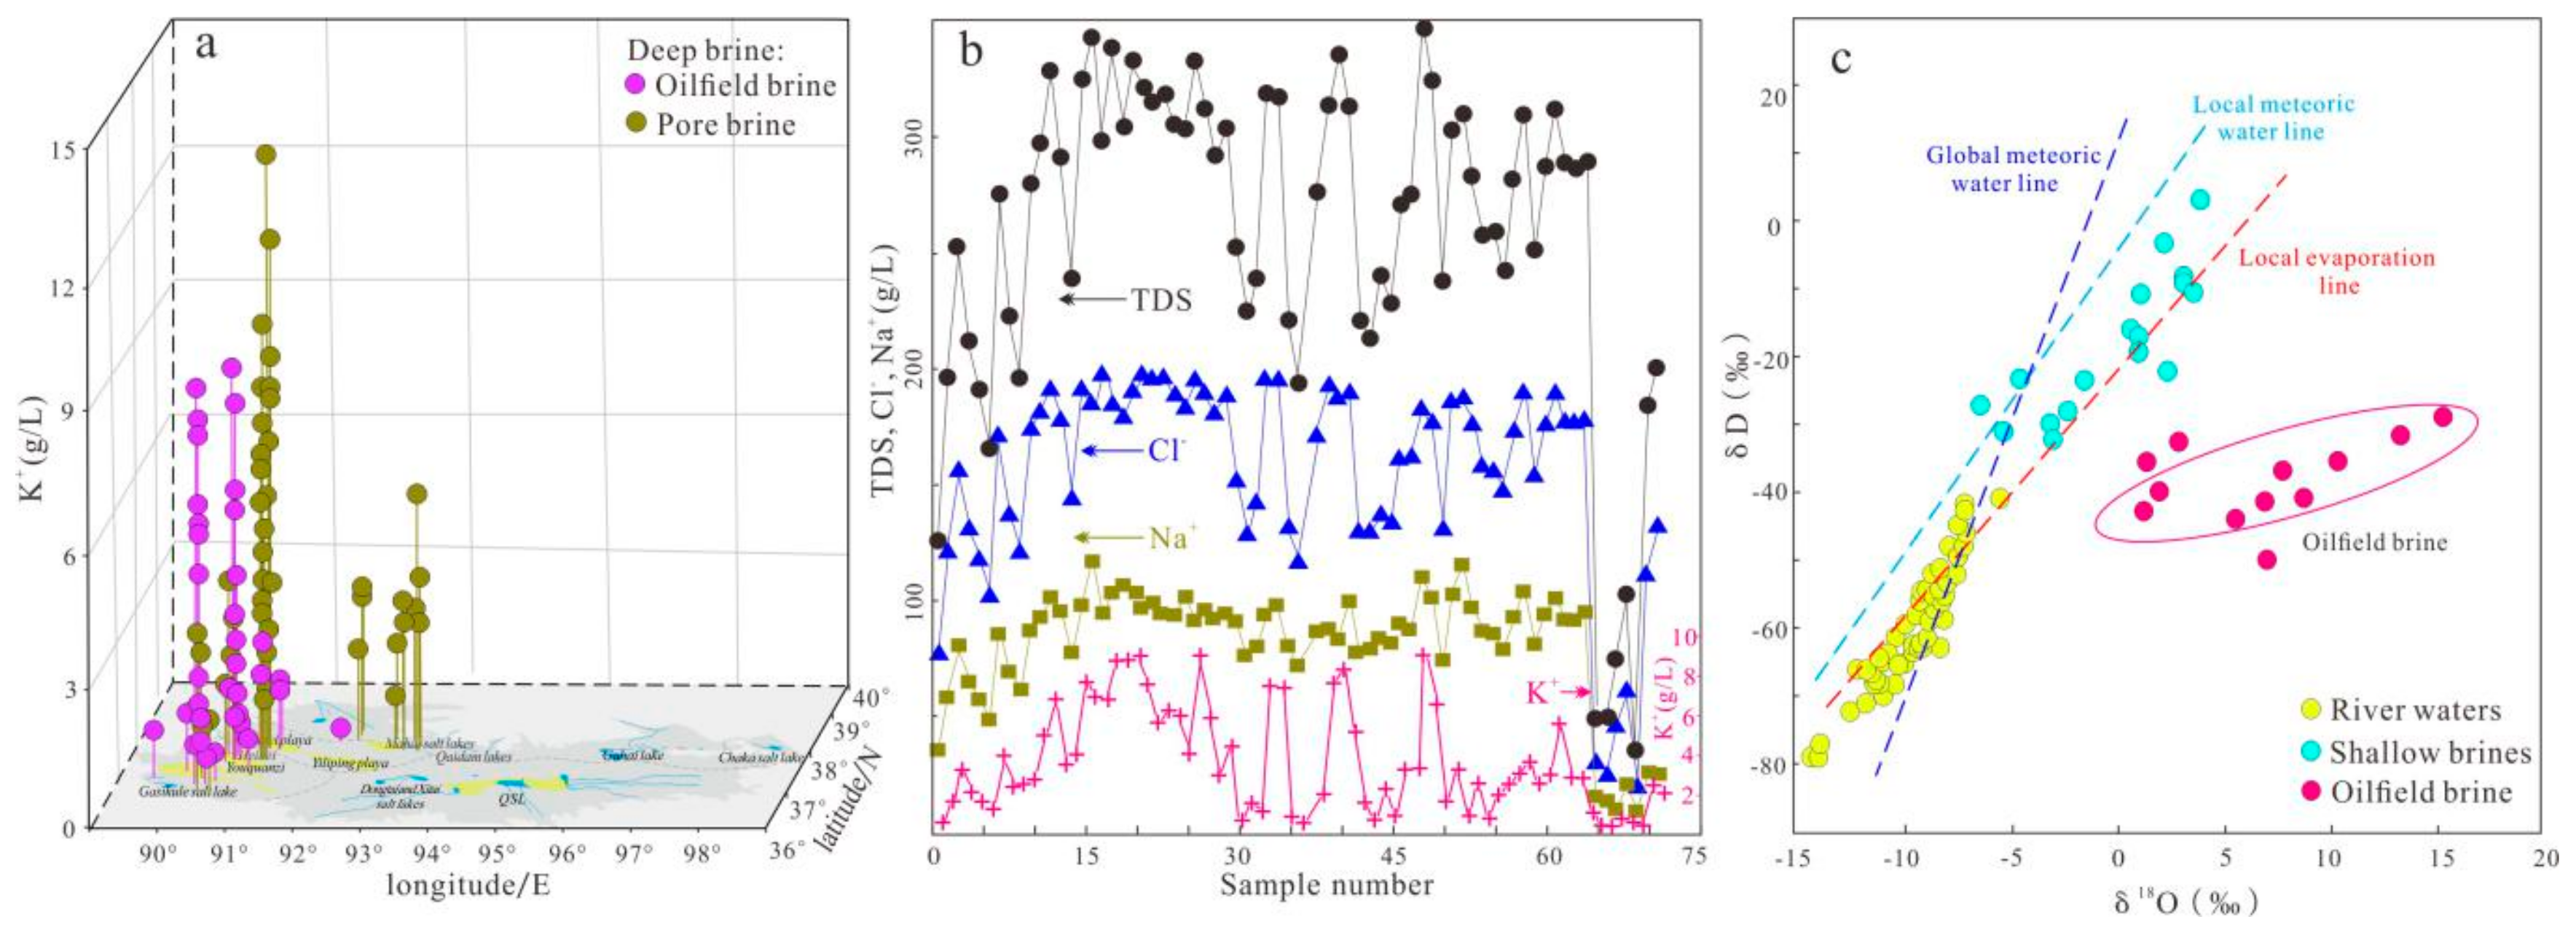
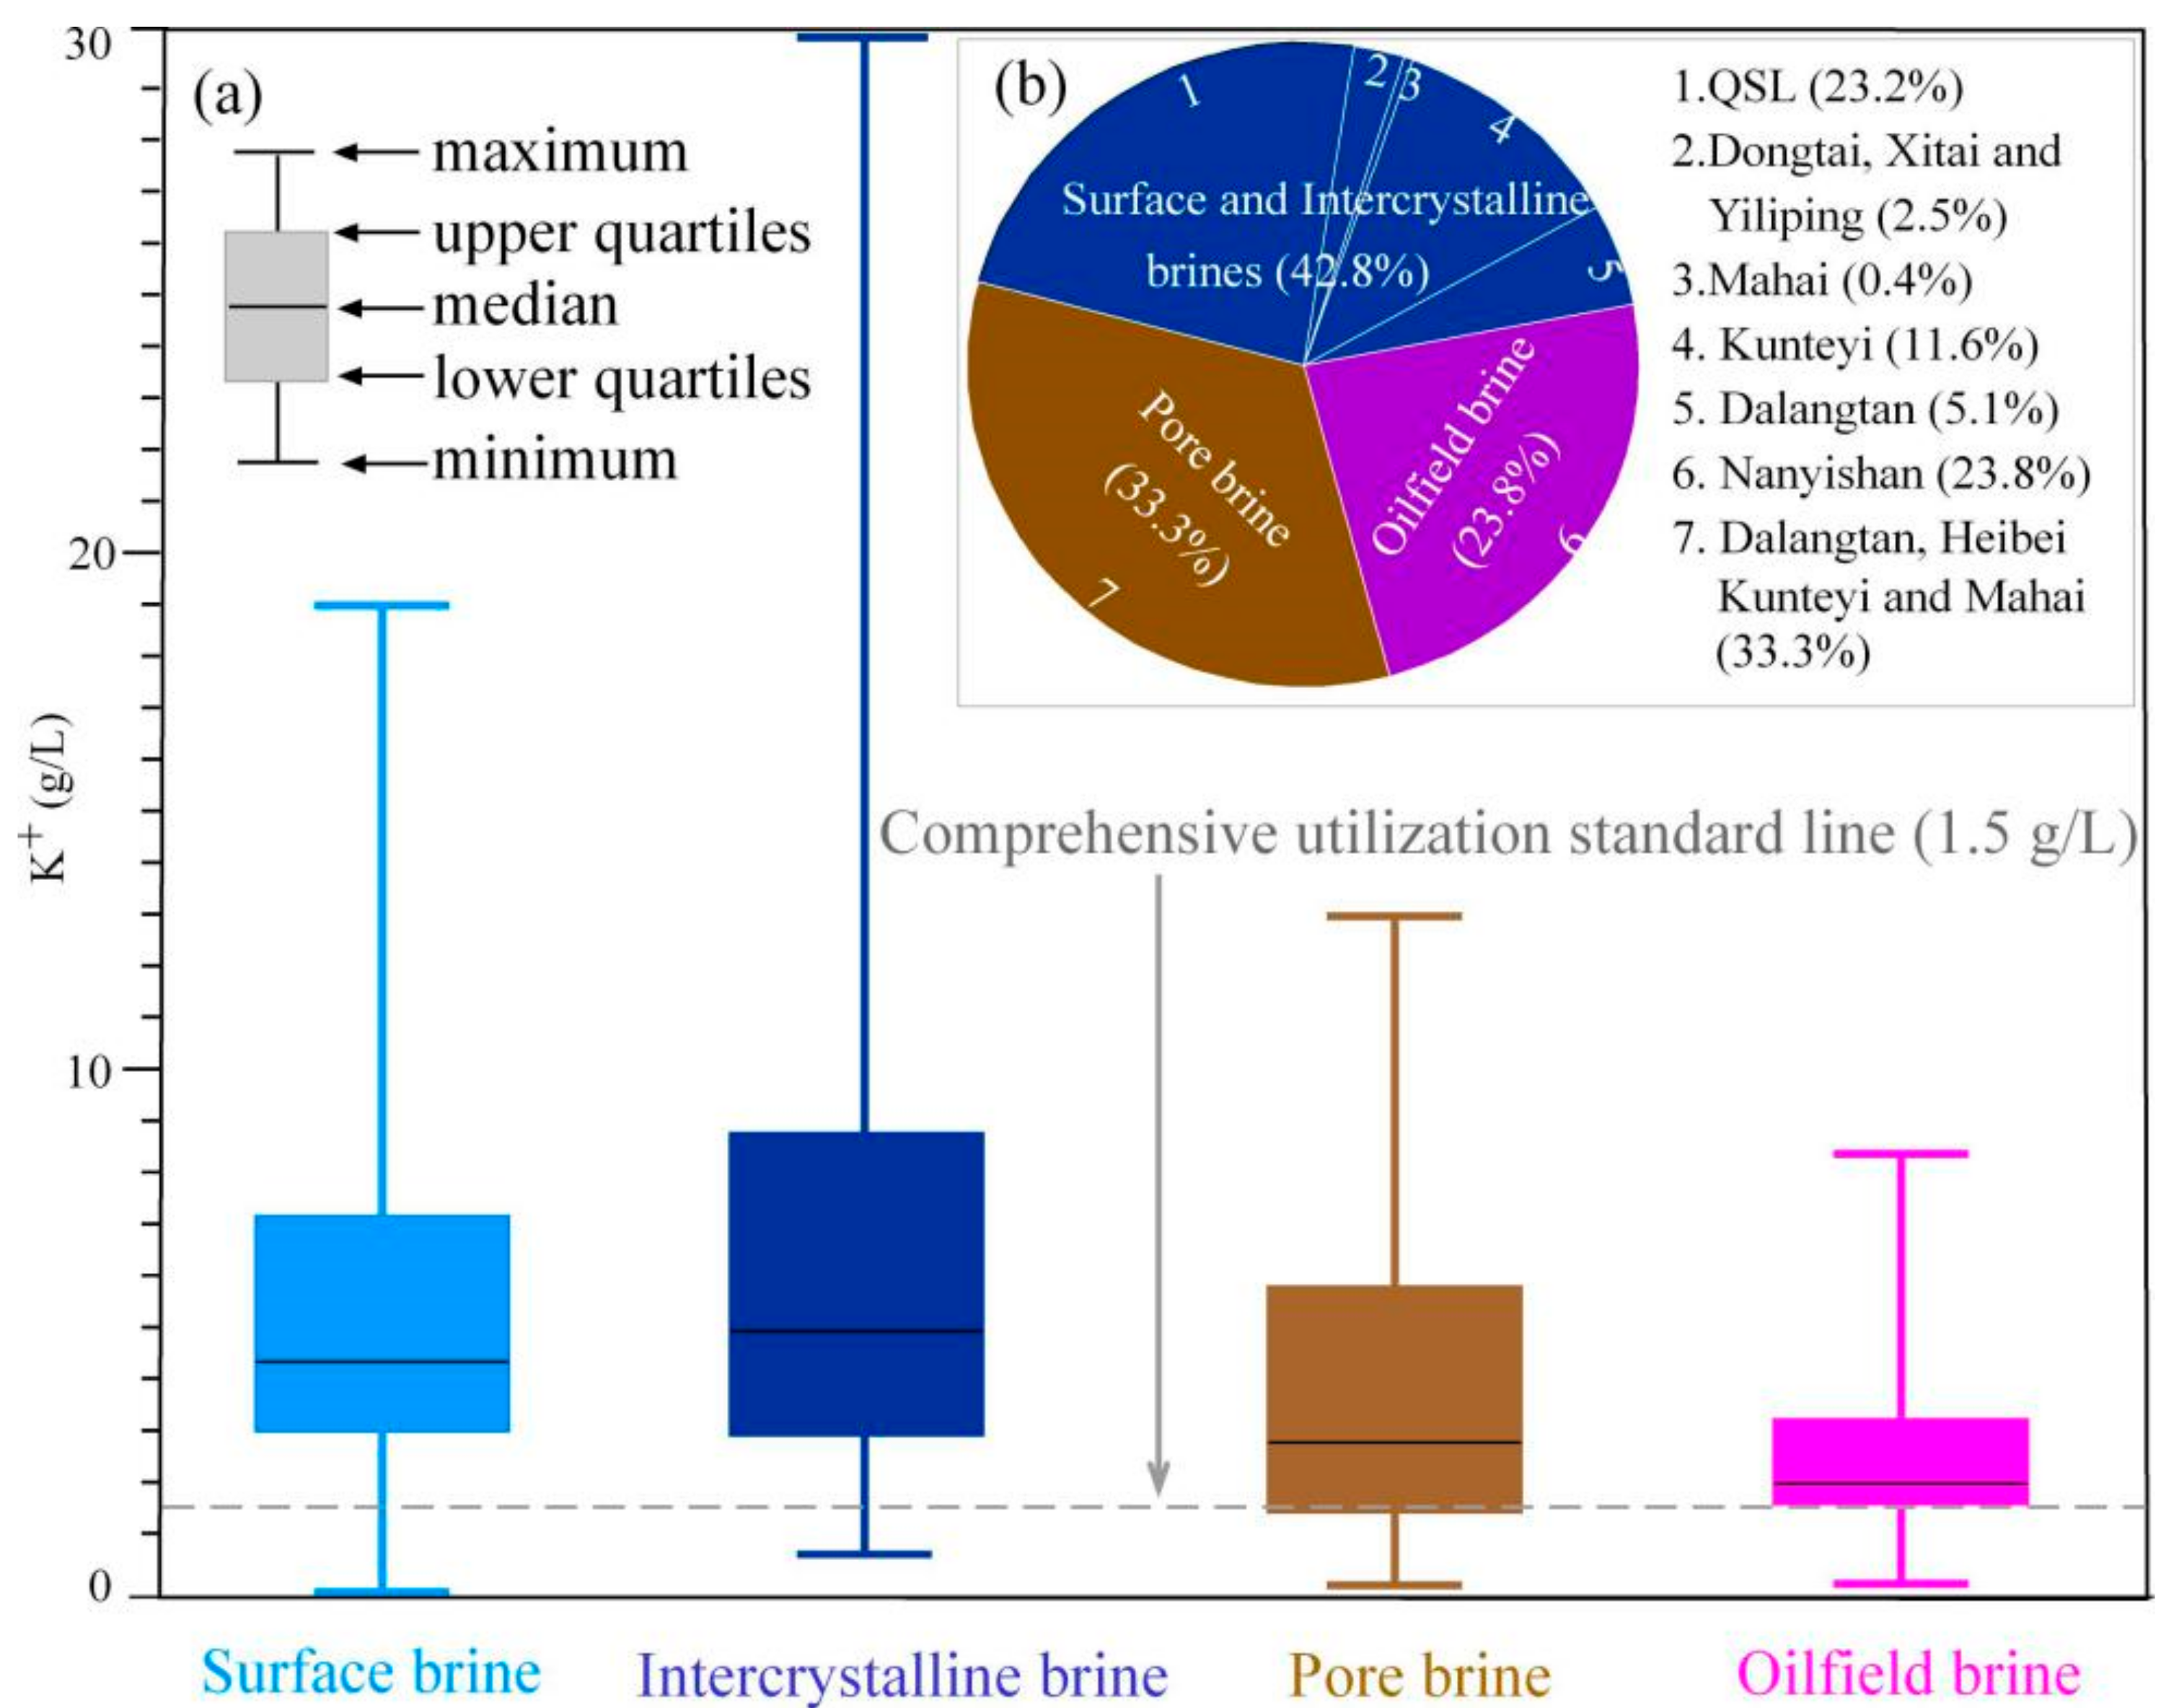
4.1. K+ Concentrations and TDS of Intercrystalline Brines in the QSL

The results (Table 1) show that the K+ concentrations of intercrystalline brines in the QSL range from 0.8 to 30.1 g/L, averaging 6.8 g/L. In detail, the highest K+ concentration of intercrystalline brine in QSL appears in the northern part of the Dabuxun Lake and the lowest K+ value is in the Qarhan section. The average K+ concentrations in the Bieletan (16.3 g/L) and Dabuxun (9.8 g/L) sections are much higher than those in the Qarhan (4.3 g/L) and Huobuxun (3.0 g/L) sections. The contour map shows that the high K+ concentrations appear near the river supplies, such as the Senie, Dabiele, Xiaobiele, West Dabuxun, and Dabuxun lakes, suggesting that the high K+ concentrations may be related to the river inflows (Figure 6).
The total dissolved solids (TDS) of intercrystalline brines in the QSL are generally high, ranging from 307.2 to 435.1 g/L, averaging 359.4 g/L (Table 1), which is about ten times higher than the TDS of modern seawater (35.0 g/L) [7]. In detail, the average TDS in the Bieletan (347.4 g/L), Dabuxun (350.8 g/L), and Qarhan (359.4 g/L) sections are comparable and higher than those in the Huobuxun (325.0 g/L) section. The eastern part of the Dabuxun section, which is affected by the Golmud River, has lower TDS compared to the western part of this section. The K+ concentrations and TDS of the intercrystalline brines are mismatched (Figure 6). High TDS does not correspond to high K+ concentrations in the QSL, especially in the Dabuxun section.

4.2. K Flux Calculation

The data of Q and C of each river are compiled from published data and shown in Table 2. Considering that the loss of K during the transportation process is ~47% [7], the annual input of KCl into the QSL by each river was calculated (Table 2). The results show that in the QSL, the amount of K supplied by rivers gradually decreases from west to east (Table 2).

4.3. The Contributions of Four Sources to the Major Ions in Rivers

The chemical compositions of each river are listed in Table S1. The results of the forward model (Figure 5c) demonstrate that the proportions of TZ+ derived from the atmospheric input vary from 0.48% to 14.82% with an average of 6.5%, indicating that the contribution of atmospheric input is minor. The average contributions from the carbonate weathering in the Wutumeiren, Qingshui, Tuolahai, Zaohuo, Golmud, and Nuomuhong rivers are 20.24%, 23.05%, 27.36%, 21.66%, 31.17%, and 14.99%, while those from the silicate weathering are 7.22%, 14.63%, 5.15%, 2.3%, 17.44%, and 22.5%, respectively. The calculations also reveal that the contributions of evaporites range from 44.28% to 70.56% in the whole study area. From the upper reaches to the lower reaches, the contributions of rock (silicate and carbonate) weathering decrease gradually, while those of evaporites increase (Figure 5c).

5. Discussion

5.1. The Source of K in the QSL from Flux Calculation Constraint

Previous studies on the formation of shallow K-rich brines (including surface brines and intercrystalline brines) in salt lakes in the QB have been reported. Chen and Bowler [26] proposed that the Qaidam “mega–paleolake” existed and migrated from west to east, followed by concentration of lake waters and formation of several salt lakes (from west to east, the Dalangtan, Chahansilatu, Kunteyi, and Yiliping playas and the QSL). Zhang [4] concluded that the environment of “high mountains and deep basins, and oscillating drying and wetting” in the QB is conducive to the enrichment of K in salt lakes. Subsequently, the mixing model of different waters [7,9,27,32]; the capture of paleolakes in the Kunlun Mountain by rivers and the migration to the Qarhan paleolake [49,50]; and the evaporation pumping model [5], have been proposed to explain the formation of giant potash deposit in the QSL. None of those studies included a water-flux weighted K+ concentration calculation in the salt lakes in the QB. Thus, a regional mass balance approach (Section 3.2.1.) was applied in the QSL in order to better understand the source of K in salt lakes in the QB.
Currently, there are two major water inflows (river water and spring water) into the QSL. The annual input of KCl into the QSL by each river was calculated and shown in Table 2. Assuming the constant input rate of river–sourced K over ~50 kys of salt precipitation in the QSL [9], the total amount of KCl brought by rivers is 659 million tons, which is higher than the proven reserves (540 million tons) of KCl in the QSL. Moreover, spring waters also bring K to the QSL. The total input of KCl by spring waters is about a quarter of the river waters (165 million tons, [7]). Thus, river water inflow should be the major source of K in the QSL. This is supported by the fact that many modern terminal lakes of large inland rivers, such as the Dongtai and Xitai salt lakes (supplied by Nalenggele River) in the middle QB (Figure 1b, [4]), and the Lop Nur Salt Lake (supplied by the Kongque River) in the Tarim Basin [51], contain K-rich brines.
Where does the K in rivers come from? The possible sources of solutes in river waters mainly include atmospheric input, evaporite dissolution, and rock (carbonate and silicate) weathering [37,38,39]. The main process that contributes K to the rivers in the QSL region will be discussed. Firstly, in the arid QB with little precipitation, atmospheric input is the main water source to the rivers but cannot be the major source of K because the K+ concentrations (0–0.38 mg/L) of atmospheric water are much lower than the river waters (3.85–36.11 mg/L) (Table 2). Secondly, the K from the evaporites is also insignificant due to that after correction for atmospheric input, the strong positive correlation between Cl and Na+ (Figure 5b) indicates that the Cl provided by the evaporite is mainly derived from halite rather than potassium chloride. The K in rivers is most likely derived from rock weathering, specifically, the silicate weathering, because carbonates only provide Ca2+, Mg2+, and CO32− to the rivers. In fact, there is a large area of granite outcrop in the eastern Kunlun Mountain and the average weight percentage of K in these rocks is as high as 3.5% [4,6,7]. The granite leaching experimental results also showed that K in granite could be leached significantly by waters under normal pressure and temperature [4,52]. Moreover, under the “high mountains and deep basins” environment, the rate of rock weathering and denudation should be accelerated, which can be proven by the huge clastic sediments of the Qaidam Basin [4]. A large amount of K in the granites can be released under this weathering process [4,52]. Therefore, the weathering of granites is the main source of the K in the QSL.
To quantitatively investigate the contributions of the above-mentioned four sources (atmospheric input, evaporite dissolution, carbonate and silicate weathering) for the salt load (K, Na, Ca, and Mg) in rivers, the forward model was used (Section 3.2.2.). The results are shown in Figure 5c and Table S1. The silicate weathering, which process provide K+ to rivers, accounts for on average 13.5% (Table S1) of the total dissolved cations.
In addition, previous studies [4,26,53] have demonstrated that modern salt lakes in the QB are the result of the migration and evolution of the “ancient Qaidam Lake.” From the Oligocene–Miocene–Pliocene–Pleistocene, the ancient Qaidam Lake migrated from the Dalangtan to Chahansilatu playas, further to Yiliping playa, and finally, to the QSL, which presents a reverse–S shape (Figure 7a) [8]. Did shallow K-rich brines (including surface brines and intercrystalline brines) in salt lakes in the eastern QB inherit K from the “ancient Qaidam Lake”?
The K+ contour map (Figure 7b) of shallow brines (including surface brines and intercrystalline brines) in salt lakes in the QB shows that the high K+ concentrations are distributed in the middle of the basin and present northwest–southeast direction, which is obviously contrary to the reverse–S evolution path. Therefore, the “ancient Qaidam Lake” contributed limited K to the QSL. The K-rich brines in the QSL mainly result from the evolution of inflowing river waters.

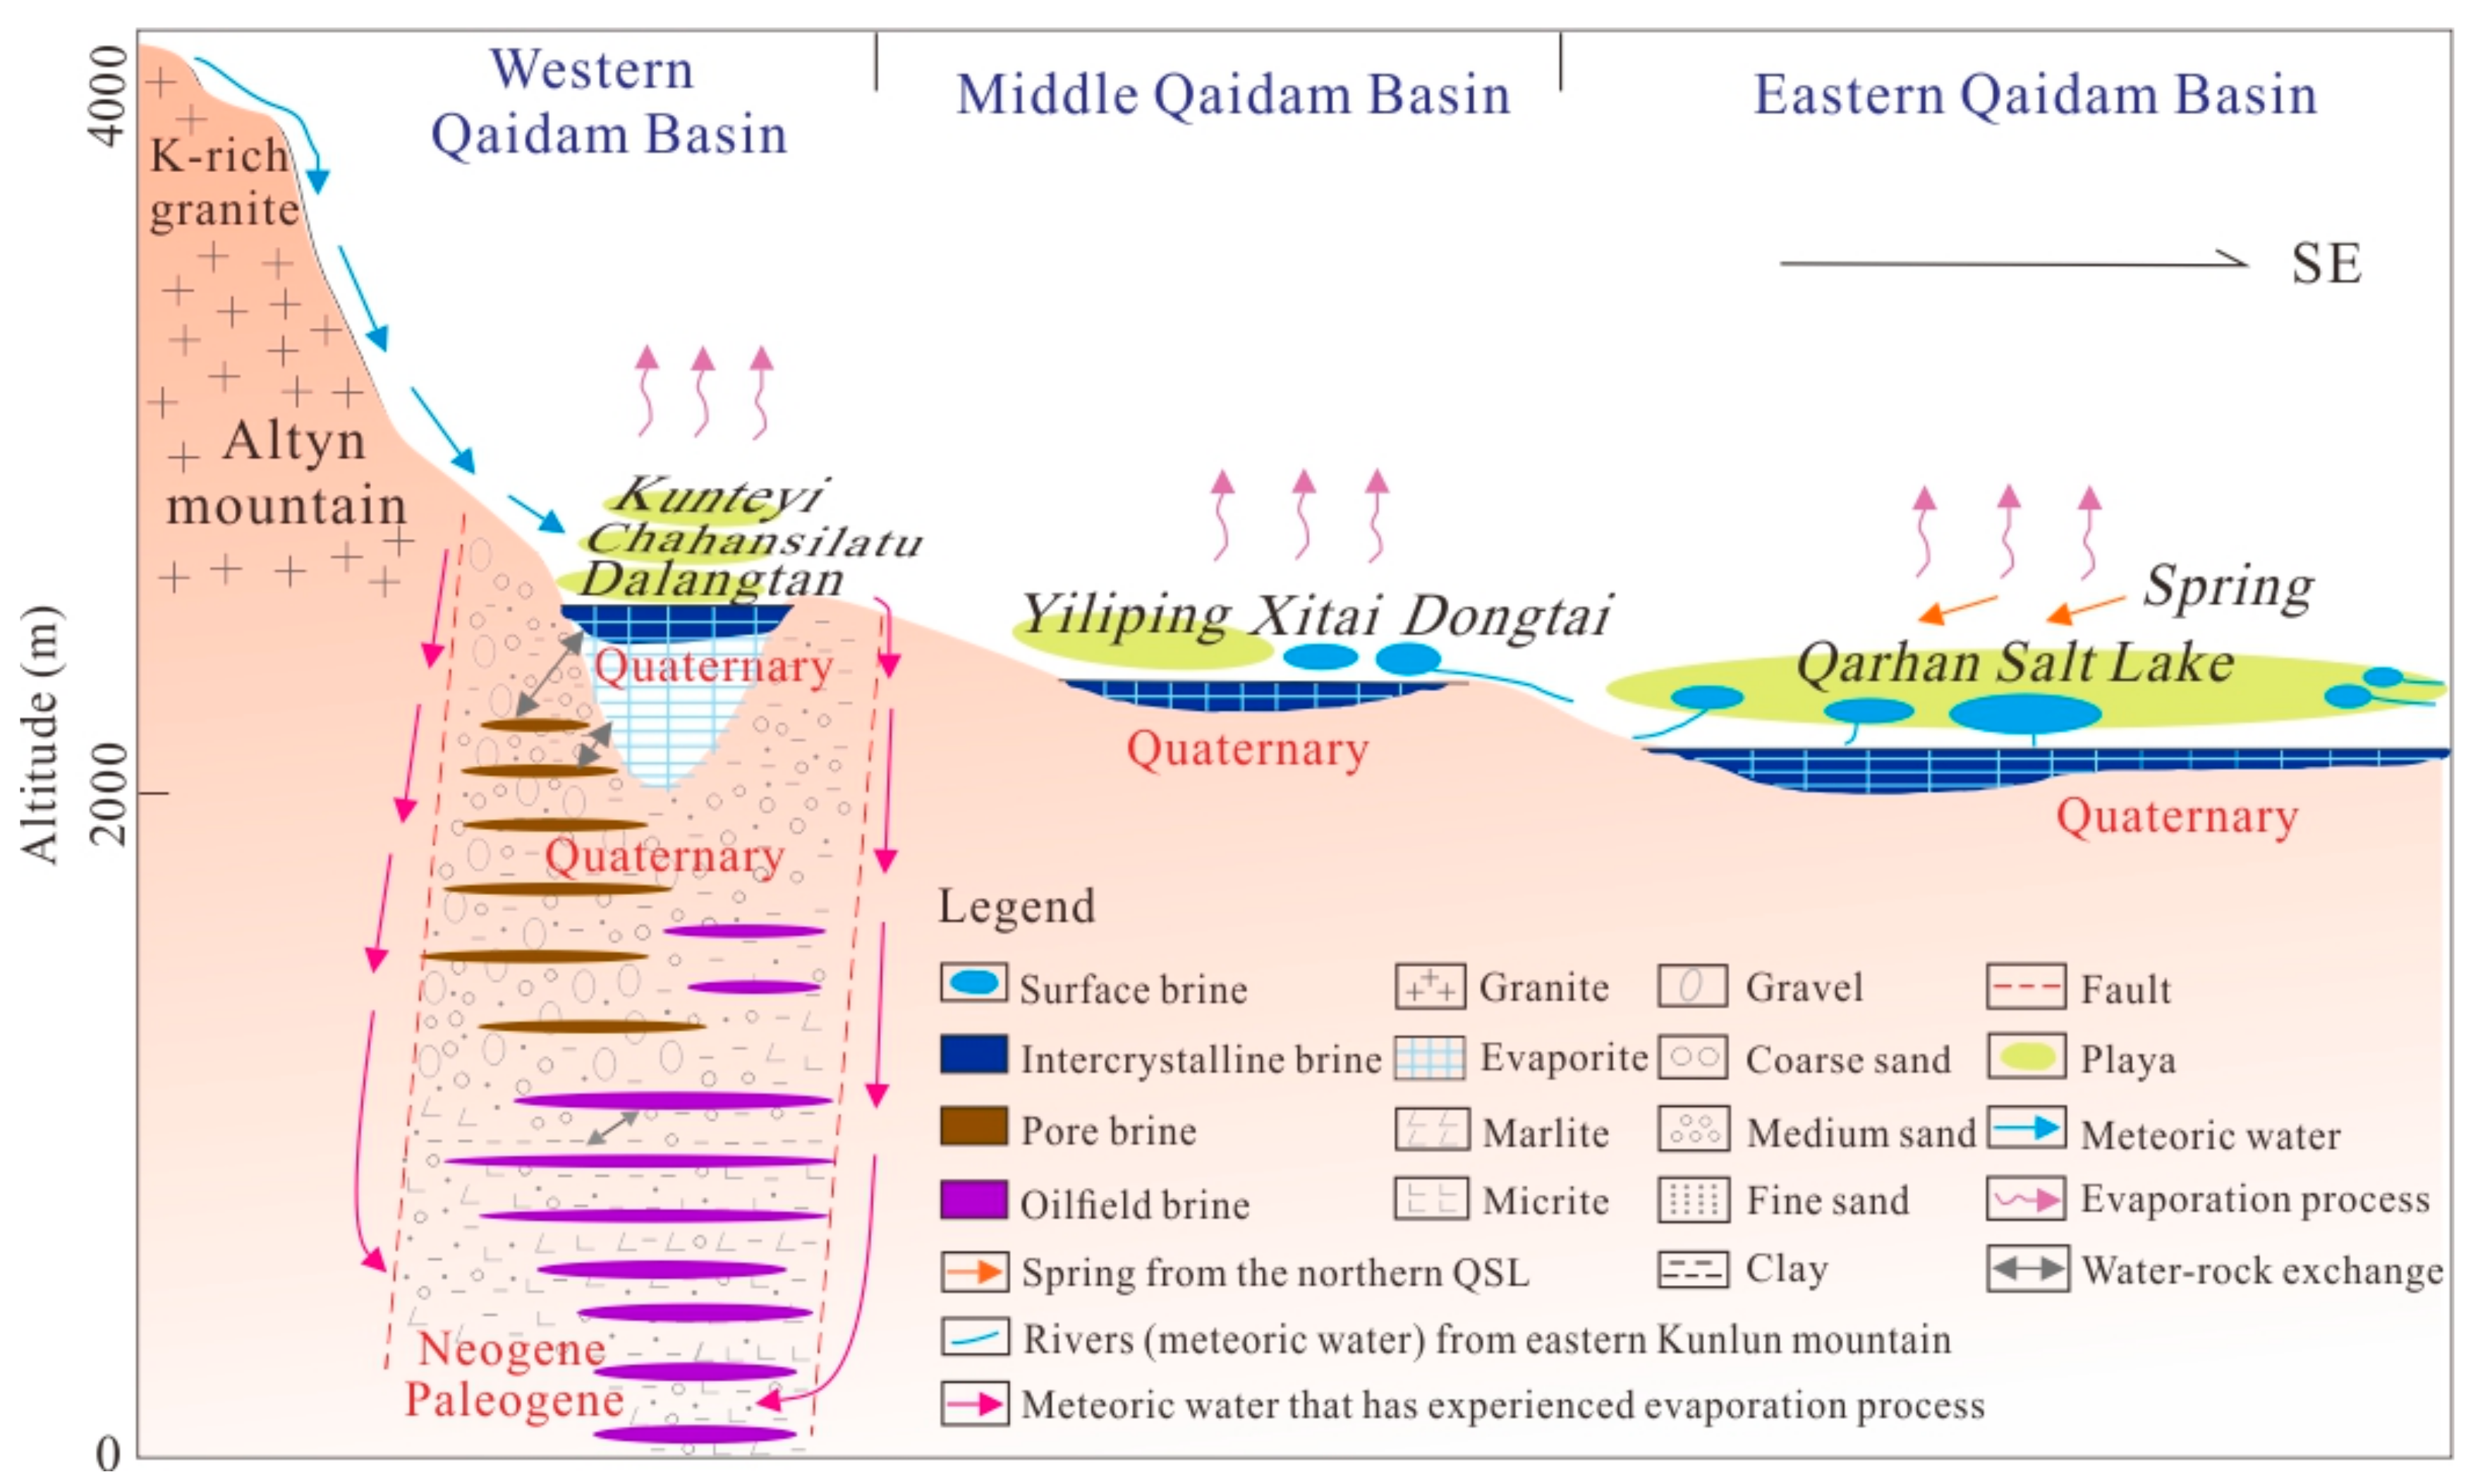
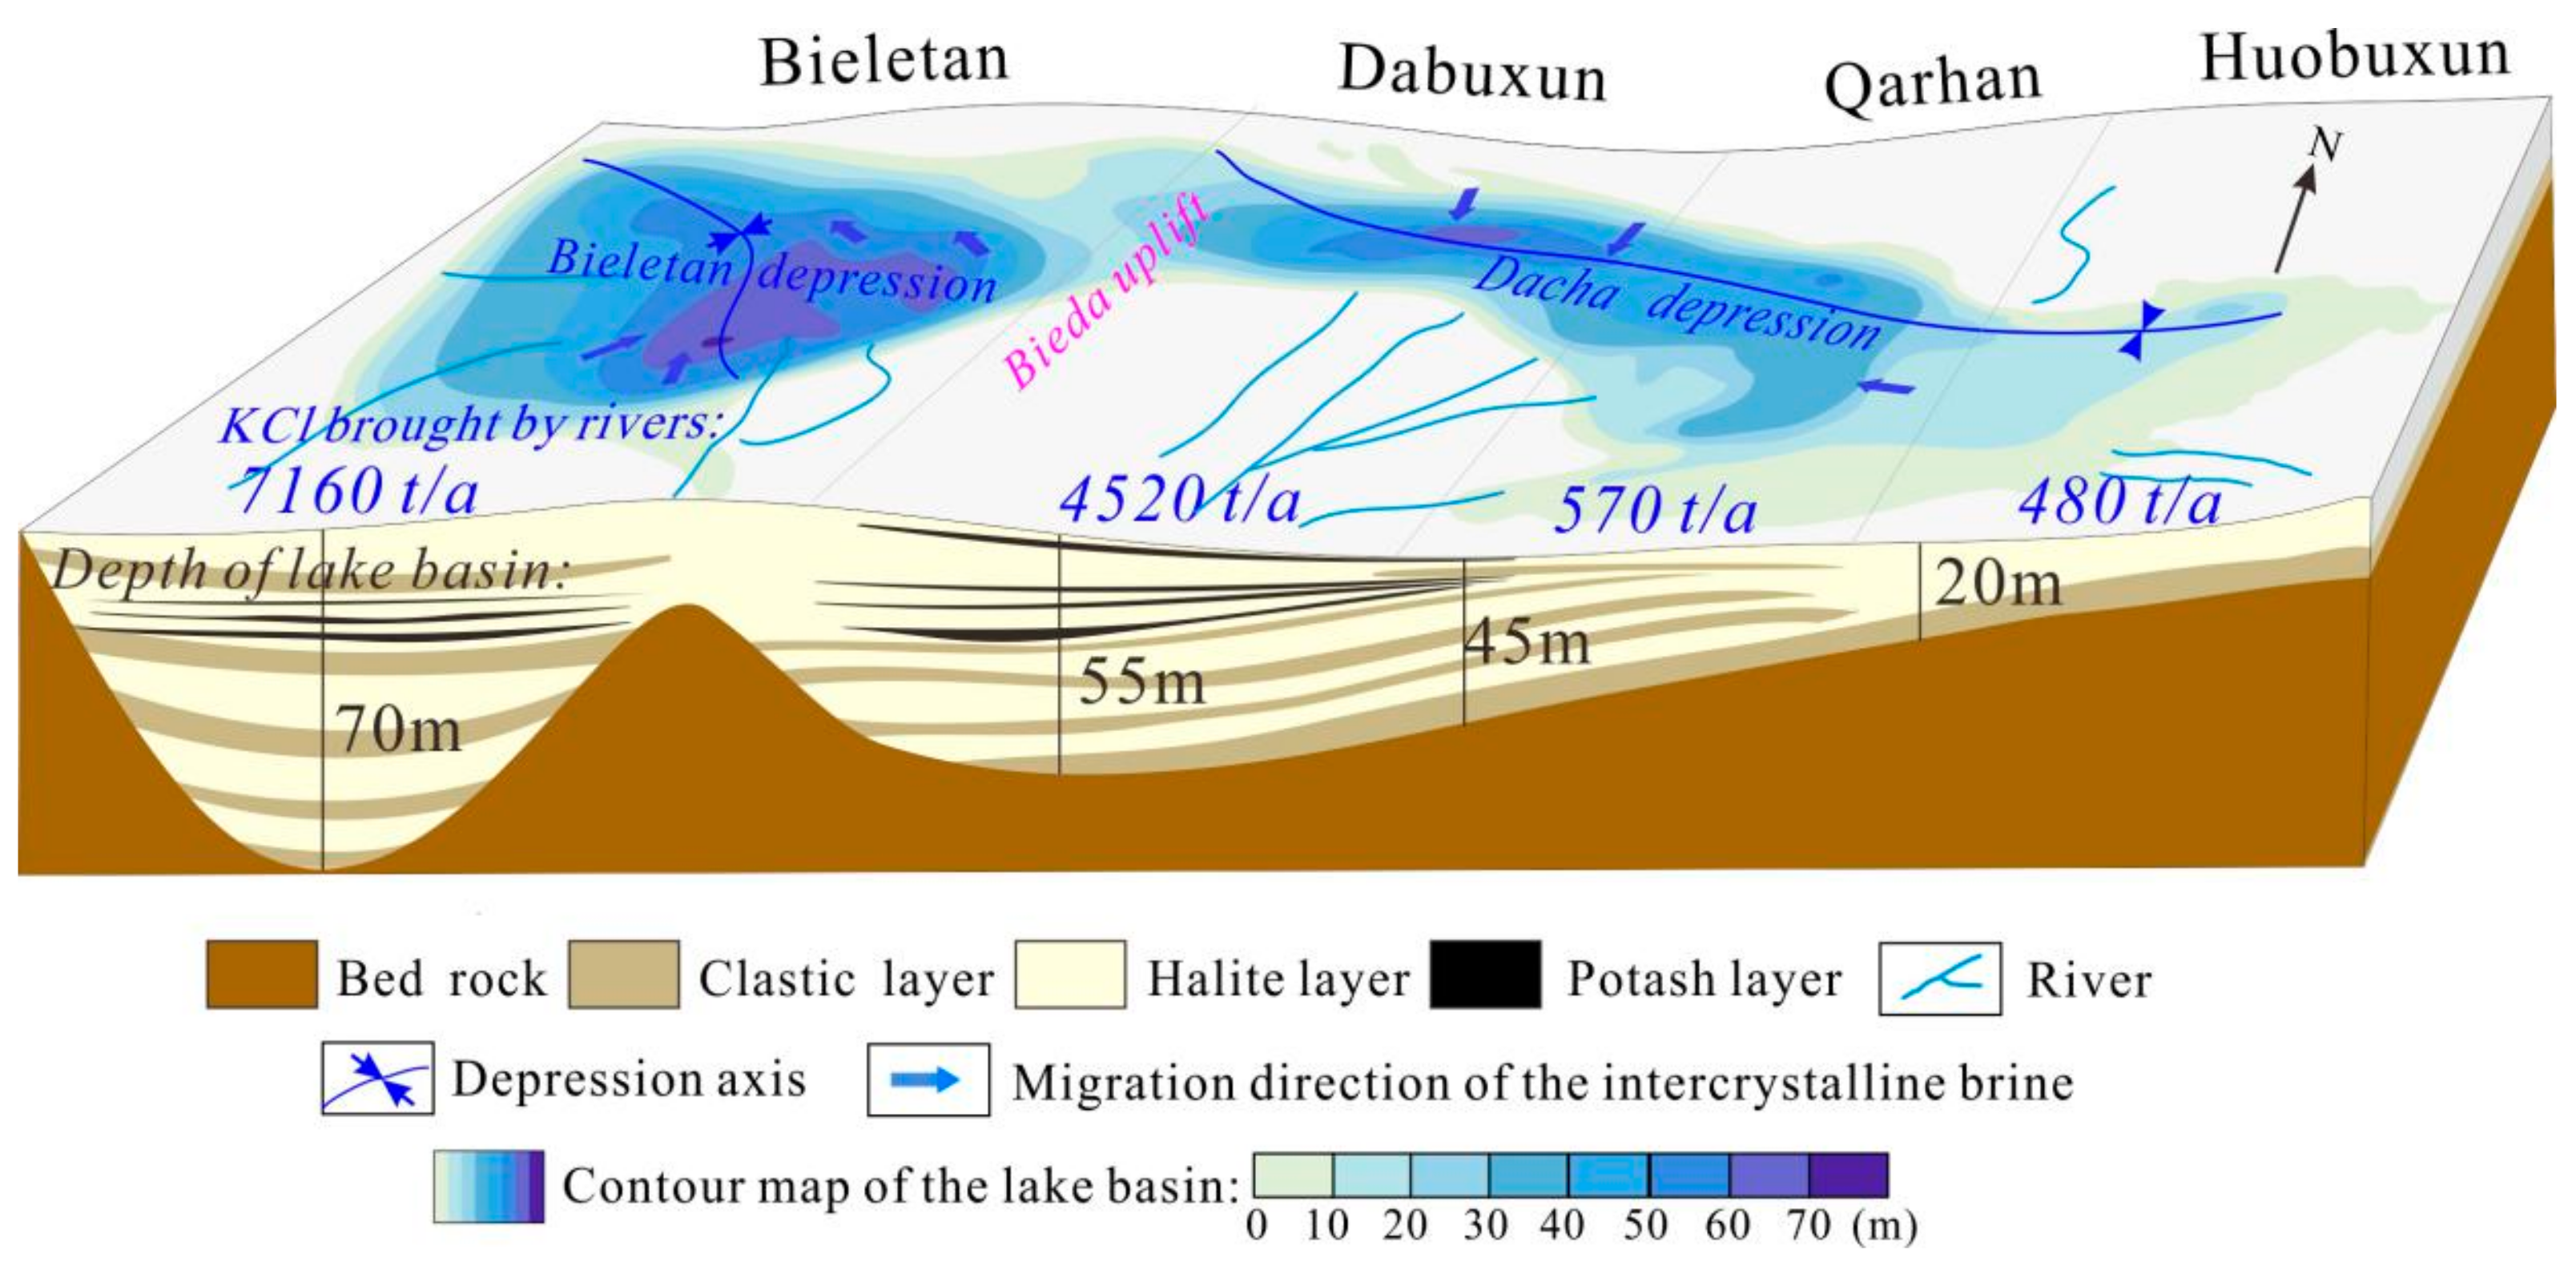
5.2. The Distribution and Sedimentary Pattern of Shallow Brines in the QB

Shallow brines include surface brine and intercrystalline brine (buried in evaporite layer with depth less than 100 m) and occur at the whole part of the basin (Figure 1, Figure 2, and Figure 8a). The comparisons indicate that K+ concentrations of shallow brines (surface brines and intercrystalline brines) are the highest in the QSL, ranging from 0.8 to 30.1 g/L. This enrichment should be interpreted by the following reasons. One is that rivers originating from the east Kunlun Mountain account for more than half of the total river runoff in the QB, which contributes more K to the QSL. The short flow distance of these rivers, indicating little K loss in the transportation paths, is also benefit to the K enrichment. Another is that the degree of evaporation and concentration of brines, revealed by the higher TDS (307.2–435.1 g/L, Table 1) than those in other salt lakes (Figure 8b), is appropriate for the K enrichment in brines in the QSL [6]. Yet another is that the mixing of two inflowing waters (river and spring waters) is conducive to the enrichment of K in the QSL. The mixing of the SO4-rich river water and Ca-rich spring water alters the chemical composition of a brine, resulting in a lack of the precipitation of K-bearing sulfate minerals [54], accelerating the enrichment of K in the brines in the QSL [9,27,32].
In addition, K+ concentrations of brines in different sections of the QSL are also uneven, and gradually decrease from the Bieletan section to the Huobuxun section (Table 1; Figure 3 and Figure 8a). The K flux calculation shows that the total amount of K brought by rivers to each section can lead to this uneven distribution (Table 2). Among ten main rivers inflowing into the QSL, Wutumeiren, Zaohuo, Tuolahai, and Qingshui rivers supply the Bieletan section and provide the highest K flux (Table 2), which results into the highest K+ concentrations in brines in this section (Table 1). Meanwhile, the QSL is divided into the Bieletan depression in the west and Dacha depression in the east by the Bieda uplift (Figure 9), which hinders hydrological connectivity of K-rich brines and produces uneven distribution of K+ concentrations in brines in these four sections [55]. Therefore, different river K recharge in different sections and isolated depressions are responsible for uneven K+ concentrations of brines in the QSL.

5.3. The Distribution, Source and Sedimentary Pattern of Deep Brines in the QB

The deep brines include pore brines and oilfield brines in the QB [18]. The pore brines have high TDSs of 200–350 g/L and their K+ concentrations are 0.22–13.00 g/L (average: 3.76 g/L) (Table S2; Figure 10a) [17,21]. These brines are mainly distributed in the depressed basins; for example, the Mahai, Dalangtan, Heibei, Chahansilatu, and Kunteyi playas (Figure 1 and Figure 10a). The reservoir of the pore brines is the early Pleistocene sand gravel layer and sand layer, overlaid by the Middle–Late Pleistocene evaporite and clay layer (Figure 2) [17]. The large reserves (~3.5 × 10⁸ t, [13]) and simple chemical compositions (mainly KCl and NaCl) of the pore brines make it a promising K resource for the future. Meanwhile, the oilfield brines are also a very important K resource in the QB for their high K+ concentrations (0.03–7.34 g/L, average 2.70 g/L; Table S2; Figure 3a) [14,15,16,19,20]. They mainly distributed in the Nanyishan and Shizigou anticline structure areas and occur in the Tertiary (Paleogene and Neogene) strata (Figure 1, Figure 2 and Figure 10a) [18]. The lithology of the reservoir for oilfield brines is sandstone, mudstone, siltstone, and marlite (Figure 2) [14,15,16,19,20].
Previous studies [14,15,16,17,18,19,20,21] show that these two types of deep brines have different sources of K and experienced different evolution processes. The origin of the pore brines was interpreted by the fact that the buried pore water leached the overlying evaporite layer (mainly halite) and obtained solutes [17]. We compared the K+, Na+, and Cl concentrations and the TDSs of these brines (Figure 10b), and found that the variations of these hydrochemical parameters have a consistent trend, implying that the source of K+ is similar to that of Na+, Cl, and TDS. Therefore, the water–salt interaction (original pore water with the overlying evaporites containing potash salts or K-rich intercrystalline brines) is responsible for the formation of the K-rich pore brines. By contrast, the origin of the oilfield brines is used to interpreted as meteoric waters according to the D–O isotopic evidence [15,20]. The meteoric waters generally experience salt dissolution, water–rock interactions, and the mixing of hydrothermal fluids when circulating the strata, supported by the Na/Cl and Br/Cl ratios, and D–O–Sr isotopes of the oilfield brines. The K in the oilfield brines may be derived from the meteoric waters, salt dissolution, and mixing of hydrothermal fluids. Meanwhile, the water–rock interaction may have depleted K in the oilfield brines according to the studies by Carpenter et al [59]. The loss of K+ in the oilfield brines happened through the conversion of clay minerals (kaolinite or smectite) to K-feldspar [59,60,61,62]:
Kaolinite + K+ + CaCO3 → K-feldspar + Ca2+;
Smectite + K+ → K-feldspar + Na+ + H+.
These water–rock interactions are ubiquitous in the oilfield brines [59] and are evidenced by the positive excursion of δ18O (Figure 10c) [14,15,63,64]. This conclusion is also confirmed by the fact that the Ca2+/Cl (0.007–0.174, average 0.03) and Na+/Cl (0.50–1.62, average 0.63) ratios of oilfield brines are much higher than those of shallow brines (surface brines and intercrystalline brines) in salt lakes (Ca2+/Cl: 0.001–0.07, average 0.01; Na+/Cl: 0.01–0.61, average 0.23) in the QB (Table S2). Moreover, the elevated K-feldspar contents in the Paleogene and Neogene strata can also verify these process [53,65]

6. Conclusions

The QB is a typical terrestrial evaporite basin, which contains an abundance of K-rich brines. These K-rich brines include the shallow brines in salt lakes (surface brines and intercrystalline brines) and deep brines (pore brines and oilfield brines) in the strata. The K+ concentrations of 64 intercrystalline brines in the QSL, which is the largest playa in the QB, were analyzed. Combining these results with the previously-reported chemical compositions of river waters and deep brines (pore brines and oilfield brines), the K+ concentrations of shallow brines (surface brines and intercrystalline brines) from different salt lakes in the QB, the source of K, and the distribution and sedimentary pattern of K-rich brines in the QB were compared. Several interpretations were made:
(1)
The K in shallow brines (surface brines and intercrystalline brines) in the QB are mainly from high–flux K input by rivers which achieve K from silicate weathering, rather than from the remnant of the “ancient Qaidam Lake.” The results calculated by using the forward model showed that evaporites contribute to most of the salt load (K+, Na+, Ca2+, and Mg2+) in rivers in the QSL, followed by the carbonate and silicate weathering.
(2)
The K+ concentrations of shallow brines (surface brines and intercrystalline brines) in the QB are uneven. The amount of river K recharge, the appropriate evaporation degree, and the mixture of river and spring waters jointly contribute to this phenomenon. The uneven K+ concentrations of brines in the QSL result from different river K recharge in different sections and isolated depressions.
(2)
The deep brines (pore brines and oilfield brines) are mainly distributed in the western QB. The water–salt interaction of original pore waters with the K-bearing evaporite layer (potash salts and/or K-rich intercrystalline brines) is the main reason for the formation of the K-rich pore brines. By contrast, the K in oilfield brines in the QB may be meteoric water, salt dissolution, and the mixing of hydrothermal fluids’ origins, and the conversion of clay minerals to K-feldspar may consume K in the oilfield brines.

Supplementary Materials

The following are available online at https://www.mdpi.com/2075-163X/9/11/655/s1, Table S1: The chemical compositions of each river in the eastern Kunlun Mountain; Table S2: The chemical compositions of different types of brines in the QB.

Author Contributions

X.Z. analyzed the data and wrote the paper; Q.F., Q.L., Z.Q. and Y.D. discussed the results and contributed the central idea; H.W. and F.S. collected the samples and provided editing work.

Funding

This research was funded by the National Natural Science Foundation of China (grant number 41872093), the Open Research Project from the State Key Laboratory of Geological Processes and Mineral Resources, China University of Geosciences (GPMR201824), and the One–Thousand Innovative Talent Project of Qinghai Province (grant to QS Fan).

Acknowledgments

We thank Liyan Shao for helping with the figure making. We are grateful to editors and reviewers for their meaningful suggestions.

Conflicts of Interest

The authors declare no conflict of interest.

References

  1. Liu, C.L.; Wang, L.C.; Yan, M.D.; Zhao, Y.J.; Cao, Y.T.; Fang, X.M.; Shen, L.J.; Wu, C.H.; Lv, F.L.; Ding, T. The Mesozoic–Cenozoic tectonic settings, paleogeography and evaporitic sedimentation of Tethyan blocks within China: Implications for potash formation. Ore Geol. Rev. 2018, 102, 406–425. [Google Scholar] [CrossRef]
  2. Warren, J.K. Evaporites through time: Tectonic, climatic and eustatic controls in marine and nonmarine deposits. Earth Sci. Rev. 2010, 98, 217–268. [Google Scholar] [CrossRef]
  3. Klingspor, A.M. Middle Devonian Muskeg evaporites of western Canada. AAPG Bull. 1969, 53, 927–948. [Google Scholar]
  4. Zhang, P.X. Salt Lake in Qaidam Basin; Science Press: Beijing, China, 1987. [Google Scholar]
  5. Hsü, J.H.; Qian, Z.H.; Lian, W.; Yuan, Z.; Chen, Y.C.; Wu, B.H.; Wang, M.L. Origin of potassium evaporation pump in Qarhan Salt Lake, China. Geol. Chem. Miner. 1991, 12, 1–28. [Google Scholar]
  6. Yang, Q.; Wu, B.H.; Wang, S.Z.; Cai, K.Q.; Qian, Z.H. Geology of Potassium Deposit in Qarhan Salt Lake; Science Press: Beijing, China, 1993. [Google Scholar]
  7. Yuan, J.Q.; Yang, Q.; Sun, D.P.; Huo, C.Y.; Cai, K.Q.; Wang, W.D.; Liu, X.J. The Formation Conditions of Potash Deposit in Qarhan Salt Lake; Geological Press: Beijing, China, 1995. [Google Scholar]
  8. Zheng, M.P.; Zhang, Y.S.; Liu, X.F.; Qi, W.; Kong, F.J.; Nie, Z.; Pu, L.Z.; Hou, X.H.; Wang, H.L.; Zhang, Z.; et al. Progress and prospect of salt lake research in China. Acta Geol. Sin. 2016, 4, 1195–1235. [Google Scholar] [CrossRef]
  9. Fan, Q.S.; Lowenstein, T.K.; Wei, H.C.; Yuan, Q.; Qin, Z.J.; Shan, F.S.; Ma, H.Z. Sr isotope and major ion compositional evidence for formation of Qarhan salt lake, western China. Chem. Geol. 2018, 497, 128–145. [Google Scholar] [CrossRef]
  10. Cao, W.H.; Wu, C. Brine Resources and the Technology of Their Comprehensive Utilization; Geology Press: Beijing, China, 2004. [Google Scholar]
  11. Yu, S.S.; Liu, X.Q.; Tan, H.B.; Cao, G.C. Sustainable Utilization of Qarhan Salt Lake Resources; Science Press: Beijing, China, 2009. [Google Scholar]
  12. Shi, Z.L.; Du, P.Y.; Wang, X.Q. Analysis and Study on Influential Factors of Potassium Chloride Production by Reverse Flotation. J. Salt Sci. Chem Ind. 2018, 47, 39–41. [Google Scholar]
  13. Zheng, M.P.; Hou, X.H.; Zhang, Y.S.; Xing, E.Y.; Li, H.P.; Yin, H.W.; Yu, C.Q.; Wang, N.J.; Deng, X.L.; Wei, Z.; et al. Progress in the investigation of potash resources in western China. Geol. China. 2018, 3, 392–401. [Google Scholar] [CrossRef]
  14. Fan, Q.S.; Ma, H.Z.; Tan, H.B.; Li, T.W.; Xu, J.X. Hydrochemical characteristics of brines and Potassium prospecting researches in Western Qaidam Basin. Acta Geosci. Sin. 2007, 5, 446–455. [Google Scholar]
  15. Fan, Q.S.; Ma, H.Z.; Lai, Z.P.; Tan, H.B.; Li, T.W. Origin and evolution of oilfield brines from Tertiary strata in western Qaidam Basin: Constraints from 87Sr/86Sr, δD, δ18O, δ34S and water chemistry. Chin. J. Geochem. 2010, 29, 446–454. [Google Scholar] [CrossRef]
  16. Tan, H.B.; Rao, W.B.; Ma, H.Z.; Chen, J.S.; Li, T.W. Hydrogen, oxygen, helium and strontium isotopic constraints on the formation of oilfield waters in the western Qaidam Basin, China. J. Asian Earth Sci. 2011, 40, 651–660. [Google Scholar] [CrossRef]
  17. Li, H.P.; Zheng, M.P.; Hou, X.H.; Sun, B.T.; Liu, G.T.; Dou, Q.C. Hydrochemistry characteristics and origin of new brine sandy gravel in early Pleistocene of Heibei concave in Qaidam Basin. Earth Sci. J. China Univ. Geosci. 2014, 10, 1433–1442. [Google Scholar]
  18. Li, H.P.; Zheng, M.P. Metallogenic characteristics of the potash deposit in deep brines in the western Qaidam Basin. Miner. Depos. 2014, 33, 935–936. [Google Scholar]
  19. Li, J.S.; Li, T.W.; Peng, X.M.; Han, Y.H.; Li, Z.P.; Ma, H.Z. Hydrogeochemical behaviors of oilfield water in the Tertiary in western Qaidam Basin. Oil Gas Geol. 2014, 1, 50–61. [Google Scholar]
  20. Li, H.P.; Zheng, M.P.; Hou, X.H.; Yan, L.J. Control factors and water chemical characteristics of potassium-rich deep brine in Nanyishan structure of western Qaidam Basin. Acta Geosci. Sin. 2015, 36, 41–50. [Google Scholar] [CrossRef]
  21. Yue, X.; Liu, X.X.; Lu, L.; Zhang, X.D.; Fan, Z.L.; Yu, X.L. Hydrochemical characteristics and origin of deep pore brine deposit in Mahai Baisn. Acta Sedimentol. Sin. 2019, 1, 1–12. [Google Scholar]
  22. Li, W.; Dong, Y.P.; Song, P.S. Development and Utilization of Salt Lake Brine Resources; Chemical Industry Press: Beijing, China, 2012. [Google Scholar]
  23. Guo, A.L.; Zhang, G.W.; Qiang, J.; Li, G.; Yao, A.P. An Indosinian Orogenic Belt in the Northeastern Qinghai–Tibet Plateau, China: Geochemical and Geochronological Evidence. Geochim. Cosmochim. Acta. 2008, 72, A335. [Google Scholar]
  24. Tan, H.B.; Chen, J.; Rao, W.B.; Zhang, W.J.; Zhou, H.F. Geothermal constraints on enrichment of boron and lithium in salt lakes: An example from a river–salt lake system on the northern slope of the eastern Kunlun Mountains, China. J. Asian Earth Sci. 2012, 51, 21–29. [Google Scholar] [CrossRef]
  25. Yin, A.; Rumelhart, P.; Butler, R.; Cowgill, E.; Harrison, T.; Foster, D.; Ingersoll, R.; Zhang, Q.; Zhou, X.Q.; Wang, X.F. Tectonic history of the Altyn Tagh fault system in northern Tibet inferred from Cenozoic sedimentation. Geol. Soc. Am. Bull. 2012, 114, 1257–1295. [Google Scholar] [CrossRef]
  26. Chen, K.Z.; Bowler, J.M. Late Pleistocene evolution of salt lakes in the Qaidam Basin, Qinghai Province, China. Paleogeogr. Paleoclimatol. Paleoecol. 1986, 54, 87–104. [Google Scholar]
  27. Zhang, P.X.; Zhang, B.Z.; Lowenstein, T.K.; Spencer, R.J. Origin of Ancient Anomalous Potassium Evaporites; Science Press: Beijing, China, 1993. [Google Scholar]
  28. Fan, Q.S.; Ma, H.Z.; Wei, H.C.; Shan, F.S.; An, F.Y.; Xu, L.M.; Madsen, D.B. Late Pleistocene paleoclimatic history documented by an oxygen isotope record from carbonate sediments in Qarhan Salt Lake, NE Qinghai–Tibetan Plateau. J. Asian Earth Sci. 2014, 85, 202–209. [Google Scholar] [CrossRef]
  29. Fan, Q.S.; Ma, H.Z.; Ma, Z.B.; Wei, H.C.; Han, F.Q. 2014b. An assessment and comparison of 230Th and AMS 14C ages for lacustrine sediments from Qarhan Salt Lake area in arid western China. Environ. Earth Sci. 2014, 71, 1227–1237. [Google Scholar] [CrossRef]
  30. Cai, K.Q.; Gao, J.H. Formation conditions of potassium deposit in Qarhan Salt Lake. Geosci. Front. 1994, 1, 3–4. [Google Scholar]
  31. Duan, Z.H.; Yuan, J.Q. The origin of saline materials of Qarhan Salt Lake in Qaidam Basin, China. Geoscience 1988, 4, 420–428. [Google Scholar]
  32. Lowenstein, T.K.; Spencer, R.J.; Zhang, P.X. Origin of ancient potash evaporites: Clues from the modern nonmarine Qaidam Basin of western China. Science 1989, 245, 1090–1092. [Google Scholar] [CrossRef]
  33. Lowenstein, T.K.; Risacher, F. Closed basin brine evolution and the influence of Ca–Cl inflow waters: Death Valley and Bristol Dry Lake California, Qaidam Basin, China, and Salar de Atacama, Chile. Aquetic Geochem. 2009, 15, 71–94. [Google Scholar] [CrossRef]
  34. Wang, S.J. Prospects for tapping the resources of the Qarhan Salt Lake. Geol. Chem. Miner 1999, 3, 175–180. [Google Scholar]
  35. Wang, C.N.; Guo, X.H.; Ma, M.Z.; Li, J.D. Ore–forming geological background of K–Mg salt in Qarhan Salt Lake. Northwest. Geol. 2008, 1, 97–106. [Google Scholar]
  36. Qinghai Institute of Salt Lakes. Methods for Analysis of Brine and Salt; Science Press: Beijing, China, 1973. [Google Scholar]
  37. Noh, H.; Hub, Y.; Qin, J.H.; Ellis, A. Chemical weathering in the Three Rivers region of Eastern Tibet. Geochim. Cosmochim. Acta. 2009, 73, 1857–1877. [Google Scholar] [CrossRef]
  38. Xiao, J.; Jin, Z.D.; Ding, H.; Wang, J.; Zhang, F. Geochemistry and solute sources of surface waters of the Tarim River Basin in the extreme arid region, NW Tibetan Plateau. J. Asian Earth Sci. 2012, 54, 162–173. [Google Scholar] [CrossRef]
  39. Wu, W.H. Hydrochemistry of inland rivers in the north Tibetan Plateau: Constraints and weathering rate estimation. Sci. Total Environ. 2016, 541, 468–482. [Google Scholar] [CrossRef] [PubMed]
  40. Galy, A.; France–Lanord, C. Weathering processes in the Ganges–Brahmaputra basin and the riverine alkalinity budget. Chem. Geol. 1999, 159, 31–60. [Google Scholar] [CrossRef]
  41. Moon, S.; Huh, Y.; Qin, J.; Van Pho, N. Chemical weathering in the Hong Red River basin: Rates of silicate weathering and their controlling factors. Geochim. Cosmochim. Acta 2007, 71, 1411–1430. [Google Scholar] [CrossRef]
  42. Jiang, H.; Liu, W.J.; Xu, Z.F.; Zhou, X.D.; Zheng, Z.Y.; Zhao, T.; Zhou, L.; Zhang, X.; Xu, Y.F.; Liu, T.Z. Chemical weathering of small catchments on the Southeastern Tibetan Plateau I: Water sources, solute sources and weathering rates. Chem. Geol. 2018, 500, 159–174. [Google Scholar] [CrossRef]
  43. Xu, Z.; Liu, C.Q. Water geochemistry of the Xijiang basin rivers, South China: Chemical weathering and CO2 consumption. Appl. Geochem. 2010, 25, 1603–1614. [Google Scholar] [CrossRef]
  44. Stallard, R.F.; Edmond, J.M. Geochemistry of the Amazon: 2. The influence of geology and weathering environment on the dissolved load. J. Geophys. Res. 1983, 88, 9671–9688. [Google Scholar] [CrossRef]
  45. White, A.F.; Blum, A.E. Effect of climate on chemical weathering in watersheds. Geochim. Cosmochim. Acta 1995, 59, 1729–1747. [Google Scholar] [CrossRef]
  46. Gaillardet, J.; Dupre, B.; Louvat, P.; Allegre, C.J. Global silicate weathering and CO2 consumption rates deduced from the chemistry of large rivers. Chem. Geol. 1999, 159, 3–30. [Google Scholar] [CrossRef]
  47. Tan, H.B.; Liu, X.Q.; Yu, S.S.; Lyu, Y.P. Character of Hydrochemistry in Golmud River–Dabsan Lake Water. J. Lake Sci. 2001, 13, 43–50. [Google Scholar]
  48. Du, Z.M. Hydrochemical changes of waters from the upper–middle reaches of Golmud river and their influencing factors. J. Salt Lake Res. 2018, 1, 25–31. [Google Scholar]
  49. Zhu, Y.Z.; Li, Z.Y.; Wu, B.H.; Wang, M.L. The formation of the Qarhan saline lakes as viewed from the Neotectonic movement. Acta Geol. Sin. 1990, 1, 13–21. [Google Scholar]
  50. Zhu, Y.Z.; Zhong, J.H.; Li, W.S. Neotectonic Movement and Evolution of Saline Lakes in the Qaidam Basin; Geological Press: Beijing, China, 1994. [Google Scholar]
  51. Liu, C.L.; Wang, M.L. Evaluation of Quaternary depositional environments and forming of potash deposits in Lop lake, Xinjiang, China. Acta Geosci. Sin. 1999, 20, 264–270. [Google Scholar]
  52. Chen, K.Z.; Yang, S.X.; Zheng, X.Y. Salt lakes in the Tebet Plateau. Acta Geol. Sin. 1981, 1, 13–21. [Google Scholar]
  53. Guo, P.; Liu, C.Y.; Huang, L.; Yu, M.L.; Wang, P.; Zhang, G.Q. Palaeohydrological evolution of the late Cenozoic saline lake in the Qaidam Basin, NE Tibetan Plateau: Tectonic vs. climatic control. Glob. Planet. Chang. 2018, 165, 44–61. [Google Scholar] [CrossRef]
  54. Yuan, J.Q.; Huo, C.Y. Genesis of the sylvinite deposits in the Qarhan Salt Lake, Qinghai province. Earth Sci. 1981, 1, 207–213. [Google Scholar]
  55. Yu, J.Q.; Gao, C.L.; Cheng, A.Y. Geomorphic, hydroclimatic and hydrothermal controls on the formation of lithium brine deposits in the Qaidam Basin, northern Tibetan Plateau, China. Ore Geol. Rev. 2013, 50, 171–183. [Google Scholar] [CrossRef]
  56. Craig, H. Isotopic variations in meteoric waters. Science 1961, 133, 1702–1703. [Google Scholar] [CrossRef] [PubMed]
  57. Xiao, Y.; Shao, J.L.; Frape, S.K.; Cui, Y.L.; Dang, X.Y.; Wang, S.B.; Ji, Y.H. Groundwater origin, flow regime and geochemical evolution in arid endorheic watersheds: A case study from the Qaidam Basin, northwestern China. Hydrol. Earth Syst. Sci. 2018, 22, 4381–4400. [Google Scholar] [CrossRef]
  58. Xu, W. Groundwater Cycle Patterns and its Response to Human Activities in Nalenggele Alluvial–Proluvial Plain. Ph.D. Thesis, Jilin University, Changchun, China, 2015. [Google Scholar]
  59. Carpenter, A.B. Origin and Chemical Evolution of Brines in Sedimentary Basins. Proceedings of the SPE Annual Fall Technical Conference and Exhibition, Houston, TX, USA, 1–3 October 1978; Ohnson, K.S., Russell, J.A., Eds.; Society of Petroleum Engineers: Houston, TX, USA, 1978; pp. 60–77. [Google Scholar]
  60. Xu, C. Preliminary study on clay minerals and their significance in sediment profile of some salt lakes in Qaidam Basin. Acta Sedimentol. Sin. 1983, 3, 123–127. [Google Scholar]
  61. Bjorkum, G. A chemical model of the formation of authigenic kaolinite, potassium feldspar, and illite in sediments. Transl. Geol. Sci. 1989, 3, 6–11. [Google Scholar]
  62. Gao, X. Clay Mineralogy; Chemical Industry Press: Beijing, China, 2017. [Google Scholar]
  63. Kharaka, Y.K.; Gunter, W.D.; Aggarwal, P.K.; Perkins, E.H.; Debraal, J.D. A Computer Program for Geochemical Modeling of Water–Rock Interations; USGS Water Resources Invest: Menlo Park, CA, USA, 1988; p. 420. [Google Scholar]
  64. Zheng, Y.F.; Chen, J.F. Stable Isotopic Geochemistry; Science Press: Beijing, China, 2000. [Google Scholar]
  65. Guo, P.; Liu, C.Y.; Huang, L.; Wang, P.; Wang, K.; Yuan, H.L.; Xu, C.K. Genesis of the late Eocene bedded halite in the Qaidam Basin and its implication for paleoclimate in East Asia. Paleogeogr. Paleoclimatol. Paleoecol. 2017, 487, 364–380. [Google Scholar] [CrossRef]
Figure 1. Geological map showing the study area: (a) the location of the Qaidam Basin (QB) in China; (b) geological map of the QB and its surrounding ranges.
Minerals 09 00655 g001
Figure 2. Distribution and origins of different types of K-rich brines in the QB.
Minerals 09 00655 g002
Figure 3. (a) Box-plot showing the K+ concentrations of surface, intercrystalline, pore, and oilfield brines in the QB (the comprehensive utilization data from [22]); (b) the reserves of surface and intercrystalline brines, and pore and oilfield brines in the QB (the reserve data from [10]).
Minerals 09 00655 g003
Figure 4. (a) The sampling sites; (b) spatial characteristics of salt deposits in the Qarhan Salt Lake (QSL): five halite–dominated evaporitic layers (S1–S5) are separated by five clastic–dominated layers (L1–L5). The layered, K-bearing minerals are mainly enriched in the S4 (K4–K7) and S5 (K8).
Minerals 09 00655 g004
Figure 5. (a) An outline of the forward model used to calculate the contributing fractions of the each end–member. (b) The relationship between Na+ and Cl that corrected for atmospheric input. Cl* = Clriv − Clatm; Na+* = Na+*riv − Na+*atm. The subscripts riv and atm are river water and atmospheric input, respectively. (c) The proportional contributions of each end-member (atmospheric input, silicate, carbonate, and evaporite) to the rivers. NL—Nalenggele river; WT—Wutumeiren river; QS—Qingshui river; ZH—Zaohuo river; Gol—Golmud river; NMH—Nuomuhong river.
Minerals 09 00655 g005
Figure 6. Contour map of K+ (g/L) and TDS (g/L) of the intercrystalline brines in the QSL.
Minerals 09 00655 g006
Figure 7. The evolution of salt lakes and the contours of K in salt lake brines in the QB: (a) the migration of the salt basins presents a reverse–S shape [8]; (b) the distribution of K+ in the salt lake brines does not follow the reverse–S evolution path (data from Table 1 and Table S2).
Minerals 09 00655 g007
Figure 8. The shallow K-rich brines in the QB: (a) The K+ concentrations and distribution of the shallow brines; (b) the relationship between K+ concentrations and TDSs of the shallow brines.
Minerals 09 00655 g008
Figure 9. Map showing the isobath of lake basin and the source and enrichment mechanism of KCl in the QSL.
Minerals 09 00655 g009
Figure 10. The deep K-rich brines in the QB: (a) The K+ concentrations and distribution of pore brines and oilfield brines (data from Table S2); (b) the consistent variations of K+, Na+, Cl, and TDS in each pore brine sample indicate that the K has the same source as Na, Cl, and TDS (data from Table S2); (c) the δD and δ18O values reveal that the oilfield brines were meteoric water origin, and experienced evaporation and water–rock interaction processes (global meteoric water line is from [56]; local meteoric water line is from [4]; the data of river waters are from [57,58]; data of surface and intercrystalline brines are from [4,15]; data of oilfield brines are from [15,16,19]; the local evaporation line is fitted in this study: δD = 3.5 × δ18O—21).
Minerals 09 00655 g010
Table 1. The K+ concentrations and TDS (total dissolved solids) of the intercrystalline brines in the QSL.
Sample SiteNo.K+ (g/L)TDS (g/L)Sample SiteNo.K+ (g/L)TDS (g/L)
Bieletan111.5336.1Qarhan331.6427.0
Bieletan221.1343.9Qarhan340.9406.4
Bieletan310.8379.9Qarhan350.8416.8
Bieletan410.2320.1Qarhan364.1333.3
Bieletan518.5327.6Qarhan3710.1366.7
Bieletan615.4330.8Qarhan382.8337.3
Bieletan726.5393.3Qarhan394.4315.2
Dabuxun87.8345.4Qarhan404.2327.4
Dabuxun912.7352.1Qarhan413.0310.7
Dabuxun1020.4352.1Qarhan428.9338.6
Dabuxun115.1307.2Qarhan433.6314.6
Dabuxun1221.0336.7Qarhan445.3346.9
Dabuxun138.2338.6Qarhan454.5331.5
Dabuxun1416.3360.3Qarhan4610.4330.0
Dabuxun153.0330.2Qarhan475.3356.8
Dabuxun161.7315.2Qarhan485.1330.6
Dabuxun174.5391.5Qarhan493.0312.5
Dabuxun184.8395.0Qarhan503.1314.2
Dabuxun193.4352.4Qarhan514.6320.4
Dabuxun202.0354.9Qarhan521.2435.1
Dabuxun212.0379.7Qarhan533.1309.9
Dabuxun2217.2329.1Qarhan542.8308.3
Dabuxun2330.1339.3Qarhan555.2325.8
Dabuxun247.2384.6Qarhan561.6309.9
Qarhan253.6386.3Qarhan571.6309.0
Qarhan261.4416.9Qarhan581.8311.0
Qarhan272.5391.5Qarhan591.9311.8
Qarhan287.0354.0Huobuxun601.5313.6
Qarhan298.9366.5Huobuxun6113.6367.6
Qarhan301.4434.9Huobuxun621.7308.6
Qarhan315.9362.1Huobuxun631.8313.2
Qarhan320.8416.6Huobuxun641.9311.0
Table 2. The total amount of KCl brought by rivers in the eastern Kunlun Mountain.
SectionRiverQ (m3/a, 108)C (mg/L)Total KCl aTotal KCl bTotal KCl c
(t/a, 103)(t/a, 103)(t/a, 103)
BieletanWutumeiren R0.8436.103.048.505.77
Zaohuo R0.8413.341.120.830.97
Tuolahai R0.4910.990.530.200.37
Qingshui R0.363.850.140.860.50
Total 4.8310.397.61
DabuxunGolmud R7.975.714.554.494.52
Total 4.554.494.52
QarhanShougong R 0.57
Total 0.570.57
HuobuxunNuomuhong R1.542.700.42
Sulinguole R 0.06
Total 0.48
Spring 3.30
Q is average volume of many years’ runoff [9]; C is the average K+ concentration in a river [4,6,7,9,11,47,48]. a The calculated data in this study; b the data from [6]; c the average data of 1 and 2. The data of total spring input data from [7].

