Article

Microcrack Evolution and Associated Deformation and Strength Properties of Sandstone Samples Subjected to Various Strain Rates

1
Key Laboratory of Ministry of Education on Safe Mining of Deep Metal Mines, Northeastern University, Shenyang 110819, China
2
Center for Rock Instability and Seismicity Research, Northeastern University, Shenyang 110819, China
3
Laboratoire de Géophysique Expérimentale, Institut de Physique de Globe de Strasbourg (UMR 7516 CNRS, Université de Strasbourg/EOST), 5 rue René Descartes, 67084 Strasbourg CEDEX, France
*
Author to whom correspondence should be addressed.
Minerals 2018, 8(6), 231; https://doi.org/10.3390/min8060231
Submission received: 26 April 2018 / Revised: 23 May 2018 / Accepted: 25 May 2018 / Published: 29 May 2018

Abstract

:
The evolution of micro-cracks in rocks under different strain rates is of great importance for a better understanding of the mechanical properties of rocks under complex stress states. In the present study, a series of tests were carried out under various strain rates, ranging from creep tests to intermediate strain rate tests, so as to observe the evolution of micro-cracks in rock and to investigate the influence of the strain rate on the deformation and strength properties of rocks. Thin sections from rock samples at pre- and post-failure were compared and analyzed at the microscale using an optical microscope. The results demonstrate that the main crack propagation in the rock is intergranular at a creep strain rate and transgranular at a higher strain rate. However, intergranular cracks appear mainly around the quartz and most of the punctured grains are quartz. Furthermore, the intergranular and transgranular cracks exhibit large differences in the different loading directions. In addition, uniaxial compressive tests were conducted on the unbroken rock samples in the creep tests. A comparison of the stress–strain curves of the creep tests and the intermediate strain rate tests indicate that Young’s modulus and the peak strength increase with the strain rate. In addition, more deformation energy is released by the generation of the transgranular cracks than the generation of the intergranular cracks. This study illustrates that the conspicuous crack evolution under different strain rates helps to understand the crack development on a microscale, and explains the relationship between the micro- and macro-behaviors of rock before the collapse under different strain rates.

1. Introduction

The characteristics of deformation and the strength properties of the surrounding rock mass are of fundamental significance to a better understanding of the stability of underground mines and the design of mining pillars and mining rooms [1,2,3,4]. The surrounding rock mass experiences extremely complex stress loading during tunnel development, mining excavation, tunnel support, and goaf backfill. The surrounding rock mass around the working faces is particularly subjected to complex stress loadings during the activities of rock drilling [5,6], rock blasting [7,8], tunnel excavation [9,10], tunnel support [11,12], and rock burst [13].
Creep is the time-dependent deformation that occurs in rock that is under constant loading [14] and it is experienced by the surrounding rock mass in the in-situ stress field. In general, the surrounding rock mass experiences creep with a creep strain rate of 10−10 s−1 or lower [15,16,17]. In addition, the surrounding rock mass may also experience impact loadings (e.g., blasting rock, drilling rock, etc.) with a high stress loading rate of up to 103 s−1 [16,18]. It has been concluded that the differences in the deformation and strength of rocks under different loading rates are large [18,19]. Therefore, it is of great significance to study the mechanical behaviors of rocks under a large range of loading rates.
Rock is a heterogeneous material consisting of several mineral components and these minerals have different deformation and strength properties [20,21]. It is inevitable that the mineral grains will have a strong influence on the deformation and strength of the rock [22,23,24,25]. Investigating the influence of the mineral grains on the deformation and strength of rock becomes very important if we want to determine the mechanism of crack evolution in the rock, prior to failure. Furthermore, the study of micro-crack propagation among different mineral grains is very useful for interpreting the mechanism of the macro-mechanical behaviors of rock.
As technology has matured, many modern advanced methods and instruments, such as scanning electron microscopes [18,26,27], electromagnetic emission [28,29], and acoustic emission (AE) transducers [30,31,32,33], have been used to explore the evolution of micro-cracks in the rock, prior to failure, and it has been determined that the initiation, propagation, and coalescence of micro-cracks result in the final failure of the rock under stress loading [34,35,36]. Although some studies have been conducted on the fracture surface morphology under different loading rates before the rock failure [18], few studies have been performed on the characteristics of crack evolution in rocks under a large range of strain rates, especially for different mineral grains. There is a need to focus more attention on determining the relationship between the micro- and macro-behavior of rocks under creep loading and impact loading. As it is much easier to capture the initiation and evolution of the cracks of different mineral grains using an optical microscope rather than an SEM [37], in this study, an optical microscope has been used to observe the micro-crack evolution in the rock. Here, we have performed creep tests and intermediate strain rate tests on sandstone in order to investigate the influence of the strain rate on the crack progress, and we have used an optical microscope so as to provide evidence for the crack evolution of different mineral grains in sandstone under different strain rates and different loading directions. We have compared the stress–strain curves of the tests for a large amount of strain rates so as to analyze the macro-mechanical parameters of the sandstone. Based on the understanding of the crack evolution under the effect of the strain rates at the microscale, we have provided detailed information so as to understand the problem that is occurring in mining activities.

2. Experimental Procedure

2.1. Sample Preparation and Characterization

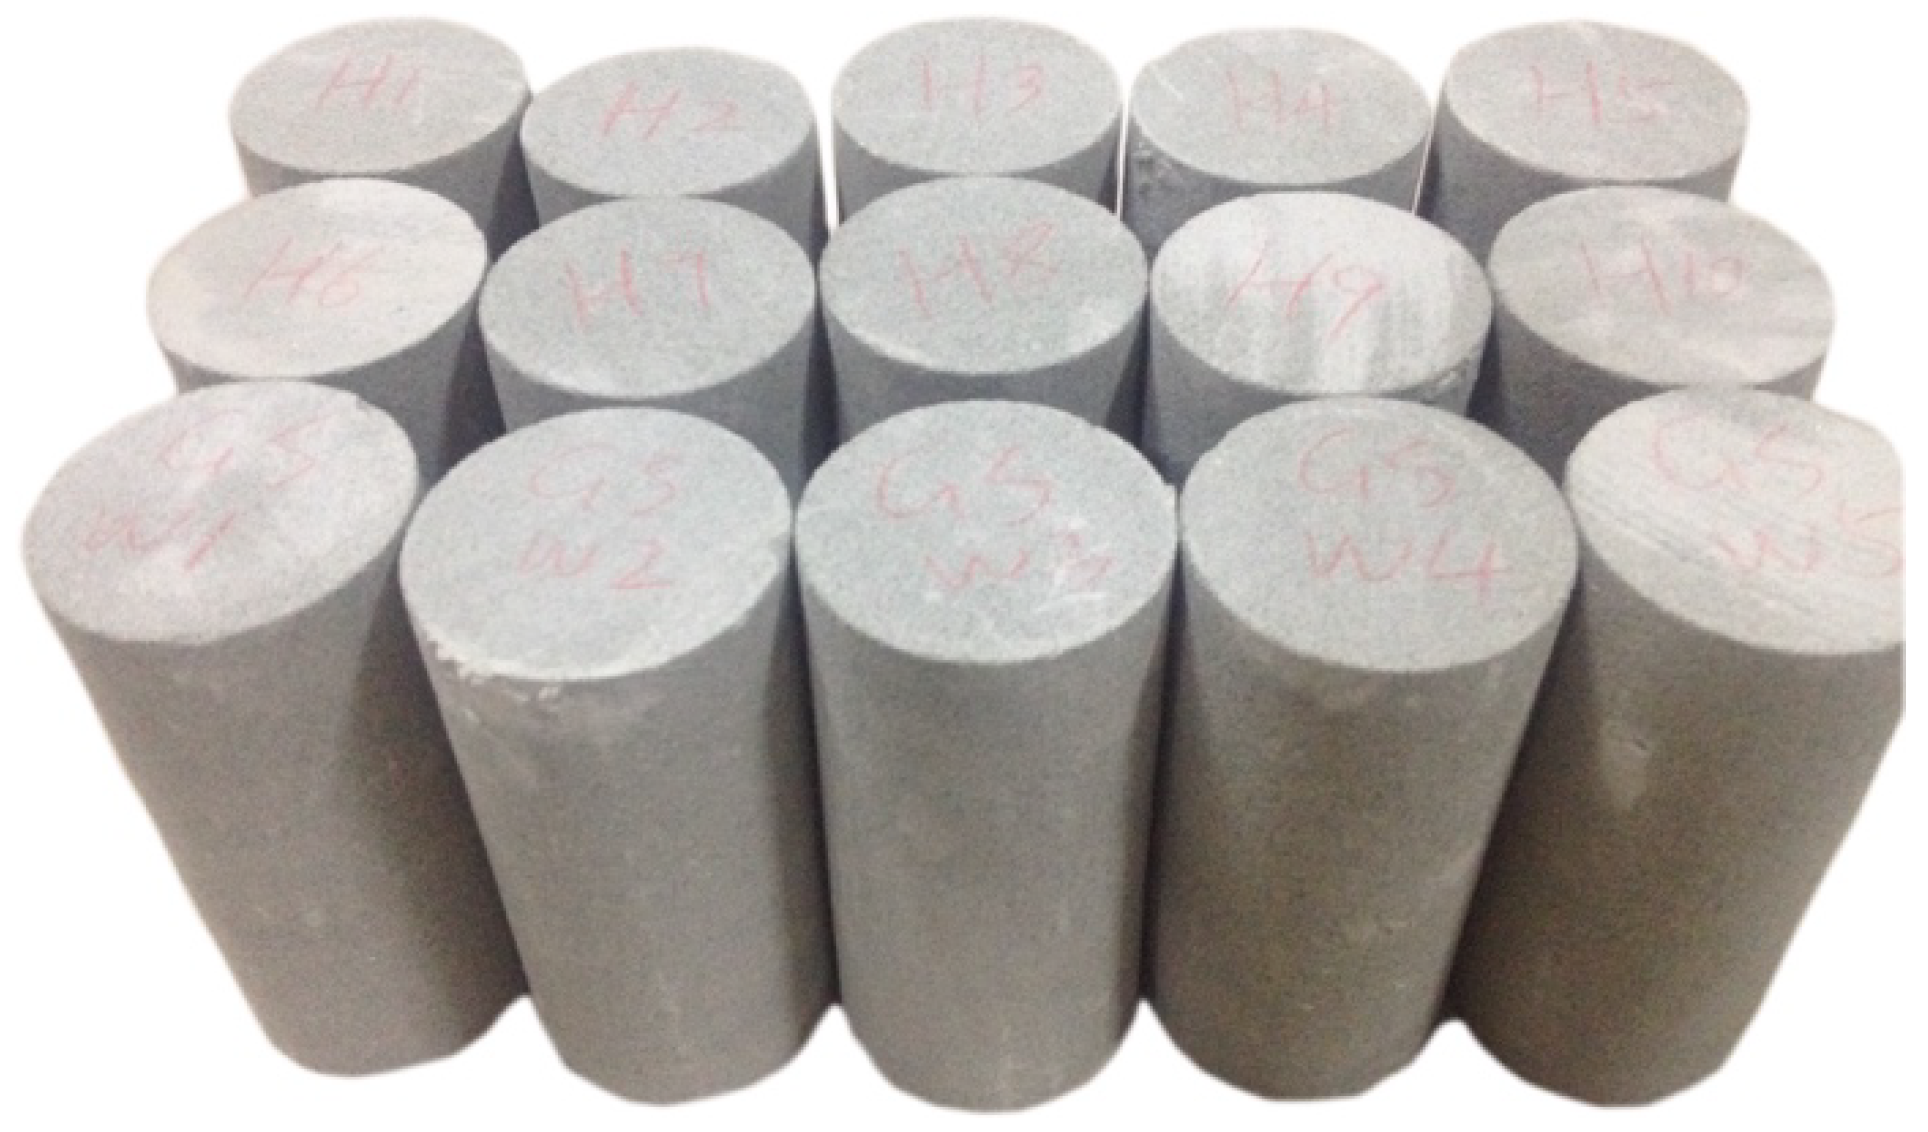
2.1.1. Sample Preparation

The sandstone that was used in this study was collected from a quarry in Neijiang, China. Neijiang is located in the Sichuan Province of the Yangtze plate. The surface structure was a gentle anticline and syncline, with no major faults. The main stratum that was exposed in the area was the Jurassic Shaximiao stratum, which was composed of arkose, aleurolite, mudstone, and feldspathic quartz sandstone, with wild grain sizes ranging from coarse to medium to fine. The parent rock, which was weathered and broken, was rich in quartz and plagioclase. The debris particles had sharp edges and corners, and the grain sizes were not uniform. The parent rock was not transported over long distances and it was deposited nearby or in situ, and the sandstone was formed from the parent rock by consolidation.
The samples for the quasi-static tests were cored perpendicular to the bedding from the same sandstone block, and had a diameter of 50 mm. They were precision-ground to 100 mm in length, which resulted in a length: diameter ratio of 2:1 (as shown in Figure 1). The diameter and thickness of the specimen for the intermediate strain rate tests were 30 and 20 mm, respectively. The cylindrical surfaces were free from obvious tool marks, and the end faces were flat to 0.25 mm, and were parallel to within 0.25°, as it was suggested by the International Society for Rock Mechanics (ISRM) [38,39]. The sample material was a green, well-indurated, feldspathic sandstone.

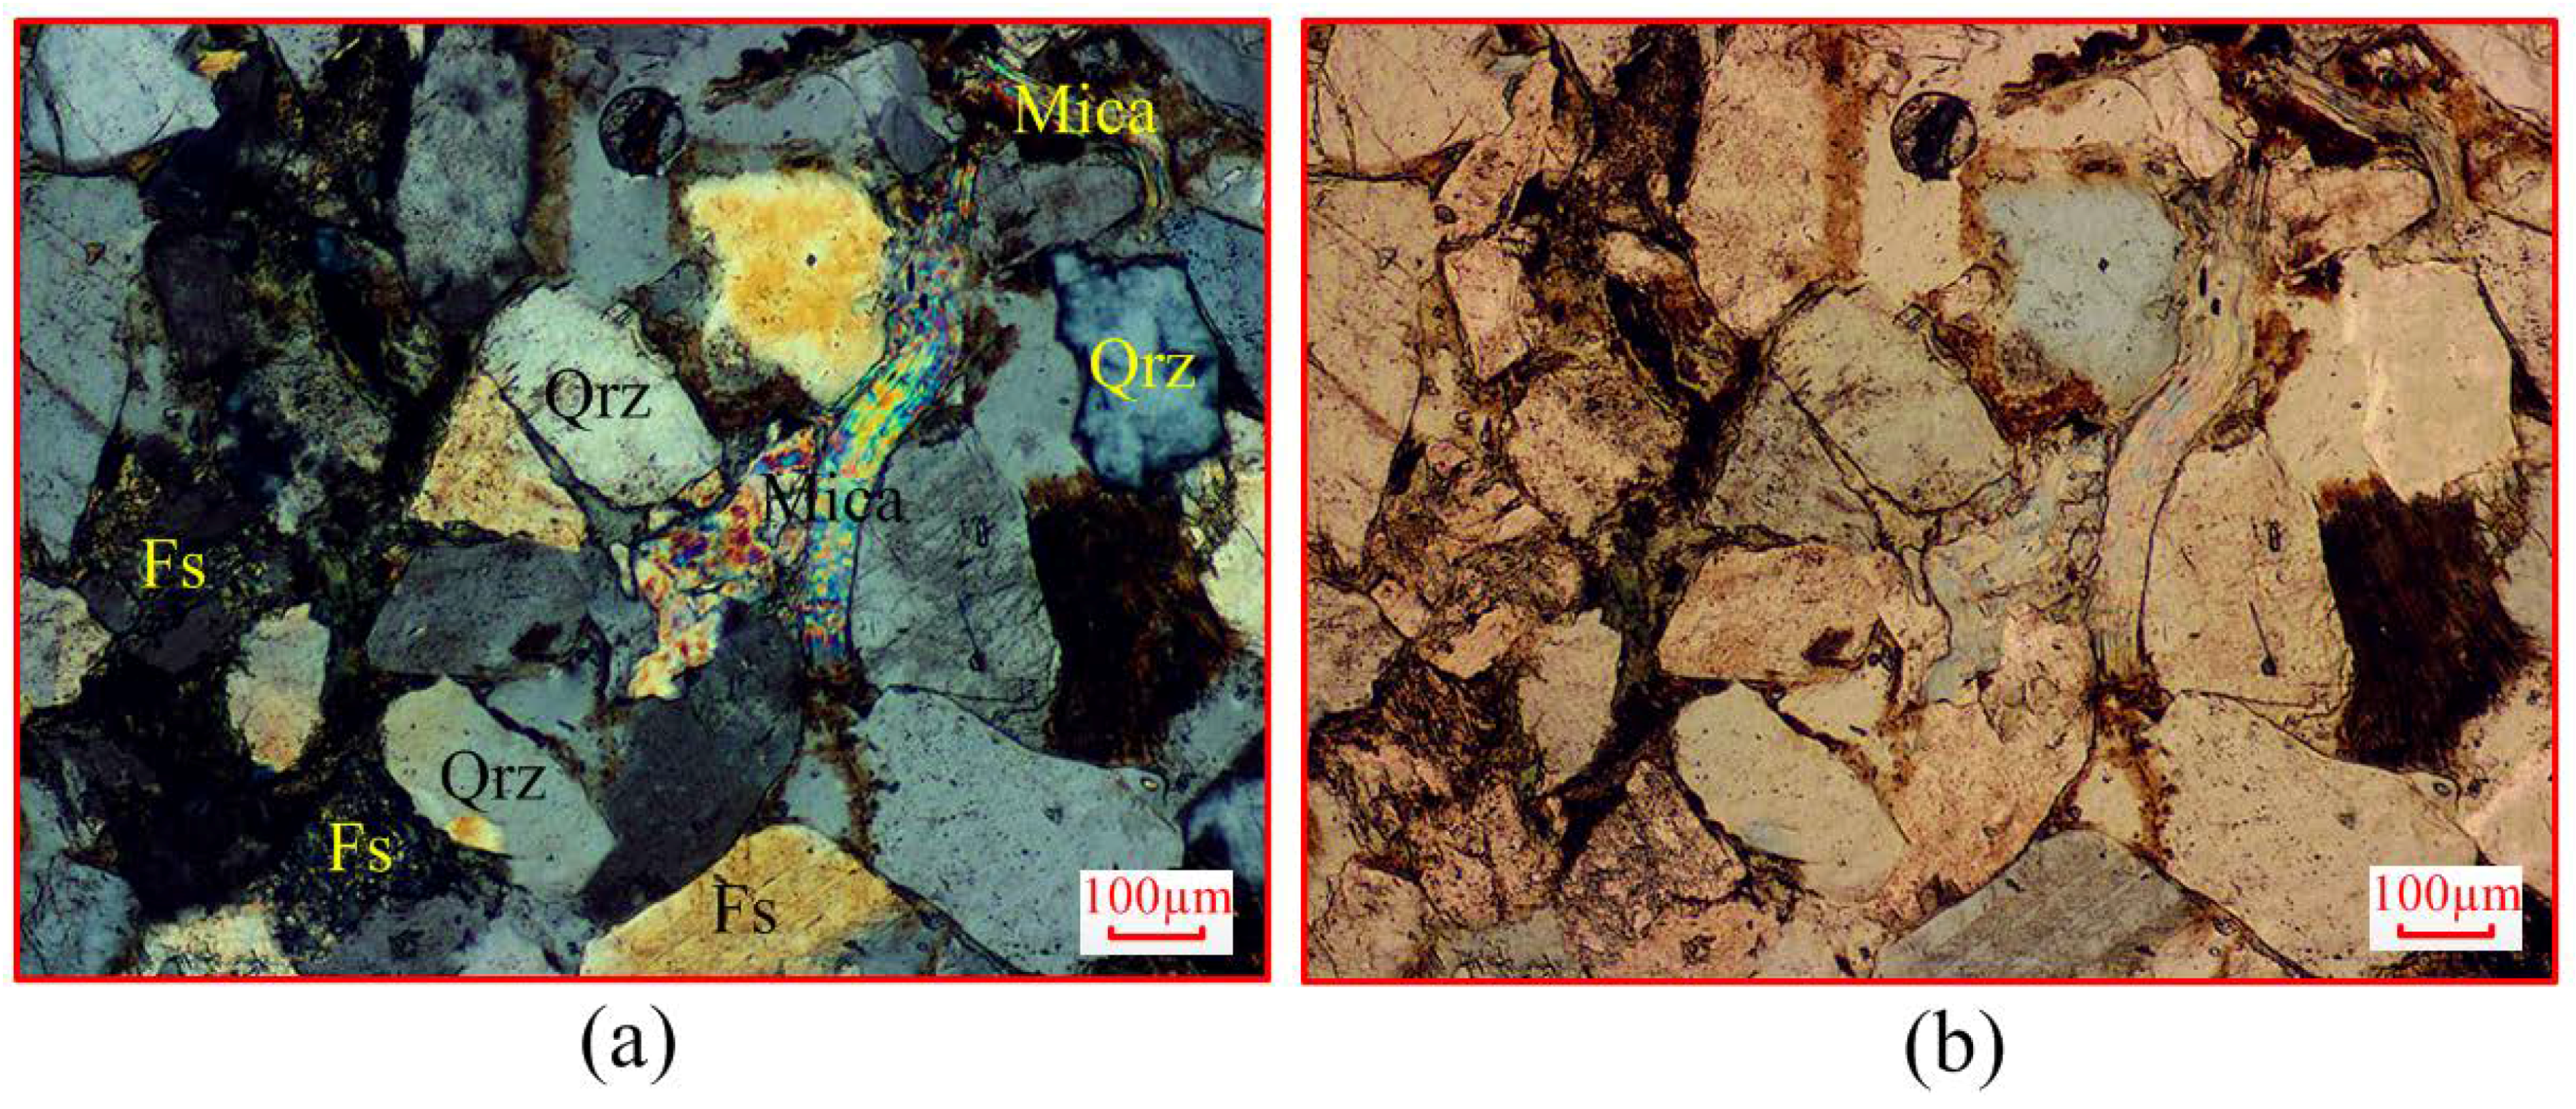
2.1.2. Mineral Morphology

The composition of the sample material was 60% quartz, 20% feldspar, 15% cement, and 5% mica [40]. No distinct layering or lamination was observed in the specimen. The optical microscope analysis (Shanghai Dianying Optical Instrument Co., Ltd., Shanghai, China) demonstrated that the grains were sub-angular, and ranged in size from 200–500 μm and showed no discernable preferred alignment (Figure 2). The type of cementation was porous and the interstitial material was mainly clay. The plagioclase was slightly weathered and formed a slight clayey alteration.
Figure 2 illustrates the thin sections prior to the loading stress tests. The composition of the sample was easy to determine, based on the smoothness of the granular plane and the color variation of the grains under the plane-polarized and cross-polarized light. However, the boundaries between the grains were not very apparent, because the grains under different ingredients were syncretic. As shown in Figure 2, there were no characteristic cracks in the different grains or between the grains and the matrix, although there were a few micro cracks around some of the grains. However, the micro-crack that occurred around the grain exhibited no trends of connecting with the other cracks.

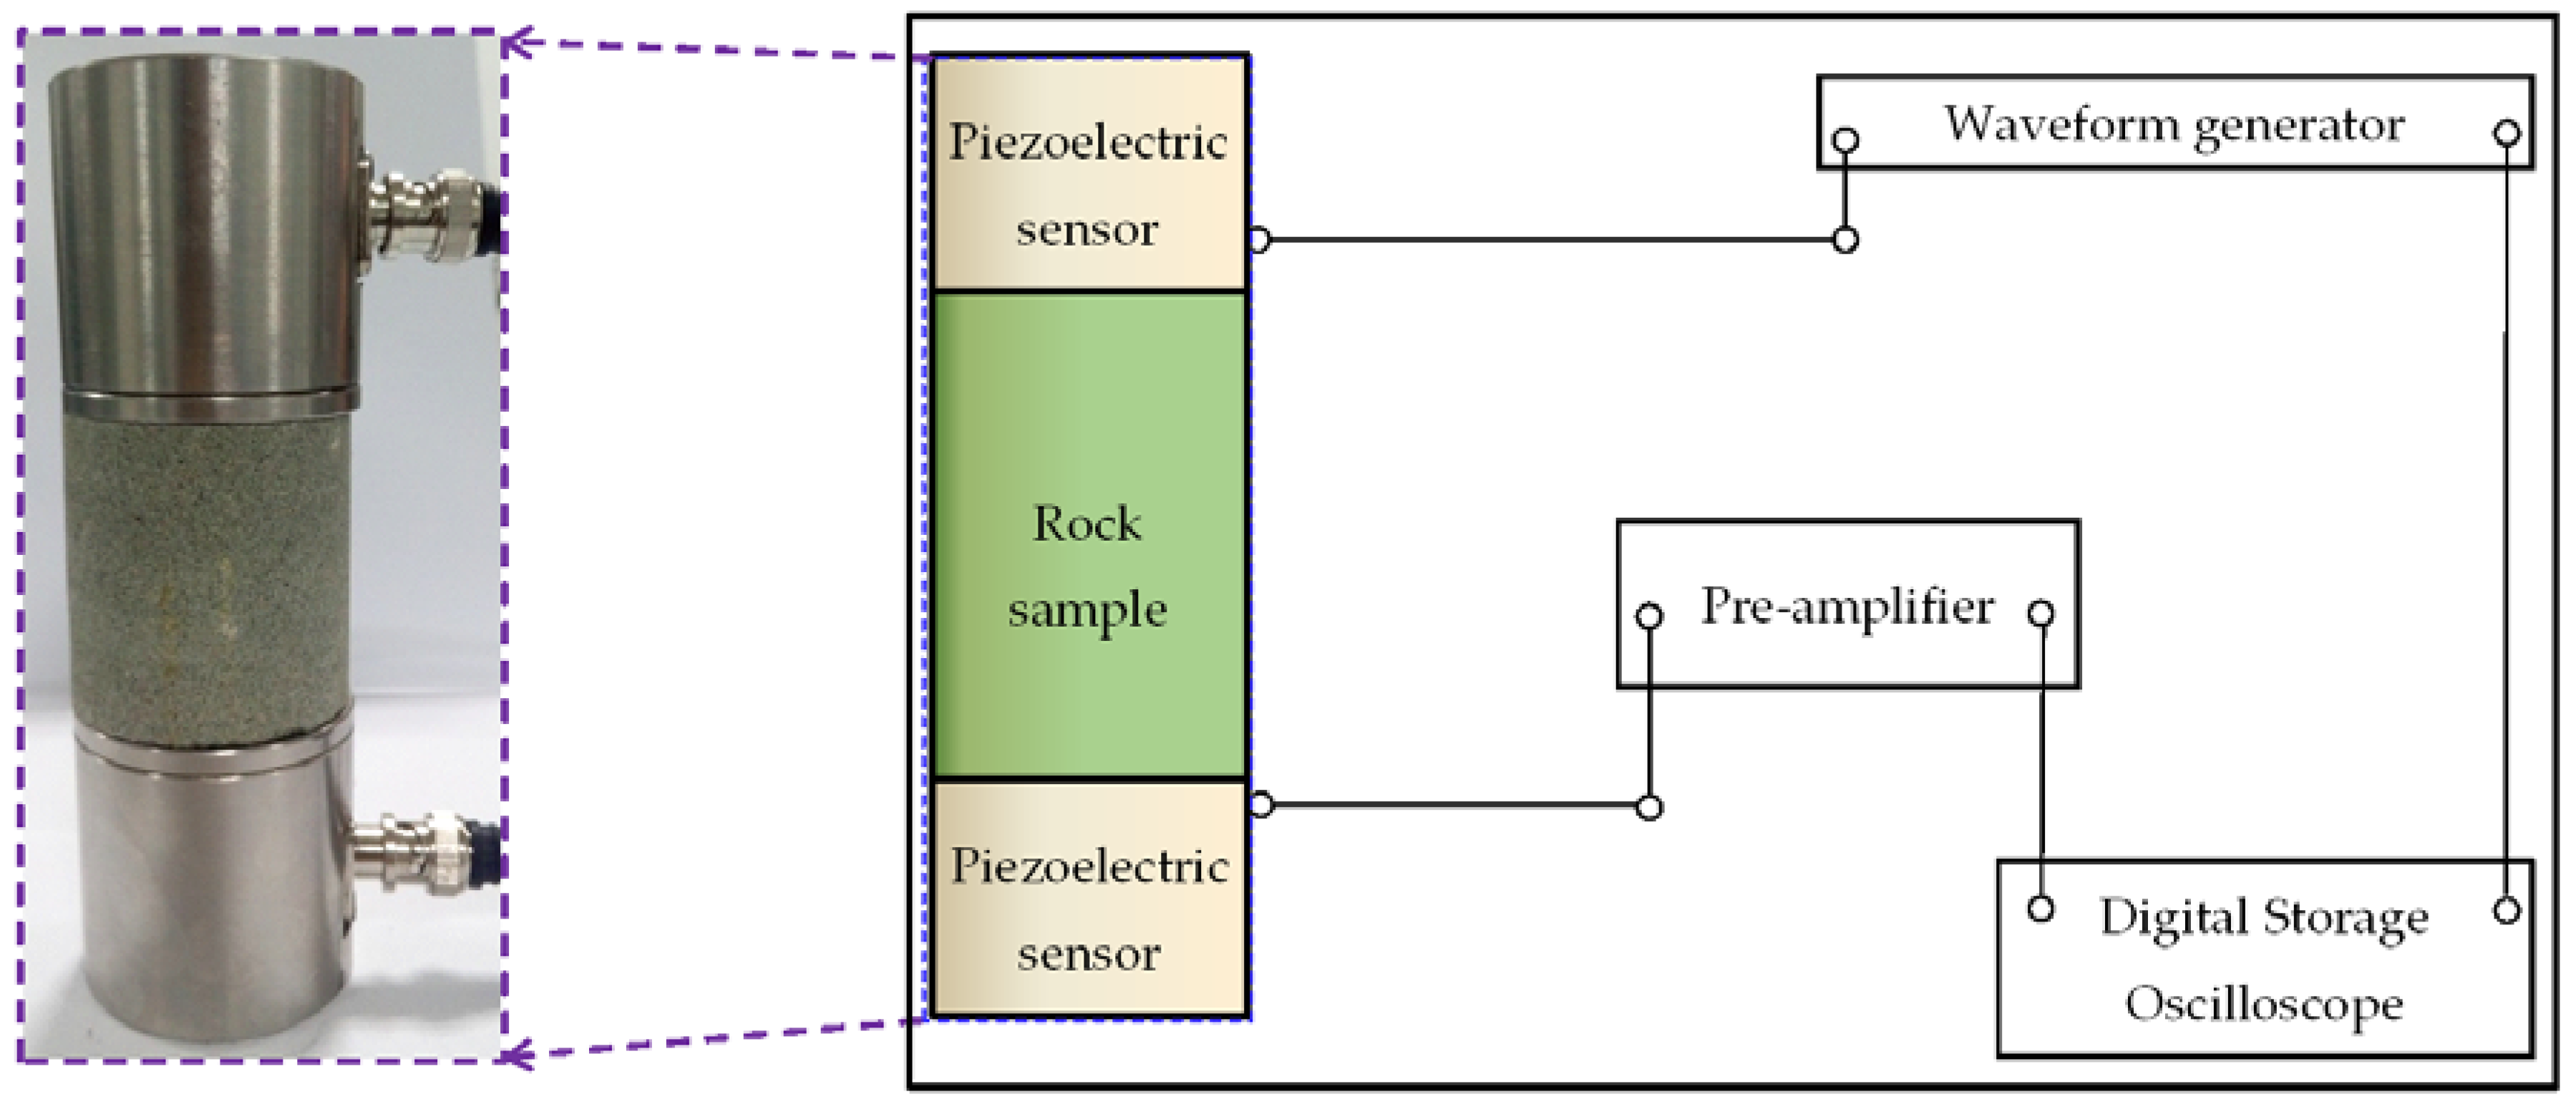
2.2. Testing Method and Testing Equipment

The ultrasonic measuring instrument (Hunan Tian Gong measurement and Control Technology Co., Ltd., Xiangtan, China) setup was comprised of three components, namely, a waveform generator, two piezoelectric sensors, and a data acquisition and recording system (Figure 3). The rock sample was sandwiched between the two piezoelectric sensors. Petroleum jelly was applied between the rock sample and the piezoelectric sensors in order to improve the sample-sensor contact. The upper piezoelectric sensor was used to generate a drive signal, which was received by the lower piezoelectric sensor after passing through the rock sample. The value of the P-wave velocity was the height of rock sample divided by the travel time. The P-wave velocity was about 1.77 km·s−1 for the natural samples of sandstone, and varied within ±0.05 km·s−1 for the samples that were used in this study. This method was used to reduce the sample variation.
The creep tests were performed using a servo-controlled rock shear rheological testing machine at room temperature, and the intermediate strain rate tests were conducted using a Split Hopkinson pressure bar (SHPB). It should be noted that it was easier to determine the initiation and evolution of the cracks using an optical microscope rather than an SEM [37]. Therefore, an optical microscope was used to evaluate the crack evolution in the rock after the tests.
As mentioned by Zhang and Zhao [41], the types of loadings could be categorized into five groups based on the range of the strain rate, as follows: there were the creep, quasi-static, intermediate, high, and very high strain rates. Alternatively, the loading types could be categorized into two kinds, namely, negligible inertial forces and important inertial forces. Considering the relationship between the negligible inertial forces and the important inertial forces, we mainly focused on the range of the strain rate with regard to the creep and intermediate strain rates in the present experiments. It should be noted that the range of the creep strain rate was 10−10–10−5 s−1 [14], and the range of the intermediate strain rate was 100–102 s−1 [42]. The values of the creep strain rate and intermediate strain rate were 10−7 s−1 and 60.7 s−1, respectively.

2.2.1. Conventional Uniaxial Compressive Strength (UCS) Tests
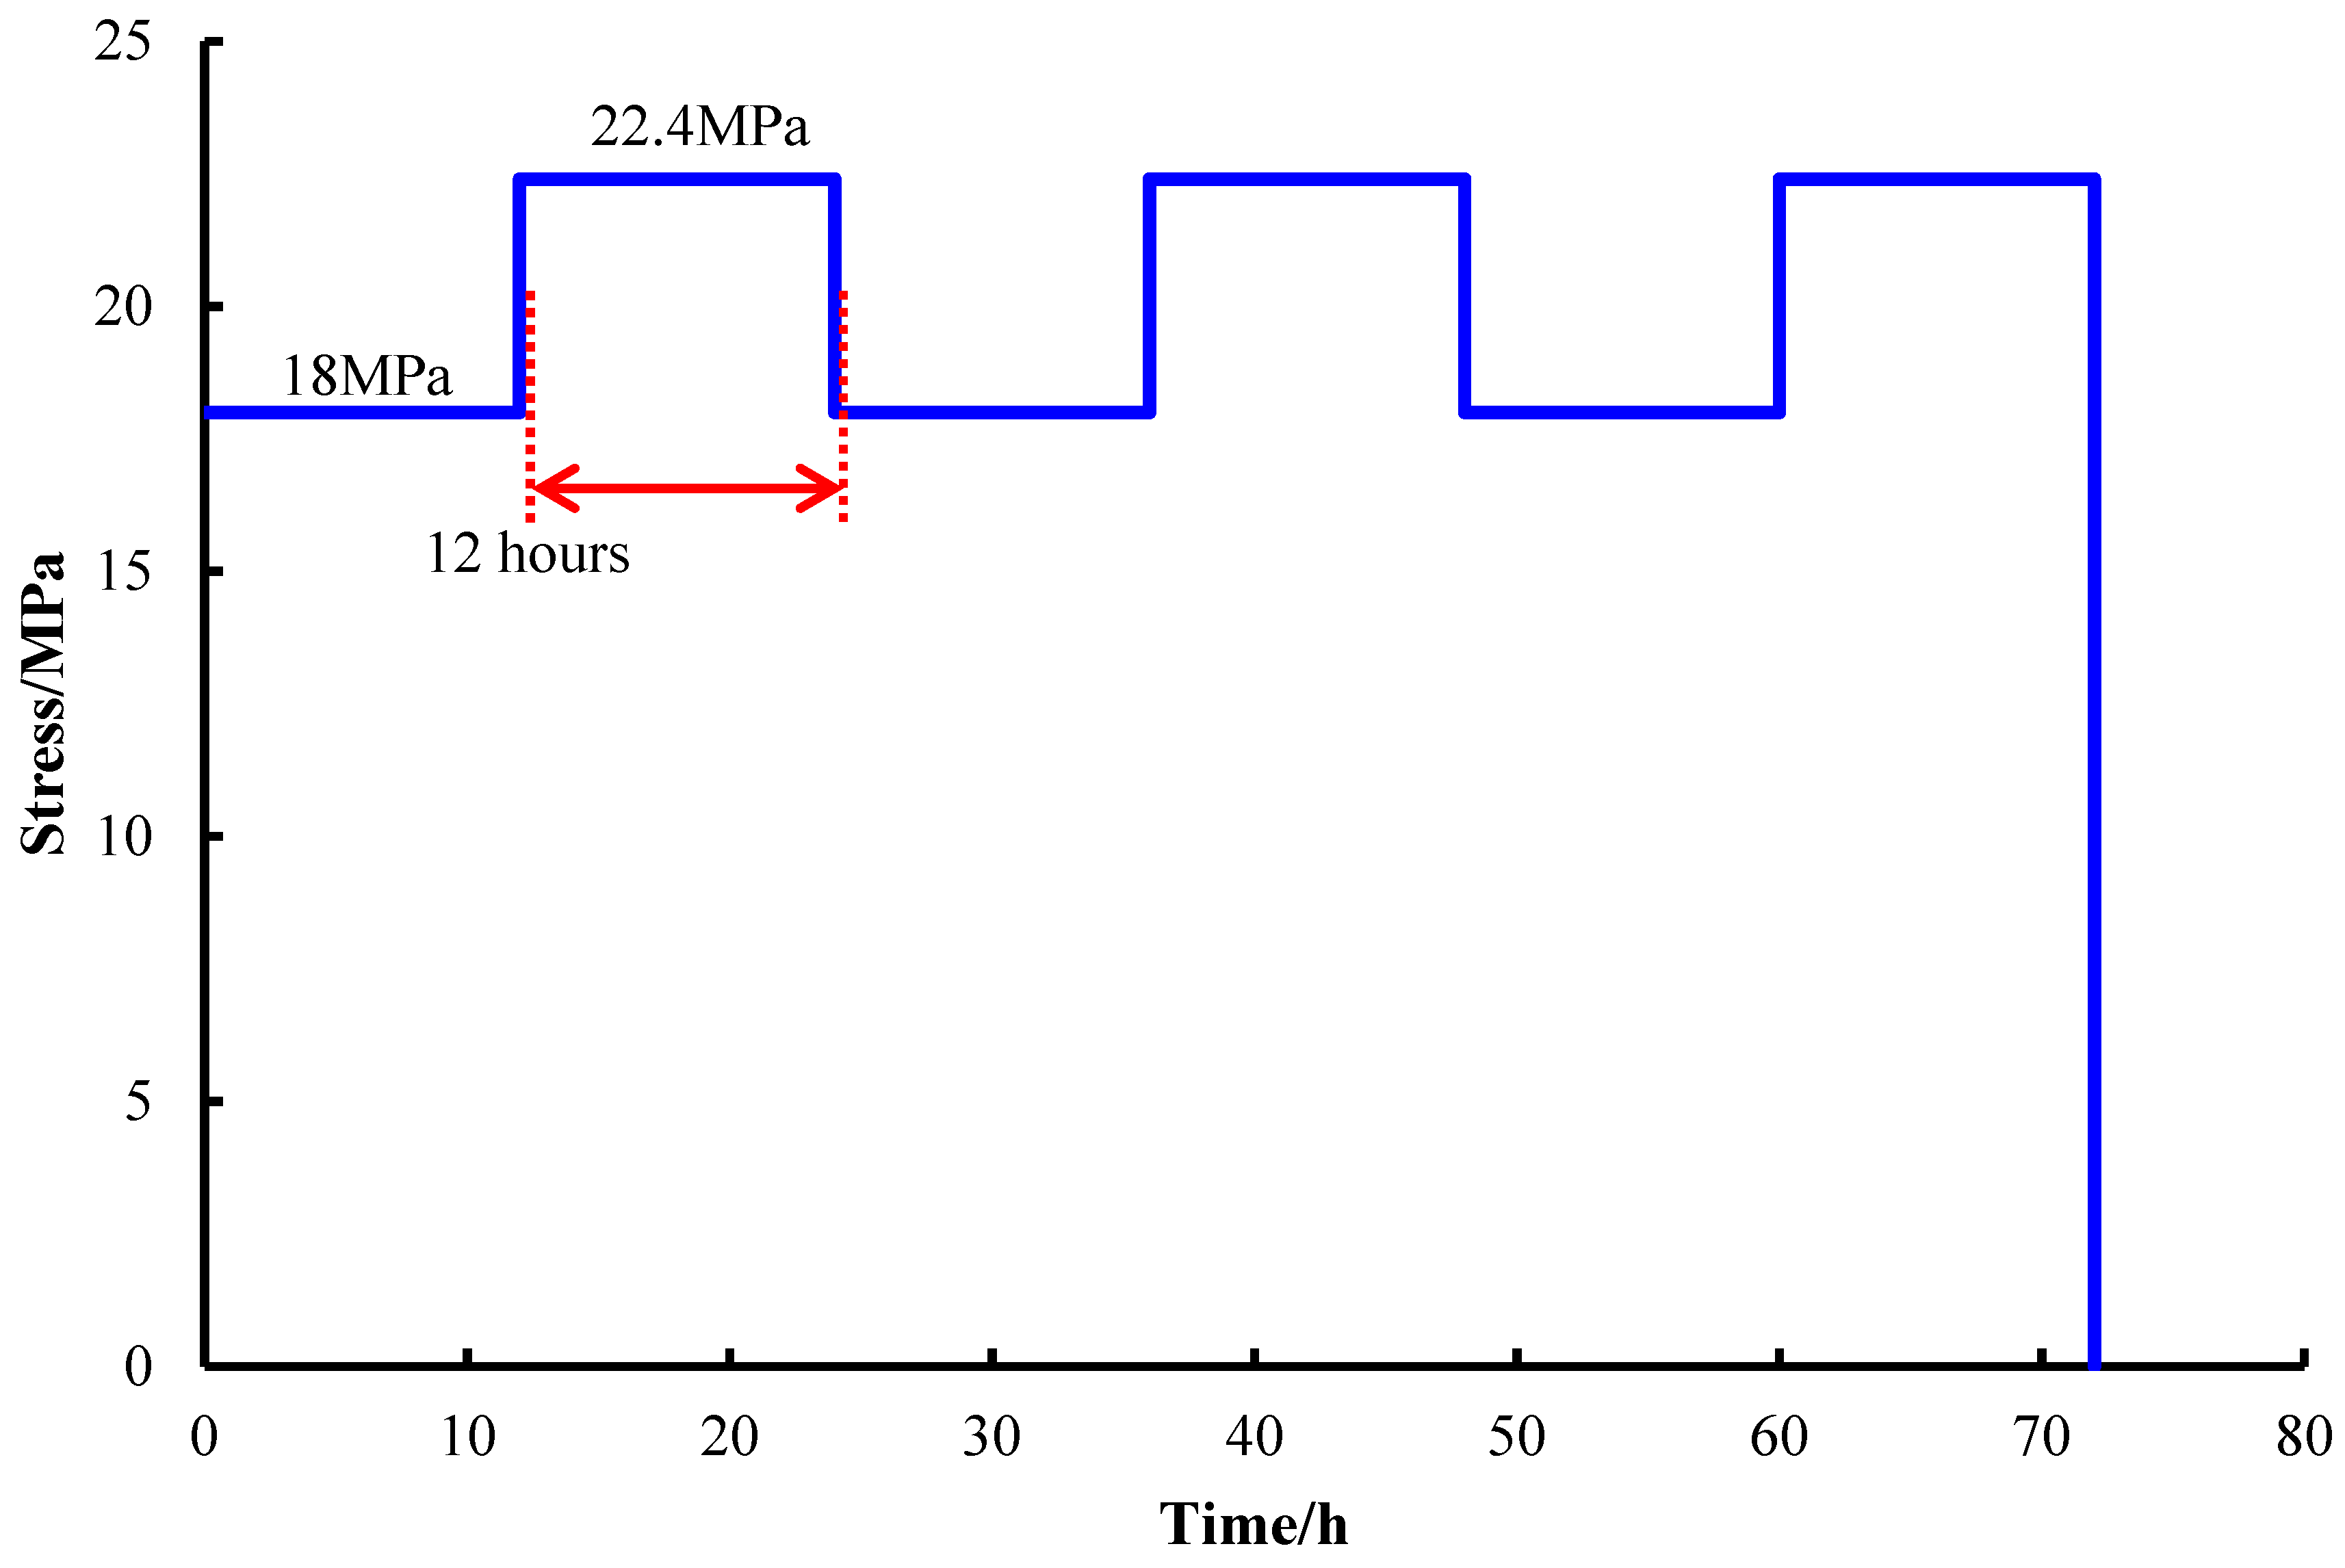
Firstly, a series of conventional UCS tests at a constant strain rate of 1.0 × 10⁻⁵ s−1 were conducted on the sandstone samples, so as to obtain the short-term deformation and failure characteristics of the sandstone. These tests were carried out on the servo-controlled rock shear rheological testing machine (Jilin Jinli Test Technology Co., Ltd., Changchun, China). The UCS, Young’s modulus, and Poisson’s ratio of the sandstone were on average 29.8 MPa, 8.4 GPa, and 0.29, respectively [40].

2.2.2. Creep Tests

The type of servo-controlled rock shear rheological testing machine that was used for the creep tests was the RYJ−500. The maximum capacity of the axial compression load was 500 kN and the relative error of the testing force and the error of the deformation measurement were ±0.5% and ±0.005 mm, respectively. The maximum axial deformation and lateral deformation were 8 and 4 mm, respectively. The layout of the sandstone samples that were equipped with the AE devices and the axial and lateral measurement devices is shown in Figure 4. Eight strain extensometers measured the axial deformation and the lateral deformation. The axial strain extensometers were in contact with the inclined surface of an inverted cone so as to measure the axial strain using the displacement at the top of the axial extensometers when the axial displacement of the inverted cone occurred. The samples were mounted between two steel end caps and were enclosed within a nitrile rubber sleeve that contained the inserts for the mounting of the AE transducers. The AE output was recorded continuously by the transducers that were mounted on the steel inserts embedded within the nitrile sample jacket and were stored by a physical AE acquisition system.
According to the “Kaiser effect” [43,44], a rock must have been subjected to a stress that was higher than the stress that it had previously experienced in order to impart new micro-crack damage within the sample. Therefore, we assumed that there was no crack propagation if the loading stress was less than the previous loading stress. In order to study the crack evolution under a low strain rate and to ensure that the cracks opened under an appropriately low strain rate, we conducted cyclic loading and unloading creep tests. It was well known that the repeatability of the mechanical behavior of rock was usually not as good as that of metal, rubber, plastics, or similar materials, because the rock was a heterogeneous material and the responses depended on the rock minerals and the structure. The rock specimens from the same rock block could have exhibited a large variation. As a result, multi-step creep tests were usually carried out so as to minimize the effects of the differences among the different specimens. In one multistep creep test, only one specimen was used, and thus the variation among the specimens could be excluded. In this study, the stress levels of the multi-step creep tests were determined by the constant strain rate tests and were set at 60%, 65%, 70% … up to 85% of the UCS. Two stress levels (the high-stress level at 75.6% of the USC and the low-stress level at 60% of the USC) were determined using the multi-step monotonic creep tests, so as to ensure that the sample would not fail and that the cracks would open properly during the tests. In the multi-step monotonic and cyclic creep tests, the stress was maintained for 12 h. The schematic diagram of the multistep cyclic creep tests is shown in Figure 5.
It should be noted that the multi-step cyclic loading and unloading creep tests were used to investigate the influence of the loading strain rates on the evolution of the cracks, because if the loading stresses were at the same level and the cyclic loading and unloading levels were maintained for some time, the number of cracks could have increased, especially at the low loading strain rate. The loading stress was maintained at a constant level after the stress had reached a given value, in order to ensure that the generated cracks did not close again after the stress was released. In addition, after the loading stress had reached a critical value, a significant fraction of the solid grains was crushed [45]. As a result, the maximum loading stress was set to 75% of the UCS and cyclic loading and unloading were used to guarantee that the generated cracks did not close. After the multistep cyclic creep tests, thin sections of the samples under different axial and radial direction were prepared. Several other samples were used after the cyclic loading and unloading, in order to perform the UCS tests to compare the sample responses after the UCS tests and the creep tests.

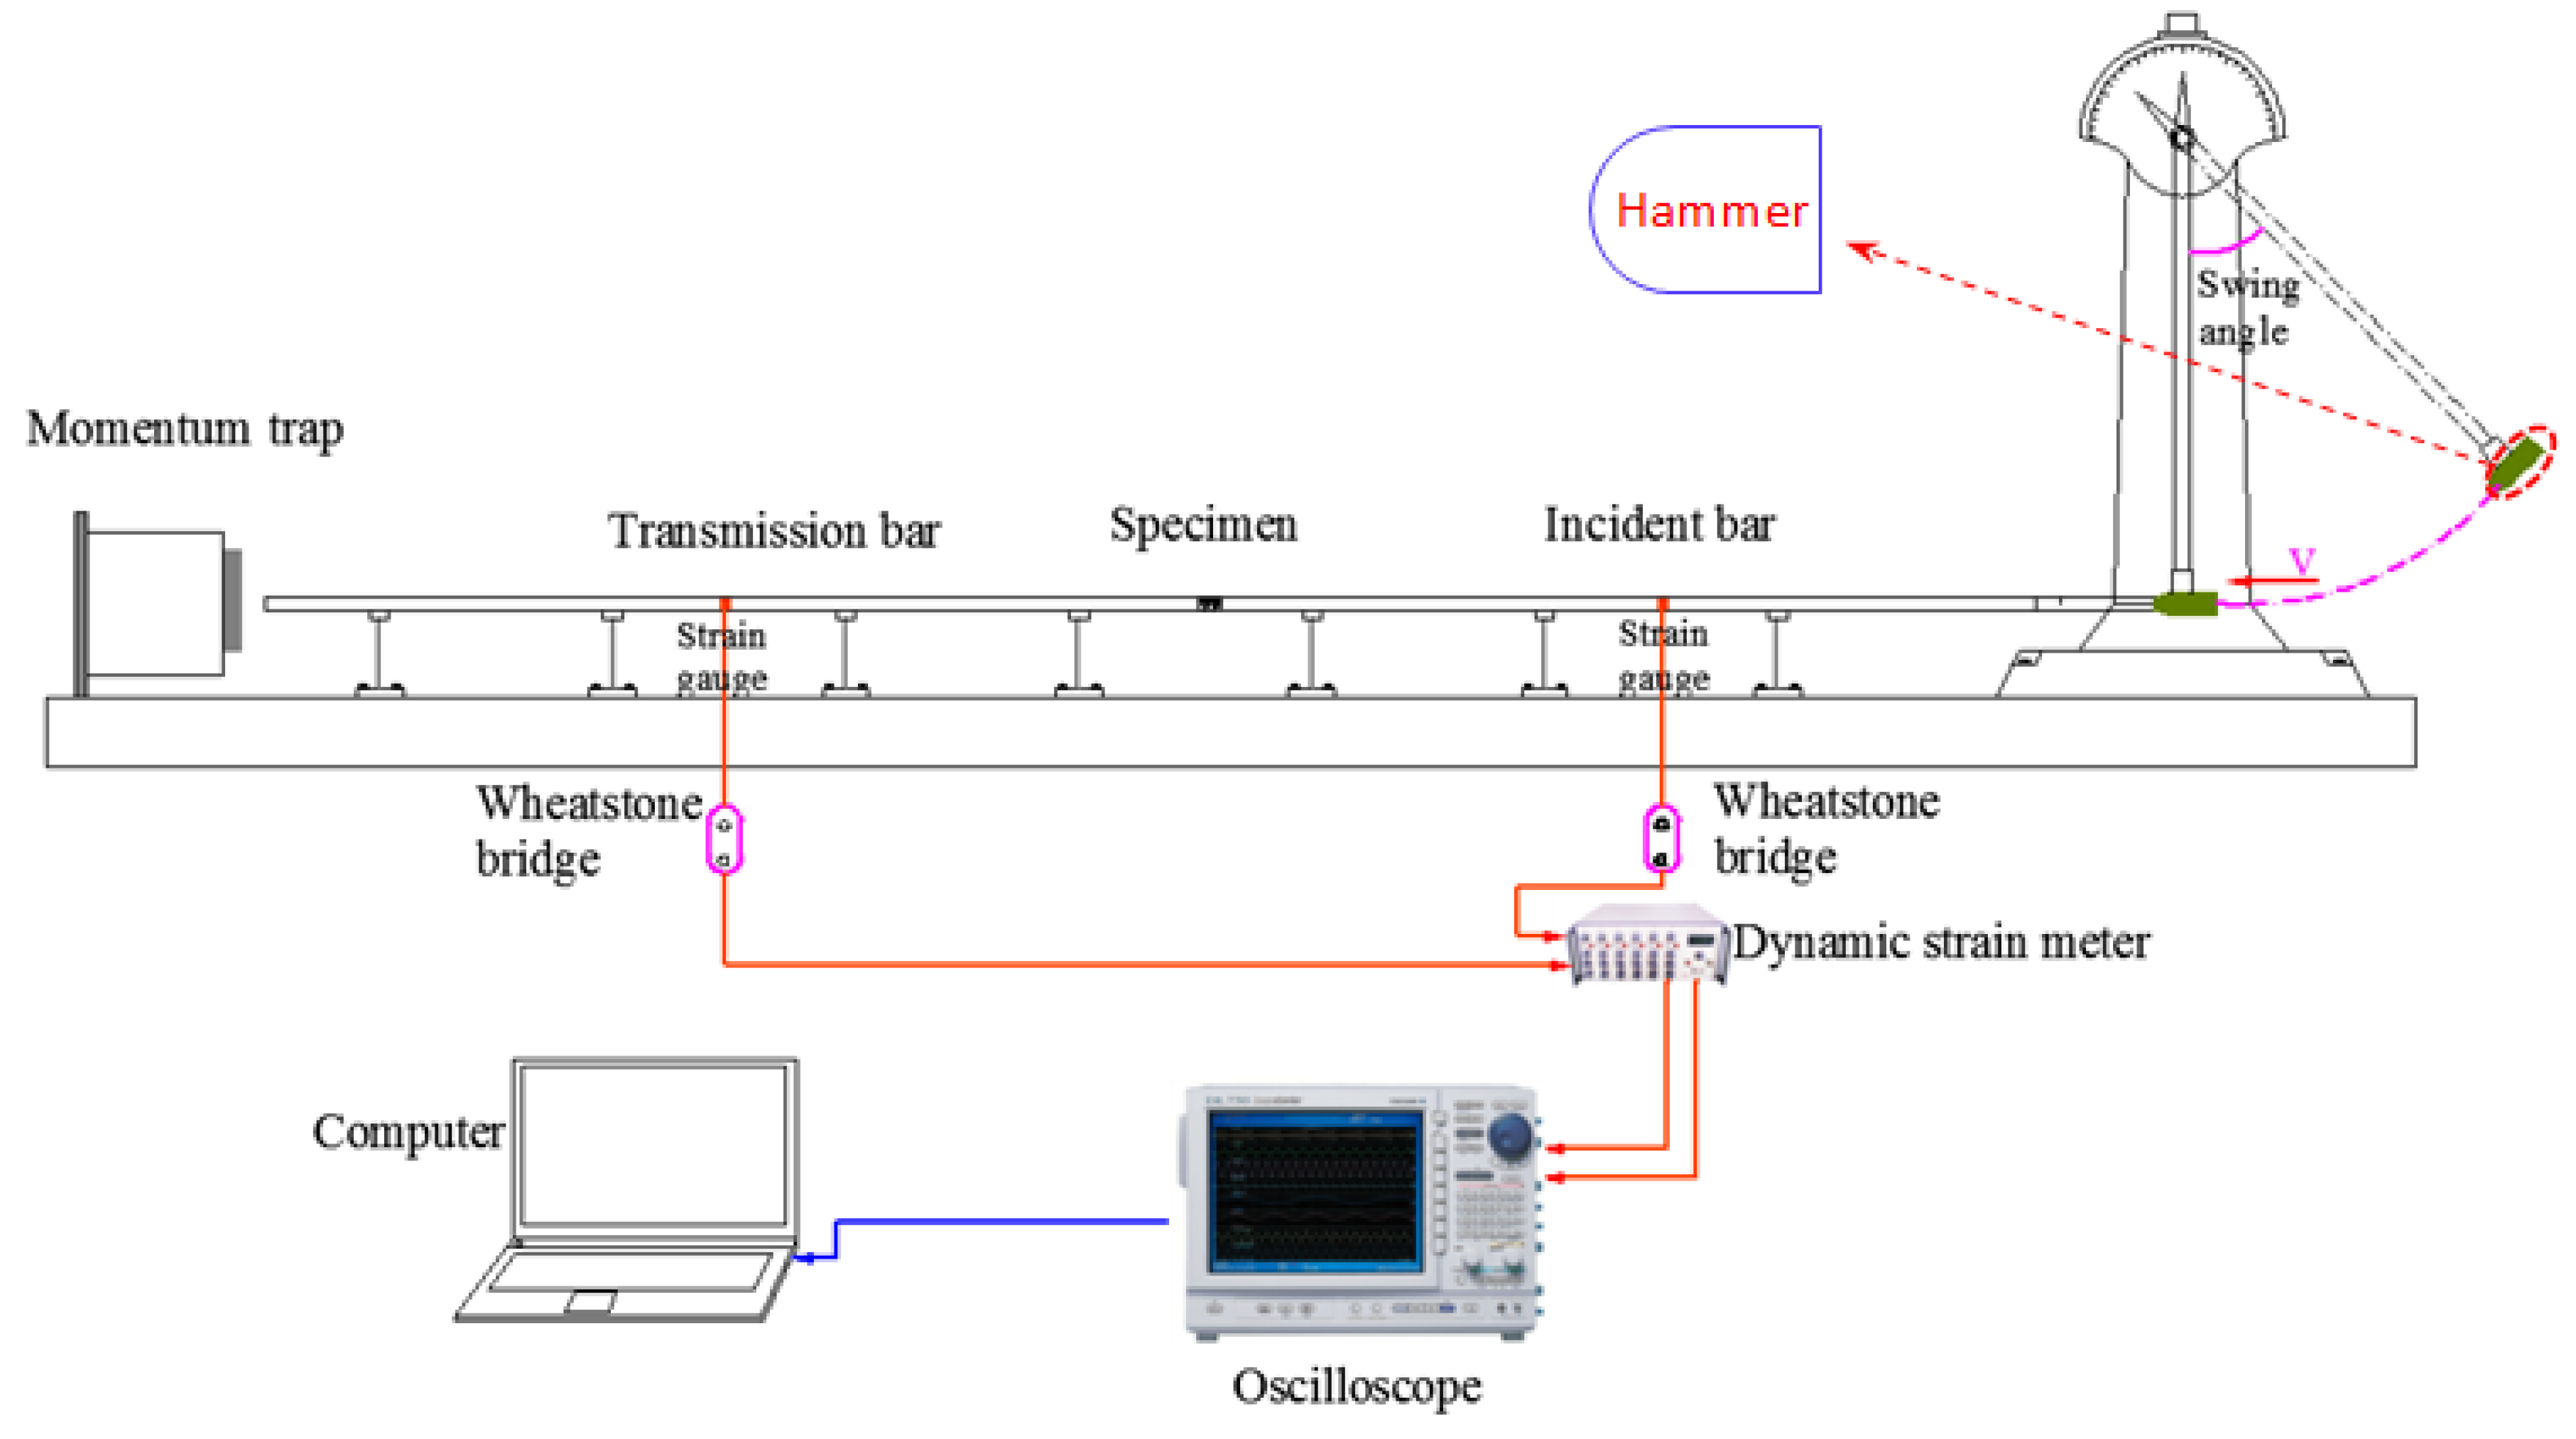
2.2.3. Intermediate Strain Rate Tests

The pendulum hammer-driven SHPB apparatus that is schematically presented in Figure 6, was comprised of three significant components, namely, a loading device, bar components, and a data acquisition and recording system. The pendulum hammer was used as a loading device to generate the impact stress wave. The bar components consisted of an incident bar, a transmission bar, and a momentum trap device at the end. The rock specimen was sandwiched between the incident bar and the transmission bar. The length of each two steel bars (incident and transmission bars) was 2.0 m. The data acquisition and recording system consisted of a preamplifier, a digital oscilloscope, and a microcomputer. The data acquisition rate of the digital oscilloscope was 10 million Bps, the bandwidth of the recording system was 100 kHz, and the data precision was 12 bit. The data acquisition and recording system conformed to the suggested method of the ISRM for a dynamic Brazilian test [39]. The velocity of the hammer that impacted the incident bar and the shape of the incident wave were controlled by changing the swing angle of the pendulum hammer. The incident strain and reflected strain that were measured by the strain gauges that were attached to the incident bar and the transmitted strain that was measured on the transmission bar, could be used to calculate the force at both ends of the rock specimen during the SHPB experiment. More detailed information about the SHPB tests machine can be found in Zhu et al. [42], and Zhang and Zhao [41].
As shown in Figure 6, the incident waves were generated by impacting the incident bar with the pendulum hammer under different velocities, thus the incident stress waveforms were controlled by accurately specifying the swing angle. Figure 7 presents the stress waves (experimental curves) that were generated by the pendulum hammer, with impact velocities of 2.5 and 4.2 m/s, and that corresponded to the loading strain rates of 21.7 and 60.7 s−1, respectively. In this respect, the strain rate was calculated by dividing the peak of the incident stress by the corresponding duration during which the peak stress was attained. Most importantly, the incident wave that was excited by the pendulum hammer was triangular in shape, featured a long rising time, and it was considered to be the ideal pulse shape for altering the wave dispersion effect and achieving a stress equilibrium condition in the rock specimen [46,47]. It took about 120 μs for the incident stress wave to reach its peak, and the peak of the stress wave increased with the impact velocity of the hammer. Compared with the incident pulse that was excited by a gas gun in a conventional SHPB test, it was not necessary to utilize the pulse-shaping technique [48,49] in order to obtain this kind of ideal incident waveform.

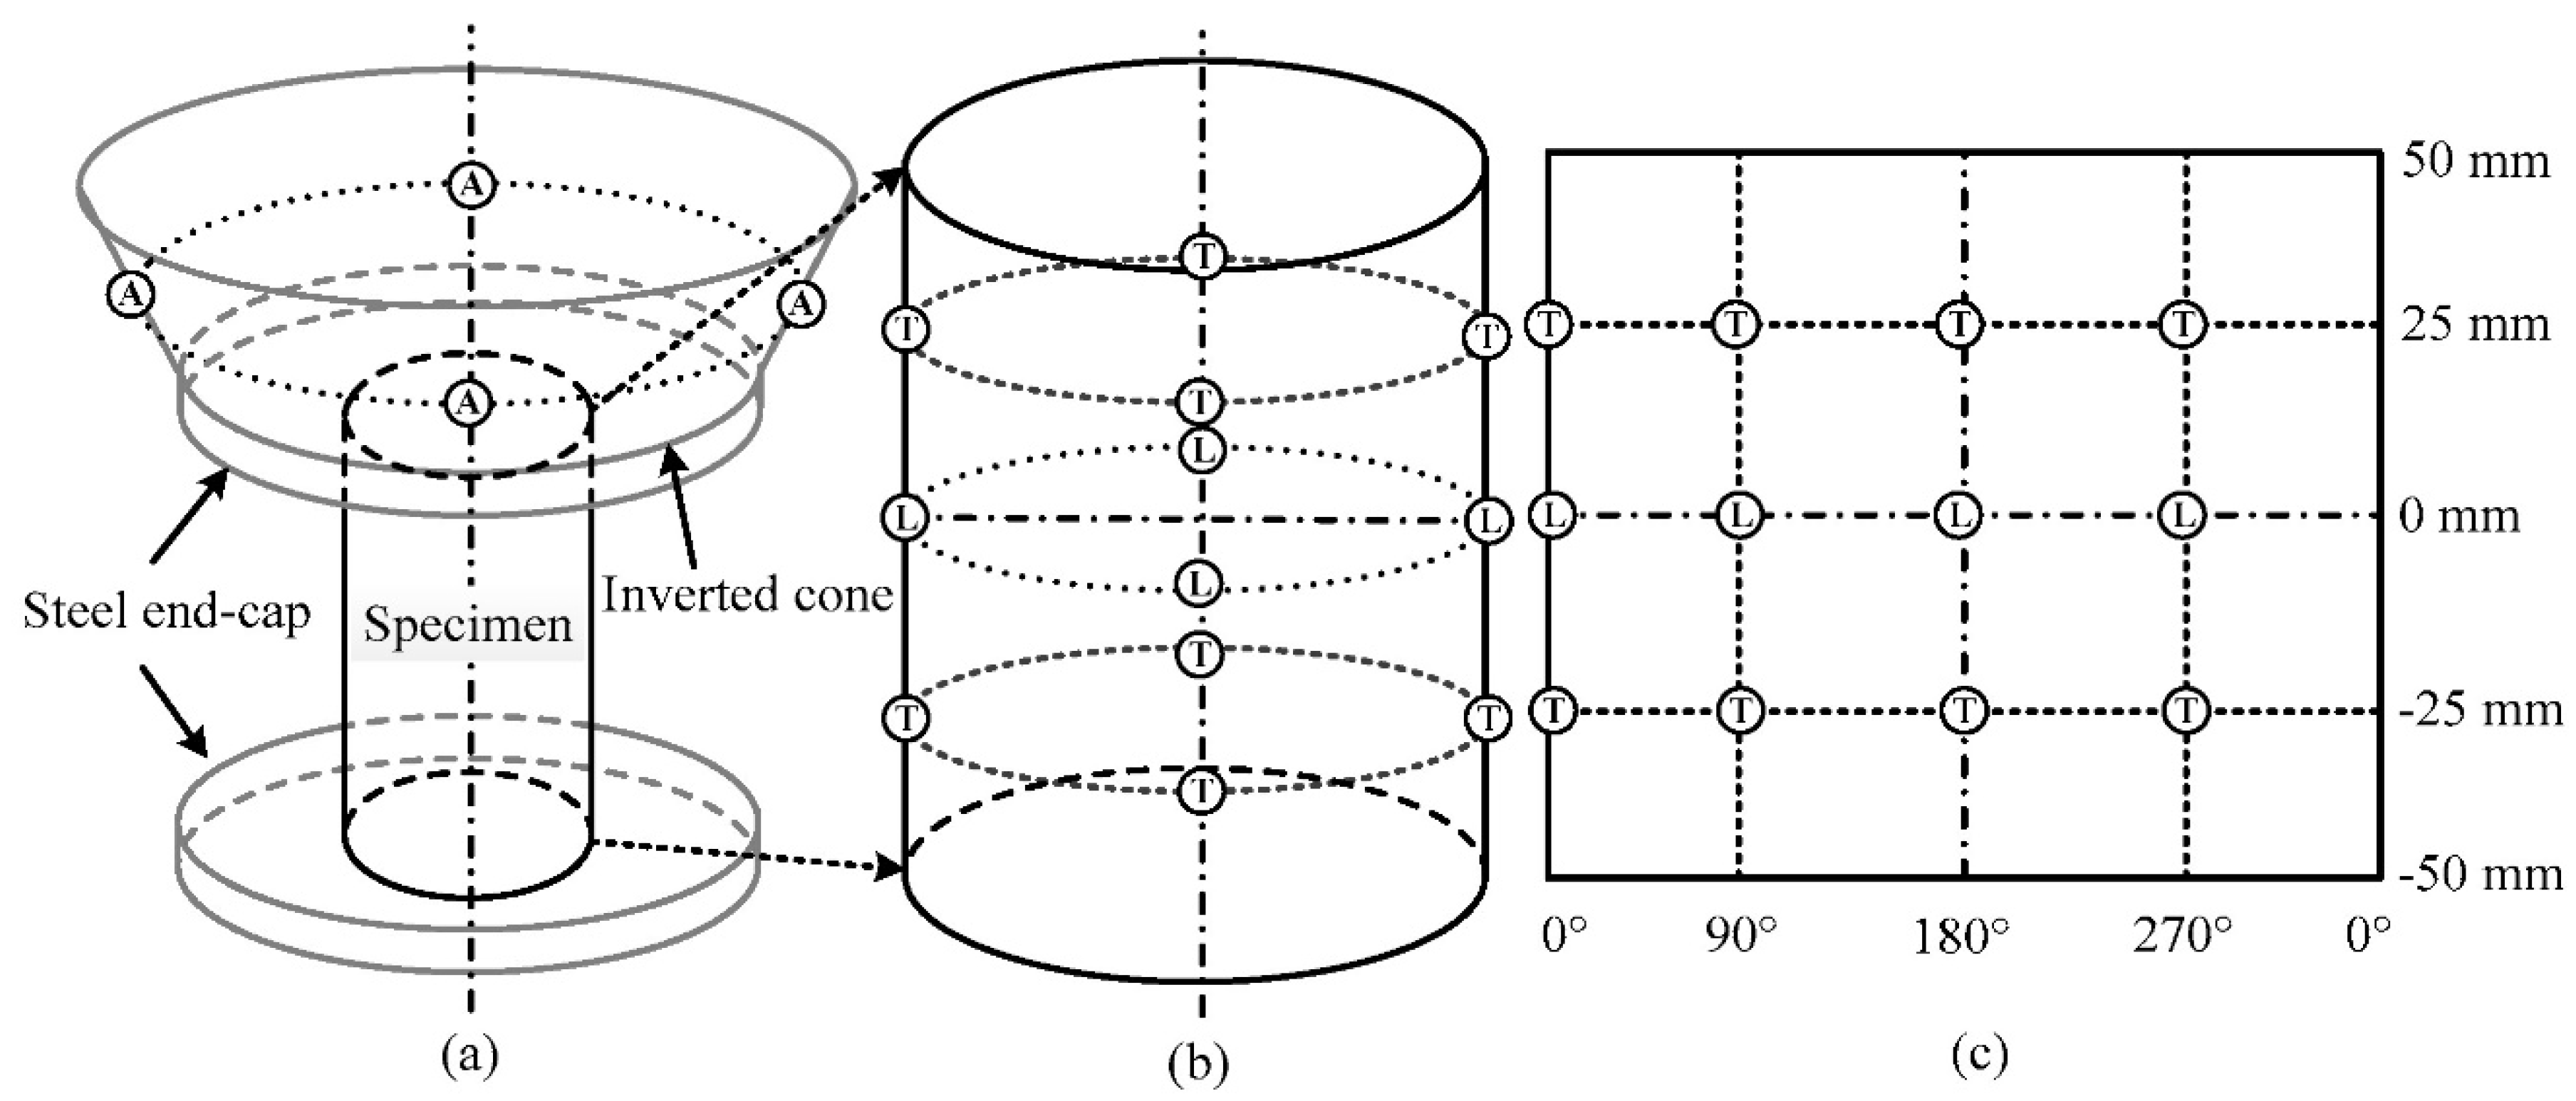
2.2.4. Microscope Observation of the Thin Sections

The optical microscope that was used in this study was a high-quality polarized optical microscope (DYP-990) that was coupled with a high-quality camera (DYS-1000A), which had 10 million effective pixels and a resolution of 3664 × 2748 pixels.
After the conventional UCS tests, the cyclic creep tests, and the intermediate strain rate tests, thin sections were obtained from the used specimens. Figure 8 illustrates the locations of the thin sections that were obtained from the specimens. In order to eliminate the end effect of the samples, we cut out the middle part of the sandstone sample at a height of 25 cm, and then created several thin sections along the axial and lateral directions. Figure 8 shows the thin sections, as follows: sections 1–5 are in the lateral direction and sections 6–10 are in the axial direction. The objective of creating thin sections along different directions was to explore the evolution of the micro-cracks along the different directions.

3. Experimental Results

In this section, the evolution of the cracks in the rock under different loading strain rates has been illustrated and the influence of the different strain rates on the strength characteristic of the rock specimens was analyzed using stress–strain curves.

3.1. Conventional UCS Tests

It should be noted that the samples that were used in the conventional UCS tests were intact and were obtained prior the cyclic creep tests that have been described in Section 2.2.2. Some thin sections were created in different loading directions after the conventional UCS tests. The area where the thin sections were obtained was a small distance from the primary fracture surface so as to avoid the influence of the fracture surface on the crack evolution.
Figure 9a demonstrates that the intergranular cracks coalesced into a long crack around the mineral grains, as the loading stress increased from the maximum level of the creep tests to the stress level of the rock failure. Although Figure 9b showed that most of the cracks were intergranular, and there were also some transgranular cracks, which showed that the grains of C and D had crushed the nearby grains. Unlike the mechanism that generated the transgranular cracks shown in Figure 9b, the transgranular cracks in grains A and B in Figure 9a did not indicate that they were generated by crushing by the nearby mineral grains. It should be noted that the view direction of Figure 9a was parallel to the loading direction. Therefore, grains A and B were crushed by the nearby grains in the axial direction. This indicated that the only direction in which the grains were crushed by the nearby grains was the direction that was parallel to the loading stress.

3.2. Creep Tests

The AE in the rock specimens was monitored by the AE equipment (Figure 4) during the cyclic loading and unloading creep tests, from which the evolution of the micro cracks in the samples during the test were obtained. After the test, thin sections were made from the samples that were used in the tests to investigate the path of the crack growth. Finally, the UCS tests were performed on the sample that was used in the previous cyclic loading and unloading test, and the stress–strain curves were compared with those of the impact tests, in order to analyze the differences in the strength parameters under different strain rates.

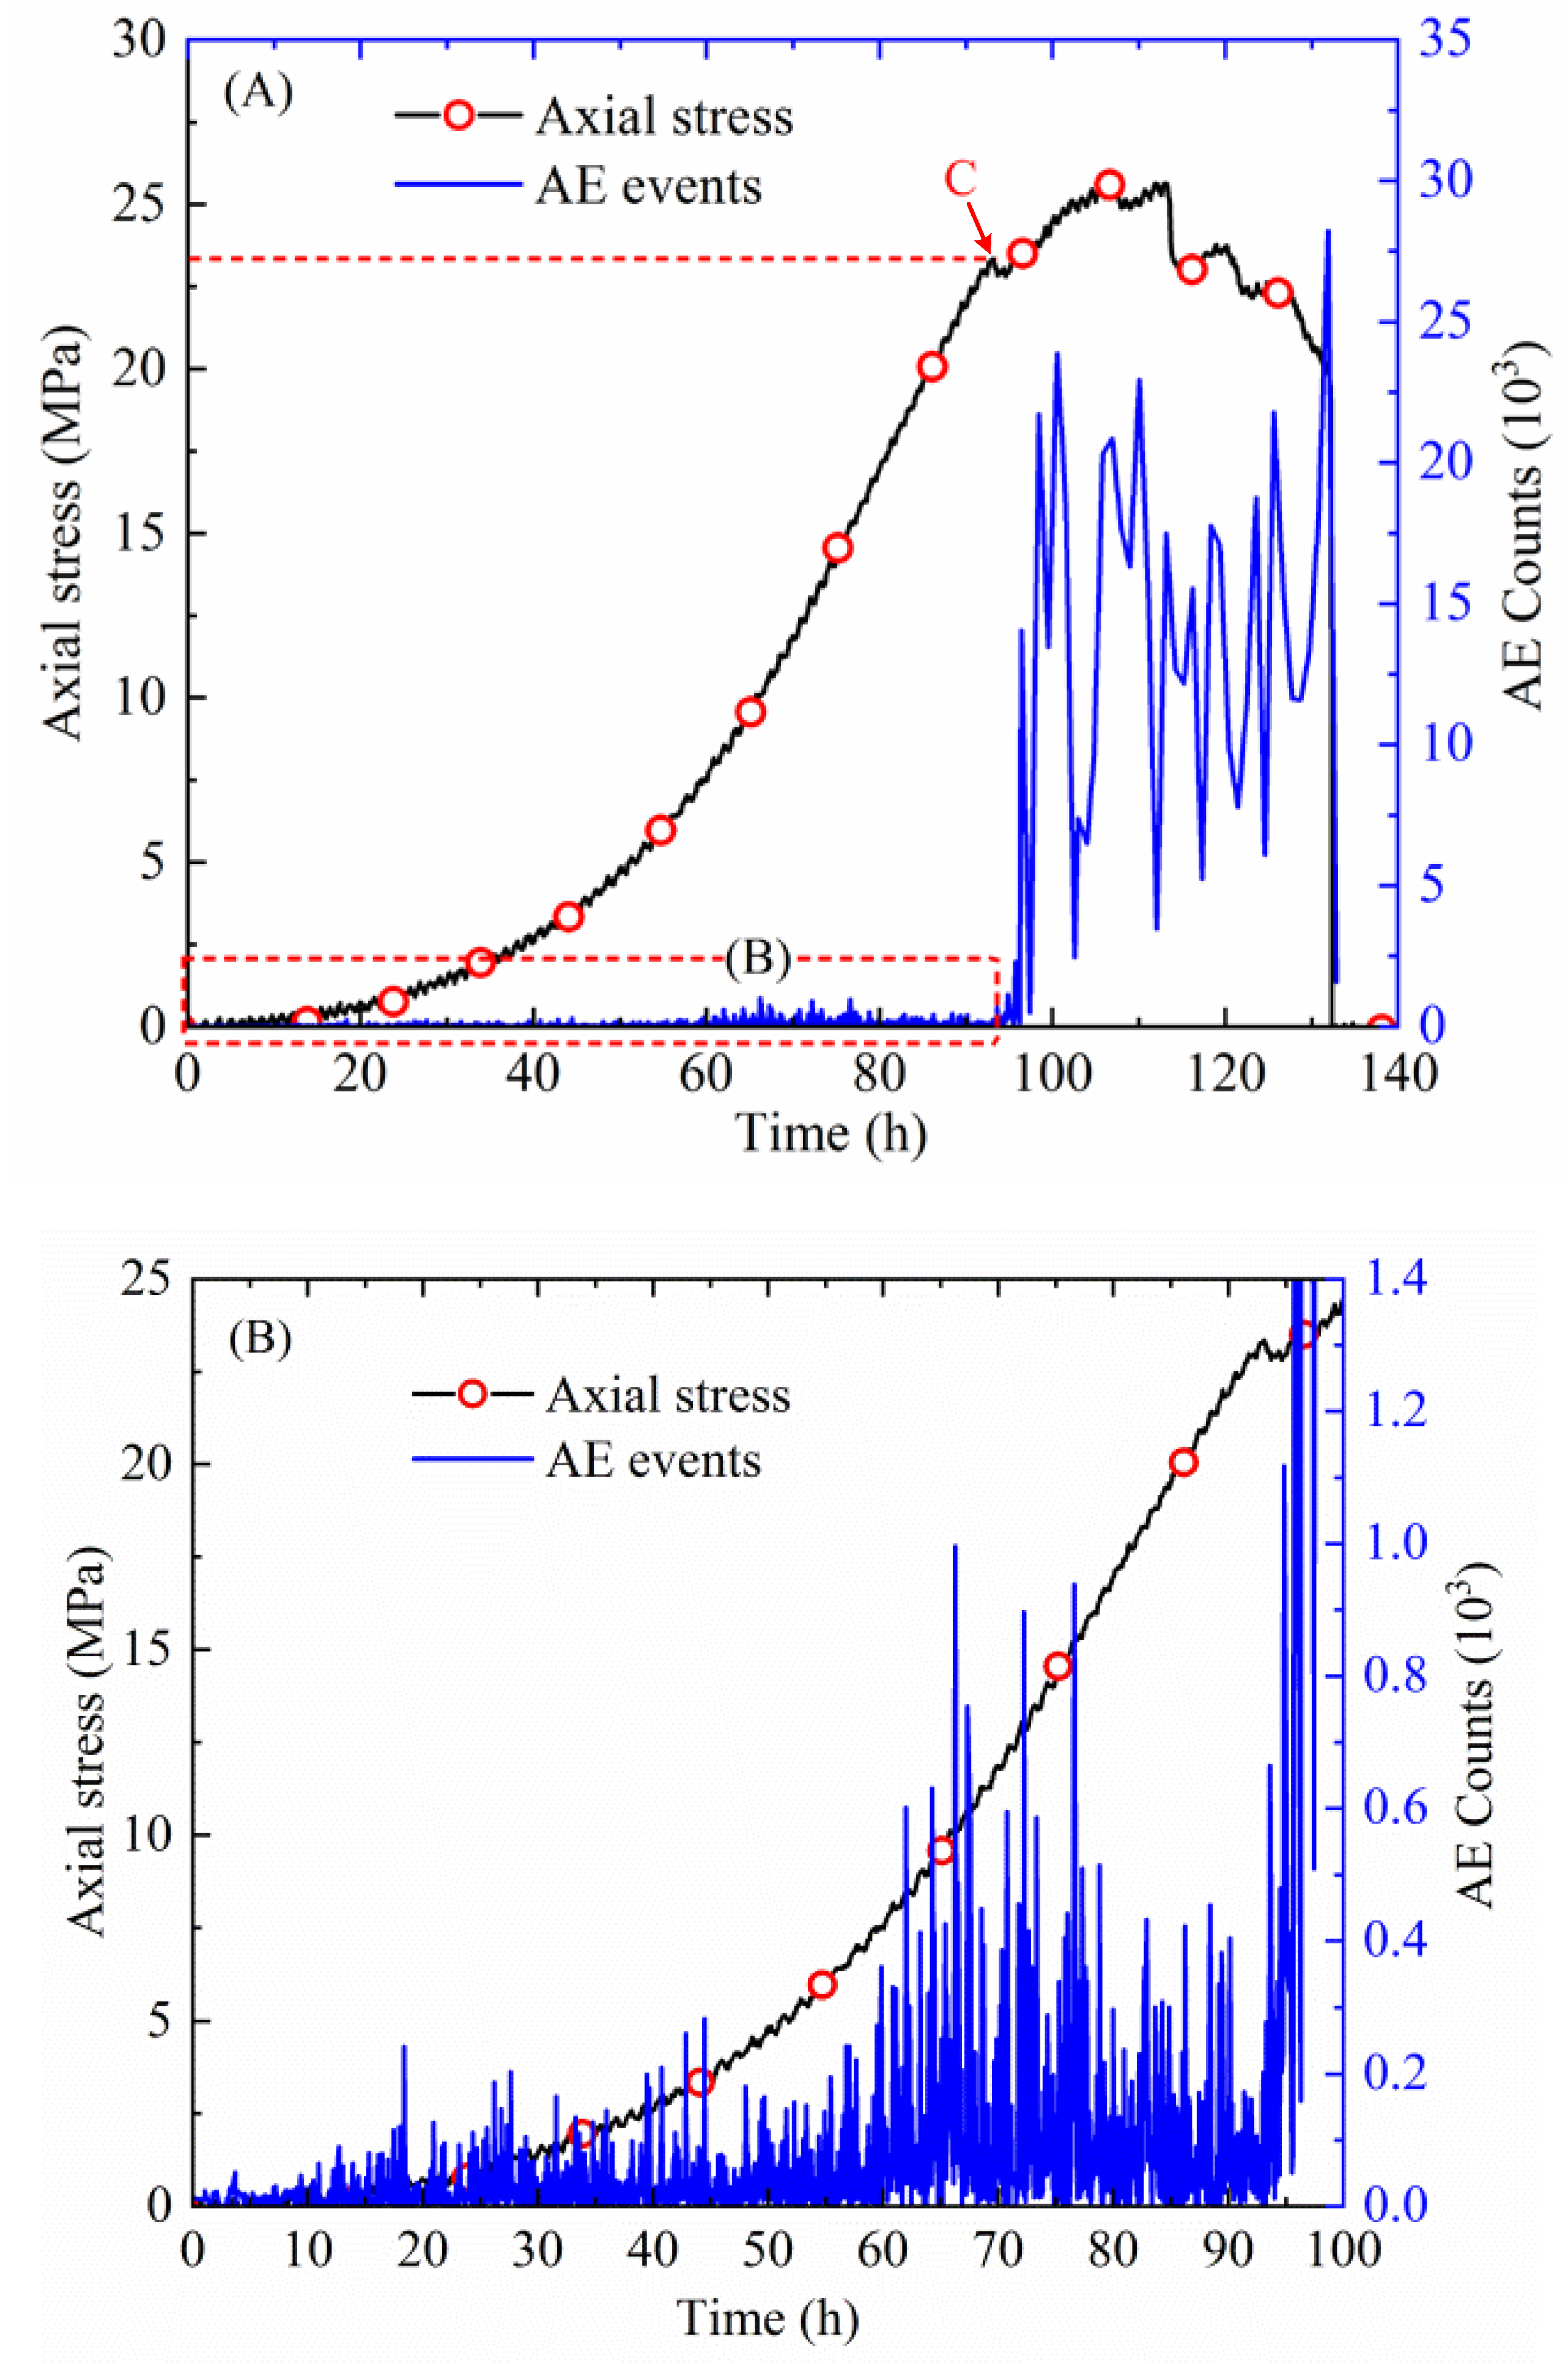
3.2.1. Axial Strain and AE Events—Time Curves

As shown in Figure 10, a cluster of AE events was generated at the onset of the stress that was applied to the sample. During the subsequent period, which was the first high-stress loading stage, more AE events were observed. As it was observed before, the number of AE events decreased over time for the same loading stage. It could be concluded that many micro-cracks were compacted during the initial time of the first two stages, but the number of compacted cracks decreased under the constant loading stress stage. However, the structure inside the sample gradually stabilized under the constant loading stress. After the loading stress was maintained for a period as constant, it was reduced to a lower level. Fewer AE events were observed under a lower loading stress, which indicated that fewer micro-cracks were generated and extended. For the second high-stress loading stage, the sample was loaded with a high stress and the micro cracks extended further. When the loading time reached the third high-stress stage, many AE events were observed. We concluded that the extension and connection of some micro-cracks had occurred inside the sample.

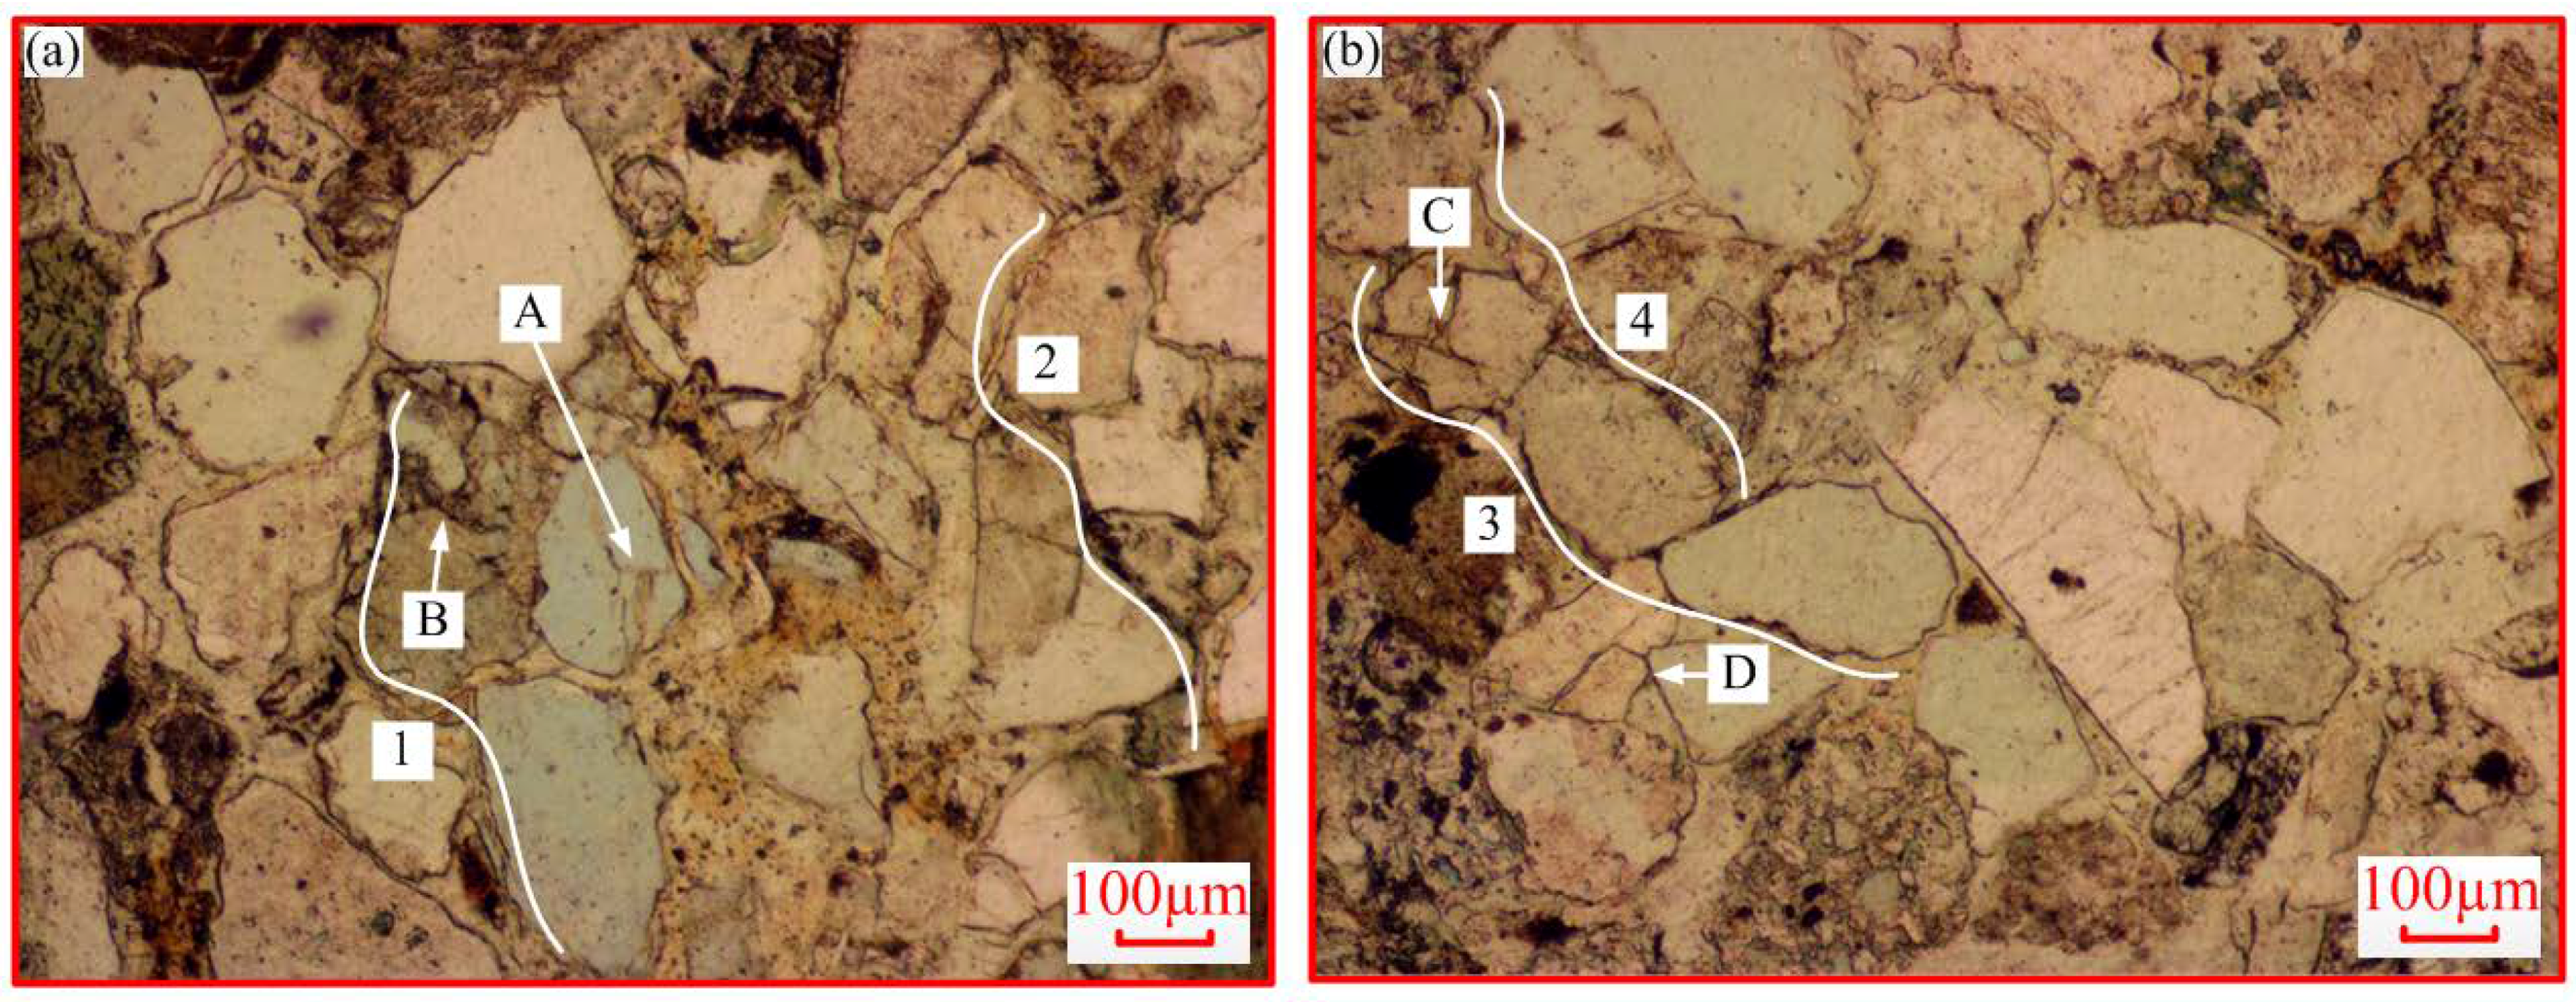
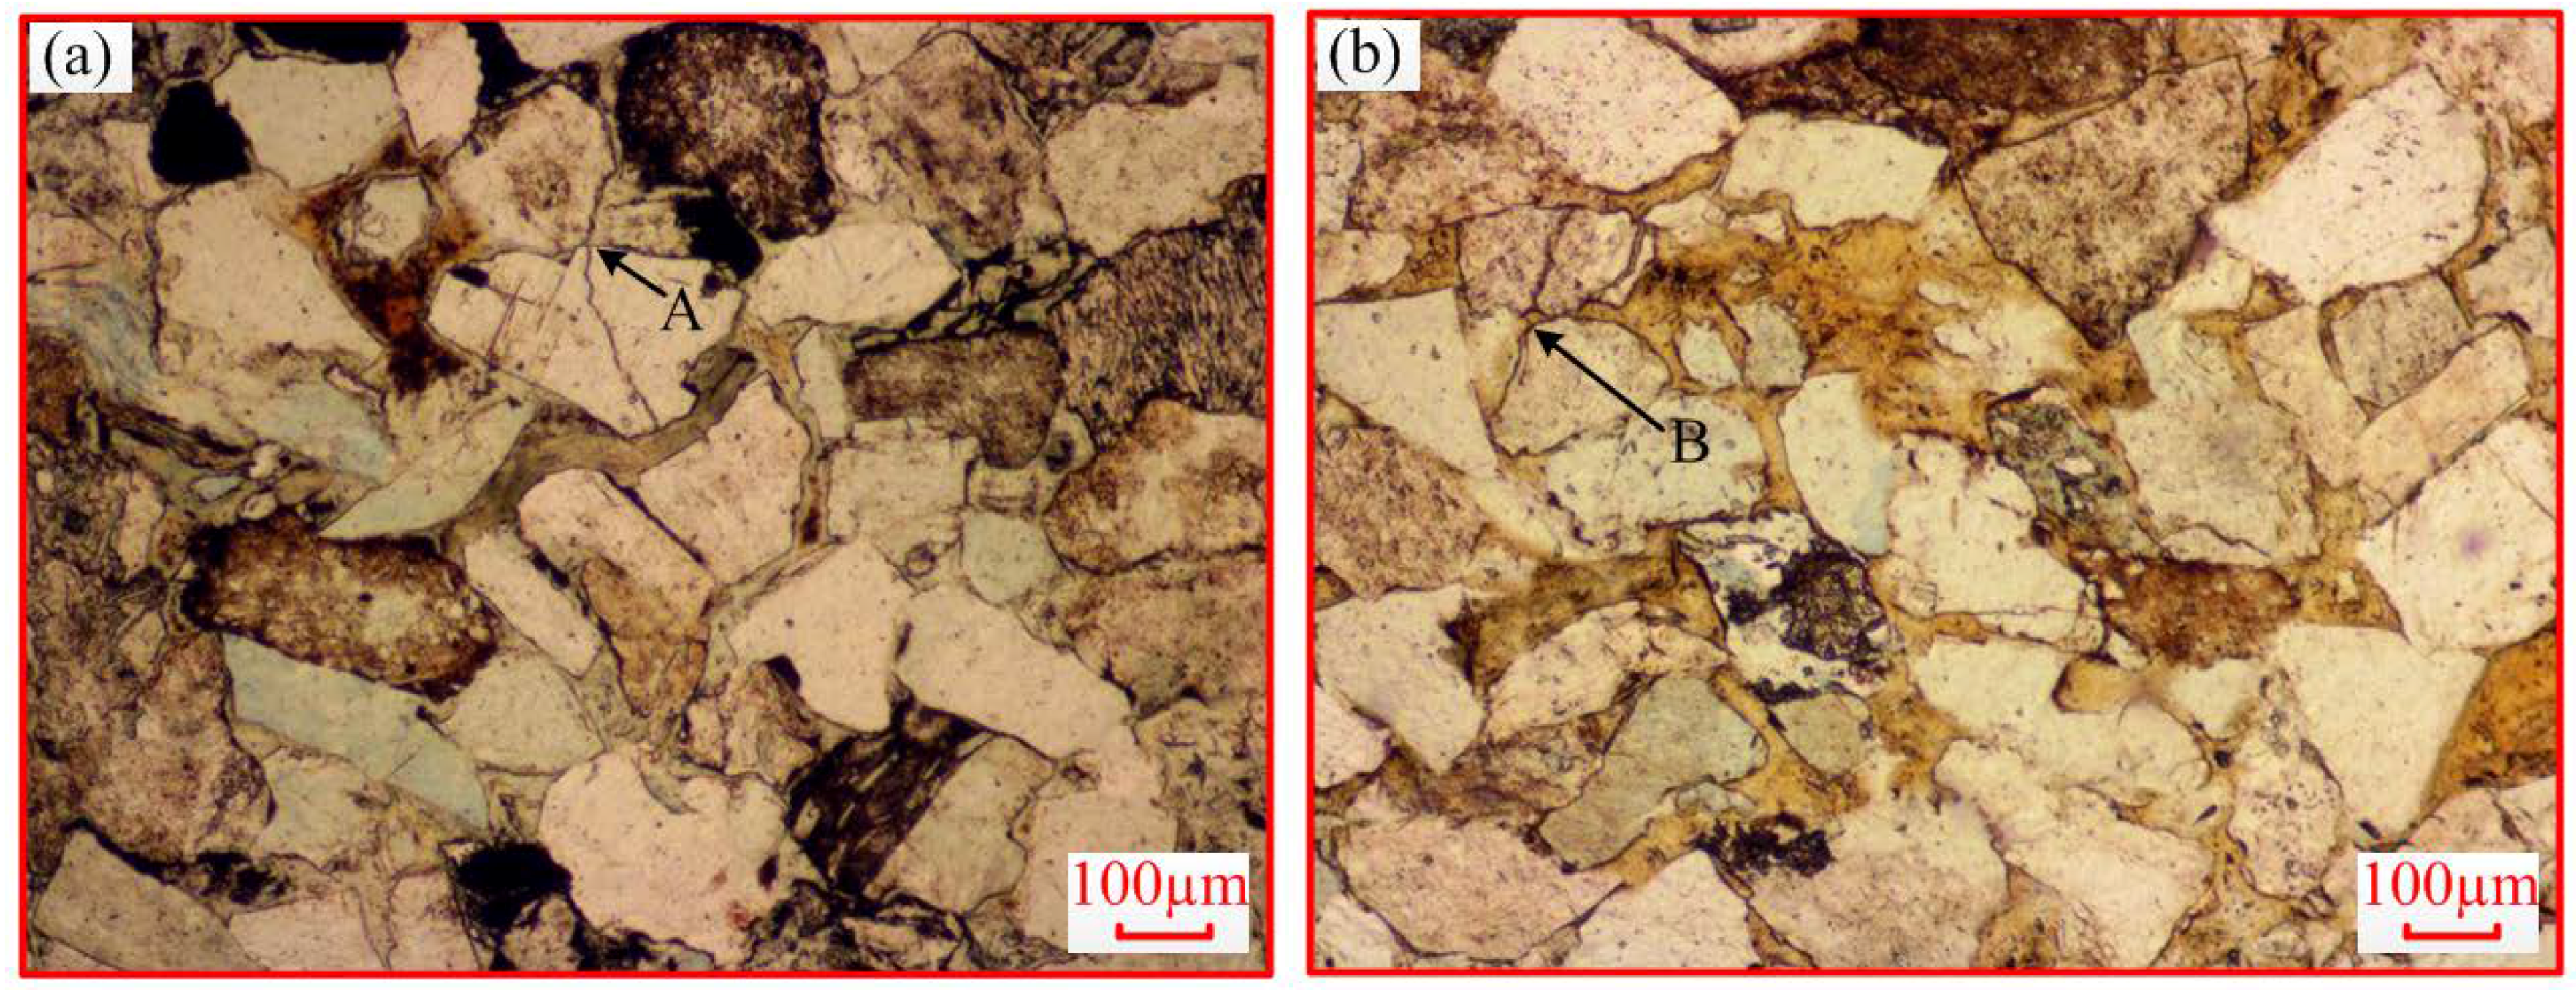
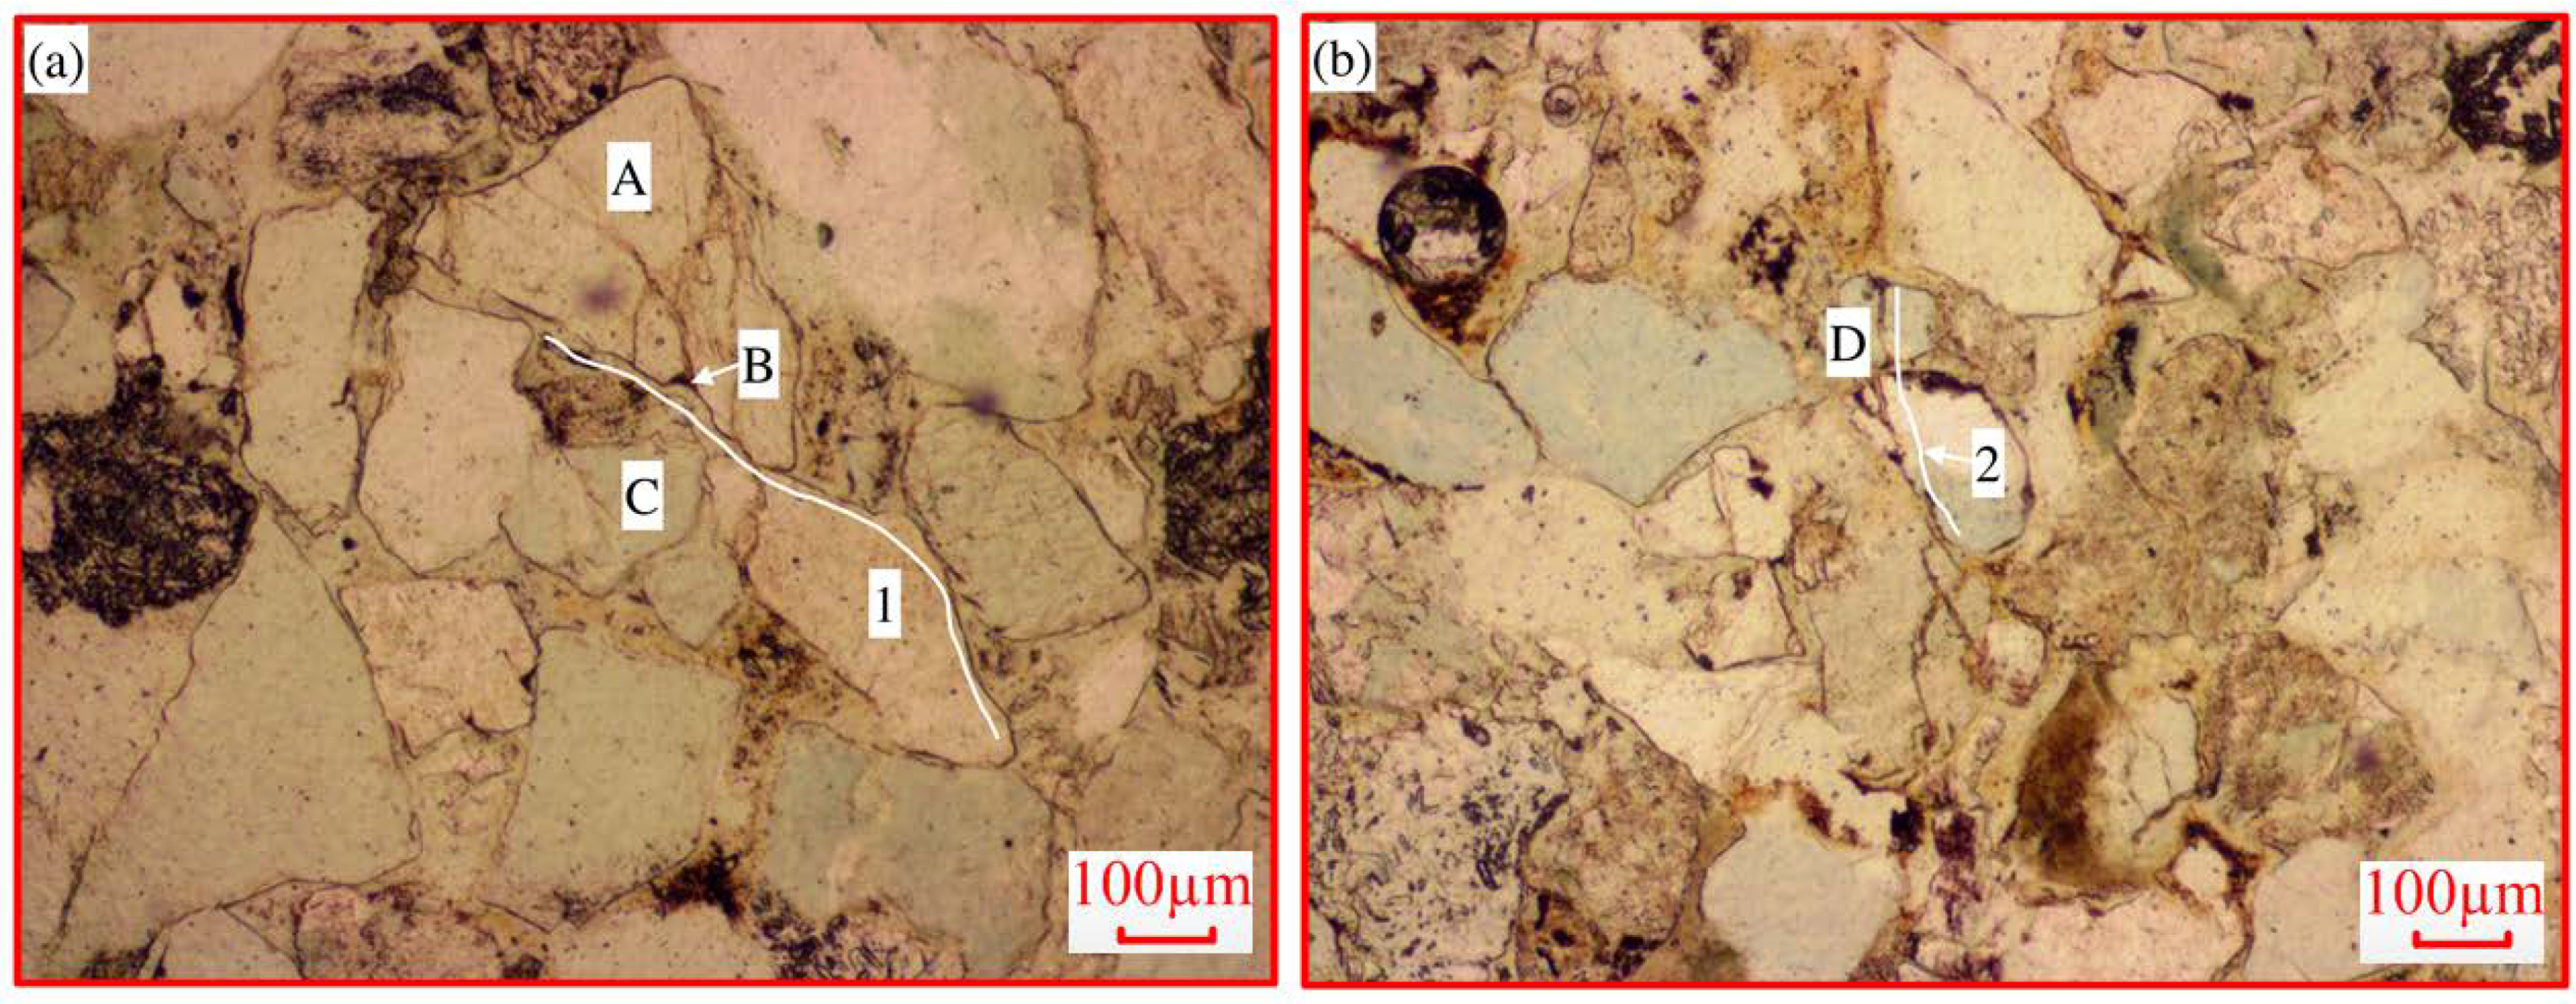
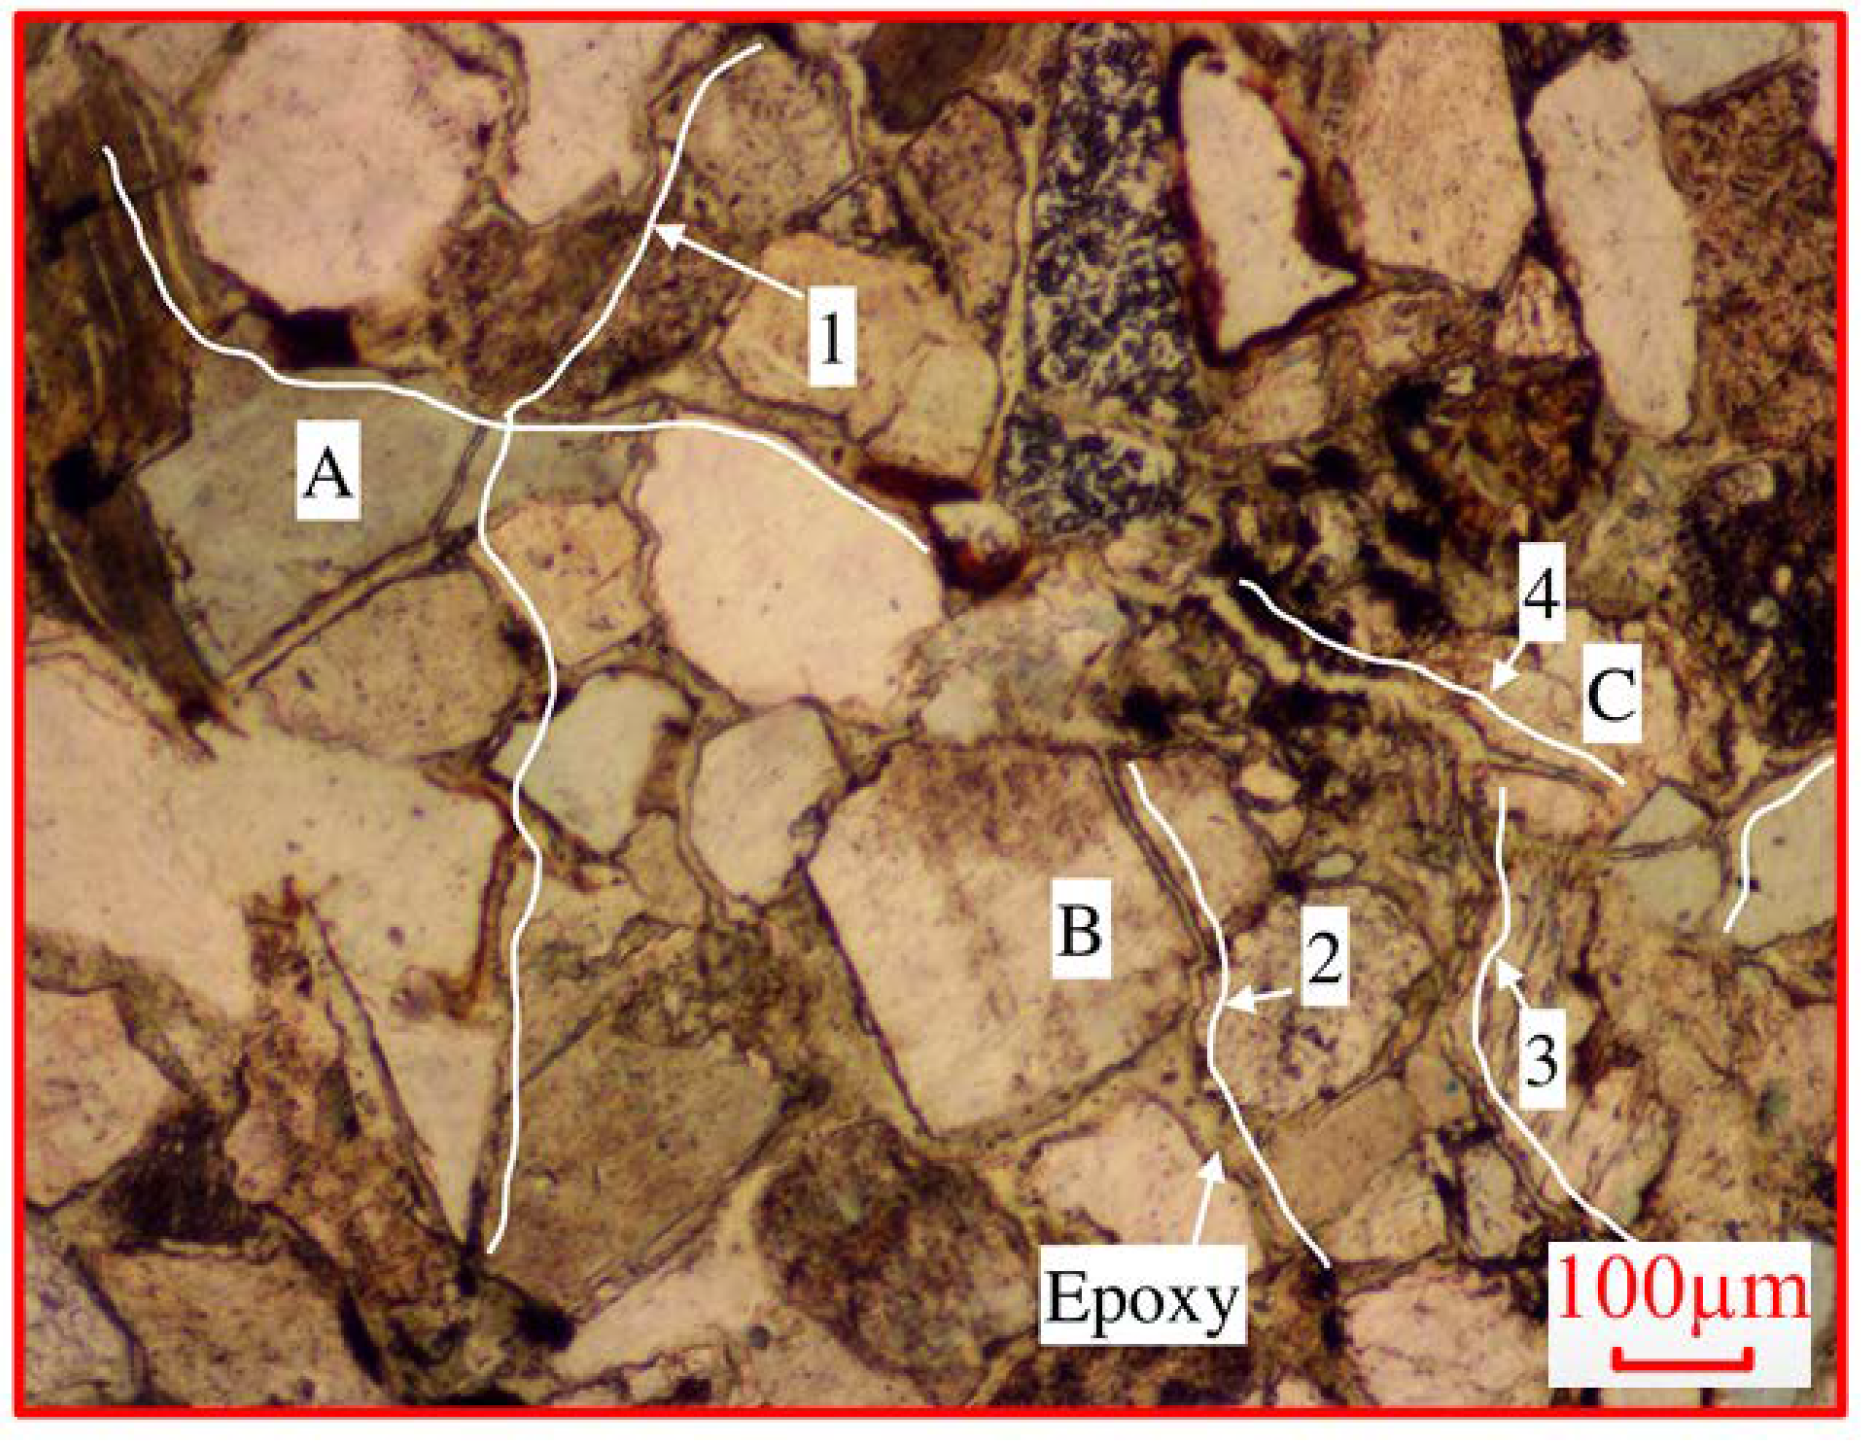
3.2.2. Microscopy Observation

The microscope observations of the thin sections showed the following results along the different directions.
(a) Lateral direction
Most of the cracks were generated around the quartz grains and were intergranular in the lateral direction of the samples during the loading and unloading creep tests, under a low strain rate. For example, cracks were observed around A, B, and D (Figure 11), and the grains were separated from the matrix. This was typical for cracks under a low loading rate.
(b) Axial direction
Although there were some intergranular cracks in the axial direction (Figure 12), these types of cracks were not as common as in the lateral direction. Some transgranular cracks started to appear in the sample (A and B in Figure 12) and this was common in the creep tests, especially in the lateral direction. In addition, the mechanism of generation of those transgranular cracks was very similar to that shown in Figure 9.

3.3. UCS Tests after Cyclic Creep Tests

Figure 13 illustrates that the preceding cyclic creep tests had some impact on the deformation of the sample, as shown by the number of AE counts. The stress value at point C in Figure 13 was about 23 MPa, which was slightly higher than the maximum value during the preceding cyclic loading and unloading tests, as shown in Figure 5. The number of AE counts was much higher after point C than before the point. This indicated that the preceding cyclic loading and unloading tests had an effect on the specimens. After point C, a large number of AE events appeared, which demonstrated that many cracks were initiated, propagated, and clustered. It should be noted that Young’s modulus and the UCS values were reduced to 5.05 GPa and 25.63 MPa, respectively. The UCS test illustrated that some of the cracks had already been compacted and that they were generated during the preceding creep test, which verified the results of the analysis of the crack evolution under the optical microscope.
Figure 13B shows that some AE events still occurred prior to point C, even though the loading stress during this period was not higher than that which was previously experienced in the cyclic creep tests. The AE events were the results of the release of energy in the specimen during the stress loading. However, a higher stress was loaded on the specimen in the cyclic creep tests. According to the Kaiser effect, we assumed that this was as a result of the recovery of the deformation after the cyclic creep tests and that the released energy was elastic deformation energy.

3.4. Intermediate Strain Rate Tests

We selected one type of failure mode under the higher strain rate in order to discuss the compaction, generation, extension, and connection of the micro-cracks and to compare it with that under the low strain rate. We analyzed the results in the two directions (shown in Figure 14).

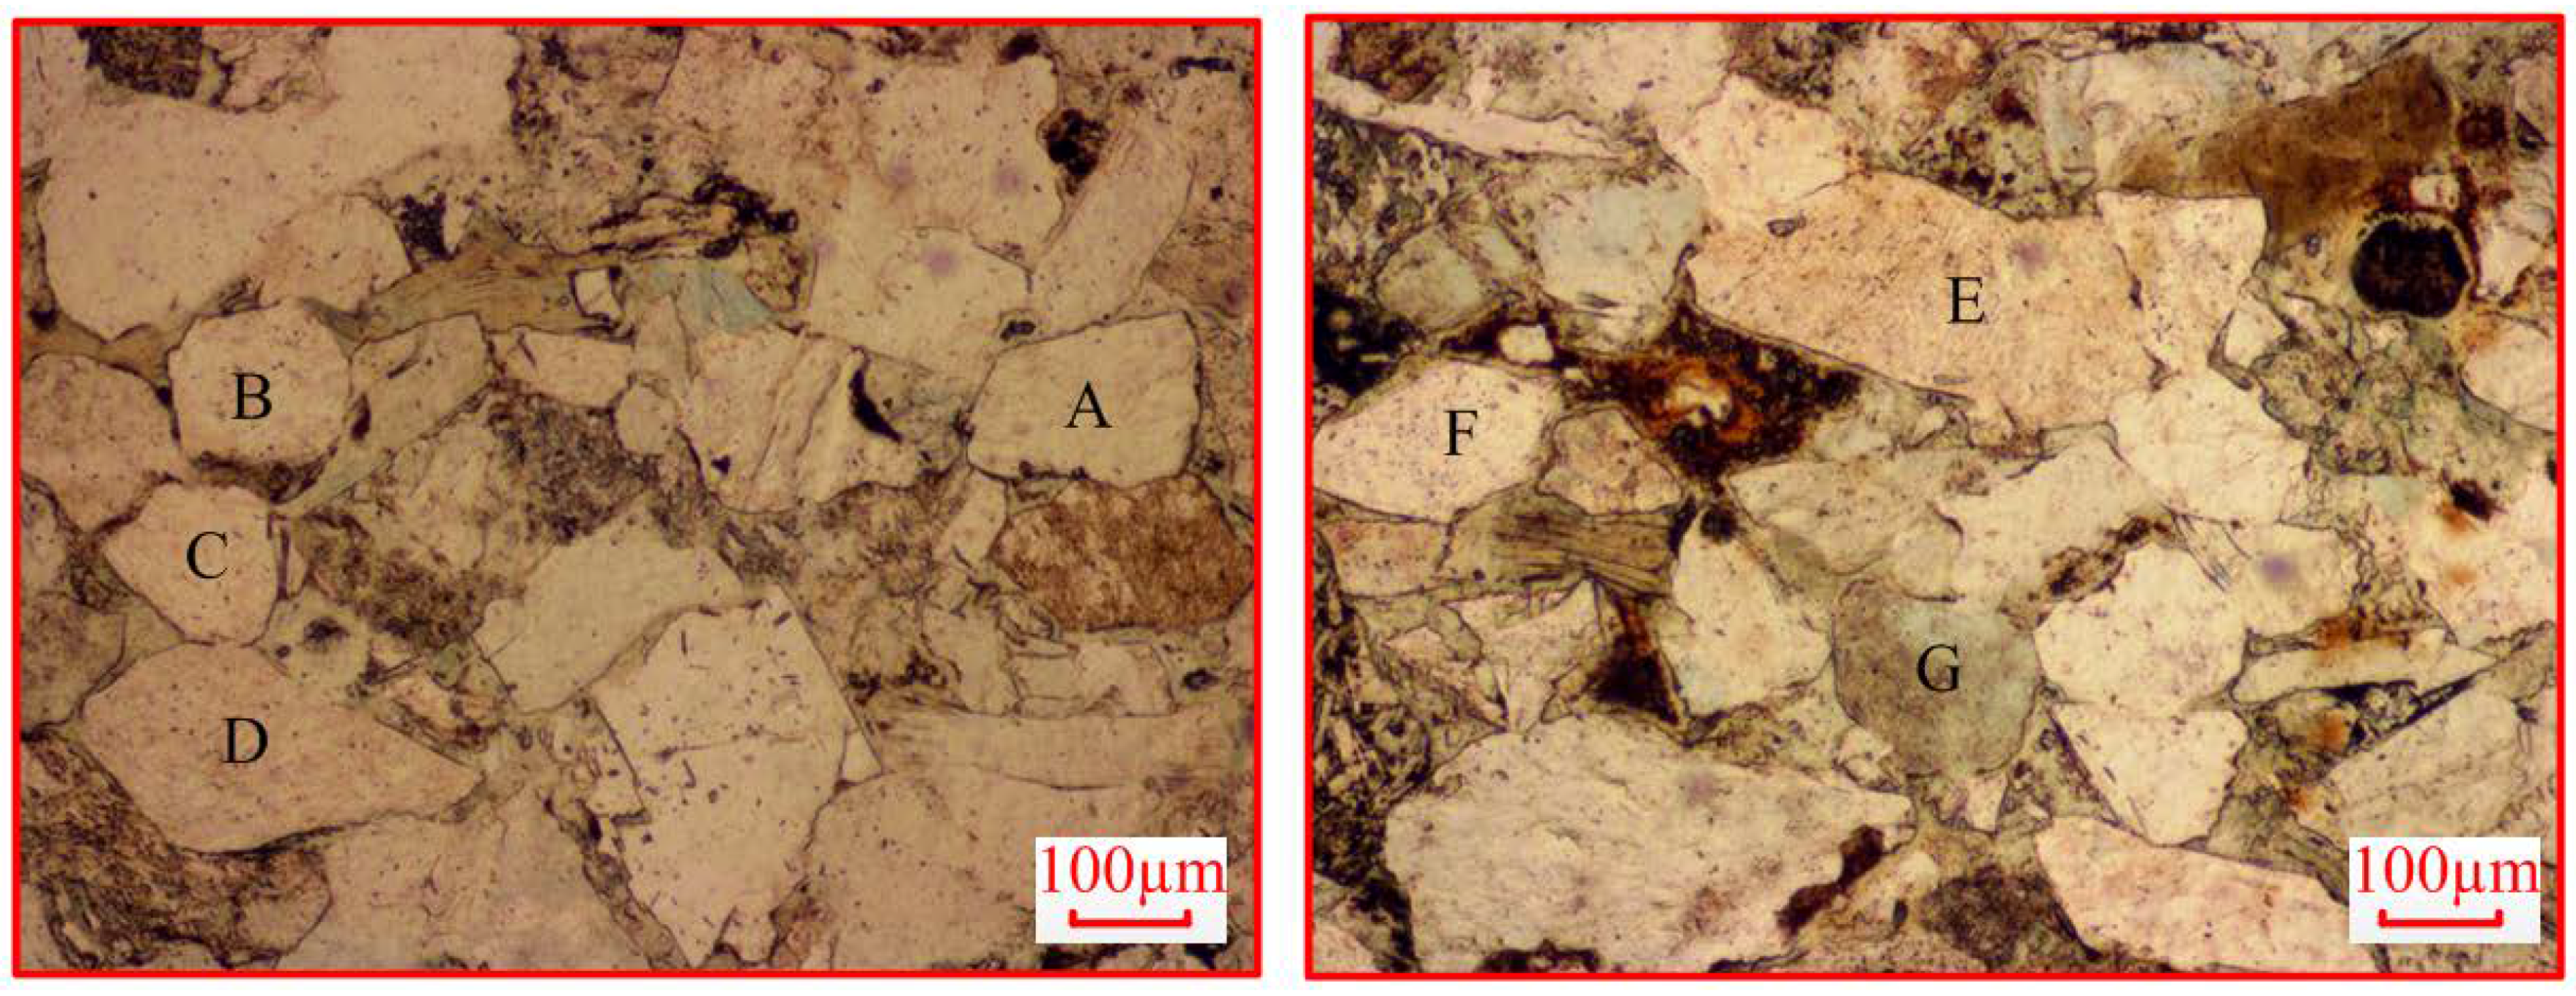
3.4.1. Lateral Direction in Microscopy

Some intergranular cracks were generated around the grains along the lateral direction in the intermediate strain rate tests. When the intergranular cracks were concentrated in one place, they clustered and connected. Then, the cracks developed and extended, and developed into a fracture. Most of these were the grain boundary cracks along the boundaries of several grains, as mentioned in [50]. If the crack met grains of a low strength, the crack would go through the grain (A and D in Figure 15) [50]; if the tip of the cracks with a strong concentration of stress touched the grain (D in Figure 15) in its direction of spread, the crack would go through the grain and became a trans-granular crack.

3.4.2. Axial Direction in Microscopy

Figure 16 shows that the mineral grains in the axial direction appeared more granular under the intermediate strain rate, because the width of the intergranular cracks between the grains and matrix was larger. However, no obvious coalescence between the intergranular cracks was observed. Nevertheless, some transgranular cracks were generated in the axial direction under the intermediate strain rate (see cracks in grains A, B, and C, shown in Figure 16). A comparison of the transgranular cracks and the intergranular cracks around the grains indicated that the transgranular cracks extend into and connect with the intergranular cracks. Furthermore, Figure 16 shows that some of the transgranular cracks (lines 3 and 4) started to coalesce and formed a fracture [50].

4. Discussion

4.1. Comparison of the Microscopy Results of the Cyclic Creep Tests and the Conventional UCS Tests

A comparison of the results in Figure 11 and Figure 12 with those in Figure 9 indicated the similarity in the crack evolution after the cyclic creep tests and after the conventional UCS tests, even though the samples in the cyclic creep tests did not fail in the end. This demonstrated that the mode of the crack evolution was nearly the same under the same strain rates, and it further indicated that the fractures that were generated in the creep test and in the constant strain rate test were not easily distinguished at the macroscopic scale [51]. Therefore, we further used the thin sections that were obtained after the cyclic creep test to analyze the crack evolution in the sandstone samples at the strain rate of 10−5 s−1.

4.2. Crack Evolution under Different Directions and Strain Rates

Figure 11 shows that most of the cracks were intergranular around the quartz grains. This was because of the different deformations that occurred as a result of an elastic mismatch in the interior structures between the grains and the matrix. The grains and the matrix had different mechanical properties regarding the loading stress. The grains had a stronger resistivity whereas the matrix had a larger deformability. Therefore, the grains with stronger mechanical properties had less deformation than the matrix when they were subjected to the same loading stress.
The reason for the transgranular cracks (shown in Figure 12) was that points of stress concentration were encountered as the grains were contacted during the stress loading. However, when the resistance of the grains is was weaker than the stress on the point of the contacted grains, the generation of transgranular cracks occurred so as to release the energy. It was interesting that the two contacted grains, shown in Figure 12a, were punctured by each other, which implied that the resistance of these two grains was almost similar. This was because both of the grains were quartz. Since only one of the two contacted grains, shown in Figure 12b, was crushed, we could conclude that the resistance of the crushed grain was decreased, because it was coupled with a feldspar, which was illustrated by the rough surface.
Although most of the cracks were intergranular in the lateral direction under the intermediate strain rates (Figure 15), some transgranular cracks appeared in the sample. Most of the transgranular cracks were generated under the influence of the intergranular cracks. Some intergranular cracks first appeared in the sample and were similar to the cracks that were generated under a low strain rate. As the intergranular cracks extended, the energy concentrated at the tip of the cracks. Once the degree of stress concentration reached a certain value, the energy would release itself along the direction of least resistance [52,53]. However, there was a higher concentration of deformation energy in the interior of the samples in the intermediate strain rate tests, than in the static tests. In addition, more cracks clustered and connected in the dynamic tests, which led to the evolution of the cracks and the release of the energy inside the samples. At this time, when a crack encountered a grain during its extension, there was a tendency that the crack would go through the grain directly, to become a fracture, and not along the grain. The trans-granular cracks under the loading of the intermediate strain rate were punctured by cracks and differed from those that were created under static loading, and were crushed at the surface of another grain.
Figure 16 shows that the energy was be released across the grains in the axial direction of the samples under the dynamic loading rate [54]. When the point of a grain touched another weaker grain, the weaker grain was punctured by the stress at the point of contact, which resulted in transgranular cracks. In addition, intergranular cracks would have resulted, because the matrix was easier transformed than the nearby grains. However, the energy was sufficient in order to generate intergranular cracks, but it was not enough to result in the extension of the intergranular cracks and their connection with the existing cracks.
Above all, the generation of the transgranular cracks during the intermediate strain rate tests was based on the existence of inter-granular cracks, whereas the trans-granular cracks during the static tests were generated directly by other grains, but the number of trans-granular cracks were very low. With the increase in the strain rate, the cracks were changing from intergranular cracks to transgranular cracks [55].

4.3. Relationship between Cracks and Mineral Component

The rock strength was dependent on the percentage of the mineral components [24,56], especially for quartz [57], and different amounts of the weak or strong mineral components provided different functions with respect to rock deformation [58]. Although quartz provided the strongest binding, followed by calcite and ferrous minerals [21], the result of the crack evolution indicated that the generation of cracks depended on the quartz component in the three main compositions, namely, quartz, feldspar, and mica. This was in agreement with previous conclusions [59]. For example, regardless of the development of intergranular cracks or transgranular cracks, as shown in Figure 12, Figure 15, and Figure 16, most of the cracks occurred around quartz. Although the applied stress resulted in the generation of cracks and their propagation between the cement and crystal, which formed transgranular cracks in the quartz particles (grain A in Figure 15), it did not affect the surface alteration. The slight alteration of the plagioclase (grain C in Figure 15) mainly occurred in the sedimentary diagenetic stage and was definitely not caused by the stress during the test. The initial generation of the transgranular cracks as a result of the collision of two different grains occurred parallel to the loading direction in the quartz (A and B, shown in Figure 12). Even though some transgranular cracks moved across the feldspar (shown in Figure 16), it had occurred because of the propagation of the cracks from the quartz. As mentioned in Section 4.1, the location where the cracks were generated was related to the occurrence of the quartz, because different mineral components had different strengths and resulted in differences in the deformation under the same loading stress. It was common knowledge that the strength of quartz was much higher than that of mica [23], and that the quartz was more brittle than mica. However, the “soft” components absorbed more energy and deformed more than the “brittle” components under the same stress level. Therefore, the resistance of quartz was more important than the resistance of the other components, with regard to the loading stress in a short time period.

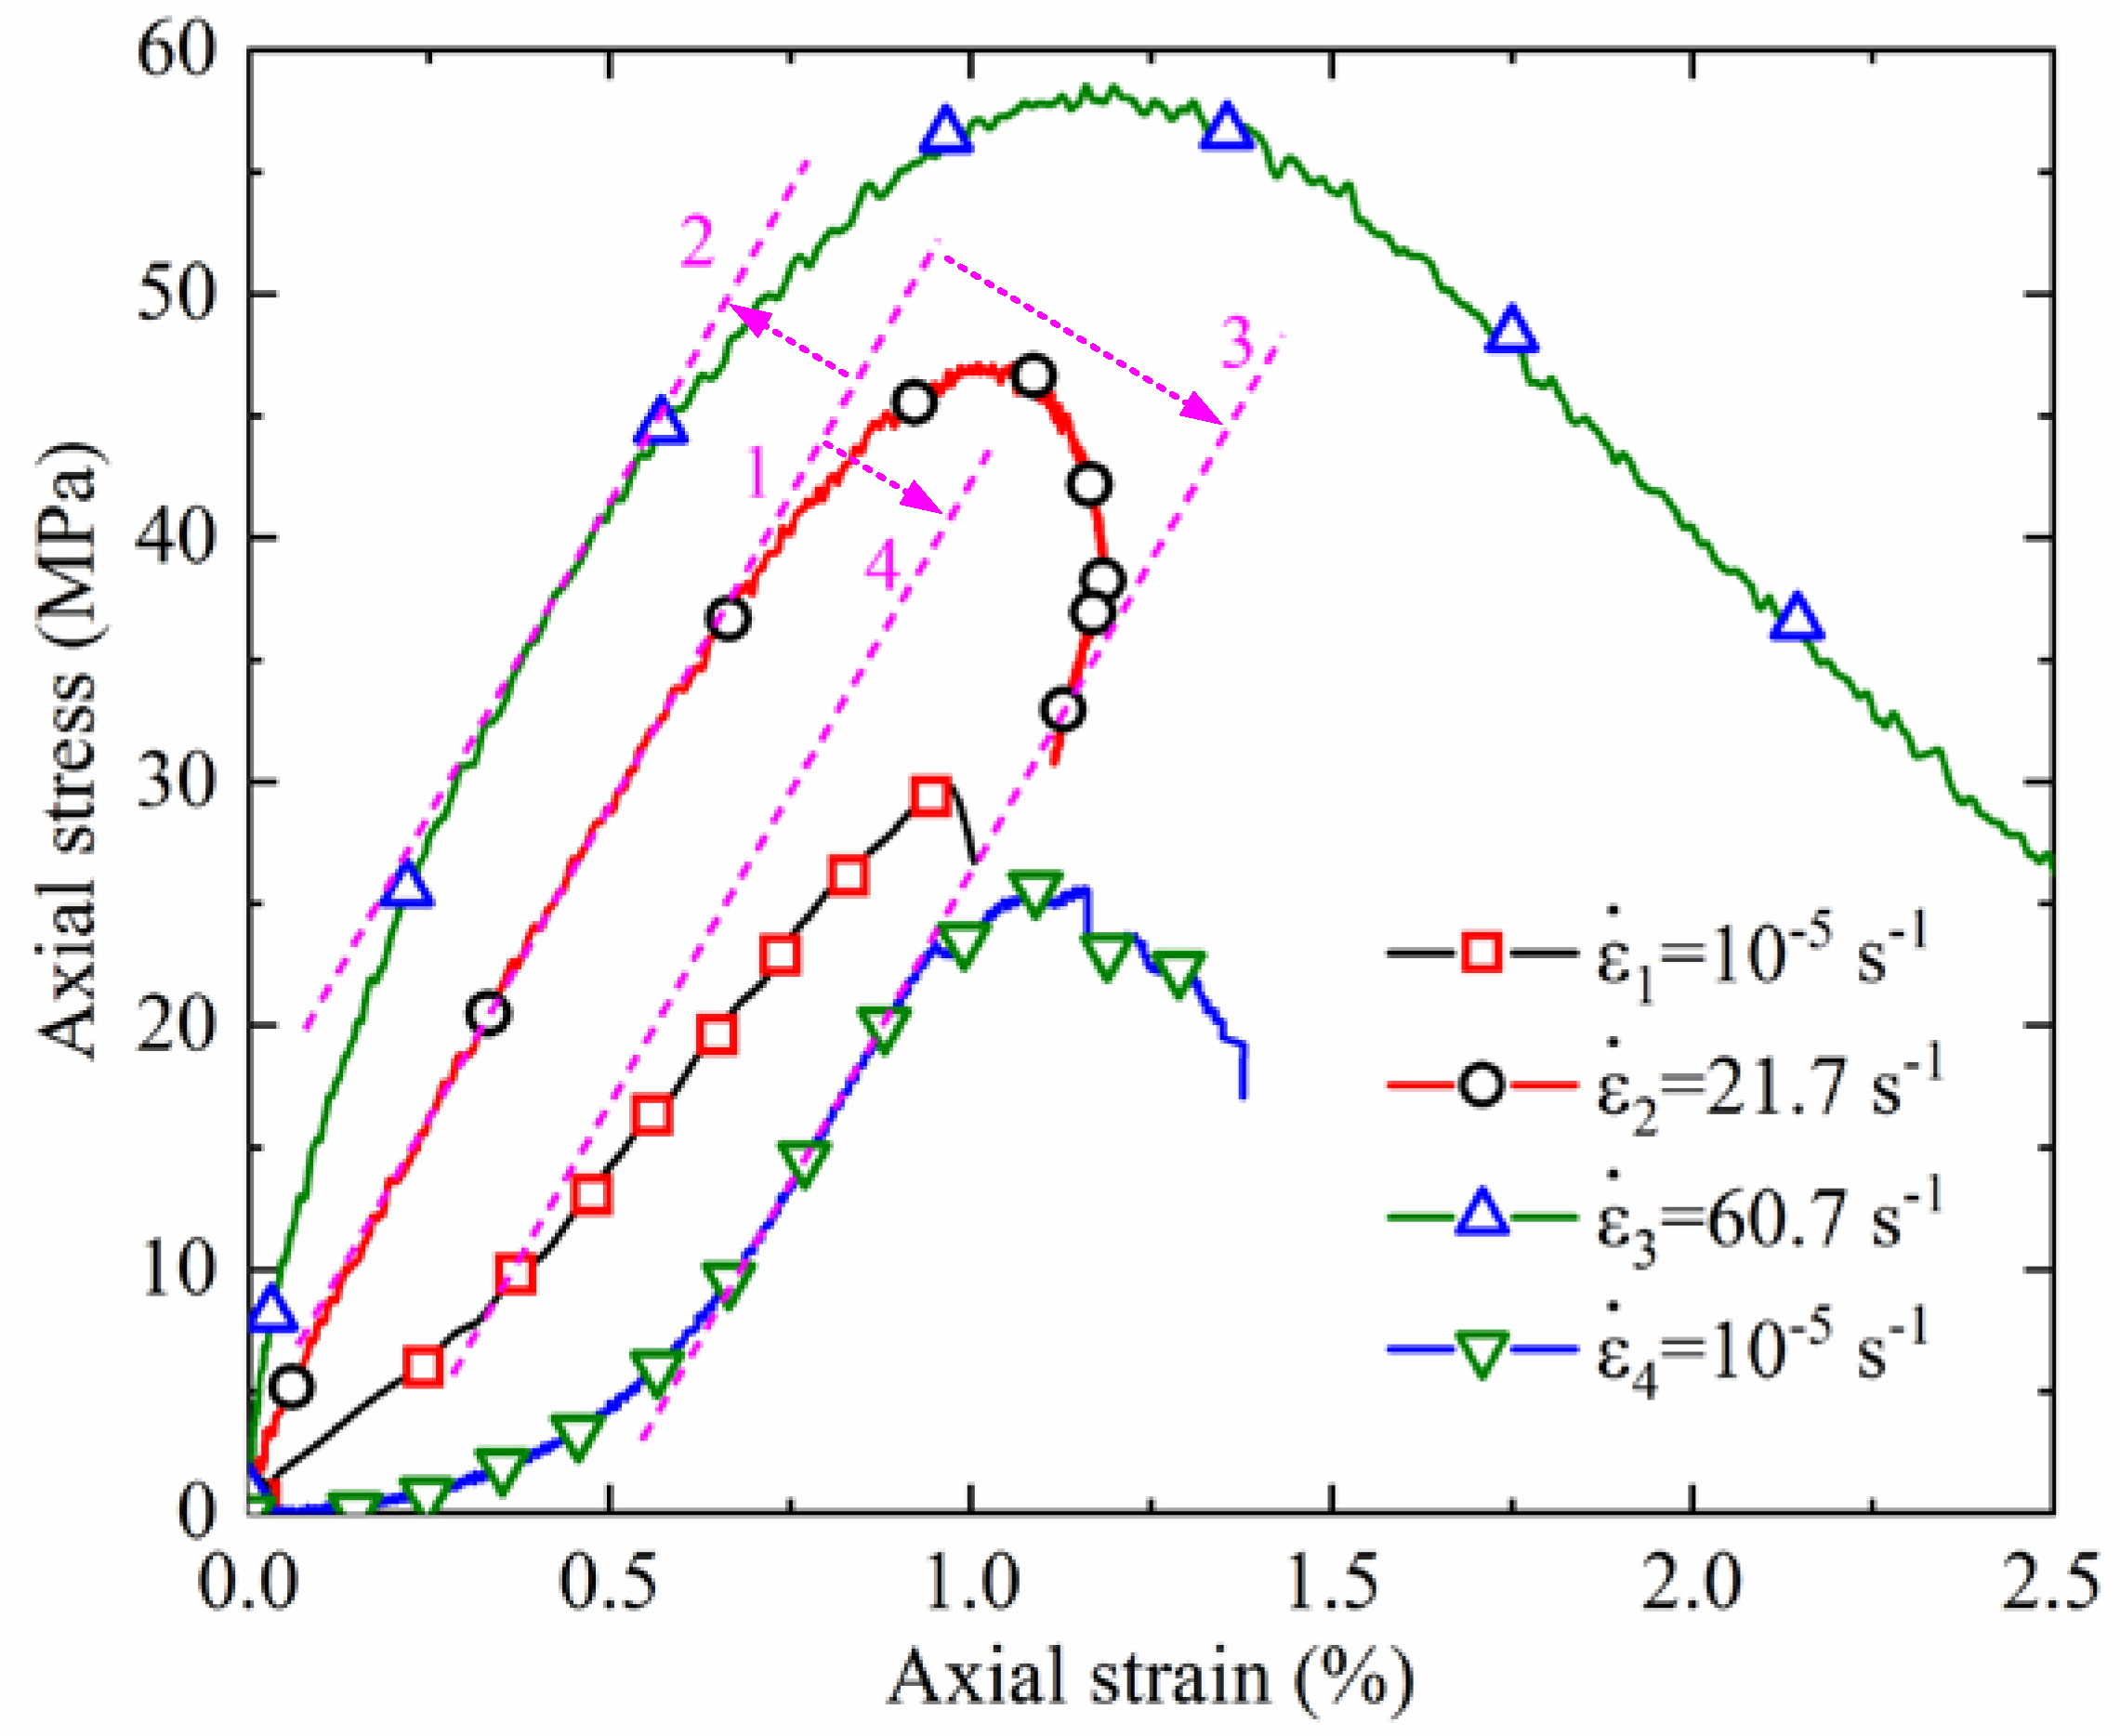
4.4. Comparison of Stress–Strain Curves

Although the sample size was different for the different strain rates, we use Equations (1) and (2), as described in Niu, et al. [60], in order to obtain the standard stress–strain curves based on the results of the intermediate strain rate tests. The complete stress–strain curves of the impact tests together with the creep tests are plotted in Figure 17.
Figure 17 illustrates that both the peak strength and Young’s modulus of the rock samples increased with the increase in the strain rate. However, Young’s modulus increased slightly, as the strain rate increased from 21.7 s−1 to 60.7 s−1, whereas the peak strength under the strain rate of 10−5 s−1 was much lower than that at 21.7 s−1. In addition, the peak strength of ε 4 ˙ was lower than that of ε 1 ˙ , which demonstrated that the cyclic creep tests did have some influence on the mechanical properties of the specimens, even though the rock samples were stressed at the same strain rate of 10−5 s−1. Moreover, it was evident that Young’s modulus was higher at the strain rate of ε 4 ˙ than at ε 1 ˙ . It was concluded that the stress–strain curve at the strain rate of ε 4 ˙ represented the crack compaction phase (picture B in Figure 13), whereas the stress–strain curves at the impact strain rate had no apparent crack compaction phase. The reason for the crack compaction phase was that the time of the stress that was applied to the sample was so short that the pre-existing cracks did not close or connect with the closed ones. Furthermore, new cracks were generated because of the large loading stress on the sample.
Compared with the curves at the strain rates of 10−5 and 21.7 s−1, at a higher strain rate, both the peak strength and Young’s modulus increased with the increase in the strain rates (curves of ε 1 ˙ and ε 2 ˙ in Figure 17), which agreed with the findings that were presented in other studies [60,61,62]. Furthermore, considering the evolution of the cracks and the increase in the strength and Young’s modulus, the conclusion that the transgranular cracks sustained more energy than the intergranular cracks [54,63] was verified in this study.
When the loading stress was applied to the specimen at a higher strain rate, the energy was first absorbed by the quartz. The quartz released the energy by the creation of transgranular cracks. However, the generation of transgranular cracks consumed much more energy than the generation of the intergranular cracks. Finally, the failure of a rock with a larger number of transgranular cracks (in higher strain rate tests) resulted in the absorption of more energy than that with a larger number of intergranular cracks (in lower strain rate tests). As a result, the increase in the strain rate increased the strength and the Young’s modulus of the rock.

5. Conclusions

In the present study, conventional UCS tests, creep tests, and intermediate strain rate tests were performed in order to determine the effect of the strain rate on the strength parameters and the relationship between the micro-crack evolution and the macro-behavior. Some useful results were obtained in to explain the macro-behavior under different strain rates. The salient conclusions are as follows:
(1)
Inter-granular cracks appeared mainly around the quartz and most of the punctured grains were quartz grains in the sandstone, regardless of strain rates.
(2)
At a creep loading rate, most cracks were inter-granular in the lateral direction and occurred near the quartz grains. Although some of the inter-granular cracks also appeared in the axial direction, some trans-granular cracks occurred in the samples at locations of high stress concentration.
(3)
At a higher strain rate, most of the cracks were inter-granular in the lateral direction, but some transgranular cracks were also observed. The trans-granular cracks developed from the intergranular cracks at higher strain rates, however their numbers were very small. In the axial direction, the transgranular cracks were colliding with the intergranular cracks, which facilitated the rapid energy release in a short time.
(4)
As the strain rate increased, the peak strength and Young’s modulus increased as well. The peak strength values that were obtained after the creep tests were much lower than those of the intermediate strain rate tests. The stress–strain curve at a strain rate of 10−5 s−1 exhibited a crack compaction phase, whereas the stress–strain curve at a higher strain rate had no apparent crack compaction phase.
(5)
Furthermore, considering the evolution of the cracks and the increase in the peak strength and Young’s modulus with increasing strain rate, we have conclude that the generation of the transgranular cracks released more energy than that of the intergranular cracks. The failure of a rock with a large number of trans-granular cracks resulted in the absorption of more energy than that with more intergranular cracks. As a result, the increase in the strain rates increased the strength and the Young’s modulus of the rock.

Author Contributions

C.-F.C. and S.-H.L. designed the experiments, analyzed the data, and contributed equally to the writing of this article, and T.X. conceived the idea and improved the full paper.

Acknowledgments

The support provided by the Natural Science Foundation of China (Grant Nos. 41672301, and 51474051), the National Key Research and Development Program of China (Grant No. 2017YFC1503100), the NSFC-Royal Society-Newton Mobility Grant (5171101959), the Fundamental Research Funds for the Central Universities of China (N150102002), and the Partenariats Hubert Curien (PHC) Cai Yuanpei grant (grant number 36605ZB) is highly acknowledged.

Conflicts of Interest

The authors declare no conflict of interest.

References

  1. Li, X.H.; Wang, H.T.; Jia, J.Q.; Yang, C.H.; Guo-Zhong, H.U.; Xue, Z.X. Ultimate displacement discrimination of stability and reliability analysis of surrounding rocks of tunnel and underground engineering. Rock Soil Mech. 2005, 26, 850–854. [Google Scholar]
  2. Li, S.C.; Wang, Q.; Wang, H.T.; Jiang, B.; Wang, D.C.; Zhang, B.; Li, Y.; Ruan, G.Q. Model test study on surrounding rock deformation and failure mechanisms of deep roadways with thick top coal. Tunn. Undergr. Space Technol. 2015, 47, 52–63. [Google Scholar] [CrossRef]
  3. Yu, W.; Zhai, S.; Gao, Q. Stability evaluation indexes of deep stope pillar and roadway surrounding rock. Dis. Adv. 2012, 5, 120–126. [Google Scholar]
  4. Qian, D.; Zhang, N.; Shimada, H.; Wang, C.; Sasaoka, T.; Zhang, N. Stability of goaf-side entry driving in 800-m-deep island longwall coal face in underground coal mine. Arab. J. Geosci. 2016, 9, 1–28. [Google Scholar] [CrossRef]
  5. Watson, B.P.; Kuijpers, J.S.; Henry, G.; Palmer, C.E.; Ryder, J.A. Nonlinear rock behaviour and its implications for deeper level platinum mining. J. S. Afr. Inst. Min. Metall. 2009, 109, 5–13. [Google Scholar]
  6. Ghosh, R.; Schunnesson, H.; Gustafson, A. Monitoring of drill system behavior for water-powered in-the-hole (ith) drilling. Minerals 2017, 7, 121. [Google Scholar] [CrossRef]
  7. Chen, S.H.; Hu, S.W.; Zhang, Z.H.; Jian, W. Propagation characteristics of vibration waves induced in surrounding rock by tunneling blasting. J. Mt. Sci. 2017, 14, 2620–2630. [Google Scholar] [CrossRef]
  8. Malbasic, V.; Stojanovic, L. Determination of seismic safety zones during the surface mining operation development in the case of the “buvac” open pit. Minerals 2018, 8, 71. [Google Scholar] [CrossRef]
  9. Kontogianni, V.A.; Stiros, S.C. Induced deformation during tunnel excavation: Evidence from geodetic monitoring. Eng. Geol. 2005, 79, 115–126. [Google Scholar] [CrossRef]
  10. Yang, H.Y.; Cao, S.G.; Li, Y.; Fan, Y.C.; Wang, S.A.; Chen, X.Z. Assessment of excavation broken zone around gateways under various geological conditions: A case study in sichuan province, China. Minerals 2016, 6, 72. [Google Scholar] [CrossRef]
  11. Brady, B.H.; Brown, E.T. Rock Mechanics: For Underground Mining, 3rd ed.; Springer Science & Business Media: Berlin, Germany, 2005. [Google Scholar]
  12. Xue, G.H.; Cheng, J.J.; Guan, J.; Zhang, G.F.; Wu, M. Surrounding rock pressure of deep roadway and influences on advance support. In Proceedings of the 3rd International Conference on Computer Science and Mechanical Automation, Wuhan, China, 10–12 November 2017; pp. 368–374. [Google Scholar]
  13. Gao, M.S.; Dou, L.M.; Xie, Y.S.; Gao, J.; Zhang, L.S. Latest progress on study of stability control of roadway surrounding rocks subjected to rock burst. Procedia Earth Planet. Sci. 2009, 1, 409–413. [Google Scholar] [CrossRef]
  14. Heap, M.; Baud, P.; Meredith, P.; Bell, A.; Main, I. Time-dependent brittle deformation in darley dale sandstone. J. Geophys. Res. Solid Earth 2009, 114. [Google Scholar] [CrossRef]
  15. Fujii, Y.; Kiyama, T.; Ishijima, Y.; Kodama, J. Circumferential strain behavior during creep tests of brittle rocks. Int. J. Rock Mech. Min. Sci. 1999, 36, 323–337. [Google Scholar] [CrossRef]
  16. Brantut, N.; Heap, M.J.; Baud, P.; Meredith, P.G. Rate- and strain-dependent brittle deformation of rocks. J. Geophys. Res. Solid Earth 2014, 119, 1818–1836. [Google Scholar] [CrossRef]
  17. Xu, T.; Zhou, G.; Heap, M.J.; Yang, S.; Konietzky, H.; Baud, P. The modeling of time-dependent deformation and fracturing of brittle rocks under varying confining and pore pressures. Rock Mech. Rock Eng. 2018, 1–23. [Google Scholar] [CrossRef]
  18. Zhang, Q.; Zhao, J. Quasi-static and dynamic fracture behaviour of rock materials: Phenomena and mechanisms. Int. J. Fract. 2014, 189, 1–32. [Google Scholar] [CrossRef]
  19. Zhang, Q.; Zhao, J. Effect of loading rate on fracture toughness and failure micromechanisms in marble. Eng. Fract. Mech. 2013, 102, 288–309. [Google Scholar] [CrossRef]
  20. Ulusay, R.; Türeli, K.; Ider, M.H. Prediction of engineering properties of a selected litharenite sandstone from its petrographic characteristics using correlation and multivariate statistical techniques. Eng. Geol. 1994, 38, 135–157. [Google Scholar] [CrossRef]
  21. Koncagül, E.C.; Santi, P.M. Predicting the unconfined compressive strength of the breathitt shale using slake durability, shore hardness and rock structural properties. Int. J. Rock Mech. Min. Sci. 1999, 36, 139–153. [Google Scholar] [CrossRef]
  22. Heap, M.J.; Wadsworth, F.B.; Xu, T.; Chen, C.-F. The strength of heterogeneous volcanic rocks: A 2d approximation. J. Volcanol. Geotherm. Res. 2016, 319, 1–11. [Google Scholar] [CrossRef]
  23. Přikryl, R. Some microstructural aspects of strength variation in rocks. Int. J. Rock Mech. Min. Sci. 2001, 38, 671–682. [Google Scholar] [CrossRef]
  24. Fahy, M.P.; Guccione, M.J. Estimating strength of sandstone using petrographic thin-section data. Environ. Eng. Geosci. 1979, 16, 467–485. [Google Scholar] [CrossRef]
  25. Zorlu, K.; Gokceoglu, C.; Ocakoglu, F.; Nefeslioglu, H.A.; Acikalin, S. Prediction of uniaxial compressive strength of sandstones using petrography-based models. Eng. Geol. 2008, 96, 141–158. [Google Scholar] [CrossRef]
  26. Sprunt, E.C.S. Scanning electron microscope study of cracks and pores in crystalline rocks. Progr. Electr. Libr. Inf. Syst. 1973, 45, 415–438. [Google Scholar]
  27. Lindqvist, P.A.; Lai, H.H.; Alm, O. Indentation fracture development in rock continuously observed with a scanning electron microscope. Int. J. Rock Mech. Min Sci. Geomech. Abstr. 1984, 21, 165–182. [Google Scholar] [CrossRef]
  28. Yamada, I.; Masuda, K.; Mizutani, H. Electromagnetic and acoustic emission associated with rock fracture. Phys. Earth Planet. Inter. 1989, 57, 157–168. [Google Scholar] [CrossRef]
  29. Mori, Y.; Obata, Y.; Sikula, J. Acoustic and electromagnetic emission from crack created in rock sample under deformation. J. Acoust. Emiss. 2009, 27, 157–166. [Google Scholar]
  30. Yang, S.Q.; Jing, H.W.; Wang, S.Y. Experimental investigation on the strength, deformability, failure behavior and acoustic emission locations of red sandstone under triaxial compression. Rock Mech. Rock Eng. 2012, 45, 583–606. [Google Scholar] [CrossRef]
  31. Mlakar, V.; Hassani, F.P.; Momayez, M. Crack development and acoustic emission in potash rock. Int. J. Rock Mech. Min. Sci. Geomech. Abstr. 1993, 30, 305–319. [Google Scholar] [CrossRef]
  32. Lockner, D. The role of acoustic emission in the study of rock fracture. Int. J. Rock Mech. Min. Sci. Geomech. Abstr. 1993, 30, 883–899. [Google Scholar] [CrossRef]
  33. Kim, J.S.; Lee, K.S.; Cho, W.J.; Choi, H.J.; Cho, G.C. A comparative evaluation of stress–strain and acoustic emission methods for quantitative damage assessments of brittle rock. Rock Mech. Rock Eng. 2015, 48, 495–508. [Google Scholar] [CrossRef]
  34. Zhuang, X.; Chun, J.; Zhu, H. A comparative study on unfilled and filled crack propagation for rock-like brittle material. Theor. Appl. Fract. Mech. 2014, 72, 110–120. [Google Scholar] [CrossRef]
  35. Haeri, H.; Shahriar, K.; Marji, M.F.; Moarefvand, P. Experimental and numerical study of crack propagation and coalescence in pre-cracked rock-like disks. Int. J. Rock Mech. Min. Sci. 2014, 67, 20–28. [Google Scholar] [CrossRef]
  36. Cao, P.; Liu, T.; Pu, C.; Lin, H. Crack propagation and coalescence of brittle rock-like specimens with pre-existing cracks in compression. Eng. Geol. 2015, 187, 113–121. [Google Scholar] [CrossRef]
  37. Cheng, Y.; Wong, L.N.Y.; Maruvanchery, V. Transgranular crack nucleation in carrara marble of brittle failure. Rock Mech. Rock Eng. 2016, 49, 3069–3082. [Google Scholar] [CrossRef]
  38. Dai, F.; Huang, S.; Xia, K.; Tan, Z. Some fundamental issues in dynamic compression and tension tests of rocks using split hopkinson pressure bar. Rock Mech. Rock Eng. 2010, 43, 657–666. [Google Scholar] [CrossRef]
  39. Zhou, Y.X.; Xia, K.; Li, X.B.; Li, H.B.; Ma, G.W.; Zhao, J.; Zhou, Z.L.; Dai, F. Suggested methods for determining the dynamic strength parameters and mode-i fracture toughness of rock materials. Int. J. Rock Mech. Min. Sci. 2012, 49, 105–112. [Google Scholar] [CrossRef]
  40. Wang, Q.Y.; Zhu, W.C.; Xu, T.; Niu, L.L.; Wei, J. Numerical simulation of rock creep behavior with a damage-based constitutive law. Int. J. Geomech. 2016, 17, 04016044. [Google Scholar] [CrossRef]
  41. Zhang, Q.B.; Zhao, J. A review of dynamic experimental techniques and mechanical behaviour of rock materials. Rock Mech. Rock Eng. 2014, 47, 1411–1478. [Google Scholar] [CrossRef]
  42. Zhu, W.C.; Niu, L.L.; Li, S.H.; Xu, Z.H. Dynamic brazilian test of rock under intermediate strain rate: Pendulum hammer-driven SHPB test and numerical simulation. Rock Mech. Rock Eng. 2015, 48, 1867–1881. [Google Scholar] [CrossRef]
  43. Afreixo, V.; Bastos, C.A.; Garcia, S.P.; Rodrigues, J.M.; Pinho, A.J.; Ferreira, P.J. Experimental and numerical study of the kaiser effect in cyclic brazilian tests with disk rotation. Int. J. Rock Mech. Min. Sci. 2002, 39, 287–302. [Google Scholar]
  44. Kaiser, J. An Investigation into the Occurrence of Noises in Tensile Tests, or a Study of Acoustic Phenomena in Tensile Tests; Technical University: Munich, Germany, 1950. [Google Scholar]
  45. Zhang, J.; Wong, T.F.; Davis, D.M. Micromechanics of pressure-induced grain crushing in porous rocks. J. Geophys. Res. Solid Earth 1990, 95, 341–352. [Google Scholar] [CrossRef]
  46. Li, S.H.; Zhu, W.C.; Niu, L.L.; Dai, F. Constant strain rate uniaxial compression of green sandstone during SHPB tests driven by pendulum hammer. Shock Vib. 2017, 2017, 1–12. [Google Scholar] [CrossRef]
  47. Li, S.H.; Zhu, W.C.; Niu, L.L.; Yu, M.; Chen, C.F. Dynamic characteristics of green sandstone subjected to repetitive impact loading: Phenomena and mechanisms. Rock Mech. Rock Eng. 2018, 1–16. [Google Scholar] [CrossRef]
  48. Gerlach, R.; Sathianathan, S.K.; Siviour, C.; Petrinic, N. A novel method for pulse shaping of split hopkinson tensile bar signals. Int. J. Impact Eng. 2011, 38, 976–980. [Google Scholar] [CrossRef]
  49. Li, D.; Wong, L.N.Y. The brazilian disc test for rock mechanics applications: Review and new insights. Rock Mech. Rock Eng. 2013, 46, 269–287. [Google Scholar] [CrossRef]
  50. Kranz, R.L. Microcracks in rocks: A review. Tectonophysics 1983, 100, 449–480. [Google Scholar] [CrossRef]
  51. Brantut, N.; Heap, M.; Meredith, P.; Baud, P. Time-dependent cracking and brittle creep in crustal rocks: A review. J. Struct. Geol. 2013, 52, 17–43. [Google Scholar] [CrossRef]
  52. Griffith, A. The theory of rupture. In Proceedings of the First International Congress for Applied Mechanics; J. Waltman, Jr.: Delft, The Netherlands, 1924; pp. 55–63. [Google Scholar]
  53. Irwin, G.R. Fracture dynamics. Fract. Met. 1948, 152, 147–166. [Google Scholar]
  54. Willard, R.J.; McWilliams, J.R. Effect of loading rate on transgranular-intergranular fracture in charcoal gray granite. Int. J. Rock Mech. Min. Sci. Geomech. Abstr. 1969, 6, 415–421. [Google Scholar] [CrossRef]
  55. Karner, S.L.; Chester, F.M.; Kronenberg, A.K.; Chester, J.S. Subcritical compaction and yielding of granular quartz sand. Tectonophysics 2003, 377, 357–381. [Google Scholar] [CrossRef]
  56. Shakoor, A.; Bonelli, R.E. Relationship between petrographic characteristics, engineering index properties, and mechanical properties of selected sandstones. Bull. Assoc. Eng. Geol. 1991, 28, 55–71. [Google Scholar] [CrossRef]
  57. Makowitz, A.; Lander, R.H.; Milliken, K.L. Diagenetic modeling to assess the relative timing of quartz cementation and brittle grain processes during compaction. AAPG Bull. 2006, 90, 873–885. [Google Scholar] [CrossRef]
  58. Handy, M.R. The solid-state flow of polymineralic rocks. J. Geophys. Res. Solid Earth 1990, 95, 8647–8661. [Google Scholar] [CrossRef]
  59. Lander, R.H.; Larese, R.E.; Bonnell, L.M. Toward more accurate quartz cement models: The importance of euhedral versus noneuhedral growth rates. AAPG Bull. 2008, 92, 1537–1563. [Google Scholar] [CrossRef]
  60. Niu, L.; Zhu, W.; Li, S.; Yu, M. Experimental study of dynamic characteristics of sandstone under intermediate strain rate by using pendulum hammer driven “SHPB” apparatus. Chin. J. Rock Mech. Eng. 2014, 33, 2443–2450. [Google Scholar] [CrossRef]
  61. Wang, Q.Z.; Yang, J.R.; Zhang, C.G.; Zhou, Y.; Li, L.; Wu, L.Z.; Huang, R.Q. Determination of dynamic crack initiation and propagation toughness of a rock using a hybrid experimental-numerical approach. J. Eng. Mech. 2016, 142, 04016097. [Google Scholar] [CrossRef]
  62. Ray, S.K.; Sarkar, M.; Singh, T.N. Effect of cyclic loading and strain rate on the mechanical behaviour of sandstone. Int. J. Rock Mech. Min. Sci. 1999, 36, 543–549. [Google Scholar] [CrossRef]
  63. Zhang, Q.B.; Zou, Y. Effect of loading rate on fracture behaviour of rock materials. In Industrial Communication Technology Handbook, 2nd ed.; Rock Engineering & Rock Mechanics Structures in & on Rock Masses; CRC Press: Boca Raton, FL, USA, 2014; pp. 119–124. [Google Scholar]
Figure 1. Sandstone specimens without distinct layering or lamination observed.
Minerals 08 00231 g001
Figure 2. Microscopic pictures of the thin sections of the sandstone: (a) photomicrograph under cross-polarized light and (b) photomicrograph under plane-polarized light. The major mineral compositions are marked in the picture. Feldspar, quartz and mica are marked as “Fs”, “Qrz” and “Mica” in the picture, respectively.
Minerals 08 00231 g002
Figure 3. Ultrasonic measuring instrument setup.
Minerals 08 00231 g003
Figure 4. Samples equipped with eight acoustic emission (AE) transducers and eight strain extensometers. The symbols of A, L, and T denote the AE transducers, axial strain extensometers, and lateral strain extensometers, respectively. The dashed lines denote the locations of the different sensors, except the dash-dot line that denotes the center line. (a) Four axial strain extensometers in contact with the inclined surface of the inverted steel cone and two steel endcaps at the top and bottom of the sample; (b) overview location of the AE transducers and lateral strain extensometers on the specimen; and (c) the location of the AE transducers and lateral strain extensometers on the unfolded outside surface of the specimen.
Minerals 08 00231 g004
Figure 5. Schematic of the multi-step creep tests. The stress level of every stage was maintained for 12 h. After three high-stress and low-stress loading stages, the applied stress was reduced to zero.
Minerals 08 00231 g005
Figure 6. Diagram of the Split Hopkinson pressure bar (SHPB) apparatus [46].
Minerals 08 00231 g006
Figure 7. Measured incident stress waves under different impacting velocities, recorded by the strain gauge; line ε 2 ˙ has an impact velocity of 4.2 m/s and line ε 1 ˙ has an impact velocity of 2.5 m/s.
Minerals 08 00231 g007
Figure 8. Location of thin sections obtained from the different loading directions of the specimen.
Minerals 08 00231 g008
Figure 9. Thin sections obtained along different directions after the conventional uniaxial compressive strength (UCS) tests. (a) Thin section in the lateral direction and (b) thin section in the axial direction. The numbers 1–4 near the lines stand for the number of cracks seen in the microscopy.
Minerals 08 00231 g009
Figure 10. Axial strain and AE events versus time; the number of AE events is shown “AE counts”.
Minerals 08 00231 g010
Figure 11. Crack distribution in the lateral direction during the creep tests. Some grains separated from the matrix as a result of the cracks. The intergranular cracks are conspicuous. The loading stress separates the grain from the matrix. The grains from A to G have pronounced edges compared to the matrix.
Minerals 08 00231 g011
Figure 12. Cracks distribution in the axial direction during the creep tests. The grains A and B are crushed by the transgranular cracks as a result of the point of stress concentration at the boundary of the grains. (a,b) stand for different locations of cracks distribution in the microscopy.
Minerals 08 00231 g012
Figure 13. Axial stress and AE events occurring over time. The two curves prior to point C in (A) are magnified in (B); the stress value at point C is about 23 MPa.
Minerals 08 00231 g013
Figure 14. Samples after the impact tests. Even though the sample number for the intermediate strain rate tests is very small, the thin sections for the different directions were obtained from different samples. The thin sections were obtained along the green line.
Minerals 08 00231 g014
Figure 15. Transgranular cracks along the intergranular cracks in the sample. (a) Grain A is crushed at point B along the inter-granular crack 1, the white line marked as 1 in the white square, at the top of grain C, and (b) grain D is punctured into two parts by the intergranular crack 2, the white line marked as 2 in the white square.
Minerals 08 00231 g015
Figure 16. Transgranular cracks generated by closed intergranular cracks. Transgranular cracks (in grains A, B, and C) are generated by the extension of intergranular cracks (lines 1, 2, and 4). The numbers of white lines are marked as the numbers 1–4 in the white square.
Minerals 08 00231 g016
Figure 17. Comparison of the stress–strain curves at different strain rates. The curve at the strain rate of ε 1 ˙ was obtained from the conventional UCS tests and the curves at the strain rates of ε 2 ˙ and ε 3 ˙ were obtained from the dynamic impact tests at the impact velocities of 2.5 and 4.5 m/s; the curve at the strain rate of ε 4 ˙ was obtained after conducting the cyclic creep tests. Lines 2–4 are duplicated from line 1.
Minerals 08 00231 g017

