Article

PGE–(REE–Ti)-Rich Micrometer-Sized Inclusions, Mineral Associations, Compositional Variations, and a Potential Lode Source of Platinum-Group Minerals in the Sisim Placer Zone, Eastern Sayans, Russia

by
Andrei Y. Barkov
1,*,
Gennadiy I. Shvedov
2 and
Robert F. Martin
3
1
Research Laboratory of Industrial and Ore Mineralogy, Cherepovets State University, 5 Lunacharsky Avenue, 162600 Cherepovets, Russia
2
Institute of Mining, Geology and Geotechnology, Siberian Federal University, 95 Avenue Prospekt im. gazety “Krasnoyarskiy Rabochiy”, 660025 Krasnoyarsk, Russia
3
Department of Earth and Planetary Sciences, McGill University, 3450 University Street, Montreal, QC H3A 0E8, Canada
*
Author to whom correspondence should be addressed.
Minerals 2018, 8(5), 181; https://doi.org/10.3390/min8050181
Submission received: 31 March 2018 / Revised: 18 April 2018 / Accepted: 19 April 2018 / Published: 27 April 2018

Abstract

:
We report the results of a mineralogical investigation of placer samples from the upper reaches of the Sisim watershed, near Krasnoyarsk, in Eastern Sayans, Russia. The placer grains are predominantly Os–Ir–(Ru) alloys (80%) that host various inclusions (i.e., platinum-group elements (PGE)-rich monosulfide, PGE-rich pentlandite, Ni–Fe–(As)-rich laurite, etc.) and subordinate amounts of Pt–Fe alloys. Analytical data (wavelength- and energy-dispersive X-ray spectroscopy) are presented for all the alloy minerals and the suite of micrometer-sized inclusions that they contain, as well as associated grains of chromian spinel. The assemblage was likely derived from chromitite units of the Lysanskiy mafic–ultramafic complex, noted for its Ti–(V) mineralization. In the Os–Ir–(Ru) alloys, the ratio Ru/Ir is ≤1, Ir largely substitutes for Os, and compositional variations indicate the scheme [Ir + Ru] → 2Os. In contrast, in the laurite–erlichmanite series, Ir and Os are strongly and positively correlated, whereas Ir and Ru are negatively correlated; Ru and Os are inversely correlated. These compositions point to the scheme [Os2+ + 2Ir3+ + □] → 4Ru2+ or alternatively, to Os2+ + Ir2+ → 2Ru2+. We deduce a potential sequence of crystallization in the parental rock and address the effects of decreasing temperature and increasing fugacity of sulfur and arsenic on the assemblage. Inclusions of Ti-rich minerals in the alloy grains are consistent with the Lysanskiy setting; the complete spectrum of chromite–magnesiochromite compositions indicates that an important part of that complex was eroded. A localized fluid-dominated micro-environment produced the unique association of laurite with monazite-(Ce), again considered a reflection of the special attributes of the Lysanskiy complex.

1. Introduction

The Sisim placer zone contains various deposits of minerals and unusual phases rich in the platinum-group elements (PGE). The deposits are found in an 80 × 30 km2 area in the southern portion of the huge Krasnoyarskiy kray territory in central Siberia, not far from Krasnoyarsk in the southwestern part of the Eastern Sayans, Russia (Figure 1).
The Au–PGE-bearing placers are developed alluvially along the River Sisim and its tributaries, among which are the rivers Ko, Levyi Ko, Seyba, Malaya Alga, Kotel’, and Koza. The placers were first mined for gold at the beginning of the 19th century, possibly even earlier. Vysotskiy [1] described the first occurrences of platinum-group minerals (PGM) from the Sisim placer zone, namely grains composed dominantly of “osmian iridium” along the Shirokiy brook in the middle reaches of the River Sisim. In 1985, D.I. Baykalov recognized abundant grains of PGM in a suite of placers that extend up to ~19 km along the River Ko, one of longest tributaries. Krivenko et al. [2] and Tolstykh & Krivenko [3] described the associations of PGM in those placers.
Here, we report new wavelength- and energy-dispersive X-ray spectroscopy results obtained on samples from placers of the Sisim watershed, originating from the upper reach of the River Sisim, including Ivanovka Creek. The PGM grains recovered are relatively small (generally <0.25–0.5 mm and, occasionally, up to 1.8 mm in the longest dimension). There is a predominance of Os–Ir–(Ru) alloy minerals, but these differ in composition from those known in other areas of the Eastern Sayans. The PGM grains at Sisim host inclusions of various types, which provide insight into the ore-forming environment and provenance. Some of these inclusions are rich in Ti or in the rare-earth elements (REE); the latter are especially unusual and are documented here for the first time as the observed intergrowth of PGE and REE-based minerals.
Our aims are the following: (1) to characterize the PGE mineralogy of the placer deposits of the entire River Sisim system, incorporating results obtained on associated placers along the River Ko [2,3]; (2) to examine mineral associations, compositional ranges, extents of solid solutions, and mechanisms of element substitutions in the PGM; (3) to discuss types and implications of various micrometer-sized inclusions hosted by placer grains of PGE alloy minerals; and (4) to suggest a potential lode source for the placer occurrences of PGM in the Sisim zone, on the basis of all of these findings and results obtained on a large set of associated grains of PGM and chromian spinel.

2. Materials and Methods

The compositions of placer grains of chromian spinel, PGE alloys, and various inclusions of amphiboles, PGM, and PGE-rich phases (Figure 2a–h and Figure 3a–f), were investigated by wavelength-dispersive spectroscopy (WDS) using a Camebax-micro electron microprobe at the Sobolev Institute of Geology and Mineralogy, Russian Academy of Sciences, Novosibirsk, Russia.
The analytical conditions used for PGE-rich minerals were the following: 20 kV and 60 nA; the Lα line was used for Ir, Rh, Ru, Pt, Pd, and As; the Mα line was used for Os; and the Kα line was used for S, Fe, Ni, Cu, and Co. We used as standards pure metals (for the PGE), CuFeS2 (for Fe, Cu, and S), synthetic FeNiCo (for Ni and Co), and arsenopyrite (for As). The minimum detection limit was ≤0.06 wt % in the results of the WDS analyses.
We analyzed (WDS) more than 50 detrital grains of chromian spinel, mostly subhedral and about 0.2–1 mm across, associated with grains of PGM in placer samples from the Sisim zone. The WDS analyses of chromite, amphiboles, and serpentine were acquired at 20 kV and 40 nA, using the Kα line, and the following standards: chromite (for Fe, Mg, Al, and Cr), ilmenite (Ti), manganiferous garnet (for Mn), and synthetic V2O5 (for V). The amphibole analyses were done using the following standards: diopside (for Ca), albite (for Na), orthoclase (for K), pyrope (Mg, Fe, Al, and Si), a glass of diopside composition doped with 2 wt % TiO2 for Ti, and manganiferous or chromiferous garnets (for Mn and Cr). For serpentine, we used an olivine standard (Mg, Si, Fe, and Ni), as well as diopside (Ca), and, as noted, garnets for Mn and Cr.
In addition, we employed scanning-electron microscopy (SEM) and energy-dispersive spectroscopy (EDS) in order to minimize interference from the host (or adjacent grains) during the analysis of phases 1–2 μm in size present in composite micro-inclusions (Figure 2a–f and Figure 3a–d). These phases were analyzed at 20 kV and 1.2 nA using a Tescan Vega 3 SBH facility combined with an Oxford X-Act spectrometer at the Siberian Federal University, Krasnoyarsk, Russia. Pure elements (for the PGE, Fe, Cu, Nd, Pr, and Sm), as well as FeS2 (for S), InAs (for As), CeO2 (for Ce), LaB6 (for La), GaP (for P), and CaF2 (for Ca) were used as standards. The Lα line was used for As, the REE, and the PGE, except for Pt (Mα line); the Kα line was used for Fe, Cu, Ni, S, P, and Ca. The results of WDS and EDS analyses (Table 1, Table 2, Table 3, Table 4, Table 5, Table 6, Table 7 and Table 8) are in good agreement.

3. Results

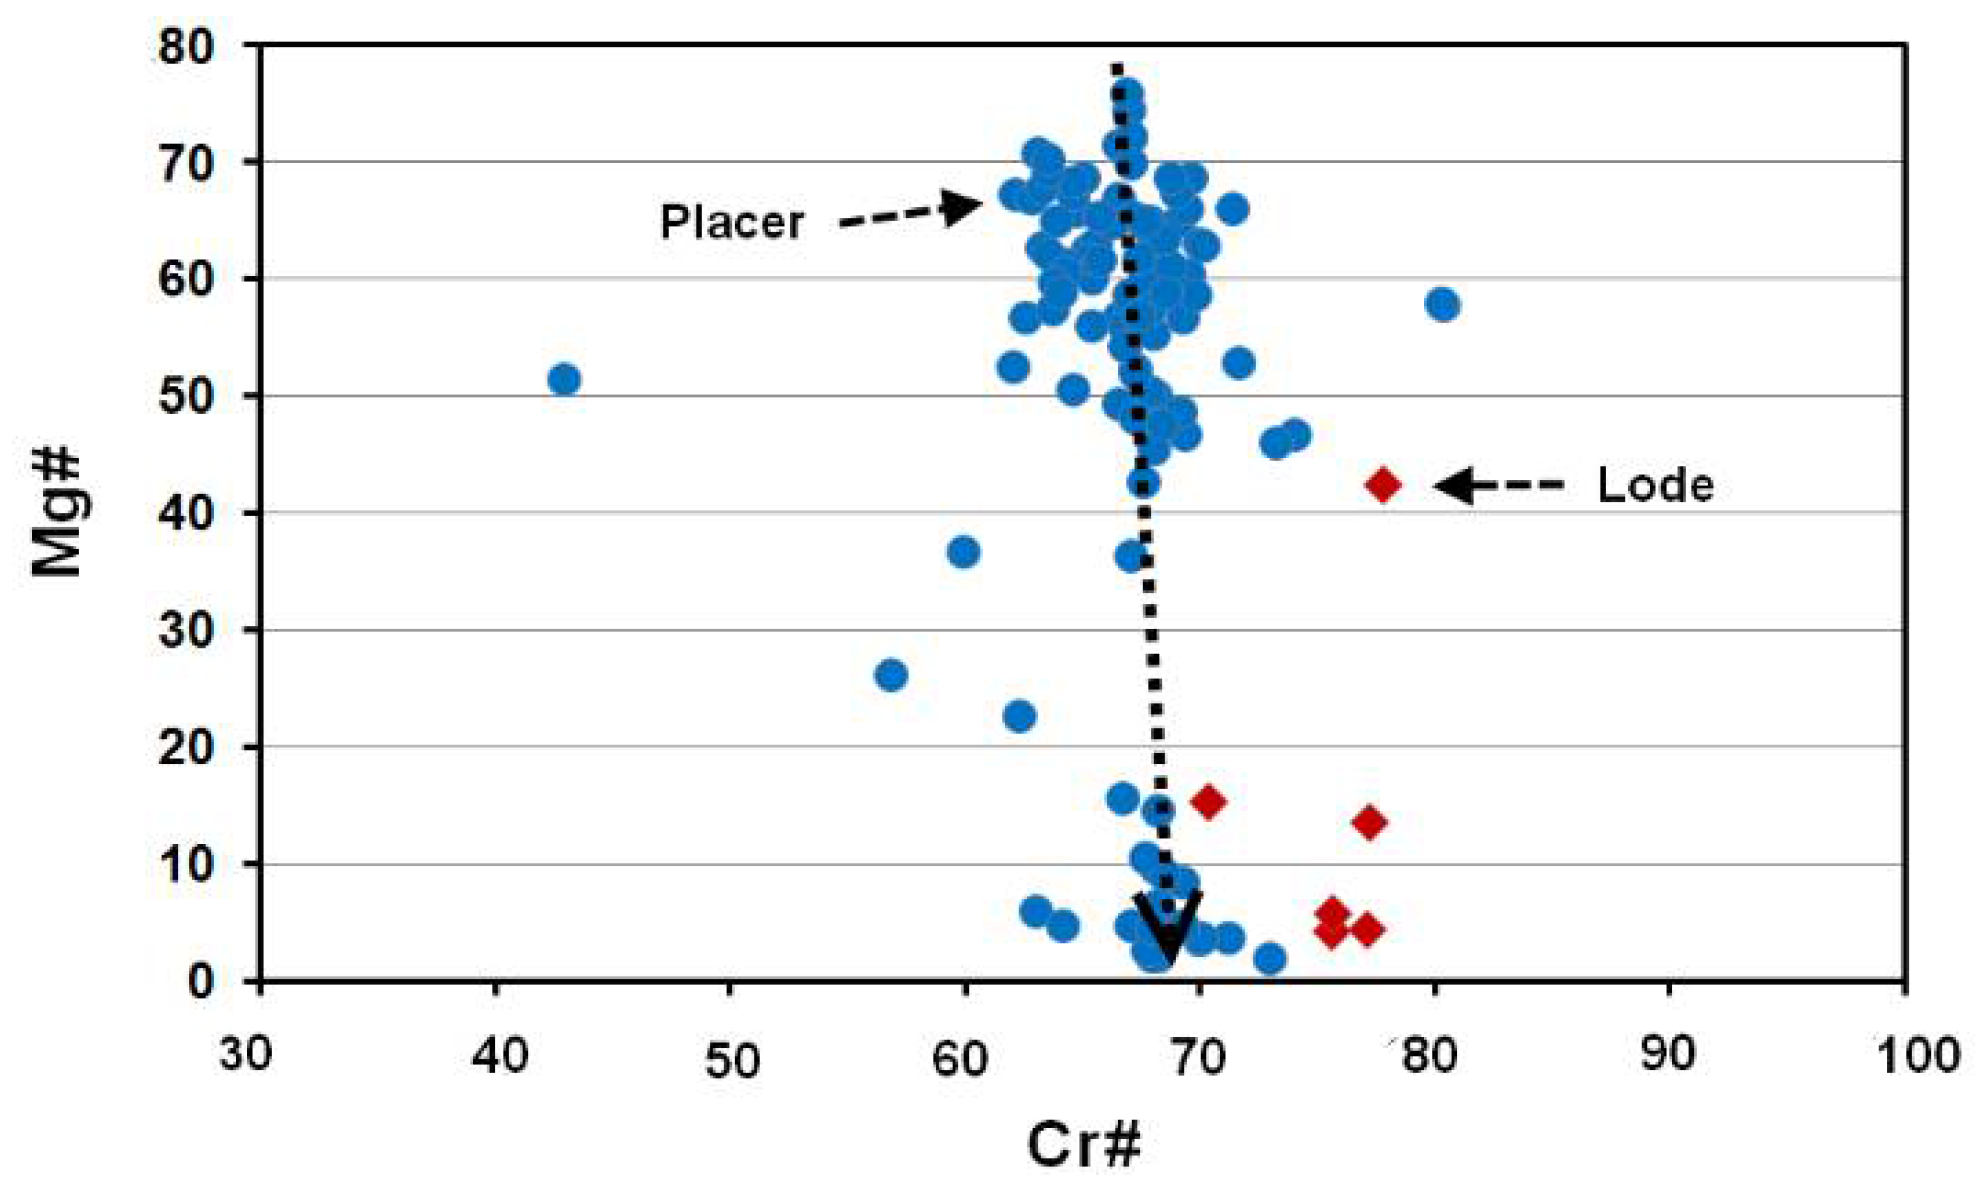
3.1. Placer and Lode Occurrences of Chromian Spinel

In placer samples of chromian spinel from the Sisim zone, we find a broad range of compositions along the magnesiochromite–chromite solid solution, with Mg# [100 Mg/(Mg + Fe2+ + Mn)] in the range 76–3 and a MgO content up to 16.6 wt % (Table 1). In contrast to the variations in Mg#, this series displays a fairly uniform Cr# [100 Cr/(Cr + Al)] (Figure 4, Table 1). In addition to placer grains, we included several grains of chromite from serpentinite exposed along the River Levyi Ko. We believe that these bodies of serpentinite belong to the Lysanskiy ultramafic–mafic layered complex, which hosts significant Ti–(V) ores. The chromite grains analyzed in the lode serpentinite are fairly similar in composition to the detrital grains recovered from the Sisim placer zone (Figure 4).

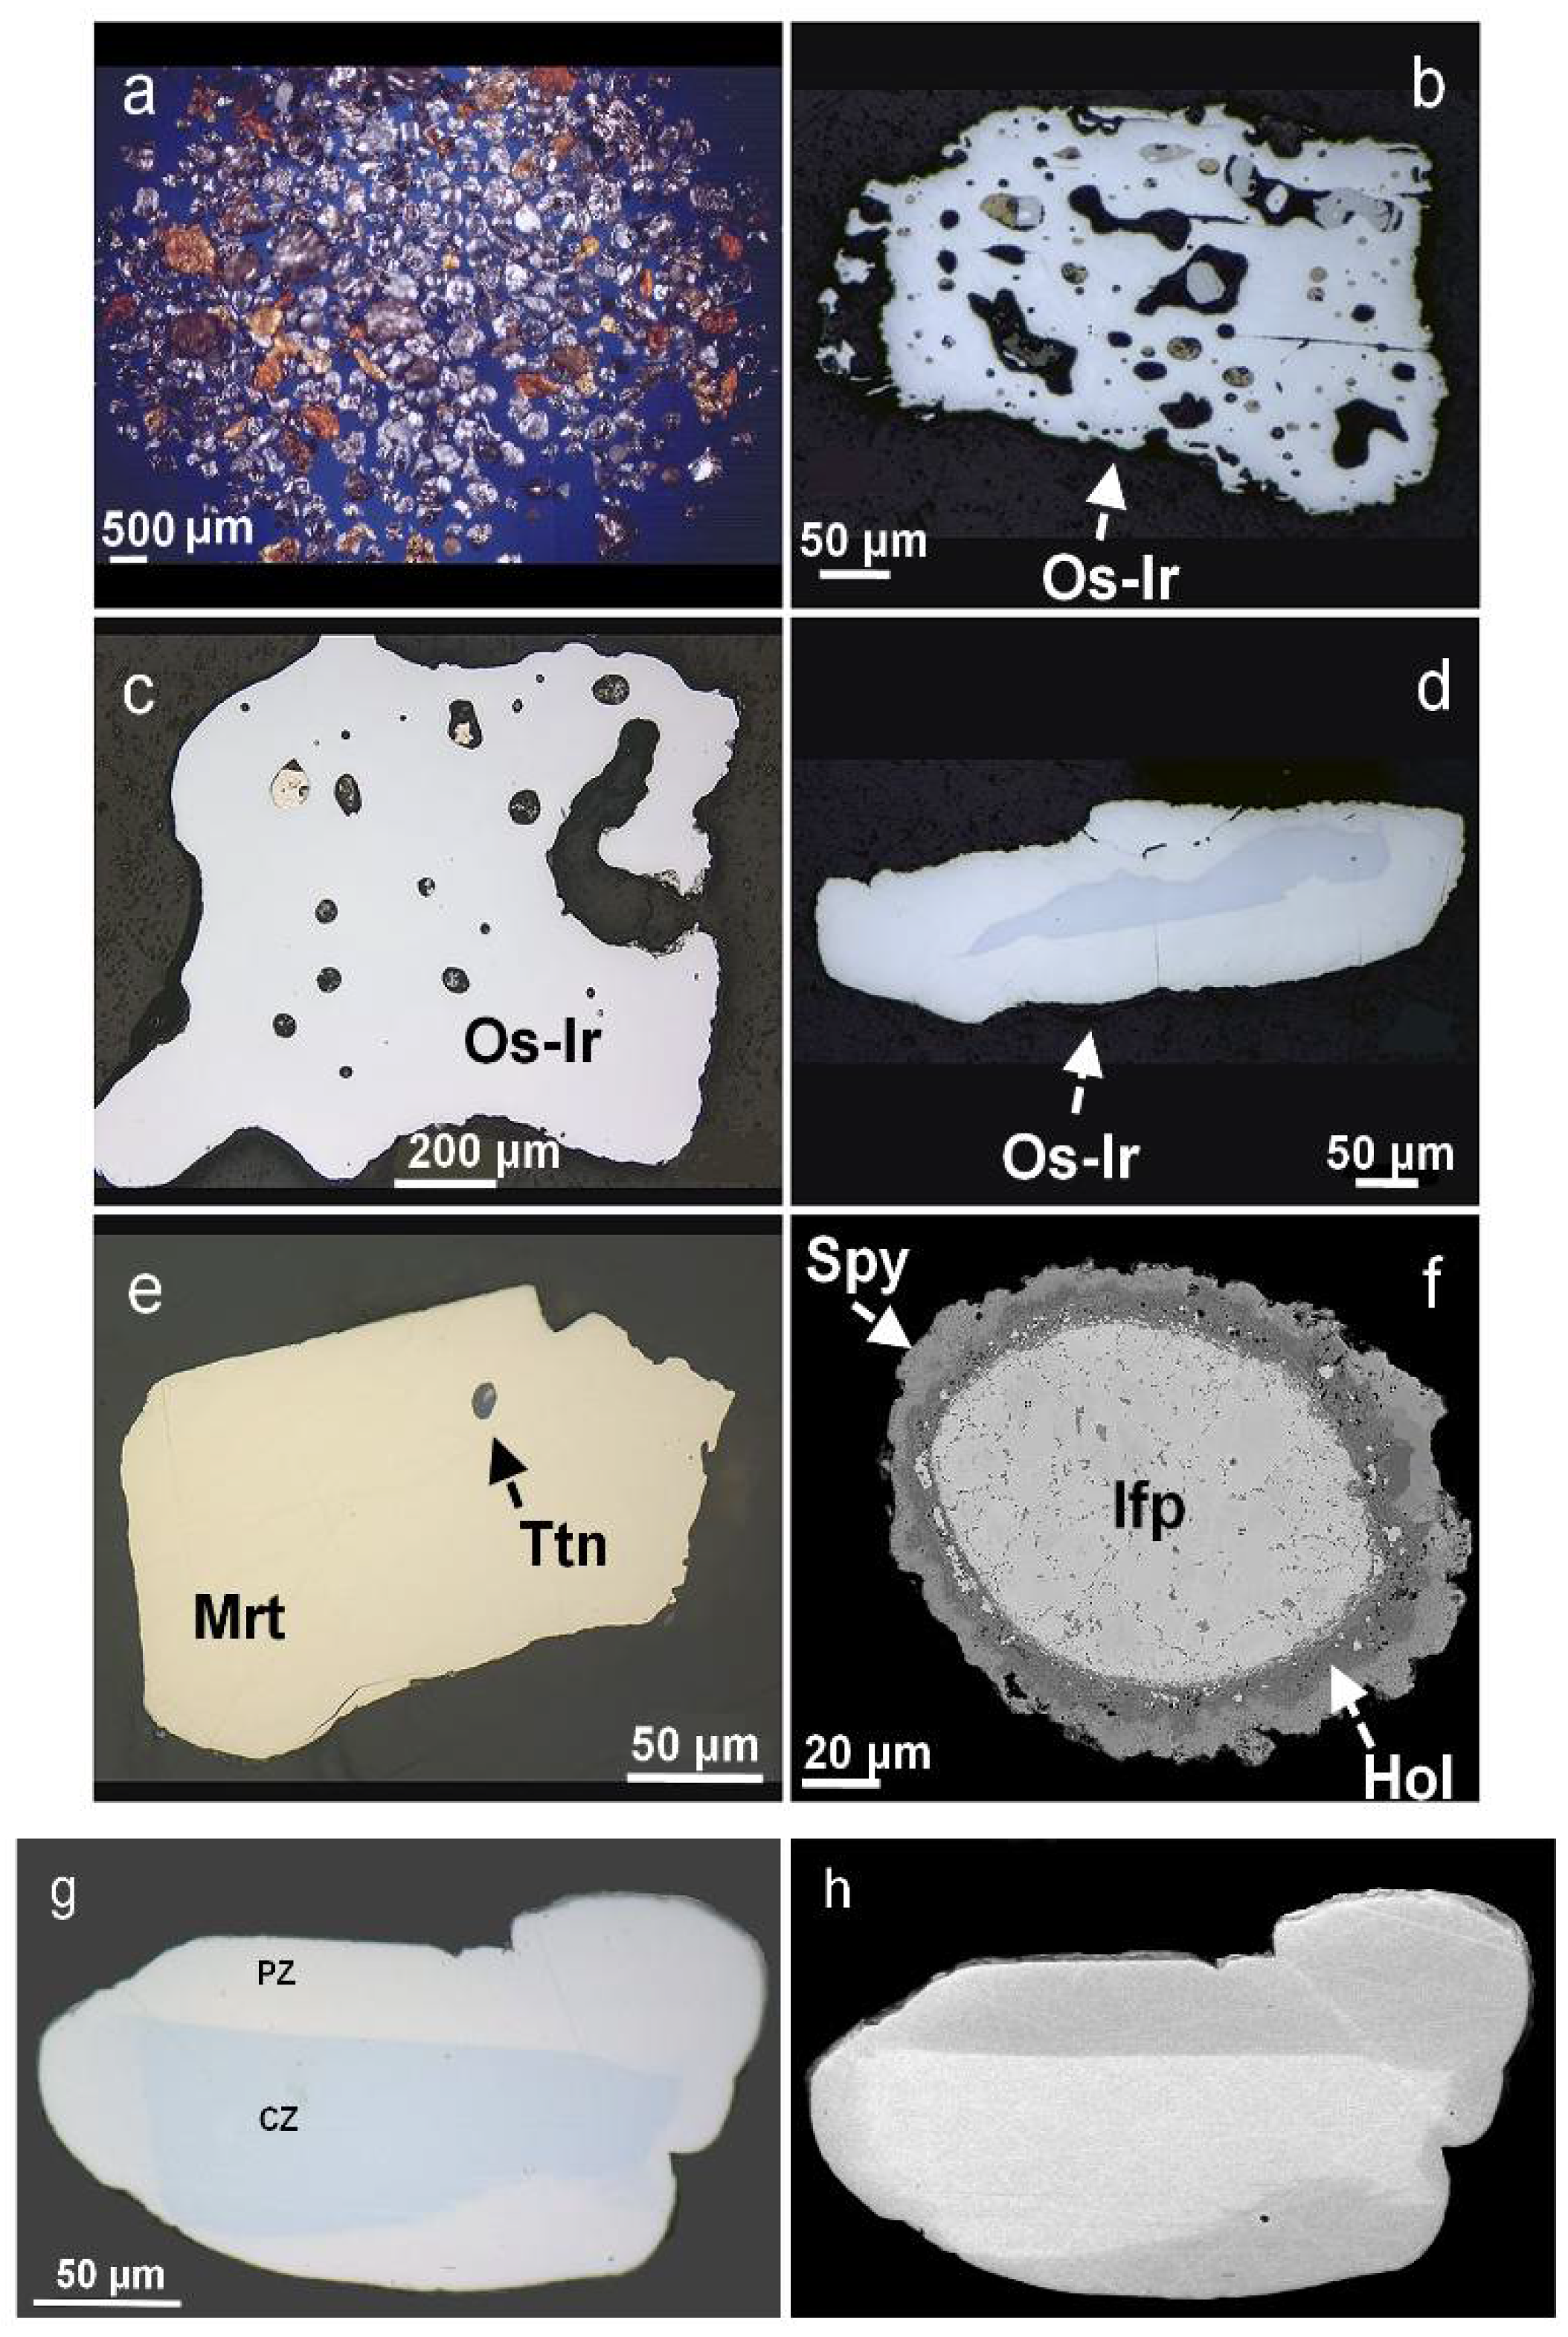
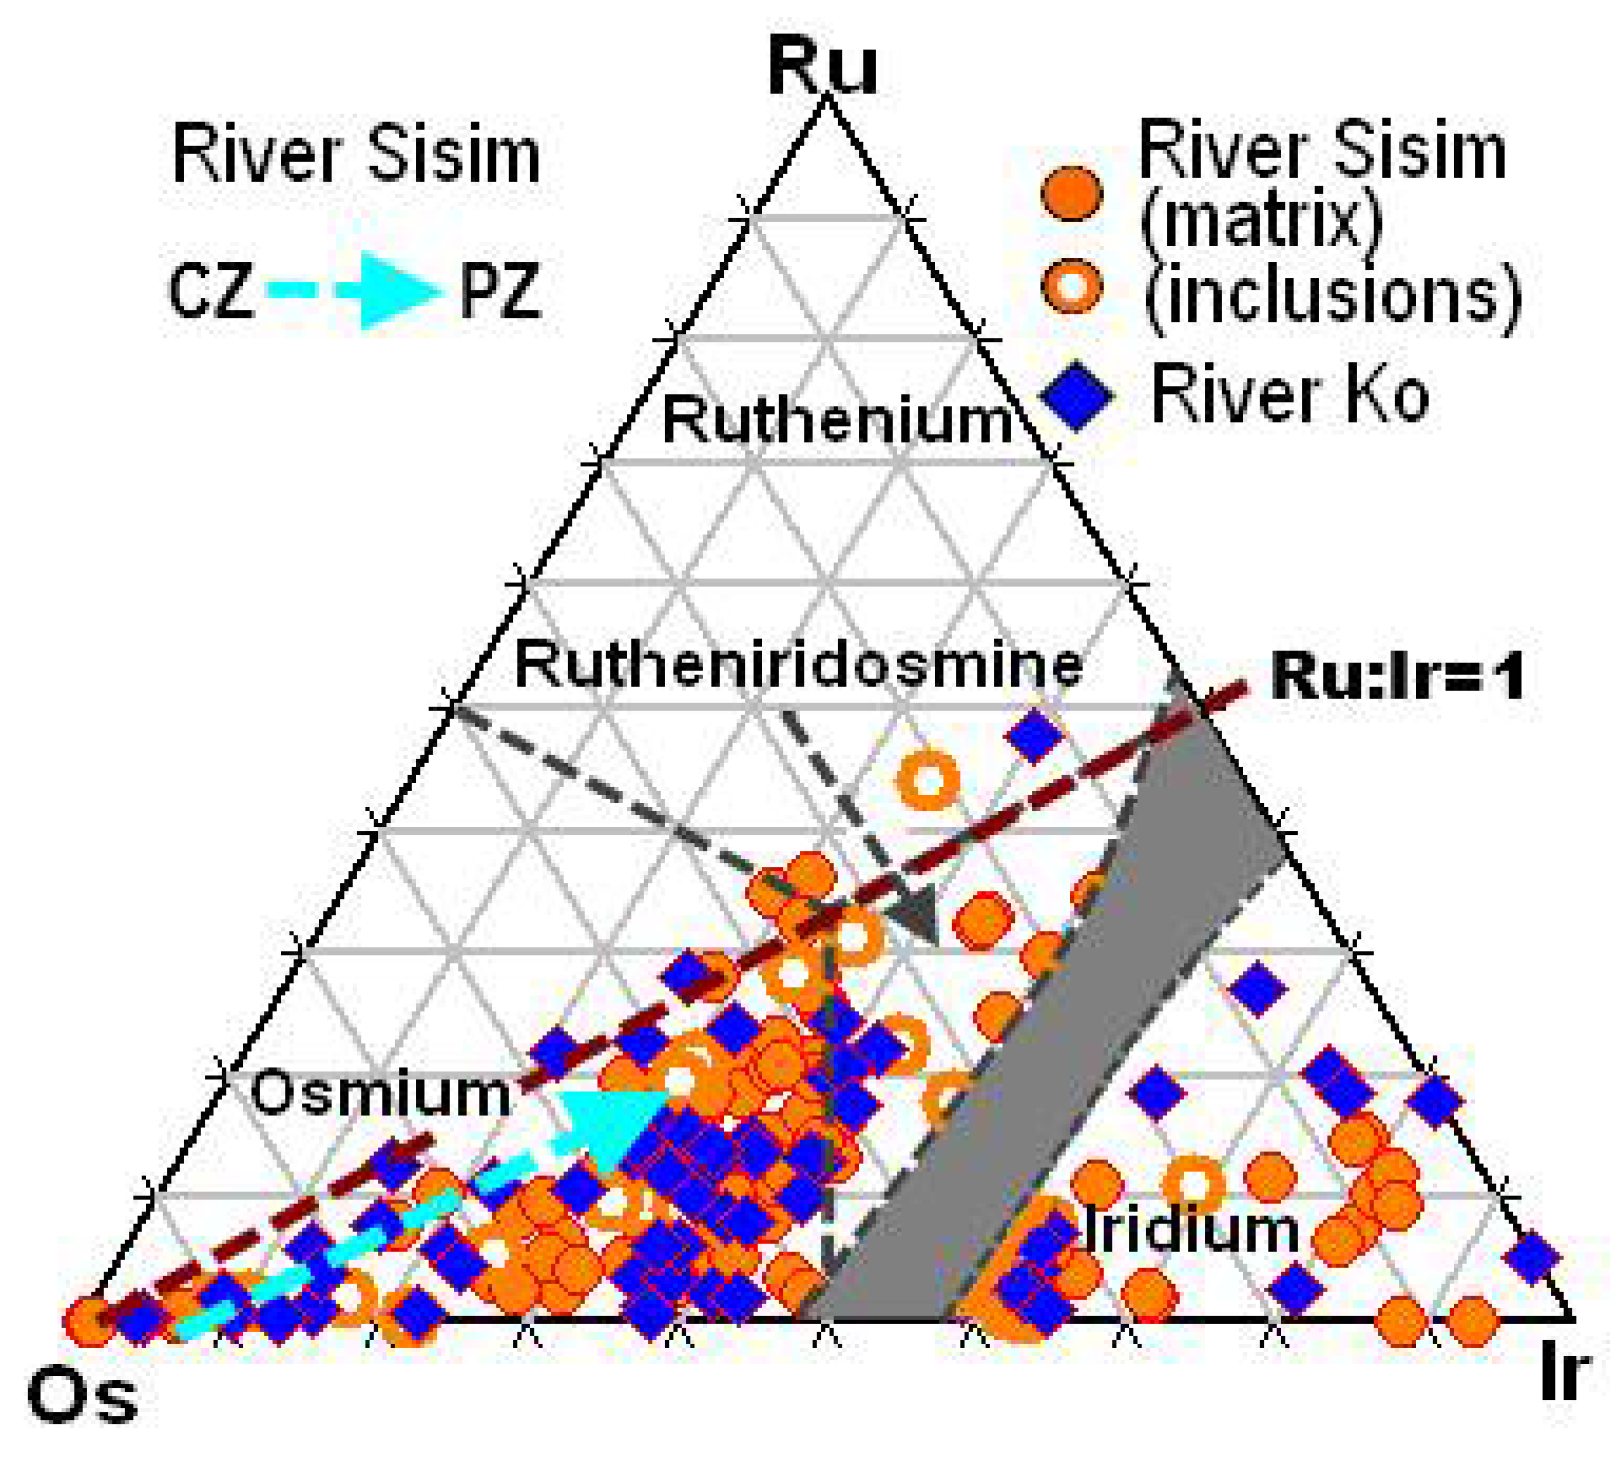
3.2. Placer Grains of Os–Ir–(Ru) and Pt–Fe Alloys

Os- and Ir-rich alloys (Table 2) predominate in the placer concentrates at Sisim, with grain sizes generally ≤0.5 mm and a maximum of 1–1.5 mm. Zonation in the grains of Os–Ir–(Ru) alloy is recognized optically and in back-scattered electron (BSE) images (Figure 2d,g). Both discrete and cryptic zonation is characterized by a relative increase in Ir and Ru toward the margin.
The observed compositions of the matrix and inclusions of the Os–Ir–(Ru) alloys define coherent pairs (Table 2); these phases coexist in fields in the Os–Ru–Ir diagram (Figure 5), indicating that they achieved a mutual equilibrium during crystallization. In contrast to alloys of ophiolite origin (e.g., [4,5]), the Os–Ir–(Ru) alloys at Sisim contain rather subordinate amounts of Ru. Few compositions correspond to the mineral ruthenium. The bulk of the alloy species are classified as either osmium and iridium; rutheniridosmine is less abundant (Figure 5). The overall field of compositions observed at Sisim does not differ essentially from the field recognized [2] at the River Ko. The similarity implies a common provenance for these placer occurrences.
In the Os–Ir–Ru compositional field (Figure 5), the solid solutions display a general decrease in Ru with increasing Os content. Interestingly, the inferred boundary of the compositional field is nearly linear and extends along the line Ru/Ir = 1. Note that the trendline observed for the sharply zoned crystal of Os–Ir–(Ru) alloy (Figure 2g,h) is close and subparallel to the line Ru/Ir = 1 (Figure 5). The core zone (CZ) in this grain is [Os92.6Ir6.5Ru0.7Fe0.10Ni0.10]; its periphery zone (PZ, Figure 2g) corresponds to [Os48.0Ir29.1Ru18.9Pt2.5Rh1.0Fe0.47Ni0.15]. The evolutionary trend thus reveals a strong increase in the content of Ir and Ru, with a minor buildup in Pt, Rh, and Fe, and a correspondingly strong decrease in Os. The compositions based on a total of 202 data-points (Figure 5) yield a fairly strong negative correlation of Os vs Ir, with a correlation coefficient R of −0.86.
Placer grains of Pt–Fe alloy at Sisim are ≤0.5 mm in size, and they typically contain elevated levels of Cu (up to 1.9 wt %, Table 3). These grains exhibit variable ΣPGE/(Fe + Cu + Ni) ratios, typically close to 3, thus corresponding to isoferroplatinum (or ferroan platinum).
Some of the Pt–Fe alloy grains are rimmed by Pt-rich phases of arsenide or sulfarsenide compositions, or both, as in the case of the grain shown in Figure 2f. It has the composition of isoferroplatinum [(Pt2.57Rh0.28Ir0.17Os0.09Ru0.05)Σ3.16(Fe0.66Cu0.17Ni<0.01)Σ0.84] and is rimmed by successive rims, the inner one composed of a S-deficient phase of hollingworthite-type [(Rh0.94Pt0.18Fe0.03Ir0.01)Σ1.84As1.15S0.69] and the outer one consisting of metal-deficient sperrylite [(Pt0.71Rh0.17Fe0.04Ni<0.01)Σ0.92(As1.82S0.26)Σ2.08]. The observed deviations from stoichiometry are likely related to conditions of their deposition at low temperatures from late fluids, possibly involving the effects of metastable crystallization. Interestingly, a similar phase of nonstoichiometric sperrylite [(Pt0.93Rh0.13Fe0.07)Σ1.15(As1.65S0.20)Σ1.85], also rich in Rh and S, was described in a similar textural association from British Columbia, Canada [7].
In addition, the Pt–Fe alloy grains at Sisim are substantially enriched in Rh (up to 5.6 wt %) and Ir (up to 6.8 wt %, Table 3); elevated contents of the components chengdeite (Ir3Fe) and “Rh3Fe” are implied in these variants of isoferroplatinum or ferroan platinum.

3.3. Inclusions of Hydrous Silicates and High-Ti Micrometer-Sized Mixtures

Serpentine and various amphiboles occur as inclusions in placer grains of PGM at Sisim. The serpentine inclusions appear to contain other minerals as micro-impurities, which result in deviations from stoichiometry. However, the analyzed level of MgO is unusually high (45.6 wt %, WDS), thus indicating a high-Fo composition of the olivine precursor coexisting with the Os–Ir alloy. Calcic and sodic–calcic amphiboles, identified as magnesio-hornblende, barroisite, and edenite, were recognized in inclusions enclosed within the PGM grains (Table 4). They are moderately high in magnesium (Mg# up to 83.6); some compositions display elevated contents of Na (up to 3.6% Na2O), K (1.1% K2O), and Ti (up to 1.7% TiO2).
Interestingly, heterogeneous micro-inclusions, apparently composed of mixtures of different phases, also were analyzed; these are hosted by grains of PGM and invariably contain high levels of Ti (54.5–68.2% TiO2), elevated Al (9.0–10.3% Al2O3), Fe (2.9–8.4% FeOtotal), Si (5.8–11.2% SiO2), and substantial Cr (0.4–1.0% Cr2O3). The main material is likely a Ti-rich oxide or a mixture of oxides, which fill these inclusions along with a subordinate silicate.

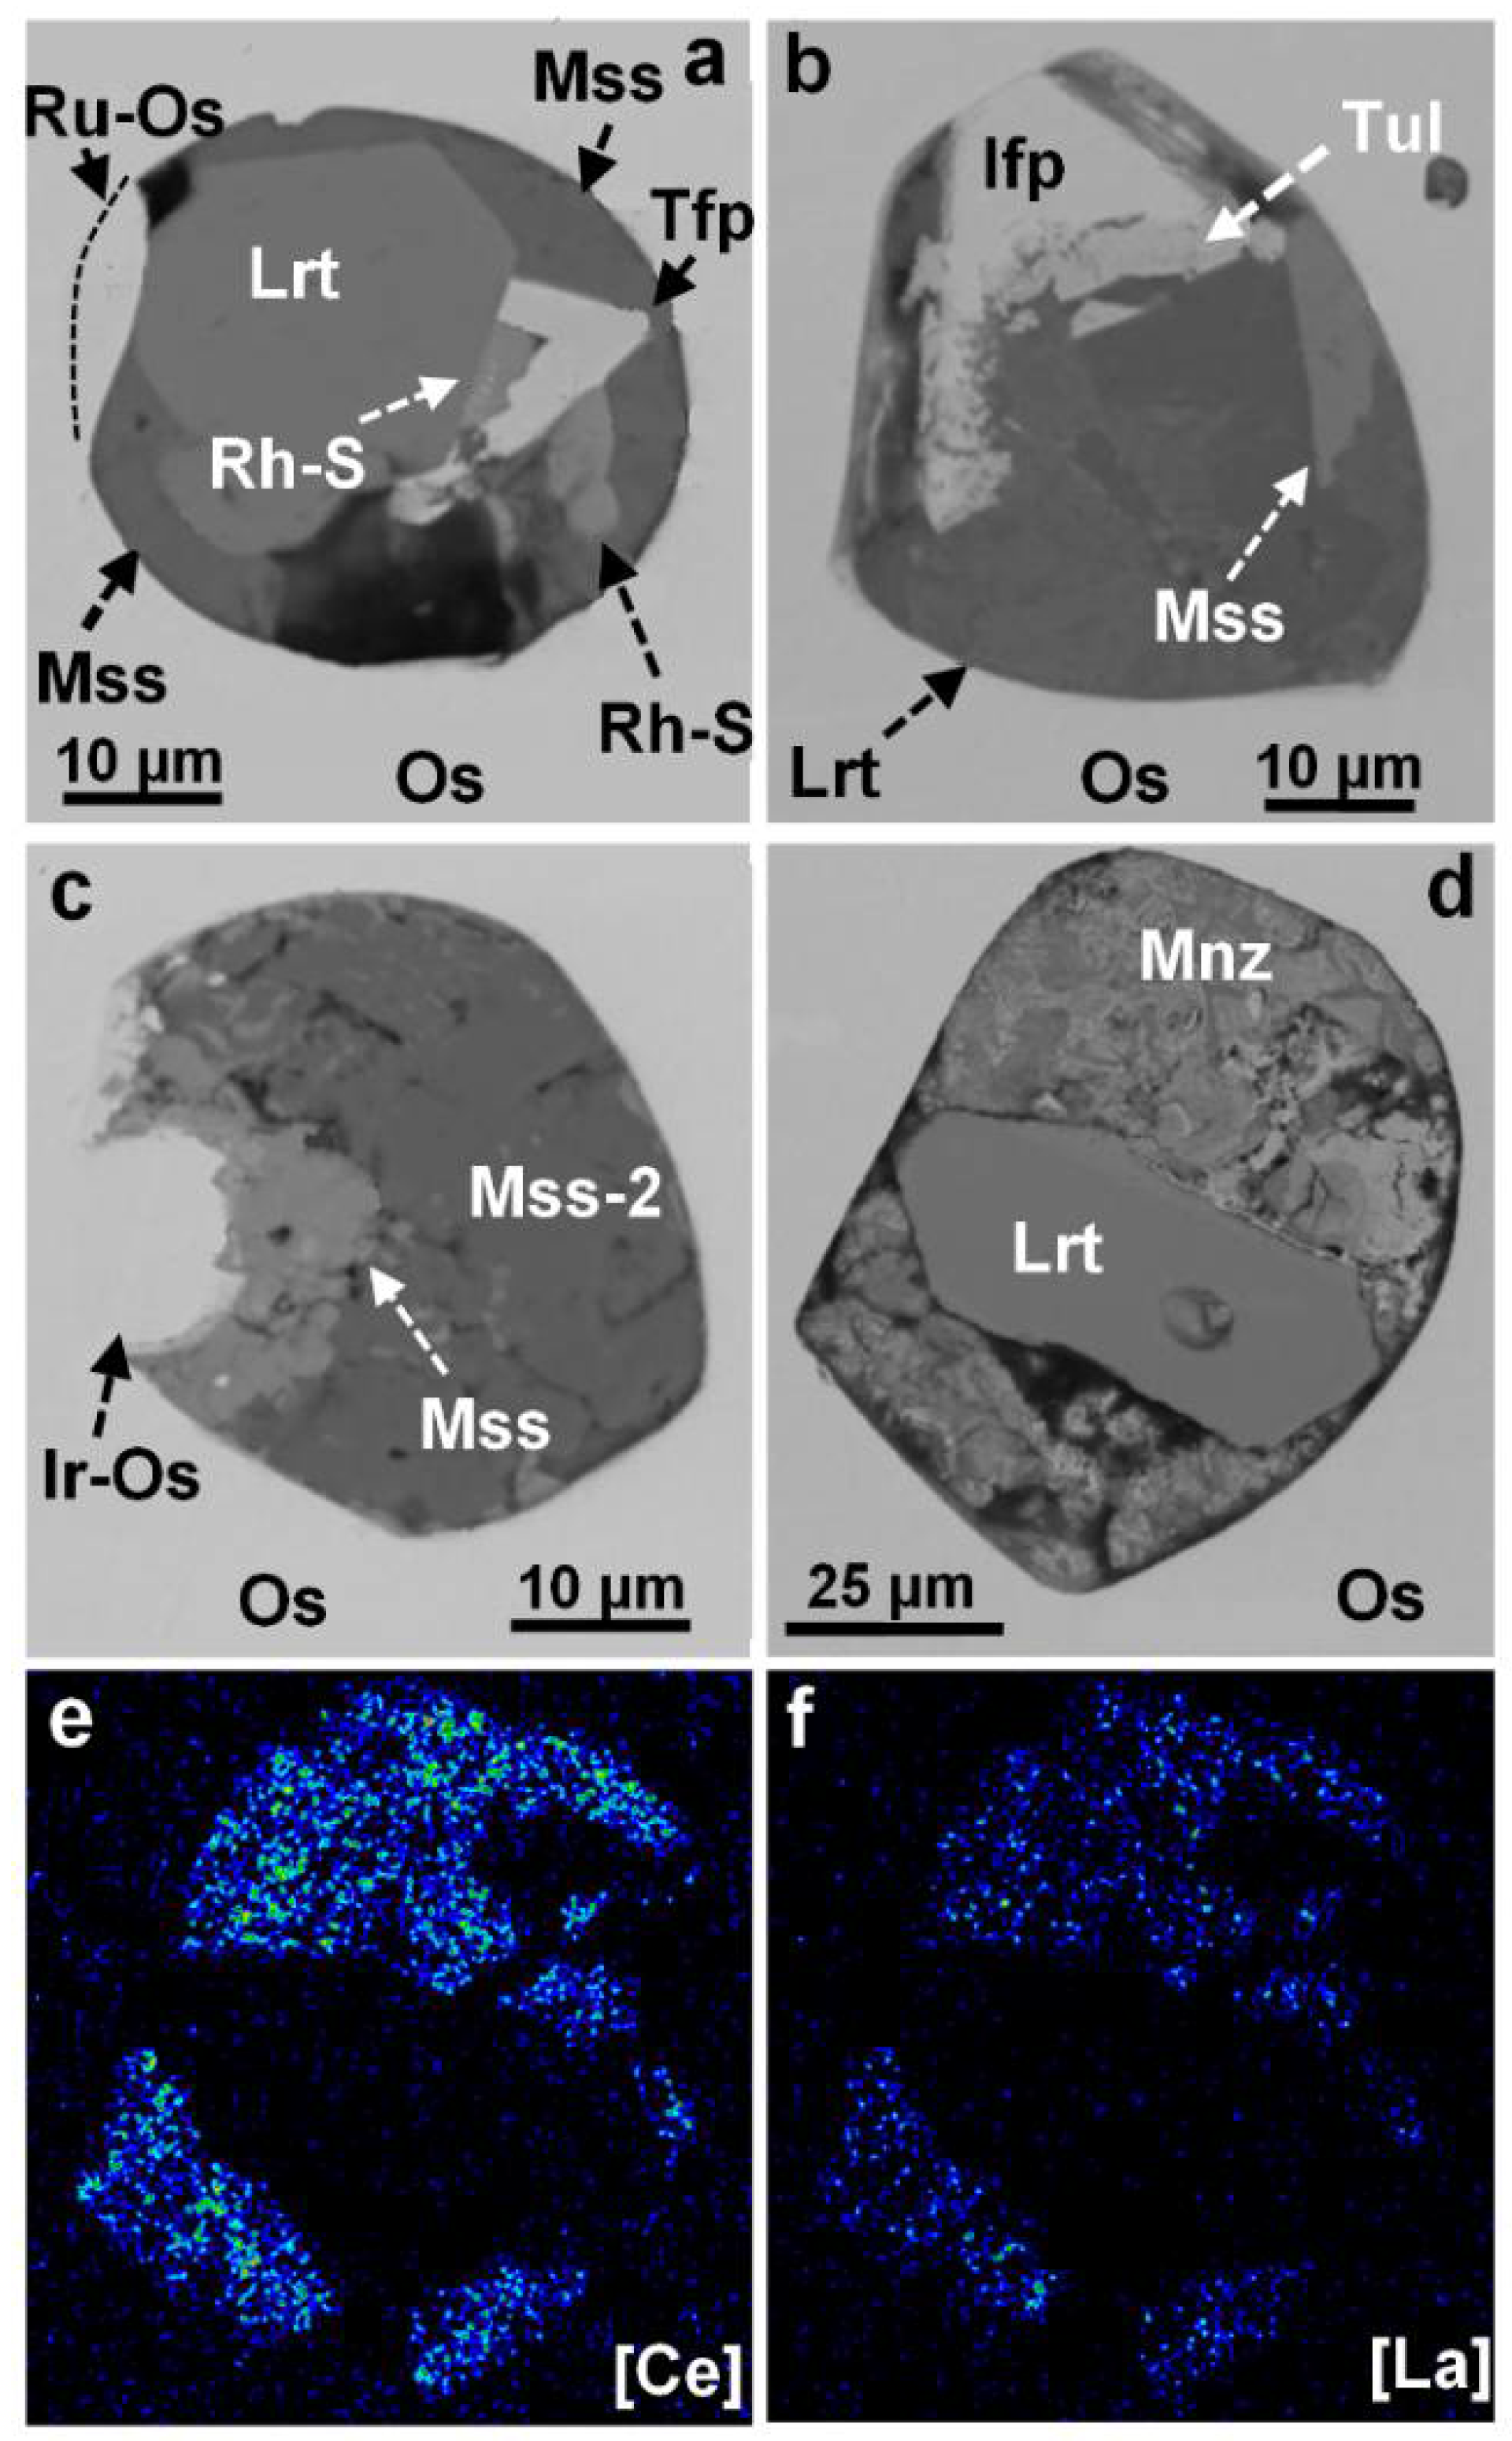
3.4. Inclusions of REE- and Ti-Rich Minerals Coexisting with PGM

A colloform REE-rich phase seems to fill a cavity in the host Os–Ir alloy around a central inclusion of laurite (Figure 3d). Low analytical totals for the phosphate material (# 1, 2, Table 5) are ascribed to its porosity. Nevertheless, the SEM/EDS compositions led to a stoichiometric formula (Ce,La,Nd,Ca,Pr)PO4 of monazite-(Ce) (Table 5). The X-ray maps for Ce and La show that they are distributed uniformly over the entire grain (Figure 3e,f).
Furthermore, titanite is documented (# 3, Table 5) in a single micro-inclusion hosted by a placer grain of mertieite-II [Pd8Sb2.3As0.6] (Figure 2e, # 1, 2, Table 6); the latter is close in composition to the ideal composition, Pd8Sb2.5As0.5 [8].

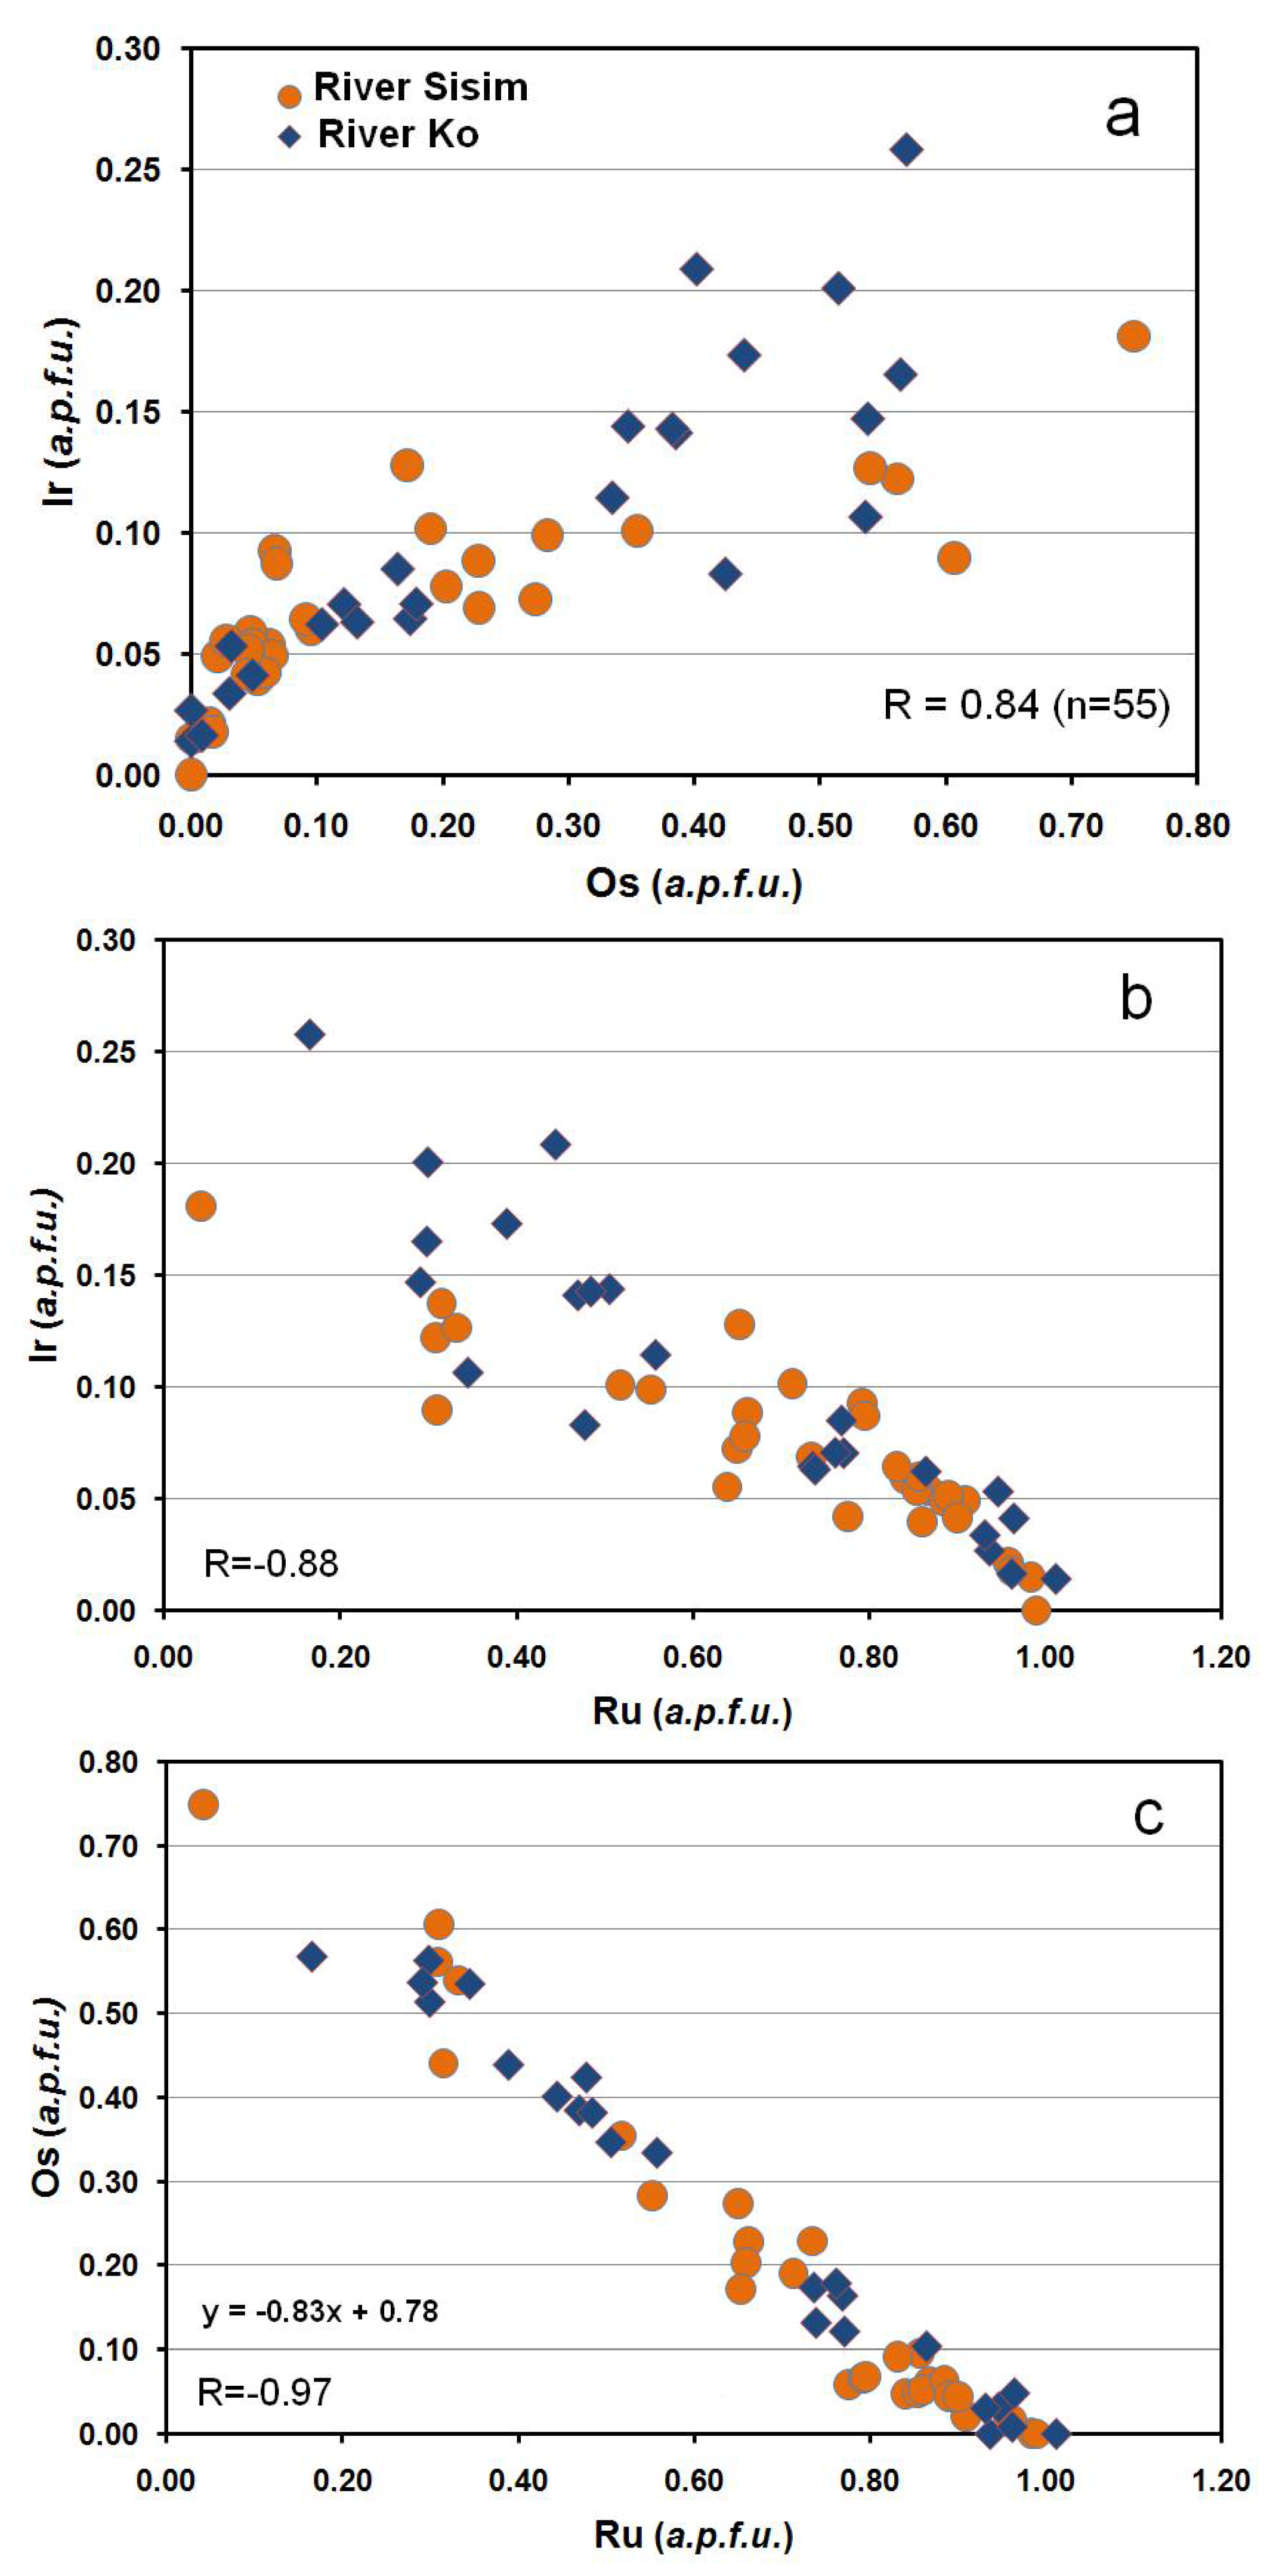
3.5. Variations and Element Correlations in the Laurite–Erlichmanite Series at Sisim

Extensive variations and broad ranges of compositions (Figure 6a–c, Table 7) are documented for members of the laurite–erlichmanite series, which occur as inclusions (<50 μm across) in placer grains of PGE alloy minerals. Element correlations are based on the analyzed specimens at Sisim (this study) and the River Ko [3]. Iridium correlates positively and strongly with Os; the value of R is 0.84, based on a total of 55 data-points (Figure 6a). In contrast, the Ir–Ru correlation is negative (R = −0.88, Figure 6b). The Os–Ru correlation is inverse (R = −0.97), as expected (Figure 6c).
In addition, we encountered an unusual laurite-type phase that is anomalously enriched in Ir (0.40 a.p.f.u., # 9, Table 7). A phase of similar composition (0.35 Ir a.p.f.u., # 10, Table 7) was reported from the Miass placer zone, southern Urals, Russia [4]. Note that both phases are represented by erlichmanite (i.e., the Os-rich end-member) and contain minor Ru (~0.1 a.p.f.u.); this feature agrees well with the sympathetic Os–Ir covariations observed in the series at Sisim (Figure 6c). More studies are required to explain the anomalous Ir-enrichment, which could be a result of an unusual environment of crystallization. On the other hand, it cannot be excluded that the Ir anomaly may reflect the presence of “invisible” exsolution-induced domains of orthorhombic IrS2.

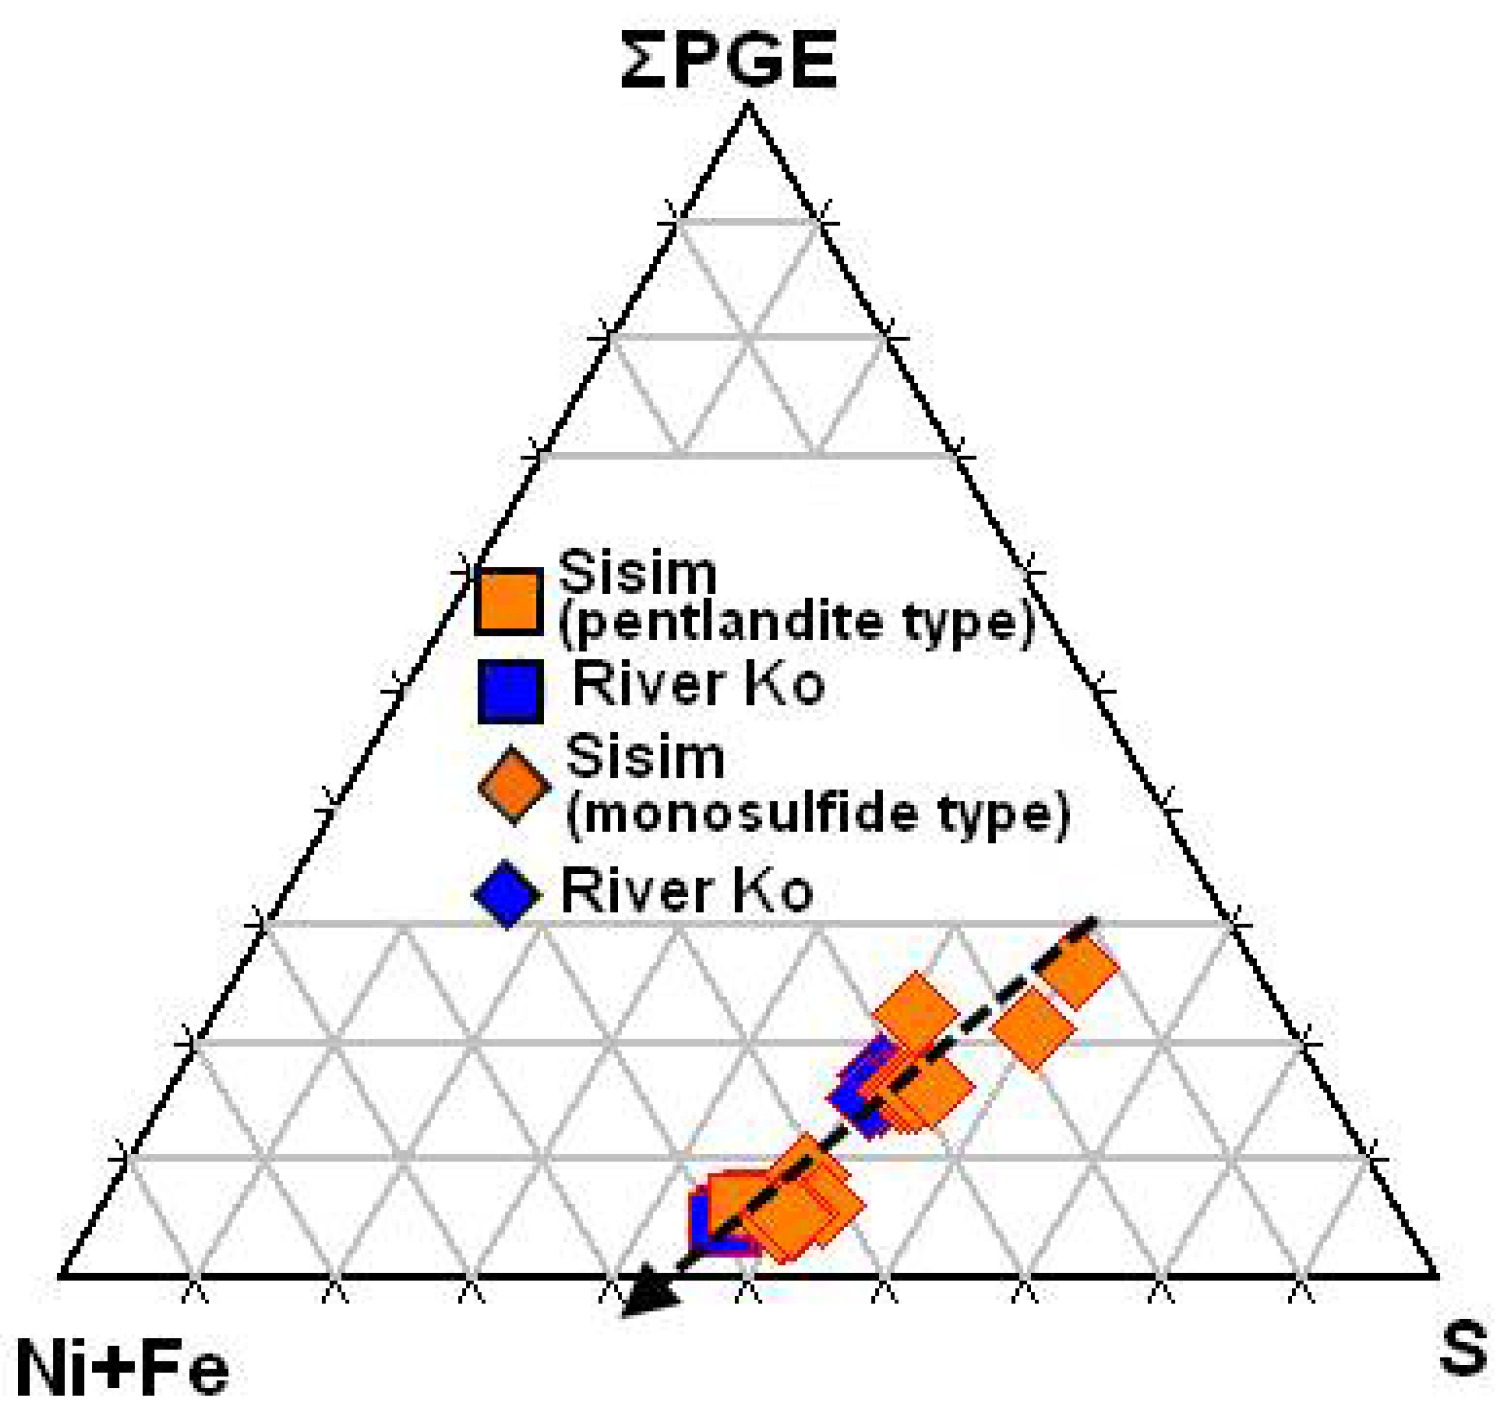
3.6. Monosulfide and Pentlandite-Type Inclusions in Grains of PGE Alloys

Compositionally, there are two types of Ni–Fe–PGE sulfide inclusions associated with laurite, Pt–Fe–(Cu) and Ir–Os–(Ru) alloys (Figure 3a–c). Grains of the first type have their ΣMe/S value, in which ΣMe is the total content of metals, close to 1:1 (or lower, with a minimum of ~0.7), and correspond to monosulfide (Mss). In the phases representative of the second type, values of ΣMe/S approach 9:8 (ideally 1.125), being characteristic of pentlandite. These phases are invariably enriched in Rh, and to a lesser extent, in Ir (Table 8).
Figure 3c shows genetically informative textural relations; they involve a core zone of Ir–Os alloy and two phases of the Mss-type (Mss and Mss-2), which are developed as overgrowths in a composite inclusion hosted by a placer grain of Os-dominant alloy [Os46.5Ir41.0Ru12.6]. The micrometer-sized core of Ir-dominant alloy has the composition [Ir62.3Os26.4Ru11.2]; it is rimmed by the first Mss-type phase [(Ni0.28Fe0.21Ir0.17Rh0.12Cu0.11Pt0.03)Σ0.92S1.08]. The second phase (Mss-2) is (Ni0.52Fe0.39Rh0.10)Σ1.01S1.00. The first phase appears to have formed early as a result of buildup in sulfur fugacity (fS2) after crystallization of the Ir–Os alloy nucleus. As a result of crystallization at a high temperature, this phase is relatively enriched in Ir and ΣPGE. In contrast, the second phase is essentially devoid of Ir, poorer in Rh, and rich in Ni.
The overall variations (Figure 7) observed for the Mss- and pentlandite-type phases at Sisim compare well to those recorded from placers of the River Ko [3]. These phases all define a single linear trend that extends toward the compositions that are rich in (Ni + Fe) and relatively poorer in S, with a corresponding decrease in ΣPGE. Vacancies could likely exist at the metal sites of the pentlandite-type phases rich in the PGE from these placers, as suggested for ferhodsite [(Fe,Rh,Ir,Ni,Cu,Co,Pt)9–xS8] discovered in the Nizhniy Tagil complex, Russia [9]. Ferhodsite is tetragonal and has a pentlandite-derivative structure. Owing to the possible presence of vacancies, compositions of (Ni,Fe,PGE)9–xS8 and (Ni,Fe,PGE)1–xS could almost coincide for some data-points in the plot (Ni + Fe)–ΣPGE–S (Figure 7).

3.7. Other Unusual Phases in Micrometric Inclusions at Sisim

Some phases of unusual compositions rich in Pd, Cu, and Ni were found in inclusions hosted by PGE alloy minerals. A Pd-bearing tetraferroplatinum (# 15, 17, Table 3) [(Pt0.91–0.93Rh0–0.07Ir0–0.06Pd0.03–0.06)Σ0.99–1.07(Fe0.58–0.63Ni0.19–0.24Cu0.06–0.24)Σ0.93–1.01] represents a solid solution with ferronickelplatinum. A phase of Pd-rich tulameenite corresponds to (Pt1.60Pd0.56)Σ2.16Fe0.95(Cu0.83Ni0.06)Σ0.89 (# 21, Table 3).
The other phases, analyzed in micrometer-sized inclusions or as a rim around Pt–Fe alloy grains, are hollingworthite, cherepanovite, and kashinite (Cu-free and Cu-rich varieties, Table 6). Especially interesting are Fe-, Ni- and As-rich phases (# 7, 8, Table 6) related to laurite. The first of them appears to be a new and hitherto unreported example of a solid solution involving pyrite-type components: laurite, pyrite, and vaesite. Previously, Barkov et al. reported on a member of the pyrite–laurite series from the Imandra complex, Russia [10]. The second phase of laurite is anomalously enriched in As (23.4% or 0.60 As a.p.f.u., # 8, Table 6); it likely indicates the existence of a solid solution with anduoite (orthorhombic RuAs2).

4. Discussion

4.1. Crystallization History of Associations of PGM at Sisim

We presume that the Os-dominant alloy phase was first to crystallize in the ultramafic lode source in inferred association with chromian spinel and cumulus olivine, proposed on the basis of inclusions of high-Mg serpentine. The core of the zoned crystals (Figure 2d,g) of the Os–Ir–(Ru) alloys nucleated first; their periphery formed at a later stage, at lower temperature. The evolutionary trend is expressed by the change of compositions from Os92.6Ir6.5Ru0.7Fe0.10Ni0.10 (core) to Os48.0Ir29.1Ru18.9Pt2.5Rh1.0Fe0.47Ni0.15 (periphery). This trend (Figure 5) is consistent with the following, descending order of melting temperatures known from the literature [11]: Os (3030 °C) → Ir (2447 °C) → Ru (2310 °C) → Rh (1963 °C) → Pt 1772 °C → Pd (1554 °C). Thus, Os, as the high-temperature component, was preferentially incorporated into the core; the rim is enriched in Ir and Ru, which are less refractory, during fractional crystallization. This example provides evidence of a simple and effective mechanism of fractionation of Os from Ru and Ir in natural systems. Minor Pt and Rh, along with Fe, are also relatively enriched in the periphery. Palladium is not important here, as is typically observed in Os–Ir–(Ru) alloys associated with chromitite. Nevertheless, we note a relative Pd-enrichment that is characteristic of the late phases of alloys associated with inclusions or rims.
In contrast with other PGE deposits, the overall field of compositions of the alloys at Sisim and River Ko is limited to the Ru-poor portion of the Os–Ir–Ru system by the line Ru/Ir = 1 (Figure 5). Furthermore, the trend of zonation observed in the Os–Ir–(Ru) alloy extends subparallel to this boundary. This feature likely implies the existence of a geochemical relationship involving Ir and Ru, so that the alloy phases with a Ru/Ir ratio exceeding 1 were not stable under the local conditions of crystallization.
Grains of Pt–Fe alloys likely crystallized after the grains of Os–Ir alloy phases. The observed variants of isoferroplatinum, enriched in the chengdeite [Ir3Fe] component, appear to have formed first among the Pt–Fe alloys. At a late stage and at subsolidus temperatures, the other Pt–Fe alloys rich in Pd, Cu, and Ni, such as Pd-bearing tetraferroplatinum and tulameenite (also Pd-rich), formed as components of inclusions hosted by grains of PGE alloys.
Levels of fS2 and fAs2 likely increased during the advanced stages of ore formation, leading to the deposition of various species of sulfide, sulfarsenide, and arsenide rich in PGE. These occur in two textural forms, as follows: as late phases crystallized from microvolumes associated with the inclusions, or as a rim that consists of hollingworthite, a sperrylite-like phase, cherepanovite, kashinite, and its Cu-rich variant. The development of the composite rims of hollingworthite and sperrylite (Figure 2f) provides a clear indication of the S–As enrichment in a late fluid.
As noted, laurite is fairly common in the form of multicomponent or single inclusions in association with the Mss-type phases (Figure 3a,b). Laurite-type phases that are atypically rich in Fe and Ni imply the existence of a solid solution involving various pyrite-type components: RuS2 (laurite), FeS2 (pyrite), and NiS2 (vaesite). One of the laurite phases is anomalously rich in as (23.4 wt %); it is indicative of considerable, though likely limited, solid solution with anduoite (orthorhombic RuAs2). These occurrences of laurite–erlichmanite phases at Sisim likely formed at low temperatures at a subsolidus stage. They are unlikely to have a high-temperature magmatic origin, which laurite reveals in other environments (e.g., [12,13]). In fluid-saturated systems rich in volatiles, laurite or ruthenoan pyrite belong to a hydrothermal paragenesis described from the Imandra complex, Russia [10,14]. Unusual laurite–clinochlore intergrowths also crystallized relatively late, from microvolumes of H2O-bearing fluid enriched in Ru, S, and lithophile elements in the Pados-Tundra complex, Russia [15]. In addition, laurite can form at a late stage as a result of a solution-and-redeposition reaction involving the original grains of Os-rich alloy in environments of increasing fS2, as observed at Miass, Russia [4].
At Sisim, a late generation of Ir–Os alloy precipitated as a core-like phase surrounded by the Mss-type phases, which all are enclosed within a grain of Os–Ir alloy (Figure 3c). As noted, the first of the Mss phases formed after the alloy core, as a result of buildup in fS2 in the micro-environment. Contents of Ir and ΣPGE decreased sharply, followed by a corresponding increase in Ni in the Mss-2 phase (Figure 3c), likely owing to a normal drop in temperature during crystallization.
We observe that Rh is a main constituent of the PGE documented in the Mss- and pentlandite-type inclusions. This feature is not unusual, as rhodian pentlandite is known in various deposits (e.g., [16,17,18,19]). Presumably, Rh is better accommodated by the structure of these sulfides, at least under the given conditions of crystallization. High-temperature conditions would presumably promote the incorporation of greater amounts of Rh and ΣPGE into these phases.
This suggestion is corroborated by experimental results. In the system Fe–Rh–S, at 900 °C, the pyrrhotite phase (Fe1–xS) dissolves up to 25.7 at. % Rh; with decreasing temperature, the maximum solubility strongly decreases to 2.8 at. % Rh at 500 °C [20]. The solubility of Ir, also determined in Fe1–xS, is much lower than that of Rh; even at a higher temperature of synthesis in the system Fe–Ir–S, pyrrhotite dissolves 5.8 at. % Ir at 1100 °C, 3.4 at. % Ir at 1000 °C, and only 1.0 at. % Ir at 800 °C [21]. The maximum levels of solubility of Pt and Os are much lower: 1.1 at. % Pt at 1100 °C, as observed in the system Fe–Pt–S [22], and 0.7 at. % Os at 1180 °C (or 0.3 at. % at 900 °C) in the system Fe–Os–S [23].
The PGE-bearing phases of Mss- and pentlandite-type included in grains of PGE alloys at Sisim and River Ko show a linear trend of crystallization (Figure 7). They evolved in the direction of a decrease in ΣPGE and a corresponding increase in Ni and Fe, presumably as temperature dropped. The overall content of S is relatively high in the ΣPGE-rich sulfide phases; note that the general level of S decreased during crystallization (Figure 7). The S-excess compositions of the phases richest in the PGE presumably compensate an excess in positive charges resulting from the incorporation of Rh3+ (and Ir3+) in the place of Ni2+ and Fe2+ in crystal structures.

4.2. Contrasting Behavior of Ir and Mechanisms of Element Substitutions

The behavior of Ir in Os–Ir–(Ru) alloys differs from that in Os–Ru–(Ir) disulfides at Sisim. In the alloys, the compositional field of which is restricted by the line Ru/Ir = 1 (Figure 5), the Ir content correlates negatively and strongly with Os (R = −0.86). Thus, Ir largely substitutes for Os in these structures; an idealized scheme, [Ir + Ru]0 → 2Os0, seems relevant and operates along the boundary. In contrast, the laurite–erlichmanite series displays the well-recognized sympathetic covariation of Ir and Os, with R = 0.84 (Figure 6a). The Ir–Ru correlation is antipathetic, with a value of R = −0.88 (Figure 6b). These variations are consistent with the substitution mechanism [Os2+ + 2 Ir3+ + □] → 4Ru2+. In addition, we cannot exclude that the Ir2+(S2)2– component is involved, so that the alternative scheme of substitution is Os2+ + Ir2+ → 2Ru2+.
The extent of [Irx(Ru,Os)1–x]S2 solid solution in the laurite–erlichmanite series is limited to ~20 mol % “IrS2”, whereas a continuous solid-solution exists between the RuS2 and OsS2 end-members, cf. [24]. This pattern may well result from the existence of vacancy-type defects and related complications arising from the incorporation of Ir [25]. The proposed mechanism is 0.667 Ir3+ + 0.333 Me□ = (Ru + Os)2+; the Ir is assumed to be trivalent in Ir0.67S2 (i.e., the ideal phase of pyrite structure “IrS3”). A second coupled substitution is [(Ir + Rh)3+ + (AsS)3– = (Ru + Os)2+ + (S2)2–], in which Ir (and Rh) are incorporated as the irarsite–hollingworthite component [25].
We suggest that the contrasting behavior of Ir at Sisim is controlled principally by levels of fS2 in the system. At very low levels, Ir substitutes preferentially for Os in the alloy phases. The positive covariation of Ir and Os, documented in the laurite–erlichmanite series, is consistent with a gradual increase in fS2. It is known that the phase OsS2 crystallizes at a substantially higher level of fS2 than RuS2; the position of the Ir–Ir2S3 buffer is relatively close to the Os–OsS2 buffer, and they both are well above the Ru–RuS2 buffer [26]. Therefore, the incorporation of the “Ir1–xS2” component into the laurite–erlichmanite series would clearly require elevated levels of fS2, which likely led to the positive covariation of Ir with Os, not Ru. The proposed mechanism [Os2+ + 2 Ir3+ + □] → 4Ru2+ may well account for other occurrences of laurite–erlichmanite (e.g., at Pados-Tundra, Russia), in which there is a positive correlation of Ir and Os, and members of the RuS2−RuSe2 series occur [15].

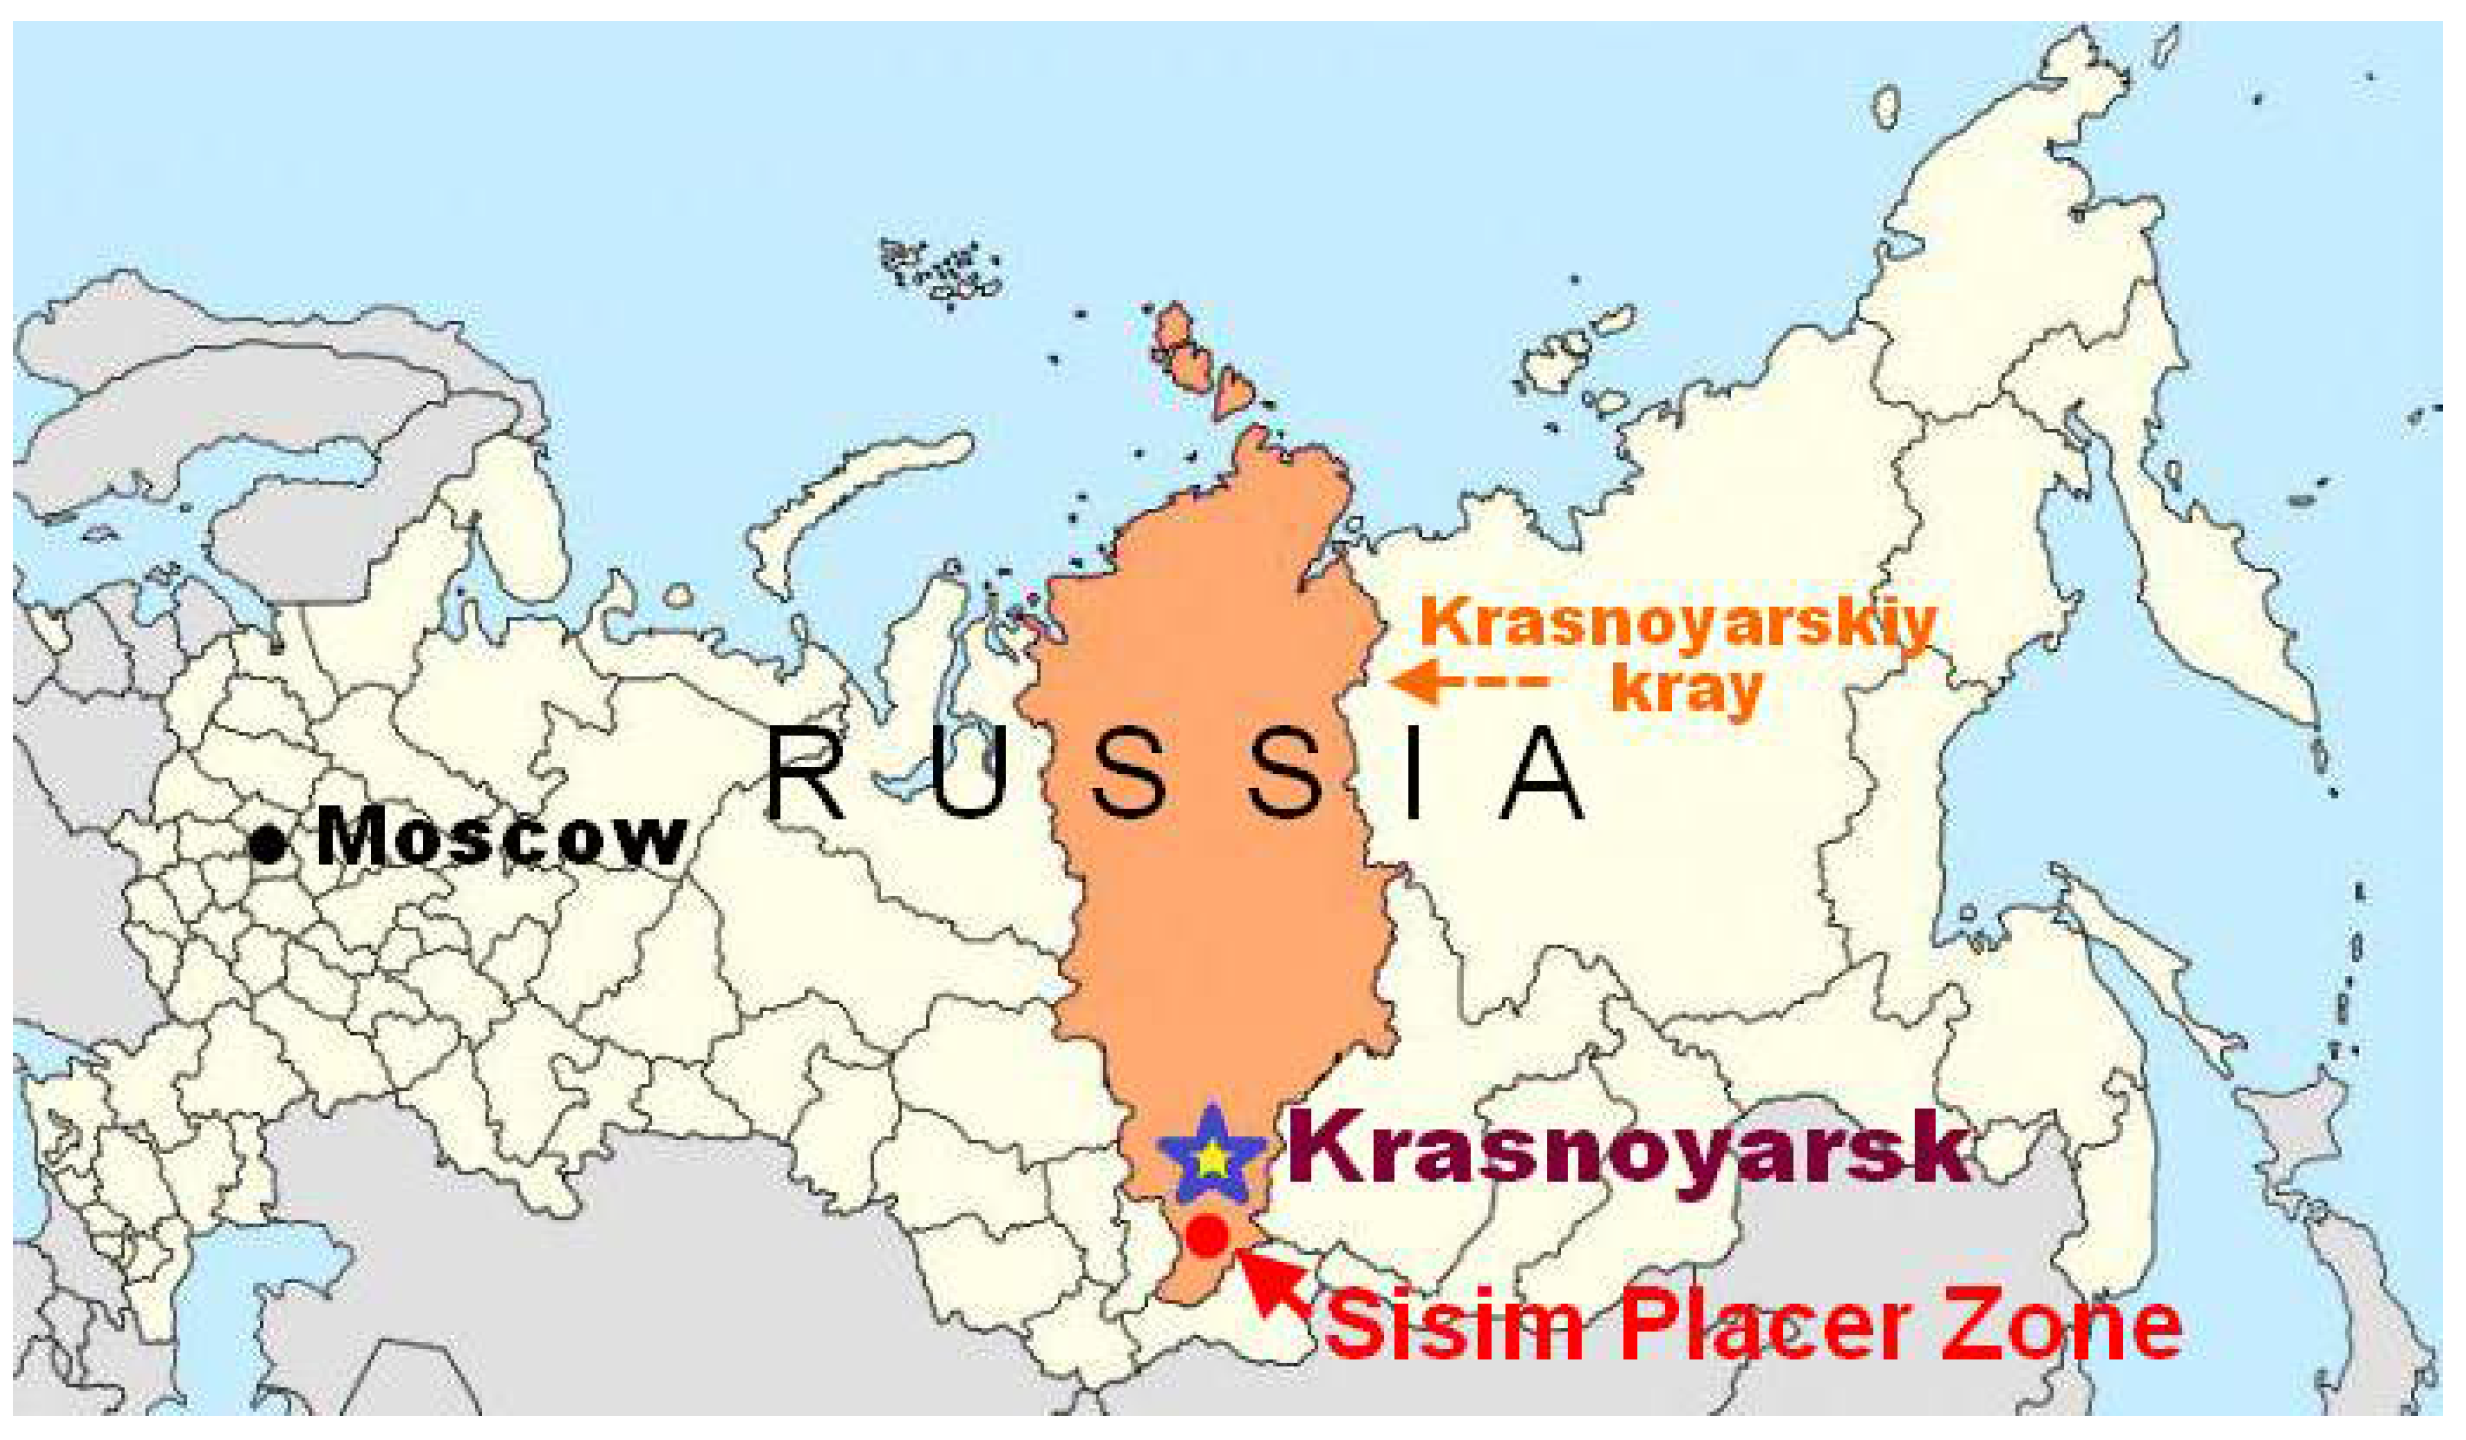
4.3. Potential Provenance of PGM in the Sisim Placer Zone

The observed terrane affinities strongly suggest that the Lysanskiy complex is the common source of placer associations of detrital grains of PGM in the area of the rivers Sisim and Ko. This complex is layered; it represents a suite of ultramafic–mafic bodies ~0.5 × 30 km in extent [27], which have tectonic contacts with the host rocks of the Bakhtinskaya suite of the Upper Proterozoic age. The complex includes several massifs: Lysanskiy, Podlysanskiy, and Kedranskiy, along with many small and fragmented bodies. These are composed of sequences of serpentinite, wehrlite, lherzolite, harzburgite, clinopyroxenite, websterite, gabbronorite, troctolite, gabbro, and anorthosite. Some massifs are dominantly ultramafic, whereas others contain mostly gabbroic rocks. The Lysanskiy complex has a high potential for Ti–(V) mineralization; it hosts podiform ilmenite—titanian magnetite orebodies up to 1–2 km across, namely the Rossyp’, Piramida, Bezymyannyi, and Malyi Lysan deposits.
A wide spectrum of compositions is here documented for detrital grains of chromian spinel (magnesiochromite–chromite series) from the Sisim zone. Compositions of lode grains of chromite from outcrops of serpentinite, attributed to the Lysanskiy complex, are fairly similar (Figure 4). Some of the detrital grains of magnesiochromite display very high levels of Mg, attaining 16.6 wt % MgO (with 48.6% Cr2O3, Table 1). This level of magnesium enrichment is unusual and even exceeds the highest contents reported from the Lower Zone in the Bushveld complex, South Africa (up to ~14% MgO and 57% Cr2O3 [28] or from the Monchepluton layered complex, Russia (~14% MgO and 56% Cr2O3) [29]. On the other hand, these grains are substantially enriched in Ti (up to 1.3% TiO2; Table 1), which could reflect the presence of exsolved, submicrometric lamellae rich in the ulvöspinel component. The relative enrichment in Ti is unusual for such a high-magnesium phase (cf. 0.3 wt % TiO2 in the chromian spinel at Monchepluton quoted above). The presence of Ti-bearing amphiboles and, especially, high-Ti micromixture inclusions (54.5–68.2% TiO2) within the grains of PGE alloys is noteworthy. The pattern of Ti enrichment strongly points to the Lysanskiy complex as the lode source of placer grains of PGM and chromian spinel. The placer grain of mertieite-II that hosts the inclusion of titanite (Figure 2e, Table 5) is the only example of a Pd placer mineral found at Sisim; it likely was derived from a more evolved PGE-bearing zone of the Lysanskiy complex.
Interestingly, at a final stage of ore genesis, the unique association of laurite and monazite-(Ce) appeared as consequences of the accumulation of the incompatible elements S, P, and the REE in a microvolume of residual aqueous fluid (Figure 3d–f). The laurite core could have formed at a subsolidus stage, with microparticles of monazite-(Ce) (Table 5) precipitated from a colloidal solution around this core. Colloidal monazite-type nanoparticles have been produced experimentally (e.g., [30]).

5. Conclusions

(1)
We attribute the PGM-bearing placer deposits in the Sisim watershed to the Lysanskiy ultramafic–mafic layered complex, Eastern Sayans. The PGE mineralization is strongly dominated by Os–Ir alloy minerals poor in Ru and is thus distinct from deposits in an ophiolite setting.
(2)
The Os–Ir–(Ru) alloy minerals and associated Pt–Fe alloys were likely derived from chromitite units of the complex, whose unusual degree of Mg enrichment suggest a picritic parental melt, unusual, however, for its level of titanium. The completeness of the magnesiochromite–chromite series in the placer grains suggests that large volumes of the source rocks were completely eroded.
(3)
The limitation of the Os–Ir–(Ru) alloys at Sisim to the Ru-poor portion of the Os–Ir–Ru system by the line Ru/Ir = 1 implies a close geochemical relationship of Ir and Ru, manifested by the scheme Ir + Ru → 2Os. A drop in temperature, leading to a decrease in Os, is recorded in zoned grains. This zonation indicates the existence of a simple and effective mechanism of fractionation of Os from Ru and Ir in natural systems.
(4)
In contrast, we document a strong positive covariation of Ir and Os along with a negative Ir–Ru correlation in the laurite–erlichmanite series, likely promoted by locally high levels of fS2. This relationship points to the scheme [Os2+ + 2Ir3+ + □] → 4Ru2+. Alternatively, the IrS2 component [Ir2+(S2)2–] is involved; if so, the incorporation of essential, though limited amounts of Ir is governed by the scheme Os2+ + Ir2+ → 2Ru2+.
(5)
The inferred sequence of crystallization of PGE alloys at Sisim is as follows: (1) grains (Os-rich) of Os–Ir–(Ru) alloy; the core (Os-rich) of the zoned grains of Os–Ir–(Ru) alloy → (2) grains (Ir-rich) and periphery zones enriched relatively in Ir–Ru of the zoned grains of Os–Ir–(Ru) alloy → (3) isoferroplatinum or ferroan platinum (rich in Ir → poor in Ir) → (4) various Pt–(Pd)–Fe–Cu–Ni alloys, all likely formed under subsolidus conditions → (5) various S–As-rich phases deposited to form inclusions (or a late rim) as a result of buildup in levels of fS2 and fAs2 in the micro-environments.
(6)
Inclusions of the PGE-bearing phases of monosulfide and pentlandite types, hosted by grains of PGE alloys, follow a linear trend of crystallization, which reflects a decrease in temperature. The decrease in ΣPGE and overall S was accompanied by an increase in Ni and Fe. The observed S-excess in the ΣPGE-rich sulfide phases likely compensates the excess in positive charges owing to the Rh3+ (+Ir3+)-for-(Ni + Fe)2+ substitution.
(7)
A unique association of laurite with micrometer-sized particles of monazite-(Ce) is documented in a composite inclusion. The juxtaposition reflects an increase in levels of incompatible elements (S, P, and the REE) in a residual microvolume of aqueous fluid. This could be another expression of the unusual character of the parental magma of the Lysanskiy complex.

Author Contributions

The authors (A.Y.B., R.F.M., and G.I.S.) discussed the results and wrote the article together, and G.I.S. conducted the field work in the Sisim placer area, collected the samples analyzed, and studied jointly during the present project.

Acknowledgments

We thank Liana Pospelova (Novosibirsk) and Sergey Silyanov (Krasnoyarsk, Russia) for their expert assistance with the analytical data. We thank the three anonymous reviewers and members of the editorial board whose comments and suggestions helped improve this manuscript. A.Y.B. gratefully acknowledges a partial support of this investigation by the Russian Foundation for Basic Research (project # RFBR 16-05-00884).

Conflicts of Interest

The authors declare no conflict of interest.

References

  1. Vysotskiy, N.K. Platinum and areas of its mining. In The Natural Producing Forces of Russia. Part 5—A Review of Platinum Deposits Outside The Urals; The USSR Academy of Sciences: Leningrad, Russia, 1933; p. 240. (In Russian) [Google Scholar]
  2. Krivenko, A.P.; Tolstykh, N.D.; Nesterenko, G.V.; Lazareva, E.V. Types of mineral assemblages of platinum metals in auriferous placers of the Altai-Sayan region. Russian Geol. Geophys. 1994, 35, 58–65. [Google Scholar]
  3. Tolstykh, N.D.; Krivenko, A.P. On the composition of sulfides containing the platinum-group elements. Zap. Vseross Miner. Obshch 1994, 123, 41–49. (In Russian) [Google Scholar]
  4. Barkov, A.Y.; Tolstykh, N.D.; Shvedov, G.I.; Martin, R.F. Ophiolite-related associations of platinum-group minerals at Rudnaya, western Sayans, and Miass, southern Urals, Russia. Mineral. Mag. 2018, in press. [Google Scholar] [CrossRef]
  5. Melcher, F.; Grum, W.; Simon, G.; Thalhammer, T.V.; Stumpfl, E.F. Petrogenesis of the ophiolitic giant chromite deposits of Kempirsai, Kazakhstan: A study of solid and fluid inclusions in chromite. J. Petrol. 1997, 38, 1419–1458. [Google Scholar] [CrossRef]
  6. Harris, D.C.; Cabri, L.J. Nomenclature of platinum-group-element alloys: Review and revision. Can. Mineral. 1991, 29, 231–237. [Google Scholar]
  7. Barkov, A.Y.; Fleet, M.E.; Nixon, G.T.; Levson, V.M. Platinum-group minerals from five placer deposits in British Columbia, Canada. Can. Mineral. 2005, 43, 1687–1710. [Google Scholar] [CrossRef]
  8. Karimova, O.; Zoloratev, A.; Evstigneeva, T.L.; Johanson, B. Mertieite-II, Pd8Sb2.5As0.5, crystal structure refinement and formula revision. Mineral. Mag. 2018. [Google Scholar] [CrossRef]
  9. Begizov, V.D.; Zavyalov, E.N. Ferhodsite (Fe,Rh,Ir,Ni,Cu,Co,Pt)9-xS8—A new mineral from the Nizhniy Tagil ultramafic complex. New Data Miner. 2016, 51, 8–11. (In Russian) [Google Scholar]
  10. Barkov, A.Y.; Halkoaho, T.A.A.; Laajoki, K.V.O.; Alapieti, T.T.; Peura, R.A. Ruthenian pyrite and nickeloan malanite from the Imandra layered complex, northwestern Russia. Can. Mineral. 1997, 35, 887–897. [Google Scholar]
  11. Roberts, P.M. Introduction to Brazing Technology; CRC Press: Boca Raton, FL, USA, 2016; p. 340. [Google Scholar] [CrossRef]
  12. Andrews, D.R.A.; Brenan, J.M. Phase-equilibrium constraints on the magmatic origin of laurite and Os–Ir alloy. Can. Mineral. 2002, 40, 1705–1716. [Google Scholar] [CrossRef]
  13. Bockrath, C.; Ballhaus, C.; Holzheid, A. Stabilities of laurite RuS2 and monosulfide liquid solution at magmatic temperature. Chem. Geol. 2004, 208, 265–271. [Google Scholar] [CrossRef]
  14. Barkov, A.Y.; Fleet, M.E. An unusual association of hydrothermal platinum-group minerals from the Imandra layered complex, Kola Peninsula, northwestern Russia. Can. Mineral. 2004, 42, 455–467. [Google Scholar] [CrossRef]
  15. Barkov, A.Y.; Nikiforov, A.A.; Tolstykh, N.D.; Shvedov, G.I.; Korolyuk, V.N. Compounds of Ru–Se–S, alloys of Os–Ir, framboidal Ru nanophases and laurite–clinochlore intergrowths in the Pados-Tundra complex, Kola Peninsula, Russia. Eur. J. Mineral. 2017, 29, 613–622. [Google Scholar] [CrossRef]
  16. Cabri, L.J. (Ed.) The Geology, Geochemistry, Mineralogy, Mineral Beneficiation of the Platinum-Group Elements; Canadian Institute of Mining, Metallurgy and Petroleum: Westmount, QC, Canada, 2002; Volume 54, p. 852. [Google Scholar]
  17. Junge, M.; Oberthür, T.; Melcher, F. Cryptic variation of chromite chemistry, platinum group element and platinum group mineral distribution in the UG-2 chromitite: An example from the Karee mine, western Bushveld complex, South Africa. Econ. Geol. 2014, 109, 795–810. [Google Scholar] [CrossRef]
  18. Junge, M.; Wirth, R.; Oberthür, T.; Melcher, F.; Schreiber, A. Mineralogical siting of platinum-group elements in pentlandite from the Bushveld Complex, South Africa. Miner. Depos. 2014, 50, 41–54. [Google Scholar] [CrossRef]
  19. Makovicky, E.; Karup-Møller, S. The Pd–Ni–Fe–S phase system at 550 and 400 °C. Can. Mineral. 2016, 54, 377–400. [Google Scholar] [CrossRef]
  20. Makovicky, E.; Makovicky, M.; Rose-Hansen, J. The system Fe–Rh–S at 900° and 500 °C. Can. Mineral. 2002, 40, 519–526. [Google Scholar] [CrossRef]
  21. Makovicky, E.; Karup-Møller, S. The phase system Fe–Ir–S at 1100, 1000 and 800 °C. Mineral. Mag. 1999, 63, 379–385. [Google Scholar] [CrossRef]
  22. Majzlan, J.; Makovicky, M.; Makovicky, E.; Rose-Hansen, J. The system Fe–Pt–S at 1100 °C. Can. Mineral. 2002, 40, 509–517. [Google Scholar] [CrossRef]
  23. Karup-Møller, S.; Makovicky, E. The system Fe–Os–S at 1180°, 1100° and 900 °C. Can. Mineral. 2002, 40, 499–507. [Google Scholar] [CrossRef]
  24. Cabri, L.J.; Harris, D.C.; Weiser, T.W. Mineralogy and distribution of platinum-group mineral (PGM) placer deposits of the world. Explor. Min. Geol. 1996, 5, 73–167. [Google Scholar]
  25. Barkov, A.Y.; Fleet, M.E.; Martin, R.F.; Alapieti, T.T. Zoned sulfides and sulfarsenides of the platinum-group elements from the Penikat layered complex, Finland. Can. Mineral. 2004, 42, 515–537. [Google Scholar] [CrossRef]
  26. Stockman, H.W.; Hlava, P. Platinum-group minerals in Alpine chromitites from Southwestern Oregon. Econ. Geol. 1984, 79, 491–508. [Google Scholar] [CrossRef]
  27. Glazunov, O.M. The Geochemistry and Petrology of the Gabbro-Pyroxenite Formation of the Eastern Sayans; Nauka: Novosibirsk, Russia, 1975; p. 188. (In Russian) [Google Scholar]
  28. Hulbert, L.J.; von Gruenewaldt, G. Textural and compositional features of chromite in the Lower and Critical zones of the Bushveld complex south of Potgietersrus. Econ. Geol. 1985, 80, 872–895. [Google Scholar] [CrossRef]
  29. Barkov, A.Y.; Korolyuk, V.N.; Martin, R.F. The maximum extent of Mg-enrichment in olivine of layered intrusions: Evidence from Monchepluton (Fo96) and Pados-Tundra (Fo93), Kola Peninsula, Russia. Eur. J. Mineral. 2018. under review. [Google Scholar]
  30. Hickmann, K.; John, V.; Oertel, A.; Koempe, K.; Haase, M. Investigation of the early stages of growth of monazite-type lanthanide phosphate nanoparticles. J. Phys. Chem. C 2009, 113, 4763–4767. [Google Scholar] [CrossRef]
Figure 1. Map showing the location of the Sisim placer zone in the Krasnoyarskiy kray of the Russian Federation.
Minerals 08 00181 g001
Figure 2. (a) Microscopic image showing grains of placer platinum-group mineral (PGM) concentrate, the size of which is generally ~0.1–0.5 mm, collected from the Sisim placer zone and analyzed in the present study. The bulk of these grains (up to ~80%) are Os–Ir–(Ru) alloy minerals (i.e., the minerals osmium and iridium). Grains of Pt–Fe alloy are subordinate (<20%); (b,c). Grains of Os–Ir alloy (Os–Ir), observed in a polished mount, contain various inclusions; (d) A grain of sharply zoned Os–Ir alloys, consisting of Os-rich core and Ir-rich rim; (e) Subhedral grain of mertieite-II (Mrt), hosting a tiny inclusion of titanite (Ttn); (f) Back-scattered electron (BSE) image displaying a rounded grain of isoferroplatinum (Ifp; Rh–Ir–Cu–bearing) [(Pt2.57Rh0.28Ir0.17Os0.09Ru0.05)Σ3.16(Fe0.66Cu0.17Ni<0.01)Σ0.84], which is mantled by a composite rim that consists of a S-deficient phase of hollingworthite (Hol, dark grey: the internal rim) [(Rh0.94Pt0.18Fe0.03Ir0.01)Σ1.84As1.15S0.69], and an outer rim composed of a metal-deficient sperrylite (Spy) [(Pt0.71Rh0.17Fe0.04Ni<0.01)Σ0.92(As1.82S0.26)Σ2.08]; (g) A reflected light microphotograph and (h) BSE image showing a sharply zoned grain of Os–Ir–(Ru) alloy from the Sisim placer zone; the core zone (CZ, blue in Figure 2g) has the composition Os92.6Ir6.5Ru0.7Fe0.10Ni0.10. The wavelength-dispersive spectroscopy (WDS) composition of the periphery zone (PZ) is Os48.0Ir29.1Ru18.9Pt2.5Rh1.0Fe0.47Ni0.15.
Minerals 08 00181 g002
Figure 3. (a) BSE image displaying a multiphase inclusion enclosed by a placer grain of an Os-dominant alloy (Os) [Os35.5Ru32.7Ir31.8] from the Sisim placer zone. It consists of a subhedral crystal of nearly end-member laurite (Lrt) [Ru0.99S2.01], a phase of tetraferroplatinum (Tfp) [(Pt0.93Pd0.06)Σ0.99(Fe0.58Cu0.24Ni0.19)Σ1.01], a monosulfide-type phase (Mss) having the composition [(Ni0.55Fe0.33Rh0.10)Σ0.99S1.01], and a pentlandite-type phase (Rh–S); ideally (Rh,Ni,Cu)9S8 [(Rh6.67–6.72Ni1.70–1.76Cu0.54–0.58Fe0.15)Σ9.1–9.2S7.8–7.9]. A Ru-dominant alloy (Ru–Os) [Ru41.0Ir32.4Os19.7Rh4.1Fe1.6Pt1.2] occurs as a narrow rim, forming part of this inclusion. (b) BSE image displaying a composite inclusion, hosted by an Os-dominant alloy [Os53.0Ir30.6Ru16.4], which is associated with isoferroplatinum (Ifp) [Pt2.95(Fe0.98Ni0.07)], rimmed partly by a tulameenite-type phase (Tul; Pd-bearing) [(Pt1.60Pd0.56)Fe0.95(Cu0.83Ni0.06)]. Also present are a monosulfide phase [Ni0.23Fe0.23Ir0.16Rh0.13Cu0.12Ru0.03)Σ0.90S1.10] and a laurite-type phase (Lrt) [(Ru,Fe,Ni,Rh)S2–x], which likely represents a solid solution toward pyrite and vaesite [(Ru0.49Fe0.26Ni0.24Rh0.11Cu0.07Ir0.04)Σ1.21S1.80]. (c) BSE image of a core-like zone of Ir-dominant alloy (Ir–Os) [Ir62.3Os26.4Ru11.2], which is surrounded by a monosulfide-type phase (Mss) [(Ni0.28Fe0.21Ir0.17Rh0.12Cu0.11Pt0.03)Σ0.92S1.08]. The second phase of the latter type (Mss-2) has the following composition: [(Ni0.52Fe0.39Rh0.10)Σ1.01S1.00]. This inclusion is enclosed within a grain of Os-dominant alloy [Os46.5Ir41.0Ru12.6]. (d) BSE image of a subhedral crystal of zoned laurite (Lrt) occurring at the center of inclusion with the composition (Ru0.89Ir0.05Os0.04)Σ0.98S2.02 in the central phase rimmed by a narrow zone rich in Ir [(Ru0.74Ir0.16Rh0.07)Σ0.97S2.03]. An aggregate of microcrystalline grains of a colloform rare-earth element (REE) phosphate that precipitated around the laurite core corresponds to monazite-(Ce) (Mnz). Inclusion hosted by a grain of Os-dominant alloy (Os) [Os43.3Ir42.2Ru14.6]. (e,f) X-ray maps show the distribution of Ce (Figure 3e) and La (Figure 3f) in the grain of the REE phase of monazite-(Ce) shown in Figure 3d.
Minerals 08 00181 g003
Figure 4. Plot of values of the index Mg# [100 Mg/(Mg + Fe2+ + Mn)] vs. Cr# [100 Cr/(Cr + Al)] in compositions of placer grains of chromian spinel (chromite–magnesiochromite series) from the Sisim River system; a total of 106 data-points are plotted. For comparison, WDS data are presented for several grains of chromite collected from lode outcrops of serpentinite exposed in the area at the River Levyi Ko (this study).
Minerals 08 00181 g004
Figure 5. Compositional variations of grains of Os–Ir–(Ru) alloys from placer deposits associated with the River Sisim (this study) and River Ko [2] in terms of the Ru–Os–Ir diagram (atomic %). The blue arrow shows the variation, from the CZ toward the PZ, which exists in the zoned placer grain of Os–Ir–(Ru) alloy from Sisim (Figure 2h). The nomenclature and miscibility gap are in [6].
Minerals 08 00181 g005
Figure 6. Correlations of Ir and Os (a); Ir and Ru (b); and Os and Ru (c) observed in compositions of members of the laurite–erlichmanite series, which occur as inclusions in placer grains of Os–Ir–(Ru) alloys from the Sisim River system (this study), compared with laurite–erlichmanite grains from the River Ko placer [3]. The equation of linear regression and values of the correlation coefficient (R) are based on a total of 55 data-points (this study).
Minerals 08 00181 g006
Figure 7. Variation of compositions of sulfide phases of the monosulfide and pentlandite types, which occur as inclusions hosted by placer grains of Os–Ir–(Ru) alloys from the River Sisim (this study) and the River Ko [3] in terms of ternary plot ΣPGE–Ni + Fe (+Co)–S (atomic %).
Minerals 08 00181 g007
Table 1. Compositions of grains of magnesiochromite–chromite from the Sisim placer zone, Eastern Sayans, Russia.
#TiO2Al2O3Cr2O3FeO(t)FeO(calc.)Fe2O3(calc.)MnOMgONiOTotal
10.5213.8346.4536.7231.85.470.341.640.04100.21
21.3313.5443.3137.5930.378.030.272.920.18100.1
31.0516.2448.0918.9712.716.960.1714.630.24100.22
41.0115.0445.629.5323.217.020.327.550.14100.05
50.3813.5742.4840.3432.578.640.680.510.0699.03
60.916.1248.6415.889.337.280.0916.590.2699.33
71.1614.6845.0227.4218.1310.320.211.120.21100.95
80.8916.4648.8216.7811.016.410.1215.590.2499.64
91.3415.0745.6123.115.628.310.1612.550.1899.1
101.1514.5446.1327.5820.288.110.229.60.16100.31
Atomic Proportions (O = 4)
#CrAlFe3+TiMgFe2+MnNiMg#Cr#Fe3+#
11.270.560.140.010.080.920.010.0018697
21.180.550.210.030.150.870.010.005156811
31.190.60.160.020.680.33<0.010.00667678
41.190.590.170.030.370.640.010.00436679
51.190.560.230.010.030.960.020.00236812
61.20.590.170.020.770.24<0.010.00676679
71.140.550.250.030.530.490.010.005526713
81.20.60.150.020.720.29<0.010.00671678
91.160.570.20.030.60.42<0.010.005596710
101.190.560.20.030.470.550.010.004466810
Note: Results of WDS analyses acquired with a Camebax-micro microprobe are quoted in wt %. These grains of magnesiochromite–chromite (subhedral; 0.1–0.4 mm in size) were collected in the Sisim placer area and at Ivanovka Creek associated. FeO (t) is all Fe as FeO. FeO (calc.) and Fe2O3 (calc.) are values calculated on the basis of stoichiometry and charge balance per four oxygen atoms (O = 4). The index Mg# is 100 Mg/(Mg + Fe2+ + Mn); Cr# is 100 Cr/(Cr + Al); and Fe3+# is 100 Fe3+/(Fe3+ + Cr + Al).
Table 2. Compositions of Os–Ir–Ru alloy minerals from the Sisim placer zone, Eastern Sayans.
# RuOsIrRhPtFeNiTotal
1Os-dominantMatrix6.7255.45370.060.230.130.0399.62
2 11.5845.638.481.132.860.160.0299.83
3 5.8274.44200.050.040.03bdl100.38
4 5.4265.9727.40.240.430.030.0599.54
5 11.9442.7941.281.11.610.260.0599.03
6 Inclusion11.7653.1534.380.240.390.110.09100.12
7 0.2577.3421.83bdl0.090.060.0399.6
8 0.8988.0510.5bdlbdl0.06bdl99.5
9 3.0871.0125.65bdlbdl0.060.0599.85
10 4.5454.239.530.261.580.18bdl100.3
11Ir-dominantMatrix6.3614.5875.290.521.810.580.0999.23
12 3.5512.6382.530.140.790.80.09100.53
13 1.1127.1270.78bdlbdl0.350.0699.41
14 57.2184.830.150.681.070.1599.08
15 Inclusion13.1737.0848.38bdl0.550.230.0499.45
Atomic Proportions (per a Total of 100 at. %)
# RuOsIrRhPtFeNi
1 1252.534.70.10.210.420.1
2 19.641.134.31.882.510.490.06
3 10.470.618.80.090.030.10
4 9.863.2260.420.40.110.14
5 20.338.636.91.841.420.810.14
6 204830.70.390.350.340.26
7 0.577.521.600.080.20.11
8 1.787.810.4000.190.01
9 5.769.224.7000.210.15
10 8.251.937.40.471.470.590.01
11 11.313.770.30.911.661.850.28
12 6.41277.80.250.732.590.28
13 2.12769.6001.180.18
14 8.96.879.50.260.633.450.44
15 22.333.343.100.480.720.1
Note: Results of electron-microprobe spectroscopy (EDS) are quoted in weight percent. Pd is close to the detection limit; bdl is below detection limit.
Table 3. Compositions of Pt–Fe–(Cu–Ni) alloy minerals from the Sisim placer zone, Eastern Sayans.
# RuOsIrRhPtPdFeNiCuTotal
1Matrix0.410.714.96bdl84.62bdl7.150.030.4298.3
2 1.120.35.445.679.63bdl6.80.151.07100.1
3 1.20.315.814.5680.01bdl7.380.090.65100
4 0.92.194.554.3880.02bdl5.650.011.9399.6
5 0.792.675.244.5579.28bdl5.820.011.75100.1
6 2.522.356.821.0379.82bdl60.120.8199.5
7Inclusionbdl0.159.720.2777.550.258.720.620.1197.4
8 bdl0.068.330.2878.980.390.70.297.9
9 bdl0.1610.840.2276.40.188.690.590.1197.2
10 0.150.089.570.3878.92bdl8.70.680.2298.7
11 0.150.318.828.4769.51bdl9.190.850.497.7
12 bdlbdl8.94.271.6bdl12.73.70.9102
13 bdlbdl20.93.564.4bdl10.22.6bdl101.6
14 bdlbdl10.67.966.9bdl10.52.6bdl98.5
15 bdlbdl4.82.969.81.213.95.61.599.7
16 bdlbdl10.86.773.7bdl10.11.9bdl103.2
17 bdlbdlbdlbdl71.72.512.84.46.197.5
18 bdlbdlbdlbdl80.26.910.81.60.9100.4
19 bdlbdlbdlbdl92.9bdl8.80.7bdl102.4
20 bdlbdlbdlbdl92bdl8.60.7bdl101.3
21 bdlbdlbdlbdl66.712.811.30.711.3102.8
Atomic Proportions (per a Total of 100 at. %)
#RuOsIrRhPtPdFeNiCuΣPGE/(Fe + Ni + Cu)
10.70.64.3072021.20.11.13.46
21.70.24.48.463.3018.90.42.63.57
31.80.34.76.963.9020.60.21.63.46
41.41.83.86.865.3016.104.83.77
51.22.24.3764.3016.504.43.79
64.125.81.666.6017.50.32.14.03
700.18.10.463.90.425.11.70.32.69
800.16.90.464.20.425.61.90.52.58
900.19.10.363.20.325.11.60.32.7
100.20.17.90.664.1024.71.80.62.69
110.20.26.812.253024.52.10.92.63
12006.15.448.40308.31.91.49
130015.54.947.2026.16.302.08
14007.810.948.5026.66.302.04
15003.23.645.31.431.512.131.15
16007.99.153025.44.502.34
17000046.53299.512.10.98
18000057.89.127.23.822.03
19000073.8024.41.802.81
20000074024.21.902.84
2100004014.123.71.420.81.18
Note: Results of WDS (# 1–11) and scanning-electron microscopy (SEM)/EDS (# 12–21) analyses are quoted in weight percent; bdl is below detection limit, and PGE is platinum-group elements. The atomic proportions are based on a total of 100%. Numbers 1–11, 19, and 20 represent isoferroplatinum or ferroan platinum; # 12–14, 16, and 18 are Pt–Fe alloy (“Pt2Fe”-type); # 15 refers to a member of the tetraferroplatinum–ferronickelplatinum series; # 17 pertains to tetraferroplatinum; and # 21 corresponds to tulameenite (Pd-bearing).
Table 4. Compositions of amphibole inclusions hosted by grains of platinum-group minerals in the Sisim placer zone, Eastern Sayans.
#SiO2TiO2Al2O3Cr2O3FeOMnOMgOCaONa2OK2OTotal
145.921.210.280.166.590.1418.1510.562.030.1595.18
245.830.848.270.187.950.219.048.381.530.1192.33
344.311.6310.260.2711.780.1714.9710.20.610.2294.42
443.611.629.910.212.050.2214.710.490.70.2193.71
547.04110.340.1710.630.1914.318.161.040.0292.9
648.631.028.20.2111.320.3413.4811.930.730.8496.7
748.371.513.320.289.90.1810.289.022.171.0696.08
844.391.7510.10.912.060.1613.25.683.640.2592.13
948.671.7213.60.126.780.187.8113.812.380.3895.45
1051.111.314.40.136.650.178.4512.182.40.3897.17
Atomic Proportions (O = 23)
#Si[4]AlAlFe3+TiCrFe2+MnMgCaNaKMg#
16.681.320.4400.130.020.80.023.941.650.570.0382.8
26.841.160.290.20.090.020.80.034.241.340.440.0283.6
36.581.420.370.440.180.031.020.023.311.620.180.0476.1
46.541.460.290.550.180.020.970.033.291.680.20.0476.7
57.020.980.8300.110.021.330.023.181.30.3<0.0170.2
67.10.90.5200.110.021.380.042.941.870.210.1667.4
76.991.011.2600.160.031.20.022.221.40.610.264.5
86.811.190.6300.20.111.550.023.020.931.080.0565.8
97.040.961.3600.190.010.820.021.692.140.670.0766.8
107.180.821.5700.140.010.780.021.771.830.650.0768.9
Note: Results of WDS analyses are quoted in wt %; bdl is “below detection limit”. Numbers 1, 3, 4, and 6 pertain to magnesio-hornblende; # 2, 5, 7, and 8–10 correspond to edenite. The atomic proportions are based on 23 oxygen atoms per formula unit, a.p.f.u. (O = 23).
Table 5. Compositions of inclusions of REE- and Ti-rich minerals hosted by grains of platinum-group minerals from the Sisim placer zone, Eastern Sayans.
#P2O5SiO2TiO2Al2O3Cr2O3Ce2O3La2O3Sm2O3Nd2O3Pr2O3FeOCaONa2OTotal
128.52bdlbdlbdlbdl24.9112.42bdl8.382.22bdl2.83bdl79.3
230.93bdlbdlbdlbdl2414.841.099.912.711.223.13bdl87.8
3029.7737.220.460.12bdlbdlbdlbdlbdl0.6526.810.0695.1
Atomic Proportions
#PSiTiAlCrCeLaSmNdPrFeCaNaΣ(REE + Ca)
11.0800000.410.200.130.0400.1400.92
21.0600000.360.220.020.140.040.040.14<0.010.94
301.020.960.02<0.01000000.020.9901.01
Note: Results of SEM/EDS analyses are quoted in wt %; bdl is below detection limit. Numbers 1 and 2 pertain to monazite-(Ce); analysis # 3 corresponds to titanite. Atomic proportions are calculated per 4 oxygen a.p.f.u. for monazite-(Ce) and per 5 oxygen a.p.f.u. for titanite. Zero stands for “not detected”.
Table 6. Compositions of various platinum-group minerals from the Sisim placer zone, Eastern Sayans.
#MineralRuOsIrRhPtPdFeNiCoCuSAsSbTotal
1Mertieite-IIbdlbdlbdlbdlbdl72bdlbdlbdlbdlbdl3.4823.599
2bdlbdlbdlbdlbdl71.86bdlbdlbdlbdlbdl3.523.2898.6
3Hollingworthite0.950.295.8931.1413.2bdl0.850.03bdlbdl9.8234.58bdl96.8
43.030.7318.2417.515.95bdl0.10.06bdlbdl10.7831.3bdl97.7
5Cherepanovite3.51bdl2.147.115bdl0.130.02bdlbdl3.1339.62bdl100.6
62.73bdl2.645.526.27bdl0.060.02bdlbdl3.4339.41bdl100
7Laurite
(Fe–Ni-rich)
31.5bdl4.96.9bdlbdl9.18.9bdl2.736.4bdlbdl100.4
8Laurite
(As-rich)
46.83.73bdlbdlbdl1.10.61.8bdl22.123.4bdl102.5
9Kashinitebdlbdl77.80.7bdlbdlbdlbdlbdlbdl22.5bdlbdl101
10Kashinite
(Cu-rich)
bdlbdl64.5bdlbdlbdl3.7bdlbdl6.424.6bdlbdl99.2
Atomic Proportions
# RuOsIrRhPtPdFeNiCoCuSAsSb
1 000008.12000000.562.32
2 000008.13000000.562.3
3 0.02<0.010.080.760.1700.04<0.01000.771.160
4 0.080.010.250.450.220<0.01<0.01000.891.10
5 0.0600.020.790.040<0.01<0.01000.170.910
6 0.0500.020.770.060<0.01<0.01000.190.920
7 0.4900.040.11000.260.2400.071.8900
8 0.890.040.0300000.020.0601.330.60
9 001.820.030000003.1500
10 001.320000.26000.43.0200
Note: Results of WDS (# 1–6) and SEM/EDS (# 7–10) analyses are quoted in weight %; bdl is below detection limit. Numbers 1 and 2 pertain to placer grain. Numbers 3–10 pertain to inclusions hosted by grains of PGE alloy minerals. The atomic proportions are based on a total of 11 a.p.f.u. for mertieite-II, 3 a.p.f.u. for hollingworthite and laurite, 2 a.p.f.u. for cherepanovite, and 5 a.p.f.u. for kashinite.
Table 7. Compositions of laurite–erlichmanite inclusions hosted by grains of PGE alloy minerals in the Sisim placer zone, Eastern Sayans.
#RuOsIrRhPtFeNiSAsTotal
114.9145.5810.79bdlbdlbdl0.0228.49bdl99.79
249.166.675.790.82bdl0.010.0136.01bdl98.47
31.757.7514.09bdlbdl0.240.226.020.17100.17
434.2422.28.710.66bdlbdlbdl32.940.0898.83
546.179.556.80.34bdlbdl0.0435.310.0898.29
628.827.89.8bdlbdlbdlbdl34.2bdl100.6
735.620.68bdlbdlbdlbdl35.3bdl99.5
857.31.92bdlbdlbdlbdl37.9bdl99.1
94.4434.3931.630.330.090.28bdl26.43bdl97.6
103.4644.4626.6bdlbdlbdlbdl24.580.8699.96
Atomic Proportions (per a Total of 3 a.p.f.u.)
#RuOsIrRhPtFeNiSAs
10.330.540.130000.00120
20.870.060.050.0100020
30.040.750.18000.010.00820.006
40.660.230.090.010002.010.002
50.830.090.060.01000.00120.002
60.550.280.100002.070
70.660.20.0800002.060
80.960.020.02000020
90.110.440.40.01<0.010.01 2.020
100.090.590.3500001.940.03
Note: Results of WDS (# 1–5 and 9) and SEM/EDS (# 6–8) analyses are quoted in weight %.; bdl is below detection limit. Analyses # 1–8 pertain to inclusions of members of the laurite–erlichmanite series, which are hosted by grains of PGE alloy minerals from the Sisim placer zone (this study). Numbers 9 and 10 represent unusual phases of erlichmanite that are anomalously enriched in Ir, which were collected at Sisim (# 9, this study) and at Rudnaya, Eastern Sayans (# 10) [4].
Table 8. Compositions of monosulfide- and pentlandite-type inclusions hosted by grains of PGE alloy minerals in the Sisim placer zone, Eastern Sayans.
#RuOsIrRhPtPdFeNiCoCuSTotal
1bdlbdl0.9512.690.250.0223.4929.260.260.4130.6598
2bdlbdl0.5712.250.130.1524.2330.110.20.2330.0297.9
36.98bdl0.8810.34bdlbdl20.5425.03bdl0.8131.1495.7
4bdlbdlbdl11.5bdlbdl18.733.1bdlbdl32.195.4
5bdlbdlbdl11.7bdlbdl19.334bdlbdl33.898.8
6bdlbdlbdl11.3bdlbdl19.533.7bdlbdl3498.5
7bdlbdlbdl10.5bdlbdl24.731bdlbdl34.6100.8
8bdlbdl3.110.2bdl122.325.6bdlbdl34.496.6
9bdlbdlbdl10.8bdlbdl2332.1bdlbdl33.999.8
10bdlbdlbdl12.1bdlbdl18.935.3bdlbdl34.9101.2
1131.5bdl4.96.9bdlbdl9.18.9bdl2.736.4100.4
12bdlbdlbdl11.4bdlbdl2428.7bdlbdl33.597.6
13bdlbdl2.729.6bdlbdl11.620.1bdl1.931.997.8
14bdlbdl2.629.8bdlbdl10.920.4bdl2.332.598.5
15bdlbdl27.410.24.5bdl9.613.7bdl5.928.8100.1
161.513.4267.65.5bdl7.310.1bdl5.223.5100.1
172.7bdl27.111.8bdlbdl10.911.5bdl6.330.5100.8
18bdlbdl64.5bdlbdlbdl3.7bdlbdl6.424.699.2
Atomic Proportions (per a Total of 100 at. %)
#RuOsIrRhPtPdFeNiCoCuSMe/S
1000.26.10.060.0120.924.70.20.347.41.11
2000.15.90.030.0721.525.50.20.246.51.15
33.500.25.10018.821.800.749.81.01
40005.60016.6280049.81.01
50005.40016.527.70050.40.99
60005.20016.727.40050.70.97
70004.70020.624.50050.20.99
8000.84.900.4619.621.50052.80.89
90004.90019.425.80049.91.01
100005.50015.8280050.70.97
1116.401.33.5008.6802.259.90.67
120005.30020.723.60050.40.99
13000.715.30011.118.201.6530.89
14000.715.30010.318.301.953.50.87
15008.661.39010.31405.654.10.85
1614.99.45.11.9609.111.905.750.90.96
171.508.26.70011.311.405.855.20.81
180026.40005.2007.960.40.65
Note: Results of WDS (# 1–3) and SEM/EDS (# 4–18) analyses are quoted in wt %; bdl is below detection limit.

