Abstract
The Shah-Ali-Beiglou epithermal base metal-silver deposit is located in the Tarom-Hashjin metallogenic province (THMP) in northwestern Iran. This deposit is hosted by quartz monzonite dikes of Oligocene age and surrounded by andesite to trachyandesite volcanic and volcaniclastic rocks of Eocene age. The subvolcanic rocks in the study area vary in composition from quartz-monzonite to monzonite and have metaluminous, calc-alkaline to shoshonitic affinity. These rocks have I-type geochemical characteristic and are related to post-collisional tectonic setting. The mineralization occurs as NE-SW and E-W-trending brecciated veins controlled by strike-slip and normal faults, which are associated to the Late Oligocene compressional regime. The mineral paragenesis of the vein mineralization is subdivided into pre-ore stage, ore stage, post-ore stage, and supergene stage. Pre-ore stage is dominated by quartz, sericite, and subhedral to anhedral pyrite as disseminated form. Ore-stage is represented by quartz, sphalerite (from 0.1 mol % to 4 mol % FeS), galena, chalcopyrite, tetrahedrite-tennantite, minor seligmannite and enargite, as vein-veinlet, cement and clast breccias. Post-ore stage is defined by deposition of quartz and carbonate along with minor barite, and supergene stage is characterized by bornite, chalcocite, covellite, hematite, goethite, and jarosite. The ore mineralization is associated with the silicic alteration. The styles of alteration are silicic, carbonate, sericitic, chloritic, and propylitic. Fluid inclusions in sphalerite have a wide range of salinities between 0.35 wt % and 21.4 wt % NaCl equivalent and homogenization temperatures range from 123 to 320 °C. The isotopic values of sulfides vary from 2.8‰ to 6.7‰ suggesting a magmatic source for the sulfur. In the present study, based on geological setting, alteration style of the host and wall rocks, main textures, mineral assemblages, composition of ore minerals, and structural features, it is suggested that the mineralization in the Shah-Ali-Beiglou is similar to intermediate-sulfidation style of epithermal deposits.
1. Introduction
A great number of important porphyry, epithermal, and base metal ore deposits are formed in the Tethyan Eurasian Metallogenic Belt (TEMB) [1,2,3,4]. In the Iranian part of the TEMB, Eocene and Oligocene base metal vein-type deposits formed in three belts: 1. Alborz-Azarbaijan Magmatic Belt (AAMB); 2. Urumieh-Dokhtar Magmatic Belt (UDMB); and 3. Iran East Magmatic Assemblage (IEMA) (Figure 1) [5,6,7].
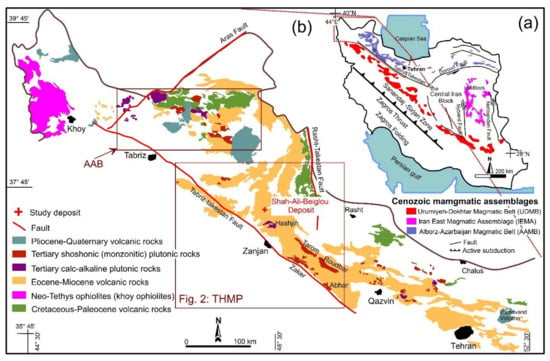
Figure 1.
(a) Distribution of the Cenozoic magmatic assemblages in Iran [6]; (b) Geological schematic map showing the main rock units and structures of the Alborz-Azarbaijan magmatic belt, the location of the Ahar-Arasbaran belt (AAB) and Tarom-Hashjin magmatic province (THMP), and the location of the study area in NW Iran; reproduced with permission from [21], published by Elsevier B.V., 2013.
The magmatic activity of the AAMB in the NW Iran initiated after Late Cretaceous compressional deformation related to the initial collision of the Arabia and Eurasia plates (e.g., [8,9,10,11]). The AAMB occurred in an extensional tectonic setting during Late Paleocene-Eocene [12,13]. The northwestern part of the AAMB includes two mineralized subzones named the Ahar-Arasbaran Belt (AAB) in the north and the Tarom-Hashjin metallogenic province (THMP) in the south (Figure 1) [2,3]. The THMP is known as an economically important metallogenic province in Iran [2,14,15] and includes a variety of mineral deposits such as Mn deposits, iron-skarns, manto-type Cu-Ag deposits, and Zn–Pb–Cu±Au–Ag epithermal deposits [3,16,17,18,19]. All of these deposits are variably attributed to post-collisional magmatic processes (e.g., [20,21,22]). The study area is located approximately 70 km north of Zanjan (Figure 1). This deposit has long been known and numerous mining activities have been carried out in different periods of time in the study area. The veins have an average grade of 3% Zn, 7% Pb, 1.1% Cu, and 24 g/t Ag.
The Shah-Ali-Beiglou deposit is hosted by the intermediate subvolcanic rocks occurring in a breccia zone. In the present study, the inductively coupled plasma mass spectrometry (ICP-MS) method has been applied for the lithogeochemical studies and electron probe micro analyzer (EPMA) has been used for the geochemical studies. In addition, fluid inclusion and sulfur isotopic methods have been applied in order to determine the composition and temperature of hydrothermal fluids, and the origin of the sulfur in hydrothermal fluids, respectively. Also, through field geology, ore microscopy, mineral geochemistry, and the paragenetic relationships of ore minerals, the ore genesis of the Shah-Ali-Beiglou Zn-Pb-Cu-Ag deposit will be clarified.
2. Regional Geology
Alborz-Azarbaijan Magmatic Belt (AAMB), in the north of Iran, extends about 800 km, in NW-SE direction (Figure 1a) [23]. The AAMB is located in the hinterland of the Arabian-Eurasia collision zone in the TEMB [1,3]. The AAMB is an important structural zone of the Alpine-Himalayan range, situated 200–500 km north of the Neotethys suture. It forms the easternmost portion of the Pontides Arc-Lesser Caucasus-AAMB belt in the Turkish–Iranian high plateau [24]. This magmatic belt is divided into western and eastern parts. The eastern part consists of mafic and felsic tuff and lava with an alkaline to shoshonitic affinity [14,22,25,26], whereas the western part consists of andesitic to dacitic lava flows and many calc-alkaline to shoshonitic granitoid bodies [3]. Magmatic activities that occurred in the AAMB and Urumieh-Dokhtar Magmatic Belt (UDMB) during the Cenozoic, are the most significant events in the magmatic history of Iran [9,10,27]. Extensive magmatic episodes have occurred in the AAMB as a result of subduction, collision and post-collisional extension [21,22,28]. High-angle subduction in the northwestern part of Iran caused the development of an extensional tectonic regime in the Alborz-Azarbaijan belt [1,14]. This extensional tectonic regime leads to the formation of a sialic back-arc oceanic basin (Khoy Basin). The collision of the extensional back-arc basin with the active continental margin of Iranian plate, occurred during the Laramide Phase (Late Cretaceous-Paleocene).
As a consequence of this collision, the Arabia and Eurasia Plates welded together and the Neotethys Sea was eliminated completely. The extensional sialic back-arc basin was pressured after the closure of the main oceanic basin, and most likely, this basin without subduction and along with the activity of numerous faults, underwent shortening, compression, and ultimately was crumbled. After the complete closure of the oceanic basin of Neotethys and the sialic back-arc basin which was followed by the crustal uplifting, the basement fractures were activated in the Central Iran margin and in different parts of it [14]. The partial melting occurred due to the crustal extension and reduction of pressure in the metasomatised mantle beneath the continental crust, and following these events, conditions for the Tertiary magmatism of UDMB and AAMB were provided [14]. The first significant volcanoes in AAMB are related to the Upper Cretaceous [29], but significant volcanic activity, mainly submarine, is emerged in the Eocene. The AAMB hosts Sungun Cu-Mo, Kighal Cu-Mo, and Sonajil Cu porphyry deposits [30,31,32], Anjerd, Sungun, and Mazraeh Cu skarn deposits [33,34], Au-Ag epithermal occurrences and several base metal vein-type deposits [3,35]. The northwestern part of this belt is subdivided into Ahar-Arasbaran metallogenic province (AAP) in the north and Tarom-Hashjin metallogenic province (THMP) in the south (Figure 1a) [3]. The magmatic activity of the THMP as a part of the AAMB continued after the Laramide compressional phase and due to post-collision extensional phase in the late Paleocene-Late Eocene. As a result of a change in the regime of extensional to compressional in the early Oligocene-Miocene, volcaniclastic rocks have been folded and granitoid intrusive bodies have been intruded in the axis of the folds (anticlines) [14].
THMP with 70–150 km wide and 300 km long hosts several epithermal Ag-Au and base-metal deposits including: low-sulfidation (Chargar, Nikuyeh), intermediate-sulfidation (Aqkand, Glojeh), and high-sulfidation (Chodarchay, Khalifehlu) deposits (Figure 2; Table 1) [2,3,18,35,36]. Moreover, it hosts many iron oxide-apatite deposits (including Sorkheh-Dizaj, Aliabad, Morvarid and Zaker; [22,25,37]. All of these deposits were formed in a post-collisional environment, as a result of the Tertiary magmatism with the NW-SE strike within an arc tectonic setting [11,14,27,38,39,40]. Tertiary volcanic and plutonic rocks cover large areas and are the dominant lithology in the THMP (Figure 2). This metallogenic province is characterized by a thick sequence of early to middle Eocene green submarine tuffs (equivalent to the Karaj Formation in Central Alborz) which are followed by the flows of submarine lava to the subaerial [38,41,42]. THMP has experienced different tectonic regimes from extensional (Late Paleocene-Early Oligocene) to compressional (Early Oligocene to Miocene) [14]. This structural inversion could have affected the spatial and temporal distribution of the ore deposits across the metallogenic province. It might have also caused overprinting of different mineralization systems over the early porphyry deposits formed during Early Paleocene-Eocene arc-related magmatism [35].
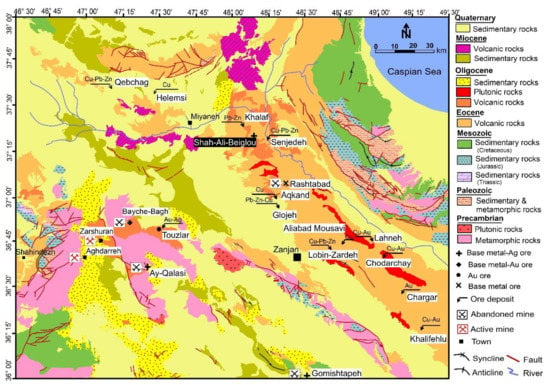
Figure 2.
Simplified geological map of the central part of AAMB in NW Iran (based on 1:250,000 geological maps of Bandar-e-Anzali [43], Takab [44], Zanjan [45], and Miyaneh [46] provided by Geological Survey of Iran), showing the locations of the study area and some of the base metal-Ag, base metal-Au, and Au deposits. Reproduced with permission from Geological Survey of Iran.

Table 1.
The main features of epithermal deposits in the Tarom-Hashjin Metallogenic Province a.
3. Materials and Methods
More than 70 samples have been taken from of the surface outcrops at two levels, one series from an altitude of 1350 m and the second series from 1150 m in the Shah-Ali-Beiglou Valley.
The samples were prepared as polished, thin and, thin-polished sections in order to identify minerals of interest and to establish textural relations by using reflected-light microscopy. These sections were prepared at the University of Tabriz.
The chemical compositions of ore minerals were determined by Electron Microprobe Analyses (EPMA) carried out at the Iranian Mineral Processing Research Center (IMPRC) in Karaj, Iran. Mineral compositions were determined by a Cameca SX-100 microprobe, with 20 kV accelerating voltage, 20 nA beam current, and with a beam diameter less than 1 µm. A combination of various mineral and metal standards was used with ZAF matrix corrections by means of CITZAF version 3.03. The analytical limits are in the order of 0.01 wt %. From the thin-polished and polished sections containing ore minerals, 15 samples were selected for electron microprobe analyses. Minerals were analyzed for S, Cu, Fe, Pb, Zn, As, Sb, Ag, Au, Bi, Cd, Se, Te, Mn, Co, Ni, In, and Hg concentrations and the detection limit for these elements are as following: 433, 401, 1113, 441, 630, 789, 775, 445, 519, 364 ,656, 561, 591, 393, 1705, 1026, 390, and 435 ppm, respectively. The calibration standards are as following: S: Chalcopyrite-S097.calDat, Cu: Chalcopyrite-Cu094.calDa, Fe: Specularite-Fe088.calDat, Pb: Galena-Pb054.calDat, Zn: Sphalerite-Zn074.calDat, As: GaAs-As052.calDat, Sb: Indium Antimonide-Sb042.calDat, Ag: Hessite-Ag060.calDat, Au: Au-1-Au074.calDat, Cd: Greenockite-Cd030.calDat, Se: Se-Se004.calDat, Te: Hessite-Te028.calDat, Mn: Rhodonite-Mn084.calDat, Co: Co-Co056.calDat, Ni: Nickel Oxide-Ni060.calDat, and In: Indium Antimonide-In017.calDat.
Major, trace and rare earth element (REE) concentrations of nine samples from the subvolcanic rocks (monzonite and quartz monzonite stock) and major vein were determined by ICP-MS method. The location of the samples was indicated in Figure 3. The elements were analyzed by (ICP-MS) with a HP-4500 system at the IMPRC, in Karaj, Iran, following digestion in HF + HNO3 solution, drying and second dissolution in 3 mL HNO3 and later 3 mL HCl. The average precision and accuracy for most of the elements fall in the range of 5%–10%, and they were controlled by repeated analyses of the SARM-1 (granite) and SARM-4 (norite) international rock standards. Qualitative analyses of the prospect samples were performed using SEM–EDX in University of Tabriz. SEM–EDX microanalysis were carried out using a FE SEM/MIRA3 FEG at the Center laboratory of University of Tabriz. Doubly polished thin sections (150–200 μm thick) were prepared from 12 samples taken from quartz-sulfide, quartz-sulfide-carbonate, and sulfide-quartz veins and breccias. No suitable fluid inclusions were found for microthermometric measurements in quartz and carbonate. Therefore, microthermometric measurements of the fluid inclusions were performed only on 3 doubly polished wafers containing sphalerite, using a Linkam THMSG-600 heating-freezing stage at the Department of Geology, University of Tabriz, Tabriz, Iran. Salinities were expressed as wt % NaCl equiv. and were calculated from measured last ice-melting temperatures using the equation of Hall et al. [49], in the two-phase liquid-rich fluid inclusions.
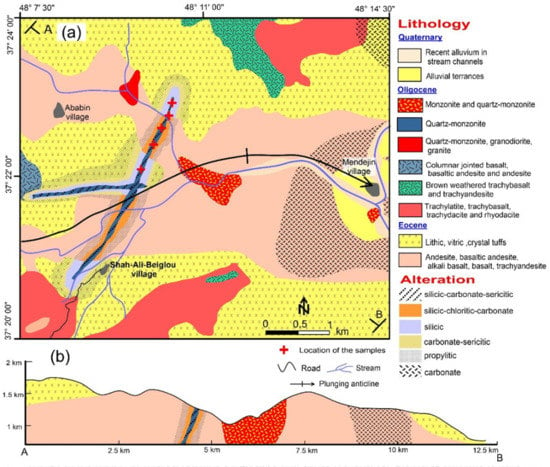
Figure 3.
(a) Geological map of the Shah-Ali-Beiglou showing the rock units and ore-bearing veins, revised and modified based on the new field data from 1:100,000 geological map of Hashjin provided by Geological Survey of Iran; (b) Schematic cross-sections showing ore-bearing vein at the contact of andesite-basalt lavas. Reproduced with permission from Faridi and Anvari [50], published by Geological Survey of Iran, 2000.
Sulfur isotopic compositions were analyzed at the Isotope Laboratory of the University of Ottawa, Ottawa, Canada. Samples are weighed into tin capsules and loaded into an Isotope Cube (Elementar) elemental analyser to be flash combusted at 1800 °C. Released gases are carried by helium through the EA to be cleaned, then separated. SO2 gas is carried into the Delta Plus XP isotope ratio mass spectrometer (Thermo Finnigan) via a conflo IV interface for δ34S determination. Analytical precision is about ±0.2‰.
4. Results
4.1. Local Geology and Tectonic Structures
The Shah-Ali-Beiglou area is situated in the northwestern part of the THMP and comprises a sequence of Eocene and Oligocene volcanic and volcaniclastic rocks, which were intruded by Oligocene plutonic rocks (Figure 3). The Shah-Ali-Beiglou deposit consists of two base metal-bearing veins that occupy strike-slip and normal faults in intrusive rocks (Figure 3). The veins display similar morphological and textural characteristics, and have regular sharp contact with volcanic and volcano-sedimentary rocks.
Three major lithological units are recognized in the Shah-Ali-Beiglou mining district: (1) Eocene volcanic and volcaniclastic rocks; (2) Early Oligocene volcanic rocks; and (3) Late Oligocene subvolcanic rocks. Eocene lava flows have columnar structure beneath the volcaniclastic rocks and occasionally as interlayers in the volcaniclastic rock unit (Figure 4a,b). The composition of the lavas varies from andesite, basaltic andesite, alkali basalt, basalt, and trachyandesite. Andesite-basalt lava contains plagioclase (Pl), pyroxene (Px), and amphibole (Amp), phenocrysts in a matrix of plagioclase and pyroxene (Figure 4d) and shows glomeroporhyritic texture (Figure 4e). Volcanic activity at Shah-Ali-Beiglou was largely explosive and consists of volcaniclastic rocks with andesitic compositions. The volcaniclastic rocks are marked by alkaline to intermediate tuffs with interlayered andesite-basalt lava (Figure 5a,b). The volcaniclastic rocks with the dominant texture of crystalloclastic are characterized by crystal tuffs, vitric tuffs, and lithic tuffs. These tuffs are mostly composed of quartz, pyroxene and plagioclase phenocrysts along with secondary carbonate minerals and glass. Opaque minerals and chlorite are observed as accessory phases. Some of crystal tuffs have banded texture which show successive bands of Fe oxide-hydroxides (hematite and goethite), altered pyroxene and feldspar along with quartz (Figure 5c,d). Early Oligocene volcanic rocks are underlain by the tuffs with an angular unconformity (Figure 6a) and are composed of trachy-latite, trachy-basalt, tracy-dacite, and rhyodacite. There are some xenoliths in the trachy-latitic rocks that contain an assemblage of carbonate, quartz, tremolite-actinolite, and goethite (Figure 6b). Olivine crystals in trachy-basalt rocks have undergone two alteration phases due to hydration and oxidation. In the first phase, they were altered into serpentine and in the second phase to anthophyllite and iddingsite. The center of some of these alterations is filled with silica (Figure 6c). Volcanic and volcaniclastic sequences, during the late Oligocene, have been intruded by small intrusions of monzonite to quartz monzonite (Shah-Ali-Beiglou Stock). The mineralogy of these rocks includes plagioclase (from 35% to 40%), potassium feldspar (from 25% to 30%), quartz (from 10% to 15%), amphibole (from 10% to 15%), and accessory minerals including biotite (from 2% to 5%), sphene, apatite, zircon, pyrite, and goethite. Tourmaline is observed as both primary and secondary. The texture of the stocks varies from granular to porphyritic with microcrystalline matrix.
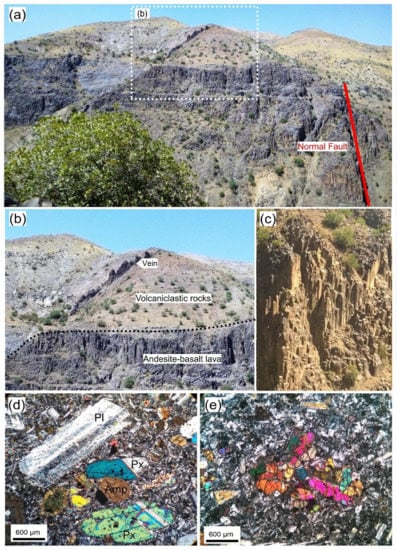
Figure 4.
Field photographs and photomicrographs of Shah-Ali-Beiglou area: (a,b) Outcrop of ore-bearing vein, volcaniclastic rocks, and andesite–basalt lava; (c) Columnar structure in andesite–basalt lava; (d) Porphyric texture consisting of phenocrysts of plagioclase (Pl), pyroxene (Px) and Amp (Amp) in the matrix of microcrystalline plagioclase and clinopyroxene; (e) Glomeroporhyritic texture of pyroxene crystals in a fine grained matrix of plagioclase and pyroxene crystals in andesite-basalt lava.
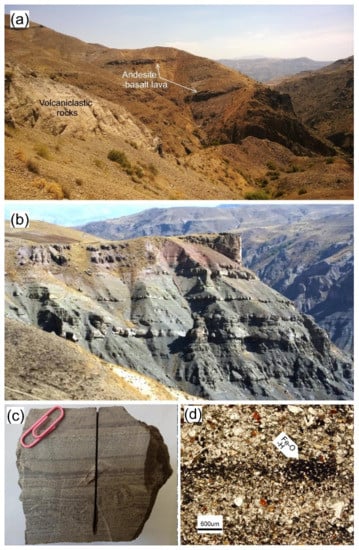
Figure 5.
Field photographs and photomicrographs of Shah-Ali-Beiglou area: (a) Eocene lava flows occurring as interlayers in the volcaniclastic rock unit; (b) Outcrop of volcaniclastic rocks containing thin-bedded texture; (c) Hand sample of crystal tuff with banded texture; (d) Crystal tuffs with banded texture (PPL). Fe-O-H: Fe-Oxide-Hydroxide.
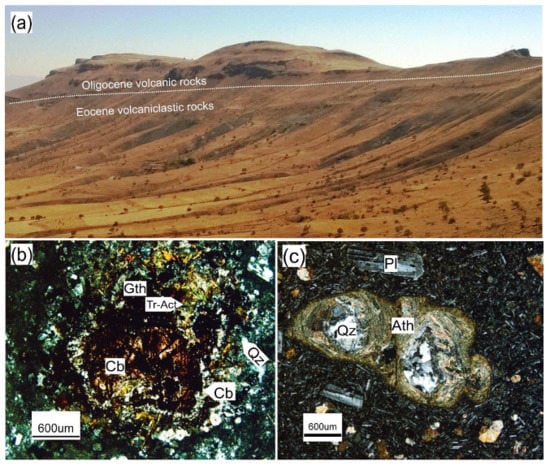
Figure 6.
Field photograph and photomicrographs of Shah-Ali-Beiglou area: (a) The unconformable contact of Eocene volcaniclastic rocks and Oligocene lavas in south of the study area; (b) A xenolith in trachylatite rock that is altered to an assemblage of carbonate, quartz, tremolite-actinolite (Tr-Act), and goethite (Gth) minerals (crossed-polarized light); (c) The second phase of the alteration in a trachy-basalt rock in which the serpentine resulted from the olivine (in the first phase), is altered to anthophyllite (Ath) filled with quartz (Qz) (crossed-polarized light).
Tectonic structures in the study area include folds and faults. The compressional forces in the Oligocene have resulted in folding and extensive fractures. The formation of these fractures has created open spaces as the passway for hydrothermal solutions. The presence of ore-bearing zones, in the same trend with the fault zones, can indicate that mineralization is controlled by fault systems. Two types of faults with the NE-SW (strike-slip fault) and E-W (normal fault) trends have been expanded parallel and perpendicular to the axis of the fold. The quartz monzonite dikes and associated base metal mineralization at Shah-Ali-Beiglou were emplaced in strike-slip and normal fault zones.
4.2. Petrogenesis and Tectonic Setting of the Subvolcanic Intrusion in the Shah-Ali -Beiglou Area
There is a subvolcanic intrusion in the east of the ore-bearing veins, which is referred as the Shah-Ali-Beiglou stock (Figure 3). This intrusion is of interest because it is considered as the most representative intrusive rocks related to the hydrothermal system. The composition of these rocks is monzonite to quartz monzonite (Figure 7a). This stock exhibits a range in SiO2 contents from 57.23 wt % to 67.78 wt %, the K2O + Na2O contents from 6.97 wt % to 9.30 wt %, and the K2O/Na2O ratios from 0.90 to 1.87 (Table 2). Overall, the rocks exhibit metaluminous character with ASI [= molar Al2O3/(CaO + K2O + Na2O)] ranging from 0.77 to 0.96 (Figure 6b). The majority of the analyzed samples show I-type affinity except two samples plotting within the A-type field (Figure 7c). In addition, they mostly show a calc-alkaline to shoshonitic affinity in the Zr–SiO2 diagram (Figure 7d). In order to distinguish tectonic setting of the stock, Y–Zr [51] diagram was used (Figure 7e), which was plotted in the arc related field. According to Zr × 3-Nb × 50-Ce/P2O5 tectonic-discrimination diagram presented by Muller and Groves [51], samples were plotted within the post-collisional arc field (Figure 7f). Therefore, it is suggested that this stock was formed in an arc-related setting that has developed in a post-collisional environment. In primitive mantle-normalized multi-element diagram (Figure 8a) [52], all the samples display approximately similar trace element abundance patterns, with enrichment in large-ion lithophile elements (LILEs) (e.g., Ba, Cs, Rb, Th, and K) and depletion in high field strength elements (HFSEs), associated with pronounced negative anomaly in Ti. The studied samples are characterized by robust negative Ti anomaly (Figure 8a) implying that the samples were not derived from normal MORB or OIB mantle sources which typically display positive Ti anomalies in chondrite-normalized trace element diagrams (e.g., [53]). The depletion in Ti can be explained by retention of Ti in Ti-rich residual mineral phases (i.e., rutile, titanite and titanomagnetite) in the mantle source [54,55]. REE chondrite-normalized diagram (Figure 8b) [56] exhibits pattern with enrichment in LREE and depletion in HREE. They show weakly fractionated HREE ((La/Yb)N = 7.48–14.85), negative Eu (Eu/Eu* = 0.63–0.75) and Ce (Ce/Ce* = 0.08–1.10) anomalies (Table 2).
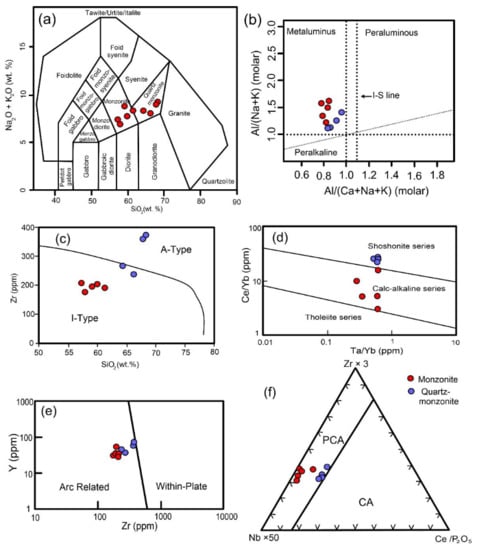
Figure 7.
Geochemical variation diagrams for the Shah-Ali-Beiglou stock. (a) Rock classification diagram [57] for the Shah-Ali-Beiglou stock; (b) Al/Na + K (molar) versus Al/Ca + Na + K that showing all of the samples exhibit metaluminous geochemical characters (after Maniar and Piccoli [58]) diagram; (c) Zr versus SiO2 diagram proposed by Collins et al. [59] that showing most of the samples have I-type geochemical characters; (d) Ce/Yb versus Ta/Yb diagram for the samples with lines separating the tholeiitic, calc-alkaline, and shoshonitic series [60] that showing samples have calc-alkaline to shoshonitic affinity; (e) Y versus Zr diagram [51] that showing samples plot within the arc related field; (f) Zr × 3-Nb × 50-Ce/P2O5 tectonic setting discrimination diagram [51] that showing samples plot within the post-collisional arc field (PCA).

Table 2.
Major and trace element contents from the Shah-Ali-Beiglou stock.
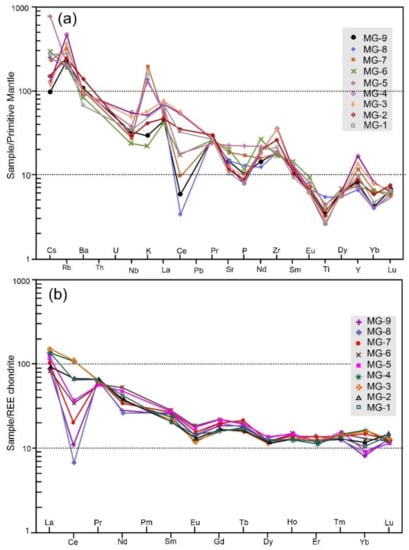
Figure 8.
(a) Primitive mantle-normalized trace elements [52]; (b) chondrite-normalized rare earth elements [56] diagrams for the Shah-Ali-Beiglou stock.
4.3. Features of the Shah-Ali-Beiglou Deposit
The Shah-Ali-Beiglou vein-type deposit is hosted by quartz monzonite dikes. This deposit including two veins which are perpendicular, one vein trending N10°–20° E and another one is trending N70°–80° W with 70°–80° dip (Figure 3). The thickness of one vein varies between 5 and 10 m with the length of 3.5 km, but another one is approximately 2 km in length and has variable thickness of between 2 and 5 m. Ore mineralization occur as vein-veinlet (Figure 9a–c and Figure 10), breccia cement and clast (Figure 11a–f), and disseminated grains (Figure 11b). The vein-veinlet and breccia types contain the most important economic quantities of ore. The field evidences indicate the presence of silica-sulfide, silica-carbonate-sulfide, and carbonate vein-veinlets. Geometrically, these vein-veinlets occur in the vicinity of each other trending parallel and approximately parallel to the host fault zone.
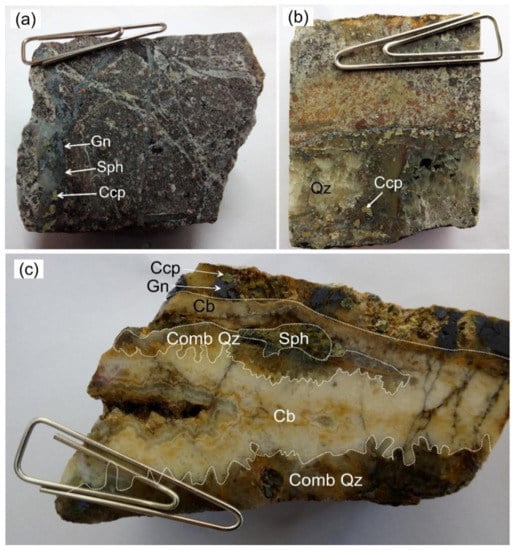
Figure 9.
Photographs of hand samples showing: (a,b) Silica-sulfide vein-veinlets including galena (Gn), sphalerite (Sph), and chalcopyrite (Ccp); (c) Silica-carbonate-sulfide vein containing typical crustiform banding and comb quartz.
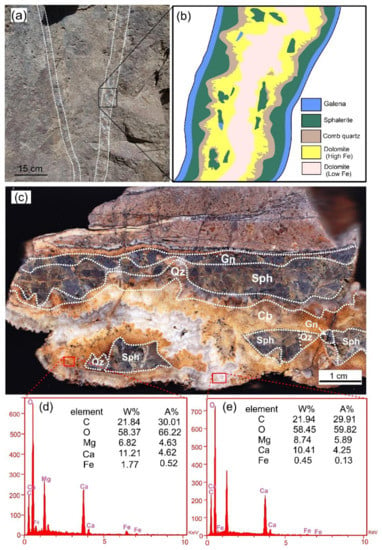
Figure 10.
(a) Close-up view of silica-sulfide-carbonate vein; (b) Schematic representation of silica-sulfide-carbonate vein, illustrating multiple phases of mineral deposition and fracturing events; (c) Photographs of hand sample showing enlarged fractures filled with ore mineral clasts and carbonates; (d) The results of EDX analyses for relatively high Fe dolomite; (e) The results of EDX analyses for relatively low Fe dolomite.
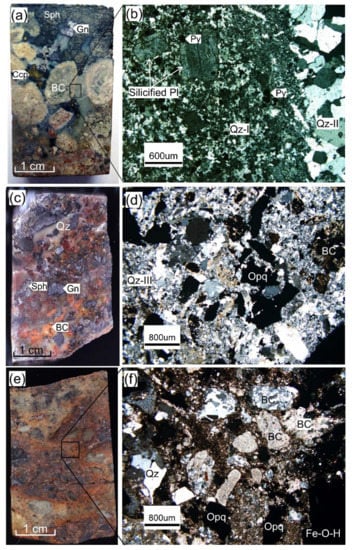
Figure 11.
Representative photographs and photomicrographs of the different breccias in the Shah-Ali-Beiglou deposit (photomicrographs taken under transmitted cross-polarized light images). (a) Breccia-I with rounded clasts in quartz-sulfide cement; (b) Pyrite with dessiminated texture in clasts of Breccia-I; (c) Hand specimens of breccia-II with angular clasts in quartz-sulfide cement; (d) Ore minerals in silica cement occurring as breccia clast; (e) Hand specimens of breccia-III; (f) Breccia-III with rounded to subrounded clasts in carbonate (-Fe-Oxide) cement. (Gn: galena, Sph: sphalerite, Ccp: chalcopyrite, Py: pyrite, Qz: quartz, Cb: carbonate mineral, BC: breccia clast, Pl: plagioclase, Opq: opaque, and Fe-O-H: Fe-oxide-hydroxide).
Some fractures are filled by carbonate during the post-ore stage (Figure 9c and Figure 10c), implying a successive re-opening of veins. The silica-carbonate-sulfide veins show a sequence, from the margin to center, of galena and sphalerite (in contact with the wallrock), followed by ~1 cm dark quartz, then ~5 cm orange dolomite with high Fe and, white dolomite with relatively low Fe at the center (Figure 10). Brecciation plays an important role in the formation of Shah-Ali-Beiglou deposit and is characterized by infilling of sulfides into open spaces. The compositions and morphologies of clasts along with the geometry of the hydrothermal breccia bodies support their emplacement by hydraulic fracturing, which resulted in increased permeability within and around the breccia bodies. Based on the lithology, size, and shape of the clasts, and also composition of cement from numerous outcrops, three breccia types were distinguished consisting of breccia-I, breccia-II, and breccia-III (Figure 11). Breccia-I is the earliest-formed breccia and contains rounded and subrounded clasts of the silicified and sericified host rock which are cemented by fine- to coarse- grained quartz. Sulfide and sulfosalt minerals occur within the clasts and along with silica cement. The Breccia-II is characterized by the presence of abundant silica cement and contains altered angular and subangular sericitized and silicified clasts of the host rock. Ore minerals in this breccia are observed both breccia clast and cement (Figure 11c,d). The breccia-III comprises fragments of ore minerals, host rock, and silica vein, in carbonate and Fe-Oxide-hydroxide cement. The clasts size is up to 6 cm with angular shape which are intensely altered to sericite (Figure 11e,f)., Breccia-III is the final stage of brecciation event in studied deposit.
4.4. Hydrothermal Alteration
In the Shah-Ali-Beiglou deposit, the alteration zones both in the ore-bearing veins and their surrounding zones, are related to the hydrothermal system that caused alteration of the host (quartz monzonite dike) and wall rocks (volcanic and volcaniclastic rocks) during Late Oligocene. Intrusion of quartz monzonite dikes through the strike-slip and normal faults, resulted in the formation of various hydrothermal alteration types including silicic, carbonate, sericitic, chloritic and phrophylitic. Five alteration zones are identified in the study area including (1) silicic-carbonate-sericitic (quartz, calcite, dolomite, sericite, jarosite, sulfide minerals and Fe oxide-hydroxide) within ore zone; (2) silicic-chlorite-carbonate (quartz, chlorite and carbonate minerals); (3) silicic (quartz, carbonate, pyrite and Fe oxide-hydroxide); (4) carbonate-sericite; and (5) propylitic (carbonate minerals, chlorite, epidote, plagioclase, ferromagnesian minerals and Fe oxide-hydroxide). Some of the hydrothermal alterations are overlapped, for example the silicic and carbonate alterations are overlapped within the silicic-carbonate-sericitic alteration zone. Sulfide mineralization is formed within the silicic-carbonate-sericitic alteration zone in quartz monzonite dike. The other alteration zones are developed in the volcanic (silicic-chlorite-carbonate and propylitic alteration zones) and volcaniclastic (silicic, carbonate-sericitic, and propylitic alteration zones) wall rocks (Figure 3). Due to the difference in the chemical composition of the plagioclase minerals that are more sodic in the volcaniclastic rocks and more calcic in the andesite-basalt rocks, so sericitic and carbonate alterations are found in the volcaniclastic and andesite-basalt rocks, respectively. In addition, due to the presence of the ferromagnesian minerals in the andesite-basalt rocks, so chloritic alteration is developed in these rocks.
4.5. Mineralogy and Mineral Chemistry
The primary ore minerals at the Shah-Ali-Beiglou mining district display a large variety of Zn-Pb-Cu(-Ag) sulfide and sulfosalt assemblages dominated by sphalerite, galena, chalcopyrite, tetrahedrite-tennantite, seligmannite, and enargite. In the ore-bearing veins, samples were collected from different ore types including sulfides of vein-veinlets, breccia cement, and dissemination occurring forms. Four main stages of mineralization are identified based on the textural relationships and mineral paragenesis of the ore veins which include pre-ore stage, ore stage, post-ore stage, and supergene stage. The pre-ore stage is characterized by sericitic and silicic alteration associated with the deposition of pyrite-I as isolated grains and veinlets in both of the host rock and wall rocks. The mineralization in ore stage is developed in hydrothermal breccias, and veins. Chalcopyrite, sphalerite, and galena are the most important ore minerals in the silica-sulfide, silica-carbonate-sulfide vein-veinlets, and breccia. Post-ore stage which is marked by carbonate and barite cutting all the earlier mineral phases, and eventually the last stage is defined by formation of supergene minerals. The results of representative electron microprobe analyses of the sulfide phases are reported in Table 3.

Table 3.
Summary of average EPMA data for primary minerals from the Shah-Ali-Beiglou deposit (concentrations in wt %). B.I: Breccia I, V.I: sulfide-silica veinlets, and V.II: silica-sulfide-carbonate vein.
4.5.1. Sphalerite
Sphalerite is the most abundant sulfide mineral in the Shah-Ali-Beiglou deposit. It occurs as vein-veinlet and breccia cement. The margins of sphalerite commonly contain “chalcopyrite disease” which is interpreted the result of replacement due to interaction of sphalerite with solutions, co-precipitation of sphalerite and chalcopyrite, crystal growth by solid state diffusion, and exsolution of CuS in Fe-bearing sphalerite [61,62]. Sphalerite at the Shah-Ali-Beiglou replaces chalcopyrite, pyrite, galena, and is, in turn, replaced by covellite along margins and fractures in the breccia-I and breccia-II (Figure 12a,b). Sphalerite is an important carrier of a wide range of minor and trace elements [63]. The cations at the Shah-Ali-Beiglou substituting Zn sites in the structure of sphalerite, include Fe, Cd, Mn, Ni, Cu, Te, Pb, Hg, and Bi (Figure 13a). Electron microprobe analyses of sphalerite are shown in Table 3. Microprobe analyses reveal Fe content in the sphalerite ranges from 0.06 wt % to 2.28 wt % (avg. 0.84 wt %) implying an Fe-poor nature of the sphalerite. The highest Fe content is measured in the sphalerites of breccia-II and the lowest concentration of Fe occurs within the sphalerite of quartz-carbonate veins.
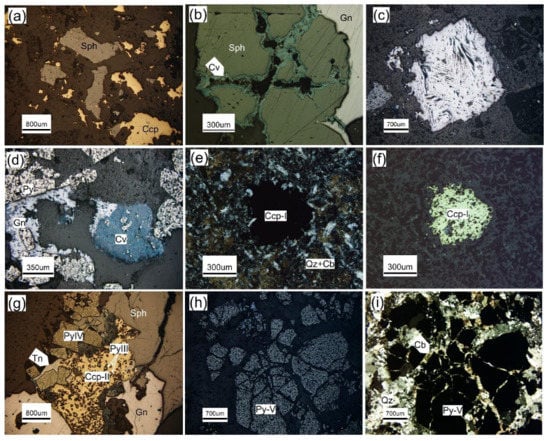
Figure 12.
Photomicrographs of the sulfide minerals from Shah-Ali-Beiglou deposit showing the textural relations among the minerals (images are taken under reflected plane-polarized light, except e and I that are taken under transmitted cross-polarized light). (a) Chalcopyrite (Ccp) crystals are replaced by sphalerite (Sph); (b) Sphalerite is substituted by covellite (Cv) along with borders and fissure planes in the breccia-I; (c) Single grain of galena in silica cement containing undulation and displacement triangular pits in the Breccia-III; (d) Replacement of galena (Gn) by covellite in breccia-I; (e,f) Rounded grain of chalcopyrite in breccia-I; (g) Pyrite-II (Py-II) substituted by chalcopyrite and both of them are substituted by galena and sphalerite; (h,i) Occurrences of coarse-grained pyrite-IV (Py-IV) at contact between quartz and carbonate (Cb).
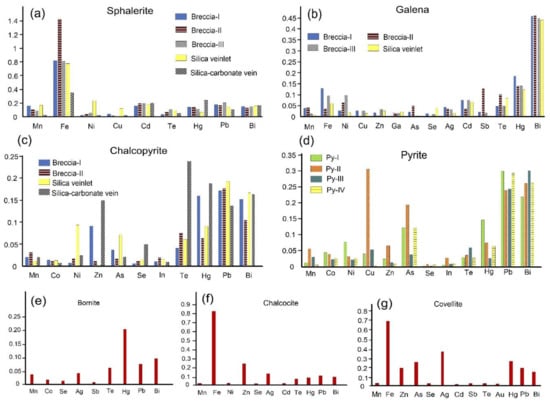
Figure 13.
Histograms showing the average concentrations of the trace elements in different minerals of Shah-Ali-Beiglou deposit: (a) Sphalerite; (b) Galena; (c) Chalcopyrite; (d) Pyrite; (e) Bornite in Breccia-III and silica-sulfide veinlets; (f) Chalcocite in Breccia-III-veinlets; (g) Covellite in Breccia-I and silica-sulfide veinlets (ascribed of ore minerals is based on the texture features; data in wt %).
4.5.2. Galena
Galena is the second most abundant sulfide mineral at the Shah-Ali-Beiglou and occurs as coarse to medium-grained crystals (from <1 to >20 mm). The galena was found approximately to be quite homogenous in composition. Deformation texture is commonly observed in galena within the breccia-III. Undulation and displacement of the curvilinear pits show that plastic deformations developed following deposition of galena (Figure 12c). Galena mainly occurs as breccia cements and vein-veinlet. Galena is formed prior to sphalerite and is substituted by it in silica-sulfide-carbonate veins. Galena is partly to completely replaced by covellite along the borders, cracks, and cleavages in the breccia-I and breccia-III (Figure 12d). Electron microprobe analyses reveal the presence of Mn, Fe, Ni, Cu, Ag, Hg, Fe, Bi, Cd, and As in the structure of galena as trace elements. Ag concentrations are at low levels in all mineralization forms (Table 3). The chemical data show Ag, Hg and Bi contents vary between 0 wt % and 0.11 wt % (avg. 0.02 wt %), 0 wt %–0.44 wt % (avg. 0.12 wt %) and 0.19 wt %–0.66 wt % (avg. 0.44 wt %), respectively.
4.5.3. Chalcopyrite
Chalcopyrite is the most common copper-iron sulfide at the Shah-Ali-Beiglou and is occurring in two generations. Chalcopyrite-I is occurred in minor amounts as rounded grains in breccia clasts (Figure 12e,f) and chalcopyrite-II mostly in vein-veinlets and breccia cement accompanied by quartz-II. Chalcopyrite-II replaces pyrite-II and tiny islands of remnant pyrite are observed within the it. The composition of chalcopyrite is close to stoichiometric. The EPMA data in all of the chalcopyrite grains show the presence of variable amounts of Te (avg. 0.08 wt %), Pb (avg. 0.17 wt %), Hg (avg. 0.12 wt %), and Bi (avg. 0.16 wt %) (Table 3; Figure 13).
4.5.4. Pyrite
Pyrite is one of the common sulfides in the study area which occurs during the pre-ore stage, and ore stage. Pyrite grains have a porous appearance and show a spongy texture (Figure 12h). Based on the mineralogy and texture studies, four pyrite generations are identified at the deposit. The first generation (Py-I) occurs as anhedral crystals along with sericitic alteration within fragments from host rock. The second generation (Py-II) and the first generation of quartz and are found as disseminated fine-grains (up to 400 µm) (Figure 14a) and veinlet in the host (within breccia clast) and wall rocks. The third generation pyrites (Py-III) is the earliest-formed in ore stage and occurs as residual inclusions within chalcopyrite, bornite, covellite and chalcocite in silica-sulfide vein-veinlets and breccia cements. Pyrite-III crystals usually exhibit a sieve texture along with corroded cores including circular assemblages of anhedral pyrite grains (Figure 14f). Pyrite-IV includes coarse-grained euhedral crystals occurring in breccia-III and silica-sulfides veinlets. The pyrite-IV in some of the samples shows breccia texture (Figure 12h,i). The values of Pb (up to 0.49 wt %) and Bi (up to 0.39 wt %) are higher than other trace elements in the pyrite (Table 3; Figure 13). Microprobe analysis shows that pyrites do not contain significant amounts of Cu and Zn. Cu concentrations in pyrite-II are higher than other pyrite generations. Arsenic has low concentrations in the studied pyrite samples, ranging from 0 wt % to 1.7 wt % (avg. 0.12 wt %, n = 52) in all samples (Table 3).
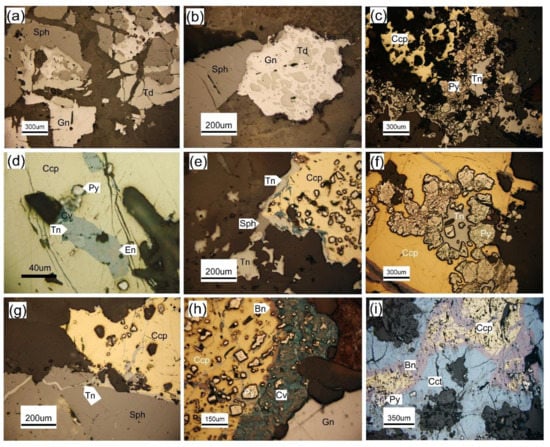
Figure 14.
Photomicrographs of reflected-plain polarized light images of sulfosalt minerals and supergene sulfides from Shah-Ali-Beiglou deposit. (a) Tetrahedrite (Td) accompanied by sphalerite and galena in Breccia-III; (b) Galena is substituted by tetrahedrite in breccia-III; (c) Pyrite is substituted by tennantite (Tn); (d) Occurrence of enargite (En) as a very minor phase associated with tennantite, within chalcopyrite (Ccp); (e) Occurrence of tennantite around chalcopyrite; (f) Tennantite infills cavities of the corroded aggregates of anhedral pyrite (Py) grains within chalcopyrite; (g) Tennantite infills microfractures in sphalerite; (h) Chalcopyrite containing pyrite-II inclusions, is replaced by bornite (Bn) and covellite (Cv) along margins in silica veinlets; (i) Chalcopyrite replaces pyrite and both are replaced by bornite and chalcocite (Cct).
4.5.5. Tetrahedrite–Tennantite
Phases of tetrahedrite–tennantite (Td-Tn) solid solution series (Cu10(Fe,Zn)2Sb4S13–Cu10(Fe,Zn)2As4S13) were identified in most of the investigated samples, although the abundances and sizes of these phases are minor. It is observed that tetraherite grains appear mostly associated with sphalerite, galena, and pyrite, while tennantite is frequently accompanied by chalcopyrite and pyrite. Tetrahedrite replaces pyrite, galena and sphalerite in breccia-III (Figure 14a,b). Tennantite replaces pyrite and chalcopyrite (Figure 14c) and occurs as small-elongated grains (5–90 μm) within and/or at the rims of chalcopyrite (Figure 14d,e). Also, it fills interstices of corroded pyrite aggregates and fractures in sphalerite indicating its later deposition in the ore stage (Figure 14f,g). 19 chemical analyses of Td-Tn minerals were obtained using the electron microprobe. Representative results are shown in Table 4. The compositions were found to be very close to the both As end-member (tennantite) and Sb end-member (tetrahedrite), as well as intermediate members of the series (Figure 15). Sb and As contents vary between 0 wt % and 29.78 wt % and 1.43 wt %–20.97 wt %, respectively. Ag concentrations in Td-Tn are higher than those of galena. The Ag content of the studied Td-Tn varies in a range from 0 wt % to 0.46 wt % (avg. 0.18 wt %). Based on the microprobe data, the Ag average content in tetrahedrites (avg. 0.27 wt %) is more than tennantites (avg. 0.08 wt %) (Table 4).

Table 4.
Summary of electron microprobe results for tetrahedrite-tennantite series from the Shah-Ali-Beiglou deposit.
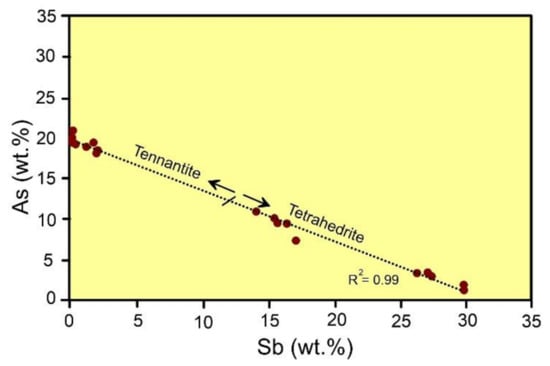
Figure 15.
Chemical variations of As versus Sb in tetrahedrite-tennantite series.
4.5.6. Other Ore Minerals
Enargite (CuAsS4−) in very low quantities as small anhedral grains is commonly observed along with tennantite with grain sizes of up to 20 μm.
Seligmannite (PbCu(As)S3−) at the Shah-Ali-Beiglou, is less abundant and is observed only in the two samples in the silica-sulfide veinlets in close relationship to tennantite and enargite, replacing chalcopyrite. The contents of As and Sb range between 15.93 wt % to 17.18 wt % (avg. 16.55 wt %) and less than 0.01 wt % to 0.07 wt % (avg. 0.03 wt %), respectively (Table 5). The highest concentration of Ag at the Shah-Ai-Beiglou occurs within the seligmannites (avg. 0.83 wt %).

Table 5.
Summary of average EPMA data for supergene sulfides and seligmannite from the Shah-Ali-Beiglou epithermal deposit (concentrations in wt %).
Supergene processes at the Shah-Ali-Beiglou have affected the sulfides. The main supergene minerals are bornite, chalcocite, covellite, jarosite, Fe and Mn oxide-hydroxides. Bornite, chalcocite, and covellite have partially to entirely replaced chalcopyrite. Presence of enclaves of chalcopyrite within bornite is common (Figure 14i). Also, during supergene processes, galena and sphalerite were replaced by covellite along the margins and fracture planes (Figure 12b,d). There is no sharp contact in the border of bornite and chalcopyrite. Also, bornite can be seen in the margin of minerals and as fillings of the microfractures, so these reasons indicate that bornite is probably a supergene mineral (e.g., [64]).
4.5.7. Gangue Mineralogy
The vein and breccia gangue minerals in the Shah-Ali–Beiglou deposit consist of quartz, carbonates (calcite and dolomite), sericite, jarosite, and minor barite. Quartz is observed as breccia cement, breccia clast, vein-veinlet, and replacement. Based on the mineralogical studies, four quartz generations are recognized. The first one along with sericite, pyrite, and Fe-oxide-hydroxide, has formed before the main stage of mineralization and is cut by other quartz generations. It consists of microcrystalline quartz within breccia clast cemented by coarser quartz-II and sulfides (Figure 11a,b). The fine- to coarse-grained euhedral quartz-II during the ore stage, infills fractures and cavities in host rock and occurs as vein-veinlet and breccia (cement and clast) (Figure 16b,c). The dominant textures of the quartz-II crystals consist of plumose, vug infills, comb and zonal (Figure 16d). The third occurs in breccia-II as fine- to coarse-grained and is represented by breccia cement and narrow veinlets cutting earlier sulfide materials and is not associated with ore minerals (Figures 11c,d and 16e). The carbonate minerals (calcite and dolomite) at the Shah-Ali-Beiglou are formed in the pre- ore and post- ore stages. In the pre-ore stage, carbonate minerals are observed within the breccia clasts and in the post-ore stage are occurred as vein-veinlets (Figure 16f) and breccia cement (Figure 11e,f). Coarse-grained dolomites dominate in veins, while medium- to fine-grained are abundant in breccia cement. In the pre-ore stage, interactions between hydrothermal solutions and host rock, resulted in the formation of carbonates concomitantly with Fe-oxide in the breccia clasts. Also, the carbonates are formed at the end of the post-ore stage, as a result of changing the acidic-neutral fluids to alkaline fluids. Sericite occurs widely in the host rocks associated with quartz and pyrite, as observed within the breccia clasts (Figure 16g). Jarosite occurs within fragments of the host rock in which the primary minerals transformed to a mixture of jarosite and iron oxides (Figure 16h). During the final events of the post-ore stage, barite occurs in low amounts as gangue mineral in voids associated with carbonate in cement of breccias (Figure 16i). The paragenetic sequence of minerals is illustrated in Figure 17.
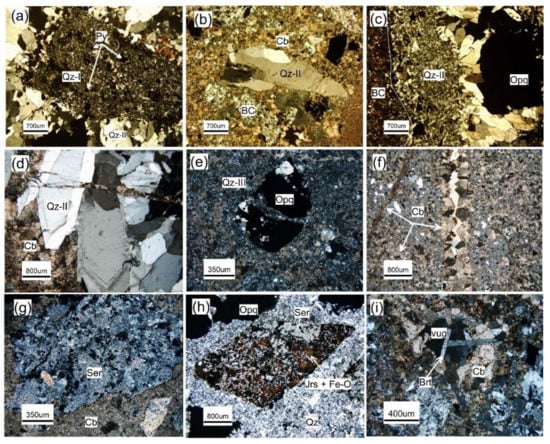
Figure 16.
Photomicrographs of gangue minerals from Shah-Ali-Beiglou deposit showing: (a) Textural relationships between fine-grained quartz crystals (Qz-I) and coarse-grained crystals (Qz-II) which precipitated during pre-ore stage and ore stage mineralization in breccia zones, respectively; (b) Quartz-II in form of breccia clast in breccia-III; (c) Quartz-II in form of breccia cement along with ore in breccia-II; (d) Quartz-II with zonal texture in quartz-carbonate veins; (e) Occurrence of quartz-III within breccia-III; (f) Occurrence of carbonate (Cb) as veinlet without ore; (g) Occurrence of sericite (Ser) as breccia clast; (h) Occurrence of jarosite (Jrs) along with Fe-oxide and sericite within breccia clast; (i) Occurrence of barite (Brt) within a vug.
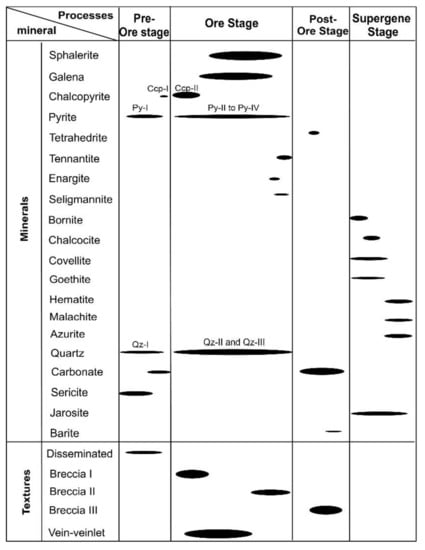
Figure 17.
Paragenetic sequence showing the stages of mineralization in the Shah-Ali-Beiglou deposit. Line width indicates abundance (fine: not abundant, thick: abundant).
4.6. Fluid Inclusion Petrography and Microthermometry
Microthermometric measurements were performed on the primary fluid inclusions hosted in the relatively transparent, honey-colored sphalerite from the ore stage (Figure 18).
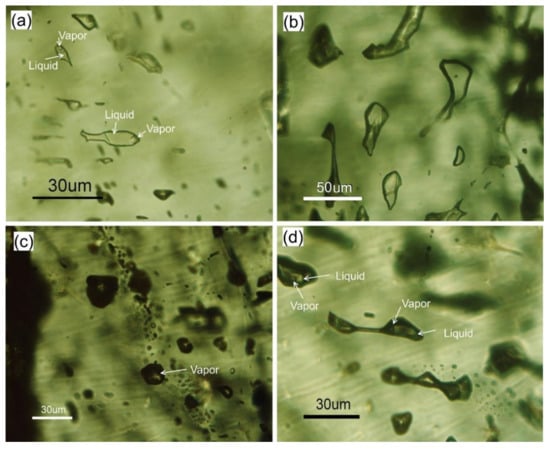
Figure 18.
Microphotographs of the fluid inclusions in sphalerite from the Shah-Ali-Beiglou deposit (at room temperature in plane-polarized light). (a) Primary liquid-rich inclusions; (b) Liquid inclusions; (c) vapor inclusions in sphalerite; (d) Evidence of the necking down in fluid inclusions.
Quartz and carbonate did not contain abundant inclusions with sufficient size to provide a more comprehensive study. The fluid inclusions can be grouped into three types based on their phase relationships at room temperature using the criteria of Roedder [65] and Goldstein [66]: (1) liquid–vapor (L–V) inclusions; (2) liquid-only (L) inclusions; and (3) vapor-only (v). Liquid–vapor (LV) inclusions comprise about 40 vol % of the fluid inclusion population. These inclusions are irregular, oval, polygon, and tabular in shape and up to 60 μm across (Figure 18a). These inclusions containing from ~70 vol % to 90 vol % of liquid at room temperature, homogenize to a liquid phase. Liquid-only (L) inclusions (Figure 18b) mostly have irregular or elongated shapes and vary in length from ~3 to ~70 μm. They occur along with healed microfracture planes or within cleavage planes and are assumed to be secondary, whereas those that coexist with LV inclusions and occur isolated in clusters are likely primary suggesting that these inclusions may have formed through necking of much larger inclusions [67]. Vapor-only (V) inclusions are oval in shape with diameters of 2–30 µm and generally exist along with liquid-rich (LV) inclusions.
There is evidence of necking down in fluid inclusions (Figure 18d) and there is no evidence of the presence of daughter minerals. The fluid inclusion studies did not reveal any evidence of boiling due to the overall presence of an invariable V:L of ∼1:8 and the absence of coexisting vapor-rich and liquid-rich inclusions that homogenize at the same temperature. These observations are also consistent with the absence of adularia and lattice-bladed calcite in the study area.
Microthermometric measurements on two-phase liquid-rich fluid inclusions indicate that the mineralization taken place by dilute to high saline hydrothermal fluids with the salinity and temperature range of 0.35 wt % to 21.4 wt % NaCl equiv. and 123 to 320 °C, respectively. Eutectic temperature (Te) of inclusions varies between −52 °C and −21 °C. The microthermometric data are summarized in Table 6 and plotted in Figure 19. The data from fluid inclusion study in the Th-salinity plot reveal the presence of three fluid inclusion groups including: 1. low to moderate temperatures and high salinities (stage-I), with ranges of 130 to 320 °C and of 17.34 wt % to 21.4 wt % NaCl equiv., respectively; 2. low to moderate temperatures and moderate salinities (stage-II) homogenizing between 135 to 288 °C and 8.68 wt % to 14.97 wt % NaCl equiv., respectively; and 3. low to moderate temperatures and low salinities (stage-III) with ranges of 123 to 274 °C and 0.35 wt % to 4.65 wt % NaCl equiv., respectively. These data indicate that the values of salinities were the highest in the first stage (avg. 19.93 wt % NaCl equiv.) and decreased through the late-stage (avg. 2.6 wt % NaCl equiv.).

Table 6.
Microthermometric data summary for LV fluid inclusions (n = 80) from sphalerite of the Shah-Ali-Beiglou deposit.

Figure 19.
Histograms of (a) homogenization temperatures (Th) and (b) salinities of primary fluid inclusions in the sphalerite from the Shah-Ali-Beiglou deposit.
Comparison of Th versus salinity measurements (Figure 20) shows the presence of high, moderate, and low salinity fluids at approximately similar temperatures, even within a single sample in the Shah-Ali-Beiglou deposit. This was most likely caused by the intermittent pulses of fluids with different salinities, as recorded during the growth of individual crystals. The first ice-melting temperatures (Tm-ice) of the first stage indicate a H2O-NaCl-CaCl2 system with the salinities of 20 wt % NaCl equiv. on average. In fluid inclusions of the second stage, the eutectic temperatures are between −52 to −37 °C that indicate the possible presence of NaCl, MgCl2, CaCl2, FeCl2, Na2CO3, and/or K2CO3 in the aqueous fluids [65,68,69], although there is a possibility that the low and variable eutectic temperatures were caused by metastability. According to Hedenquist and Henley [70], where wt % NaCl equiv. refers to the equivalent of NaCl + KCl + CaCl2; these salinity values may be overestimated in fluid inclusion studies due to the presence of dissolved CO2 and other gases.
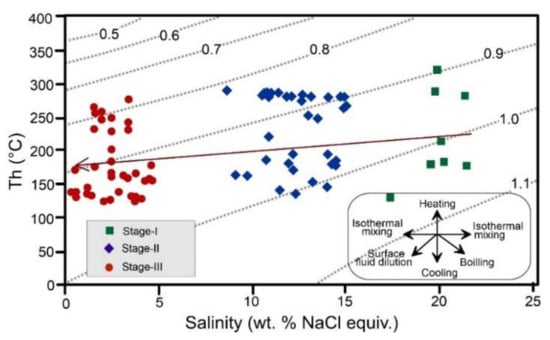
Figure 20.
Homogenization temperature (Th) versus salinity (wt % NaCl eq.) plot of fluid inclusion data in the Shah-Ali-Beiglou deposit showing isothermal mixing trend during mineralization (Doted lines indicate density curves after Wilkinson, [71]).
4.7. Sulfur Isotope Data
In order to constrain the source of sulfur in the hydrothermal system of the Shah-Ali-Beiglou deposit, sulfur isotope (δ34S) analyses were conducted on the samples chosen from veins and breccias. These analyses were performed on 15 pure samples separated from sphalerite, galena, and chalcopyrite. The results that are ranging from 2.8‰ to 6.7‰, are presented in Table 7 and Figure 21. There is a general decreasing trend in δ34S sulfide values corresponding to the mineral sequence of sphalerite, chalcopyrite, and galena (Figure 22a). This mineral sequence corresponds to the sequence provided by Ohmoto and Rye [72] for the order of 34S enrichment. The δ34S values of the fluid were calculated using the δ34S values of the sulfide minerals and mineral-H2S equilibrium isotopic fractionation factor of Li and Liu [73], assuming H2S as the main sulfur species in the fluid (Table 7). The isotopic compositions were calculated using the mean value of the homogenization temperatures of fluid inclusion data obtained from this study. The average calculated δ34S values of hydrothermal fluids in equilibrium with the sulfides (Table 7) range from a maximum of +3.96‰ for sphalerite to +8.1‰ for Galena (Figure 22b).

Table 7.
Sulfur isotope data for galena, chalcopyrite, sphalerite and H2S of the Shah-Ali-Beiglou deposit. The isotopic compositions were calculated using the mean value of the Th of L-V inclusion data obtained from Table 6.
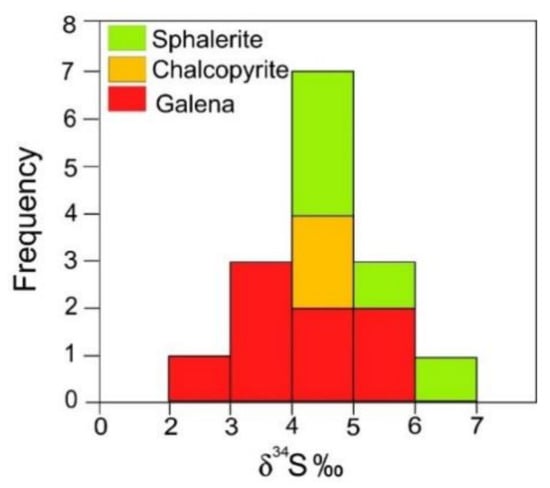
Figure 21.
Histograms illustrating the range of sulfur isotope values for sulfides from the Shah-Ali-Beiglou deposit.
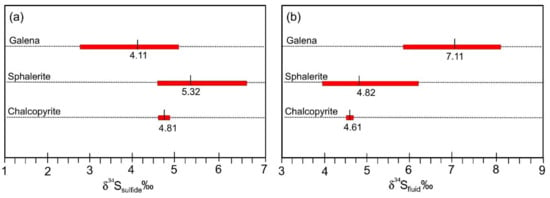
Figure 22.
Range (bars) and average (numbers) of δ34S sulfide (a) and calculated δ34SH2S (b) values in the Shah-Ali-Beiglou deposit.
5. Discussion
5.1. Geochemistry of Ore Minerals
Variations in FeS content in sphalerite may reflect variations in the activity of FeS in the fluid and in physicochemical conditions during precipitation [74]. Also, variation in the mol % FeS of sphalerite coexisting with pyrite and pyrrhotite reflects the variability of the sulfidation state in a given system and provides useful information in classifying an epithermal deposit [75,76,77]. According to Einaudi et al. [77] the mol % FeS in sphalerite coexisting with pyrite and pyrrhotite at intermediate sulfidation states, should range from 1 mol % to 10 mol % FeS and locally up to 20 mol % FeS. The composition of the sphalerite from Shah-Ali-Beiglou ranges from 0.1 to 4.00 (avg. 1.59 mol % FeS), which is consistent with the sphalerite compositions from intermediate sulfidation systems. Gottesman and Kampe [78] suggested that high Zn/Cd ratios of over 500 are inherited from basaltic source rocks, whereas moderate ratios (~330–430) derive from andesitic source rocks. Similarly, Zn/Cd ratios lower than 250 are characteristic of acidic sources. Considering the intermediate Zn/Cd ratios (324–418) of sphalerite in the study region, we suggest that the hydrothermal solutions are linked to the andesitic magmatism.
5.2. Source and Composition of Mineralizing Fluids and Sulfur
Regarding to the systematic variation of Th and salinity between fluid inclusion assemblages in individual crystals of sphalerite from the Shah-Ali-Beiglou district, it is likely that the high-salinity fluids were periodically injected and mixed with low-salinity ones over short period of time. Similar evidence for the presence of lower and higher salinity fluids in the same deposit has also been noted previously for silver and base metal mineralization in the Fresnillo district [79,80] and in other intermediate-sulfidation epithermal deposits of Mexico, Iran, and Turkey [81,82,83]. Albinson et al. [81] noted that the salinity of individual Zn-Pb-Ag deposits is from 12 wt % to 23 wt % NaCl equivalent. By contrast, the fluid responsible for quartz and carbonate gangue deposition in intermediate-sulfidation vein deposits is usually much lower in salinity than the episodic pulses of saline fluid that deposit the ore and associated sulfide minerals [80].
The origin of the hydrothermal fluids that form epithermal deposits can be varied; from predominantly magmatic in high sulfidation (HS) and intermediate sulfidation (IS) epithermal deposits to mostly meteoric in low sulfidation (LS) deposits [84,85,86,87,88,89]. High-salinity brines may evolve in a magmatic environment [80,81]. Thus, the high salinities of the fluid inclusions in the study area are consistent with a magmatic source. This interpretation corresponds to similar conclusions in other magmatic-hydrothermal systems, such as those described by Camprubí and Albinson [90] for formation of IS epithermal deposits and Shamanian et al. [82] for Abolhassani epithermal Prospect in Iran. A relationship between silver and base metal ores with relatively higher salinities and gold-silver ores with lower salinities, has been mentioned [91] and confirmed for Mexican epithermal deposits [79,80,81]. According to Simmons et al. [92], Gold-silver deposits generally have dilute solutions of less than 5 wt % NaCl equiv., whereas Ag-Pb-Zn deposits commonly have brines of less than 10 wt % to more than 20 wt % NaCl equiv. Correlation of Ag + Au/Pb + Zn + Cu ratios with fluid inclusion salinities, indicates the importance of chloride complexing in transport of the base metals in polymetallic mineralization [81]. The Au(HS)2− bisulfide complexes are most important for gold transportation in the epithermal environment [93,94]. By contrast, chloride complexes are more significant for silver and base metal transport than for gold transport under the relatively reduced, neutral pH conditions [94]. Therefore, Zn-Pb-Cu(-Ag) concentrations in the fluids of the Shah-Ai-Beiglou deposit were most likely transported in the form of chloride complexes. We assume that chlorine was magmatic in origin due to the lack of evaporates and connate brines in the region.
Sulfur in the hydrothermal fluids could have been derived from three sources: (1) preexisting sulfides in the host sequence; (2) sulfur-bearing magmatic volatiles; or (3) dissolved sulfate in seawater [85]. Sulfur in the magmatic fluids usually has δ34S values near zero, although extensive open-system degassing can lead to local enrichment of 34S (e.g., [95]). Considering the isotopic data of various geological environment, rock, and ore types reported in previous studies [72,96], it is clear that our results are consistent with the δ34S values of magmatic rocks [85,97,98]. The isotopic evidence for a predominantly magmatic ore fluid, is further supported by the intermediate and high salinities of LV inclusions (e.g., [99]).
5.3. Ore Deposition and Depth of Formation
The depth of formation below the paleowater table can be estimated from hydrostatic boiling point curves [100], assuming hydrostatic pressure. However, because of the lack of evidence for boiling, this estimation will provide a minimum value. Based on the temperatures from the fluid inclusion studies (Figure 23), it can be seen that the mineralization in the Shah-Ali-Beiglou deposit has been formed at depths of ~100 to ~1200 m below the paleowater table.
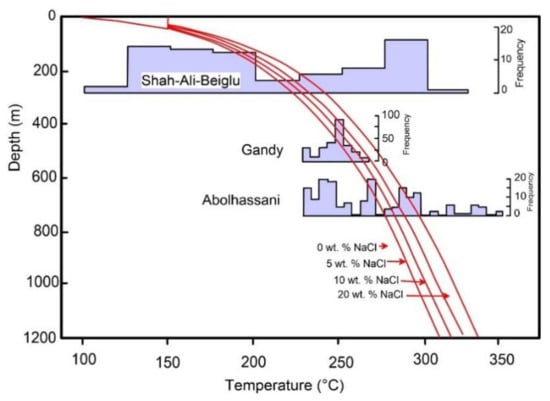
Figure 23.
Temperature-depth diagram with boiling-point curves for pure H2O (0 wt %) and for brine of different composition given in wt % NaCl (from Haas [100]). Shah-Ali-Beiglou data were fitted at the mean Th values to the 8.6 wt % NaCl curve. Histograms of Gandy and Abolhassani are based on Shamanian et al. [82].
5.4. Genesis of the Shah-Ali-Beiglou Deposit
The Shah-Ali-Beiglou deposit shows numerous similarities with epithermal deposits as discussed by Einaudi et al. [77], Gemmell, [101], Hedenquist et al. [84], Sillitoe and Hedenquist [102], and White and Hedenquist [103].
These are evidenced by recognition of: (1) epithermal textures such as hydrothermal vein-veinlets and breccias associated with vug infilling, crustiform, plumose and comb textures; (2) alteration mineral assemblage such as quartz, sericite, and carbonate; (3) vein-style mineralization as the dominant morphology; and (4) ore mineralogy consisting of sphalerite, galena, chalcopyrite, pyrite, and tetrahedrite-tennantite. The epithermal mineralization can be classified into three main groups of LS, IS, and HS deposits based on the sulfur content, ore sulfide assemblage, dominant alteration and gangue assemblages (e.g., [84,92,102]). The IS deposits present a large span in metal assemblage and characteristics, from Au-Ag and Ag-Au deposits (division at Ag/Au ~50), with less than 0.05 wt % combined base metal content, to Ag-base metal and base metal-Ag deposits [81]. A base metal-rich intermediate sulfidation style of mineralization is supported by the following features: (i) development of the sulfide and sulfosalt minerals consisting of sphalerite with low FeS content, galena, chalcopyrite, tetrahedrite-tennantite, and silver occurring as Ag-bearing sulfosalts; (ii) development of sericite rather than adularia, indicating higher temperatures and limited boiling, probably as a result of greater formational depths; (iii) high-K calc-alkaline and shoshonitic nature of the genetically related igneous rocks; and (iv) precipitation from near neutral (pH ~6), reduced, moderately saline fluids (5 wt %–20 wt % NaCl equiv.) in moderate temperatures (150–300 °C) [77,102].
The main characteristics of the IS epithermal deposits according to the most recent terminology for epithermal mineralization (e.g., [102]) are shown on Table 8 and have been compared with the main features of Shah-Ali-Beiglou deposit, in order to define the style of mineralization in the Shah-Ali-Beiglou deposit.

Table 8.
Comparative characteristics of the main features of the Shah-Ali-Beiglou deposit and intermediate sulfidation type deposits (after Sillitoe and Hedenquist, [102]) and Shah-Ali-Beiglou deposit.
The Shah-Ali-Beiglou deposit is similar to the IS systems in terms of the following aspects:
- (i)
- vein-style mineralization with steeply dipping that is the dominant morphology in this deposit is as typical for other IS epithermal deposits [104].
- (ii)
- The Ag:Au ratio of the whole-ore composition in the Shah-Ali-Beiglou deposit ranges from 68 to 3666 and these values correspond to the IS systems where the Ag:Au ratio is at least 10:1 and typically higher than 100 [77].
- (iii)
- The composition of the sphalerite ranges from 0.1 mol % to 4 mol % FeS, which is consistent with the sphalerite compositions from IS systems that range from 1 mol % to 10 mol % FeS and locally up to 20 mol % [76,77,92].
- (iv)
- Absence of illite-adularia and alunite typical of the LS and HS deposits in the alteration mineral assemblage of the Shah-Ali-Beiglou deposit.
- (v)
- The main ore minerals in the studied deposit consist of FeS-poor sphalerite, galena, and chalcopyrite. These sulfides are usually related to IS (e.g., [77,84,102]).
- (vi)
- The sericitic alteration in the study area is dominant. According to Sillitoe and Hedenquist [88], this alteration is predominant in the IS epithermal mineralization.
- (vii)
- The nature of calc-alkaline to shoshonitic of the igneous rocks related to Shah-Ali-Beiglou deposit is common in the IS epithermal deposits (e.g., [102]).
- (viii)
- The average temperatures of ore formation (123–320 °C), as well as the salinities (0.35 wt %–21.4 wt % NaCl equiv.) in fluids determined in sphalerite, are typical of the IS epithermal deposits so that base metal types commonly have brines of less than 10 wt % to more than 20 wt % NaCl equiv. [92].
While a great number of IS epithermal deposits occur within continental margin arcs in extensional settings (e.g., Tonopah, Nevada; Creede, Colorado; Fresnillo, Mexico; Pachula-Real de Monte, Mexico; Tayoltita, Mexico; Arcata, Peru; Sacarimb, Romania, Rosia Montana, Romania; data from Sillitoe and Hedenquist, [102], the Shah-Ali-Beiglou deposit is formed in an Oligocene-Early Miocene compressional post-collisional tectonic setting [14].
Shah-Ali-Beiglou deposit show similarities with deep vein-type deposits, which are present in the lower parts of the LS epithermal environment in Mexico (e.g., [81]). The base metal-rich deposits in Mexico typically occur in deeper portions of the Au-Ag mineralization and below the boiling level. These deposits can be recognized from fluid inclusion evidences (lack of vapor-rich inclusions and high salinity) and petrographic evidence (lack of platy or lattice calcite, lack of adularia, and presence of predominantly coarsely crystalline varieties of quartz and ore minerals) [105,106]. Accordingly, it is likely that the base metal-Ag veins in the study area belong to the deep portion of an eroded LS epithermal deposit with the base metal sulfide-rich veins now exposed.
5.5. Shah-Ali-Beiglou Mineralization Model
The fluid inclusion and stable isotope data presented in this work suggest a model for structural and magmatism evolution in which: (a) ore veins are controlled by a regional dominant sinistral strike-slip fault system; (b) Quartz monzonite magma intruded into Eocene volcanic and volcaniclastic rocks along the fault as a dike; (c) Hydrothermal fluids deriving from an intrusion (Shah-Ali-Beiglou stock) ascended along breccia zone to higher levels, causing extensive hydrothermal alterations and finally deposited ore minerals mostly as vein-veinlet and breccia cement (Figure 24 and Figure 25). Hydrothermal fluids of dominantly magmatic source ascended along breccia and fracture zones to higher levels and these fluids are responsible for the deposition of sulfides and sulfosalts. The galena, sphalerite, chalcopyrite, and sulfosalts were deposited from a low to high salinity fluid and were probably transported in the form of chloride complexes (e.g., [103]). Isothermal mixing of deep meteoric water with the magmatic hydrothermal fluid is probably the main mechanism for base metal deposition in ore stage (e.g., [91,107,108]).
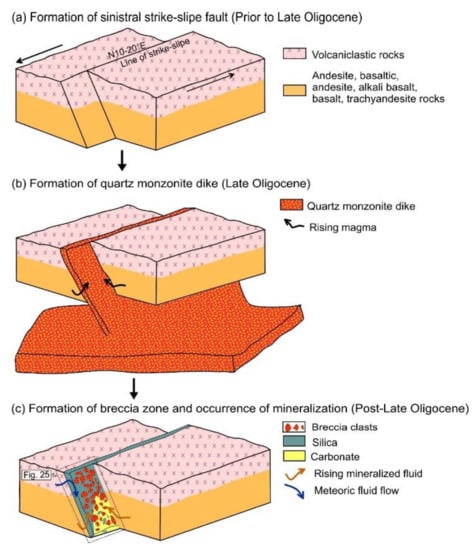
Figure 24.
Block diagrams showing structural and mineralization evolution of the Shah-Ali-Beiglou deposit in the study area. (a) Displacement of rock units by sinistral strike-slip fault in a N10°–20° E direction; (b) Rising quartz monzonite magma through the fault and formation of dike along the fault plane; (c) Development of ore mineralization along breccia zone within the quartz-monzonite dike as vein-veinlet, breccia cement and disseminated.
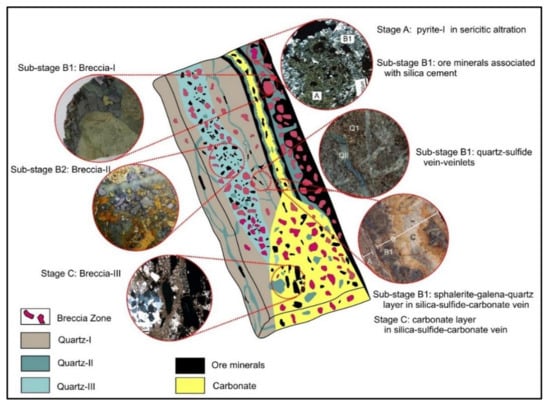
Figure 25.
Schematic presentation of Shah-Ali-Beiglou vein-type deposit, illustrating multiple phases of ore mineral deposition and fracturing events. Stage A: The pre-ore stage in which pyrite-I was deposited as isolated grains. Stage B1: The earliest stage of ore mineralization (ore stage) was developed as hydrothermal breccias and vein-veinlets. Stage B2: The ore mineralization continued as breccia cement associated with pyrite. Stage C: The post-ore stage, which is marked by mostly carbonate as breccia cement and vein-veinlet that are associated with tetrahedrite.
6. Conclusions
The Shah-Ali-Beiglou is an example of base metal-silver epithermal deposit in the Tarom-Hashjin metallogenic province, occurring in the breccia zones. The studied deposit with vein-type geometry is related to post-collisional magmatism ranging from calc-alkaline to shoshonitic affinity, in a compressional tectonic setting. The phase of magmatism is characterized by rocks with intermediate compositions (monzonite and quartz monzonite) that mostly shows I-type geochemical features. Ore mineralization is formed in relation with the fault-controlled (strike-slip fault) mineralization system during Late Oligocene. Mineralization is predominantly as vein-veinlets and open-space fillings in the breccia zones. The wide ranges of salinity data for this deposit likely reflect a large degree of isothermal mixing of end-member fluids. The relatively high-salinity fluids (up to 21 wt % NaCl equiv.) along with sulfur isotope data suggest that mineralizing fluids contain a substantial proportion of magmatic water. The moderate and high salinity fluids at Shah-Ali-Beiglou could be linked to base metals transport in chloride-rich solutions. Ore minerals, alteration mineralogy, alteration patterns, structural controls, and main textures, indicate that the Shah-Ali-Beiglou deposit was formed under intermediate sulfidation epithermal conditions.
Acknowledgments
This research is part of the first author’s Ph.D. thesis project. Financial support was provided by University of Tabriz, Iran and by the Iranian Mineral Processing Research Center (IMPRC) Fund. We acknowledge their support. Y. Song is thanked for carrying out some of isotope analyses. The manuscript has benefited from constructive comments by G. Bozkaya and careful editorial work by P. Moshefi. We would like to thank two reviewers for providing constructive reviews.
Author Contributions
K.M. performed the experiments and drafted the paper; M.R.H. analyzed the data; M.M. revised the regional and local geological section; S.M. revised the paper.
Conflicts of Interest
The authors declare no conflict of interest and the founding sponsors had no role in the design of the study; in the collection, analyses, or interpretation of data; in the writing of the manuscript, and in the decision to publish the results.
References
- Mao, J.; Pirajno, F.; Lehmann, B.; Luo, M.; Berzina, A. Distribution of porphyry deposits in the Eurasian continent and their corresponding tectonic settings. J. Asian Earth Sci. 2013, 79-B, 576–584. [Google Scholar] [CrossRef]
- Ciobanu, C.L.; Cook, N.J.; Stein, H. Regional setting and Re-Os age of ores at Ocna de Fier Dognecea (Romania) in the context of the banatitic magmatic and metallogenic belt. Miner. Depos. 2002, 37, 541–567. [Google Scholar] [CrossRef]
- Yiğit, Ö. A prospective sector in the Tethyan Metallogenic Belt: Geology and geochronology of mineral deposits in the Biga Peninsula, NW Turkey. Ore Geol. Rev. 2012, 46, 118–148. [Google Scholar] [CrossRef]
- Bozkaya, G.; Banks, A.D. Physico-chemical controls on ore deposition in the Arapucandere Pb–Zn–Cu-precious metal deposit, Biga Peninsula, NW Turkey. Ore Geol. Rev. 2015, 66, 65–81. [Google Scholar] [CrossRef]
- Azizi, H.; Jahangiri, A. Cretaceous subduction-related volcanism in the northern Sanandaj-Sirjan Zone, Iran. J. Geodyn. 2008, 45, 178–190. [Google Scholar] [CrossRef]
- Siani, M.; Mehrabi, B.; Azizi, H.; Wilkinson, C.M.; Ganerod, M. Geochemistry and geochronology of the volcano-plutonic rocks associated with the Glojeh epithermal gold mineralization, NW Iran. Open Geosci. 2015, 7, 207–222. [Google Scholar] [CrossRef]
- Mehrabi, B.; Siani, M.; Goldfarb, R.; Azizi, H.; Ganerod, M.; Marsh, E. Mineral assemblages, fluid evolution, and genesis of polymetallic epithermal veins, Glojeh district, NW Iran. Ore Geol. Rev. 2016, 78, 41–57. [Google Scholar] [CrossRef]
- Berberian, M.; King, G.C.P. Towards a paleogeography and tectonic evolution of Iran. Can. J. Earth Sci. 1981, 18, 210–265. [Google Scholar] [CrossRef]
- Allen, M.B.; Ghassemi, M.R.; Shahrabi, M.; Qorashi, M. Accommodation of late Cenozoic oblique shortening in the Alborz range, northern Iran. J. Struct. Geol. 2003, 25, 659–672. [Google Scholar] [CrossRef]
- Guest, B.; Stockli, D.F.; Grove, M.; Axen, G.J.; Lam, P.S.; Hassanzadeh, J. Thermal histories from the central Alborz Mountains, northern Iran: Implications for the spatial and temporal distribution of deformation in northern Iran. Geol. Soc. Am. Bull. 2006, 118, 1507–1521. [Google Scholar] [CrossRef]
- Madanipour, S.; Ehlers, T.A.; Yassaghi, A.; Rezaeian, M.; Enkelmann, E.; Bahroudi, A. Synchrounous deformation on orogenic plateau margins: Insights from the Arabia-Eurasia collision. Tectonophysics 2013, 608, 440–451. [Google Scholar] [CrossRef]
- Vincent, S.J.; Allen, M.B.; Ismail-Zadeh, A.D.; Flecker, R.; Foland, K.A.; Simmons, M.D. Insights from the Talysh of Azerbaijan into the Paleogene evolution of the south Caspian region. Geol. Soc. Am. Bull. 2005, 117, 1513–1533. [Google Scholar] [CrossRef]
- Verdel, C.; Wernicke, B.P.; Hassanzadeh, J.; Guest, B. A Paleogene extensional arc flare-up in Iran. Tectonics 2011, 30. [Google Scholar] [CrossRef]
- Moayyed, M. Investigation of Tertiary Volcano-Plutonic Bodies in West Alborz-Azarbaijan (Hashjin Area). Ph.D. Thesis, Shahid Beheshti University, Tehran, Iran, 2001; p. 296. (In Persian). [Google Scholar]
- Hajalilu, B. Tertiary Metallogenesis in the Western Alborz-Azarbaijan (Mianeh-Siahrood) with Special Focus on Hashtjin Area. Ph.D. Thesis, Shahid Beheshti University, Tehran, Iran, 1999; p. 275. Unpublished. (In Persian). [Google Scholar]
- Nabatian, G.; Rastad, E.; Neubauerc, F.; Honarmandd, M.; Ghaderib, M. Iron and Fe-Mn mineralisation in Iran: Implications for Tethyan metallogeny, Australian. J. Earth Sci. 2015, 62, 211–241. [Google Scholar] [CrossRef]
- Nabatian, G.; Jiang, S.Y.; Honarmand, M.; Neubauer, F. Zircon U–Pb ages, geochemical and Sr–Nd–Pb–Hf isotopic constraints on petrogenesis of the Tarom-Olya pluton, Alborz magmatic belt, NW Iran. Lithos 2016, 244, 43–58. [Google Scholar] [CrossRef]
- Kouhestani, H.; Azimzadeh, A.M.; Mokhtari, M.A.A.; Ebrahimi, M. Mineralization and fluid evolution of epithermal base metal veins from the Aqkand deposit, NW Iran. J. Miner. Geochem. 2017, 194, 139–155. [Google Scholar] [CrossRef] [PubMed]
- Maghfouri, S.; Hosseinzadeh, M.R.; Moayyed, M.; Movahednia, M.; Choulet, F. Geology, mineralization and sulfur isotopes geochemistry of the Mari Cu (Ag) Manto-type deposit, northern Zanjan, Iran. Ore Geol. Rev. 2017, 81, 10–22. [Google Scholar] [CrossRef]
- Jamali, H.; Dilek, Y.; Daliran, F.; Yaghubpur, A.M.; Mehrabi, B. Metallogeny and tectonic evolution of the Cenozoic Ahar–Arasbaran volcanic belt, northern Iran. Int. Geol. Rev. 2010, 52, 608–630. [Google Scholar] [CrossRef]
- Castro, A.; Aghazadeh, M.; Badrzadeh, Z.; Chichorro, M. Late Eocene–Oligocene post-collisional monzonitic intrusions from the Alborz magmatic belt, NW Iran. An example of monzonite magma generation from a metasomatized mantle sou. Lithos 2013, 180–181, 109–127. [Google Scholar] [CrossRef]
- Nabatian, G.; Ghaderi, M.; Neubauer, F.; Honarmand, M.; Lui, X.; Dong, Y.; Jiang, S.Y.; von Quadt, A.; Bernroider, M. Petrogenesis of Tarom highpotassic granitoids in the Alborz-Azarbaijan belt, Iran: Geochemical, U-Pb zircon and Sr-Nd-Pb isotopic constraints. Lithos 2014, 184, 324–345. [Google Scholar] [CrossRef]
- Nabavi, M. An Introduction to the Geology of Iran; Geological Survey of Iran Publication: Tehran, Iran, 1976; pp. 1–109. (In Persian) [Google Scholar]
- Maghdour-Mashhoura, R.; Esmaeilya, D.; Tabbakh Shabanib, A.A. Petrology and geochemistry of the Karaj Dam basement sill: Implications for geodynamic evolution of the Alborz magmatic belt. Chemie der Erde 2015, 75, 237–260. [Google Scholar] [CrossRef]
- Nabatian, G.; Ghaderi, M. Oxygen isotope and fluid inclusion study of the Sorkhe-Dizaj iron oxide-apatite deposit, NW Iran. Int. Geol. Rev. 2013, 55, 397–410. [Google Scholar] [CrossRef]
- Blourian, G.H. Petrology of the Tertiary Volcanic Rocks in the Northern Tehran. Ph.D. Thesis, Tarbiat Moallem University, Tehran, Iran, 1994; p. 145, (In Persian with English Abstract). [Google Scholar]
- Asiabanha, A.; Foden, J. Post-collisional transition from an extensional volcanosedimentary basin to a continental arc in the Alborz Ranges, N-Iran. Lithos 2012, 148, 98–111. [Google Scholar] [CrossRef]
- Agard, P.; Omrani, J.; Jolivet, L.; Whitechurch, H.; Vrielynck, B.; Spakman, W.; Monie, P.; Meyer, B.; Wortel, R. Zagros orogeny: A subduction-dominated process. Geol. Mag. 2011, 148, 692–725. [Google Scholar] [CrossRef]
- Didon, J.; Gemain, Y.M. Le Sabalan, Volcan Plio-Quaternaire, Azarbyjan Oriental, Iran. Ph.D. Dissertation, Universite Scientifique et Médicale de Grenoble, Saint-Martin-d’Hères, France, 1976; p. 304. [Google Scholar]
- Calagari, A.A. Stable isotope (S, O, H and C) studies of the phyllic and potassicphyllic alteration zones of the porphyry copper deposit at Sungun, East Azarbaijan, Iran. J. Asian Earth Sci. 2003, 21, 767–780. [Google Scholar] [CrossRef]
- Hosseinzadeh, G.; Calagari, A.; Moayyed, M.; Moazzen, M. Study of hypogene alteration and copper mineralization in Sonajil area, NW Iran. Geosci. Geol. Surv. Iran 2010, 19, 3–12. (In Persian) [Google Scholar]
- Simmonds, V.; Calagari, A.A.; Kyser, K. Fluid inclusion and stable isotope studies in Kighal porphyry copper-molybdenum deposit, East-Azarbaidjan, NW Iran. Arab. J. Geosci. 2015, 8, 437–453. [Google Scholar] [CrossRef]
- Karimzadeh-Somarin, A.; Hosseinzadeh, G. Mineralogy of the Anjerd Skarn Deposit. Ahar Region, NW Iran; International and Mineralogical Association: Edinburgh, UK, 2002. [Google Scholar]
- Calagari, A.A.; Hosseinzadeh, G. The mineralogy of copper-bearing skarn to the east of the Sungun-Chay River, East-Azarbaidjan, Iran. J. Asian Earth Sci. 2006, 28, 423–438. [Google Scholar] [CrossRef]
- Yasami, N.; Ghaderi, M.; Madanipour, S.; Taghilou, B. Structural control on overprinting high-sulfidation epithermal on porphyry mineralization in the Chodarchay deposit, northwestern Iran. Ore Geol. Rev. 2017, 86, 212–224. [Google Scholar] [CrossRef]
- Hosseinzadeh, M.R.; Maghfouri, S.; Moayyed, M.; Rahmani, A. Khalifehlu Deposit: High-Sulfidation Epithermal Cu-Au Mineralization in the Tarom Magmatic Zone, North Khoramdareh. J. Earth Sci. 2016, 99, 179–194. [Google Scholar]
- Nabatian, G.; Ghaderi, M.; Daliran, F.; Rashidnejad-Omran, N. Sorkheh-Dizaj iron oxide-apatite ore deposit in the Cenozoic Alborz-Azarbaijan magmatic belt, NW Iran. Resour. Geol. 2013, 63, 42–56. [Google Scholar] [CrossRef]
- Hassanzadeh, J.; Ghazi, A.M.; Axen, G.; Guest, B. Oligo-Miocene mafic alkaline magmatism north and northwest of Iran: Evidence for the separation of the Alborz from the Urumieh-Dokhtar magmatic arc. Geol. Soc. Am. Bull. 2002, 34, 331. [Google Scholar]
- Mirnejad, H.; Hassanzadeh, J.; Cousens, B.L.; Taylor, B.E. Geochemical evidence for deep mantle melting and lithospheric delamination as the origin of the inland Damavand volcanic rocks of northern Iran. J. Volcanol. Geotherm. Res. 2010, 198, 288–296. [Google Scholar] [CrossRef]
- Ballato, P.; Uba, C.E.; Landgraf, A.; Strecker, M.R.; Sudo, M.; Stockli, D.F.; Friedrich, A.; Tabatabaei, S.H. Arabia-Eurasia continental collision: Insights from late Tertiary foreland-basin evolution in the Alborz Mountains, Northern Iran. Geol. Soc. Am. Bull. 2010, 123, 106–131. [Google Scholar] [CrossRef]
- Alavi, M. Sedimentary and structural characteristics of the Paleo-Tethys remnants in northeastern Iran. Geol. Soc. Am. Bull. 1991, 103, 983–992. [Google Scholar] [CrossRef]
- Alavi, M. Regional stratigraphy of the Zagros fold-thrust belt of Iran and its proforeland evolution. Am. J. Sci. 2004, 304, 1–20. [Google Scholar] [CrossRef]
- Clark, G.C.; Davies, R.G.; Hamzepour, B.; Jones, C.R.; Ghorashi, M. Geological Map of Bandar-e-Anzali. Scale 1:250,000; Geological Survey of Iran: Tehran, Iran, 1977. [Google Scholar]
- Alavi, M.; Amidi, M.; Tatavosian, S.H. Geological Map of Takab. Scale 1:250,000; Geological Survey of Iran: Tehran, Iran, 1976. [Google Scholar]
- Hajian, J.; Zahedi, M.; Alavi, M.; Eftekharnezhad, J. Geological Map of Zanjan. Scale 1:250,000; Geological Survey of Iran: Tehran, Iran, 1969. [Google Scholar]
- Alavi, N.; Lotfi, M.; sabzehei, M.; Lescuyer, J. Geological Map of Miyaneh. Scale 1:250,000; Geological Survey of Iran: Tehran, Iran, 1978. [Google Scholar]
- Aghajani, S.; Emami, M.H.; Lotfi, M.; Gholizadeh, K.; Siani, M.G. Evidences of low-sulfidation epithermal type mineralization in the Nikuyeh area, Qazvin-Iran. In Proceedings of the SEG Conference, Keystone, CO, USA, 27–30 September 2014. [Google Scholar]
- Zamanian, H.; Rahmani, S.; Jannessary, M.R.; Zareii, S.H.; Borna, B. Ore minealization study of The Cu-Au vein-type deposit in The Tarom-Granitoid (North Zanjan) based on mineralogical, geochemical and fluid inclusion evidences. J. Earth Sci. 2015, 98, 255–282. [Google Scholar]
- Hall, D.L.; Sterner, S.M.; Bodnar, R.J. Freezing point depression of NaCl-KCl-H2O solutions. Econ. Geol. 1988, 83, 197–202. [Google Scholar] [CrossRef]
- Faridi, M.; Anvari, A. Geological Geological Map of Hashtjin, Scale 1: 100,000; Geological Survey of Iran: Tehran, Iran, 2000. [Google Scholar]
- Muller, D.; Groves, D.I. Potassic Igneous Rocks and Associated Gold-Copper Mineralization; Sec. Updated; Springer Series in Chemical Physics; Springer: Berlin, Germany, 1997; p. 242. [Google Scholar]
- Sun, S.S.; McDonough, W.S. Chemical and isotopic systematics of oceanic basalts: Implications for mantle composition and processes. J. Geol. Soc. Lond. 1989, 42, 313–345. [Google Scholar] [CrossRef]
- Hofmann, A.W. Mantle geochemistry: The message from oceanic volcanism. Nature 1997, 385, 219–229. [Google Scholar] [CrossRef]
- Foley, S.F.; Wheller, G.E. Parallels in the origin of the geochemical signatures of island arc volcanics and continental potassic igneous rocks: The role of residual titanites. Chem. Geol. 1990, 85, 1–18. [Google Scholar] [CrossRef]
- Pearce, J.A.; Parkinson, I.J. Trace element models for mantle melting: Application to volcanic arc petrogenesis. In Magmatic Processes and Plate Tectonics; Prichard, H.M., Alabaster, T., Harris, N.B.W., Neary, C.R., Eds.; Geological Society of London: London, UK, 1993; Volume 76, pp. 373–403. [Google Scholar]
- Nakamura, N. Determination of REE, Ba, Fe, Mg, Na and K in carbonaceous and ordinary chondrites. Geochim. Cosmochim. Acta 1974, 38, 757–775. [Google Scholar] [CrossRef]
- Middlemost, E.A.K. Naming materials in the magma/igneous rock system. Earth Sci. Rev. 1994, 37, 215–224. [Google Scholar] [CrossRef]
- Maniar, P.O.; Piccoli, P.M. Tectonic discrimination of granitoids. Bull. Geol. Soc. Am. 1989, 101, 635–643. [Google Scholar] [CrossRef]
- Collins, W.J.; Beams, S.D.; White, A.J.R.; Chappell, B.W. Nature and origin of A-type granites with particular reference to southeastern Australia. Contrib. Miner. Petrol. 1982, 80, 189–200. [Google Scholar] [CrossRef]
- Pearce, J.A. Role of the sub-continental lithosphere in magma genesis at activecontinental margins. In Continental Basaltsand Mantle Xenoliths; Hawkesworth, C.J., Norry, N.J., Eds.; Shiva: Cheshire, UK, 1983; pp. 230–249. [Google Scholar]
- Wiggins, L.B.; Craig, J.R. Reconnaissance of the Cu-Fe-Zn-S system: Sphalerite phase relations. Econ. Geol. 1980, 75, 742–751. [Google Scholar] [CrossRef]
- Bortnikov, N.S.; Genkin, A.D.; Dobrovolskaya, M.G.; Muravitskaya, G.N.; Filiminova, A.A. The nature of chalcopyrite inclusions in sphalerite: Exolution, coprecipitation, or disease? Econ. Geol. 1991, 86, 1070–1082. [Google Scholar] [CrossRef]
- Cook, N.J.; Ciobanu, C.L.; Pring, A.; Skinner, W.; Shimizu, M.; Danyushevsky, L.; Saini-Eidukat, B.; Melcher, F. Trace and minor elements in sphalerite: A LA-ICPMS study. Geochim. Cosmochim. Acta 2009, 73, 4761–4791. [Google Scholar] [CrossRef]
- Clark, D.J.; Gemmell, J.B.; Norman, M.; Hespe, A.M. Textural and geochemical distinction between supergene and hypogene Cu sulfide phases at the Mammoth copper deposit, Queensland, Australia. In Mineral Deposits at the Beginning of the 21st Century; Piestrzynski, A., Ed.; Swets & Zeitlinger Publishers: Lisse, The Netherlands, 2001; pp. 219–222. [Google Scholar]
- Roedder, E. Fluid inclusions. Rev. Mineral. 1984, 12, 644. [Google Scholar]
- Goldstein, R.H. Petrographic analysis of fluid inclusions. In Fluid Inclusions: Analysis and Interpretation; Samson, I., Anderson, A., Marshall, D., Eds.; Mineralogical Association of Canada Short Course: Québec, QC, Canada, 2003; Volume 32, pp. 9–53. [Google Scholar]
- Bodnar, R.J.; Reynolds, T.J.; Kuehn, C.A. Fluid-inclusion systematics in epithermal systems. Rev. Econ. Geol. 1985, 2, 73–97. [Google Scholar]
- Prokofiev, V.Y.; Garofalo, P.S.; Bortnikov, N.S.; Kovalenker, V.A.; Zorina, L.D.; Grichuk, D.V.; Selektor, S.L. Fluid inclusion constraints on the genesis of gold in the Darasun district (eastern Transbaikalia), Russia. Econ. Geol. 2010, 105, 395–416. [Google Scholar] [CrossRef]
- Shepherd, T.J.; Ranbin, A.H.; Alderton, D.H.M. A Practical Guide to Fluid Inclusion Studies; Blackie: Glasgow, UK, 1985; p. 223. [Google Scholar]
- Hedenquist, J.W.; Henley, R.W. The importance of CO2 on freezing point measurements of fluid inclusions; evidence from active geothermal systems and implications for epithermal ore deposition. Econ. Geol. 1985, 80, 1379–1406. [Google Scholar] [CrossRef]
- Wilkinson, J.J. Fluid inclusions in hydrothermal ore deposits. Lithos 2001, 55, 229–272. [Google Scholar] [CrossRef]
- Ohmoto, H.; Rye, O. Isotopes of sulfur and carbon. In Geochemistry of Hydrothermal Ore Deposits; Barnes, H.L., Ed.; Wiley: New York, NY, USA, 1979; pp. 506–567. [Google Scholar]
- Li, Y.B.; Liu, J.M. Calculation of sulfur isotope fractionation in sulfides. Geochim. Cosmochim. Acta 2006, 70, 1789–1795. [Google Scholar] [CrossRef]
- Neiva, A.M.R.; Moura, A.; Carvalho, P.C.S. Metallogenesis at the Terramonte Pb–Zn–Ag quartz vein, Portugal: Geological, mineralogical and geochemical evidences. Ore Geol. Rev. 2015, 71, 14–28. [Google Scholar] [CrossRef]
- Scott, S.D.; Barnes, H.L. Sphalerite geothermometry and geobarometry. Econ. Geol. 1971, 66, 653–669. [Google Scholar] [CrossRef]
- Czamanske, G.K. The FeS content of sphalerite along the chalcopyrite-pyrite-bornite sulfur fugacity buffer. Econ. Geol. 1974, 69, 1328–1334. [Google Scholar] [CrossRef]
- Einaudi, M.T.; Hedenquist, J.W.; Inan, E.E. Sulfidation state of fluids in active and extinct hydrothermals systems: Transitions from porphyry to epithermal environments. In: Simmons, S.F.; Graham, I. Volcanic, Geothermal, and Ore-Forming Fluids: Rulers and Witnesses of Processes within the Earth. Econ. Geol. 2003, 10, 285–313. [Google Scholar]
- Gottesman, W.; Kampe, A. Zn/Cd ratios in calcsilicate-hosted sphalerite ores at Tumurtijn-Ovoo, Mongolia. Chem. Erde 2007, 67, 323–328. [Google Scholar] [CrossRef]
- Simmons, S.F.; Gemmell, J.B.; Sawkins, F.J. The Santo Nino silver-lead-zinc vein, Fresnillo District, Zacatecas; Part II, Physical and chemical nature of ore-forming solutions. Econ. Geol. 1988, 83, 1619–1641. [Google Scholar] [CrossRef]
- Simmons, S.F. Hydrologic implications of alteration and fluid inclusion studies in the Fresnillo District, Mexico; evidence for a brine reservoir and a descending water table during the formation of hydrothermal Ag-Pb-Zn orebodies. Econ. Geol. 1991, 86, 1579–1601. [Google Scholar] [CrossRef]
- Albinson, T.; Norman, D.I.; Cole, D.; Chomiak, B. Controls on formation of low-sulfidation epithermal deposits in Mexico: Constraints from fluid inclusion and stable isotope data. Special Publication-Soc. Econ. Geol. 2001, 8, 1–32. [Google Scholar]
- Shamanian, G.H.; Hedenquist, J.W.; Hattori, K.H.; Hassanzadeh, J. The Gandy and Abolhassani epithermal prospects in the Alborz magmatic arc, Semnan province, Northern Iran. Econ. Geol. 2004, 99, 691–712. [Google Scholar] [CrossRef]
- Çiçek, M.; Oyman, T. Origin and evolution of hydrothermal fluids in epithermal Pb-Zn-Cu±Au±Ag deposits at Koru and Tesbihdere mining districts, Çanakkale, Biga Peninsula, NW Turkey. Ore Geol. Rev. 2016, 78, 176–195. [Google Scholar] [CrossRef]
- Hedenquist, J.W.; Arribas, R.A.; Gonzalez-Urien, E. Exploration for epithermal gold deposits. Rev. Econ. Geol. 2000, 13, 245–277. [Google Scholar]
- Cooke, D.R.; Simmons, S.F. Characteristics and genesis of epithermal gold deposits. Rev. Econ. Geol. 2000, 13, 221–244. [Google Scholar]
- Hedenquist, J.W.; Arribas, A., Jr.; Reynolds, J.T. Evolution of an intrusion-centered hydrothermal system: Far Southeast-Lepanto porphyry and epithermal Cu-Au deposits, Philippines. Econ. Geol. 1998, 93, 373–404. [Google Scholar] [CrossRef]
- Hedenquist, J.W.; Izawa, E.; Arribas, A.; White, N.C. Epithermal Gold Deposits: Styles, Characteristics and Exploration; Society of Resource Geology: Tokyo, Japan, 1996; 18p. [Google Scholar]
- Arribas, A.; Cunningham, C.G.; Rytuba, J.J.; Rye, R.O.; Kelly, W.C.; Podwysocki, M.H.; Mckee, E.H.; Tosdal, R.M. Geology, geochronology, fluid inclusion and isotope geochemistry of the Rodalquilar Au alunite deposits. Spain. Econ. Geol. 1995, 90, 795–822. [Google Scholar] [CrossRef]
- Rye, R.O.; Bethke, P.M.; Wasserman, M.D. The stable isotope geochemistry of acid sulfate alteration. Econ. Geol. 1992, 87, 225–262. [Google Scholar] [CrossRef]
- Camprubí, A.; Albinson, T. Epithermal Deposits in México—Update of Current Knowledge, and an Empirical Reclassification; Geological Society of America Special Papers; The Society: Washington, DC, USA, 2007; Volume 422, pp. 377–415. [Google Scholar]
- Henley, R.W. Ore transport and deposition in epithermal environments. In Proceedings of the Conference on Stable Isotopes and Fluid Processes in Mineralization, Brisbane, Queensland, Australia, 10–12 July 1985; pp. 51–69. [Google Scholar]
- Simmons, S.F.; White, N.C.; John, D.A. Geological characteristics of epithermal precious and base metal deposits. Econ. Geol. 2005, 29, 485–522. [Google Scholar]
- Benning, L.G.; Seward, T.M. Hydrosulfide complexing of Au(I) in hydrothermal solutions from 150 to 400oC and 500 to 1500 bars. Geochim. Cosmochim. Acta 1996, 60, 1849–1871. [Google Scholar] [CrossRef]
- Seward, T.M.; Barnes, H.L. Metal transport by hydrothermal ore fluids. In Geochemistry of Hydrothermal ore Deposits, 3rd ed.; Barnes, H.L., Ed.; John Wiley and Sons: New York, NY, USA, 1997; pp. 435–486. [Google Scholar]
- Marini, L.; Chiappini, V.; Cioni, R.; Cortecci, G.; Dinelli, E.; Principe, C.; Ferrara, G. Effect of degassing on sulfur contents and δ 34 S values in Somma-Vesuvius magmas. Bull. Volcanol. 1998, 60, 187–194. [Google Scholar] [CrossRef]
- Field, C.W.; Fifarek, R.H. Geology and Geochemistry of Epithermal Systems; Society of Economic Geologists, Cop.: El Paso, TX, USA, 1985. [Google Scholar]
- Hedenquist, J.W.; Lowenstern, J.B. The role of magmas in the formation of hydrothermal ore deposits. Nature 1994, 370, 519–527. [Google Scholar] [CrossRef]
- Hedenquist, J.W.; Arribas, R.A.; Aoki, M. Zonation of Sulfate and Sulfide Minerals and Isotopic Composition in the Far Southeast Porphyry and Lepanto Epithermal Cu-Au Deposits, Philippines. Resour. Geol. 2017, 67, 174–196. [Google Scholar] [CrossRef]
- Thiersch, P.C.; Williams-Jones, A.E.; Clark, J.R. Epithermal mineralization and ore controls of the Shasta Au-Ag deposit, Toodoggone District, British Columbia, Canada. Miner. Depos. 1997, 32, 44–57. [Google Scholar] [CrossRef]
- Haas, J.L. The effect of salinity on the maximum thermal gradient of a hydrothermal system at hydrostatic pressure. Econ. Geol. 1971, 66, 940–946. [Google Scholar] [CrossRef]
- Gemmell, J.B. Low and Intermediate-Sulfidation Epithermal Deposits; ARC-AMIRAP: Canberra, Australia, 2004; pp. 57–63. [Google Scholar]
- Sillitoe, R.H.; Hedenquist, J.W. Linkages between Volcanotectonic Settings, Ore Fluid Compositions, and Epithermal Precious-Metal Deposits; Special Publication-Economic Geologists Bull. Society Economic Geologists; Society Economic Geologists: Littleton, CO, USA, 2003; Volume 10, pp. 315–343. [Google Scholar]
- White, N.C.; Hedenquist, J.W. Epithermal environments and styles of mineralization: Variations and their causes, and guidelines for exploration. J. Geochem. Explor. 1990, 36, 445–474. [Google Scholar] [CrossRef]
- Camprubí, A.; Ferrari, L.; Cosca, M.A.; Cardellach, E.; Canals, À. Ages of epithermal deposits in Mexico: Regional significance and links with the evolution of Tertiary volcanism. Econ. Geol. 2003, 98, 1029–1037. [Google Scholar] [CrossRef]
- Albinson, T.; Parrilla, L. Geologic, mineralogic, and fluid inclusion characteristics of polymetallic veins, Real de Guadalupe District, Guerrero. Econ. Geol. 1988, 83, 1975–1984. [Google Scholar]
- Renteria, T.D. Estudio Metalogenetico de la Mina Sombrerete en Zacatecas, Mexico: Tesis Maestro en Ingenieria; Mexico, D.F., Ed.; Universidad Nacional Autonoma de Mexico: Mexico City, Mexico, 1992; 108p. [Google Scholar]
- Drummond, S.E.; Ohmoto, H. Chemical evolution and mineral deposition in boiling hydrothermal systems. Econ. Geol. 1985, 80, 126–147. [Google Scholar] [CrossRef]
- Henley, R.W.; Barton, P.B.; Truesdell, A.H.; Whitney, J.A. Fluid-Mineral Equilibria in Hydrothermal Systems; Society of Economic Geologists: El Paso, TX, USA, 1984; Volume 1. [Google Scholar]
© 2018 by the authors. Licensee MDPI, Basel, Switzerland. This article is an open access article distributed under the terms and conditions of the Creative Commons Attribution (CC BY) license (http://creativecommons.org/licenses/by/4.0/).