Article

Degradation of Thiol Collectors Using Ozone at a Low Dosage: Kinetics, Mineralization, Ozone Utilization, and Changes of Biodegradability and Water Quality Parameters

1
School of Civil and Resources Engineering, University of Science and Technology Beijing, Beijing 100083, China
2
Key Laboratory of High-Efficient Mining and Safety of Metal Mines, Ministry of Education, Beijing 100083, China
*
Author to whom correspondence should be addressed.
Minerals 2018, 8(11), 477; https://doi.org/10.3390/min8110477
Submission received: 16 September 2018 / Accepted: 19 October 2018 / Published: 24 October 2018

Abstract

:
Ozonation at a high O3 dosage can achieve high efficiencies in removing flotation reagents but it has a low ozone-utilization rate. The ozonation of potentially toxic thiol collectors (potassium ethyl xanthate (EX), sodium diethyl dithiocarbamate (SN-9), O-isopropyl-N-ethyl thionocarbamate (Z-200) and dianilino dithiophoshoric acid (DDA)) was investigated in an ozone-bubbled reactor at a low O3 dosage of 1.125 mg/(min·L). The degradation kinetics, mineralization, ozone utilization, changes of biodegradability, and water quality parameters were studied, and the degradation behaviors of four collectors were compared. Thiol collectors could be effectively degraded with a removal ratio of >90% and a mineralization ratio of 10–27%, at a low O3 dosage. The ozonation of thiol collectors followed the pseudo first-order kinetics, and rate constants had the order of kSN-9 > kEX > kZ-200 > kDDA. The Z-200 and DDA were the refractory flotation reagents treated in the ozonation process. After ozonation, the biodegradability of EX, SN-9, and DDA solutions was remarkably raised, but the biodegradability of Z-200 only increased from 0.088 to 0.15, indicating that the Z-200 and its intermediates were biologically persistent organics. After ozonation, the solution pH decreased from 10.0 to 8.0–9.0, and both the conductivity and oxidation-reduction potential increased. The ozone utilization ratio in decomposing thiol collectors was above 98.41%, revealing almost complete usage of input O3. The results revealed that thiol collectors could be effectively degraded by O3, even at a low dosage, but their degradation behaviors were quite different, due to intrinsic molecular properties.

1. Introduction

Froth flotation is extensively used to separate valuable minerals from sulfide ores. Thiol collectors, including xanthates, dithiophosphates, and dithiocarbamates, are important flotation reagents which can render sulfide minerals hydrophobic and facilitate bubble attachments [1]. As a huge amount of sulfide ores are treated annually by froth flotation, the quantities of consumed collectors are extremely large. Even in the 1980s, the global xanthate consumption per year was estimated to be more than 52,000 tons [2]. Therefore, thiol collectors and derived byproducts can be frequently encountered in flotation effluents. The hazards of xanthate to humans or aquatic lives have been comprehensively reviewed [3,4].
To reduce water consumption in mineral processing, the flotation effluents should be circulated into flotation circuits. However, in most cases, residual flotation reagents and their byproducts have negative effects on mineral flotation because these compounds can randomly alter the chemistry of flotation system [5,6]. Therefore, it is necessary to remove residual reagents from flotation effluents to improve water quality of flotation feeding water.
In the past decades, numerous methods have been developed to remove organic reagents from flotation effluents, such as coagulation and precipitation [7], adsorption [8], chemical oxidation [9], advanced oxidation [10,11,12], and biodegradation [13,14]. Adsorption is an efficient and simple technique in removing flotation reagents, but further treatment of sludge with toxic reagents and high water content becomes very difficult. The chemical oxidation with oxidants such as sodium hypochlorite often results in secondary pollution [9]. The biodegradation is a low-cost process for treating flotation effluents. However, the long treatment period [14] and the toxicity of some reagents to microbes [13,15] have limited its application in treating flotation effluents.
Recently, advanced oxidation processes (AOPs), involving ozone [10,11], Fenton’s reagents [16], hydrogen peroxide [17], persulfate [18], photocatalysis [19], and photoelectrooxidation [20] have been studied to degrade organic flotation reagents, especially xanthates. As hydroxyl radicals (·OH) have an oxidation-reduction potential (ORP) of 2.8 V, the AOPs have exhibited high efficiency in decomposing flotation reagents and their intermediates. However, most of these reports have just been limited to the removal of xanthates [10,11,19,20], and little attention is paid to degrading the other thiol collectors, such as dithiophosphates and dithiocarbamates. Since the molecular structures of thiol collectors are quite different, their decomposition behaviors by the AOPs may be different from each other.
Among above mentioned AOPs, ozonation is one of the most promising processes in decomposing organic pollutants. Ozonation at a high O3 dosage can effectively decompose xanthates with a remarkable reduction of COD and generation of SO42− ions [10,11]. In the flotation of sulfide ores, the pulp pH is usually kept at 9–12 [21,22]. Thus, the alkalinity of flotation effluents can enhance the ozonation of organic reagents as OH ions are the catalyst in decomposing O3 to generate·OH [23,24]. Additionally, from the viewpoints of practical applications, ozone can be generated in situ, using air or oxygen as sources, in mines, avoiding the transportation and storage of dangerous chemical oxidants such as H2O2 [17] and sodium hypochlorite [9]. Therefore, ozonation is considered to be an appropriate technique to treat flotation effluents in mines.
However, ozonation is somewhat disputed for high energy consumption in O3 generation [25,26]. Thus the ozone utilization becomes very critical in economic valuation of ozonation. In our previous study, O3 utilization in degrading n-butyl xanthate ranged from 7.2 to 51.7% at the O3 dosage of 5.88–50.36 mg/(min·L) [11]. Even when ultraviolet radiation (UV) was combined to promote the decomposition of O3, the O3 utilization in UV/O3 process only increased by 15–30%, compared to pure O3 [11]. Liu et al. [10] observed fast degradation of butyl xanthate at high O3 dosage of 145.59 mg/(min·L), but the O3 utilization was not concerned. As the reagent concentration in flotation pulps is usually 10−3–10−4 mol/L [27], the pollutant concentration in flotation effluents is much lower than that of pharmaceutical effluents and petrochemical wastewaters [28,29]. In ozonation, a lower concentration of organics usually leads to a declined O3 decomposition rate, resulting in lower ozone utilization. Thus, a lower O3 dosage might achieve a higher O3 utilization, in the treatment of flotation effluents. Therefore, it is necessary to investigate the degradation efficiencies of flotation reagents and ozone utilization at low O3 dosage.
In this study, four thiol collectors, potassium ethyl xanthate (EX), sodium diethyl dithiocarbamate (SN-9), O-isopropyl-N-ethyl thionocarbamate (Z-200), and dianilino dithiophoshoric acid (DDA), were selected as the sulfide mineral collectors. The O3 dosage was controlled to be as low as 1.125 mg/(min·L), much lower than that previously used in the ozonation of xanthates [10,11]. The aims of this work were, (1) to investigate degradation kinetics, mineralization, and changes of biodegradability and water quality parameters in degrading thiol collectors using O3, (2) to compare degradation efficiencies of thiol collectors with different molecular structures, and (3) to evaluate the ozone utilization and energy consumption efficiency at a low O3 dosage. The result can provide fundamental aspects of ozone utilization and degradation behaviors of potentially toxic sulfide mineral collectors, at a low O3 dosage.

2. Materials and Methods

2.1. Chemicals

The EX and SN-9 with analytical grade were purchased from Shanghai Aladdin Chemical Reagent Co., Ltd., Shanghai, China. The Z-200 and industrial grade DDA were purchased from Tieling Flotation Reagents Co. Ltd., China. Their molecular formulas, molecular structures, and abbreviations used are summarized in Table 1. By storing the collectors in a brown vacuum desiccator, they were separated from air and radiation, to prevent the oxidation. Other chemicals, such as iodine (I2), potassium iodide (KI), silver sulfate (Ag2SO4), mercury sulfate (HgSO4), and potassium bichromate (K2Cr2O7) were of analytical grade and were purchased from Sinopharm Chemical Reagent Beijing Co., Ltd., Beijing, China. In all experiments, deionized water was used.

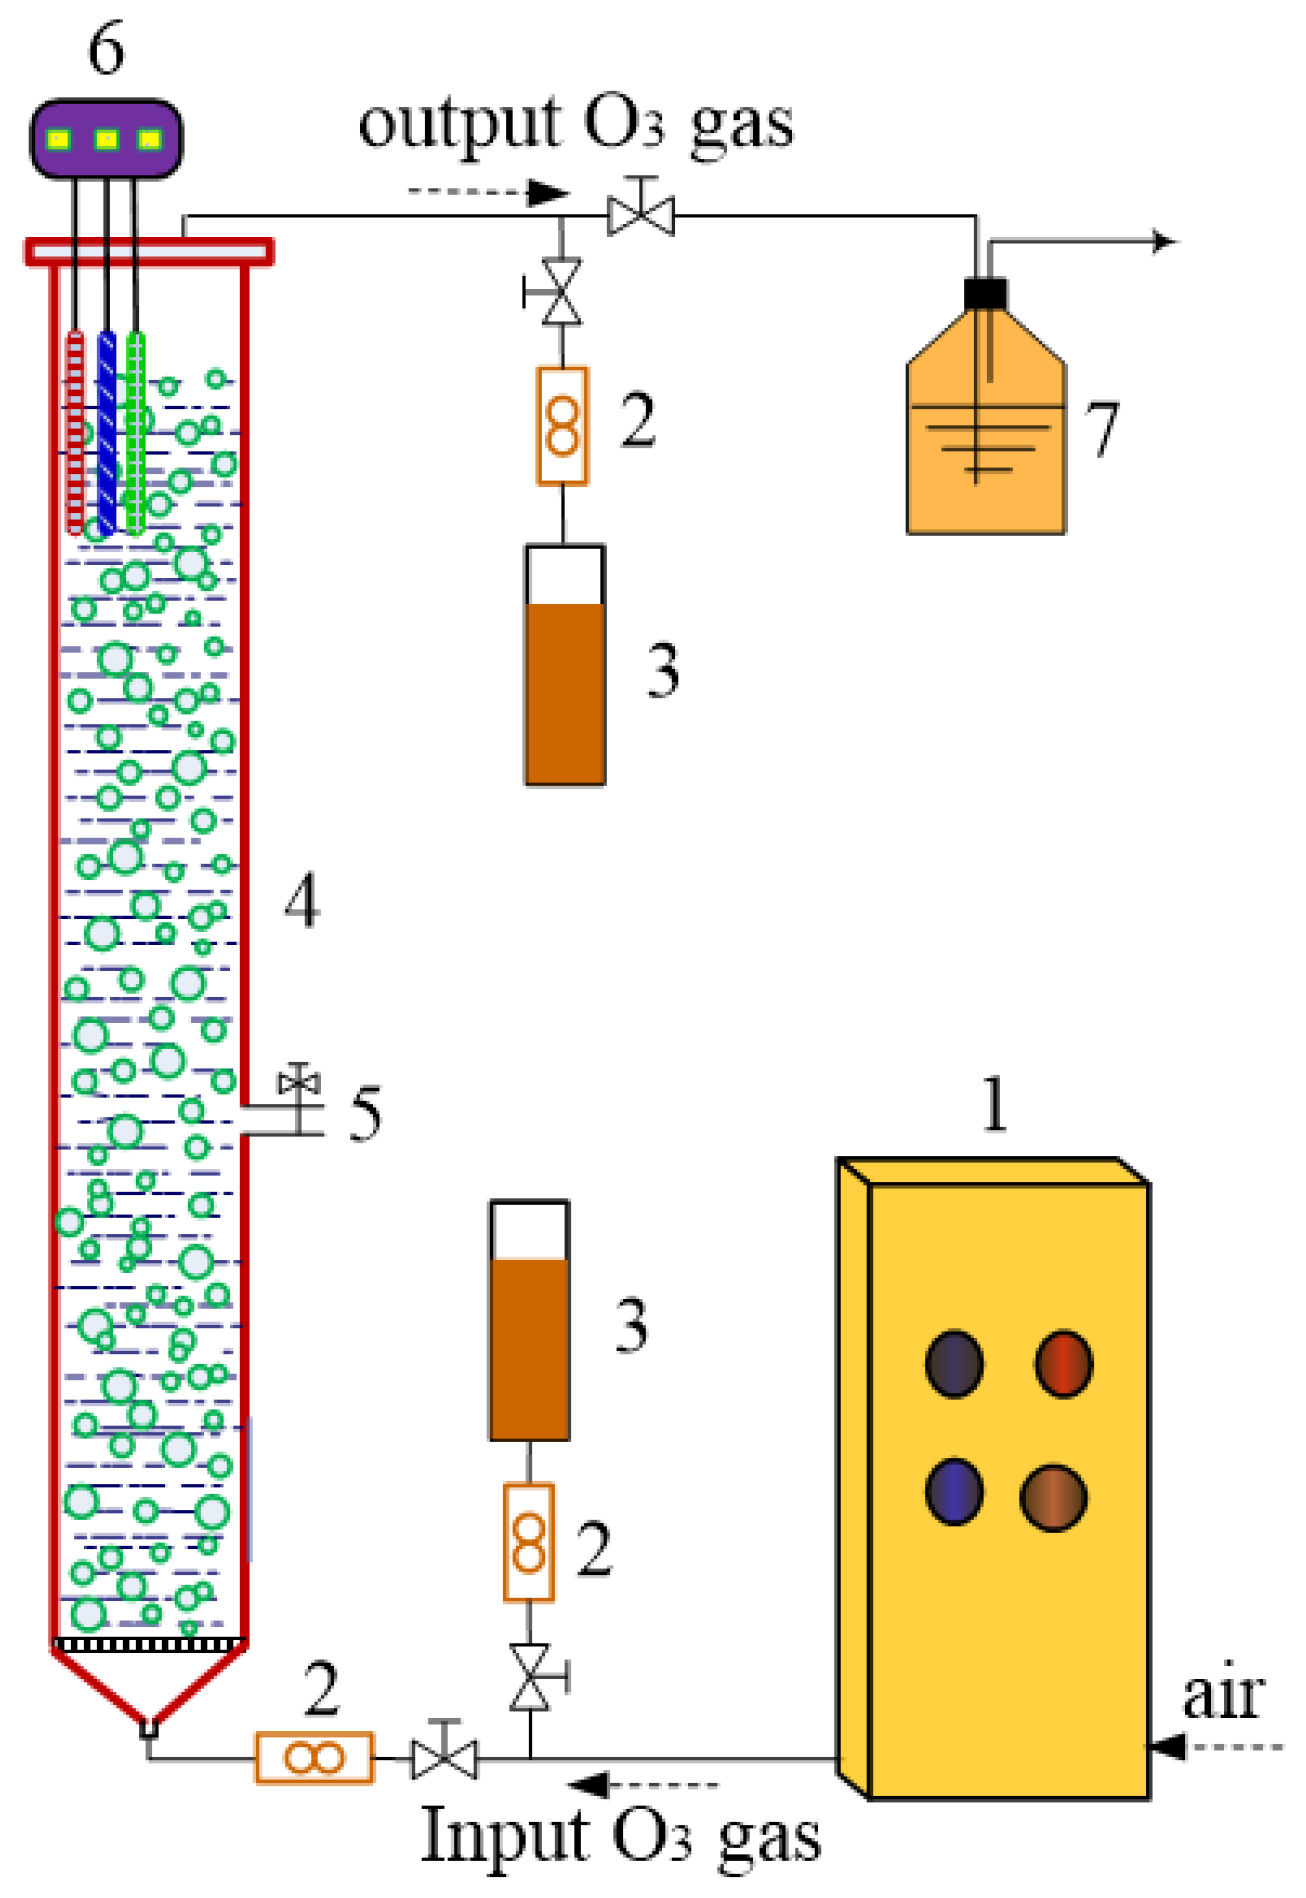
2.2. Experimental Procedures

All the degradation experiments were conducted with a batch mode in a jacket glass bubbled reactor connected to a thermostatic bath. The schematic diagram of experimental setup is shown in Figure 1. The cylindrical reactor, with a height of 1150 mm and internal diameter of 50 mm, was installed with a porous glass plate at the bottom to distribute the O3 stream. Ozone was generated with air as the source, by an O3 generator (SW-004, Qingdao West Electronic Purifiers Co., Qingdao, China). The O3 stream was introduced into the reactor with a steady-state O3 concentration of 1347 mg/m3 and at a gas flow rate of 0.1 m3/h. The degradation experiments were carried out at 25 ± 2 °C.
Prior to degradation experiments, the collector (0.2 g) was dissolved in 2 L deionized water to prepare an EX (SN-9, Z-200 or DDA) solution of 100 mg/L concentration. The initial pH was adjusted to 10.0 with 0.05 mol/L NaOH or HCl solution. While 2 L collector solution was introduced into the reactor, bubbled with an O3 stream, the degradation began at the O3 dosage of 1.125 mg/(min·L). As the four different collectors had different degradation efficiencies, to achieve the collector removal ratio of 90–100%, for the comparison, the ozonation time was chosen to be 90, 90, 120, and 180 min for the EX, SN-9, Z-200, and DDA, respectively. The aqueous samples were taken at designed intervals to determine the concentrations of collector, SO42− ions, COD, BOD5, and TOC. The water quality parameters (pH, conductivity, oxidation-reduction potential (ORP)) were measured by immersing the electrodes into solutions as shown in Figure 1.

2.3. Analysis and Calculation

2.3.1. Determination of the Collector Concentration

The xanthate concentration has always been determined by the UV-vis spectroscopic method. However, this method has seldom been reported to measure the concentration of the SN-9, Z-200 and DDA [13]. Figure 2a showed the UV-vis absorbance spectra of EX, SN-9, Z-200, and DDA solutions recorded by a UV-vis spectrophotometer (UV-5500PC, Shanghai Metash Instruments Co. Ltd., Shanghai, China). The maximum absorption peaks appeared at 301 nm for EX, 256 nm for SN-9, 241 nm for Z-200, and 230 nm for DDA solution, respectively. The plots of the collector concentration versus absorbance at its characteristic absorption wavelength are shown in Figure 2b. The correlation coefficients (>0.99) indicated that calibration curves could be used to calculate the collector concentration by recording its absorbance.
Thus, in this work, the concentration of four collectors was determined by the UV-vis spectroscopic method. The removal ratio of the collector was calculated as the following:
β collector = C 0 C t C 0 × 100 %
where βcollector was the removal ratio of the collector (EX, SN-9, Z-200 or DDA), C0 and Ct (mg/L) were the collector concentration at initial and time t, respectively.

2.3.2. Determination of COD, BOD5, TOC, and Concentration of SO42− ions

The chemical oxygen demand (COD) was determined by the standard dichromate method (HJ/T 399‒2007). The biochemical oxygen demand (BOD5) was detected by the classic dilution and inoculation method (HJ 505‒2009). The aqueous samples were incubated at 20 °C, for 5 days. The total organic carbon (TOC) concentrations were measured using a Shimadzu TOC-V organic carbon analyzer. The concentration of SO42− ions was determined by a barium chromate spectrophotometry method (HJ/T 342–2007). In this study, the removal ratio of COD was obtained by Equation (2), as follows:
β COD = C O D 0 C O D t C O D 0 × 100 %
where βCOD was the removal ratio of COD, COD0 and CODt (mg/L) were the COD concentration at initial and time t, respectively.
The carbon mineralization ratio was calculated by Equation (3), as follows:
γ C = T O C 0 T O C t T O C 0 × 100 %
where γC was the carbon mineralization ratio of the collector, and TOC0 and TOCt (mg/L) were the TOC concentration at initial and time t, respectively. As the SO42− ions, with the highest valence of sulfur, were the final products during the oxidation of organic sulfur in thiol collectors, the sulfur mineralization ratio was defined by Equation (4), as follows:
γ S = M n × 96 × C SO 4 2 , t C 0 × 100 %
where γS was the sulfur mineralization ratio of the collector, M and n were the molecular weight and number of sulfur atom in the collector molecule (EX, SN-9, Z-200 or DDA), respectively, C SO 4 2 , t was the concentration of SO42− ions at time t, and C0 (mg/L) was initial collector concentration.

2.3.3. Analysis of Water Quality Parameters

Water quality parameters of ozonated solutions, including solution pH, conductivity and ORP, were measured by a multi-parameter water quality meter equipped with different electrodes (Bante 900-UK, Shanghai Bante Instruments Co. Ltd., Shanghai, China). The solution pH was measured by a pH combination electrode (P11 mode). Before the measurement, it was calibrated with buffer solutions of pH 4.01, 7.00 and 10.01. The conductivity was determined by a glass conductivity probe with platinum cells (K10 mode). The ORP was recorded using an epoxy ORP electrode (501 mode), which was composed of a platinum pin and Ag/AgCl reference electrode.

2.3.4. Analysis of Gaseous O3 Concentration

The gaseous O3 concentration was determined by the KI absorption method (CJ/T 3028.2-94). The O3 concentration in the output O3 gas was measured after 30 min of ozonation to meet the solubility equilibrium of O3 in solutions. The ozone utilization ratio was calculated by Equation (5), as follows:
η O 3 = C O 3 , in C O 3 , out C O 3 , in × 100 %
where ηO3 was the ozone utilization ratio, CO3,in and CO3,out (mg/m3) were the O3 concentration in input and output O3 gas streams, respectively.

3. Results and Discussion

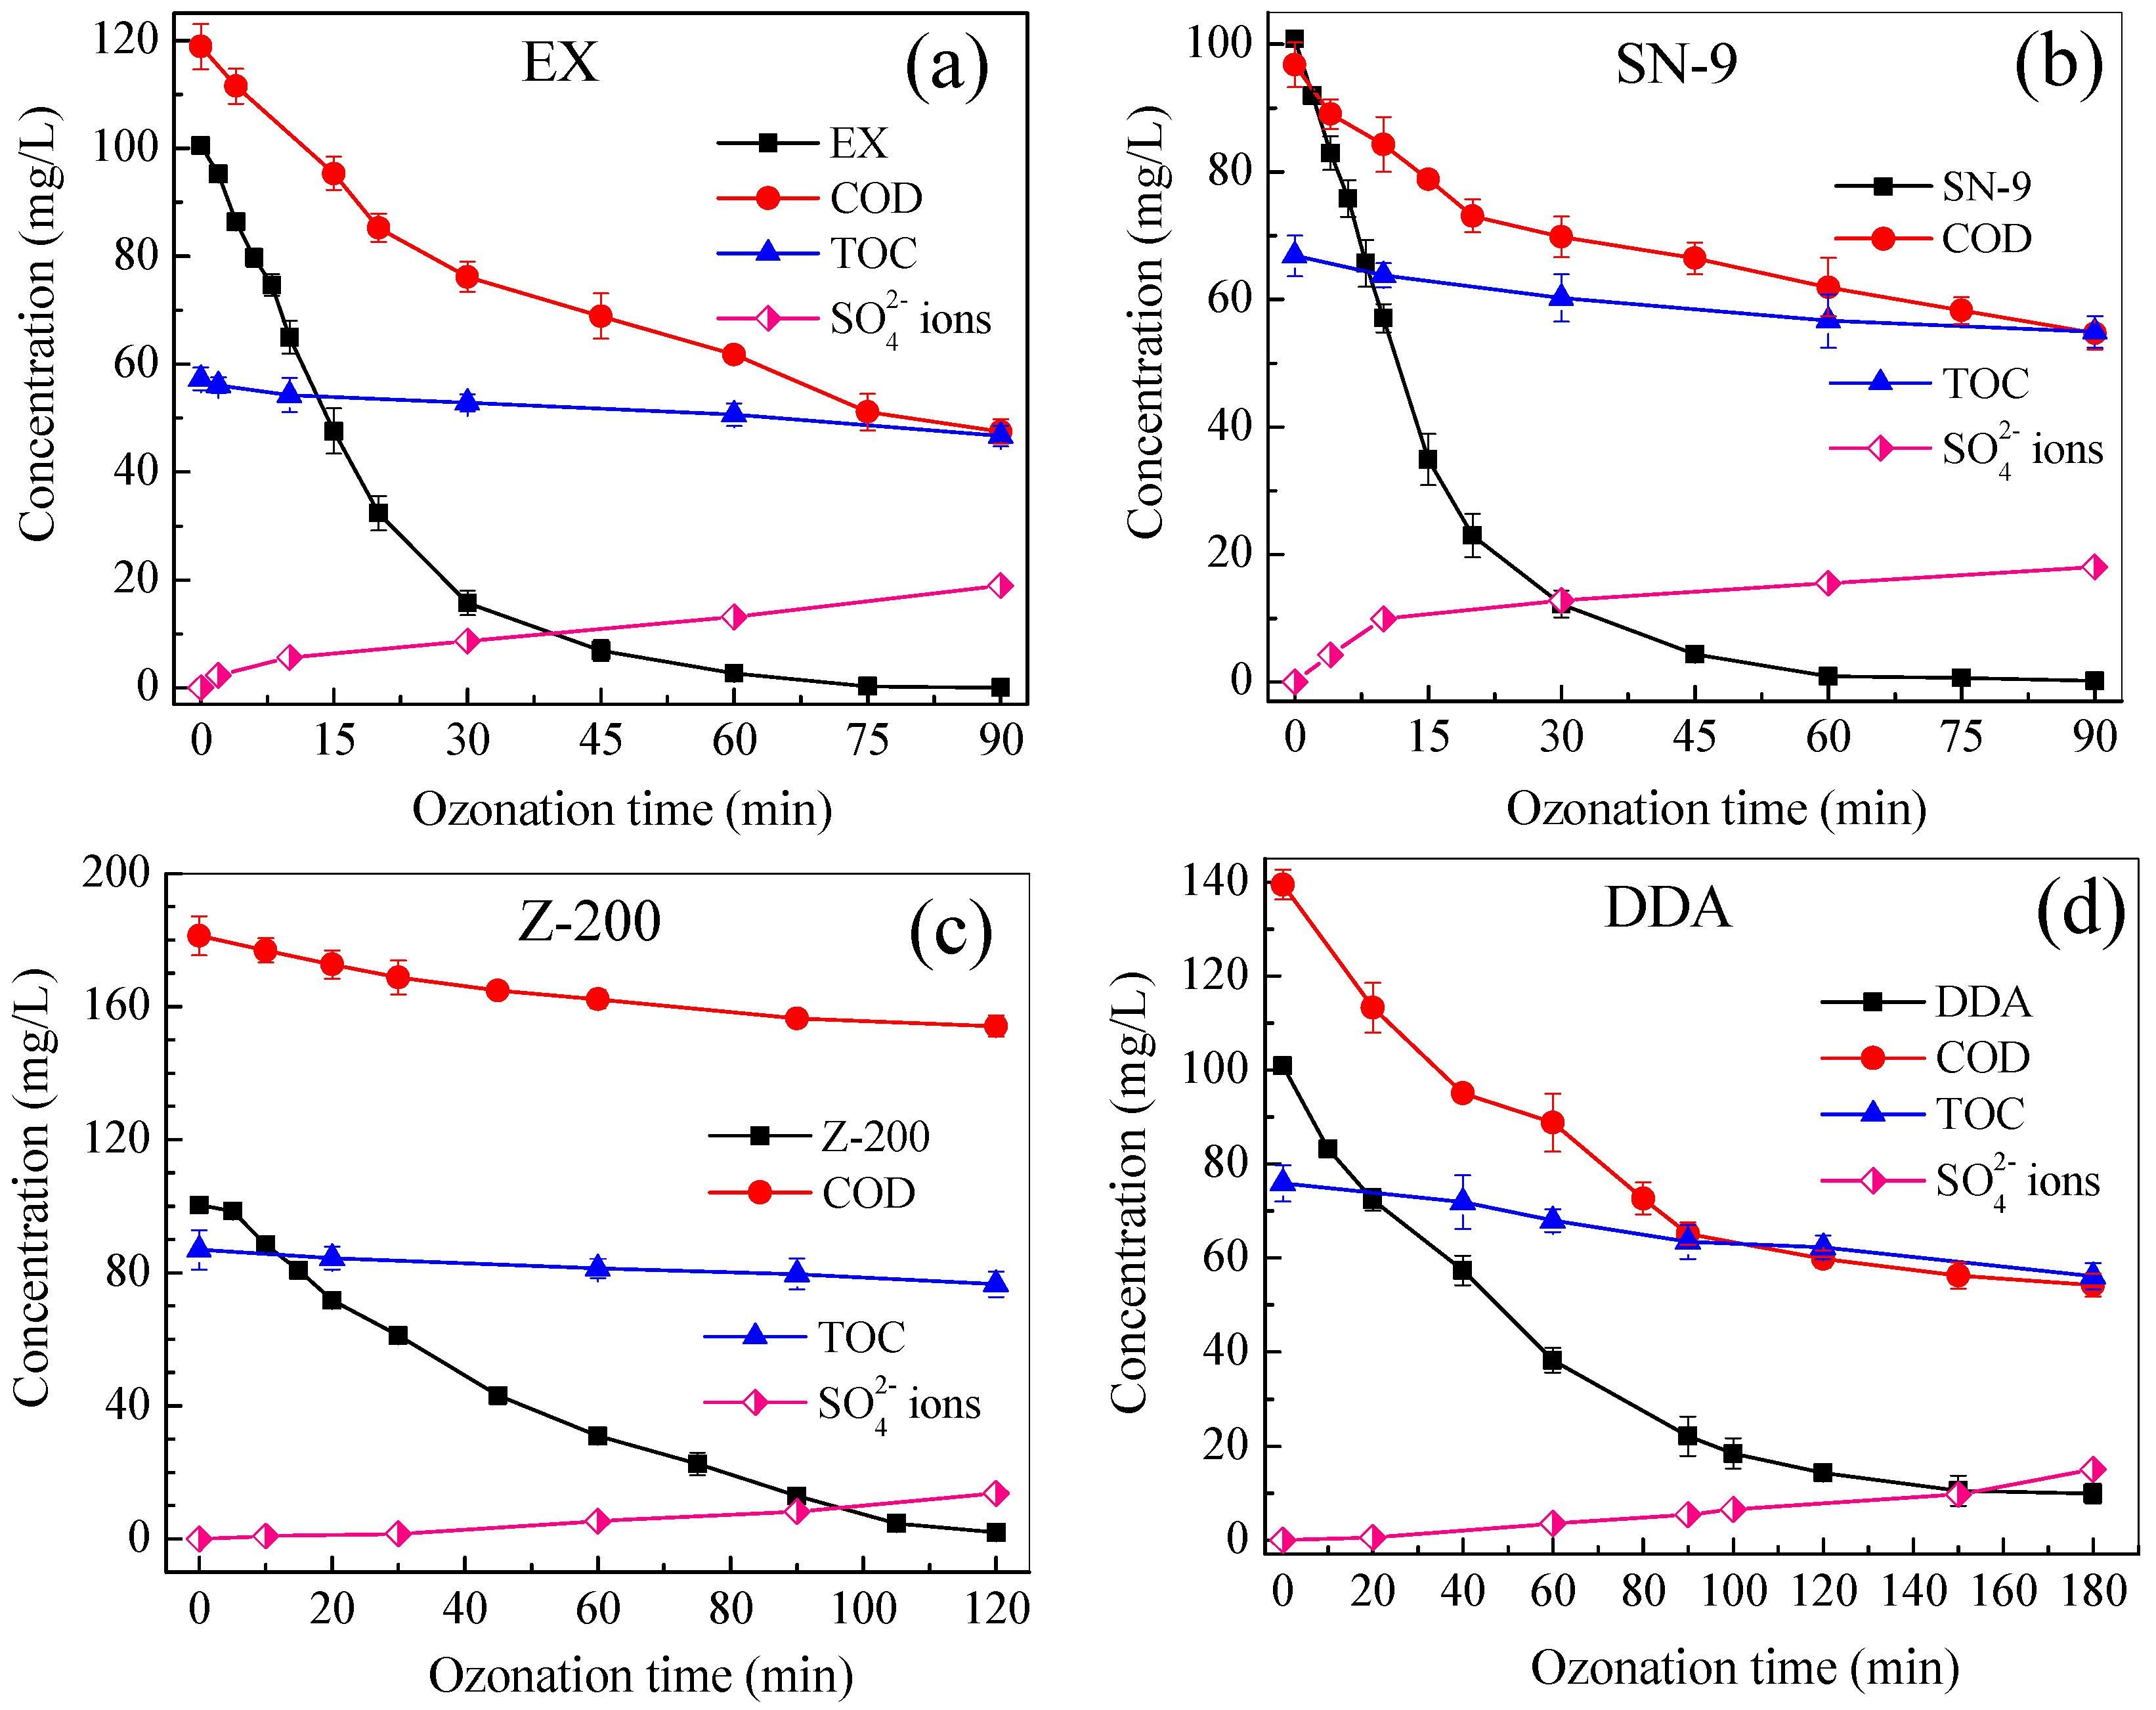
3.1. Degradation Kinetics of Thiol Collectors

The degradation behaviors of thiol collectors by O3 are shown in Figure 3a. Figure 3b illustrated the logarithmic plot of ln(Ct/C0) versus ozonation time t, and kinetic parameters were summarized in Table 2. As shown in Figure 3a, EX, and SN-9 were rapidly degraded by O3, but the degradation of Z-200 and DDA were much slower. At 90 min, the removal ratio of EX and SN-9 was close to 100%, but only 87.38% of the Z-200 and 79.71% of the DDA were removed. By extending the ozonation time, 98.39% of Z-200 could be removed at 120 min, but only 90.91% of DDA was degraded even at 180 min. As shown in Figure 3b and Table 2, the removal of thiol collectors by O3 could be well described by the pseudo first-order kinetic models. By comparing rate constant of kcollector, it could be seen that the degradation by O3, for the four collectors, followed the order of kSN-9 > kEX > kZ-200 > kDDA. Especially, the kcollector of SN-9 and EX was almost three times higher than that of Z-200 and DDA. The results revealed that in terms of ozonation, the SN-9 and EX could be easily decomposed, but the Z-200 and DDA were refractory flotation reagents.
Due to low operation cost, the biodegradation has been tested to degrade some flotation reagents. The first-order biodegradation rate constants of SN-9 and Z-200 were reported to be 3.13 × 10⁻⁴ and 4.17 × 10⁻⁵ min−1, respectively [13]. By comparing the kSN-9 (0.0687 min−1) and kZ-200 (0.0194 min−1) in Table 2, it was clear that the rate constant in ozonation was two‒three orders higher than that in the biodegradation of same flotation reagent. The ozonation even at a low O3 dosage achieved a much higher efficiency than the biodegradation in degrading flotation reagents.
Nowadays, residual flotation reagents are usually removed in tailing ponds with a natural degradation process. The first-order rate constant of EX natural degradation has been reported by Sun et al. [4] to be 2.094 × 10⁻⁵ min−1, with a half-life of 22.99 day, at pH 7 and 25 °C, and have been given by Shen et al. [30] to be 1.55 × 10⁻⁵ min−1, at pH 6.8 and 20 °C. Chen et al. [31] observed almost no natural degradation of EX at a pH ≥ 5, in 4 h. However, for the EX degradation, the ozonation at a low O3 dosage of 1.125 mg/(min·L) could achieve the kEX of 0.0579 min−1, with a half-life of 11.97 min. Therefore, compared to a natural degradation process, ozonation at low O3 dosage can effectively degrade flotation reagents, within a much shorter treatment time.

3.2. Carbon and Sulfur Mineralization of Thiol Collectors

In the ozonation of the thiol collectors, the concentrations of COD, TOC, and SO42− ions were measured, as illustrated in Figure 4. For all collectors investigated, the concentration of both COD and TOC decreased with the increase of SO42− concentration while the collector was degraded. Compared to the significant decrease of COD, the decline of TOC was much slower. As shown in Table 3, at the collector removal ratio of >90%, the removal ratio of COD was approximately below 62% and the carbon mineralization ratio (γC) was just lower than 27%, respectively. When comparing the rate constants of collector and COD removal (summarized in Table 2 and Table 3), the kcollector value was found to be 2–10 times higher than the kCOD, for each collector. It was revealed that only a small fraction of carbon in thiol collectors was completely mineralized by O3, although all of the above 90% of collectors were decomposed. In the ozonation of n-butyl xanthate, n-butanol was detected by UPLC/Q-TOF-MS [32], and O-butyl peroxydithiocarbonate was found [11]. Thus, it could be reasonably inferred that most organic carbon in thiol collectors were still in the forms of reductive organic intermediates, after the ozonation.
As illustrated in Figure 4, the concentration of SO42− ions increased to 18.93 mg/L for EX, 18.07 mg/L for SN-9, 13.65 mg/L for Z-200, and 15.01 mg/L for DDA, respectively, at the end of ozonation. The generation of the SO42− ions indicated the complete oxidation of organic sulfur in the thiol collectors. However, as given in Table 3, the sulfur mineralization ratio (γS) was just below 22%, indicating that some sulfur byproducts, such as CS2, S2− and organics containing sulfur, might exist in solutions [10,11,30,32]. As volatile sulfur species such as CS2 and H2S were generated, they may have been emitted from ozone-bubbled solutions into a gas phase, resulting in lower γS values. For example, Yan et al. [32] had inferred the emitting of 20.6% sulfur into the gas phase in decomposing n-butyl xanthate by O3. Generally, in this work, the mineralization ratio of carbon and sulfur for the four collectors ranged from 10% to 27%, at the collector removal ratio of above 90%.
As given in Table 3, the γC of Z-200 at 90 min was just 8.31%, much lower than that of EX, SN-9, and DDA at 90 min. The kCOD of EX, SN-9, and DDA was 5.91, 3.69, and was 4.14 folds higher than that of Z-200, respectively. It clearly revealed that the intermediates derived from the Z-200 were hardly oxidized by O3. Although the DDA was very refractory in the ozonation, the γC of the DDA was close to that of EX and SN-9 at 90 min, indicating that its intermediates could be readily decomposed by O3. By considering γC and γS together, the mineralization of four collectors by O3 had the following order: SN-9 ≈ EX > DDA > Z-200.
In general, ozonation reactions are divided into two main pathways—direct ozone oxidation, occurring at pH < 4.0 and indirect ozone oxidation, occurring at pH > 10.0. At the pH of 4.0–10.0, both pathways exist, but direct ozone oxidation becomes predominant in the neutral and weak acid medium [33,34]. As shown in Figure 5, the solution pH decreased from 10.0, initially, to 8.0–9.0 at the end of ozonation. Therefore, in this case, the direct ozone oxidation might have greatly contributed to the collector decomposition during most of the ozonation period. Unfortunately, the direct oxidation of organics by O3 has some disadvantages of low reaction rate and strong selectivity, as compared to oxidation by free radicals [35,36,37]. Thus, the intermediates, hardly oxidized by O3 molecules, should be accumulated in the solutions.

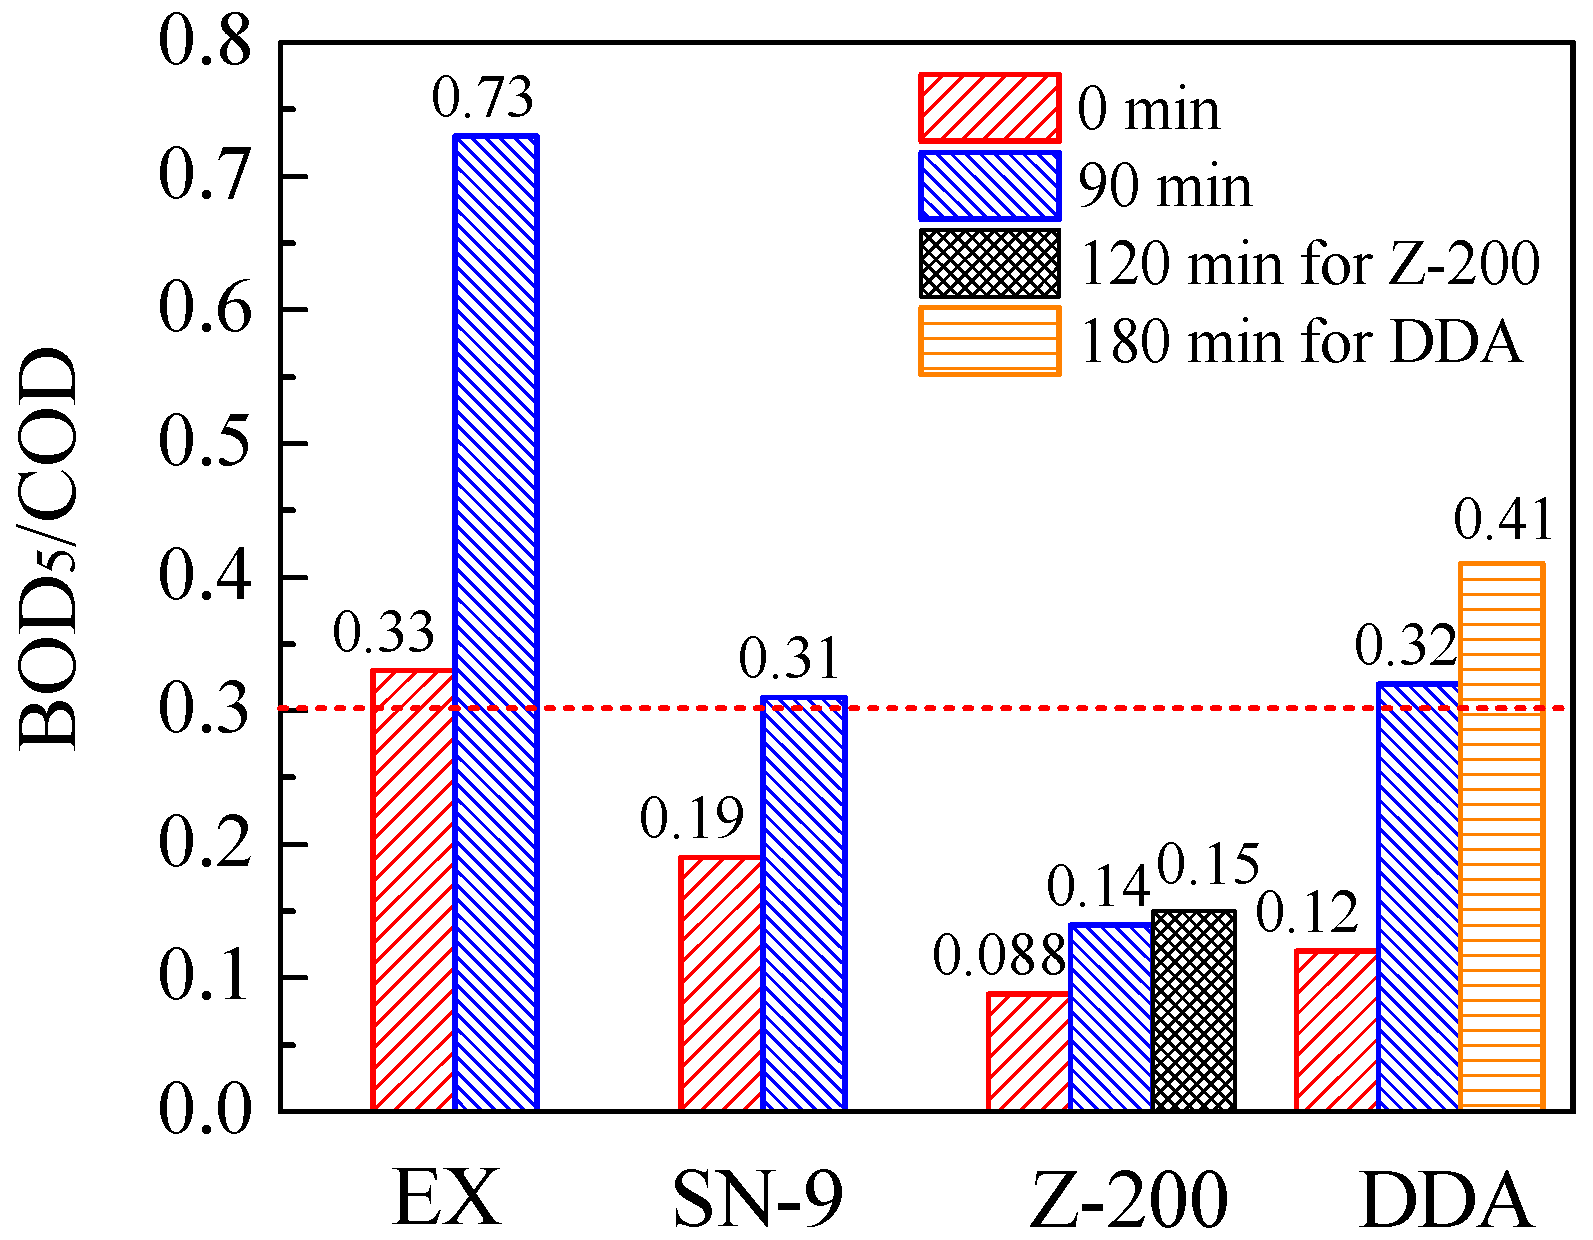
3.3. Variation of Biodegradability

Although biodegradation is a low-cost procedure for removing organic pollutants, some flotation reagents, such as n-butyl xanthate [10], butyl amine aerofloat [10], ethylthionocarbamate [13], turpentine [38], isopropyl xanthate [39], and aniline aerofloat [40], are hardly biodegraded due to their special molecular structures. However, the intermediates derived by O3, from these reagents, might become biodegradable [10]. Thus, a combined ozonation and biodegradation process may be more feasible than ozonation or biodegradation alone, in treating flotation effluents.
In this study, the variation of biodegradability of thiol collectors, before and after ozonation, was investigated. As shown in Figure 6, the BOD5/COD for EX, SN-9, Z-200, and DDA solutions before the ozonation was 0.33, 0.19, 0.088, and 0.12, respectively. In general, organic pollutants with the BOD5/COD of >0.3 are considered to be biodegradable [10]. Thus, it was clear that excepting the EX, the SN-9, Z-200, and DDA were biologically persistent flotation reagents. After ozonation for 90 min, the BOD5/COD for EX, SN-9, and DDA solutions increased to 0.73, 0.31, and 0.32, respectively, indicating the generation of biodegradable intermediates. However, the BOD5/COD for Z-200 solution just increased from 0.088 to 0.15, after ozonation for 120 min, revealing that its intermediates were still hardly biodegraded. It can be seen that both the Z-200 and its intermediates were biologically persistent organics. For all four collectors investigated, the increase of the biodegradability, after the ozonation, followed the order of EX > DDA ≈ SN-9 > Z-200.

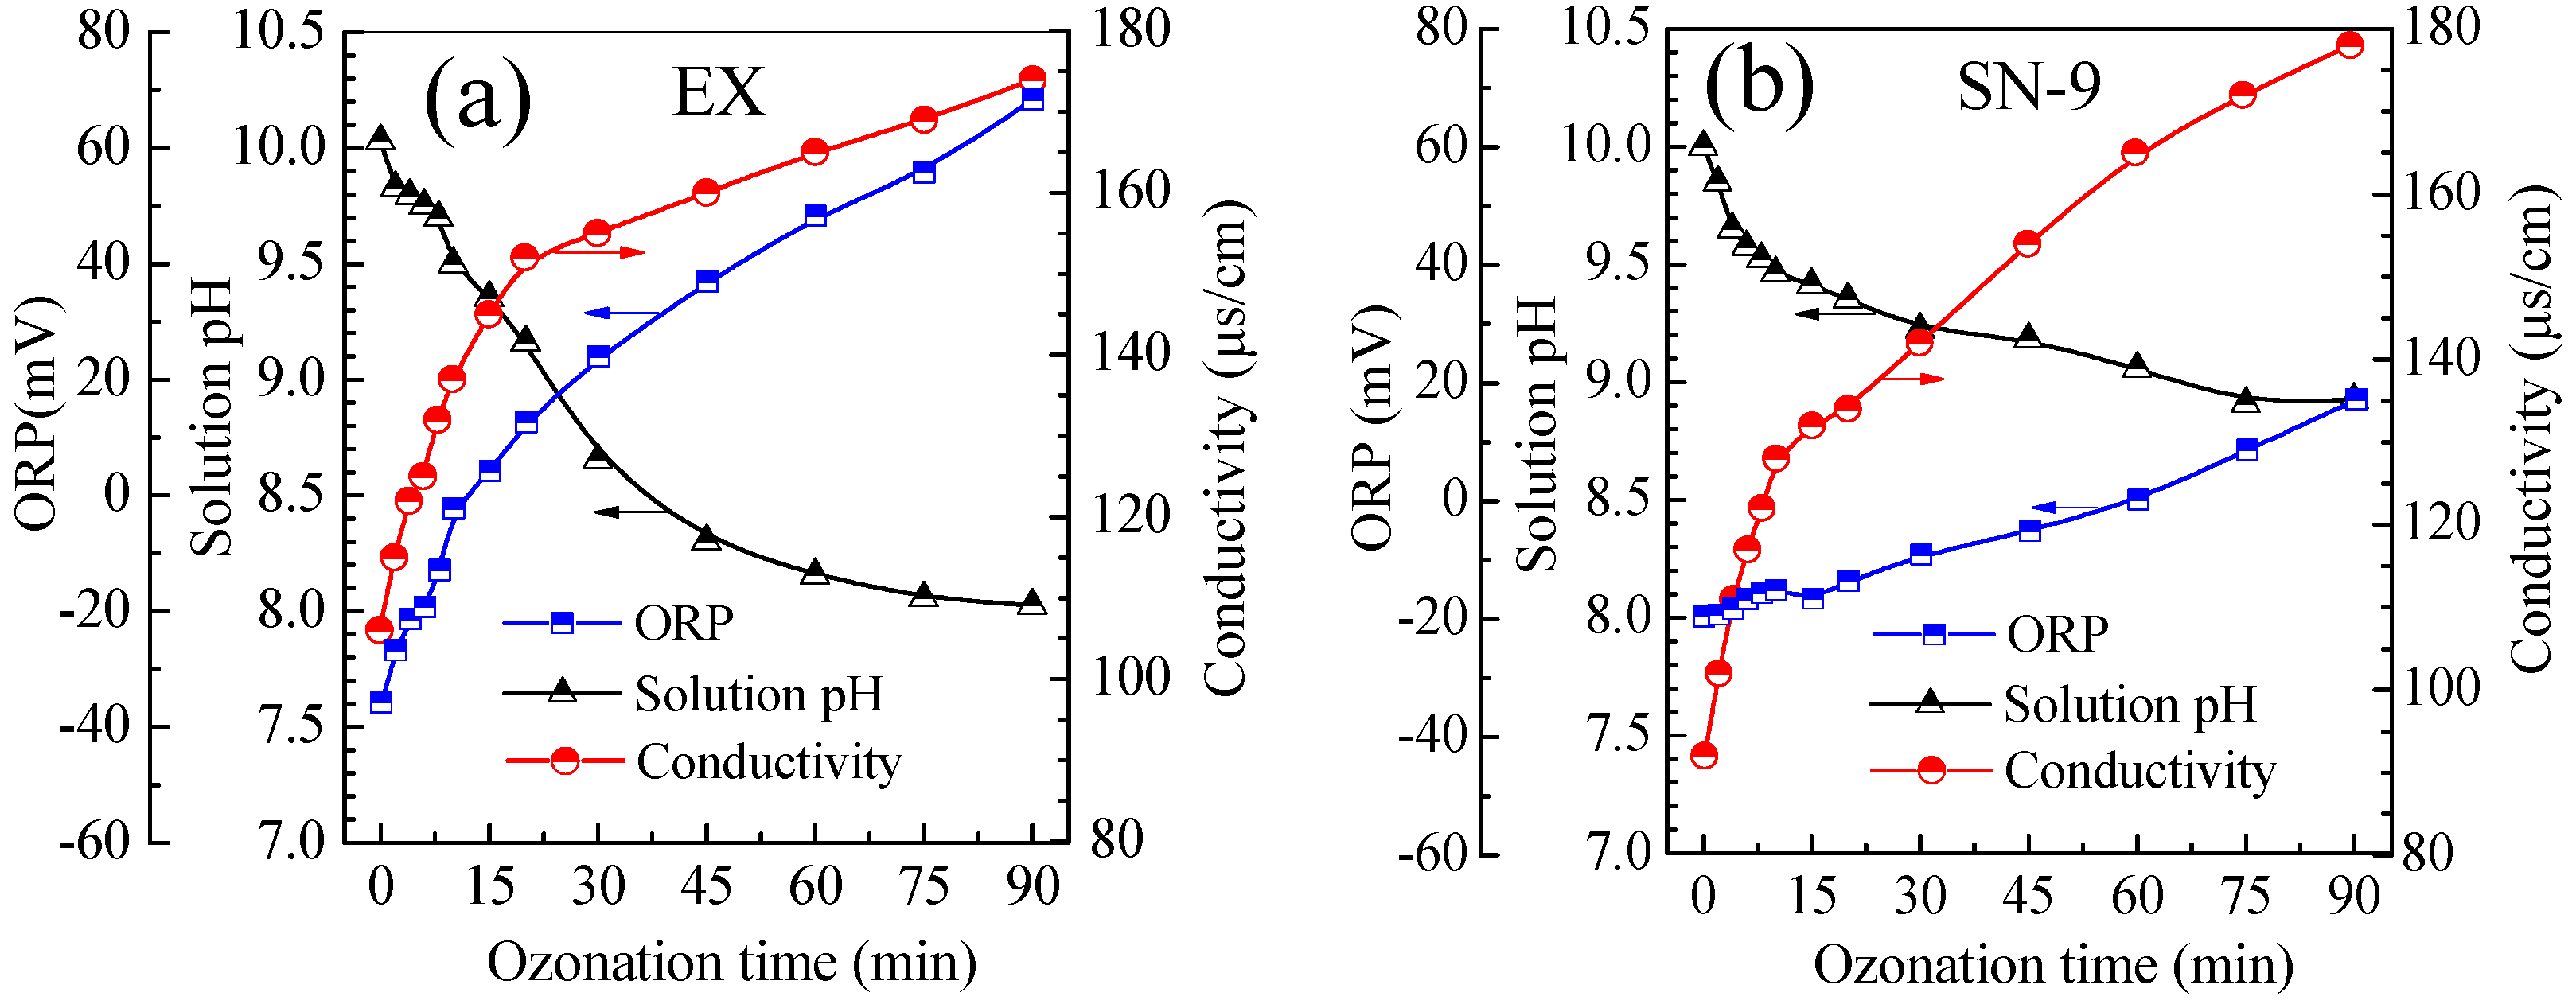
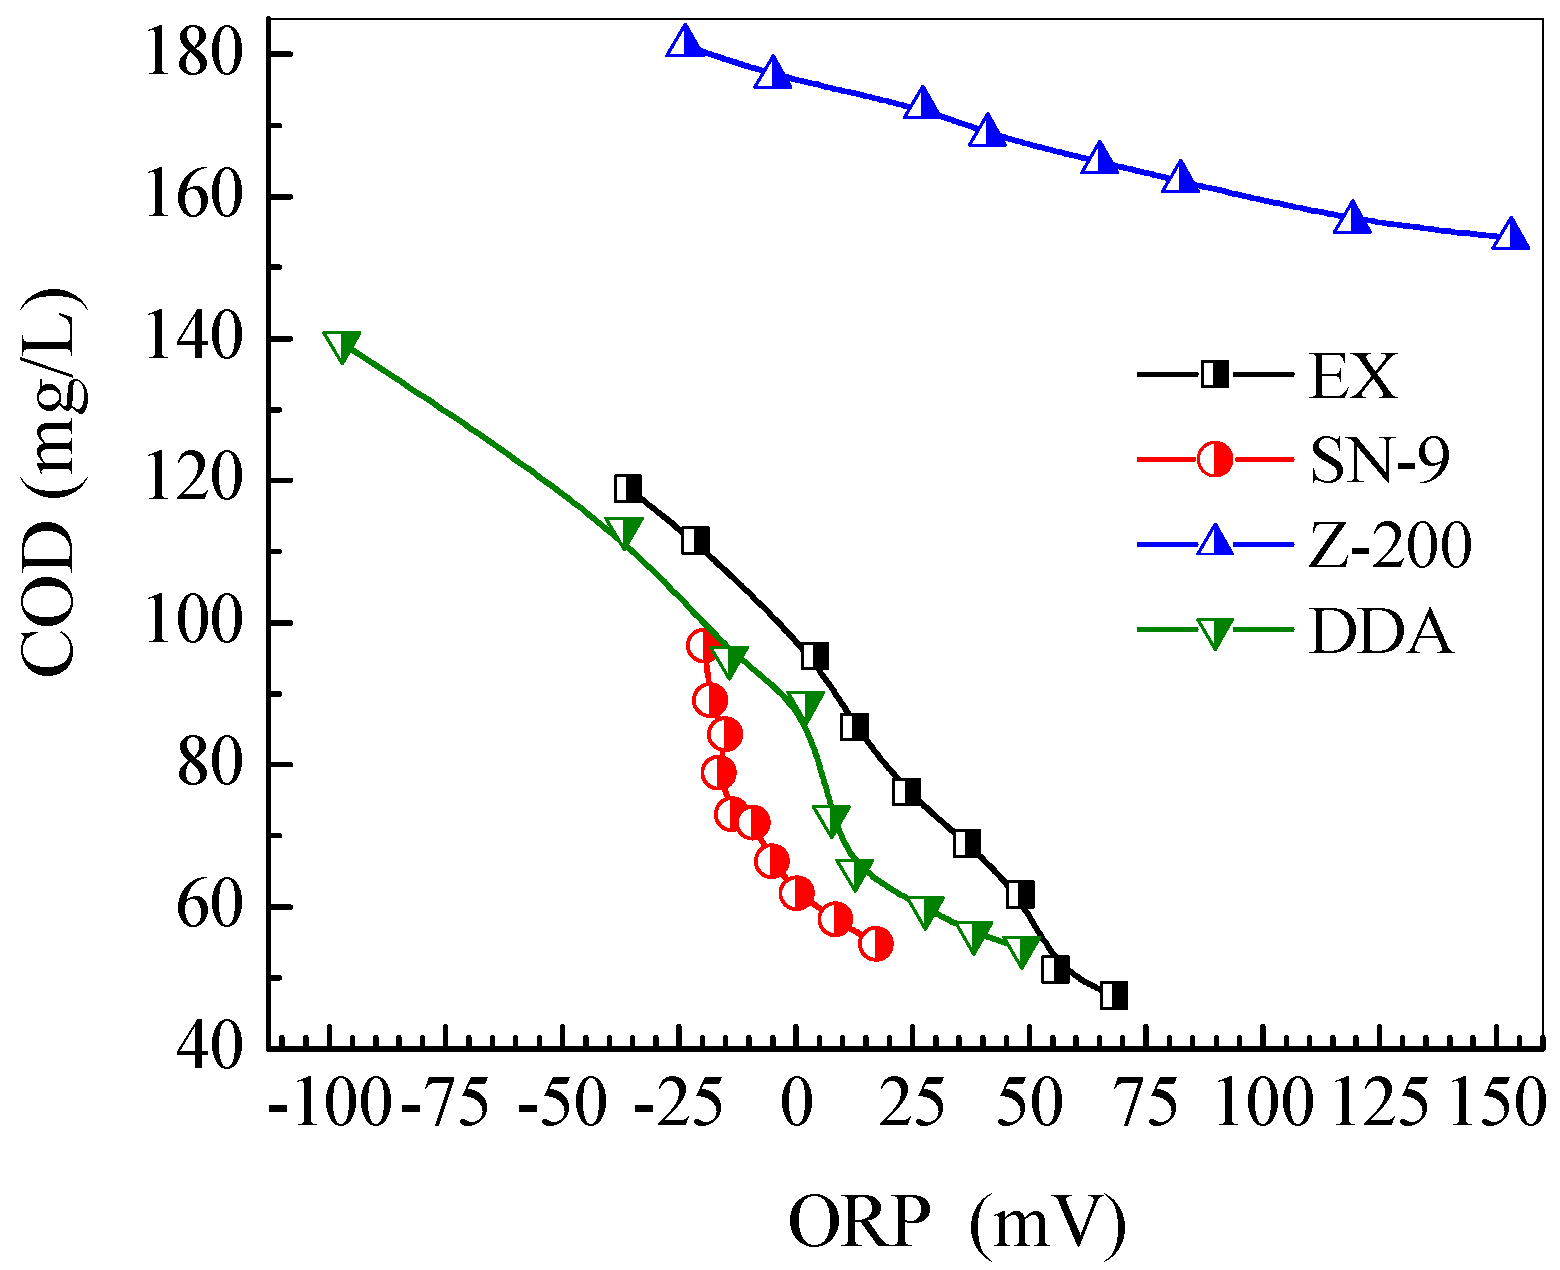
3.4. Evolution of Solution pH, ORP and Conductivity

In the flotation of sulfide minerals, solution parameters such as pulp pH and ORP are very important in determining the floatability of minerals and interaction of flotation reagents with minerals [41,42,43,44]. Since treated flotation effluents will be reused in flotation circuits as feeding water, the changes of both solution parameters and reagent concentrations should be revealed to better understand the quality of reused flotation water. However, in the previous works of degrading flotation reagents by O3 [10,11,32], H2O2 [31], Fenton reagents [45], and sodium hypochlorite [9], little attention was paid to revealing the evolution of solution parameters, except for the pH value.
In this work, the solution pH, ORP, and conductivity in degrading collectors were recorded as shown in Figure 5. For four collectors studied, the solution pH was declined from 10.0 to 8.0‒9.0, and the increase of the conductivity reached 68, 86, 101, and 121 μs/cm for EX, SN-9, Z-200, and DDA solution, respectively, at the collector removal ratio of >90%. The indirect ozonation reactions were initiated with catalytic decomposition of O3 by OH ions, as shown in Equations (6)‒(11) [23,24]. The chain reactions of O3 decomposition could generate free radicals, such as OH, HO2, and·O2, which were responsible for breaking the chemical bonds of organics. Thus H+ ions were continually dissociated from H2O, with an observed decrease of solution pH. In addition, simple carboxylic acids, such as formic and acetic acids could be generated via indirect reactions [46,47], which also contributed to the acidity of collector solutions. Thus, the pH of collector solutions was decreased after the ozonation.
H 2 O H + +   OH
O 3 + OH HO 2 +   O 2
HO 2 H + +   O 2
O 3 + O 2 O 3 + O 2
O 3 + H + HO 3
HO 3 OH + O 2
In the degradation of xanthates by O3 or H2O2, inorganic ions, such as S2−, S2O32−, SO42− and CO32− were observed to be readily generated [10,11,31]. Ionized intermediates, such as O-ethyl thiocarbonate (ETC) and O-ethyl peroxydithiocarbonate (EPX) were also detected in the oxidation of EX by H2O2 [17]. Therefore, the increase of conductivity directly revealed that some ionic intermediates were generated in the ozonation of collectors. The higher conductivity in Figure 5 corresponded to a lower concentration of collector and COD, as shown in Figure 4.
In the ozonation process, it is frequently observed that the ozone consumption rate will remarkably decrease with a rapid increase of the ORP and the reduction of pollutant removal efficiency, while the pollutant concentration goes below a certain value [48,49]. So, the ORP is a useful indicator in the control of O3 addition, to minimize the process cost [48,50,51]. For the mineral flotation, the ORP is found to determine the oxidation of collectors and speciation of metal ions [41,44]. Thus, the revelation of ORP evolution is very important for both the control of O3 addition and the reuse of treated flotation effluents.
As shown in Figure 5, the ORP of collector solutions, before ozonation, was negative. As the ozonation reactions occurred, the ORP increased up to 68.3, 17.2, 150.3, and 48.4 mV for EX, SN-9, Z-200, and DDA solutions, at the end of ozonation, respectively. The variations of COD concentration with the ORP are shown in Figure 7. The ORP of ozonated solutions increased with the reduction of the COD for the four collectors. Thus, it can be inferred that a certain correlation should exist between the COD and ORP of ozonated solutions, which might allow the ORP, as the indicator, to control the ozonation process.

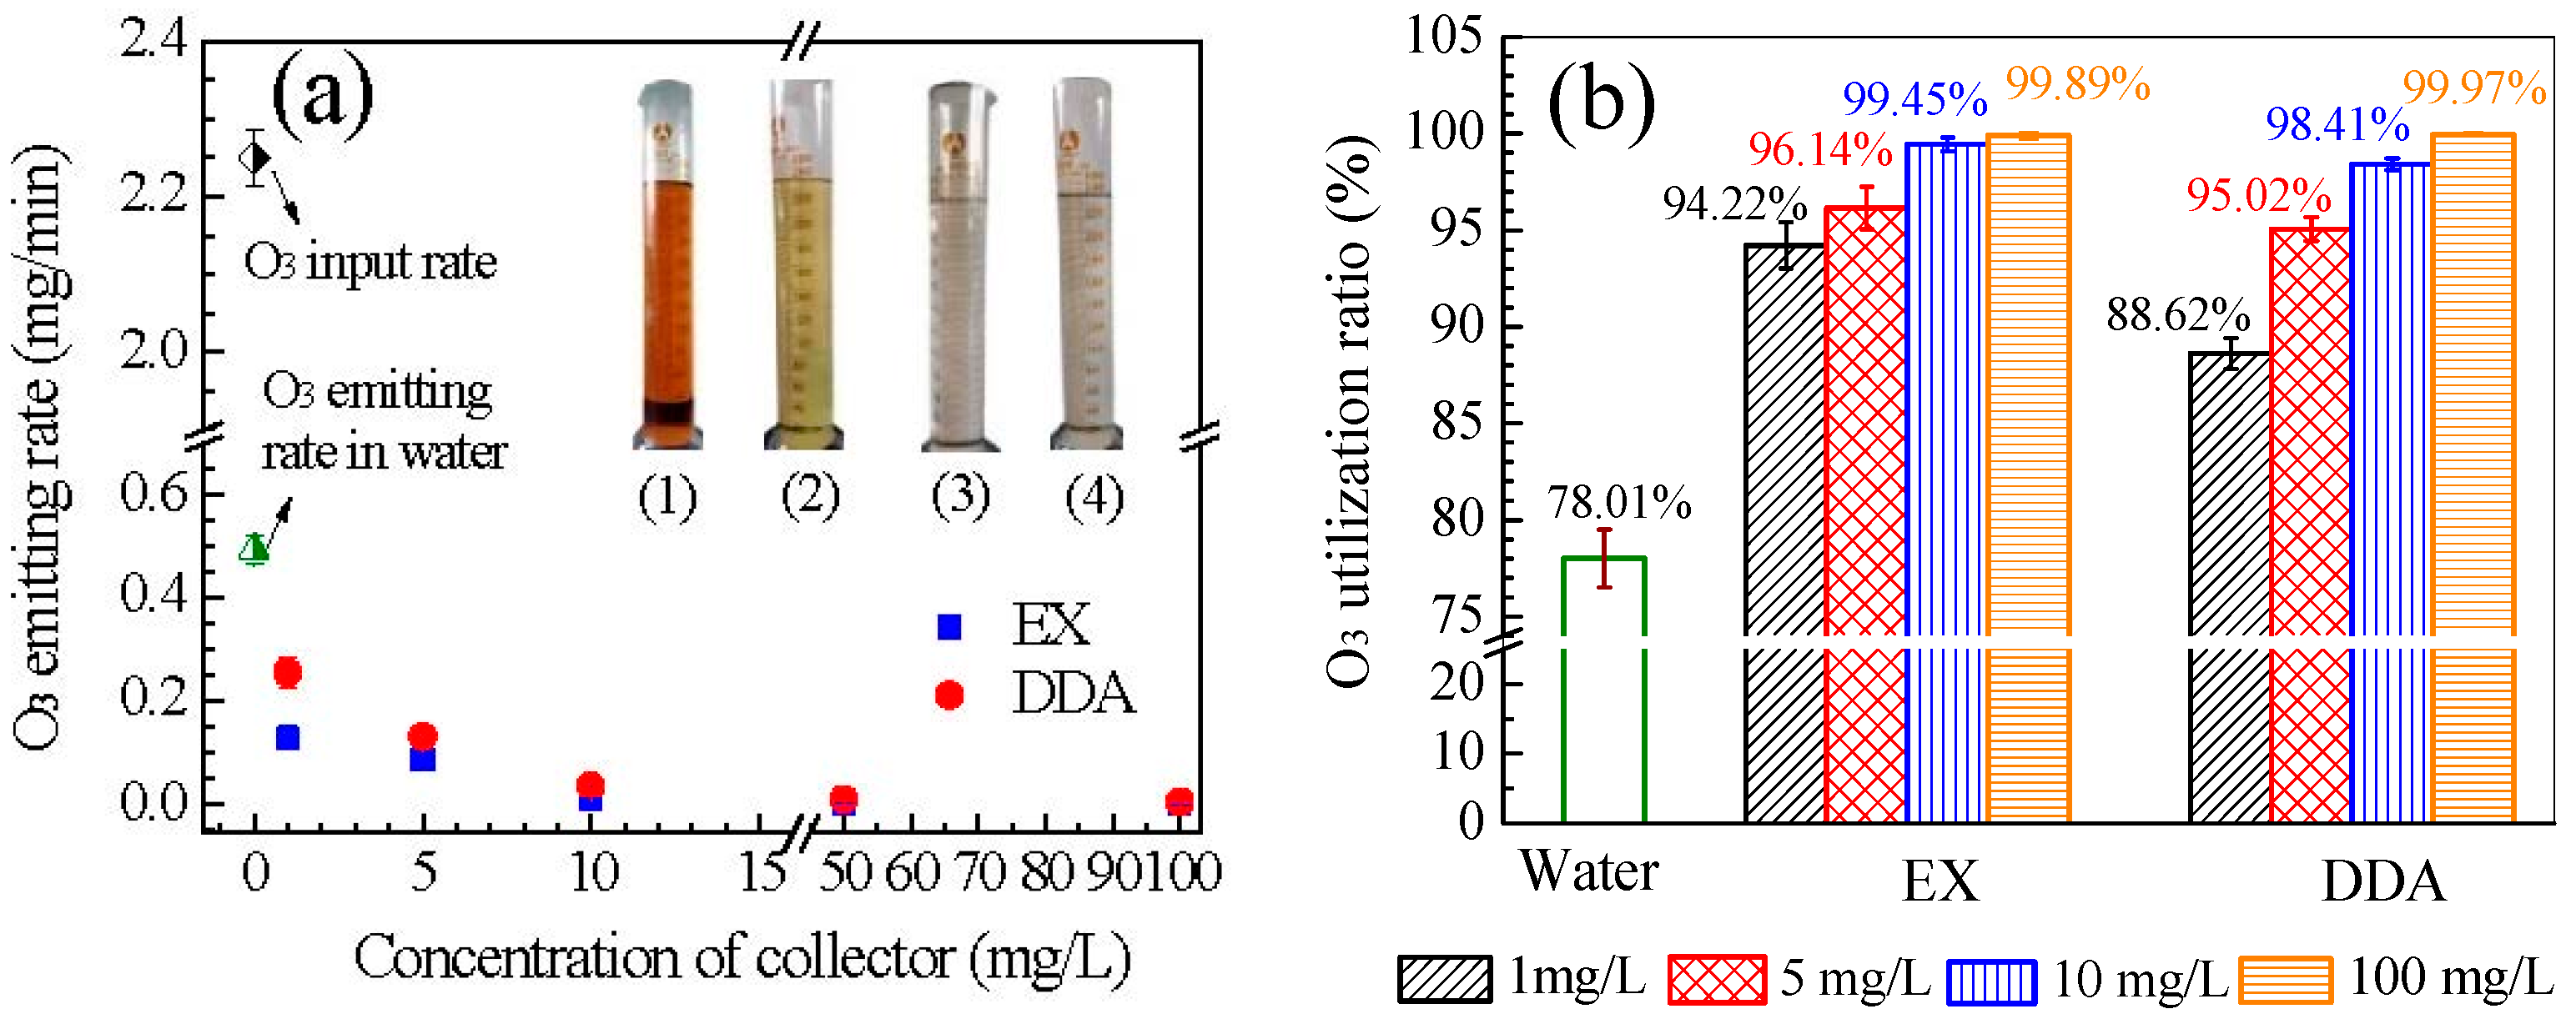
3.5. Ozone Utilization

At the O3 dosage of 1.125 mg/(min·L), the O3 input rate was 2.26 mg/min. As shown in Figure 8, the O3 emitting rate for deionized water at pH 10.0 was just 0.495 mg/min, and the O3 utilization ratio (ηO3) of 78.01% was achieved. The color of KI absorption liquid was changed from a dark red, due to the absorption of the input O3 gas, to a light yellow for the absorption of the O3 emitted from water. The result revealed that 78.01% of input O3 was dissolved and decomposed in alkaline water. Since OH ions could catalytically decompose dissolved O3 as given in Equations (6)–(11), the alkalinity of water promoted the dissolution of gaseous O3 into water, resulting in a lower O3 emitting rate. It suggests that the alkalinity of flotation effluents is beneficial to the O3 utilization and generation of free radicals (OH, ·HO2 and O2, etc.). In this work, low O3 dosage should have also contributed to a high ηO3, for deionized water.
When the collector concentration was raised from 1 to 100 mg/L, the ηO3 shown in Figure 8b increased from 94.22% to 99.89%, for thee EX and from 88.62% to 99.97%, for the DDA solution, respectively. The color of the KI absorption liquids, for absorbing the O3 emitted, from the 100 mg/L EX and DDA solutions was almost white, directly demonstrating nearly no escape of O3 from the reactors. It was very clear that the addition of collectors increased the O3 utilization, which could be attributed to the reactions of O3 molecules, with collectors. As shown in Figure 8b, the EX had higher ηO3 than the DDA, while the concentration was <10 mg/L. The difference in ηO3 directly revealed that the EX was more sensitive in reacting with O3 than the DDA. In this work, at a low O3 dosage of 1.125 mg/(min·L), the ηO3 was close to 100%, in the ozonation of EX and DDA with 100 mg/L concentration. However, in the ozonation of n-butyl xanthate, the achieved ηO3 just ranged from 7.2% to 51.7%, at the O3 dosage of 5.88‒50.36 mg/(min·L) [11]. The results revealed that the ozonation of thiol collectors at a low O3 dosage could achieve almost 100% utilization of O3, meaning it reduced the treating cost by adding a lesser amount of O3.

3.6. Analysis of Energy Consumption Efficiency

In the treatment of contaminants with AOPs, the electrical energy per order (EE/O) was introduced to directly evaluate the electric efficiency and feasibility of the scale-up of AOPs [52]. This parameter was defined as “the electric energy in kWh required in degrading a contaminant by one order of magnitude in 1 m3 contaminated water”. To calculate the energy requirements for the ozonation, an average energy consumption of 15 kWh/kg for the O3 production was assumed [53], and the energy calculations were based on a 90% removal of collectors. EE/O values (kWh/(m3·order)) were calculated for batch operations as given by Equation (12).
E E / O = P × 1000 V × 60 × ln 10 k collector
where P was the electric power (kWh) required for producing dosed O3, V was the volume (L) of test collector solution, and kcollector was the pseudo-first-order constant (min−1).
The results of the energy calculation for the ozonation of the four collectors are summarized in Table 4. As shown in Table 2, the kcollector of EX and SN-9 was lower than that of Z-200 and DDA, revealing the higher efficiency in the degradation of EX and SN-9. Thus, the EE/O values for EX and SN-9 removal were much lower than that for Z-200 and DDA. However, at a low O3 dosage of 1.125 mg/(min·L), the ozonation of all of four collectors was feasible, in terms of energy consumption, since values of EE/O, not higher than 10 kWh/(m3·order), were considered suitable for practical application [54].

4. Conclusions

Thiol collectors (EX, SN-9, Z-200 and DDA) could be effectively degraded by O3 at a low dosage of 1.125 mg/(min·L). Both the removal of collectors and the decline of COD followed the pseudo-first-order kinetic models. The ozonation of the four collectors followed the order of kcollector: kSN-9 (0.0687 min−1) > kEX (0.0579 min−1) > kZ-200 (0.0194 min−1) > kDDA (0.0164 min−1). The kcollector in the removing-collectors was 2‒10 times higher than the kCOD of COD removal. At the collector removal ratio of >90%, the mineralization ratio of the four collectors ranged from 10% to 27%, with the order of SN-9 ≈ EX > DDA > Z-200. For the four collectors investigated, EX and SN-9 could be easily degraded by O3, but the ozonation of Z-200 and DDA exhibited much lower efficiencies. Especially, both the Z-200 and its intermediates were hardly decomposed by O3.
The SN-9, Z-200, and DDA were found to be biologically persistent flotation reagents as their BOD5/COD values were below 0.2. After ozonation, the BOD5/COD of EX, SN-9, and DDA solutions increased to 0.73, 0.31, and 0.41, respectively, with remarkable increase of the biodegradability. However, the BOD5/COD of Z-200 solution increased just from 0.088 to 0.15, after the ozonation, revealing that its intermediates were still hardly biodegraded. After ozonation, the solution pH of four collectors decreased from 10.0 to 8.0–9.0, and an increase of conductivity (68–121 μs/cm) was observed, exhibiting the generation of various ionic intermediates. For the four collectors, the ORP rapidly increased with the decline of COD concentration, indicating that the ORP might act as the indicator to monitor the ozonation of collectors.
At low O3 dosage of 1.125 mg/(min·L), the ηO3 reached 78.01% for ionized water at pH 10.0 due to effective O3 decomposition initiated by OH ions. The addition of collectors significantly enhanced the O3 decomposition. At the collector (EX and DDA) concentration of >10 mg/L, the ηO3 increased to above 98.41%, revealing an almost complete usage of input O3 at a low O3 dosage. EE/O values revealed that the ozonation of all of four collectors was feasible, in terms of energy consumption.

Author Contributions

P.F. and H.P. designed the study. G.L. and Z.C. set up the experimental degradation systems. X.L., G.L. and H.P. performed the degradation experiments of four collector solutions and analyzed the water quality parameters (pH, ORP and conductivity) and the concentration of collector, COD and SO42 ions. X.L. and Z.C. carried out the analysis of TOC and ozone concentration in gas phase. All of the authors interpreted experimental results and supported the preparation of the paper. P.F. had revised the manuscript.

Funding

This research was funded by the National Natural Science Foundation of China, grant number 51674017.

Acknowledgments

We were grateful to Center for Environmental Quality Test, Tsinghua University for providing the analysis of BOD5 concentration of collector solution samples.

Conflicts of Interest

The authors declare no conflict of interest.

References

  1. Bulatovic, S.M. Handbook of Flotation Reagents: Chemistry, Theory and Practice, 1st ed.; Elsevier: Amsterdam, The Netherlands, 2010. [Google Scholar]
  2. Somasundaran, P.; Moudgil, B.M. Reagents in Mineral Technology; Marcel Dekker Inc.: New York, NY, USA, 1988. [Google Scholar]
  3. Li, X.F. Teratogenic toxicity of butyl xanthate to frog embryos. Environ. Sci. Acta 1990, 10, 213–216. [Google Scholar]
  4. Sun, Z.X.; Forsling, W. The degradation kinetics of ethyl xanthate as a function of pH in aqueous solution. Miner. Eng. 1997, 10, 389–400. [Google Scholar] [CrossRef]
  5. Kemppinen, J.; Aaltonen, A.; Sihvonen, T.; Leppinen, J.; Sirén, H. Xanthate degradation occurring in flotation process waters of a gold concentrator plant. Miner. Eng. 2015, 80, 1–7. [Google Scholar] [CrossRef]
  6. Rao, S.R.; Finch, J.A. A review of water reuse in flotation. Miner. Eng. 1989, 2, 65–85. [Google Scholar] [CrossRef]
  7. Mielczarski, J. The role of impurities of sphalerite in the adsorption of ethyl xanthate and its flotation. Int. J. Miner. Process. 1986, 16, 179–194. [Google Scholar] [CrossRef]
  8. Rezaei, R.; Massinaei, M.; Zeraatkar Moghaddam, A. Removal of the residual xanthate from flotation plant tailings using modified bentonite. Miner. Eng. 2018, 119, 1–10. [Google Scholar] [CrossRef]
  9. Lin, W.X.; Tian, J.; Ren, J.; Xu, P.T.; Dai, Y.K.; Sun, S.Y.; Wu, C. Oxidation of aniline aerofloat in flotation wastewater by sodium hypochlorite solution. Environ. Sci. Pollut. Res. 2016, 23, 785–792. [Google Scholar] [CrossRef] [PubMed]
  10. Liu, R.Q.; Sun, W.; Ouyang, K.; Zhang, L.M.; Hu, Y.H. Decomposition of sodium butyl xanthate (SBX) in aqueous solution by means of OCF: Ozonator combined with flotator. Miner. Eng. 2015, 70, 222–227. [Google Scholar] [CrossRef]
  11. Fu, P.F.; Feng, J.; Yang, T.W.; Yang, H.F. Comparison of alky xanthates degradation in aqueous solution by the O3 and UV/O3 process: Efficiency, mineralization and ozone utilization. Miner. Eng. 2015, 81, 128–134. [Google Scholar] [CrossRef]
  12. Fu, P.F.; Feng, J.; Yang, H.F.; Yang, T.W. Degradation of n-butyl xanthate by vacuum UV-ozone (VUV/O3) in comparison with ozone and VUV photolysis. Process Saf. Environ. Prot. 2016, 102, 64–70. [Google Scholar] [CrossRef]
  13. Chen, S.H.; Gong, W.Q.; Mei, G.J.; Zhou, Q.; Bai, C.P.; Xu, N. Primary biodegradation of sulfide mineral flotation collectors. Miner. Eng. 2011, 24, 953–955. [Google Scholar] [CrossRef]
  14. Araujo, D.M.; Yoshida, M.I.; Takahashi, J.A.; Carvalho, C.F.; Stapelfeldt, F. Biodegradation studies on fatty amines used for reverse flotation of iron ore. Int. Biodeterior. Biodegrad. 2010, 64, 151–155. [Google Scholar] [CrossRef]
  15. Jafari, M.; Shafaei, S.Z.A.; Abdollahi, H.; Gharabaghi, M.; Chelgani, S.C. A comparative study on the effect of flotation reagents on growth and iron oxidation activities of Leptospirillum ferrooxidans and Acidithiobacillus ferrooxidans. Minerals 2017, 7, 2. [Google Scholar] [CrossRef]
  16. Mahiroglu, A.; Tarlan-Yel, E.; Sevimli, M.F. Treatment of combined acid mine drainage (AMD)-flotation circuit effluents from copper mine via Fenton’s process. J. Hazard. Mater. 2009, 166, 782–787. [Google Scholar] [CrossRef] [PubMed]
  17. Silvester, E.; Truccolo, D.; Hao, F.P. Kinetics and mechanism of the oxidation of ethyl xanthate and ethyl thiocarbonate by hydrogen peroxide. J. Chem. Soc. Perkin Trans. 2002, 2, 1562–1571. [Google Scholar] [CrossRef]
  18. Chen, S.H.; Xiong, P.; Zhan, W.; Xiong, L. Degradation of ethylthionocarbamate by pyrite-activated persulfate. Miner. Eng. 2018, 12, 38–43. [Google Scholar] [CrossRef]
  19. Xiao, Q.; Ouyang, L.L. Photocatalytic photodegradation of xanthate over Zn1-xMnxO under visible light irradiation. J. Alloys Compd. 2009, 479, L4–L7. [Google Scholar] [CrossRef]
  20. Molina, G.C.; Cayo, C.H.; Rodrigues, M.A.S.; Bernardes, A.M. Sodium isopropyl xanthate degradation by advanced oxidation processes. Miner. Eng. 2013, 45, 88–93. [Google Scholar] [CrossRef]
  21. Feng, Q.C.; Wen, S.M.; Zhao, W.J.; Liu, J.; Liu, D. Effect of pH on surface characteristics and flotation of sulfidized cerussite. Physicochem. Probl. Miner. Process. 2016, 52, 676–689. [Google Scholar] [CrossRef]
  22. Gibson, C.E.; Kelebek, S. Sensitivity of pentlandite flotation in complex sulfide ores towards pH control by lime versus soda ash: Effect on ore type. Int. J. Miner. Process. 2014, 127, 44–51. [Google Scholar] [CrossRef]
  23. Staehelin, J.; Hoigné, J. Decomposition of ozone in water: Rate of initiation by hydroxide ions and hydrogen peroxide. Environ. Sci. Technol. 1982, 16, 676–681. [Google Scholar] [CrossRef]
  24. Yershov, B.G.; Morozov, P.A.; Gordeev, A.V.; Seliverstov, A.F. Kinetic regularities of ozone decomposition in water. J. Water Chem. Technol. 2009, 31, 381–388. [Google Scholar] [CrossRef]
  25. Wu, C.H.; Ng, H.Y. Degradation of C.I. Reactive Red 2 (RR2) using ozone-based systems: Comparisons of decolorization efficiency and power consumption. J. Hazard. Mater. 2008, 152, 120–127. [Google Scholar] [CrossRef] [PubMed]
  26. Katsoyiannis, I.A.; Canonica, S.; von Gunten, U. Efficiency and energy requirements for the transformation of organic micropollutants by ozone, O3/H2O2 and UV/H2O2. Water Res. 2011, 45, 3811–3822. [Google Scholar] [CrossRef] [PubMed]
  27. Rahman, R.M.; Ata, S.; Jameson, G.J. Study of froth behaviour in a controlled plant environment‒Part 2: Effect of collector and frother concentration. Miner. Eng. 2015, 81, 161–166. [Google Scholar] [CrossRef]
  28. Wen, S.H.; Chen, L.; Li, W.Q.; Ren, H.Q.; Li, K.; Wu, B.; Hu, H.D.; Xu, K. Insight into the characteristics, removal, and toxicity of effluent organic matter from a pharmaceutical wastewater treatment plant during catalytic ozonation. Sci. Rep. 2018, 8, 9581. [Google Scholar] [CrossRef] [PubMed]
  29. Ding, P.Y.; Chu, L.B.; Wang, J.L. Advanced treatment of petrochemical wastewater by combined ozonation and biological aerated filter. Environ. Sci. Pollut. Res. 2018, 25, 9673–9682. [Google Scholar] [CrossRef] [PubMed]
  30. Shen, Y.; Nagaraj, D.R.; Farinato, R.; Somasundaran, P. Study of xanthate decomposition in aqueous solutions. Miner. Eng. 2016, 93, 10–15. [Google Scholar] [CrossRef] [Green Version]
  31. Chen, X.H.; Hu, Y.H.; Peng, H.; Cao, X.F. Degradation of ethyl xanthate in flotation residues by hydrogen peroxide. J. Cent. South Univ. 2015, 22, 495–501. [Google Scholar] [CrossRef]
  32. Yan, P.F.; Chen, G.Q.; Ye, M.Y.; Sun, S.Y.; Ma, H.T.; Lin, W.X. Oxidation of potassium n-butyl xanthate with ozone: Products and pathways. J. Clean. Prod. 2016, 139, 287–294. [Google Scholar] [CrossRef]
  33. Beltran-Heredia, J.; Torregrosa, J.; Dominguez, J.R.; Peres, J.A. Kinetics of the reaction between ozone and phenolic acids present in agro-industrial wastewaters. Water Res. 2001, 35, 1077–1082. [Google Scholar] [CrossRef]
  34. Beltran, F.J.; Garcia-Araya, J.F.; Alvarez, P.M. pH sequential ozonation of domestic and wine-distillery wastewaters. Water Res. 2001, 35, 929–936. [Google Scholar] [CrossRef]
  35. Tobiasn, N.; Hans, F.; Clemens, V.S. Ozonation of wastewater: Rate of ozone consumption and hydroxyl radical yield. Environ. Sci. Technol. 2009, 15, 5990–5995. [Google Scholar] [CrossRef]
  36. Hoigné, J.; Bader, H. Rate constants of reactions of ozone with organic and inorganic compounds in water-I Non-dissociating organic compounds. Water Res. 1983, 17, 173–183. [Google Scholar] [CrossRef]
  37. Hoigné, J.; Bader, H. Rate constants of reactions of ozone with organic and inorganic compounds in water-II Dissociating organic compounds. Water Res. 1983, 17, 185–194. [Google Scholar] [CrossRef]
  38. Cheng, H.; Lin, H.; Huo, H.X.; Dong, Y.B.; Xue, Q.Y.; Cao, L.X. Continuous removal of ore floatation reagents by an anaerobic–aerobic biological filter. Bioresour. Technol. 2012, 114, 255–261. [Google Scholar] [CrossRef] [PubMed]
  39. Natarajan, K.A.; Sabari Prakasan, M.R. Biodegradation of sodium isopropyl xanthate by Paenibacillus polymyxa and Pseudomonas putida. Miner. Metall. Process. 2013, 30, 226–232. [Google Scholar] [CrossRef]
  40. Song, W.F.; Chen, X.Q.; Yan, M.; Tang, T.Z.; Li, S.Y. Processing of aniline aerofloat wastewater with SBR system and its biodegradation mechanism. Agric. Sci. Technol. 2013, 14, 1032–1036. [Google Scholar]
  41. López Valdivieso, A.; Sánchez López, A.A.; Ojeda Escamilla, C.; Fuerstenau, M.C. Flotation and depression control of arsenopyrite through pH and pulp redox potential using xanthate as the collector. Int. J. Miner. Process. 2006, 81, 27–34. [Google Scholar] [CrossRef]
  42. Eliseev, N.I. Dixanthogen Formation in Flotation. J. Min. Sci. 2012, 48, 1065–1070. [Google Scholar] [CrossRef]
  43. Montalti, M.; Fornasiero, D.; Ralston, J. Ultraviolet-visible spectroscopic study of the kinetics of adsorption of ethyl xanthate on pyrite. J. Colloid Interface Sci. 1991, 143, 440–450. [Google Scholar] [CrossRef]
  44. Nava-Alonso, F.; Pecina-Treviño, T.; Pérez-Garibay, R.; Uribe-Salas, A. Pulp potential control in flotation: The effect of hydrogen peroxide addition on the extent of xanthate oxidation. Can. Metall. Q. 2002, 41, 391–397. [Google Scholar] [CrossRef]
  45. Wang, X.Y.; Liu, W.G.; Duan, H.; Liu, W.B. Degradation mechanism study of amine collectors in Fenton process by quantitative structure-activity relationship analysis. Physicochem. Probl. Miner. Process. 2018, 54, 713–721. [Google Scholar] [CrossRef]
  46. Hammes, F.; Salhi, E.; Koester, O.; Kaiser, H.P.; Egli, T.; von Gunten, U. Mechanistic and kinetic evaluation of organic disinfection by-product and assimilable organic carbon (AOC) formation during the ozonation of drinking water. Water Res. 2006, 40, 2275–2286. [Google Scholar] [CrossRef] [PubMed]
  47. Ramseier, M.K.; von Gunten, U. Mechanisms of phenol ozonation‒kinetics of formation of primary and secondary reaction products. Ozone Sci. Eng. 2009, 31, 201–215. [Google Scholar] [CrossRef]
  48. Wu, T.T.; Englehardt, J.D. Peroxone mineralization of chemical oxygen demand for direct potable water reuse: Kinetics and process control. Water Res. 2015, 73, 362–372. [Google Scholar] [CrossRef] [PubMed]
  49. Chiang, Y.P.; Liang, Y.Y.; Chang, C.N.; Chao, A.C. Differentiating ozone direct and indirect reactions on decomposition of humic substances. Chemosphere 2006, 65, 2395–2400. [Google Scholar] [CrossRef] [PubMed]
  50. Contreras, E.M.; Bertola, N.C.; Zaritzky, N.E. Monitoring the ozonation of phenol solutions at constant pH by different methods. Ind. Eng. Chem. Res. 2011, 50, 9799–9809. [Google Scholar] [CrossRef]
  51. Lan, B.Y.; Nigmatullin, R.; Puma, G.L. Ozonation kinetics of cork-processing water in a bubble column reactor. Water Res. 2008, 42, 2473–2482. [Google Scholar] [CrossRef] [PubMed]
  52. Bolton, J.R.; Bircger, K.G.; Tumas, W.; Tolman, C.A. Figure-of-merit for the technical development and application of advanced oxidation technologies for both electric- and solar-derived systems. Pure Appl. Chem. 2001, 73, 627–637. [Google Scholar] [CrossRef]
  53. Rosenfeldt, E.J.; Linden, K.G.; Canonica, S.; von Gunten, U. Comparison of the efficiency of OH radical formation during ozonation and the advanced oxidation processes O3/H2O2 and UV/H2O2. Water Res. 2006, 40, 3695–3704. [Google Scholar] [CrossRef] [PubMed]
  54. Goslan, E.H.; Gurses, F.; Banks, J.; Parsons, S.A. An investigation into reservoir NOM reduction by UV photolysis and advanced oxidation processes. Chemosphere 2006, 65, 1113–1119. [Google Scholar] [CrossRef] [PubMed]
Figure 1. Schematic diagram of experimental setup. 1—ozone generator; 2—flow meter; 3—KI absorption liquid for measuring O3 concentration; 4—bubbled cylindrical reactor; 5—sampling valve; 6—multi-parameter water quality meter (pH electrode, ORP electrode, conductivity probe); 7—ozone destructor bottle with KI solution.
Minerals 08 00477 g001
Figure 2. UV-vis absorbance spectra for the four collector solutions, at 20 mg/L concentration (a); and the collector concentration versus the absorbance of collector solutions (b).
Minerals 08 00477 g002
Figure 3. The variations of the removal ratio of thiol collectors with ozonation time (a) and the pseudo-first-order kinetic fitting of ln(Ct/C0) versus ozonation time t (b).
Minerals 08 00477 g003
Figure 4. The variations of the concentration of collector, COD, TOC, and SO42− ions with ozonation time in the degradation of EX (a), SN-9 (b), Z-200 (c), and DDA (d).
Minerals 08 00477 g004
Figure 5. The variations of solution pH, conductivity, and ORP, with ozonation times, in the degradation of EX (a), SN-9 (b), Z-200 (c), and DDA (d).
Minerals 08 00477 g005aMinerals 08 00477 g005b
Figure 6. The biodegradability of collector solutions before and after the ozonation, for different treatment times.
Minerals 08 00477 g006
Figure 7. The variations of COD concentration with the ORP of ozonated collector solutions.
Minerals 08 00477 g007
Figure 8. Ozone-emitting rate (a) and O3 utilization ratio (b) in the ozonation of EX and DDA, with different concentrations. The inset figures are photographs of KI absorption liquids, for absorbing input O3 gas (1), emitted O3 from deionized water (2), EX (3), and DDA (4) solutions with 100 mg/L concentration, respectively.
Minerals 08 00477 g008
Table 1. Collector name, molecular formula, molecular structure, and abbreviations used in this work.
Collector NameMolecular FormulaMolecular StructureAbbreviation
potassium ethyl xanthateC2H4OCS2K Minerals 08 00477 i001EX
sodium diethyl dithiocarbamate(C2H5)2NCSSNa Minerals 08 00477 i002SN-9
O-isopropyl-N-ethyl thionocarbamate(CH3)2CHOCSNHC2H5 Minerals 08 00477 i003Z-200
dianilino dithiophoshoric acid(C6H5NH)2PSSH Minerals 08 00477 i004DDA
Table 2. Kinetic equations, pseudo-first-order rate constants (kcollector), half-life time (t1/2) and correlation coefficients (R2) in the ozonation of thiol collectors.
CollectorKinetic Equationkcollector (min−1)t1/2 (min)R2
EXCt = C0·e−0.0579t0.057911.970.9903
SN-9Ct = C0·e−0.0687t0.068710.090.9918
Z-200Ct = C0·e−0.0194t0.019435.690.9835
DDACt = C0·e−0.0164t0.016442.270.9967
Table 3. The removal ratio of the collector and the COD, the carbon and sulfur mineralization ratio, and the pseudo-first-order rate constants for COD removal, in the ozonation of thiol collectors.
CollectorRemoval Ratio of Collector (%)Removal of CODMineralization Ratio (%)
Removal Ratio of COD (%)kCOD
(min−1)
R2CarbonSulfur
EX99.98 (90 min)60.04 (90 min)0.01110.984318.42 (90 min)11.95 (90 min)
SN-999.87 (90 min)43.47 (90 min)0.006940.983817.84 (90 min)21.21 (90 min)
Z-20087.38 (90 min)13.67 (90 min)0.001880.98588.31 (90 min)12.54 (90 min)
98.37(120 min)14.97 (120 min)11.82 (120 min)20.92 (120 min)
DDA79.71 (90 min)53.25 (90 min)0.007790.988816.35 (90 min)7.89 (90 min)
90.91(180 min)61.11 (180 min)26.05 (180 min)21.98 (180 min)
Table 4. Electrical energy per order (EE/O) in the ozonation of the four thiol collectors.
CollectorEXSN-9Z-200DDA
EE/O (kWh/(m3·order))0.450.333.186.06

