Article

The Crystal Chemistry of Rathite Based on New Electron-Microprobe Data and Single-Crystal Structure Refinements: The Role of Thallium

1
Naturhistorisches Museum, Burgring 7, 1010 Wien, Austria
2
Institut für Mineralogie und Kristallographie, Universität Wien, Althanstraße 14, 1090 Wien, Austria
*
Author to whom correspondence should be addressed.
Minerals 2018, 8(10), 466; https://doi.org/10.3390/min8100466
Submission received: 21 September 2018 / Revised: 4 October 2018 / Accepted: 15 October 2018 / Published: 18 October 2018
(This article belongs to the Special Issue Thallium: Mineralogy, Geochemistry and Ore Processes)

Abstract

:
Crystal-structure refinements in space group P21/c were performed on five grains of rathite with different types and degrees of thallium, silver, and antimony substitutions, as well as quantitative electron-microprobe analyses of more than 800 different rathite samples. The results of these studies both enlarged and clarified the complex spectrum of cation substitutions and the crystal chemistry of rathite. The [Tl+ + As3+] ↔ 2Pb2+ scheme of substitution acts at the structural sites Pb1, Pb2, and Me6, the [Ag+ + As3+] ↔ 2Pb2+ substitution at Me5, and the Sb-for-As substitution at the Me3 site only. The homogeneity range of rathite was determined to be unusually large, ranging from very Tl-poor compositions (0.16 wt%; refined single-crystal unit-cell parameters: a = 8.471(2), b = 7.926(2), c = 25.186(5) Å, β = 100.58(3)°, V = 1662.4(6) Å3) to very Tl-rich compositions (11.78 wt%; a = 8.521(2), b = 8.005(2), c = 25.031(5) Å, β = 100.56(3)°, V = 1678.4(6) Å3). The Ag content is only slightly variable (3.1 wt%–4.1 wt%) with a mean value of 3.6 wt%. The Sb content is strongly variable (0.20 wt%–7.71 wt%) and not correlated with the Tl content. With increasing Tl content (0.16 wt%–11.78 wt%), a clear increase of the unit-cell parameters a, b, and V, and a slight decrease of c is observed, although this is somewhat masked by the randomly variable Sb content. The revised general formula of rathite may be written as AgxTlyPb16−2(x+y)As16+x+yzSbzS40 (with 1.6 < x < 2, 0 < y < 3, 0 < z < 3.5). Based on Pb–S bond lengths, polyhedral characteristics and Pb-site bond-valence sums, we conclude that the Pb1 site is more affected by Tl substitution than the Pb2 site. When Tl substitution reaches values above 13 wt% (or 3 apfu), a new phase (“SR”), belonging to the rahite group, appears as lamellar exsolution intergrowths with Tl-rich rathite (11.78 wt%). Rathite is found only in the Lengenbach and Reckibach deposits, Binntal, Canton Wallis, Switzerland.

1. Introduction

The name rathite was given by Baumhauer [1], in honor of Gerhard von Rath, Professor of Mineralogy, Bonn, Germany, to a new mineral of the sartorite–dufrénoysite series from the Lengenbach deposit (Binntal, Canton Wallis, Switzerland) with the formula 12PbS·5As2S3·Sb2S3 (=Pb12As10Sb2S30). One century later, Berlepsch et al. [2], on the basis of new single-crystal structure determination of chemically well-characterized rathite and summarizing past achievements in unraveling name, chemistry, structure, and classification made by Solly [3], Giuşcă [4], Berry [5], Le Bihan [6], Nowacki et al. [7], Marumo and Nowacki [8], Makovicky [9], Laroussi et al. [10], Pring [11], and Berlepsch et al. [12], presented the last chapter of the complex story of this rare mineral. They concluded that rathite is a member of sartorite homologous series with space group symmetry P21/c and reported the unit-cell parameters a = 8.496(1), b = 7.969(1), c = 25.122(3) Å, β = 100.704(2)° for a sample with the composition Ag2.01Tl1.37Pb9.25(As19.09Sb0.83)Σ19.92S40.00. Berlepsch et al. [2] also pointed out that the substitution involving Ag is essential for the formation of rathite and that it distinguishes rathite from another N = 4; 4 member of the sartorite homologous series, viz. dufrénoysite Pb16As16S40 [space group P21, a = 8.47(4), b = 25.74(4), c = 7.90(1) Å, β = 90.35(12)°]. Furthermore, these authors suggested that the Tl and Sb substitutions in rathite are to be considered optional.
No subsequent studies of rathite were conducted prior to our present work, although Makovicky and Topa [13] recently present a set of analytical formulae for the calculation of the homolog order Ncalc and the substitution degree for Tl and Ag in the sartorite homologous series (Tlsubst and Agsubst), from quantitative electron microprobe analyses. In the meantime, barikaite (Topa et al. [14]), philrothite (Bindi et al. [15]), and carducciite (Biagioni et al. [16]) were described as homeotypes of rathite, and polloneite (Topa et al. [17]) as a threefold superstructure of dufrénoysite (Table 1).
As part of an indepth and long-term study of the sulphosalt mineralogy of the Lengenbach deposit by the first author since 2013, the present paper deals with the crystal chemistry of rathite and aims to provide an understanding of the observed substitutional schemes on the basis of numerous electron microprobe datasets and a larger number of single-crystal structure refinements of samples from the Lengenbach and Reckibach occurrences.

2. Examined Material, Appearance, and Optical Properties

Euhedral crystals and massive sulphosalt accumulations (patches) of the sartorite homologs from the world-famous Lengenbach deposit (e.g., Graeser et al. [20] and references therein) and the Reckibach sulphosalt occurrence (Cannon et al. [21]) were obtained from the collection of the Natural History Museum, Vienna, and the Natural History Museum, Basel, as well as from private collections of Horst Geuer (Germany), Frank Keutsch (USA), the second author (Austria), Thomas Raber (Germany), Phillippe Roth (Switzerland), and Ralph Cannon (Germany). These samples were collected or acquired in the time range between 1816 and 2017.
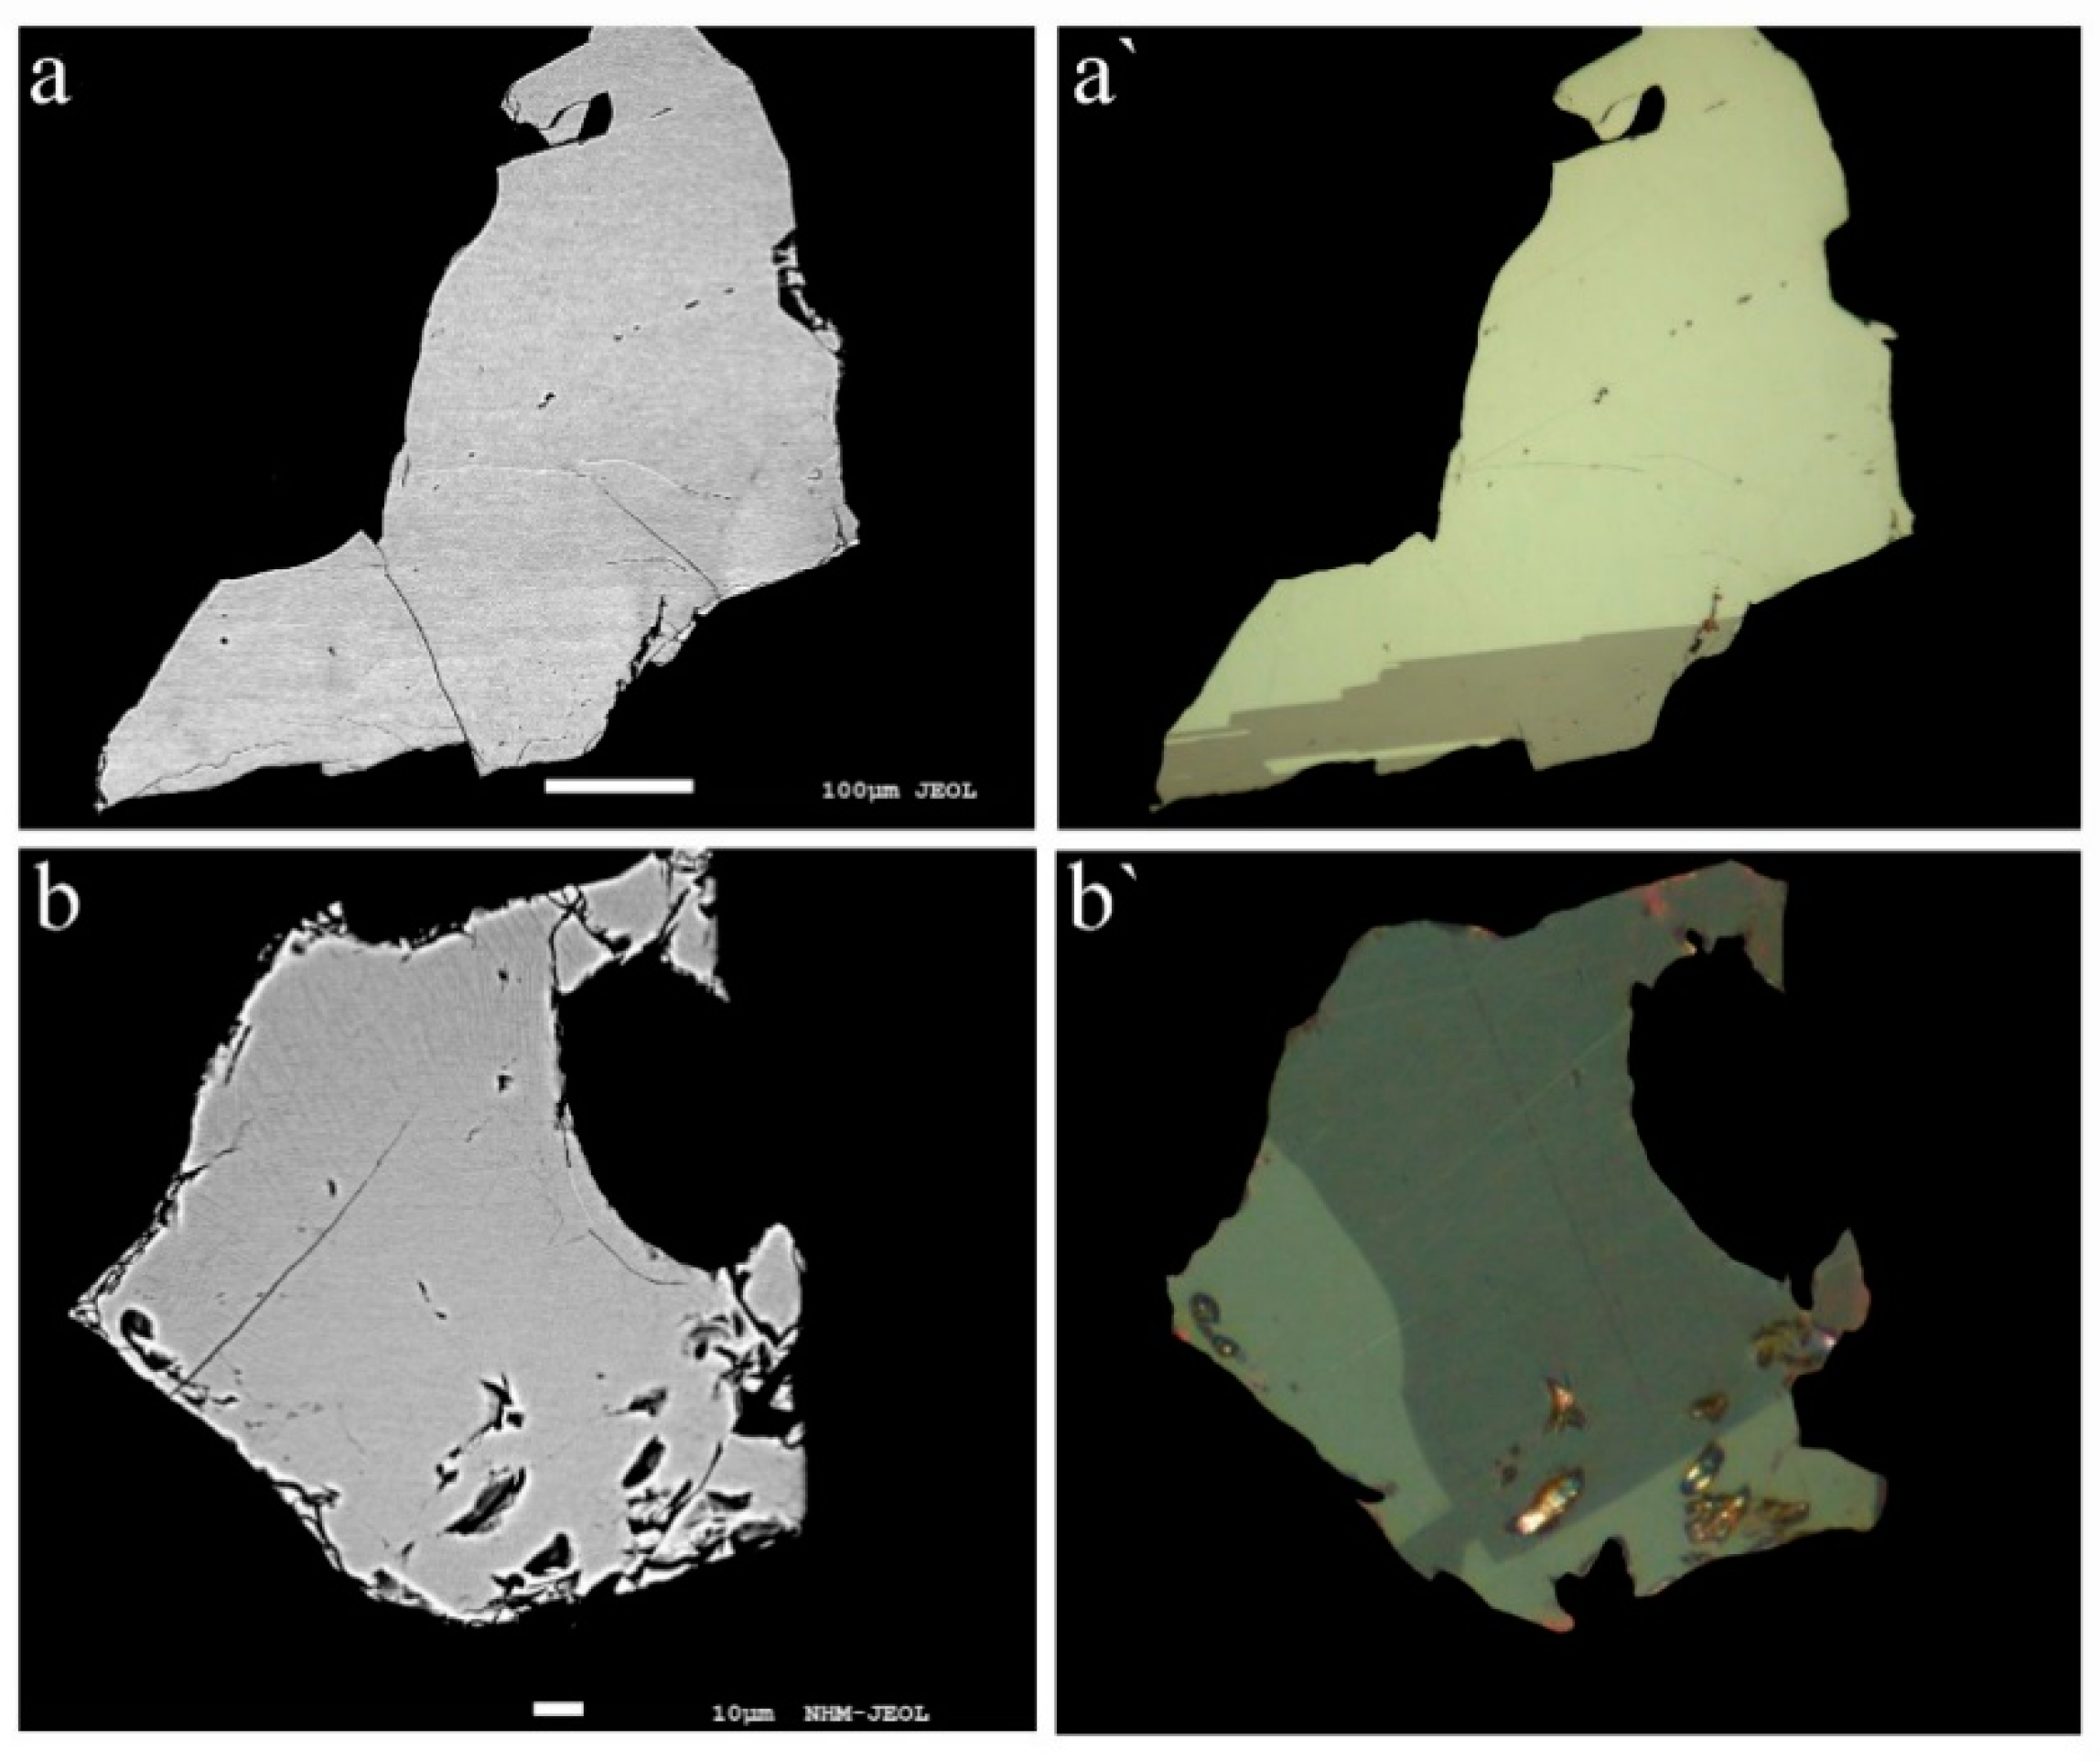
Our studies show that rathite is commonly intimately intergrown with sartorite, baumhauerite, liveingite, and dufrénoysite, but also occurs as larger, single-phase homogenous grains. Macroscopically, the mineral is always blackish (independent of the Tl content), with metallic to dull luster. In reflected light, the color of rathite is greyish-white with strong anisotropy. No twin lamellae were observed in the structurally studied fragments, but twinning was partly observed in other fragments and may be present in other samples. Representative back-scattered electron and optical images of rathite grains analysed by EPMA are shown in Figure 1, Figure 2 and Figure 3: homogeneous rathite grains (aggregates) with low and high Tl content are shown in 
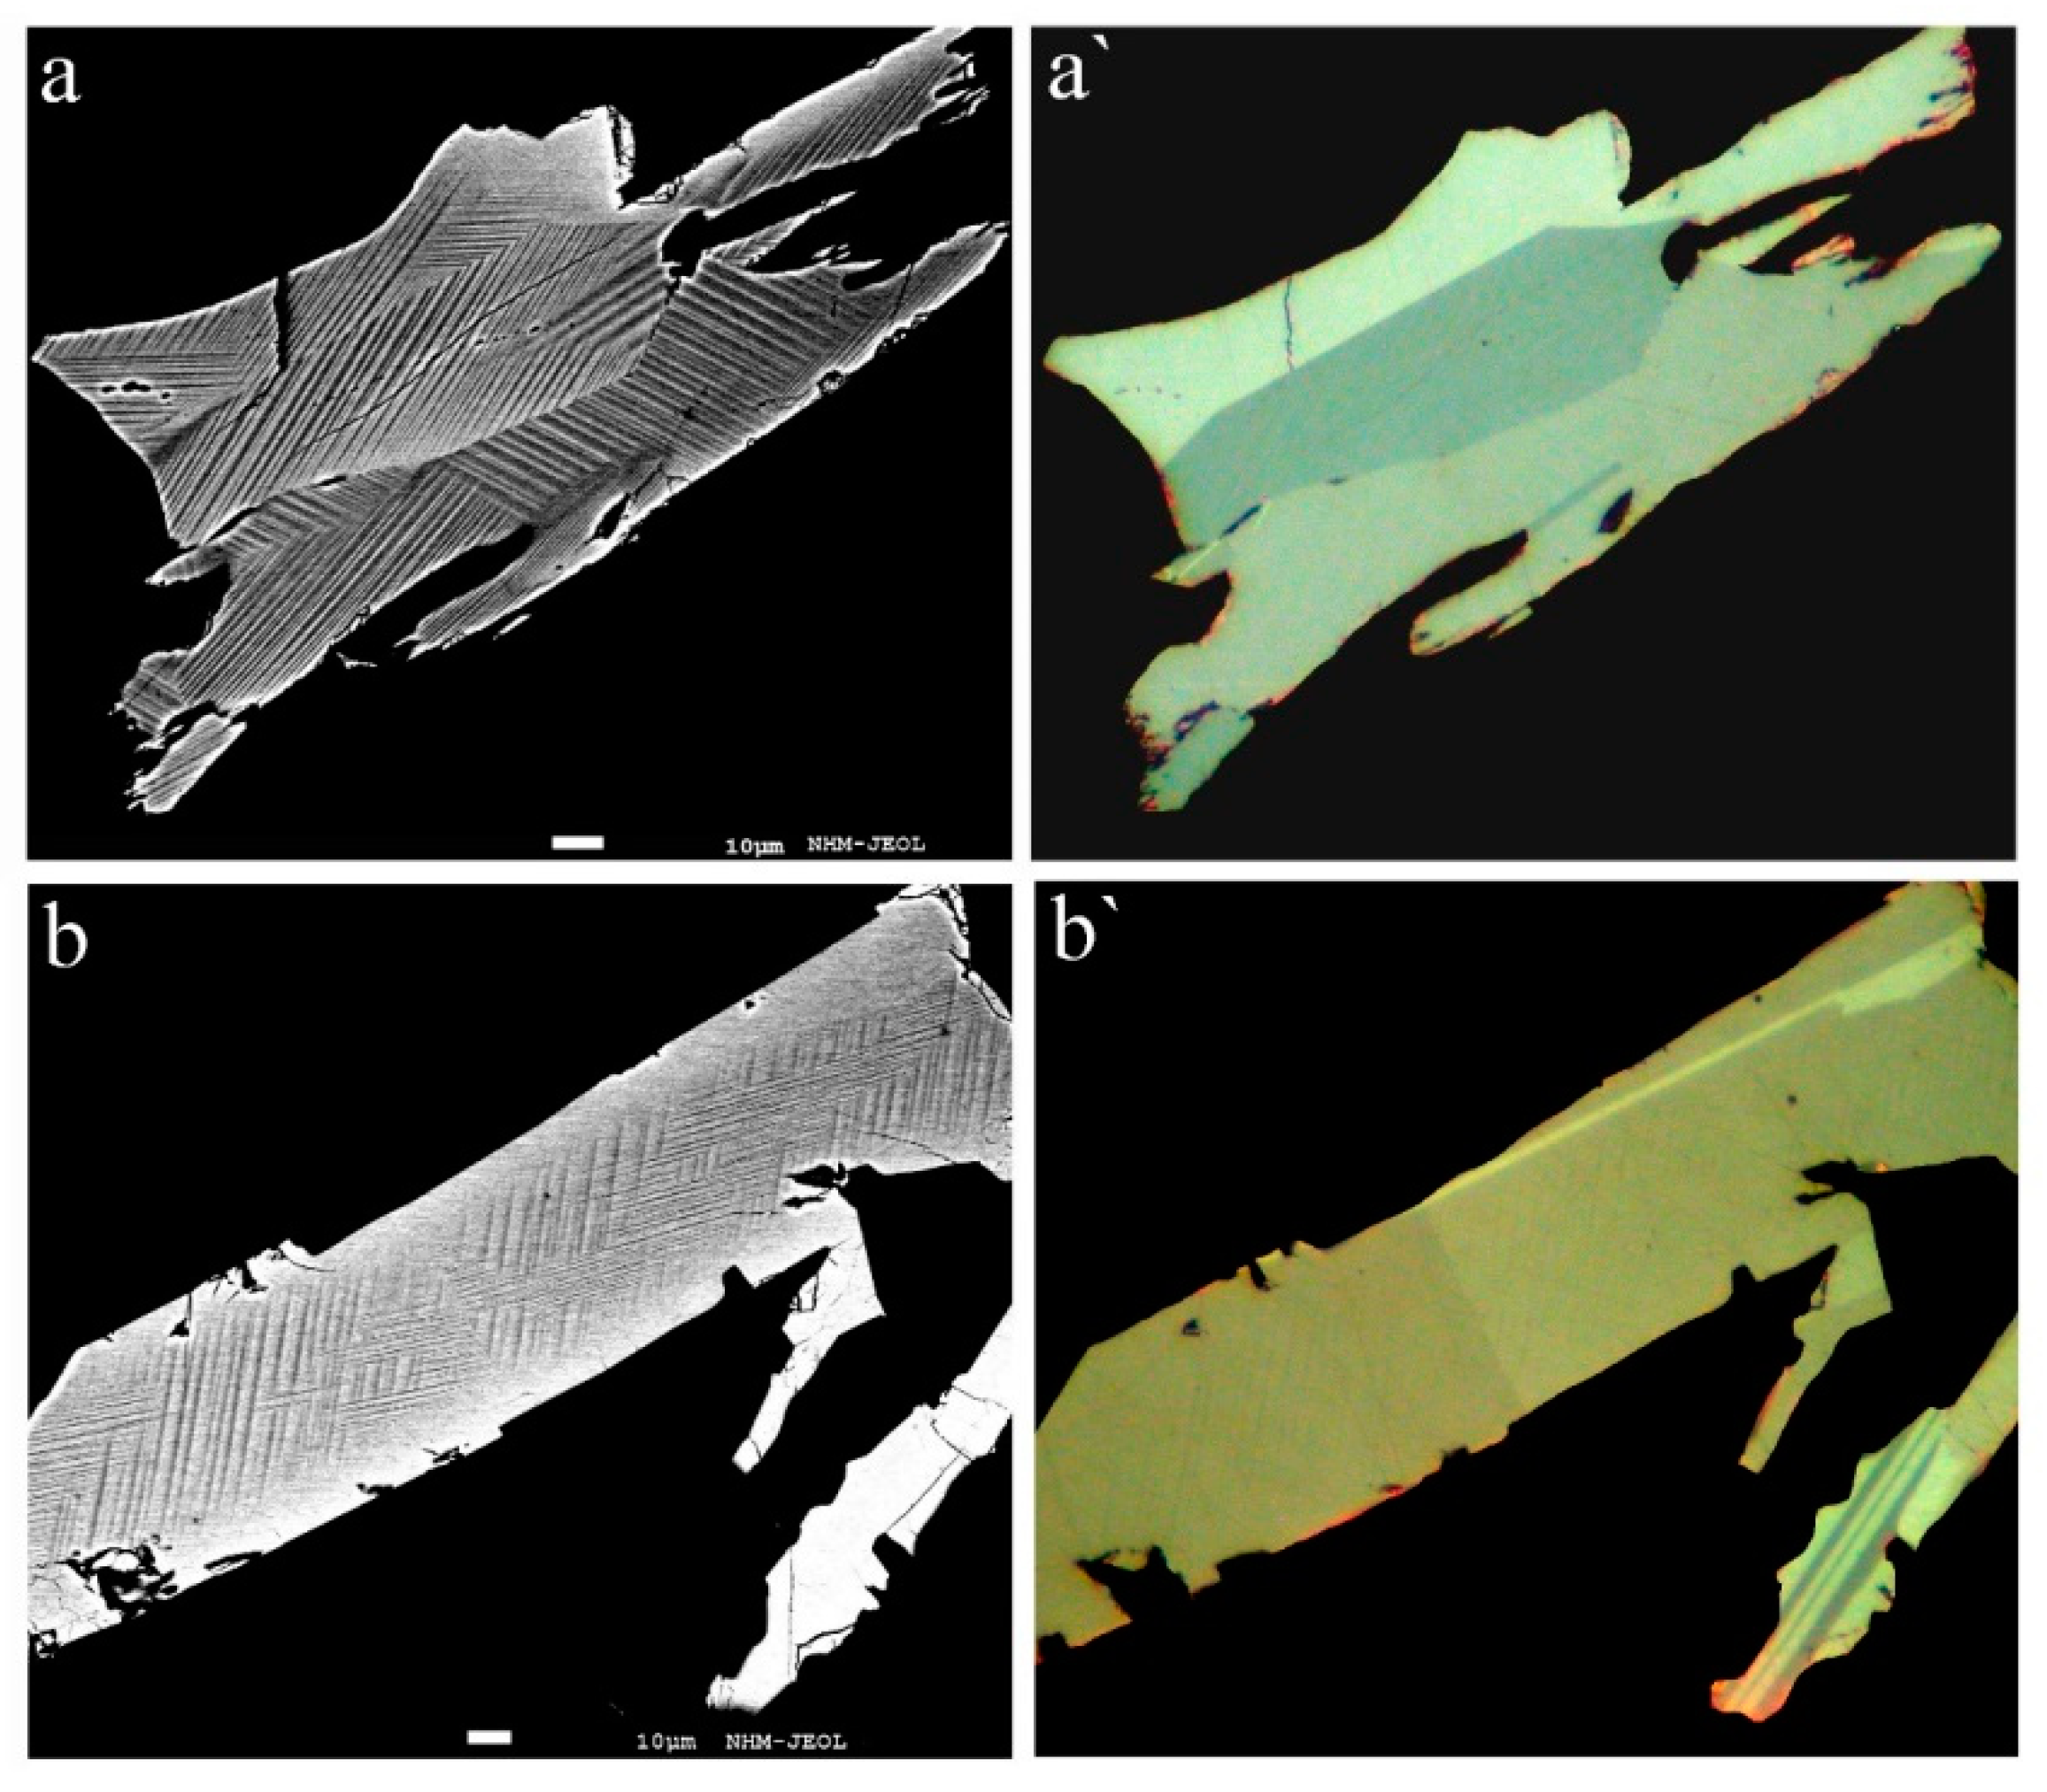
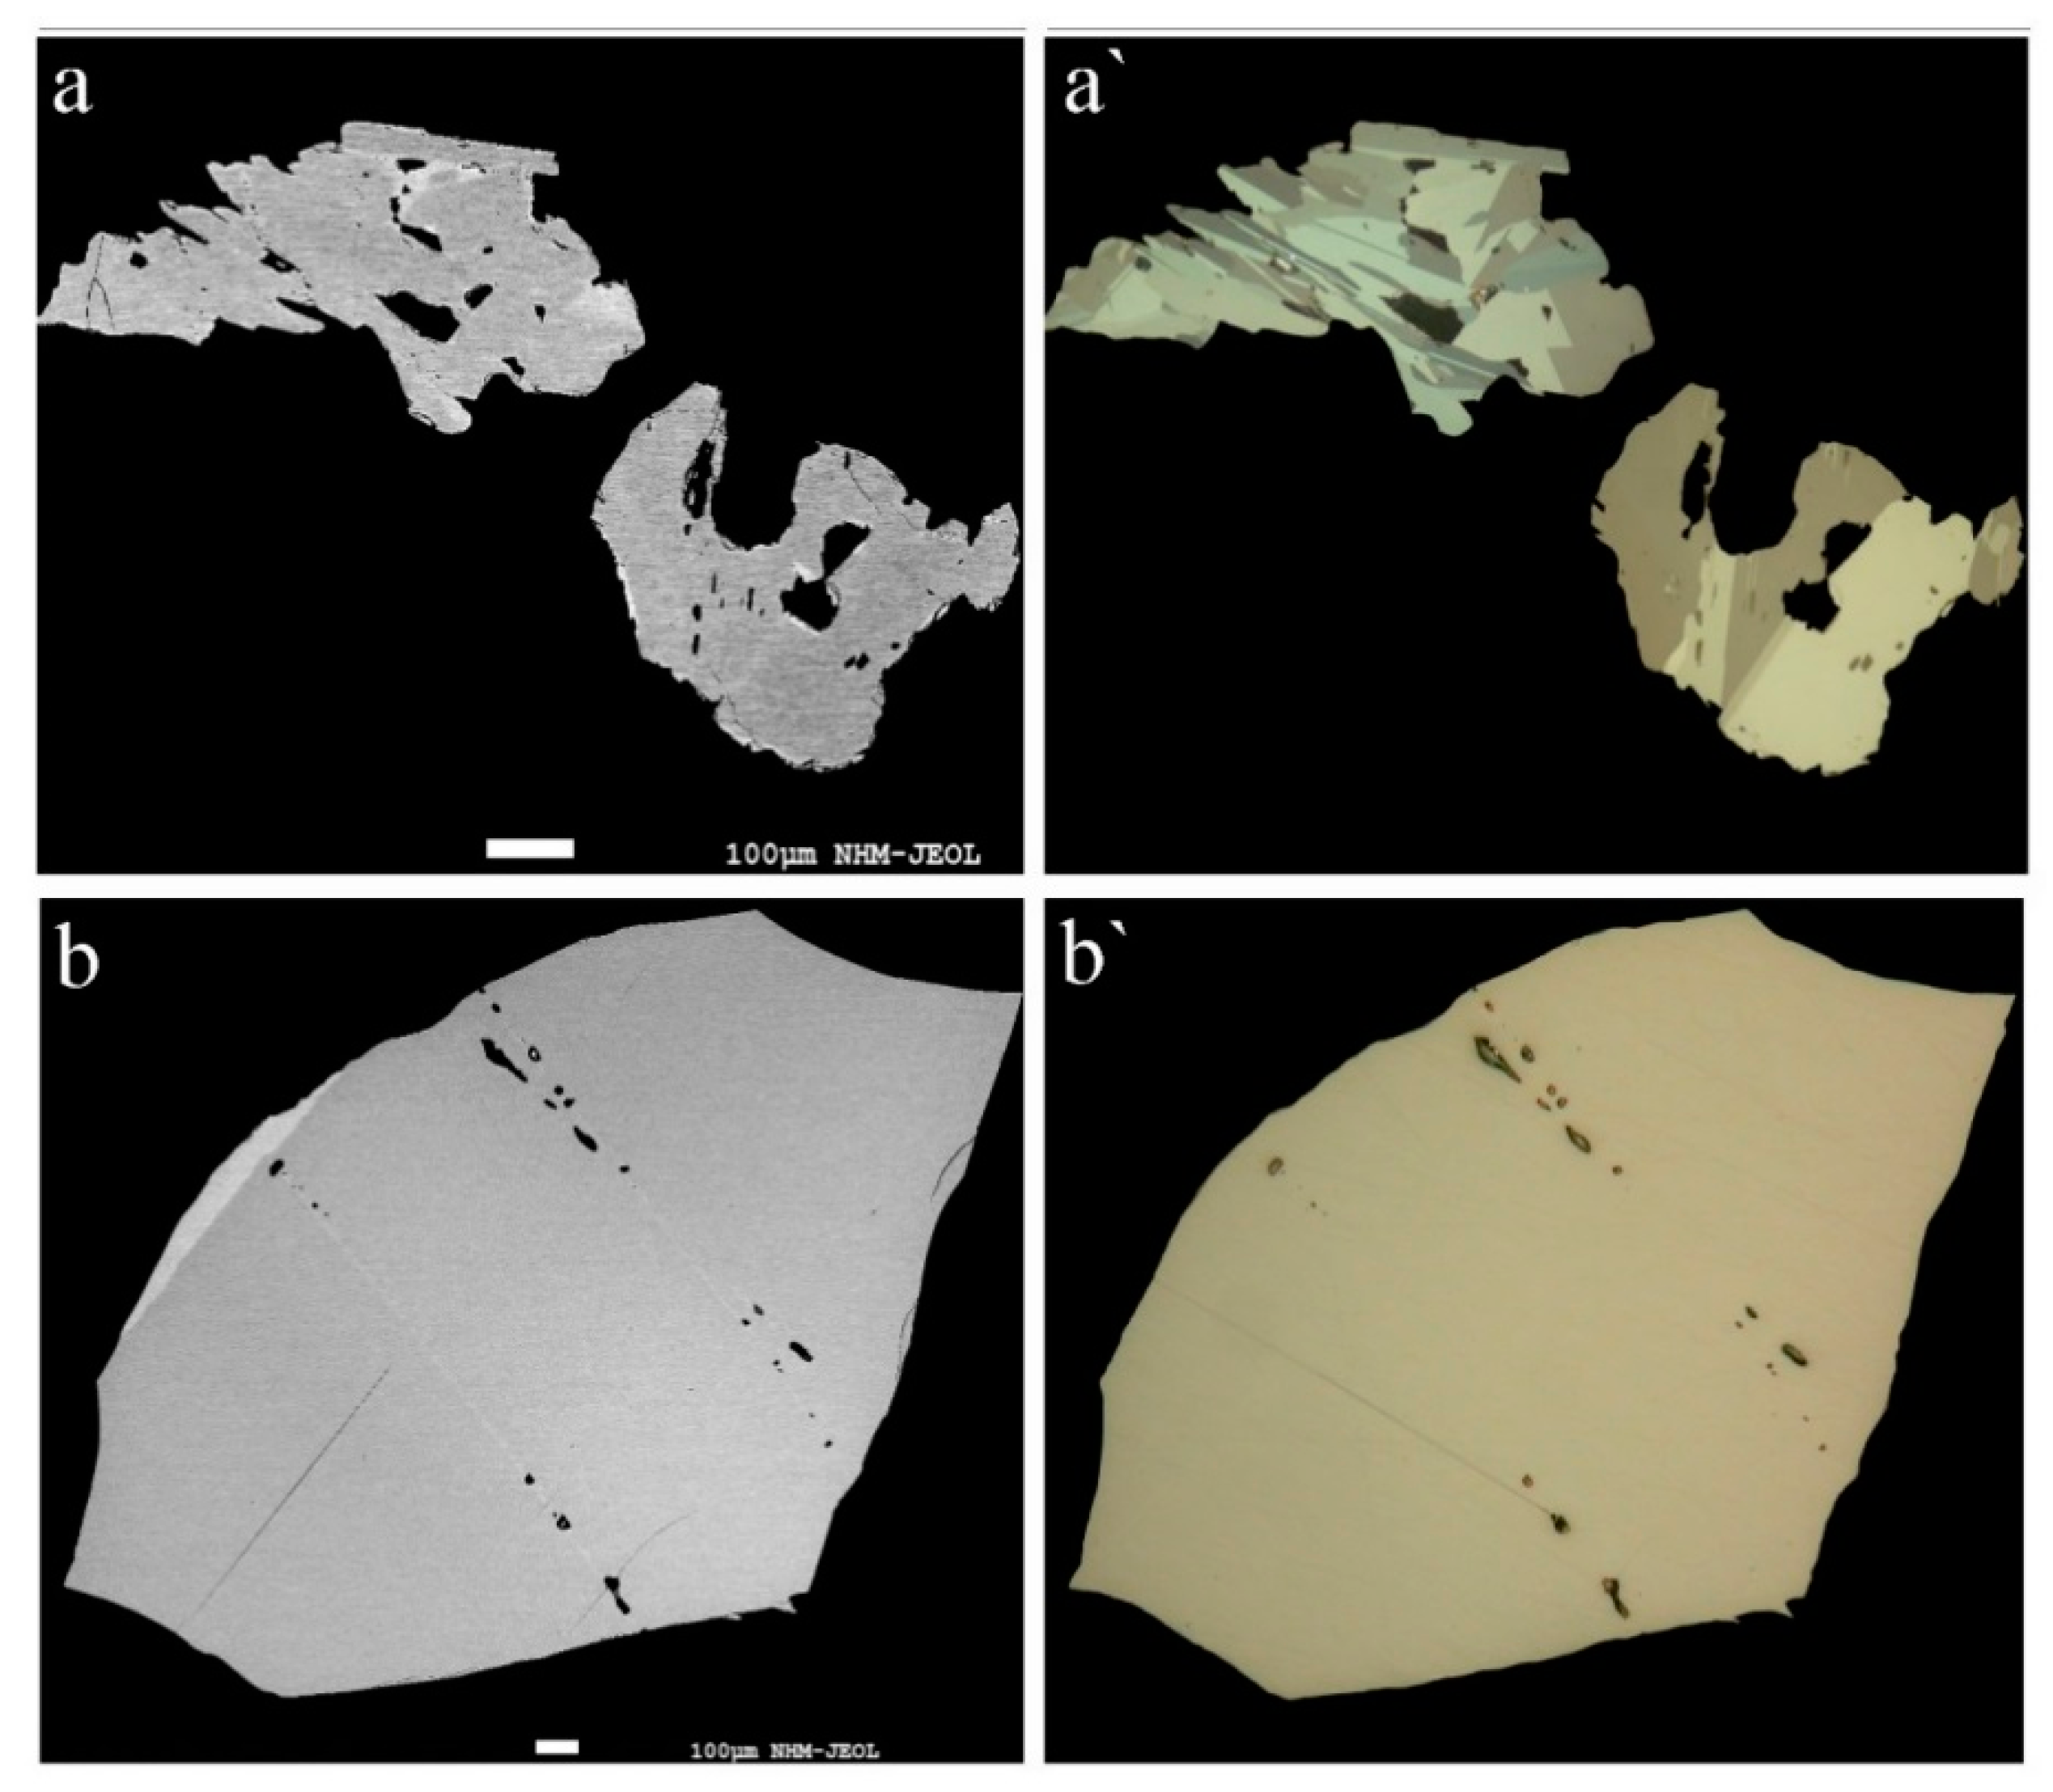
Figure 1, of Tl-rich rathite with exsolved lamellae of a Tl-richer rathite-type phase “SR” (for details see below) in Figure 2 and of Sb-bearing rathites from Reckibach and Lengenbach in Figure 3.

3. Chemical Data

Up to twenty separate sulphosalt grains, depending on quantity of available material in a given sample, were mechanically extracted from the dolomite-hosted sulphosalt aggregates or crystals and subsequently embedded in an epoxy-mount, polished, studied in reflected light, examined by qualitative back-scattered electron (BSE) images and energy dispersive spectrometry (EDS) analyses) and quantitative wave-length dispersive spectrometry (WDS) electron microprobe analyses. This procedure was separately applied to a large number of samples.
Chemical analyses of rathite and accompanying sulphosalt minerals from Lengenbach and Reckibach deposits, Binntal, Canton Wallis, Switzerland, were carried out using a JEOL “Hyperprobe” JXA 8530F field-emission gun electron microprobe (FE-EPMA) in the Central Research Laboratories at the Natural History Museum, Vienna, employing JEOL and Probe for EPM analysis software (WDS mode, 25 kV, 20 nA, 2 μm beam diameter, count time 10 s on peak and 5 s on background positions). The following emission lines and standards were used: As-Lα, Tl-Lα and S-Kα (lorándite, TlAsS2), Pb-Mα (galena), Ag-Lα (Ag metal), and Sb-Lα (stibnite). Other elements, such as Hg, Cu, and Fe, were sought but not detected.
The formula calculations for the sartorite homologue order Ncalc, described by Makovicky and Topa [13], are designed to identify the minerals of the family from the results of electron microprobe investigations, and are used here to select all point analyses representative for rathite and rathite-related phases with N = 4. More than 2700 point analyses, of more than 800 samples containing rathite, with calculated homologue number Ncalc ranging between 3.9 and 4.1, and with a good charge balance (calculated from at % values) ranging between –2.5 and +2.5, were selected and represent the best analytical data base of rathite compositions at present. The entire content of the database is plotted in the (As + Sb) − (Ag + Tl) − Pb ternary diagram (Figure 4) as a grey background and gives a first hint of the chemical variations.
The representative mean chemical compositions of rathite with different degree of (Ag+ + As3+)-for-2Pb2+, (Tl+ + As3+)-for-2Pb2+ and Sb-for-As substitutions (some used for subsequent crystal-structure studies), are presented in Table 2 and Table 3, whereas individual points of the first group of samples (used for the structural studies) are plotted in different colours in the ternary diagram of Figure 4. The range of Ag, Tl, and Sb variations found are considerably larger than those reported by Berlepsch et al. [2]. The degree of Ag and Tl substitutions (Agsubst and Tlsubst) are calculated with formulae given by Makovicky and Topa [13]. The Agsubst value varies between 43.4 and 47.9, whereas the Tlsubst value shows a large variation between 0.5 and 41.9, with strong implications for the crystal chemistry and range of compositional variability of rathite.
The empirical formulae of the chemically most different rathite compositions (based on 72 atoms per formula unit (apfu), 32Me + 40S) are presented in the footnote of Table 2 and Table 3 and demonstrate a limited Ag substitution combined with large Tl and Sb substitutions ranging between Ag1.70Tl0.04Pb12.47(As15.88Sb1.75)Σ17.63S40.17 (Tl-poorest sample) to Ag1.76Tl2.91Pb6.67(As19.77Sb0.90)Σ20.66S39.99 (Tl-richest sample) and Ag1.82Tl0.80Pb10.79(As14.88Sb3.43)Σ18.31S40.28 (Sb-richest sample).
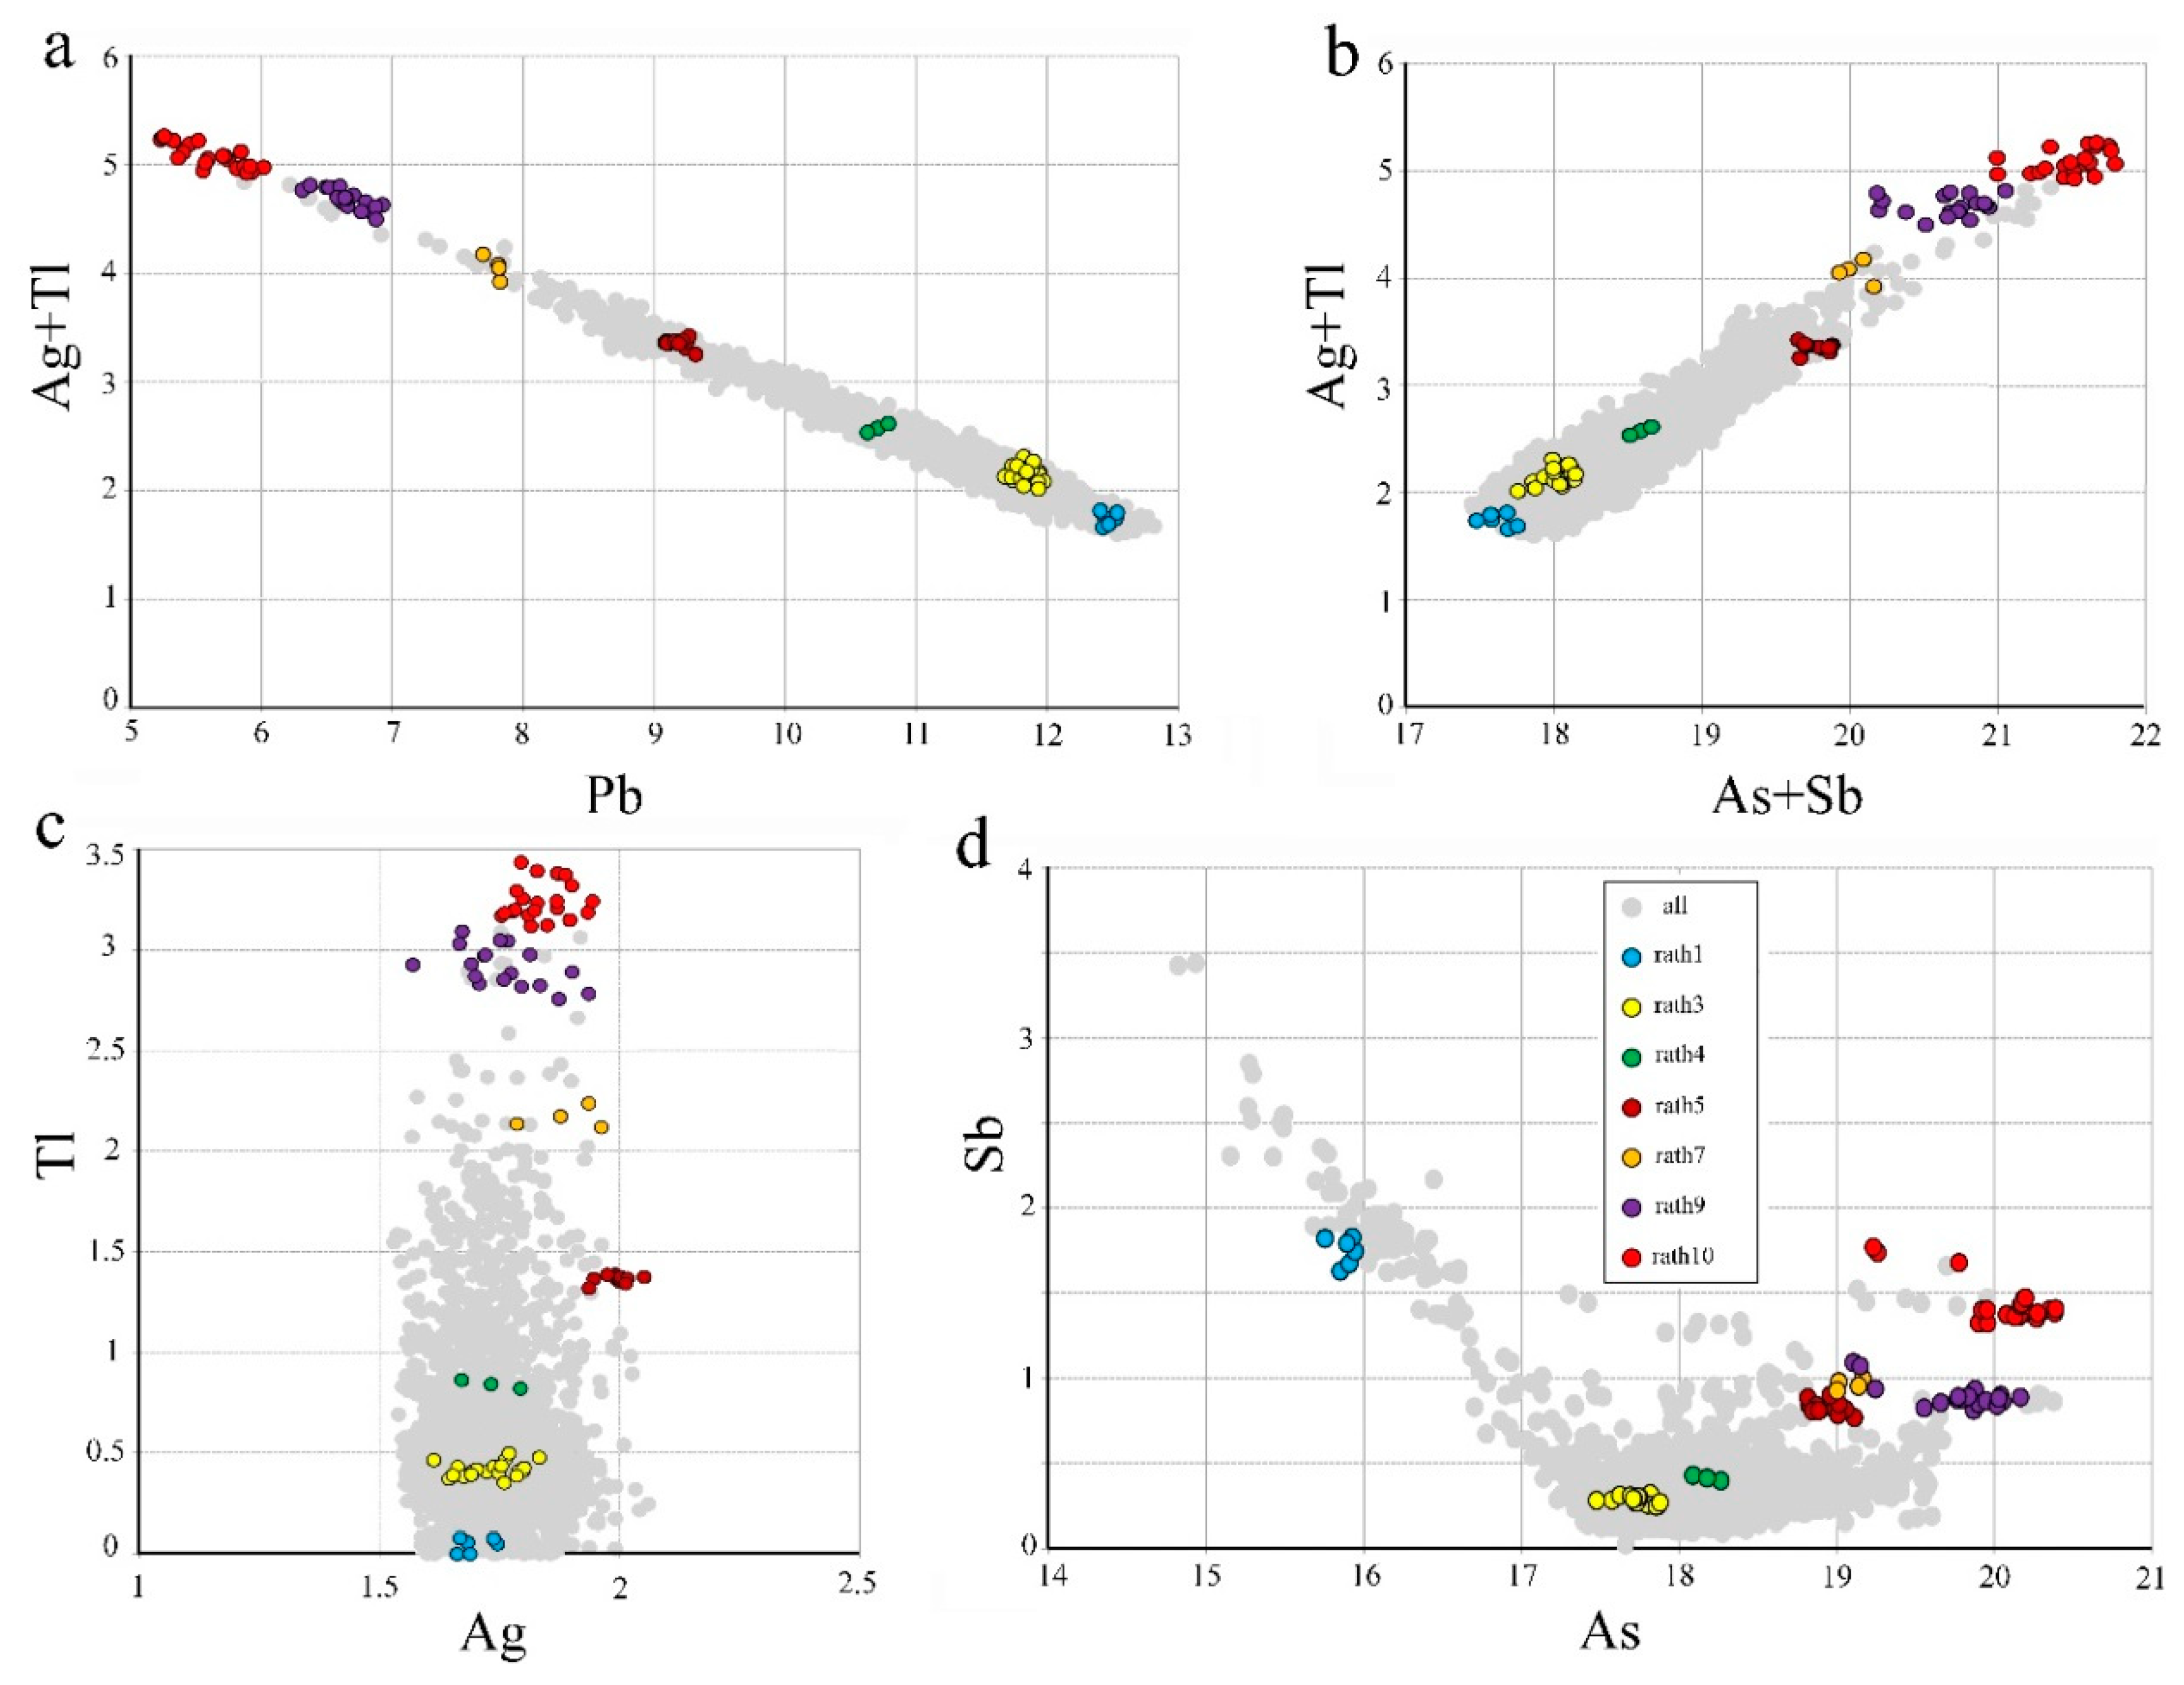
The binary plots a, b, c, d in Figure 5, based on apfu, depict the correlations of (Ag + Tl) vs. Pb, (Ag + Tl) vs. (As + Sb), Tl vs. Ag, and Sb vs. As, respectively, and allowed to determine the range of variations and a revised general formula of rathite: AgxTlyPb16−2(x+y)As16+x+yzSbzS40 (with 1.6 < x < 2, 0 < y < 3, 0 < z < 3.5). An Ag-free natural rathite does not exist, in agreement with studies of the system PbS-As2S3 between 250 and 750 °C (Kutolglu [22]), although synthetic “rathite” (insufficiently characterized) was observed in an earlier, hydrothermal study of this system (Rösch and Hellner [23]). The conclusion of Berlepsch et al. [2] that the presence of Ag in the crystal structure of rathite is essential for this mineral, agrees with the Kutolglu study.
In Lengenbach, the Sb content of rathite, sartorite, baumhauerite, liveingite, and dufrénoysite generally ranges between 0 wt% and ~2 wt% Sb. An unusually high Sb content in rathite (5 wt%–7 wt%) is found normally in samples coming from the Reckibach deposit, except for a single sample from Lengenbach (Table 3). A conspicuous Sb content in rathite was pointed out by Baumhauer [1].
EPMA studies revealed a specific limit to the Tl content in rathite. The back-scattered images in Figure 2 show two aggregates of mixed exsolution lamellae of the Tl-richest rathite (bright grey phase, rath9 in Table 2; 11.78 wt% Tl) and a possibly new, still Tl-richer species, still under investigation, here designated “SR” (dark-grey phase, rath10 in Table 2; 13.25 wt% Tl). The empirical formula of phase “SR” is Ag1.84Tl3.24Pb5.62(As20.05Sb1.44)Σ21.49S39.81, with Ncalc = 3.9, which clearly indicates its membership of the rathite group. Note the small gap between the chemical compositions of rath9 and phase “SR” (rath10), in the ternary plot of Figure 4 and binary plots of Figure 5, where all data are considered. The meaning and importance of that are discussed later, in connection with the results of crystal structures and crystal chemistry of the studied rathite samples.

4. Crystallography

Single-crystal studies were performed on a total of eight rathite fragments, mechanically extracted after quantitative electron microprobe analysis, from samples containing the groups mentioned in Table 2. All fragments were found to show good diffracting quality; no twinning or other anomalies were noted. We were so far unable to obtain structural information for phase “SR” due to the thinness of its exsolution lamellae, but the search for suitable fragments is still ongoing.
Single-crystal X-ray diffraction data were collected for all samples except rath9 on a Bruker SMART APEX CCD-three-circle-diffractometer at the University of Salzburg. Intensity data were collected with graphite-monochromatised MoKα X-radiation (50 kV, 30 mA) using SMART software (Bruker AXS [24]). The crystal-to-detector distance was set to 60 mm for all rathite crystals. The detector was positioned at –28° 2θ using an ω-scan mode strategy at four different ϕ positions (0°, 90°, 180°, and 270°). In total, 630 frames with Δω = 0.3° were acquired for each run, with a 40 s/frame time of acquisition. Intensity data were integrated using SAINT software (Bruker AXS [25]). The semiempirical absorption correction based on pseudo ω scans was done with XPREP software (Bruker AXS [26]). Sample rath9 (and three other samples not reported here) were measured at the University of Vienna using a Nonius KappaCCD single-crystal diffractometer (graphite-monochromatised MoKα X-radiation, 50 kV, 30 mA; crystal-to-detector distance 30 mm, 1126 frames, 330 s/frame) that was equipped with a 300 μm diameter capillary-optics collimator to provide increased resolution. The data were processed with the Nonius program suite DENZO-SMN and corrected for Lorentz, polarization, background, and by multiscan absorption correction (Otwinowski and Minor [27]), absorption effects.
The centrosymmetric space group P21/n proposed for all fragments by XPREP was chosen in accordance with systematic extinctions and intensity statistics and was afterward transformed in P21/c standard settings. Rathite structures with different Tl content were solved by direct methods (SHELXS-97; Sheldrick [28]), which revealed most of the atom positions. The crystal-structure model and atom-site labeling scheme of Berlepsch et al. [2] were used as starting points for subsequent refinements. Occupancies of split sites were assigned based on geometric features and chemical considerations based on EPMA data. Between about 20 and 50 “bad” reflections (from a total of about 2300 to 6000 reflections) were omitted in order to “sharpen” the obtained models and to improve the distinguishing of the split sites; in the case of rath9 four of the omitted reflections were blocked by the beam stop. We checked that this omission did not seriously affect our models. Taking in account that Pb and Tl cannot be distinguished in X-ray diffraction experiments, no attempt to localize Tl in the structure refinement was made. Based on refinements for low-Sb samples (rath4 and rath3), the distinction between Ag and Sb was possible and found to be in accordance with the Berlepsch et al. [2] model.
Out of the eight studied crystals, we selected five (samples rath1, rath3, rath4, rath7, and rath9) that best represent a series of increasing Tl contents. Details on data collection and results of the structure refinement of these samples are given in Table 4, unit-cell dimensions are compared in Table 5, fractional atomic coordinates and anisotropic atomic displacement parameters of rath1 (Tl-poorest) and rath9 (Tl-richest) are compiled in Table 6 and Table 7, and a comparison of corresponding site occupancies is given in Table 8, while Table 9 and Table 10 give selected bond lengths for rath1 and rath9.
The full set of data is accessible via the CIF files freely available online as Supplementary Material linked to this article. Supplementary tables of fractional atomic coordinates, anisotropic atomic displacement parameters, bond lengths, and polyhedron characteristics for samples rath3, rath4, rath5 (partly recalculated from [2]), and rath7 are available online (Tables S1–S3, respectively).
The single-crystal diffraction data of all studied rathites indicated, independent of the individual Tl contents, a monoclinic cell, with space group P21/c and a~8.5, b~8, c~25 Å, β~100.6°. The small but conspicuous changes in unit-cell parameters are shown in Table 4. A clear increase of a, b, and V, and a slight decrease of c with increasing Tl content are masked somewhat by a random variation of the Sb content.
The asymmetric unit in the crystal structure of rathite contains eight cation sites and ten sulphur sites. The rathite structure model of Berlepsch et al. [2] consists of two fully occupied Pb sites, three fully occupied As sites, and three mixed split positions Me3 (As0.735,Sb0.265), Me5 (As0.526,Ag0.474), and Me6 (Pb0.739,As0.261). Our refinement results, compared with those of Berlepsch et al. [2] are presented in Table 6. Figure 6 depicts the crystal structure of rath1 (a) and rath9 (b), projected along the a = 8.4 Å axis. The 18 independent sites form a layer (L1 or L2 in Figure 6a) four coordination polyhedra long and two polyhedra thick, based on an SnS-like archetype, built by six (mainly) As-centered coordination polyhedra (CN = 5–7) with a crankshaft arrangement of short As–S bonds, and terminating with two Pb-centred tricapped trigonal coordination prisms (CN = 9) at one end. Two such identical layers, symmetry related by inversion centers in rathite, form a tightly bonded double layer (ribbon), and the adjacent parallel double layers are separated by the lone-electron pair micelle. Along the a and b axes, the infinite rows of ribbons form a (001) slab, related by the 21 screw axis and the c glide plane to the next one. The dark-green ribbon of rath1 is Pb-rich due to the 0.961 Pb occupancy of the Me6 site and the light-green ribbon of rath9 is As-rich due to the 0.576 As occupancy of the Me6 site.

4.1. Crystal Chemistry

4.1.1. Pb Sites

Thallium is supposed to enter into the structure of rathite (as in the sartorite family) on the Pb sites and investigations of those sites reveal the Tl role. Figure 7 shows the coordination polyhedra of [9]Pb1 and [9]Pb2 sharing the S1, S2, and S6 sulphur ligands. The S5, S6, S7, and S8 sulphur ligands are close to the Me3, Me5, and Me6 sites, and the Pb–S bond lengths are slightly affected by the different substitution at these Me sites.
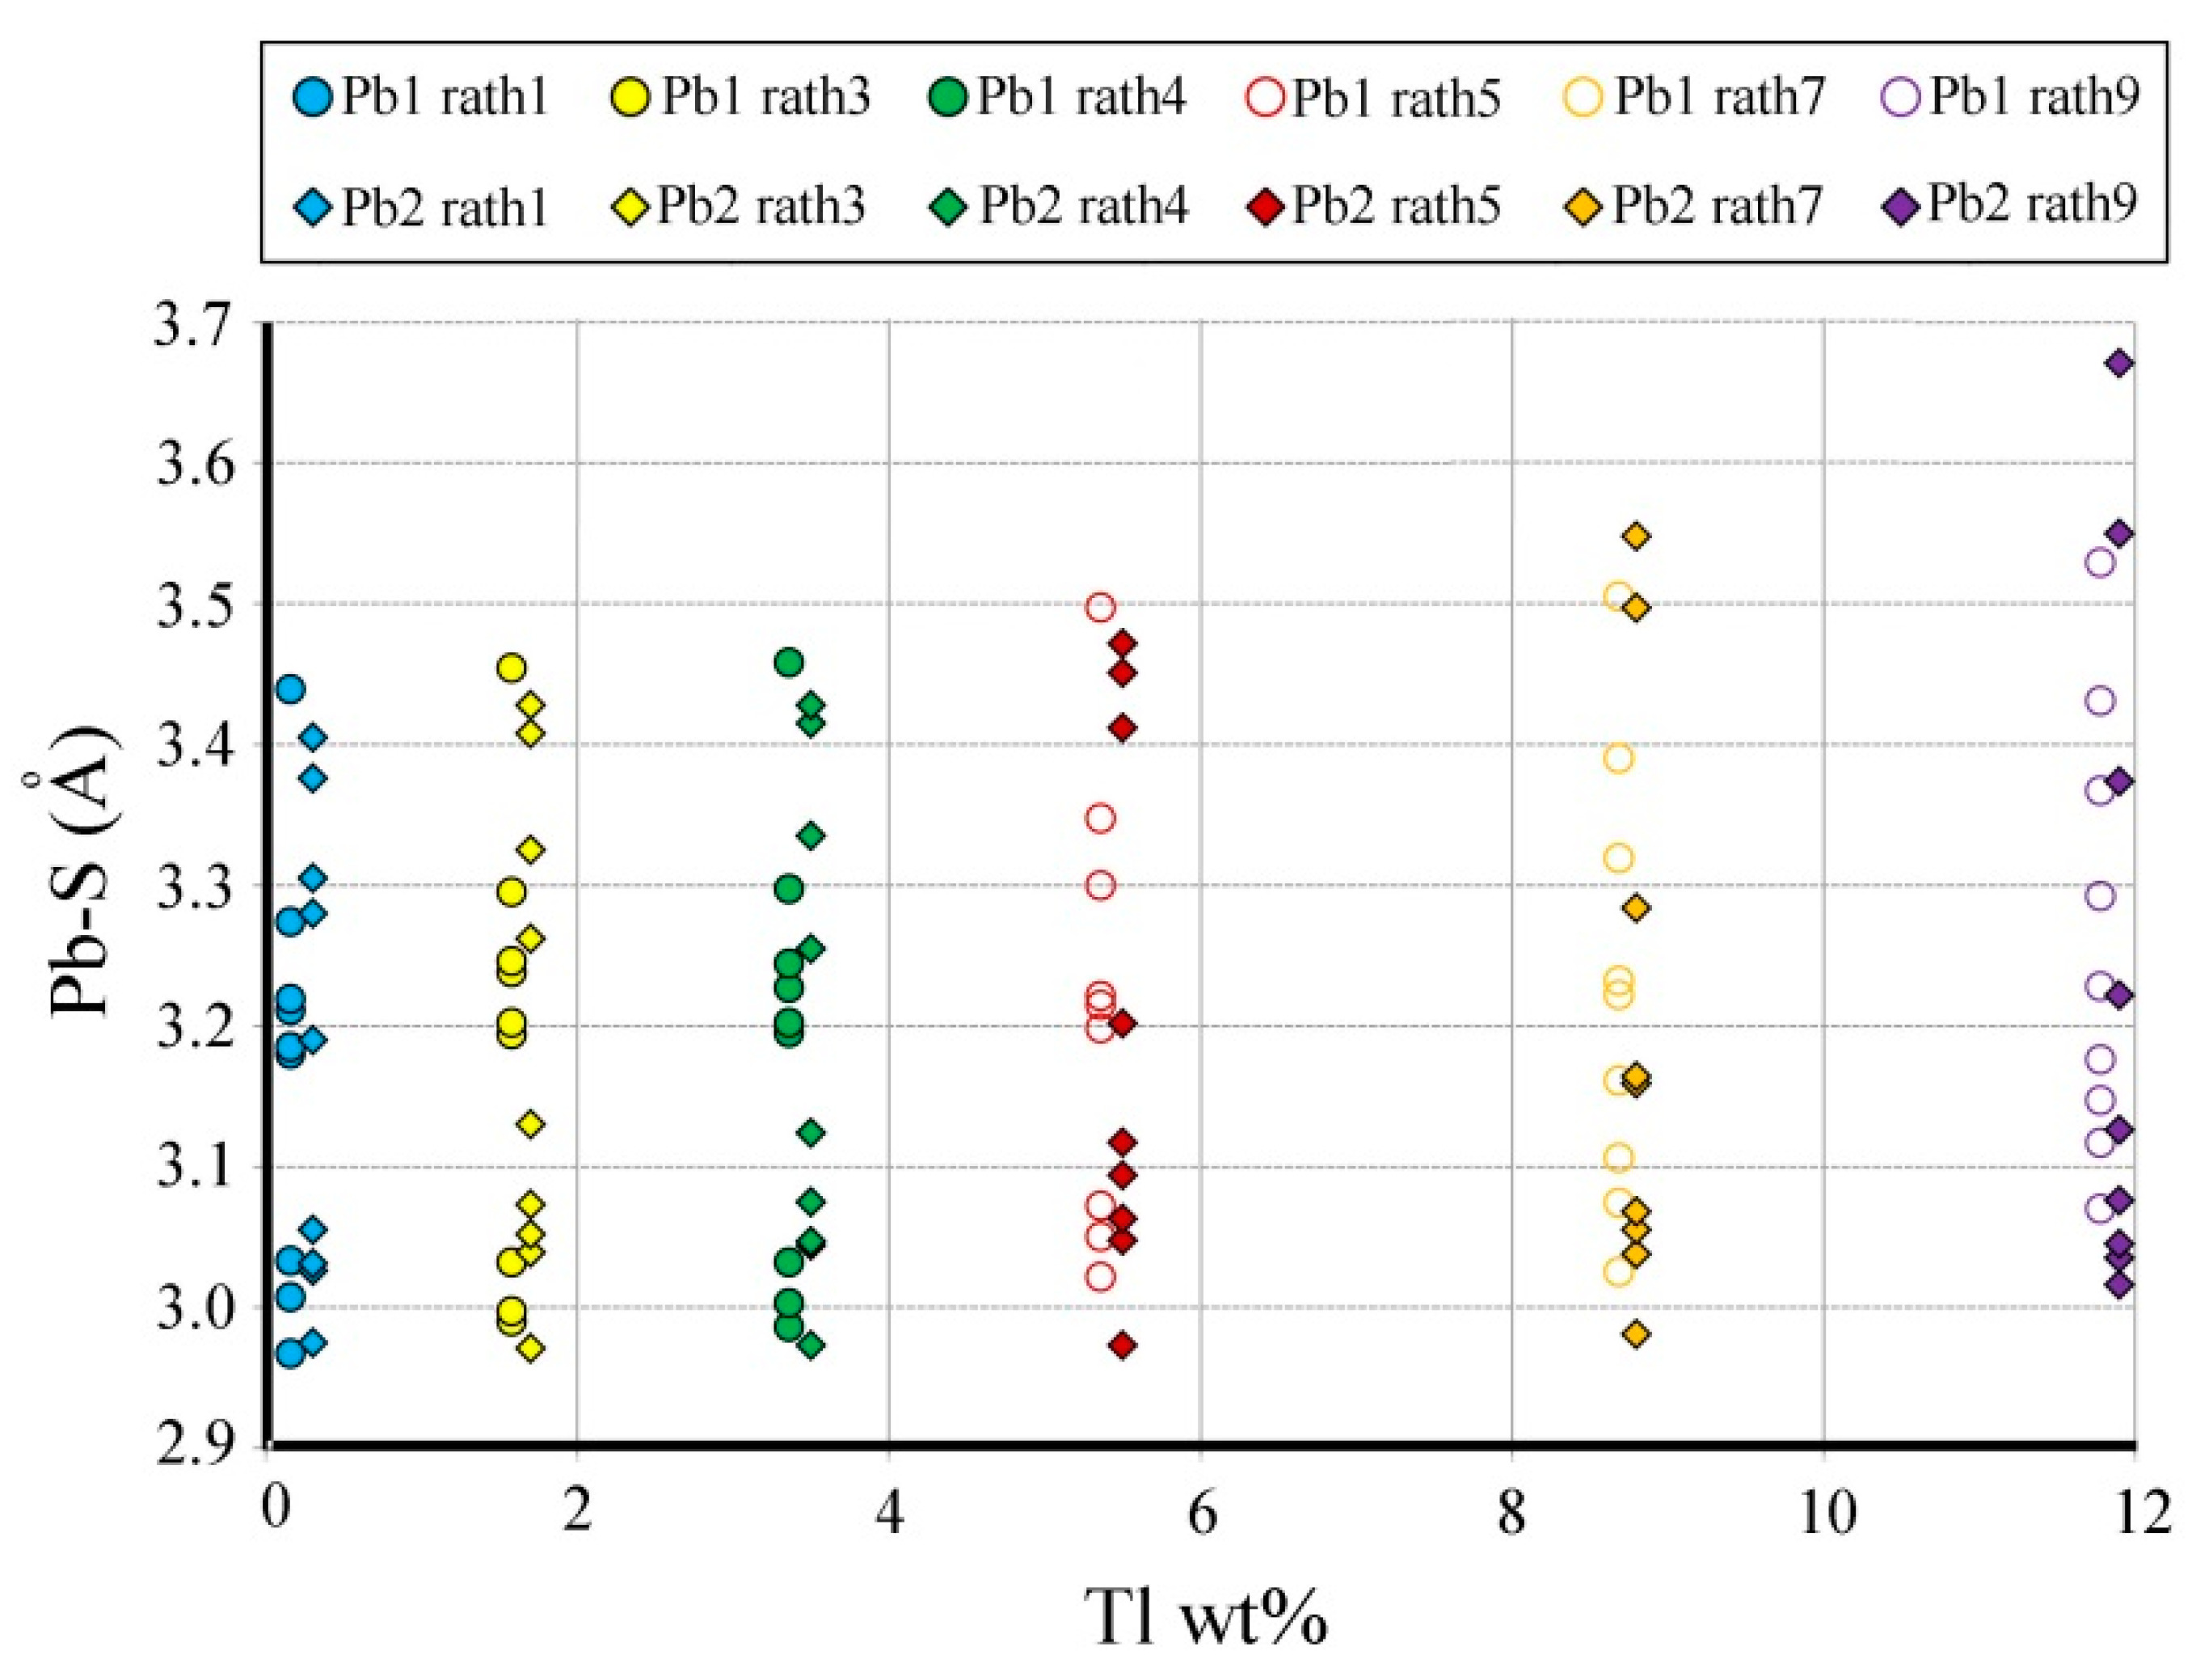
The incorporation of Tl on the two Pb sites, Pb1 and Pb2, is expressed by an increase of the (Pb,Tl)–S bond lengths that is positively correlated with the Tl content (Figure 8, Table 9 and Table 10). For the samples with high Tl content (above 5 wt%), the first two short (Pb,Tl)–S bond lengths for Pb1 and Pb2 are better separated in comparison with the corresponding bond lengths in the low-Tl samples, thus indicating that Pb1 incorporates more Tl than Pb2.
As shown in Table 11, Table 12 and Table 13, this incorporation is also reflected by the polyhedron characteristics, as defined in IVTON (Balić Žunić and Vicković [29]; Makovicky and Balić Žunić [30]): radius rs in Å of a circumscribed sphere least-squares fitted to the coordination polyhedron, the volume distortion υ, the ’volume-based’ eccentricity ECCV, the volume in Å3 of the circumscribed sphere, the volume in Å3 of coordination polyhedron, the average bond distance and the standard deviation of the bond distance all increase with increasing Tl content, while the bond-valence sum notably decreases.

4.1.2. As, (As/Ag), (As,Sb), and (Pb/As) Sites

The As sites behave differently in rathite. The As–S bond lengths (Table 9 and Table 10) of the As1, As2, and A4 sites comprise regular three short (2.2–2.37 Å) and two long (2.9–3.4 Å) distances, typical for pure As sites (CN = 5) and indicate that As1, As2, and As4 sites are unaffected by the observed substitutions.
The Ag substitution in rathite occurs on the Me5 site that is split into an Me5b site (As) and a Me5a site (Ag), with a fairly constant ratio of roughly 1:1, also reflected by the fairly constant Ag contents in all chemically analyzed samples (3.1 wt%–4.1 wt%, mean 3.6 wt%). This substitution feature is explained by the fixed location of the Ag atom within the ribbon, as is also observed for other sartorite-group members, such as argentobaumhauerite [31] and argentoliveingite [32], in both of which, however, the Ag site is fully occupied.
The Me6 site is split and shared between Pb (Me6a) and As (Me6b). With increasing Tl content, and therefore increased [Tl+ + As3+] ↔ 2Pb2+ substitution, the occupancies change from Pb0.961(3) and As0.039(3) (Tl-poorest sample rath1) to Pb0.424(4) and As0.576(4) (Tl-richest sample rath9). The Me6 site is located in the central part of the ribbon (Figure 6, Figure 9, and Figure 10).
Sb substitution is seemingly only affecting the Me3 site. In the Sb-richest, structurally studied sample (rath1), the occupancy of this (then split) site is Me3a = As0.532(9) and Me3b = Sb0.468(9). The left side of the binary plot of Sb vs. As in Figure 5d depicts the linear decrease of As with increasing Sb due to direct Sb-for-As substitution, whereas the right side expresses the increase of As due to the Ag and Tl substitutions.
Since our EPMA data revealed even Sb-richer samples (with up to 7.71 wt% Sb), for which currently no crystal-structure refinements are available, these might theoretically represent a new mineral species with Sb dominant on the Me3 site (according to the current IMA rules on the definition of new mineral species). However, we cannot exclude that minor Sb might also be present on the Me5b (As) subsite of the split Ag/As Me5 site.

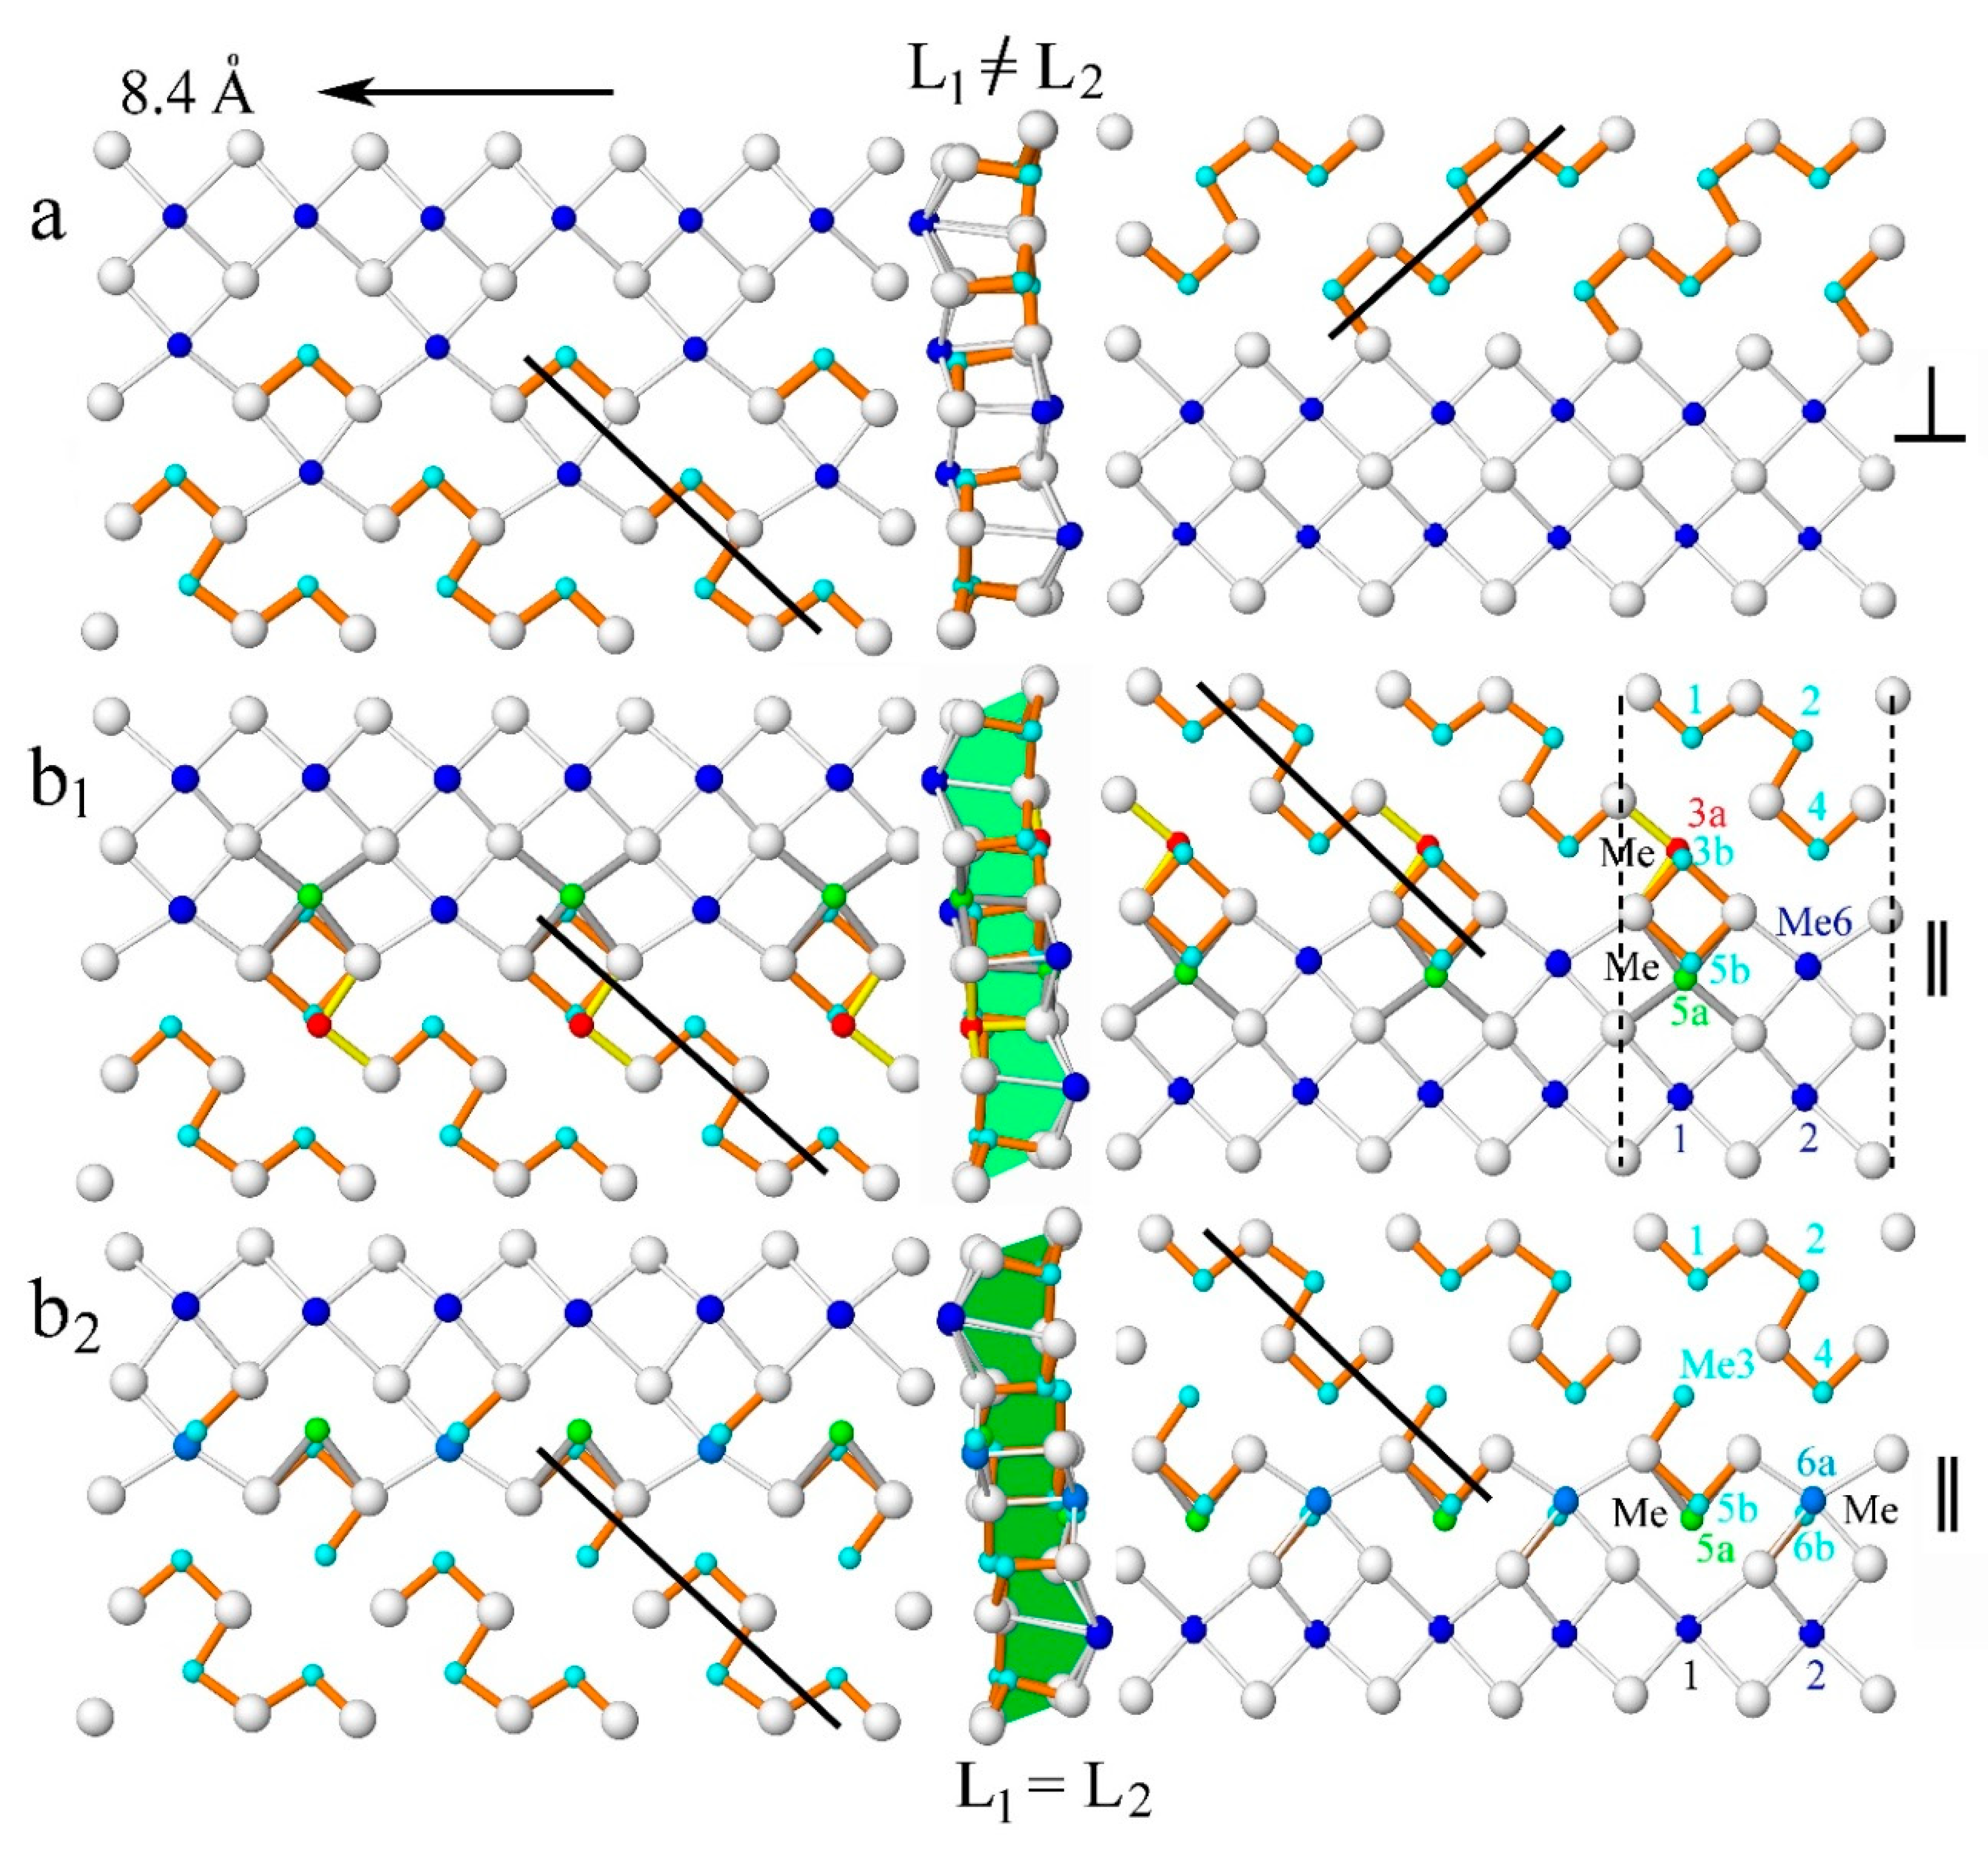
4.1.3. Crankshaft Chains

Another way to visualize the differences between the structures of rath1 and rath9 is the analysis of the crankshaft chains (alternating short–long bond distribution present in the highly covalent structures), as an unbroken or fragmented chain of short Me–S bonds. The crankshaft chains of the tightly bonded double SnS-like layer ribbon in rath1 and rath2 (Figure 9b1,b2) and their chemistries are compared with the one of dufrénoysite (Figure 9a).
To achieve that, three unit-cell broad ribbons along the 8.4 Å axis, oriented with the Pb-dominated layer for dufrénoysite on the left side, are sliced in two, 90° clockwise-rotated layers (L1 and L2), and placed on the left and right sides of each ribbon (Figure 9). The short As–S bonds are shown in orange color, while the Sb–S short bonds are indicated in yellow color. For each ribbon, the length and direction of the crankshaft chains are indicated. The L2 SnS-layer of dufrénoysite shows an unbroken four-polyhedra crankshaft chain of As. All other ribbons additionally possess one- or two-polyhedra fragmented crankshaft chains beside the unbroken three-polyhedra chain.
One can distinguish parallel and almost perpendicular directions of the chain directions between the left and right sides of the layers in each ribbon (thick black lines in Figure 9). In the centrosymmetric structures of rathite (exemplified by rath1 and rath9) individual SnS-like layers (L1 and L2) of the tightly bonded double layer are symmetry related by inversion centers and their direction is parallel to each other, a feature not seen in the acentric structure of dufrénoysite, where the direction are perpendicular to each other.

5. Phase “SR”

The phase “SR” (rath10) forms thin exsolution lamellae (~2 micron thick, dark in BSE images) with the Tl-richest rathite rath9 (bright in BSE images), in two separate grains coming from different samples, with almost the same chemistry (Figure 2a,b and Table 1). The presence of two kinds of lamellae implies two distinct phases with different chemistries and structures. The exsolved intergrowths between the phase “SR” and rath9 may have formed during cooling of a previously stable, homogeneous higher-temperature Tl-rich phase.
The chemical composition of “SR” differs from that of rath9, but due to the thinness of the lamellae (measured with fully focused beam) an accurate determination of its composition and its range is difficult to achieve. For rath9 a homogenous grain was used for chemistry and structure determination (Figure 1b, Table 2). The calculated homolog order Ncalc is 3.9 for “SR”, indicating a close relationship with rathite and the existence of a periodicity based on a ..44.. sequence (as in rathite). The degree of Ag and Sb substitution in “SR” is equivalent to that in rathite, but the degree of Tl substitution is 16% higher than in rath9.
A hypothetical crystal structure for phase “SR” is presented in Figure 10. It could have the same metric as rathite, but should have a lower symmetry (monoclinic P21 or triclinic P-1) in order to produce two asymmetric ribbons with different chemistry. One ribbon (light green in Figure 10) is As-rich (Me6 site fully occupied by As) similar to the (As,Ag)-rich ribbon from the argentobaumhauerite structure (Topa and Makovicky [31]). The other ribbon (dark green) may be Pb-rich (Me6 site fully occupied by Pb, as in rath1) similar to one of the (Pb,Ag)-rich ribbons in the argentoliveingite structure (Topa et al. [32]). Both ribbons in phase “SR” are only similar to, but not identical with the mentioned ones, because of the partial presence of Ag at the site Me5. The suggested periodicity sequence ..44.. is based on two chemically and structurally different ribbons, whereas in rathite there is only one ribbon.
A structure determination of phase “SR” would necessitate careful electron-diffraction studies and/or simultaneous refinement of two phases in the same fragment.

Supplementary Materials

The following are available online at https://www.mdpi.com/2075-163X/8/10/466/s1: Table S1: Fractional atomic coordinates and displacement parameters (in Å2) for samples rath3, rath4, rath5, and rath7; Table S2: Bond lengths in samples rath3, rath4, rath5, and rath7; Table S3: Polyhedron characteristics for atoms in samples rath3, rath4, rath5, and rath7.

Author Contributions

Conceptualization, D.T. and U.K., measurements and interpretation, D.T. and U.K.; writing paper, D.T. and U.K.

Funding

This research received no external funding.

Acknowledgments

The authors express their gratitude to all the above listed donors who contributed material to this study. We thank Goran Batic for his technical assistance in preparing some of the microprobe mounts. We also thank to three anonymous reviewers who helped to improve the manuscript. We are grateful to Minerals editor Christian Biagioni for his useful comments.

Conflicts of Interest

The authors declare no conflict of interest.

References

  1. Baumhauer, H. Ueber den Rathit, ein neues Mineral aus dem Binnenthaler Dolomit. Z. Kristall. 1896, 26, 593–602. [Google Scholar] [CrossRef]
  2. Berlepsch, P.; Armbruster, T.; Topa, D. Structural and chemical variations in rathite, Pb8Pb4−x(T12As2)x(Ag2As2)As16S40: Modulations of a parent structure. Z. Kristall. 2002, 217, 1–10. [Google Scholar]
  3. Solly, R.H. On the Relation Between Rathite, Rathite α, and Wiltshireite. Mineral. Mag. 1911, 16, 121–123. [Google Scholar] [CrossRef]
  4. Giuşcă, D. Die Erze der Lagerstätte vom Lengenbach im Binnental (Wallis). Schweiz. Mineral. Petrogr. Mitt. 1930, 10, 152–177. [Google Scholar]
  5. Berry, L.G. New data on lead sulpharsenites from Binnental, Switzerland. Am. Mineral. 1953, 38, 330. [Google Scholar]
  6. Le Bihan, M.T. Étude structurale de quelques sulfures de plomb et d’arsénic naturels du gisement de Binn. Bull. Soc. Franç. Minéral. Cristallogr. 1962, 85, 15–47. [Google Scholar] [CrossRef]
  7. Nowacki, W.; Marumo, F.; Takeuchi, Y. Investigations on sulfides from Binntal (Canton Valais, Switzerland). Schweiz. Mineral. Petrogr. Mitt. 1964, 44, 5–9. [Google Scholar]
  8. Marumo, F.; Nowacki, W. The crystal structure of rathite-I. Z. Kristall. 1965, 122, 433–456. [Google Scholar] [CrossRef]
  9. Makovicky, E. The building principles and classification of sulphosalts based on the SnS archetype. Fortschr. Mineral. 1985, 63, 45–89. [Google Scholar]
  10. Laroussi, A.; Moëlo, Y.; Ohnenstetter, D.; Ginderow, D. Argent et thallium dans les sulfosels de la série de la sartorite (Gisement de Lengenbach, vallée de Binn, Suisse). C. R. Acad. Sci. Sér. II 1989, 308, 927–933. [Google Scholar]
  11. Pring, A. The crystal chemistry of the sartorite group minerals from Lengenbach, Binntal, Switzerland—A HRTEM study. Schweiz. Mineral. Petrogr. Mitt. 2001, 81, 69–87. [Google Scholar]
  12. Berlepsch, P.; Makovicky, E.; Balić-Žunić, T. Crystal chemistry of sartorite homologues and related sulfosalts. Neues Jahrb. Mineral. Abh. 2001, 176, 45–66. [Google Scholar]
  13. Makovicky, E.; Topa, D. Crystal chemical formula for sartorite homologues. Mineral. Mag. 2015, 79, 25–31. [Google Scholar] [CrossRef]
  14. Topa, D.; Makovicky, E.; Tajedin, H.; Putz, H.; Zagler, G. Barikaite, Ag3Pb10(Sb8As11)Σ19S40, a new member of the sartorite homologous series. Mineral. Mag. 2013, 77, 3039–3046. [Google Scholar] [CrossRef]
  15. Bindi, L.; Nestola, F.; Makovicky, E.; Guastoni, A.; de Battisti, L. Tl-bearing sulfosalt from the Lengenbach quarry, Binn valley, Switzerland: Philrothite, TIAs3S5. Mineral. Mag. 2014, 78, 1–9. [Google Scholar] [CrossRef]
  16. Biagioni, C.; Orlandi, P.; Moëlo, Y.; Bindi, L. Lead-antimony sulfosalts from Tuscany (Italy). XVI. Carducciite, (AgSb)Pb6(As,Sb)8S20, a new Sb-rich derivative of rathite from the Pollone mine, Valdicastello Carducci: Occurrence and crystal structure. Mineral. Mag. 2014, 78, 1775–1793. [Google Scholar] [CrossRef]
  17. Topa, D.; Keutsch, F.N.; Makovicky, E.; Kolitsch, U.; Paar, W. Polloneite, a new complex Pb(-Ag)-As-Sb sulfosalt from the Pollone mine, Apuan Alps, Tuscany, Italy. Mineral. Mag. 2016, 81, 1303–1322. [Google Scholar] [CrossRef]
  18. Ribar, B.; Nicca, C.; Nowacki, W. Dreidimensionale Verfeinerung der Kristallstruktur von Dufrenoysit, Pb8As8S20. Z. Kristall. 1969, 130, 15–40. [Google Scholar] [CrossRef]
  19. Topa, D.; Makovicky, E. The crystal structure of veenite. Mineral. Mag. 2016, 81, 355–368. [Google Scholar] [CrossRef]
  20. Graeser, S.; Cannon, R.; Drechsler, E.; Raber, T.; Roth, P. Faszination Lengenbach. Abbau—Forschung Mineralien 1958–2008; KristalloGrafik Verlag: Lindau, Germany, 2008; 192p. [Google Scholar]
  21. Cannon, R.; Hensel, H.; Raber, T. Der Reckibach-Dolomit im Binntal, Schweiz: Mineralbestand und Neufunde. Lapis 2008, 33, 20. [Google Scholar]
  22. Kutolglu, A. Röntgenographische und thermische Untersuchungen im quasibinaren System PbS-As2S3. Neues Jahrb. Mineral. Mon. 1969, 1969, 68–72. [Google Scholar]
  23. Rösch, H.; Hellner, E. Hydrothermale Untersuchung am System PbS-As2S3. Naturwissenschaften 1959, 46, 72. [Google Scholar] [CrossRef]
  24. Bruker AXS. SAINT, Version 5.0; Bruker AXS, Inc.: Madison, WI, USA, 1998. [Google Scholar]
  25. Bruker AXS. SMART, Version 5.0; Bruker AXS, Inc.: Madison, WI, USA, 1998. [Google Scholar]
  26. Bruker AXS. SHELXTL, Version 5.1; Bruker AXS, Inc.: Madison, WI, USA, 1997. [Google Scholar]
  27. Otwinowski, Z.; Borek, D.; Majewski, W.; Minor, W. Multiparametric scaling of diffraction intensities. Acta Crystallogr. 2003, A59, 228–234. [Google Scholar] [CrossRef]
  28. Sheldrick, G.M. A short history of SHELX. Acta Crystallogr. 2008, A64, 112–122. [Google Scholar] [CrossRef] [PubMed]
  29. Balić Žunić, T.; Vicković, I. IVTON—Program for the calculation of geometrical aspects of crystal structures and some crystal chemical applications. J. Appl. Crystallogr. 1996, 29, 305–306. [Google Scholar] [CrossRef]
  30. Makovicky, E.; Balić Žunić, T. New measure of distortion for coordination polyhedra. Acta Crystallogr. 1998, B54, 766–773. [Google Scholar] [CrossRef]
  31. Topa, D.; Makovicky, E. Argentobaumhauerite: Name, chemistry, crystal structure, comparison with baumhauerite, and position in the Lengenbach mineralization sequence. Mineral. Mag. 2016, 80, 819–840. [Google Scholar] [CrossRef]
  32. Topa, D.; Graeser, S.; Makovicky, E.; Stanley, C. Argentoliveingite, IMA 2016-029. CNMNC Newsletter No. 32, August 2016, page 920. Mineral. Mag. 2016, 80, 915–922. [Google Scholar]
Figure 1. Representative backscattered electron images and corresponding reflected-light photographs (crossed polars) of homogeneous low-Tl (a) and high-Tl (b) rathite grains (rath3 and rath9, respectively). Both optical images show two domains.
Minerals 08 00466 g001
Figure 2. Representative backscattered electron images and corresponding reflected-light photographs (crossed polars) of two aggregates (a,b) showing mixed exsolution lamellae of the Tl-richest rathite (bright grey phase, rath9 in Table 1; 11.78 wt% Tl) and a possibly new, still Tl-richer species, “SR” (dark grey phase, rath10 in Table 1; 13.25 wt% Tl). Note that the small fragment in the (b’) optical image shows twin lamellae.
Minerals 08 00466 g002
Figure 3. Representative backscattered electron images and corresponding reflected-light photographs (crossed polars) of high-Sb rathite (white) intergrown with low-Sb bulk areas: (a) containing rath14 and rath15 from Lengenbach; (b) containg rath12 and rath13 from Reckibach.
Minerals 08 00466 g003
Figure 4. Substitutional variations in rathite from Lengenbach in the (As + Sb) − (Ag + Tl) − (Pb) sulphide ternary plot (at %). The grey dots show all 2700 spot analyses, while samples rath1 to rath9 are those also characterized by crystal-structure refinements. Most of the analyses belong to the rath3–rath5 interval (1.58 wt%–5.36 wt% Tl). Low-Tl (rath1, typical of Reckibach samples) and high-Tl (rath9 and rath10) are very rarely encountered compositions.
Minerals 08 00466 g004
Figure 5. Binary plots (ad) are based on apfu values of rathite and depict the correlations of (Ag + Tl) vs. Pb, (Ag + Tl) vs. (As + Sb), Tl vs. Ag, and Sb vs. As, respectively. Binary plots c and d clearly indicate the range of variations for Tl, Ag, and Sb.
Minerals 08 00466 g005
Figure 6. Crystal structures of (a, top) rath1 (Tl-poorest) and (b, bottom) rath9 (Tl-richest), in a projection along the a = 8.4 Å axis and including a comparison of their Me3, Me5, and M6 split and mixed sites. White circles represent sulphur sites, blue ones (Pb,Tl) sites, cyan As sites, green the single half-occupied Ag site, red the single partially occupied Sb site, and light blue the single partially occupied Pb site. The dark-green (a) and light-green (b) ribbons in rath1 and rath9 emphasize their different chemistry, high Pb and high As, respectively. The equivalent SnS-like layers L1 and L2 are indicated with red boxes in (a).
Minerals 08 00466 g006
Figure 7. Coordination polyhedra for the Pb1 and Pb2 sites (CN = 9). Sulphur sites S1, S2, and S6 are shared, and the Pb–S bond lengths for S5, S6, S7, and S8 are slightly affected by substitutions at the Me3, Me5, and Me6 sites.
Minerals 08 00466 g007
Figure 8. Pb–S bond-length variation for Pb1 (circles) and Pb2 (diamonds) sites in the structurally investigated rathite samples as a function of their thallium substitution.
Minerals 08 00466 g008
Figure 9. Comparison of the asymmetric (a) dufrénoysite and centrosymmetric (b1) rath1 (Tl-poorest) and (b2) rath9 (Tl-richest) N = 4 double-layer ribbons (three unit-cells along the a = 8.4 Å axis) and their opposing surfaces at the left and right, of the Sn-S like layers (L1 and L2) in the crystal structures of dufrénoysite and rathite. The short As–S bonds are orange colored, and the directions and lengths of the crankshaft chains are indicated by straight black lines. The symbols ┴ and || indicate the almost perpendicular and parallel directions of the crankshaft chains for L1 and L2. The unit-cell dimension along a is indicated as broken lines; site labels are also given. Color coding as in Figure 6.
Minerals 08 00466 g009
Figure 10. Hypothetical crystal structure of the very Tl-rich phase “SR” based on two chemically (one Pb-rich and one As-rich) and structurally (not related) different ribbons.
Minerals 08 00466 g010
Table 1. Comparative data for rathite and related sartorite homologues with N = 4 and Z = 1.
MineralRathitePhilrothiteBarikaiteCarducciiteDufrénoysiteVeenitePolloneite
FormulaAg2Pb9.5Tl1.5-As18SbS40Tl8As24S40 *Ag3Pb10-As11Sb8S40Ag2Pb12As10-Sb8S40Pb16As16S40Pb16Sb10As6-S40AgPb46As26-Sb23S120
Crystal systemmonocl.monocl.monocl.monocl.monocl.monocl.monocl.
Space groupP21/cP1121/aP21/c#P21/cP21P21P21
Cell params.
a (Å)8.496(1)11.768.538.4909(3)8.47(4)8.429(2)8.413(2)
b (Å)7.969(1)8.018.088.0227(3)25.74(4)26.069(5)25.901(5)
c (Å)25.122(3)24.8324.9525.3957(9)7.90(1)8.962(2)23.817(5)
β (o)100.704(2)132.84 (γ) $100.66100.382(2)90.35(12)117.447(2)90.01(3)
V3)1671.31715.91689.21701.61702.01747.65189.8
Ref. &1234567
* Simplified formula which neglects appreciable Pb and Ag contents; the empirical formula is (Tl0.789Pb0.198)Σ0.987(As2.662Sb0.159Ag0.142Cu0.004Hg0.002)Σ2.969S5.044 (Bindi et al. [15]). # Transformed from P21/n, a = 8.533(1), b = 8.075(1), c = 24.828(2) Å, β = 99.077(1)°. $ Unit-cell parameters permutated for comparison purposes. & 1: Berlepsch et al. [2]; 2: Bindi et al. [15]; 3: Topa et al. [14]; 4: Biagioni et al. [16]; 5: Ribar et al. [18]; 6: Topa and Makovicky [19]; 7: Topa et al. [17].
Table 2. Chemical-analytical data and derived chemical and structural parameters for the studied rathite samples (all from Lengenbach), ordered according to increasing Tl contents.
SampleNAAgTlPbAsSbSTotalchNchemAgsubstTlsubst
rath1 *63.35(06)0.16(12)47.24(14)21.76(12)3.89(16)23.55(07)99.95(09)–1.14.043.50.5
rath233.63(09)1.14(07)46.12(09)24.05(11)0.99(07)24.27(09)100.20(06)–2.14.147.93.6
rath3 *203.47(12)1.58(14)45.59(38)24.69(19)0.64(04)23.83(10)99.80(49)–0.24.043.45.1
rath4 *33.55(11)3.26(09)42.09(15)25.83(03)0.95(04)24.40(21)100.08(06)–0.74.044.010.6
rath5 *%114.13(06)5.36(07)36.61(30)27.31(15)1.94(09)24.48(07)99.83(21)2.33.947.817.6
rath6363.64(14)6.91(42)36.08(57)27.53(34)0.92(20)25.10(18)100.18(41)–1.84.045.121.6
rath7 *44.01(14)8.69(18)31.70(22)28.09(12)2.30(07)25.27(03)100.06(13)–0.64.047.927.2
rath843.92(11)9.86(43)29.24(68)28.37(31)3.54(07)24.73(24)99.66(14)1.83.944.831.9
rath9 *183.75(20)11.78(40)27.33(62)29.28(45)2.16(18)25.35(20)99.65(17)0.24.044.736.1
rath10 $213.97(13)13.25(45)23.30(84)30.08(67)3.50(29)25.35(25)99.45(39)1.73.945.141.9
* Crystal structure refined; % Data from Berlepsch et al. [2]; $ Rath10 (in the text partly designated as “SR”) is a preliminary name for a new, extremely Tl-rich rathite-group species that forms exsolution lamellae with very Tl-rich sample rath9 (for details see text). Notes: NA = Number of analyses; ch = Charge balance as (Σ(val+)−Σ(val−)); Nchem, Agsubst, and Tlsubst are described in the text. Empirical formulae, calculated on the basis of Σ(Me + S) = 72 apfu, are as follows: rath1: Ag1.70Tl0.04Pb12.47(As15.88Sb1.75)Σ17.63S40.17; rath2: Ag1.80Tl0.30Pb11.89(As17.15Sb0.44)Σ17.59S40.43; rath3: Ag1.73Tl0.42Pb11.84(As17.73Sb0.28)Σ18.01S40.00; rath4: Ag1.73Tl0.84Pb10.71(As18.18Sb0.41)Σ18.59S40.13; rath5: Ag2.01Tl1.37Pb9.25(As19.09Sb0.83)Σ19.92S40.00 (Table 2, crystal 2m in Berlepsch et al. [2]); rath5: Ag1.99Tl1.36Pb9.18(As18.94Sb0.83)Σ19.67S39.69 (Σ(Me + S) = 72 apfu); rath6: Ag1.74Tl1.74Pb8.96(As18.90Sb0.39)Σ19.29S40.27; rath7: Ag1.89Tl2.16Pb7.79(As19.08Sb0.96)Σ20.04S40.11; rath8: Ag1.85Tl2.45Pb7.18(As19.25Sb1.48)Σ20.73S39.79; rath9: Ag1.76Tl2.91Pb6.67(As19.77Sb0.90)Σ20.66S39.99; rath10 (“SR”): Ag1.84Tl3.24Pb5.62(As20.05Sb1.44)Σ21.49S39.81.
Table 3. Selected chemical-analytical data for Sb-enriched areas of some of the studied rathite samples, and derived chemical and structural parameters.
SampleCommentNAAgTlPbAsSbSTotalchNchemAgsubstTlsubst
rath11homogeneous grain *53.31(10)0.20(06)46.85(25)20.83(19)5.55(11)23.03(18)99.77(13)1.393.9841.090.69
rath12grain 1, matrix *33.36(14)0.09(05)46.92(27)22.17(09)3.90(05)23.19(05)99.63(22)1.683.9540.970.29
rath13grain 1, bright area *23.52(09)0.17(15)46.33(22)20.70(05)6.20(07)23.00(03)99.92(08)2.123.9842.900.59
rath14grain 2, matrix §23.58(18)6.00(14)37.38(05)26.87(05)1.20(05)24.87(05)99.90(14)–1.614.0044.6219.10
rath15grain 2, bright rim §23.63(16)3.00(03)41.30(05)20.59(06)7.71(05)23.85(05)100.08(07)–1.984.0447.409.73
* material from Reckibach deposit. § material from Lengenbach deposit. Notes: NA = Number of analyses; ch = Charge balance as (Σ(val+) − Σ(val−)); Nchem, Agsubst, and Tlsubst are described in the text. Empirical formula, calculated on the basis of Σ(Me + S) = 72 apfu, are as follows: rath11: Ag1.70Tl0.06Pb12.53(As15.40Sb2.52)Σ17.92S39.79; rath12: Ag1.71Tl0.02Pb12.46(As16.28Sb1.76)Σ18.04S39.77; rath13: Ag1.80Tl0.05Pb12.37(As15.28Sb2.82)Σ18.10S39.68; rath14: Ag1.72Tl1.52Pb9.36(As18.62Sb0.51)Σ19.13S40.26; rath15: Ag1.82Tl0.80Pb10.79(As14.88Sb3.43)Σ18.31S40.28.
Table 4. Crystal data and summary of parameters describing data collection and refinement for five rathite fragments with different Tl contents and Pb:As ratios (rath1, rath3, rath4, rath7, and rath9).
Crystal DataRath1Rath3Rath4Rath7Rath9
Chemical formulaAg1.70Tl0.04Pb12.47-
As15.88Sb1.75S40.17
Ag1.73Tl0.42Pb11.84-
As17.73Sb0.38S40.00
Ag1.73Tl0.84Pb10.71-
As18.18Sb0.41S40.13
Ag1.89Tl2.16Pb7.79-
As19.08Sb0.96S40.11
Ag1.76Tl2.91Pb6.67-
As19.77Sb0.90S39.99
Formula weight5452.235370.405271.655157.05039.67
Crystal systemmonoclinicmonoclinicmonoclinicmonoclinicmonoclinic
Space groupP21/c (no. 14)P21/c (no. 14)P21/c (no. 14)P21/c (no. 14)P21/c (no. 14)
Dx (g·cm3)5.4465.3735.2865.1534.986
No. of reflections for cell parameters37983715367135149982
a (Å)8.4710(17)8.4811(3)8.4812(17)8.4864(17)8.5210(17)
b (Å)7.9263(16)7.9184(3)7.9221(16)7.9610(16)8.0050(16)
c (Å)25.186(5)25.1449(9)25.080(5)25.031(5)25.031(5)
β (o)100.58(3)100.635(2)100.66(3)100.66(3)100.56(3)
V3)1662.4(6)1659.6(1)1656.0(6)1661.9(6)1678.4(6)
Z11111
µ (mm1)41.7541.5840.1036.9535.41
Data collection
No. of measured refls.13,60963,03113,41811,7049363
No. of independent refls.23386010232662264851
No. of observed refls.19255074193244723175
Criterion for observed refls.I > 2σ(I)
Rint (%), Rsigma(%)9.44, 5.062.52, 4.925.88, 10.755.76, 2.974.67, 3.69
θmax (o)23.2932.6423.2834.2430.06
Range of h, k, l–9 ≤ h ≤ 9, −8 ≤ k ≤ 8, –27 ≤ l ≤ 27–12 ≤ h ≤ 12, –11 ≤ k ≤ 11, –38 ≤ l ≤ 38–9 ≤ h ≤ 9, –8 ≤ k ≤ 8, –27 ≤ l ≤ 27–11 ≤ h ≤ 13, –12 ≤ k ≤ 11, –28 ≤ l ≤ 37–11 ≤ h ≤ 11, –11 ≤ k ≤ 11, –35 ≤ l ≤ 35
Refinement
Refinement on Fo2
R [Fo > 4σ(Fo)]0.03050.04640.03600.05240.0480
wR (Fo2)0.03800.05600.04340.07950.0897
S (GooF)0.9321.0900.9581.0941.120
No. of parameters refined173170170193189
Weighting scheme (a, b)0.0272, 00.0152, 48.460.0363, 00, 25.730.032, 12.15
w = 1/[σ2(Fo2) + (aP)2 + bP]where P = (Fo2 + 2Fc2)/3
Extinction0.00012(3)0.000097(17)0.00010(4)none0.00004(3)
(Δ/σ)max0.0000.0000.0000.0010.000
Δρmax (e/Å3)1.20 (0.31 Å from As5)6.13 (0.74 Å from Sb3)1.78 (1.03 Å from As6)4.58 (0.71 Å from As2)3.43 (0.67 Å from Sb3)
Δρmin (e/Å3)–1.82 (0.97 Å from Pb2)–7.22 (0.76 Å from Pb2)–2.00 (0.92 Å from Pb2)–3.92 (0.60 Å from As2)–2.79 (0.74 Å from As3)
Source of at. scatt. factorsInternational Tables for X-ray Crystallography, Vol. C (1992) (Tables 4.2.6.8 and 6.1.1.4)
Table 5. Unit-cell dimensions of the five studied rathite samples compared with that of the Berlepsch et al. [2] sample (rath5). Corresponding Tl, Ag, and Sb wt% values are also tabulated to show their influence.
SampleabcbVTlAgSb
rath18.471(2)7.926(2)25.186(5)100.58(3)1662.4(6)0.163.353.89
rath38.481(3)7.918(3)25.145(1)100.64(2)1659.6(1)1.583.470.64
rath48.481(2)7.922(2)25.080(5)100.66(3)1656.0(6)3.263.550.95
rath58.496(1)7.969(1)25.122(3)100.70(2)1671.3(2)5.364.131.94
rath78.486(2)7.961(2)25.031(5)100.66(3)1661.9(6)8.694.012.30
rath98.521(2)8.005(2)25.031(5)100.56(3)1678.4(6)11.783.752.16
Table 6. Fractional atomic coordinates and displacement parameters (in Å2) for sample rath1.
SiteAtomSofx/ay/bz/cUeq
Pb1Pb10.47749(5)0.74919(5)0.20403(2)0.03175(17)
Pb2Pb10.97430(6)0.74928(7)0.20185(2)0.0491(2)
As1As10.29630(12)0.84357(13)0.34027(4)0.0207(3)
As2As10.25257(13)0.32458(13)0.14905(4)0.0234(3)
Me3aAs0.532(9)0.668(2)0.6623(18)0.0397(7)0.0309(14)
Me3bSb0.468(9)0.6913(16)0.6296(14)0.0465(5)0.0309(14)
As4As10.13947(12)0.66113(13)0.06090(4)0.0206(3)
Me5aAs0.526(4)0.4213(6)0.0339(6)0.05012(16)0.0335(7)
Me5bAg0.474(4)0.4145(4)0.0204(4)0.07458(14)0.0335(7)
Me6aPb0.961(3)0.90673(5)0.08741(6)0.07248(2)0.02971(19)
Me6bAs0.039(3)0.90673(5)0.08741(6)0.07248(2)0.02971(19)
S1S10.2600(3)0.0006(3)0.26462(10)0.0215(6)
S2S10.2526(3)0.4733(3)0.22448(10)0.0209(6)
S3S10.5040(3)0.6731(3)0.32334(10)0.0205(6)
S4S10.9085(3)0.1668(3)0.18240(10)0.0216(6)
S5S10.6907(3)0.8389(3)0.11438(10)0.0231(6)
S6S10.1725(3)0.8759(3)0.12011(10)0.0231(6)
S7S10.3698(3)0.5139(3)0.09989(10)0.0223(6)
S8S10.9592(3)0.5062(3)0.09564(11)0.0265(7)
S9S10.5891(3)0.1997(4)0.01083(12)0.0341(7)
S10S10.1745(3)0.1851(4)0.00804(11)0.0273(7)
Table 7. Fractional atomic coordinates and displacement parameters (in Å2) for sample rath9.
SiteAtomSofx/ay/bz/cUeq
Pb1Pb,Tl10.47452(5)0.76513(5)0.20656(2)0.04385(14)
Pb2Pb,Tl10.98429(5)0.74839(6)0.20956(2)0.05941(16)
As1As10.30436(11)0.86055(12)0.34475(4)0.0341(2)
As2As10.24105(12)0.34506(12)0.14487(4)0.0378(2)
Me3aAs0.869(9)0.6991(3)0.6548(2)0.03806(7)0.0457(5)
Me3bSb0.131(9)0.657(2)0.629(2)0.0320(5)0.074(5)
As4As10.13572(11)0.68203(13)0.05613(4)0.0336(2)
Me5aAs0.57(1)0.4240(3)0.0192(3)0.0522(3)0.0398(8)
Me5bAg0.43(1)0.4131(4)0.0106(4)0.0777(2)0.0502(11)
Me6aPb0.423(4)0.8988(2)0.0775(3)0.06918(8)0.0412(5)
Me6bAs0.577(4)0.8724(5)0.0359(6)0.0815(2)0.0560(11)
S1S10.2536(3)0.9909(3)0.26445(11)0.0393(5)
S2S10.2431(3)0.4834(3)0.22240(9)0.0336(5)
S3S10.5114(3)0.6894(3)0.33042(10)0.0351(5)
S4S10.8936(3)0.1702(1)0.17229(10)0.0394(6)
S5S10.7023(2)0.8341(3)0.10894(9)0.0308(5)
S6S10.1546(3)0.8842(3)0.12034(10)0.0429(6)
S7S10.3577(3)0.5313(3)0.09452(10)0.0357(5)
S8S10.9541(3)0.5100(3)0.08273(14)0.0534(8)
S9S10.5906(3)0.1934(3)0.01964(12)0.0463(6)
S10S10.1813(3)0.1780(3)0.01344(9)0.0353(5)
Table 8. Comparison of site occupancies and measured Tl contents of the studied rathite samples.
SiteAtomRath1Rath3Rath4Rath5 *Rath7Rath9
Pb1Pb(Tl)111111
Pb2Pb(Tl)111111
As1As111111
As2As111111
Me3bAs0.532(9)0.899(10)0.922(10)0.735(9)0.821(7)0.869(9)
Me3aSb0.468(9)0.101(10)0.078(10)0.265(9)0.179(7)0.131(9)
As4As111111
Me5bAs0.526(4)0.546(2)0.540(3)0.526(10)0.531(10)0.57(1)
Me5aAg0.474(4)0.454(2)0.460(3)0.474(10)0.469(10)0.43(1)
Me6aPb0.961(3)0.897(3)0.866(4)0.739(4)0.594(4)0.423(4)
Me6bAs0.039(3)0.103(3)0.134(4)0.261(4)0.406(4)0.577(4)
Tl wt%0.16(12)1.58(14)3.26(09)5.36(07)8.69(18)11.78(40)
* Berlepsch et al. [2].
Table 9. Bond lengths in sample rath1 (Tl-poorest sample, with 0.16 wt% Tl).
Pb1–Pb2–As1–As2–As4–
S12.968(3)S42.975(3)S42.222(3)S22.236(3)S62.247(3)
S23.006(3)S13.026(3)S12.249(3)S72.285(3)S82.258(3)
S33.032(3)S53.031(3)S32.319(3)S32.377(3)S72.331(3)
S23.180(3)S63.055(3)S83.199(3)S82.972(3)S103.143(3)
S63.186(3)S23.190(3)S73.245(3)S43.415(3)S93.360(3)
S73.211(3)S83.280(3)
S53.219(3)S13.304(3)
S13.275(3)S43.376(3)
S33.440(3)S23.406(3)
As3–Sb3–As5–Ag5–Pb6–
S102.299(19)S52.383(14)S92.290(5)S102.720(4)S42.836(3)
S52.324(19)S102.430(13)S92.397(5)S92.766(5)S62.885(3)
S92.557(13)S82.571(11)S102.473(5)S92.767(5)S102.956(3)
S82.887(13)S92.880(10)S52.977(5)S52.773(4)S92.985(3)
S73.38(2)S73.378(14)S63.238(5)S62.774(4)S53.009(3)
S93.589(13) S32.811(4)S103.119(3)
S83.385(3)
Table 10. Bond lengths in sample rath9 (Tl-richest sample, with 11.78 wt% Tl).
Pb1–Pb2–As1–As2–As4–
S23.070(3)S43.016(3)S12.236(3)S22.231(2)S82.262(3)
S33.118(3)S23.035(2)S42.255(3)S72.293(3)S62.266(3)
S13.148(3)S13.045(2)S32.313(3)S32.430(3)S72.301(3)
S13.177(3)S63.076(3)S73.296(3)S82.958(3)S103.140(3)
S23.230(3)S13.127(3)S83.323(3)S43.456(3)S93.413(3)
S63.293(3)S53.221(2)
S73.367(2)S23.376(2)
S53.433(2)S43.550(3)
S33.528(3)S83.671(3)
As3–Sb3–As5–Ag5–Pb6–As6–
S102.230(3)S102.532(16)S92.248(5)S102.668(5)S42.694(3)S52.354(5)
S52.279(4)S52.562(16)S92.464(6)S32.685(5)S62.786(3)S42.490(6)
S82.535(4)S92.716(13)S102.470(4)S92.710(6)S92.847(3)S62.710(6)
S92.890(4)S82.758(13)S52.932(4)S62.807(6)S52.863(3)S92.897(6)
S73.597(3)S73.303(14)S33.192(7)S52.824(4)S102.900(3)S102.898(6)
S73.367(13) S92.928(5)S103.102(3)
S83.503(4)
Table 11. Polyhedron characteristics for atoms in sample rath1.
SiteAtomOcc.12345678910
Pb1Pb193.1630.0170.1940.944132.52363.7333.1680.1481.81
Pb2Pb193.1770.0170.1190.863134.26664.5783.1830.1661.77
As1As152.7800.3010.6730.99590.00213.0062.6470.5273.14
As2As152.8140.4130.6660.96193.38011.3402.6570.5172.92
Me3aAs0.53252.9130.4630.6600.939103.54911.5022.6900.4552.43
Me3bSb0.46862.9170.1650.5900.945104.01727.6442.8720.5093.41
As4As152.8260.3370.6830.97794.56412.9542.6680.5403.02
Me5aAs0.52652.7610.2770.5530.98588.12013.1812.6750.4112.39
Me5bAg0.47462.7690.0590.0380.98288.95126.6572.7680.0291.13
Me6Pb,AsPb0.96 As0.0473.0390.0840.2010.879117.61340.7833.0250.1832.12
Notes: 1: coordination number, 2: radius rs in Å of a circumscribed sphere least-squares fitted to the coordination polyhedron, 3: volume distortion υ = [V(ideal polyhedron) − V(real polyhedron)]/V(ideal polyhedron); the ideal polyhedron has the same number of ligands, 4: ‘volume-based’ eccentricity ECCV = 1 − [(rs − Δ)/rs]3; Δ is the distance between the center of the sphere and the central atom in the polyhedron, 5: ‘volume-based’ sphericity SPHV = 1 − 3σrrs; σr is the standard deviation of the radius rs, 6: volume in Å3 of the circumscribed sphere, 7: volume in Å3 of coordination polyhedron, 8: average bond distance, 9: standard deviation of the bond distance, 10: bond-valence sum. All values were calculated with IVTON (Balić Žunić and Vicković [29]; Makovicky and Balić Žunić [30]).
Table 12. Polyhedron characteristics for atoms in sample rath9 (for explanation of header numbers see Table 11).
SiteAtomOcc.12345678910
Pb1(Pb,Tl)1193.2630.0200.2020.950145.52269.7813.2630.1541.41
Pb2(Pb,Tl)2193.2270.0340.2120.818140.75566.5323.2350.2431.66
As1As1152.8300.3010.6920.99694.9513.7142.6840.5723.07
As2As2152.8200.3700.6660.95493.92512.2272.6740.5232.82
Me3aAs30.8752.9740.5060.7260.899110.20511.2672.7040.5592.72
Me3bSb30.1363.0350.2580.5440.904117.15327.6682.8730.3692.65
As4As4152.8240.2890.6860.97594.32713.8692.6760.5573.02
Me5aAs50.5752.7760.3250.5620.96689.65412.5102.6610.3872.42
Me5bAg50.4362.7760.0650.1740.97089.58526.6542.7700.1001.16
Me6aPb60.42372.9800.1090.3040.825110.81637.3622.9560.2712.77
Me6bAs60.57752.7940.3460.4510.98691.40212.3652.6700.2431.96
Table 13. Comparison of occcupancies and polyhedron characteristics of the Pb1 and Pb2 sites (CN = 9) in the studied rathite samples.
SampleTl (wt%)SiteAtom123456
rath10.16Pb1(Pb,Tl)13.163132.52363.7333.1680.151.81
rath31.58Pb1(Pb,Tl)13.179134.52264.6683.1830.151.75
rath43.26Pb1(Pb,Tl)13.178134.49364.6463.1830.151.75
rath55.36Pb1(Pb,Tl)13.211138.71566.6103.2140.151.61
rath78.69Pb1(Pb,Tl)13.225140.46167.3963.2260.161.56
rath911.78Pb1(Pb,Tl)13.262145.45869.7463.2620.161.41
rath10.16Pb2(Pb,Tl)23.177134.26664.5783.1830.171.77
rath31.58Pb2(Pb,Tl)23.182134.91664.7473.1880.171.76
rath43.26Pb2(Pb,Tl)23.182135.01564.7703.1880.171.76
rath55.36Pb2(Pb,Tl)23.198136.96065.3923.2030.191.71
rath78.69Pb2(Pb,Tl)23.204137.78665.5173.2110.211.71
rath911.78Pb2(Pb,Tl)23.227140.75566.5323.2350.241.66
Notes: 1: radius rs in Å of a circumscribed sphere least-squares fitted to the coordination polyhedron, 2: volume in Å3 of the circumscribed sphere, 3: volume in Å3 of the coordination polyhedron, 4: average bond distance, 5: standard deviation for bond distance, 6: bond-valence sum. All values were calculated with IVTON (Balić Žunić and Vicković [29]; Makovicky and Balić Žunić [30]).

