Article

Integrated 3D Geological Modeling to Gain Insight in the Effects of Hydrothermal Alteration on Post-Ore Deformation Style and Strain Localization in the Flin Flon Volcanogenic Massive Sulfide Ore System

1
Geological Survey of Canada, 601 Booth Street, Ottawa, ON K1A 0E8, Canada
2
Department of Earth and Environmental Sciences, University of Waterloo, 200 University Avenue West, Waterloo, ON N2l 3G1, Canada
*
Author to whom correspondence should be addressed.
Minerals 2018, 8(1), 3; https://doi.org/10.3390/min8010003
Submission received: 25 September 2017 / Revised: 12 December 2017 / Accepted: 19 December 2017 / Published: 25 December 2017
(This article belongs to the Special Issue Geological Modelling)

Abstract

:
3D geological modeling of lithogeochemical and geological data provides insight into the role of the sulfide ore horizon and associated footwall hydrothermal alteration in localizing shear strain in the Flin Flon volcanogenic massive sulfide deposits, Canada, as deformation evolved from brittle-ductile to ductile regimes during collisional stages of the 1.9–1.8 Ga Trans-Hudson orogeny. 3D spatial characterization of hydrothermal alteration based on the Ishikawa index (AI) and normative corundum percentages outline sericite + chlorite-rich high strain zones, consisting of Al-enriched and Na-depleted felsic and mafic volcanic rocks in the footwall of the sulfide ore horizon. The hydrothermal vent complex, from which these sheared alteration zones originated, was stacked together with the ore horizon by W-vergent thrust faults during an early collisional deformation regime, imbricating molasse-type clastic sediments with the ore-hosting volcanic and volcaniclastic rocks of the Flin Flon arc assemblage. Chlorite-rich planar zones marked by high values of the Carbonate–chlorite–pyrite index (CCPI) are laterally more extensive and outline a later system of ductile shear zones, in which phyllosilicates, quartz and chalcopyrite in stringer zones localized shear strain and enhanced transposition of the hydrothermal vent stockwork. The contrasting deformation styles of these two thrusting events and their localization within the ore horizon and hydrothermal vent stockwork have important implications for vectoring towards undiscovered ore in this mature mining camp that are possibly also relevant to other strongly deformed VMS ore systems.

1. Introduction

The identification, classification and zoning of hydrothermally-altered rocks play a prominent role in vectoring towards volcanogenic massive sulfide (VMS) deposits. Over several decades, lithogeochemical methods were developed for the exploration of altered host rocks providing evidence for hydrothermal fluid circulation associated with the formation of VMS deposits [1,2,3,4]. Although hydrothermal alteration zones of VMS deposits may vary widely in scale, geometry and prevalent alteration mineral assemblages, they typically share characteristic geochemical zoning patterns, particularly in proximal upflow zones in the footwall of the deposit [1]. In VMS deposits metamorphosed to grades below lower amphibolite facies, these upflow zones are identified by intensely chloritized feeder zones with local mineralized and silicified quartz-sulfide stringers that are enveloped by broader zones of aluminous phyllosilicates, including sericite, pyrophyllite, and phengite [2,3]. This zoning in hydrothermal alteration minerals results predominantly from variations in the development of two chained chemical reactions during hydrothermal fluid flow that involve: (1) the breakdown of sodium-plagioclase and volcanic glass and their replacement by aluminous phyllosilicates and (2) the replacement of aluminous phyllosilicates by chlorite in zones proximal to the feeder stockwork and footwall of the VMS deposits due to the ingress of seawater [4]. Many alteration indices for these sericite-producing (Na depleting) and chlorite-by-sericite-replacement (Mg–Fe gain–K depletion) reactions, have been proposed [4,5,6,7], while their effectiveness as proxies for mapping the intensity of hydrothermal alteration has been convincingly demonstrated in many mining districts [4,8,9]. In addition to these phyllosilicate alteration assemblages, carbonate is also a common constituent of altered felsic and mafic volcanic rocks, particularly in the immediate footwall and hanging wall of VMS ore zones [4].
From the perspective of ore vectoring, identifying hydrothermal alteration zoning and interpreting their relative proximity to associated sulfide ore can be difficult, because most Precambrian and Paleozoic VMS ore systems are affected by a complex history of polyphase tectonic deformation [10,11,12]. The simple model-derived zonal arrangement of alteration mineral assemblages is invariably modified and obliterated by accretionary and collisional tectonic processes and associated metamorphism. Moreover, due to the relatively high ductility of sulfide ore minerals (e.g., phyrrhotite, chalcopyrite and sphalerite) and phyllosilicates in altered volcanic host rocks, shear zones tend to be preferentially localized in the ore and footwall hydrothermal alteration zones [13]. The heterogeneous distribution of high finite strains accommodated within these incompetent zones can deform the VMS ore system to the extent that the ore horizon is dismembered into subparallel shear lenses, which become completely detached from the once discordant hydrothermal feeder system [14]. Hence, an in depth 3D understanding of the spatial relationships between the ore horizon, the associated footwall hydrothermal alteration and geological structure is important to gain insight into how VMS deposits were modified by tectonic processes. This understanding is highly relevant to exploration, as it accounts for the tectonic modification of the ore system in implementing vectoring methods, which may lead to the improved identification of drill targets.
In this paper, we aim to unravel these complex spatial relationships by integrating 3D models of sulfide ore lenses, hydrothermal alteration zones and principal geological structures of the Paleoproterozoic Flin Flon VMS ore system, Manitoba, Canada. This VMS ore system offers an ideal opportunity for such a study, because its geological structure has been documented in detail by underground [15,16,17] and surface mapping [16,18] providing, in combination with seismic data [19] and a systematically-structured drillhole database [20], a wealth of constraints for integrated 3D modeling.

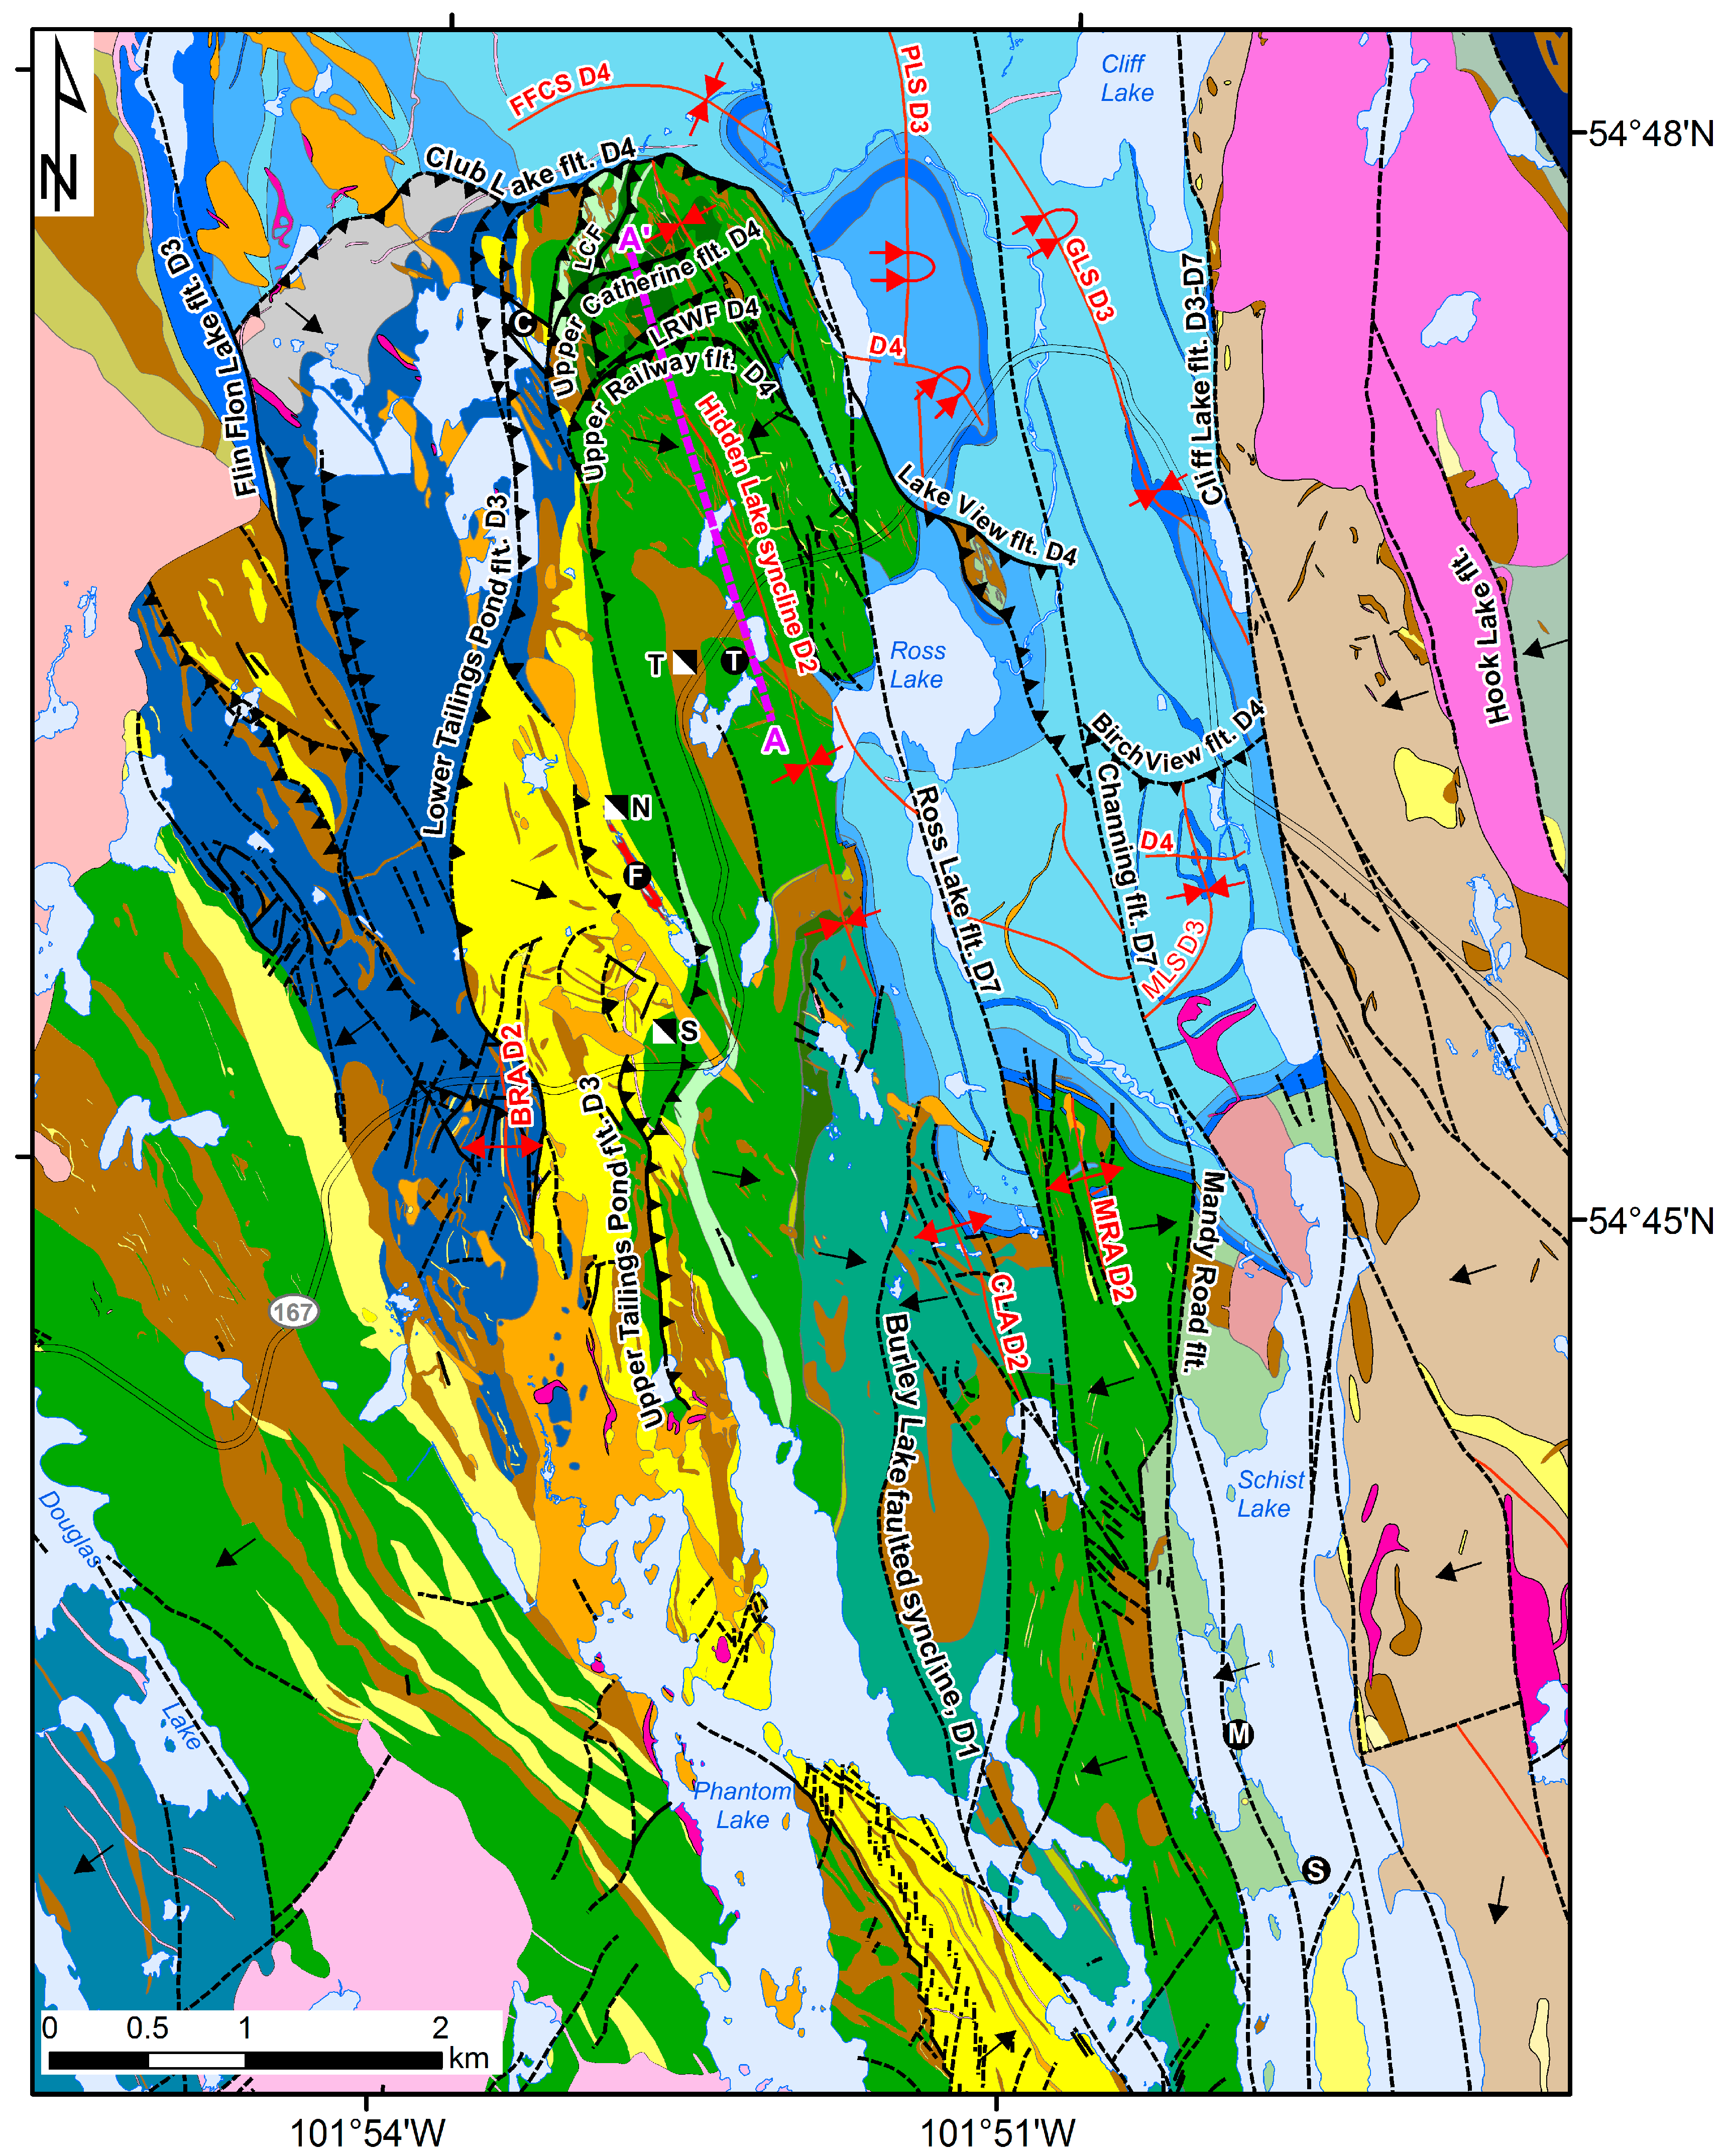
2. Geological Setting

The Paleoproterozoic Flin Flon greenstone belt comprises a collage of 1.92–1.88 Ga juvenile oceanic terranes that accreted between 1.87 Ga and 1.80 Ga, during convergence of the Archean Hearne, Sask and Superior cratons (Figure 1, inset) and subsequent collisional stages of the Trans-Hudson orogeny, which resulted in polyphase deformation and regional metamorphism [21]. The Flin Flon mining camp is located in the central part of the Amisk collage (Figure 1), a 70 km-wide belt of basalt-dominated volcanic, volcaniclastic, synvolcanic intrusive and subordinate felsic volcanic rocks assigned to regional fault-bounded juvenile arc, ocean floor and ocean plateau tectonostratigraphic assemblages [22,23]. These assemblages were stitched by 1.87–1.84 Ga successor arc plutons and are unconformably overlain by the 1.84–1.83 Ga Missi Group, a sequence of clastic metasedimentary rocks of fluvial and alluvial origin [24]. Mining in the Flin Flon camp has, since the 1920’s, been centered on the FF Main, 777 and Callinan sulfide ore zones that are hosted in coherent rhyolite and felsic volcaniclastic lithofacies of the “mine horizon” (upper level of the Millrock member), which overlies a thick sequence of mafic volcanic flows, tuff breccia and plagioclase-crystal fragmental tuff of the Blue Lagoon member [18] (Figure 2). These gold-rich massive sulfide deposits, with average grades of 4.4% Zn, 2.2% Cu, 2.2 g/t Au and 32 g/t Ag [25,26], have distinct sulfide mineral assemblages, dominated by pyrrhotite, chalcopyrite, magnetite, and pyrite with minor cubanite, arsenopyrite, tetrahedrite and galena [27]. The ore-hosting lithofacies are inferred to have been deposited at the margin of an extensional basin during the waning stages of an episode of submarine mafic volcanism, before it was buried by basalt flows of the Hidden formation and intruded by synvolcanic sills and dykes during the next episode of voluminous mafic volcanism [28,29]. The Hidden formation is in turn overlain by basalt flows and inter-flow volcaniclastic sediments of the Louis formation, which records a third period of voluminous mafic volcanism [30,31]. These rocks, together with mafic and felsic volcanic and volcaniclastic rocks in adjacent fault blocks (collectively defining the Flin Flon arc assemblage) [18], (Figure 2) were intruded by early successor arc plutons and shortened by D1–D2 folding and thrust faulting prior to a period of orogenic uplift. After emergence above sea level, a regolith developed on top of the deformed volcanic basement on which molasse deposits of the Missi Group were unconformably deposited [18,24] (Figure 2). The Flin Flon arc assemblage and Missi Group were intruded by the 1.84 Ga Boundary and Phantom Lake intrusive suits [18], thrust-imbricated and folded in roughly orthogonal directions (D3–D4) during ensuing collisional orogenic events, reaching upper greenschist to lower amphibolite facies metamorphic conditions during D4 [16,17]. This volcanic-basement-involved fold and thrust belt was in turn overprinted by two phases of cleavage formation (D5–D6) and post-metamorphic faulting (D7) [16]. A SE–NW directed trend in metamorphic grade across the Flin Flon mine camp spans the prehnite-pumpellyte in the SE to lower amphibolite facies in the NW [24,32].
Evidence of hydrothermal alteration at the surface and in outcrops of the footwall of the VMS ore zone is rare [31], but where encountered, is typical of discordant hydrothermal alteration in proximal vents to the VMS ore zones. These rarely-exposed footwall alteration types include: intensely epidotized pillow basalt, local zones of chloritization and sericitization in volcanic and volcaniclastic lithofacies and gossans with chlorite and pyrite-filled fractures [24]. Contrary to their sporadic exposure, hydrothermally-altered rocks are widespread in mine workings, where chlorite, sericite + biotite rich alteration zones in the proximal footwall of the VMS ore zone are intimately associated with the splays of D3 and D4 shear zones. These “chlorite schists” invariably display high-strain fabrics, which in many localities would be more accurately labelled chlorite phyllonite (on the basis of genetic fault rock terminology), considering that these rocks display asymmetric monoclinic fabric elements, such as σ-type quartz porphyroclasts and extensional crenulation (S–C′) fabrics. Although the alteration zones have been strongly transposed in subparallel orientation to the ore zone, discordant relationships between chlorite-sericite + magnetite alteration and volcanic strata have been recorded locally [15].
In drill core, mafic and felsic volcanic and volcaniclastic lithofacies of the Millrock member display a variable intensity of hydrothermal alteration with mineral assemblages that in decreasing order of abundance contain chlorite, sericite, carbonate, biotite, stilpnomelane, talc, magnetite and garnet. Coherent rhyolite lithofacies varies from practically-unaltered quartz and quartz + feldspar phyric rhyolite, to strongly sericitized and silicified rhyolite with rare garnet to locally strongly chloritized rhyolite. Pyrite, chalcopyrite and pyrrhotite (either disseminated or in stringers) are common but preferentially associated with intensely-altered rhyolite. Mafic volcanic lithofacies (basalt to andesite) is variably chloritized and locally exhibit, epidotization, patchy carbonate replacement, sulfide stringer, small biotite (<3 mm) and magnetite (<7 mm) porphyroblasts. Basalt tuff breccia is commonly chloritized with variable degrees of intensity and contains biotite porphyroblasts and centimeter-wide magnetite-rich intervals. Plagioclase crystal fragmental tuff and felsic rhyolite breccia lithofacies of the Blue Lagoon members are locally silicified and chloritized. Generally, the abundance and size of biotite (<3 mm), actinolite and garnet porphyroblasts (<5 mm) increase with the depth with metamorphic grade. The intensity of chloritization, on the other hand, decreases with structural depth, showing a transition to a more distal alteration facies with sericite as the dominant alteration mineral. Rhyolite and mafic volcanic rocks are commonly fractured and filled with late quartz–carbonate or quartz–carbonate–epidote veins, crosscutting the earlier alteration assemblages in the host rocks. This vein system also overprints the synvolcanic hanging wall alteration in the overlying Hidden and Louis formations [31].

3. Materials and Methods

3D geological modeling was aimed at gaining insight into the spatial relationships between the ore, hydrothermal alteration and shear zones, which involved the following three steps:
  • Multivariate interpretation of alteration indices computed from drill core and outcrop major oxide analyses to characterize the type and intensity of hydrothermal alteration.
  • Joint registration and visualization of the alteration indices with 3D models of sulfide ore lenses, lithostratigraphic horizons and shear zones, as well as their 2D visualization on vertical cross sections, to facilitate interpretation of alterations and ore zones in their structural geologic context.
  • Spatial interpolation of the alteration indices on a 3D curvilinear-faulted grid to further enhance insight into the spatial association between geological structure and the hydrothermal alteration zones and to better assess their structural continuity.
Step 1. Lithogeochemical characterization of hydrothermal alteration was based on the alteration box plot [4] and corundum percentages derived from normative mineral estimation procedures [34]. The alteration box plot is a well-known method to recognize hydrothermal alteration trends in multivariate space, in which the Carbonate–chlorite–pyrite index (CCPI) is plotted against the Ishikawa index (AI) [5]. It provides a rapid and simple method for identifying common trends, serving as proxies for alkali alteration and feldspar destruction due to hydrothermal alteration of felsic and mafic volcanic rocks [4]. The trends of altered rocks were plotted together with a subset, representing least-altered samples, which can be a priori defined by a number of criteria [35]. In our analysis, the selection of this subset was based on:
  • A groundmass and phenocryst mineralogy in coherent volcanic rocks that is in agreement with the rock class assigned to the sample.
  • Lack of visible texture indicative of hydrothermal alteration.
  • No anomalously high contents of sericite, chlorite, biotite, quartz.
  • Agreement between the classification from the Barth-Niggli normative mineral estimation and the rock class label assigned to the sample (i.e., basalt, andesite for mafic volcanic rocks and rhyolite, dacite for felsic volcanic rocks).
To validate the results obtained from the alteration box plot with a proxy that is less sensitive to the lithologic composition of precursor rocks and metamorphic overprint, the normative corundum mineral percentage was computed using Barth-Niggli normative mineral estimation procedures [36]. These normative mineral estimation procedures were developed for mapping hydrothermal alteration for greenschist facies metavolcanic rocks from the southern Abitibi greenstone terrane in Quebec [37,38]. The normative calculations are based on a sequential estimate of minerals where the order of calculation is defined by a specific paragenesis. Other attempts to estimate normative minerals use linear programming techniques where the estimate of a priori mineral abundances is carried out by the minimization of least squares [39,40,41,42]. This study follows the approach previously taken by [43,44,45], which demonstrated that calculations of normative minerals based on the Barth-Niggli normative procedure provided useful information for the identification of alteration and lithotectonic provenance. Within typical felsic to mafic volcanic rocks of the Flin Flon formation, normative corundum is calculated only when there is an excess of Al over Ca + Na + K due to alkali alteration and feldspar destruction. Due to diagenesis and varying degrees of metamorphism, there is a gain or loss of alkali elements (Na, K, Ca), lattice water (H2O+) and/or CO2. Thus, the observed mineralogy in the volcanic rocks is different from normative mineralogy. This is reflected in the fact that the normative corundum is a common constituent of volcanic rocks that have undergone hydrothermal alteration and low-grade regional metamorphism. The breakdown of feldspars and the subsequent formation of sericite, zoisite, paragonite and epidote results in a relative depletion of Ca, Na and K and a corresponding excess of Al. Classical normative mineral procedures do not compensate for the loss of the alkali elements and therefore, the excess Al is computed as a normative corundum. An advantage of using the corundum normative mineral percentage over the alteration boxplot (the CCPI in particular) is that the index is independent of the lithologic composition of the volcanic host rock. Hence, it can be used to spatially characterize hydrothermal alteration, without the need to stratify the analysis over differences in host rock composition.
The AI, CCPI alteration indices and normative corundum percentages were computed from 1551 major element analyses of volcanic and volcaniclastic rocks sampled from drill core and outcrops of the footwall of the sulfide ore zones (Table S1). These samples were collected from 1982 to 2010 by geologists of Hudbay Minerals Inc., Laurentia University and the Manitoba-, Saskatchewan- and Canadian Geological Surveys, the latter of which include the first and second authors. Major elements of the numerous batches of rock samples were determined using X-ray fluorescence (XRF); (n = 1029) or metaborate-tetraborate fusion followed by inductively coupled plasma atomic emission spectroscopy (ICP-AES); (n = 522). Lower detection limits reported for the major oxides for ICP and XRF analyses were 0.01%. Standards and blanks were analyzed for each batch of samples, but not monitored by the authors. A total of 115 duplicate samples were available to estimate precision of the AI, CCPI and normative corundum percentage. Root mean square errors (RMSE) and biases (for ICP-XRF duplicates) of the relative differences Di between duplicates of the alteration proxies were computed using the equation presented in [46]:
RMSE = 1 n i = 1 n D i 2 × 100 %   Bias = 1 n i = 1 n D i × 100 %   D i = ( C i 1 C i 2 ) / 2 C ¯ i
where D i is the relative difference of the routine, C i 1 and duplicate C i 2 concentrations and C ¯ i is the mean for the ith duplicate [46]. The RMSEs of AI, CCPI and normative corundum percent computed from altered samples are within the 1–12% range. The RMSEs for all the samples, which include the subset of least altered samples, however, were much higher, attaining values up to 39% for normative corundum percent (Table 1).
Step 2. The drill core AI, CCPI indices and normative corundum percentage computed in Step 1, were integrated with the elements of the previously published 3D geological model of the Flin Flon mine camp [17] to interpret the 3D spatial distribution of alteration proxies in context of the subsurface geological structure. This integrated model was compiled in an Adobe Acrobat® 3D. A PDF supplementary file (Figure S1) provides interactive 3D visualization and includes wireframe surfaces of the sulfide ore lenses, lithostratigraphic horizons and the principle D3–D4 and D7 shear zones, fault structures and a generalized version of the 1:10,000 scale geological map [18]. In addition, the 3D model contains a set of lithostratigraphic reference holes that were used as subsurface constraints for the modeling of the lithostratigraphic horizons and structures. Point datasets of drillhole observations, including occurrences of a mineralized argillite marker horizon in the Millrock member, chlorite and sericite alteration minerals, provided additional constraints for interpreting the deformed VMS ore system. Constraints for modeling the D3 and D4 shear zones included high spatial-resolution mine surveys, picks (i.e., reflectors) from 2D and 3D seismic data (not included in Figure S1) and surface traces extracted from the 1:10,000 scale geological map [18]. Strike-dip measurements of shear zone fabrics from outcrops [16] provided secondary constraints to model their geometry and helped link the subsurface constraints of the shear zones with their corresponding 2D traces at the surface [16,18]. The reader is referred to [17] for more information on the 3D modeling methodology that was used to generate the 3D wireframe geological surfaces. In addition to the 3D geological model presented in Figure S1, 2D vertical sections with projections of the shear zones, alteration indices and the occurrences of chlorite and sericite were prepared, providing the more traditional means for illustrating the alteration zoning with respect to the geological structure.
Step 3. The AI, CCPI and normative corundum percentages were, in addition to their 2D and 3D visualization, interpolated on a 3D curvilinear grid modelled to be conformable to the overall geological structure of the D3 thrust-stacked lithostratigraphic units, including the offsets associated with the D4 shear zones. This grid modeling technique allowed the prediction of the lateral continuity of the alteration zones in the transposed hydrothermal vent stockwork. The grid, originally employed for analyzing the spatial distribution of lithofacies [47], was built from lithostratigraphic surfaces that bound the D3 thrust stack and the D4 shear zones that deform and offset it. A coordinate transformation (UVT transform) [48] is defined that restores curvilinear XYZ coordinates in geologic space to Cartesian paleogeographic (UV) and time (T) coordinates in geochronologic space. This removes the effects of deformation on the geometry of the lithostratigraphic units in estimating spatial autocorrelation. When interpolation results are transformed back to the geological XYZ space, the structures that deformed the lithostratigraphic units are taken into account. The reader is referred to [48,49] for further details on this grid modeling methodology and to [47] for a description of the compilation steps that were involved in building the curvilinear-faulted grid model of the Flin Flon deposits. Once the curvilinear grid was defined, spatial interpolation of the CCPI, AI indices and normative corundum percentage proceeded by estimating 3D variograms from the UVT-transformed point datasets. Each of the variograms was empirically fitted using an exponential model. Grid interpolation employed ordinary kriging [50] with a neighborhood search of two times the modelled variogram range. This interpolation resulted in continuous 3D grid mapping of the alteration indices with sufficient lateral continuity to appreciate spatial relationships with the modelled geological structures. The most intense zones of hydrothermal alteration were extracted from the 3D grids using a threshold of 95% for the AI and CCPI indices and were visualized together with the VMS ore lenses.

4. Results

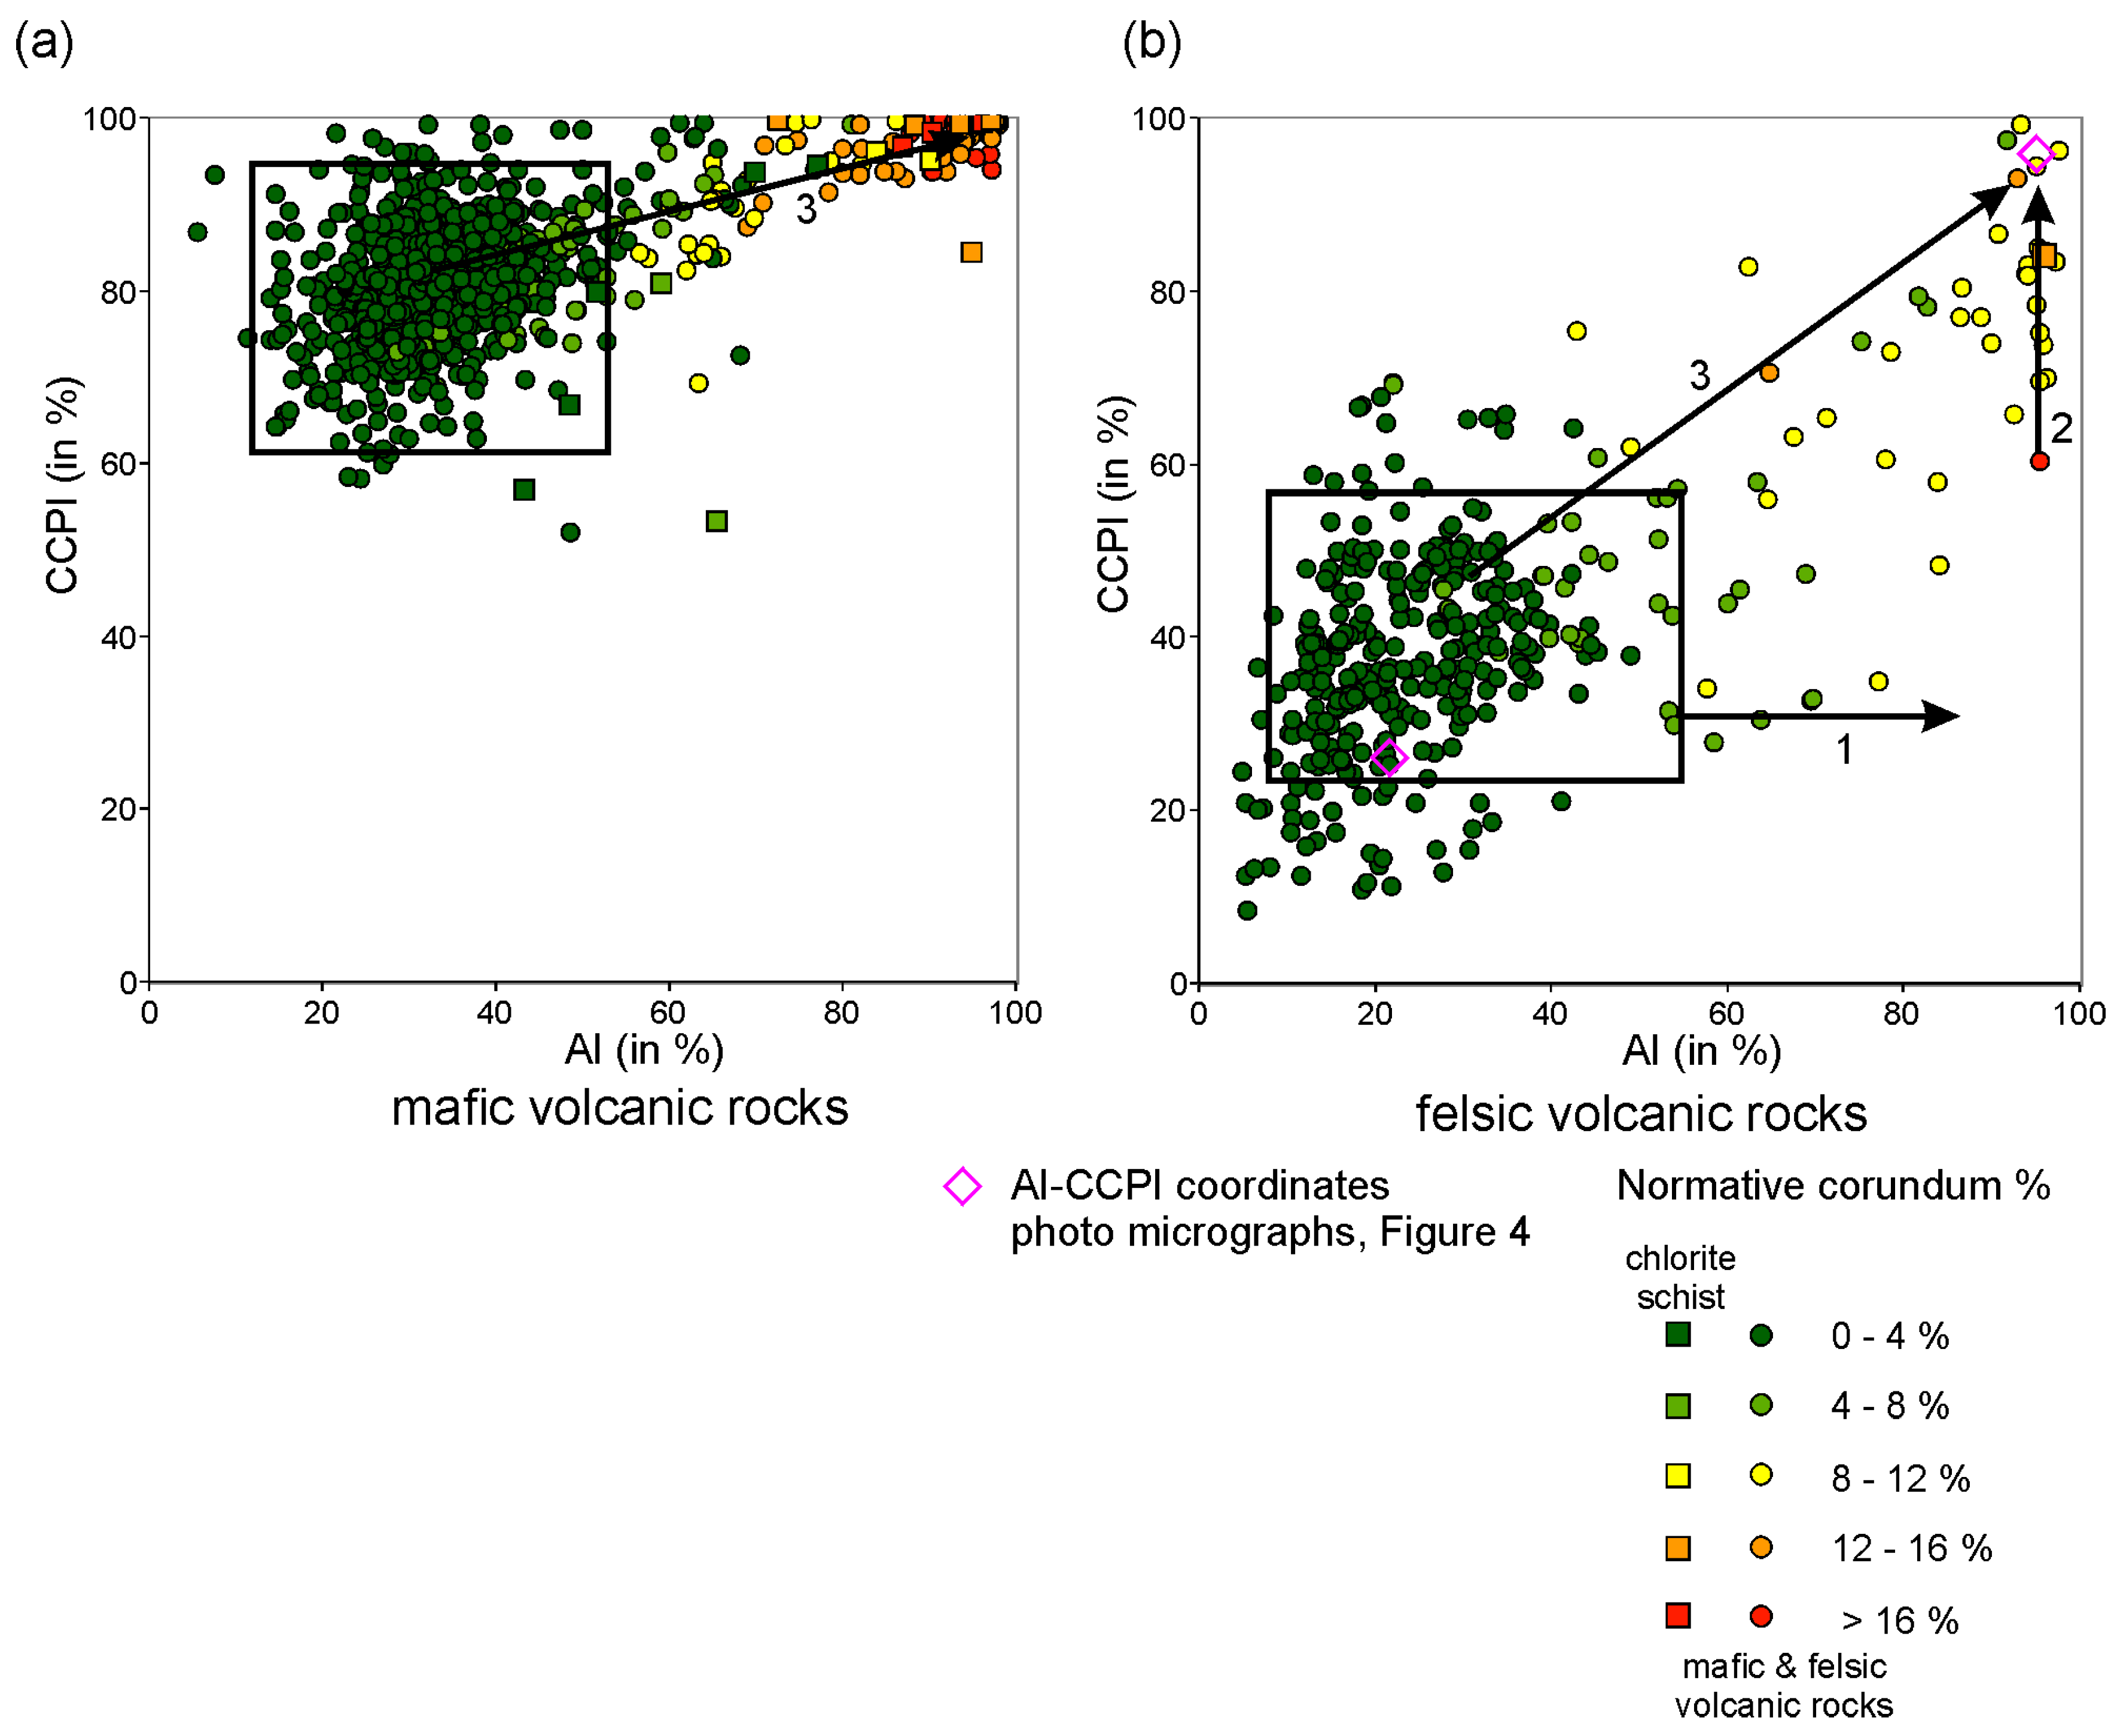
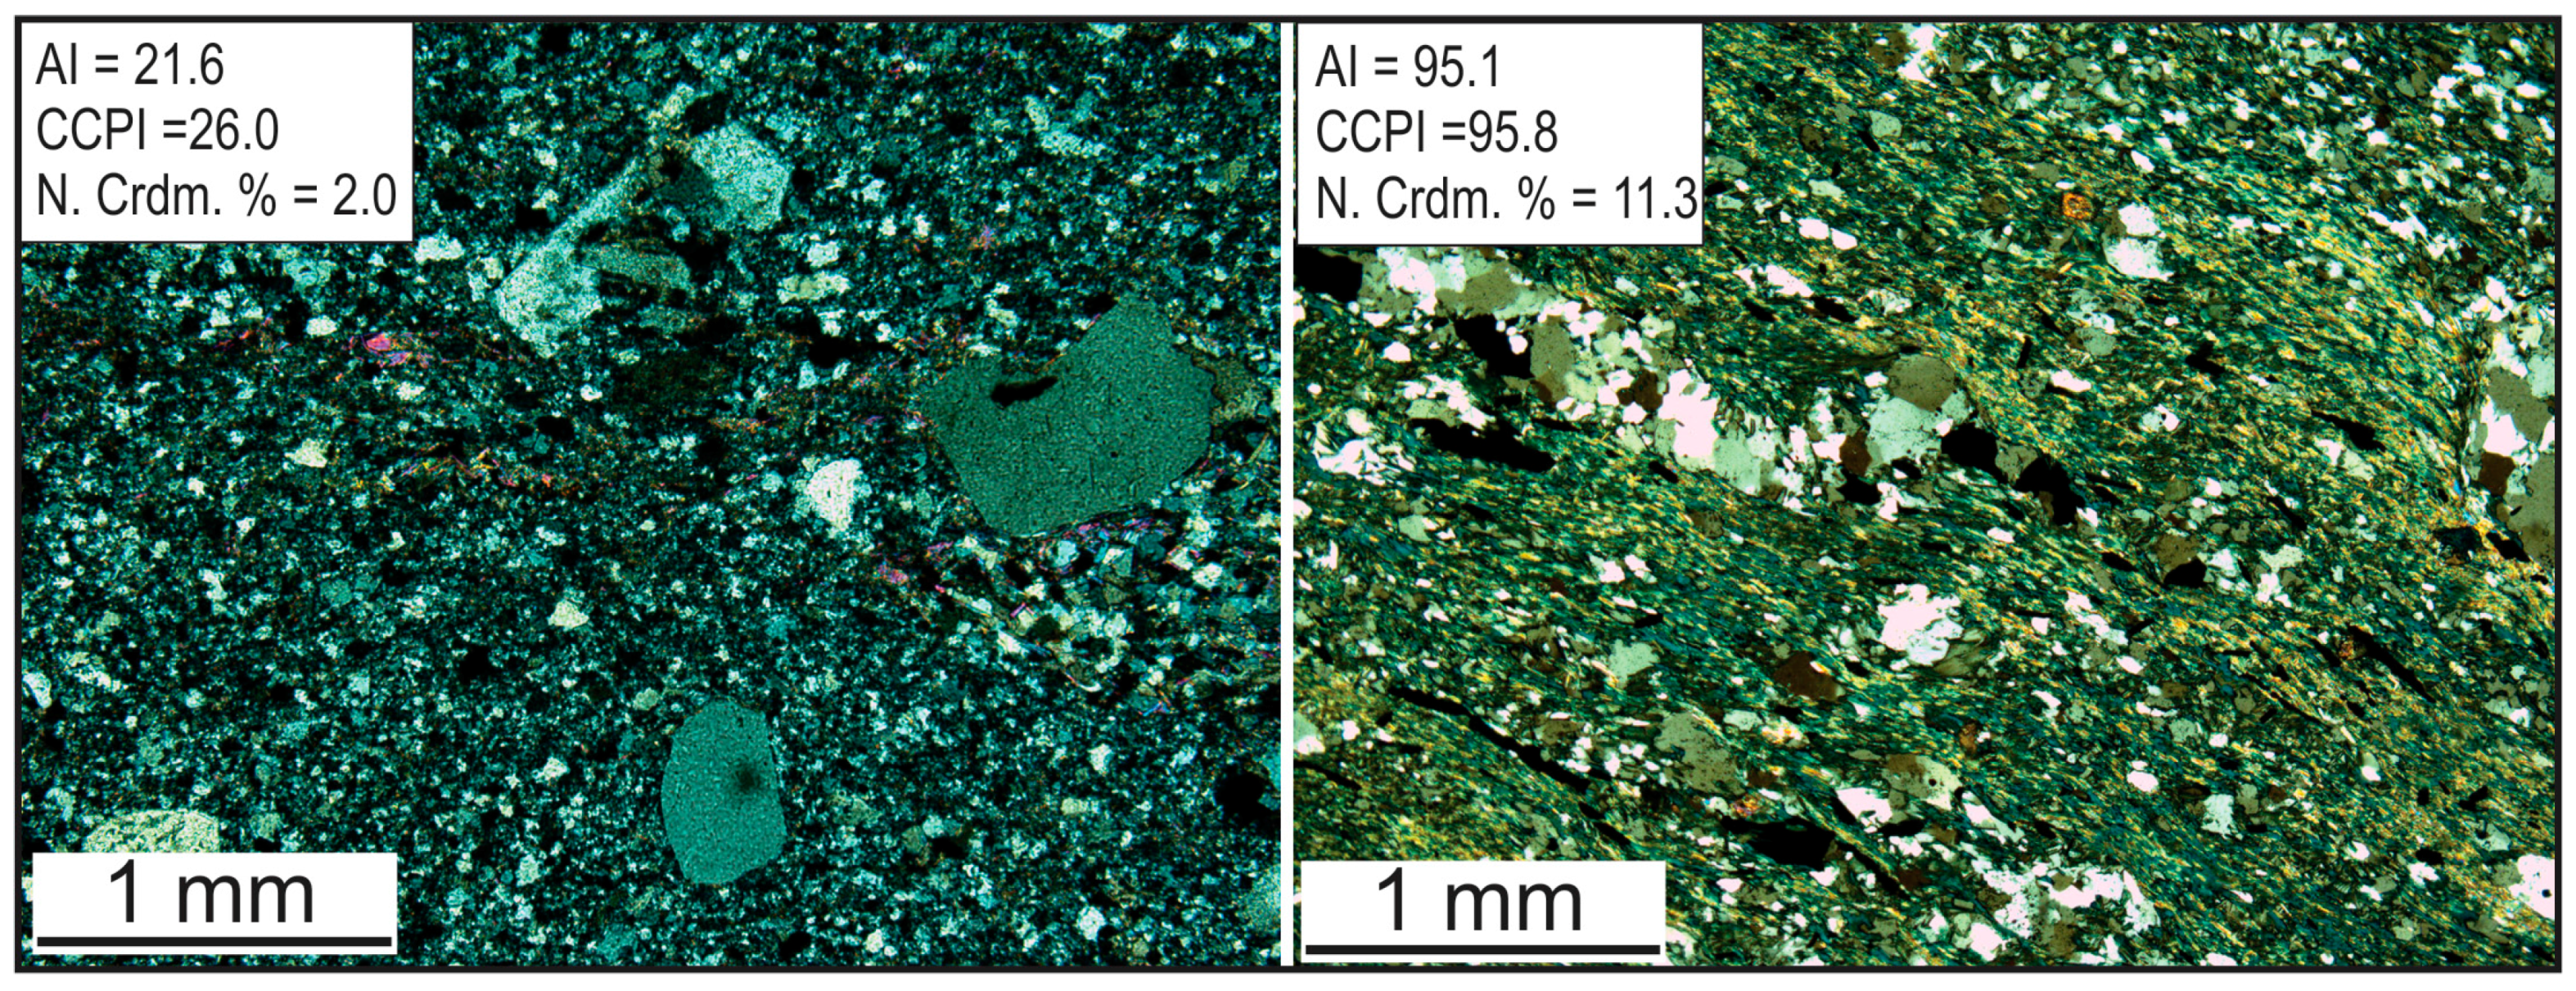
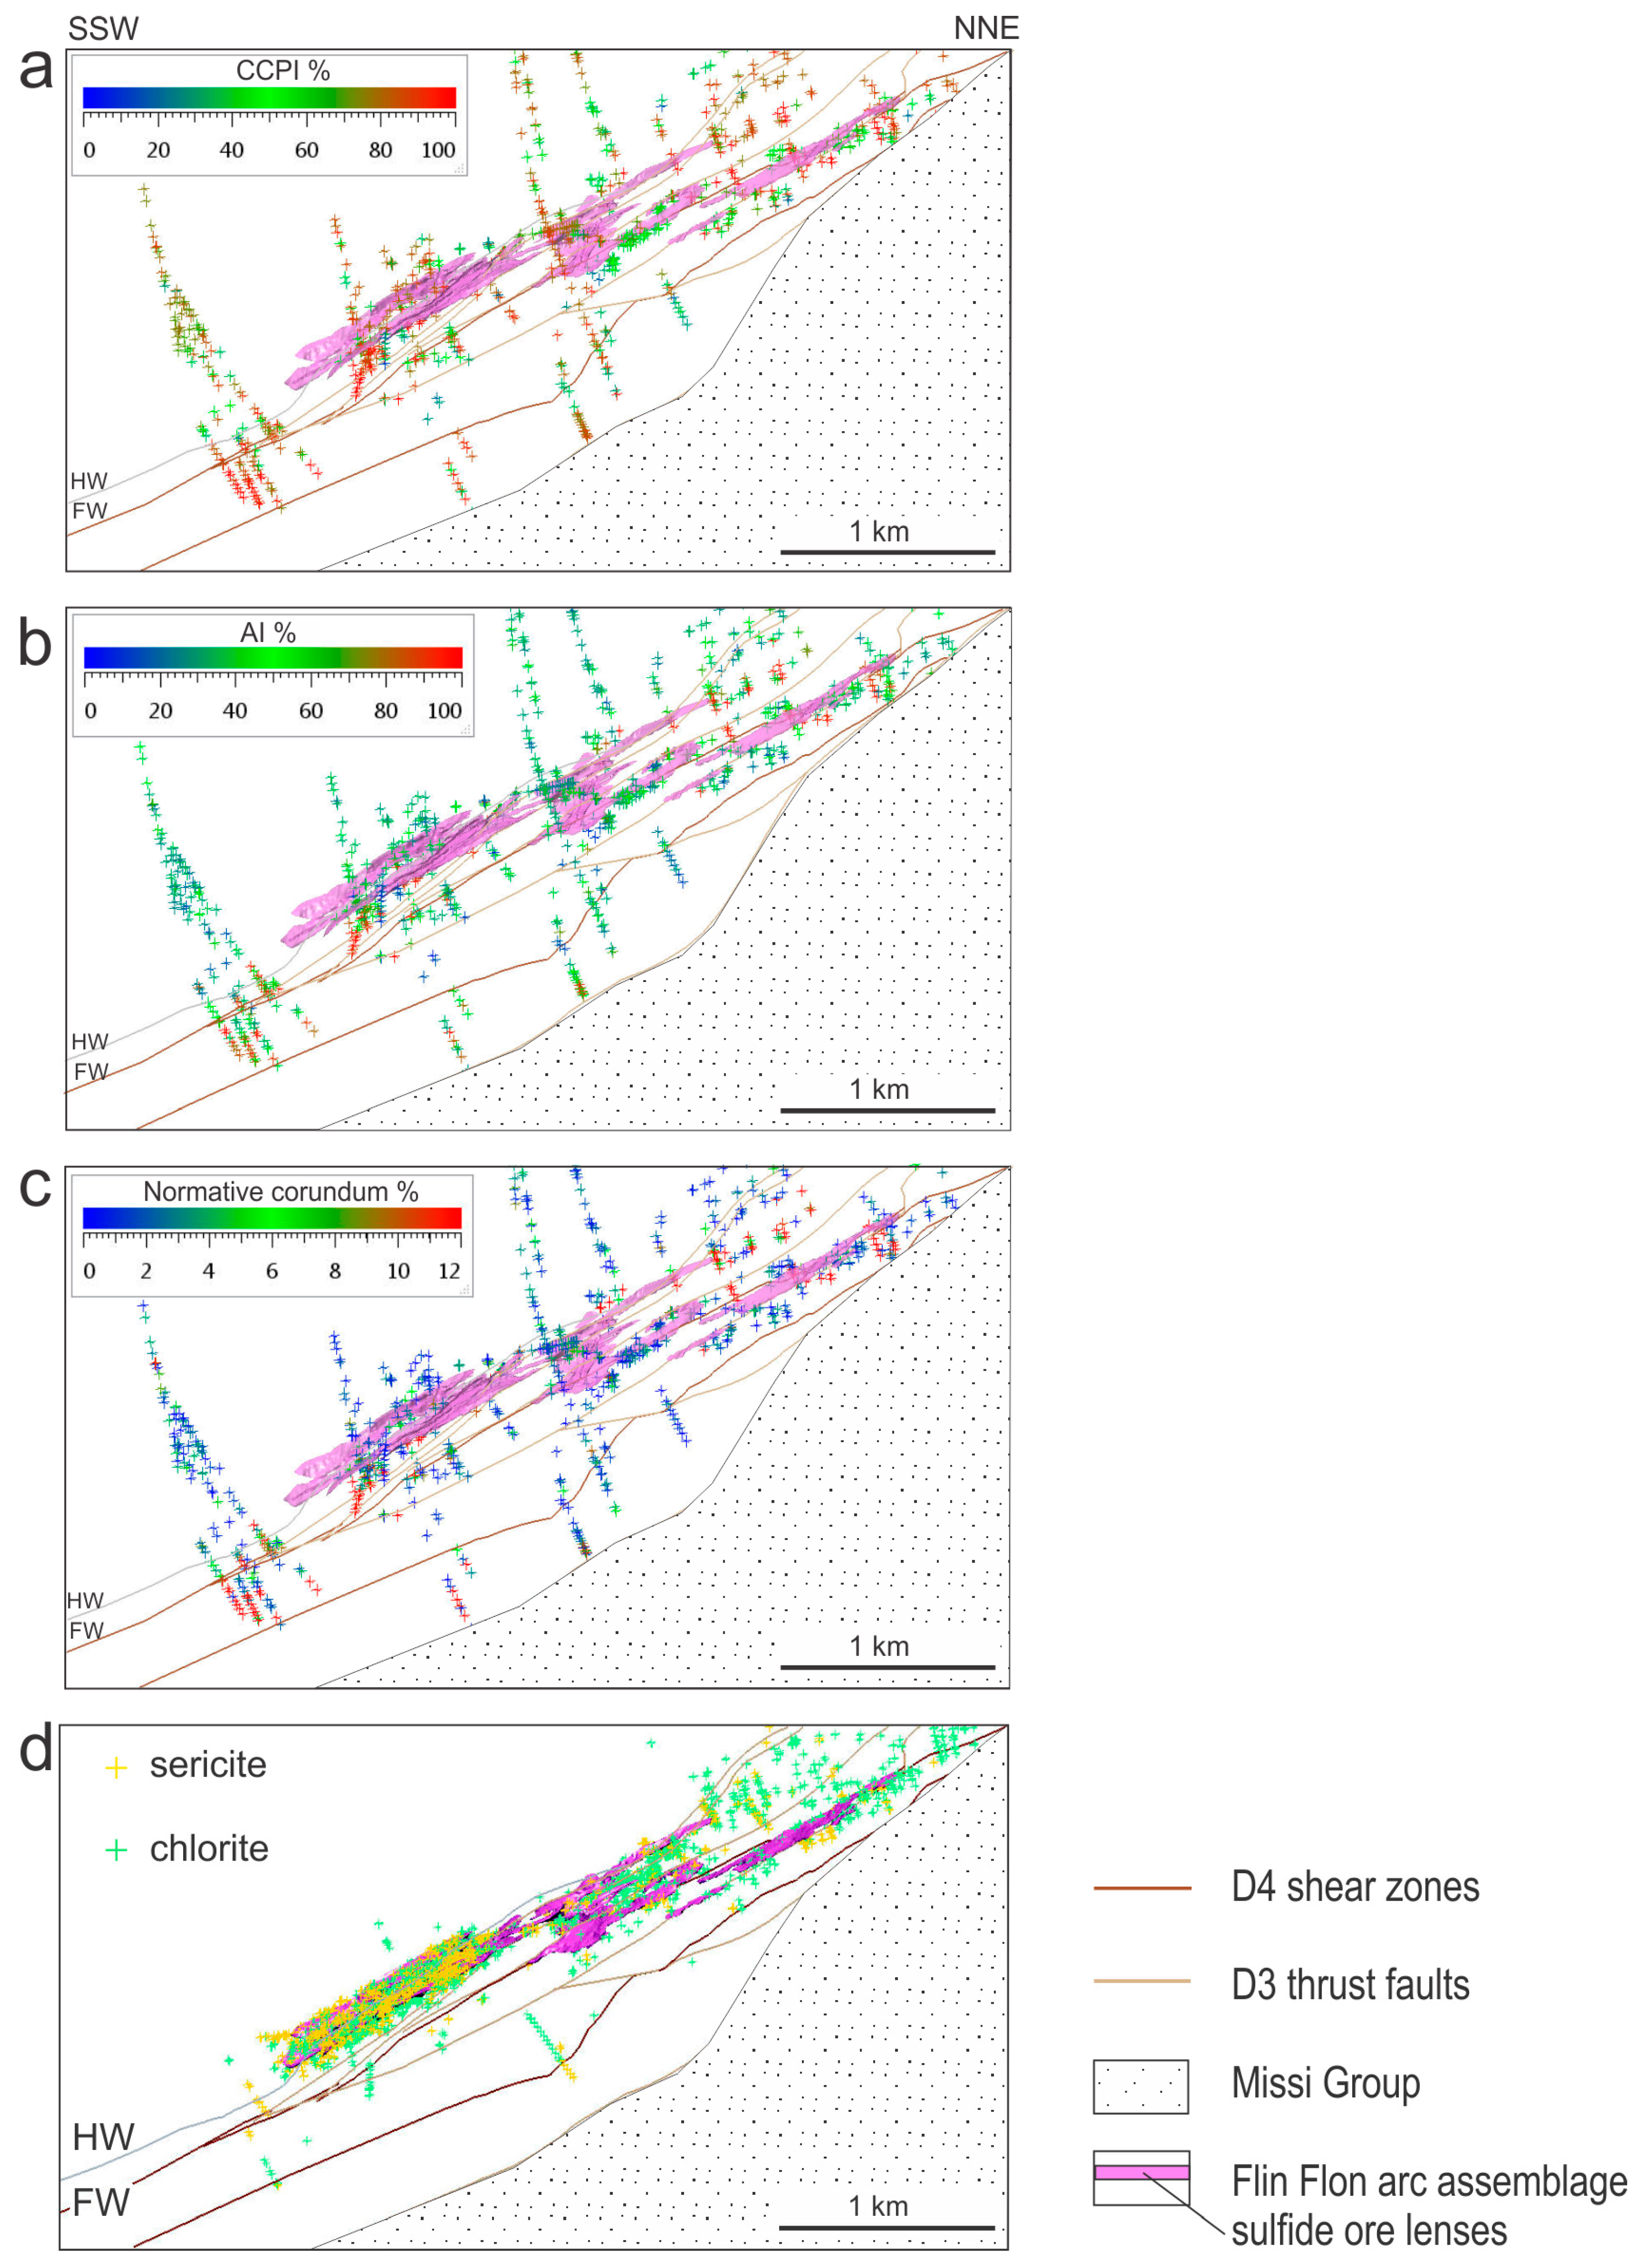
4.1. Hydrothermal Alteration Trends (Proxies for Type/Intensity)

Three hydrothermal alteration trends are evident in the alteration box plot compiled from major oxide analyses of least- to strongly-altered mafic and felsic volcanic rocks of the Millrock member (Figure 3). These trends correspond to those described by [4] and are therefore numbered accordingly:
  • Trend 1: This trend is typical of weak sericitization at the margins of the hydrothermal system [4]. This trend is not present in the samples of mafic volcanic rocks and is ambiguous for some of the felsic volcanic rock samples. This trend is poorly represented in the Flin Flon lithogeochemical data and is likely due to the truncation of the laterally extensive conformable hydrothermal alteration zone at deeper levels in the footwall by D3 thrust faulting.
  • Trend 2: This trend is typical of intense sericite-chlorite + pyrite alteration in mafic and felsic volcanic rocks in the proximal footwall of the hydrothermal alteration system [4]. This trend is evident in many samples of felsic volcanic rocks (coherent and brecciated rhyolite lithofacies) as they represent the dominant host rocks of the VMS deposits.
  • Trend 3: This trend is typical of chlorite-dominated proximal footwall alterations of felsic or mafic volcanic rocks and commonly associated with discordant hydrothermal alteration feeder zones [4]. This trend is evident in samples of mafic and felsic volcanic rocks and consistent with the chlorite-dominant mineral assemblages in the D4 shear zones in the proximal footwall of the VMS ore zones.
Normative corundum percentages are also represented in the alteration box plot using a linear color scale, ranging from green for low-, yellow for intermediate- and red hues for high values (Figure 3). This mapping shows that there is a high degree of correspondence between the AI and normative corundum percentage, which confirms the fact that the indices are based on different proxies (Na depletion vs. Al enrichment) of the same feldspar breakdown and sericite replacement alteration reactions. Figure 4 shows photomicrographs of least-altered and intensely-altered rhyolite samples with corresponding values of the AI, CCPI and normative corundum indices. The two samples plot roughly on opposite sides of trend 3 in the box plot for felsic volcanic rocks (Figure 3b). Note that the trend defined by chlorite schist samples expands over the full range of the trend defined by the least-altered to intensely-altered mafic volcanic rocks (Figure 3a), suggesting that the chlorite phyllonite did not only originate from hydrothermally-altered volcanic rocks, but also from their least-altered equivalents.

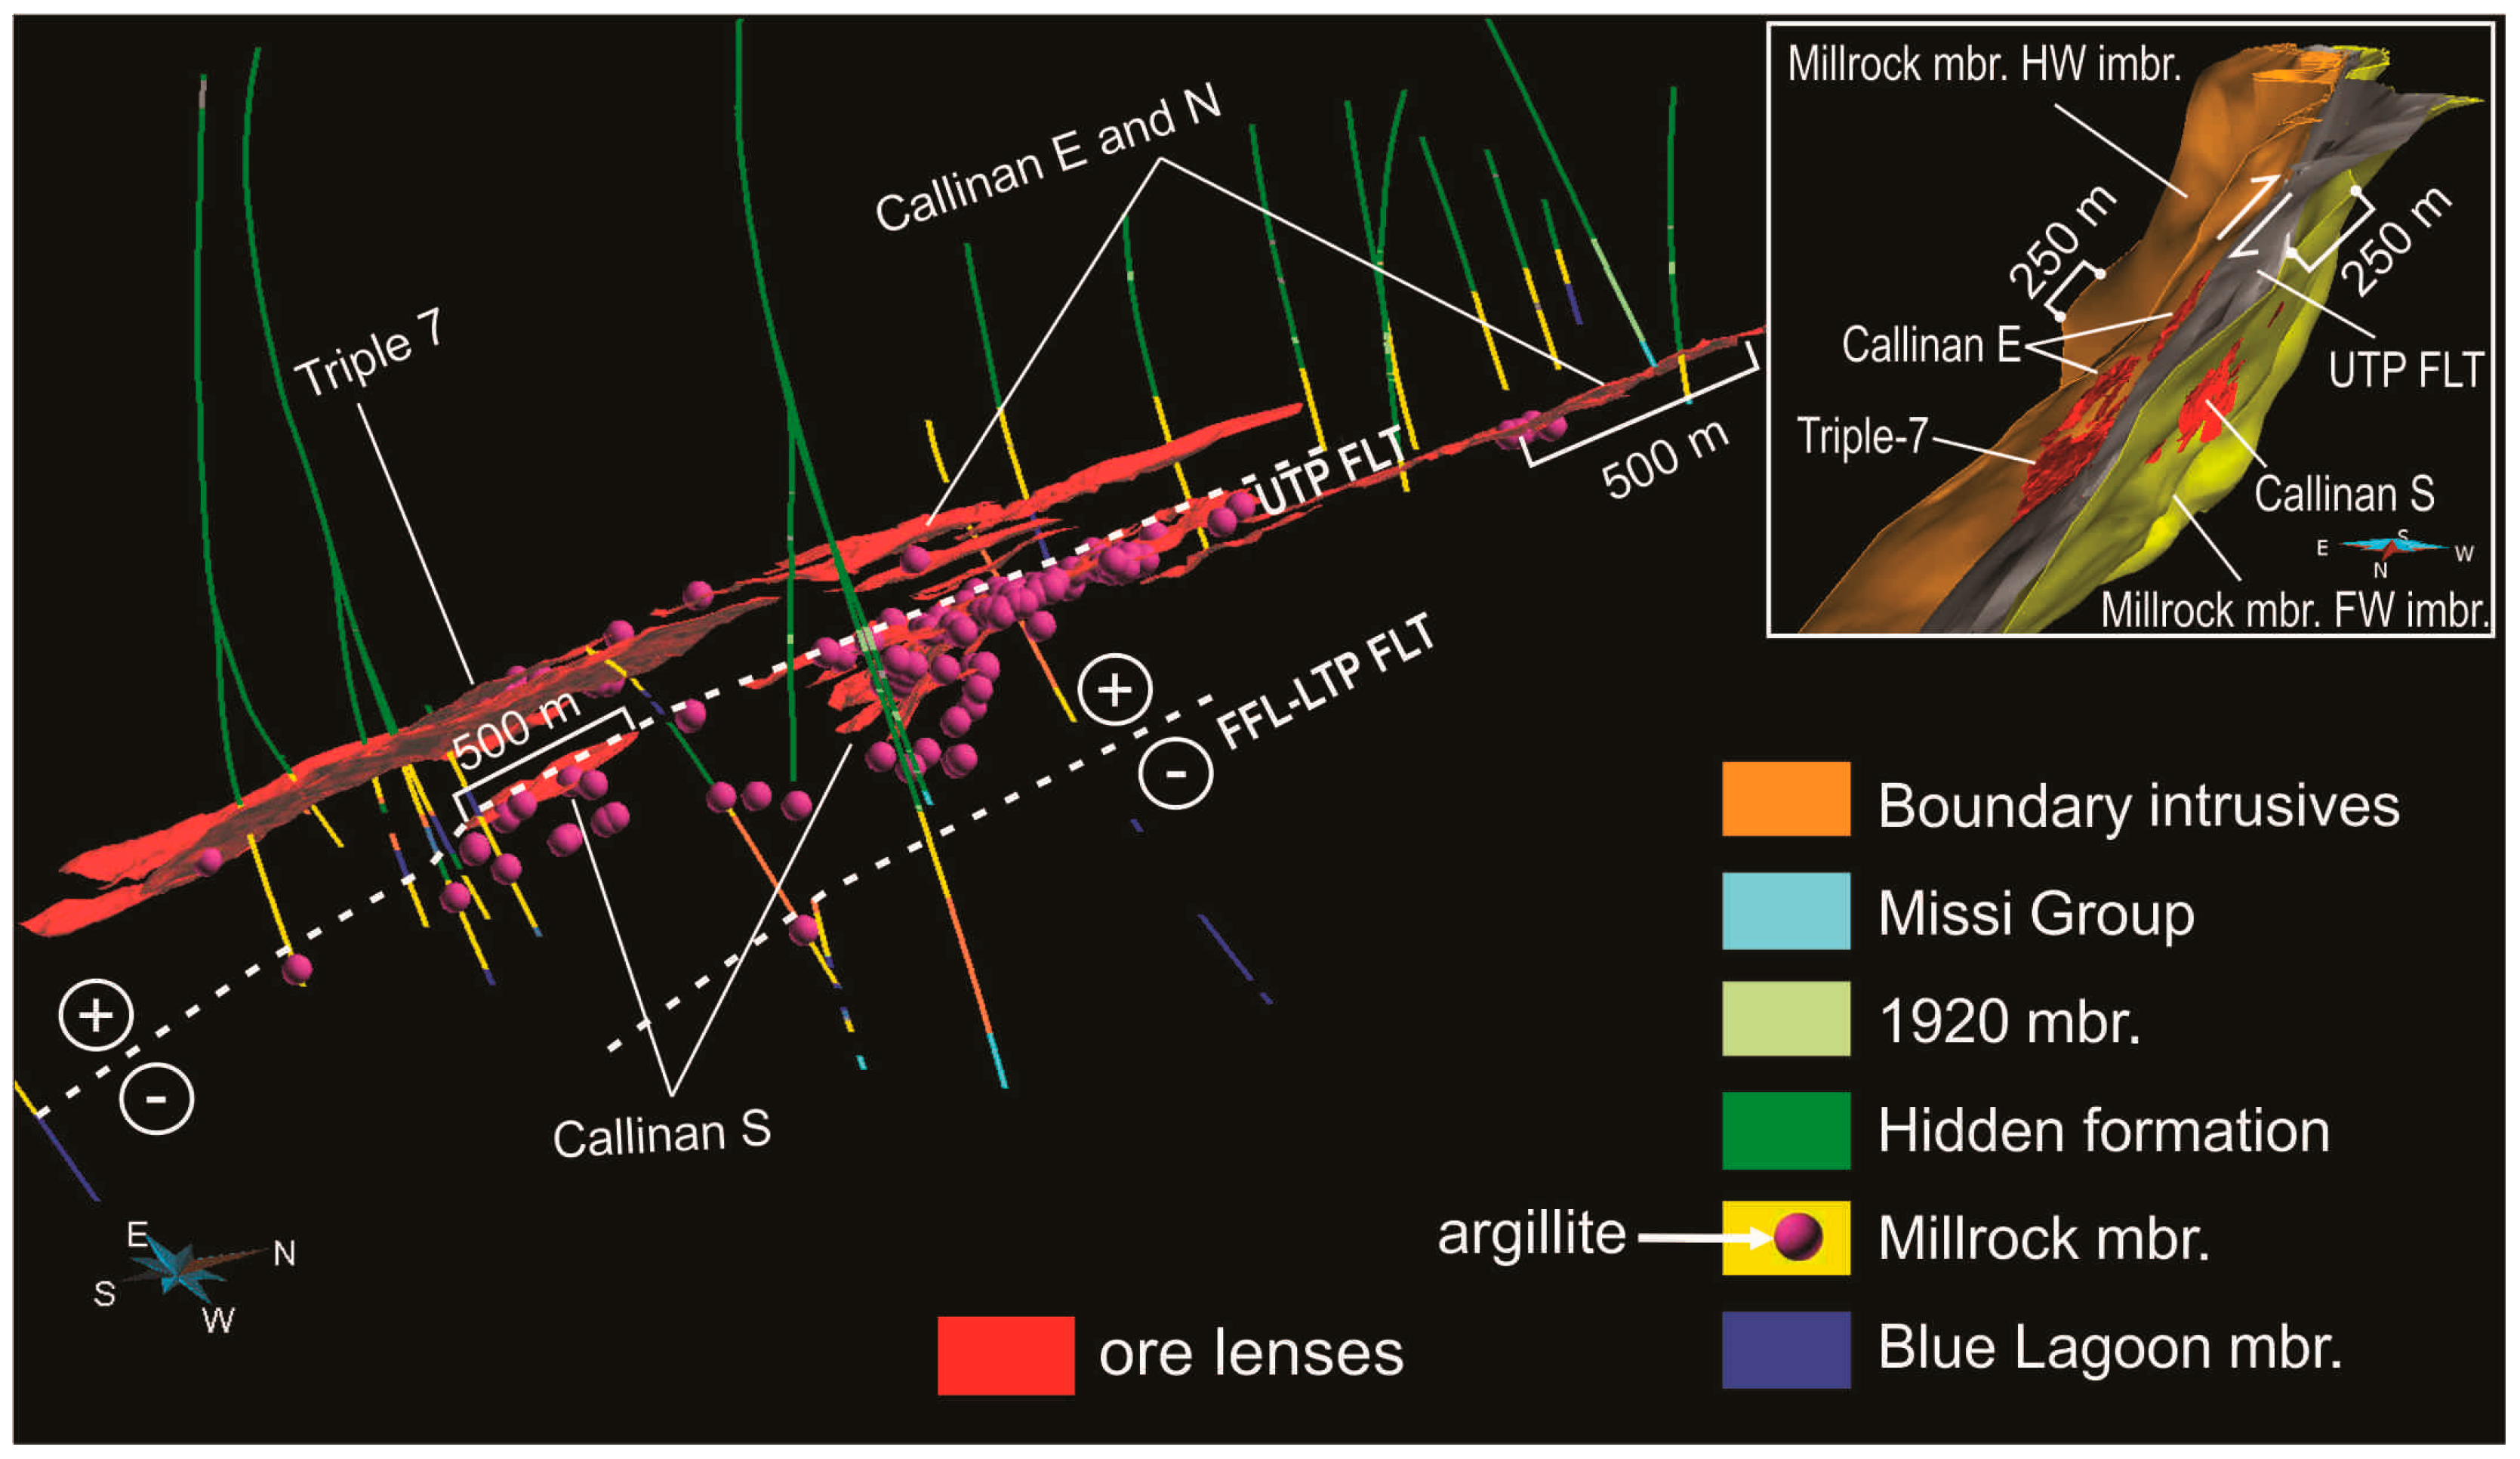
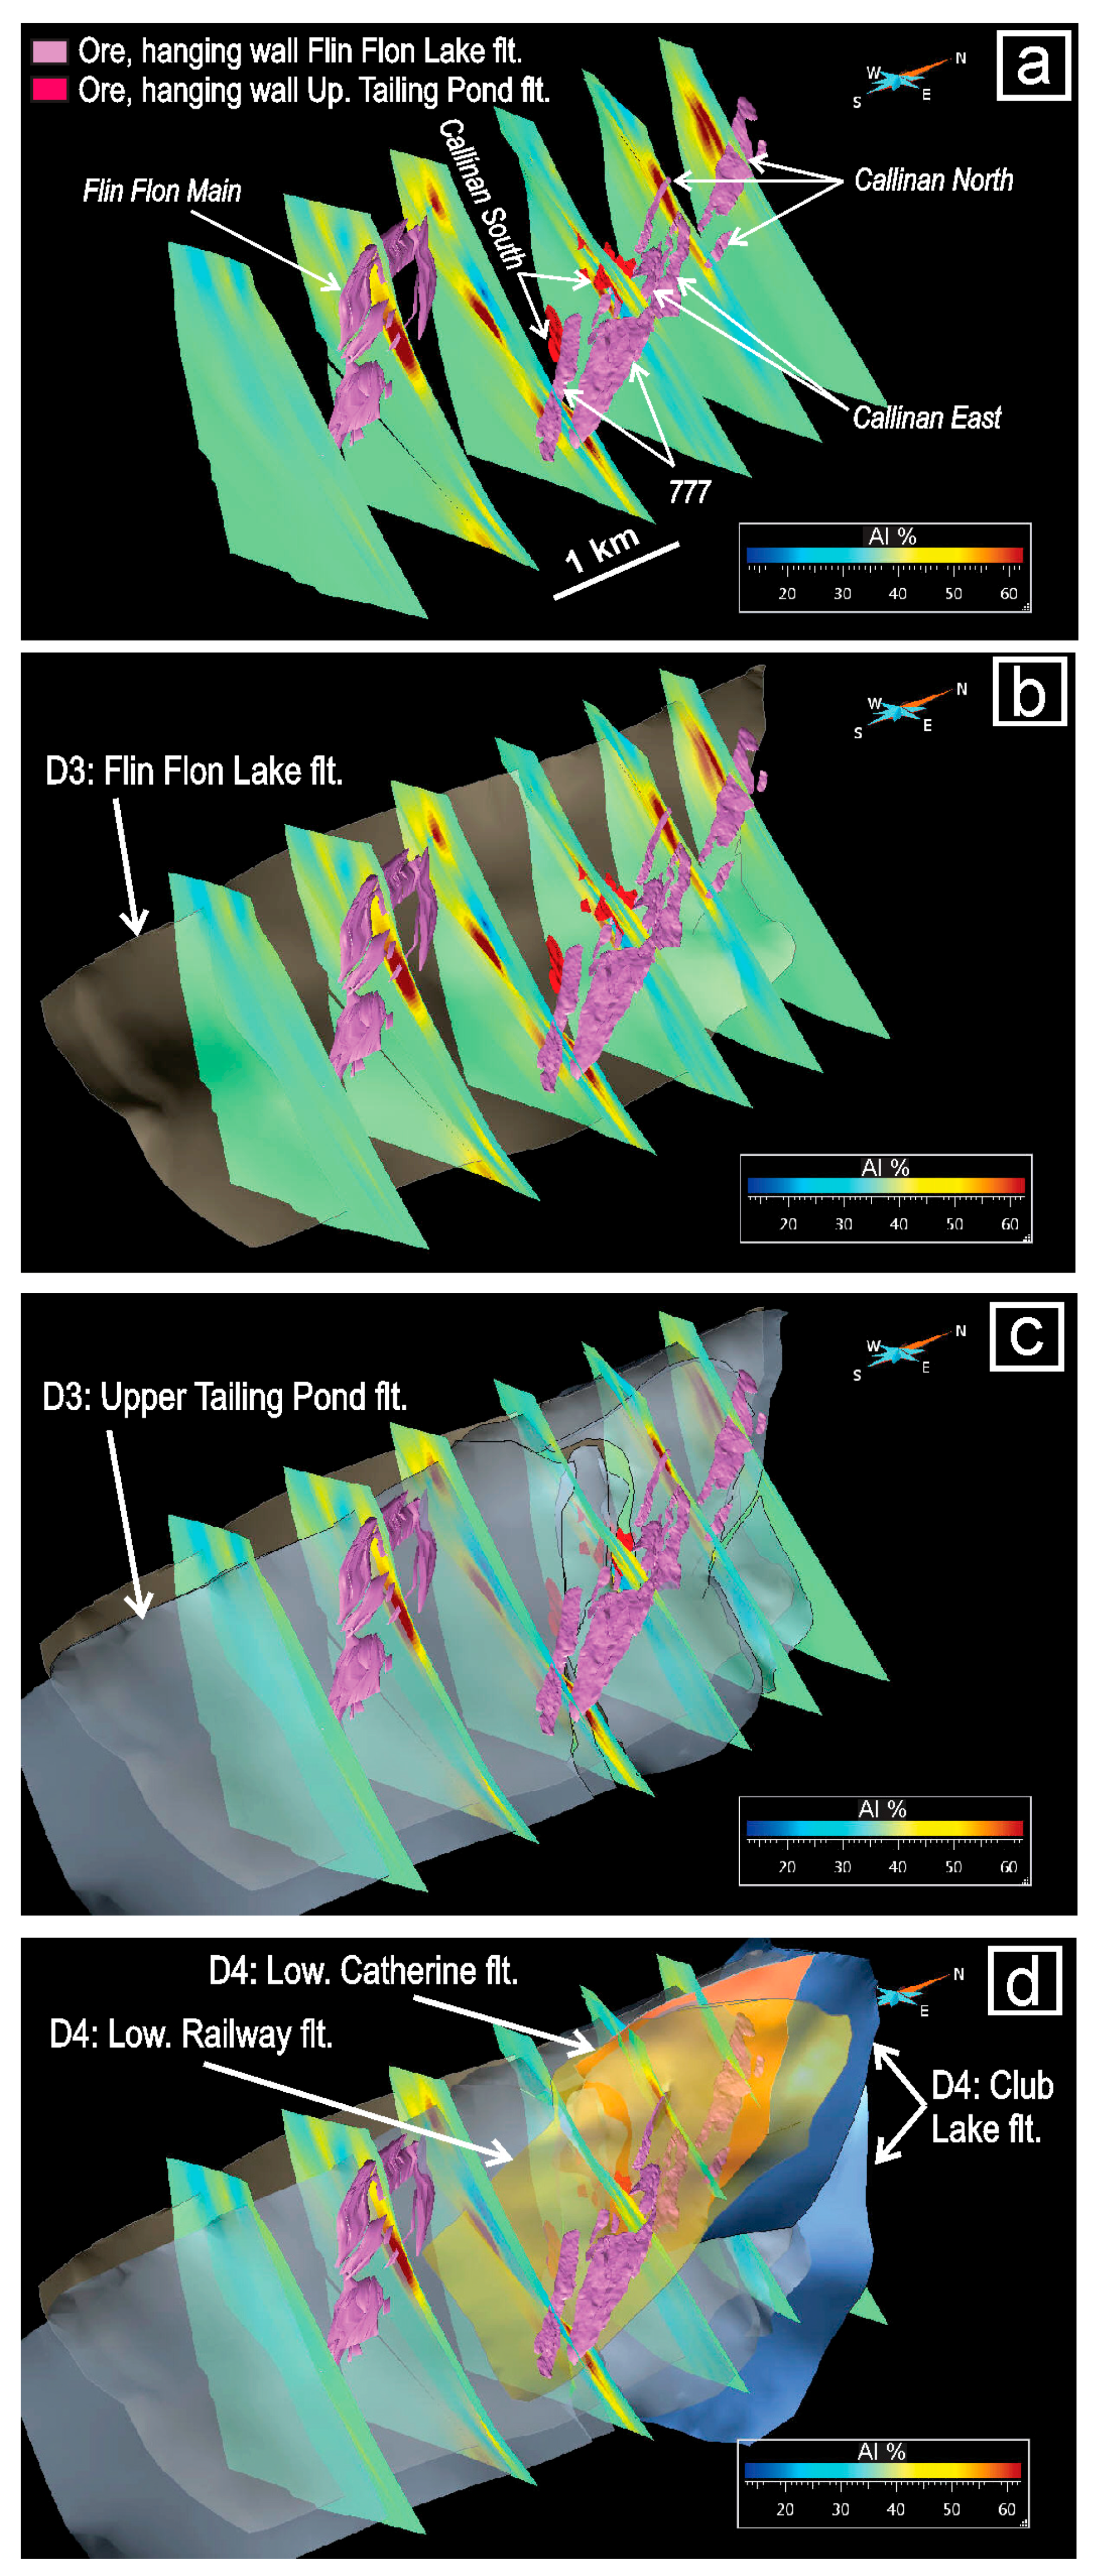
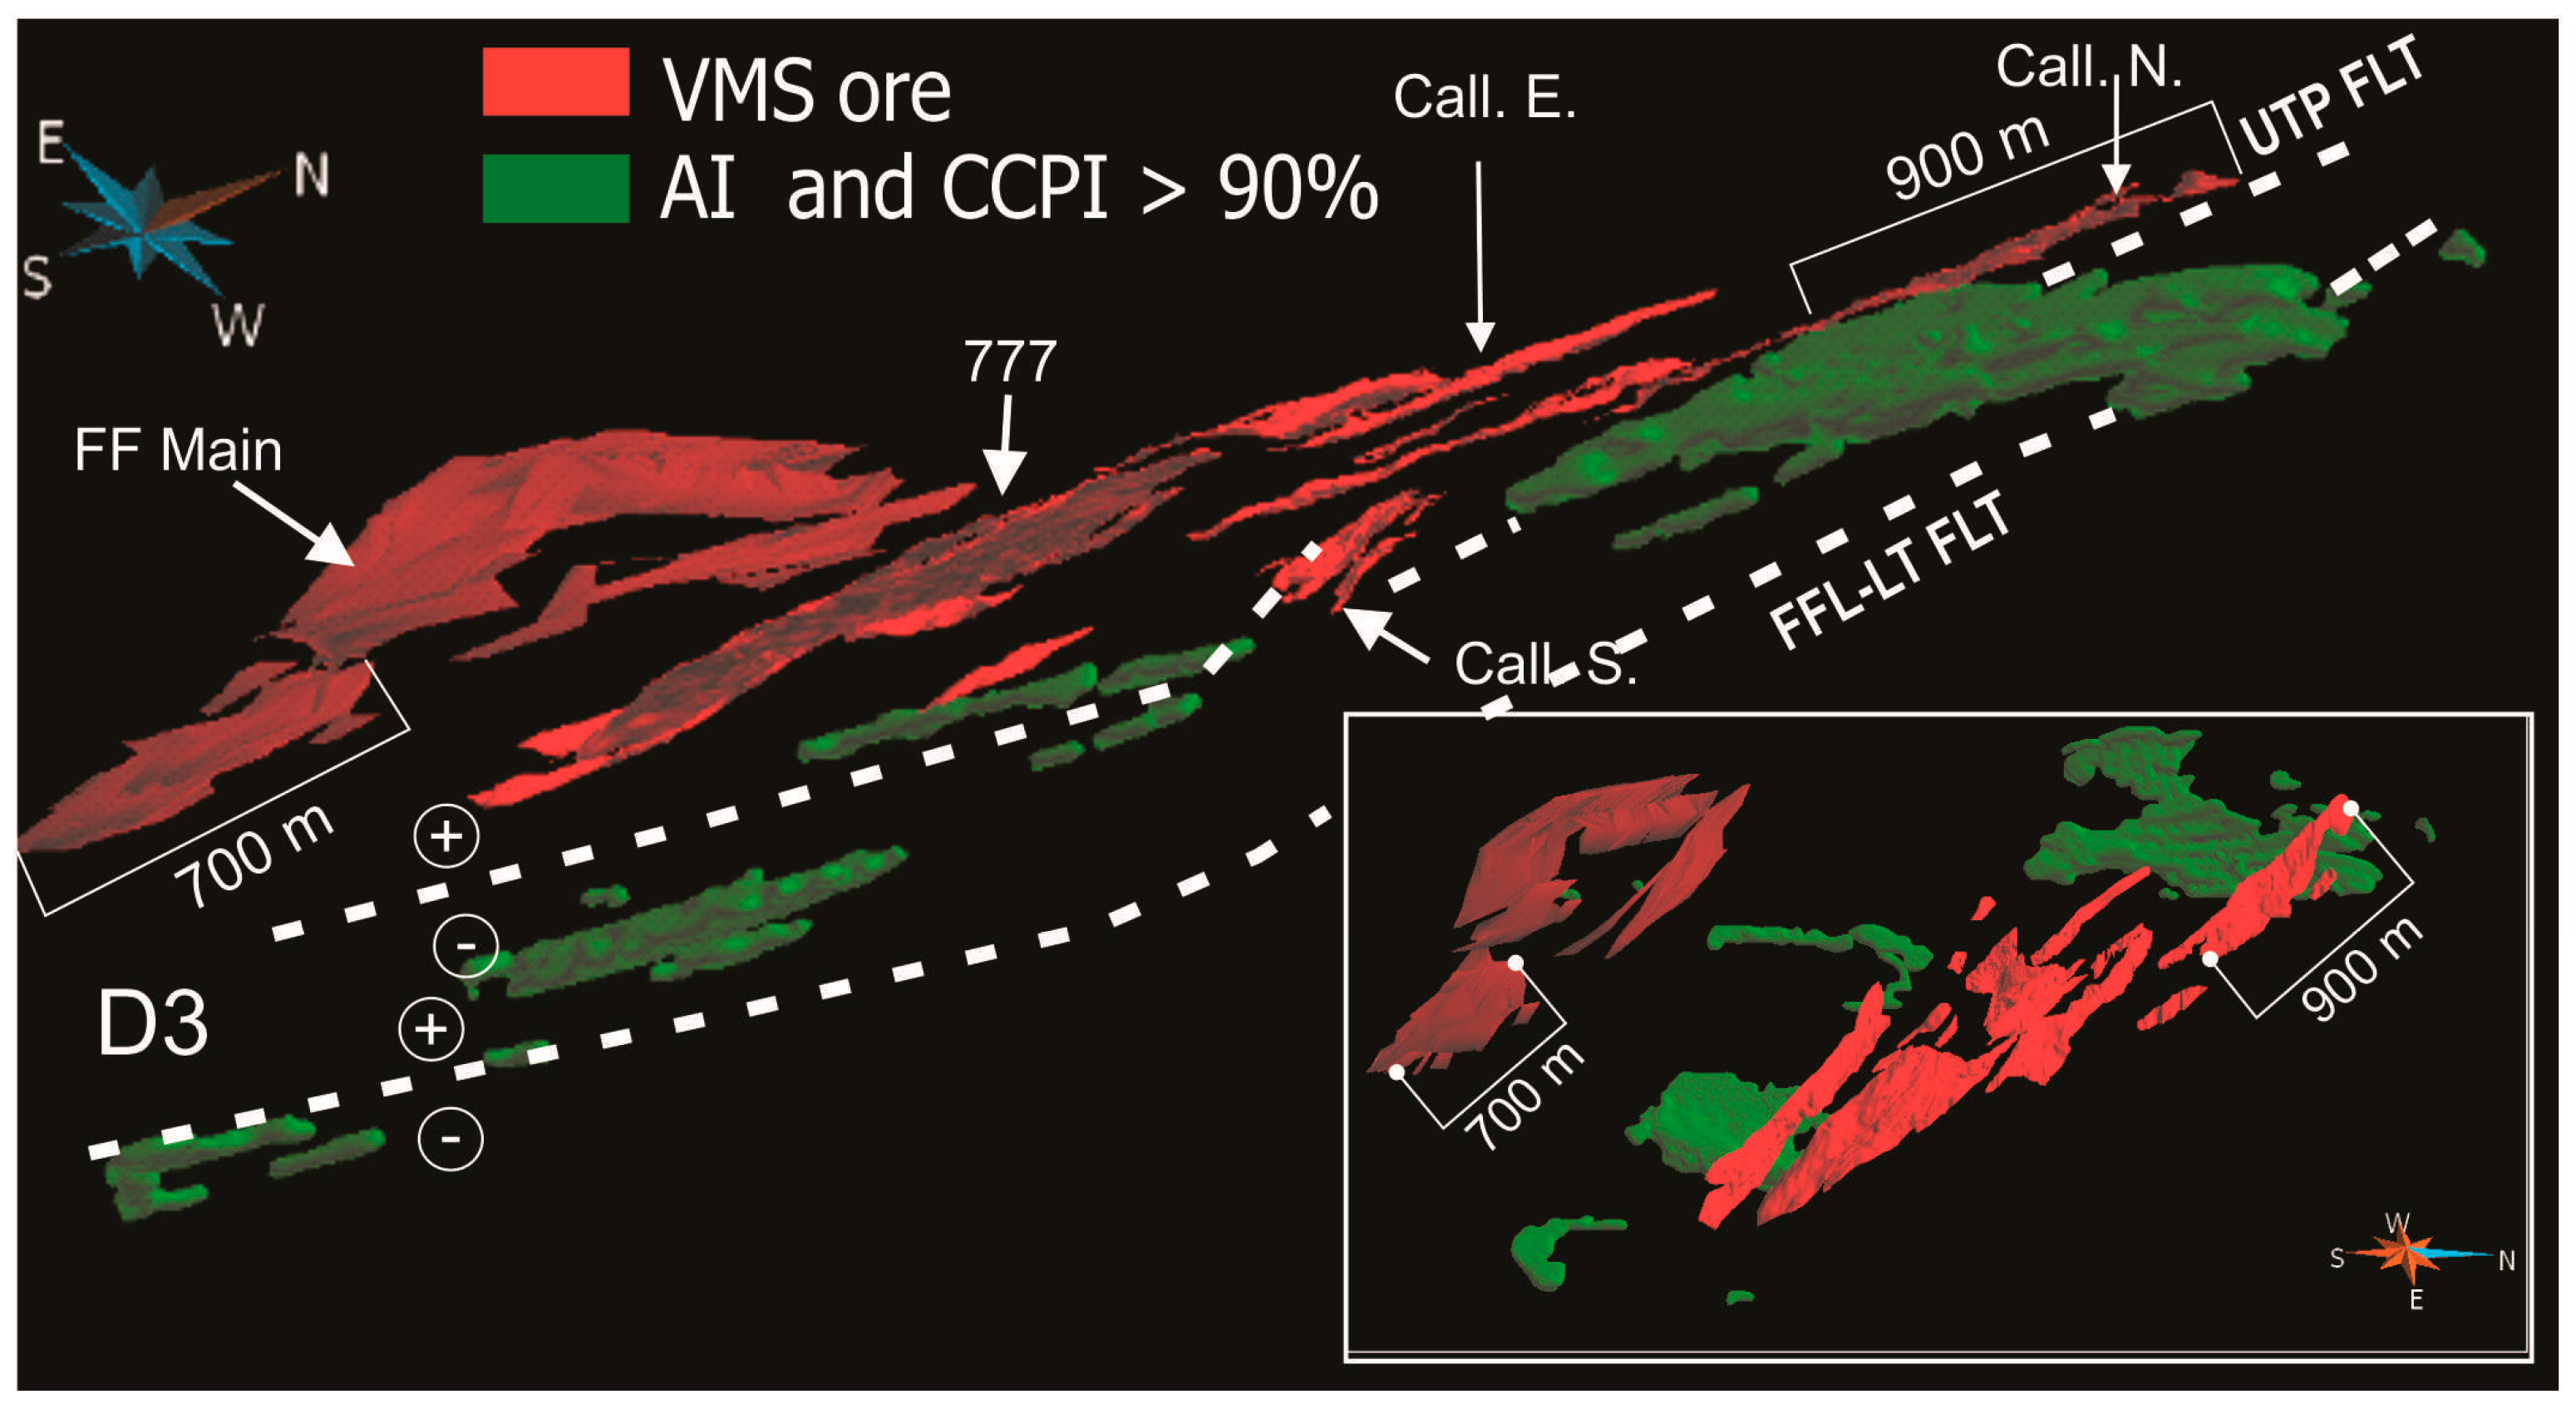
4.2. 3D Structural Setting of the Flin Flon VMS Deposit

Two E-dipping D3 thrust faults repeated and locally brought up the Millrock member over younger hanging wall formations (Figure 2 and Figure S1). These thrust faults are correlated with similarly-oriented E-dipping post-Missi D3 thrust faults, approximately 2 km to the east, which imbricate metasedimentary rocks of the Missi Group with volcanic and volcaniclastic rocks of the Flin Flon arc assemblage [17], (Figure 2 and Figure S1). W-directed imbricates of Missi Group metasedimentary and volcanic rocks of the Louis formation were also established in an outcrop east of Louis Lake [16] (Figure 2). The regional significance of D3 thrust faulting is also evident from regional-scale repeats of the massive sulfide ore horizon, argillite intervals and the VMS-hosting rhyolite lithofacies (Figure 5 and Figure S1). D4 ductile listric shear zones accommodated north-directed tectonic transport and locally re-imbricated the D3 thrust imbricates. The Club Lake shear zone is the basal splay of this listric D4 imbricate structure and accommodated northward tectonic transport of the Flin Flon arc assemblage over Missi Group metasedimentary rocks (Figure 2 and Figure S1). The shear zone exhibits asymmetric fabrics and a pronounced D4 stretching lineation that locally defines the plunge of D4 sheath folds (Figure 6a) and is oriented parallel to the elongation of the ore sulfide lenses. The Catherine and Railway D4 thrust faults cut into older lithostratigraphic units with depth and sole into the Club Lake fault (Figure S1). These splays are mapped at surface (Figure 6b) and mine workings (Figure 6c) as 10 to 25 m wide brittle-ductile to ductile shear zones and are easily recognized in the drill core by high strain L–S shape fabrics, rotated porphyroclasts with local development of C/S fabrics. The shear zones are commonly associated with crenulation zones and meter-scale folds of quartz veins (Figure 6d). In the footwall of the ore horizon D4 shear zone splays are preferentially localized in hydrothermally-altered rocks, which resulted in the development of the previously-described chlorite-rich phyllonite. Underground studies [15] show that restoration of the sulfide lenses of the Callinan deposits along the D4 shear zones yield offsets that range between 165 and 400 m [15].
The sheared ore lenses of the 777 deposit consist of pyrrhotite, pyrite, chalcopyrite and sphalerite and show mylonitic banding on centimeter to millimeter scale [27,51], (Figure 7a,b).The Callinan ore lenses consist of banded as well as breccia sulfide ore, the latter being interpreted as a lateral distal facies equivalent of the former [15]. The tectonic fabrics in the banded massive sulfide ore of the 777 and Callinan deposit are continuous across their contacts with chlorite phyllonite originating from the shear and transposition of the footwall hydrothermal alteration zones (Figure 7c,d). In contrast to the D3 brittle-ductile deformation of the sulfide ore horizon, the mechanical remobilization of sulfide ore during D4 deformation was predominantly ductile and homogeneous in character, resulting in elongated mylonitized ore lenses with the preservation of primary Cu/Cu + Zn metal zoning patterns [52]. On the microscopic scale, however, remobilization appears to be inhomogeneous, being both ductile and brittle in nature with incompetent sulfides, gold and electrum filling fractures in pyrite porphyroblasts (Figure 7e) and cataclasistic deformation of pyrite (Figure 7f). Triple junctions in weakly fractured pyrite porphyroblasts (Figure 7e) suggest that metamorphic new growth and annealing were competitive processes during the cataclastic deformation of pyrite. Pressure shadows of chalcopyrite around quartz porphyroclasts and magnetite crystals in chlorite phyllonite suggests local fluid-assisted remobilization of incompetent sulfides in the feeder stock work of the 777 deposit (Figure 7c).

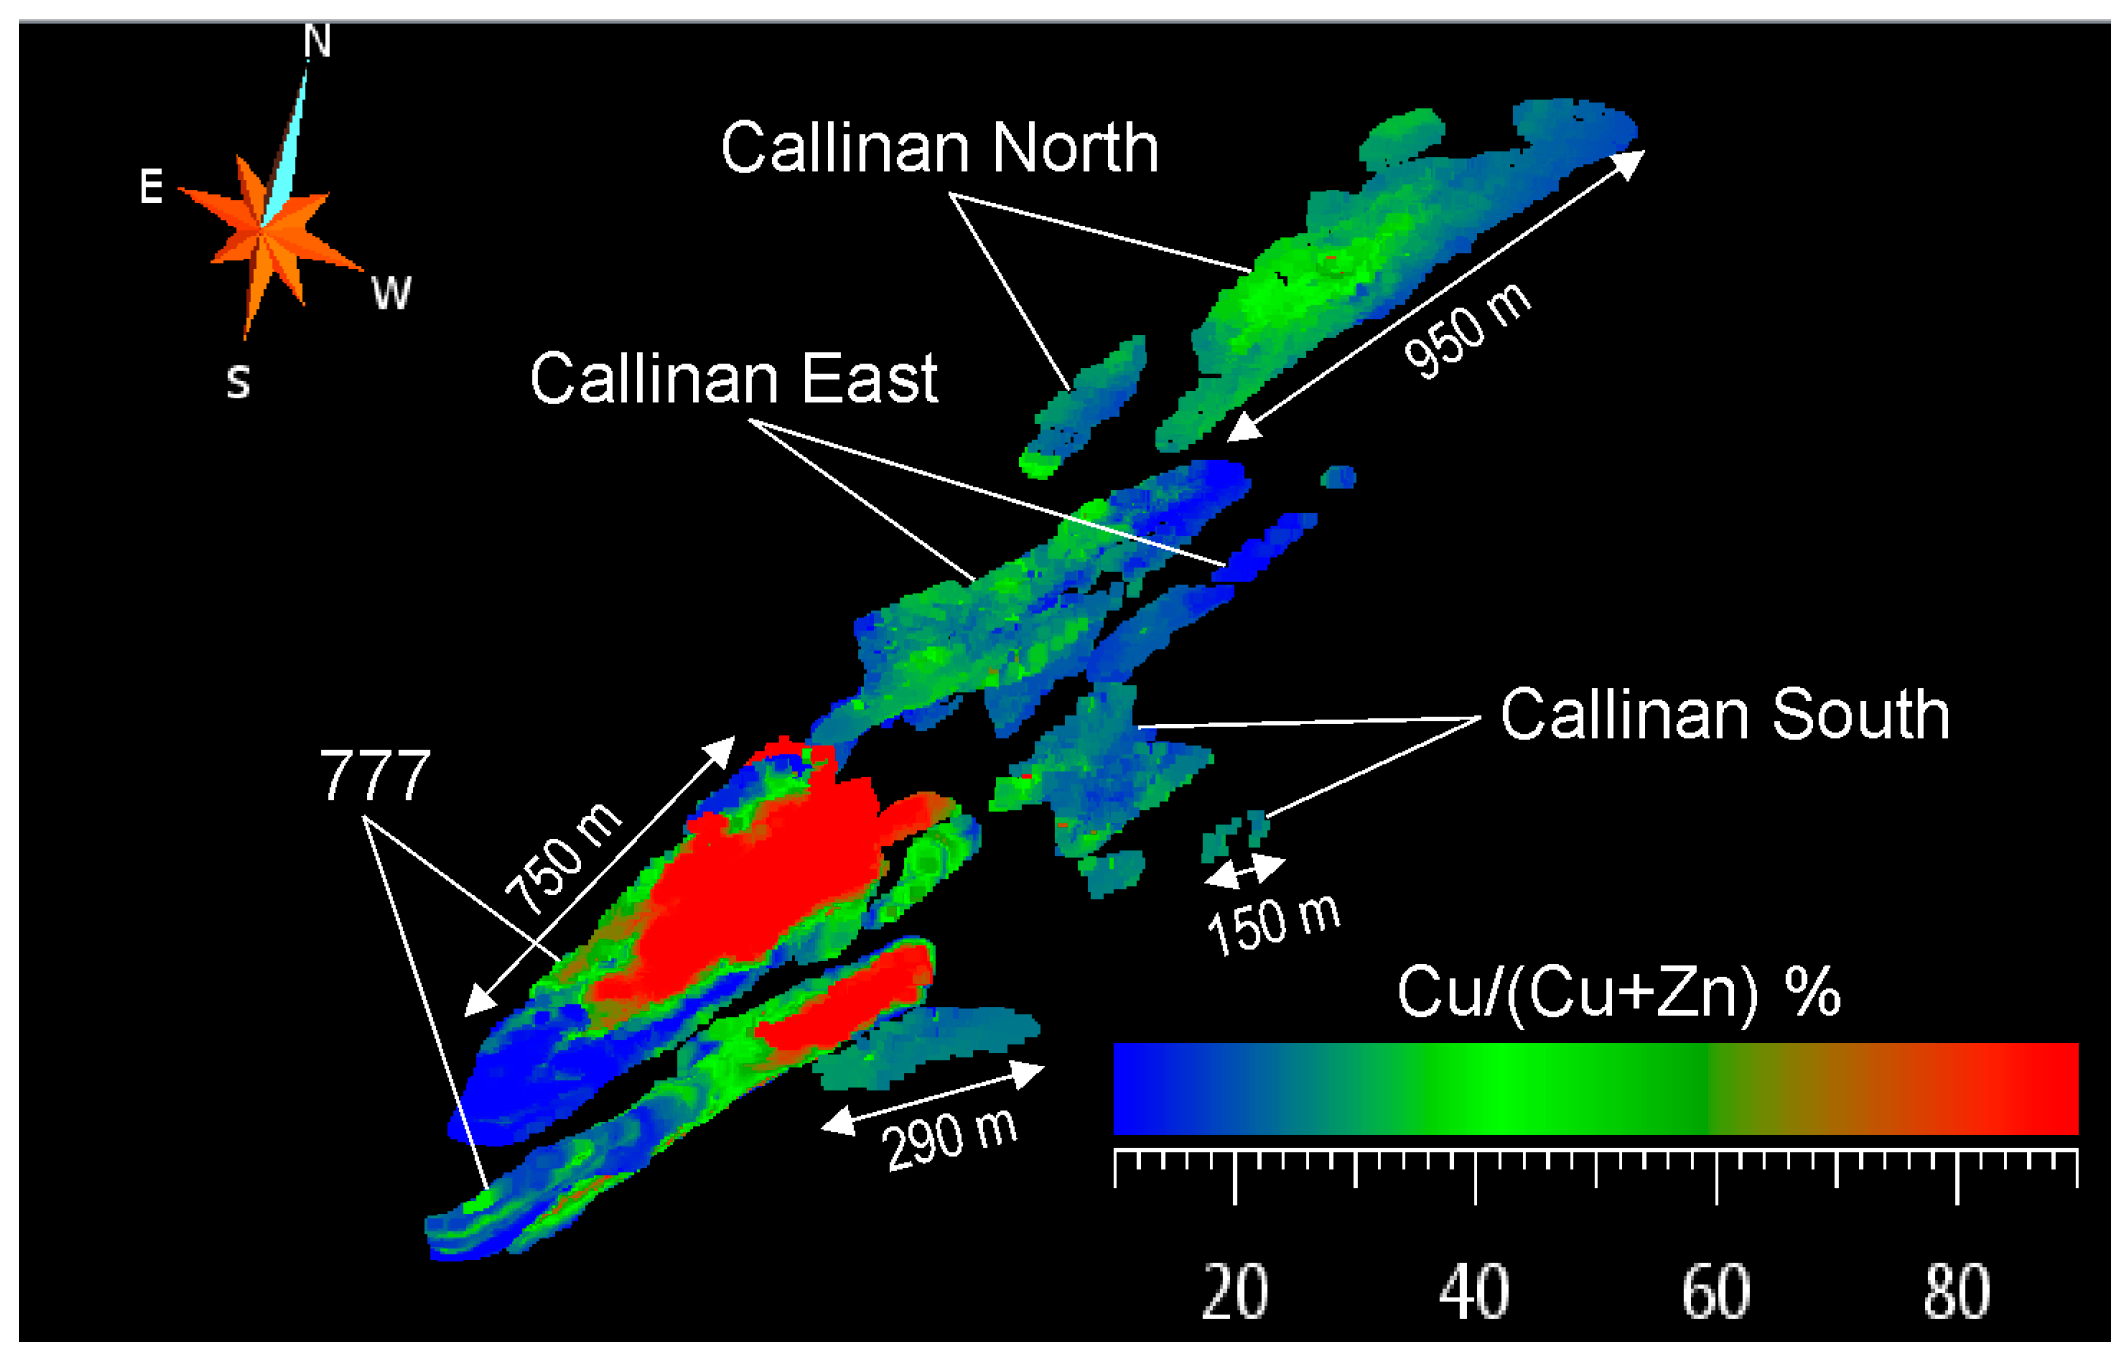
4.3. Spatial Association between Hydrothermal Alteration, Ore and Shear Zones

AI, CCPI alteration index values and normative corundum percentages display high values in the proximal footwall of the ore lenses (Figure S1 and Figure 8a–c). Zones of high AI (Figure 9b) and normative corundum percentages (Figure 9c) largely coincide and are both confined to the footwall of the VMS ore zones (Figure S1). The preservation of ore-proximal hydrothermal alteration signatures with limited displacement from the ore zones, suggests that the distribution of contrasting AI and normative corundum values, although having been affected by shear, are still effectively outlining the hydrothermal vent system in which the primary lithogeochemical signatures of Na-depleting hydrothermal alteration reactions have been preserved. High CCPI values, on the other hand, are not only confined to these footwall proximal alteration zones but also appear to be spatially associated with segments of D3 and D4 shear zones in the hanging wall of the VMS ore zone (Figure S1 and Figure 8a). Contrary to the mineral zoning shown in standard models of hydrothermal alteration in the footwall of VMS ore systems [1] chlorite is not confined to a central proximal zone surrounded by sericite, but shows a more laterally extensive distribution along D4 shear zones in comparison to the distribution of sericite (Figure 8d and Figure S1). This suggests that the zones of high CCPI, in addition to mapping the intensity of hydrothermal alteration, also mark zones with pervasive metamorphic new growth of chlorite.
Interpolation of the alteration indices on the curvilinear-faulted grid provides a more continuous 3D spatial characterization of the hydrothermal alteration zones (Figure 10), allowing analysis of their spatial relationships with the shear zones in more detail. The 3D interpolation patterns of AI, CCPI and normative corundum % show strata-parallel repeats of high index values in the footwall of the Flin Flon Main, 777 and Callinan ore zones that coincide with the upper and lower D3 thrust panels and are conformable to ore-hosting lithofacies (Figure 10 and Figure 11). The conformable relationship between the alteration zones, lithostratigraphic units and shear zones is explained by the transposition of the hydrothermal feeder system as a result of strong non-coaxial deformation during the development of D3 and D4 shear zones, effectively eliminating the angular relationship between the once discordant hydrothermal feeder channels and volcanic strata. Furthermore, the high-intensity alteration zones (both AI and CCPI > 95%) appear to be detached from the ore horizon (Figure 11) and suggest limited displacement of the ore horizon in a northerly direction, which is consistent with the displacement accommodated by D4 shear zones, as estimated from restoring the Callinan ore lenses [15]. In general, the spatial association between the ore horizon and proximal footwall hydrothermal alteration, although it was strongly sheared and transposed has been left intact in the upper D3 thrust panel, resulting in strong transposition of the hydrothermal vent stockwork and the sulfide ore zones.

5. Discussion

The 3D modeling results yield detailed insight into the spatial associations between the sulfide ore lenses, hydrothermal alteration and brittle to ductile shear zones in the Flin Flon mine camp, which allows speculating on the 4D tectonic evolution of the Flin Flon VMS ore system. The 2D map pattern of NE–SW and N–S trending faults splays was previously interpreted to result from a single event of thrust faulting [23,53,54,55]. The tightly-constrained 3D models of these faults, however, show that two distinct intersecting sets of relatively planar thrust faults are required to accommodate, in addition to the 500 m displacement of the ore horizon in westerly direction, 165–400 m of displacement of the Millrock member and the ore lenses hosted within it in a northerly direction, consistent with kinematic analysis of the D4 faults in underground mine workings [15]. This kinematic interpretation is also consistent with sinistral transcurrent reactivation of N–S trending D3 thrust faults during north-directed transport along the S–SSE dipping D4 thrust faults, as reported in [16]. This example serves to illustrate that the degrees of freedom in interpreting structural geometry and topological relationships between principal structures controlling the disposition of the VMS ore lenses, can be significantly reduced when incorporating the third dimension.
The AI and normative corundum percentages consistently show high values in the proximal footwall of the ore lenses. These co-located zones are confined to the footwall of the VMS deposits and do not occur where D4 shear zones transect hanging wall formations. This preservation of lithogeochemical signatures typical for proximal footwall hydrothermal alteration, suggests that the AI and corundum indices are effective tools in mapping the primary lithogeochemical signatures of Na-depleting hydrothermal alteration reactions, even when the hydrothermal vent stockwork was strongly transposed along ductile shear zones. High CCPI values, on the other hand, are not only confined to these footwall proximal alteration zones but are also spatially associated with segments of D3 and D4 shear zones that crosscut the hanging wall of the VMS ore zone. Chlorite phyllonite in the footwall of the ore horizon show a wide range of AI and normative corundum percentages, including those that are typical for least-altered rocks (Figure 3). Contrary to the mineral zoning shown in standard models of hydrothermal alteration in the footwall of VMS ore systems [1,2,3], chlorite is not confined to a central proximal zone surrounded by sericite, but shows a more laterally extensive overlapping distribution along the D3 and D4 shear zones (Figure 9d). These findings suggest that the zones of high CCPI were formed by metamorphic new growth of chlorite, which on the basis of the wide ranges in AI and normative corundum values (Figure 3) occurred in both least-altered to strongly-hydrothermally-altered rocks. This finding is consistent with the widespread occurrence of chlorite with compositions that suggest a metamorphic origin [32]. However there is anomalous Fe- and Mg-rich chlorite in interpillow mafic tuff and hyaloclastite in the lower parts of the hanging wall stratigraphy, which although formed by the metamorphic recrystallization of chlorite, initially crystallized from hydrothermal fluids [31,32].
Figure 12 illustrates a hypothetical sequence of events in the tectonic evolution of the Flin Flon VMS ore system that highlights the localization of high shear strain in the sulfide ore horizon and associated footwall hydrothermal alteration. A tentative reconstruction of the pre-tectonic configuration of the ore system is shown in Figure 12a. Detailed outcrop mapping [26] and lithofacies modeling [46] show that the Flin Flon Main deposit is located between the rhyolite dome and margin of a subsidence structure (e.g., Cauldron). Both the Callinan and 777 deposits formed on the more distal basin side of this rhyolite dome complex. Lateral lithofacies variations from proximal massive 777 to distal breccia sulfide ore of the Callinan lenses, tuff breccia to bedded tuff and the transition of Callinan and 777 sulfide ore into mineralized argillite, corroborate this paleogeographic reconstruction of the VMS ore system. Conspicuous Cu/(Cu + Zn) ore metal zoning of the VMS deposits suggests that both the Flin Flon main and 777 deposits were formed at hydrothermal vents in contrast to Callinan ore where such metal zoning is weak and predominantly absent [5]. After two phases of regional-scale folding associated with accretionary tectonism, the ore horizon was stacked during W-vergent D3 thrusting after uplift and deposition of the molasse deposits of the Missi Group. The tectonic stacking of the ore horizon most likely occurred in a dominantly brittle deformation regime (with the exception of the ductile base-metal sulfides at the base of the ore lenses and the phyllosilicate-rich hydrothermal alteration vents). Restoring the Callinan breccia ore lenses in the lower thrust panel with the ones in the upper thrust panel yields a minimum displacement of 750 m [17]. Tectonic stacking of VMS ore tends to occur under low-grade metamorphic conditions with pyrite behaving in a brittle manner. Under these conditions, there is a strong contrast in rheologic properties between the relative incompetent phyllosilicate-rich footwall hydrothermal alteration zone and sulfide ore of the stringer zones and weakly altered volcanic rocks in the hanging wall of the VMS ore system. Discrete tectonic contacts observed in the mine workings and drill core are consistent with brittle deformation conditions during D3 and possibly partly preserved the angular relationships between the hydrothermal vents, the massive sulfide ore and strata [15]. This interpretation is also consistent with the relatively small gap in age between D3 thrust imbrication of Missi Group sediments with rocks of the Flin Flon arc assemblage, as constrained by the ca. 1842 Ma age of the Boundary intrusions and the ca. 1847 Ma youngest detrital zircon in the Missi metasedimentary rocks [16,56], suggesting that D3 thrusting affected shallow crustal levels approximately coeval with the deposition of detritus during the tectonic uplift of the Flin Flon arc assemblage. Although the D3 thrust faults locally display strike-lineated LS fabrics, this ductile fabric was formed later during north-directed D4 thrusting when the D3 thrust faults were reactivated as tear faults with a sinistral sense of displacement [16]. These tear faults are intruded by dykes that yield younger ages [56] with respect to the minimum age constraints for D3 thrust faulting [16], which is also consistent with the reactivation of D3 thrust faults during north-directed D4 thrusting [16]. Although the majority of host rocks and ore minerals (magnetite, pyrrhotite, pyrite) were deformed under brittle conditions, chalcopyrite, sphalerite and phyllosilicates in the stringer zones likely behaved in a ductile manner and contributed to a strong rheologic contrast between the ore zone and host rocks, resulting in localized nucleation of brittle-ductile D3 shear zones. Although overall, D3 detachments preferentially developed at the base of the mine horizon, they locally climb up through the mine horizon, involving the underlying Blue Lagoon member and overlying Hidden formation in the thrust imbrication (Figure S1), [17]. This suggests that the strain was heterogeneously distributed across the ore zone and its host rocks [17]. The significant displacement along the D3 thrust faults, as constrained by the minimum displacement required to restore the VMS ore lenses in the hanging wall and footwall of the upper D3 thrust fault (Figure 5, inset and Figure S1) should be considered when applying ore vectoring methods based on hanging wall hydrothermal alteration signatures.
The VMS ore zone and their host rocks were re-imbricated, as a result of northward-directed thrusting and crustal thickening (Figure 12c), [17]. The style of deformation during this second D4 thrusting event and the nature of the L4 mineral lineation defined by recrystallized feldspar and quartz, biotite and actinolite is consistent with ductile deformation under high-grade greenschist to lower amphibolite conditions, at depths that were significantly below the brittle-ductile transition (i.e., >10 km). The contrast between the rheologic properties of the ore and footwall hydrothermal alteration zone was much reduced during D4, and explain the following aspects in D4 deformation: (1) transposition of the strata, sulfide ore and hydrothermal vent system, (2) strong elongation of the ore lenses and formation of sheath folds plunging parallel to the L4 lineation and (3) localized stacking and dismembering of sulfide ore in lenses between D4 shear zone splays (4) mylonitized bases of sulfide ore lenses in contact with chlorite-rich phyllonite. The Flin Flon Main deposit, on the other hand, has a much lower aspect ratio because it was not that strongly affected by D4 deformation, being located at a larger distance from D4 shear zones (and being protected in a strain shadow of the rhyolite dome complex that hosts the deposit). Contrary to the D3 thrusts, the offsets of the sulfide ore horizon accommodated by individual D4 splays was limited (up to a few hundreds of meters), which is in agreement with the amount of northward displacement of 777 and Callinan ore lenses with respect to the transposed high-intensity alteration zones shown (Figure 11, inset). The ductile deformation regime during D4 resulted in a network of anastomosing splays separating shear lenses of sulfide ore and host rocks with transposed hydrothermal alteration zones at their base. In contrast to D3, tectonic stacking during D4 occurred only locally within the ore zone, limiting discrete offsets between shear lenses of sulfide ore to a maximum of 400 m. Instead, thinning and transposition of the ore zone with phyllosilicate host rocks were the dominant processes. This plastic deformation resulted in the modification of the primary alteration mineral assemblage, including laterally extensive metamorphic new growth of chlorite ± biotite without completely obliterating the lithogeochemical signatures associated with seafloor hydrothermal alteration. The ductile style of D4 deformation with plastic deformation and transposition dominant over tectonic stacking explains why, despite the polyphase deformation history of thrusting, the most proximal parts of the footwall hydrothermal vent system, remained attached to the ore zone (Figures S1, Figure 8 and Figure 9). Similar relationships between deformation style and inferred crustal depth as described here for the Flin Flon VMS deposit, were encountered in comparative studies of VMS deposits in the Iberian pyrite belt (IPB) and Cabo Ortegal Complex (COC) in NW Iberia. Whereas tectonic stacking was significant in the low grade metamorphic setting of the IPB, it was largely absent in the COC, where the dominant deformation processes were isoclinal folding, metamorphic recrystallization and transposition [13]. These studies, similarly to the integrated interpretation presented in this paper, suggest that early thrust faulting in brittle and brittle-ductile deformation regimes control the main imbrication and stacking of the sulfide ore zone on multiple structural levels.

6. Conclusions

3D integrated modeling of structural and lithogeochemical data show that the Flin Flon VMS ore zone and associated footwall hydrothermal alteration locally exerted strong control on the geometry and style of deformation associated with the collisional orogenic deformation history of the Flin Flon greenstone belt. The hydrothermally-altered phyllosilicate-rich footwall of the VMS ore zone localized detachment associated with D3 W-vergent thrusting of the D2 Hidden Lake syncline, resulting in a regional-scale stacking of the northern orebodies, with the greatest part of the Callinan and 777 ore zones being transported to the hanging wall of this detachment. Deformation at deeper crustal levels during later deformation (D4) was penetrative throughout the ore zone and most proximal footwall hydrothermal alteration. This ductile phase of deformation resulted in the elongation of the ore lenses parallel to a regional SE-plunging stretching lineation and formation of a chlorite-rich transposition fabric with only limited stacking of ore lenses along individual splays of D4 shear zones. Lithogeochemical signatures of primary hydrothermal alteration, although overprinted by metamorphic new growth of chlorite, are locally preserved at the base of the sheared ore lenses. The structural configuration revealed in this 3D modeling study has important implications for ore vectoring. The down-plunge extension of the ore zone in both the upper and lower D3 thrust panel, provide commendable exploration targets, particularly when considering that the down-dip intersection of the D3 thrust fault with the ore zone has not yet been established by drilling.

Supplementary Materials

The following are available online at www.mdpi.com/2075-163X/8/1/3/s1, Figure S1: 3D geological model of the Flin Flon mine camp; Table S1: Lithogeochemical data of the footwall of the Flin Flon VMS deposits.

Acknowledgments

We gratefully acknowledge the support of Hudbay Minerals Inc. in providing access to the drillhole data of the Flin Flon mine camp and for sharing their expertise on the Flin Flon VMS deposits. We also acknowledge funding of this research by Natural Resources Canada’s Targeted Geoscience Initiative program (phase 3) and thank all colleagues and collaborators involved, for sharing their knowledge and interpretation of the geology of the Flin Flon mine camp. We are grateful to two anonymous reviewers and Wouter Bleeker for their insightful comments and suggestions, which led to significant improvements of this manuscript.

Author Contributions

E.S. and D.A. computed the alteration indices and interpreted the alteration trends shown on the alteration box plot; E.G. computed normative corundum percentages from the drill core samples and interpreted the results. E.S. generated the 3D model elements (e.g., wireframe surfaces, drillhole logs and grid models of alteration indices) that supported the interpretation presented in this study. D.A. provided additional unpublished materials that contributed to the interpretations presented in this paper. E.S. wrote the paper, with the exception of the section on normative corundum percentages, which was written by E.G.

Conflicts of Interest

The authors declare no conflict of interest. Authors must identify and declare any personal circumstances or interest that may be perceived as inappropriately influencing the representation or interpretation of reported research results.

References

  1. Franklin, J.M.; Gibson, H.L.; Jonasson, I.R.; Galley, A.G. Volcanic-associated massive sulfide deposits. Econ. Geol. 2005, 100, 523–560. [Google Scholar]
  2. Franklin, J.M.; Sangster, D.F.; Lydon, J.W. Volcanic-associated massive sulfide deposits. Econ. Geol. 1981, 75, 485–627. [Google Scholar]
  3. Lydon, J.W. Volcanogenic massive sulfide deposits, Part 2: Genetic models. Geosci. Can. 1988, 3, 155–182. [Google Scholar]
  4. Large, R.R.; Gemmell, J.B.; Paulick, H. The alteration box plot: A simple approach to understand the relationship between alteration mineralogy and lithogeochemistry associated with volcanic-hosted massive sulfide deposits. Econ. Geol. 2001, 96, 957–971. [Google Scholar] [CrossRef]
  5. Ishikawa, Y.; Sawaguchi, T.; Iwaya, S.; Horiuchi, M. Delineation of prospecting targets for Kuroko deposits based on modes of volcanism of underlying dacite and alteration halos. Min. Geol. 1976, 26, 105–117. [Google Scholar] [CrossRef]
  6. Saeki, Y.; Date, J. Computer applications to alteration data of the footwall dacite lava at the Ezuri Kuroko deposits. Min. Geol. 1980, 30, 241–250. [Google Scholar] [CrossRef]
  7. Lentz, D.R. Petrology, geochemistry and oxygen isotope interpretation of felsic volcanic and related rocks hosting the Brunswick 6 and 12 massive sulfide deposits (Brunswick belt) Bathurst mining camp, New Brunswick, Canada. Econ. Geol. 1999, 94, 57–86. [Google Scholar] [CrossRef]
  8. Brauhart, C.W.; Huston, D.L.; Andrew, A.S. Oxygen isotope mapping in the Panorama VMS district, Pilbara Craton, Western Australia: Applications to estimating temperatures of alteration and to exploration. Miner. Depos. 2000, 35, 727–740. [Google Scholar] [CrossRef]
  9. Dubé, B.; Mercier-Langevin, P.M.; Hannington, M.; Lafrance, B.; Gosselin, G.; Gosselin, P. The LaRonde Penna world-class Au-rich volcanogenic massive sulfide deposit, Abitibi Quebéc: Mineralogy and geochemistry of alteration and implications for genesis and exploration. Econ. Geol. 2007, 102, 633–666. [Google Scholar] [CrossRef]
  10. Van Staal, C.R.; Williams, P. Structure, origin and concentration of the Brunswick 12 and 6 orebodies. Econ. Geol. 1984, 79, 1669–1692. [Google Scholar] [CrossRef]
  11. Bleeker, W.; Parrish, R.R. Stratigraphy and U-Pb zircon geochronology of Kidd Creek: Implications for the formation of giant volcanogenic massive sulfide deposits and the tectonic history of the Abitibi greenstone belt. Can. J. Earth Sci. 1996, 1213–1231. [Google Scholar] [CrossRef]
  12. Lentz, D.R.; van Staal, C.R. Predeformational origin of massive sulfide mineralization and associated footwall alteration at the Brunswick 12 Pb-Zn-Cu deposit, Bathurst, New Brunswick: Evidence from the porphyry dike. Econ. Geol. 1995, 90, 453–463. [Google Scholar] [CrossRef]
  13. Castroviejo, R.; Quesada, C.; Soler, M. Post-depositional tectonic modification of VMS deposits in Iberia and its economic significance. Miner. Depos. 2011, 46, 615–637. [Google Scholar] [CrossRef] [Green Version]
  14. Franklin, J.M. Lithogeochemical and mineralogical methods for base metal and gold exploration. In Proceedings of Exploration 97: Fourth Decennial International Conference on Mineral Exploration; Gubins, A.G., Ed.; Prospectors and Developers Association of Canada: Toronto, ON, Canada, 1997; pp. 191–208. [Google Scholar]
  15. Tessier, A.C.; O’Donnell, J.J. Callinan/777 Deposit. Compilation and Target Generation Project. Unpublished Report. 2001. [Google Scholar]
  16. Lafrance, B.; Gibson, H.L.; Pehrsson, S.; Schetselaar, E.; DeWolfe, Y.M.; Lewis, D. Structural reconstruction of the Flin Flon volcanogenic massive sulfide mining district, Saskatchewan and Manitoba, Canada. Econ. Geol. 2016, 111, 849–875. [Google Scholar] [CrossRef]
  17. Schetselaar, E.; Pehrsson, S.; Devine, C.; Lafrance, B.; White, D.; Malinoswki, M. 3-D geological modelling in the Flin Flon mining district, Trans-Hudson Orogen, Canada: Evidence for polyphase imbrication of the Flin Flon-777-Callinan volcanogenic massive sulfide ore system. Econ. Geol. 2016, 111, 877–901. [Google Scholar] [CrossRef]
  18. Simard, R.-L.; MacLachlan, K.; Gibson, H.L.; DeWolfe, Y.M.; Devine, C.; Kremer, P.D.; Lafrance, B.; Ames, D.E.; Syme, E.C.; Bailes, A.H.; et al. Geology of the Flin Flon Area, Manitoba and Saskatchewan (Part of NTS 63K12, 13). Manitoba Innovation, Energy and Mines, Manitoba Geological Survey, Geoscientific Map MAP2010-1 and Saskatchewan Ministry of Energy and Resources, Geoscience Map 2010-2, 1 Colour Map, Scale 1:10000. Available online: http://publications.gov.sk.ca/documents/310/37248-GM2010-2_Flin_Flon.pdf (accessed on 20 December 2017).
  19. White, D.J.; Malinowski, M.; Devine, C.; Gilmore, K.; Schetselaar, E.; Pehrsson, S. Drill targeting with 3-D seismics for volcanogenic massive sulfide exploration in the Flin Flon mining camp. Econ. Geol. 2016, 111, 903–912. [Google Scholar] [CrossRef]
  20. Schetselaar, E.; Currie, M.; Pehrsson, S.; Devine, C.; Mwenifumbo, J. 3D Drillhole and Geologic Map Database of the Flin Flon Mining District, Manitoba and Saskatchewan. Geol. Surv. Can. 2011, 33. [Google Scholar] [CrossRef]
  21. Corrigan, D.; Pehrsson, S.; Wodicka, N.; de Kemp, E. The Paleoproterozoic Trans-Hudson Orogen: A prototype of modern accretionary processes. In Ancient Orogens and Modern Analogues; Murphy, J.B., Keppie, J.D., Hynes, A.J., Eds.; Geological Society, London, Special Publications: London, UK, 2009; Volume 327, pp. 457–479. [Google Scholar]
  22. Stern, R.A.; Syme, E.C.; Lucas, S.B. Geochemistry of 1.9 Ga MORB- and OIB-lie basalts from the Amisk collage, Flin Flon belt, Canada: Evidence for an intra-oceanic origin. Geochim. Cosmochim. Acta 1995, 59, 3131–3154. [Google Scholar] [CrossRef]
  23. Syme, E.C.; Lucas, S.B.; Bailes, A.H.; Stern, R.A. Contrasting arc and MORB-like assemblages in the Paleoproterozoic Flin Flon belt, Manitoba, and the role of intra-arc extension in localizing volcanic-hosted massive sulfide deposits. Can. J. Earth Sci. 1999, 36, 1767–1788. [Google Scholar] [CrossRef]
  24. Syme, E.C.; Bailes, A.H. Stratigraphic and tectonic setting of Early Proterozoic volcanogenic massive sulfide deposits, Flin Flon, Manitoba. Econ. Geol. 1993, 88, 566–589. [Google Scholar] [CrossRef]
  25. Bamburak, J.D. Metallic Mines and Mineral Deposits of Manitoba; Open File Report OF90-2; Manitoba Energy and Mines: Winnipeg, MB, Canada, 1990; p. 105.
  26. Thomas, D.J. New perspectives on the Amisk Group and regional metallogeny, Douglas Lake-Phantom Lake area, northern Saskatchewan. In Summary of Investigations 1990, Saskatchewan Geological Survey; Miscellaneous Report 90-4; Saskatchewan Energy and Mines: Saskatoon, SK, Canada, 1990; pp. 13–20. [Google Scholar]
  27. Jonasson, I.R.; Ames, D.E.; Galley, A.G. Sulfide Ore Geochemistry Database for Volcanogenic Massive Sulfide Deposits of the Paleoproterozoic Flin Flon belt. Geol. Surv. Can. 2009. [Google Scholar] [CrossRef]
  28. Devine, C.A.; Gibson, H.L.; Bailes, A.H.; MacLachlan, K.; Gilmore, K.; Galley, A.G. Stratigraphy of VMS-Hosting Volcanic and Volcaniclastic Rocks of the Flin Flon Formation, Flin Flin-Creighton Area, Saskatchewan and Manitoba. Available online: http://publications.gov.sk.ca/documents/310/88725-devine.pdf (accessed on 20 December 2017).
  29. Gibson, H.L.; Lafrance, B.; DeWolfe, M.; Devine, C.; Gilmore, K.; Pehrsson, S. Volcanic Reconstruction and Post Depositional Modification of a Cauldron Subsidence Structure within the Flin Flon VMS District. In Prospectors and Development Association of Canada (PDAC) Technical Session Presentation: Flin Flon: New Developments in an Old Camp; Prospectors and Development Association of Canada (PDAC): Toronto, ON, Canada, 2009. [Google Scholar]
  30. DeWolfe, Y.M.; Gibson, H.L.; Lafrance, B.; Bailes, A.H. Volcanic reconstruction of Paleoproterozoic arc volcanoes: The Hidden and Louis formations, Flin Flon, Manitoba, Canada. Can. J. Earth Sci. 2009, 46, 481–508. [Google Scholar] [CrossRef]
  31. Ames, D.E.; Galley, A.G.; Taylor, B.T.; Kjarsgaard, I.M.; Tardif, N. Hanging wall vectoring for buried VMS deposits, Paleoproterozoic Flin Flon mining camp, Manitoba, Canada. Econ. Geol. 2016, 111, 963–1000. [Google Scholar] [CrossRef]
  32. Starr, P.G. Sub-Greenschist to Lower Amphibolite Facies Metamorphism of Basalts: Examples from Flin Flon, Manitoba and Rossland, Britisch Columbia. Ph.D. Thesis, University of Calgary, Calgary, AB, Canada, January 2017; p. 495. [Google Scholar]
  33. Galley, A.G.; Syme, E.C.; Bailes, A.H. Metallogeny of the Paleoproterozoic Flin Flon belt, Manitoba and Saskatchewan; Geological Association of Canada, Mineral Deposits Division: St. John’s, NL, Canada, 2007; Special Publication 5; pp. 533–552. [Google Scholar]
  34. Best, M.G. Igneous and Metamorphic Petrology, 2nd ed.; Wiley-Blackwell: Malden, MA, USA, 2003; p. 752. ISBN 1405105887. [Google Scholar]
  35. Kampmann, T.C.; Jansson, N.F.; Stephens, M.B.; Majka, J.; Lasskogen, J. Systematics of hydrothermal alteration at the Falun base metal sulfide deposit and implications for ore genesis and exploration, Bergslagen ore district, Fennoscandian Shield, Sweden. Econ. Geol. 2017, 112, 1111–1152. [Google Scholar] [CrossRef]
  36. Knuckey, M.J.; Comba, C.D.A.; Riverin, G. Structure, metal zoning and alteration at the Millenbach deposit, Noranda, Quebec. In Precambrian Sulfide Deposits; Hutchinson, R.W., Spence, C.D., Franklin, J.M., Eds.; Geological Association of Canada: St John’s, NL, Canada, 1982; Special Paper 25; pp. 256–295. [Google Scholar]
  37. Piché, M.; Jébrak, M. Normative minerals and alteration indices developed for mineral exploration. J. Geochem. Explor. 2004, 82, 59–77. [Google Scholar] [CrossRef]
  38. Banks, R. The Use of linear programming in the analysis of penological mixing problems. Contrib. Mineral. Petrol. 1979, 70, 237–244. [Google Scholar] [CrossRef]
  39. De Caritat, P.; Bloch, J.; Hutcheon, I. LPNORM: A linear programming normative analysis code. Comput. Geosci. 1994, 20, 313–347. [Google Scholar] [CrossRef]
  40. Paktunc, A.D. MODAN: An interactive computer program for estimating mineral quantities based on bulk composition. Comput. Geosci. 1998, 24, 425–431. [Google Scholar] [CrossRef]
  41. Herrmann, W.; Berry, R.F. MINSQ—A least squares spreadsheet method for calculating mineral proportions from whole rock element analysis. Geochem. Explor. Environ. Anal. 2002, 2, 361–368. [Google Scholar] [CrossRef]
  42. Posch, M.; Kurz, D. A2M—A program to compute all possible mineral modes from geochemical analyses. Comput. Geosci. 2007, 33, 563–572. [Google Scholar] [CrossRef]
  43. Grunsky, E.C. Recognition of alteration in volcanic rocks using statistical analysis of lithogeochemical data. J. Geochem. Explor. 1986, 25, 157–183. [Google Scholar] [CrossRef]
  44. Grunsky, E.C. Recognition of alteration and mineralization in volcanic terrains. In Proceedings of the International Volcanological Congress, Symposium: Volcanism, Hydrothermal Systems & Related Mineralization, Auckland, New Zealand, 1–9 February 1986; Volume 5, pp. 51–56. [Google Scholar]
  45. Harris, J.R.; Wilkinson, L.; Grunsky, E.C. Effective use and interpretation of lithogeochemical data in regional mineral exploration programs: Application of geographic information systems (GIS) technology. Ore Geol. Rev. 2000, 16, 107–143. [Google Scholar] [CrossRef]
  46. Hyslop, N.P.; White, W.H. Estimating precision using duplicate measurements. J. Air Waste Manag. Assoc. 2009, 59, 1032–1039. [Google Scholar] [CrossRef] [PubMed]
  47. Schetselaar, E. Mapping the 3D lithofacies architecture of a VMS ore system on a curvilinear-faulted grid: A case study from the Flin Flon mining camp, Canada. Ore Geol. Rev. 2013, 53, 261–275. [Google Scholar] [CrossRef]
  48. Mallet, J.L. Space-time mathematical framework for sedimentary geology. Math. Geol. 2004, 36, 1–32. [Google Scholar] [CrossRef]
  49. Jayr, S.; Gringarten, E.; Tertois, A.L.; Mallet, J.L.; Dulac, J.C. The need for a correct geological modelling support: The advent of the UVT-transform. First Break 2008, 26, 73–79. [Google Scholar]
  50. Chiles, J.P.; Delfiner, P. Geostatistics: Modelling Spatial Uncertainty; Wiley: Hoboken, NJ, USA, 1999; p. 695. ISBN 0471083151. [Google Scholar]
  51. Ames, D.E.; Tardif, N.; MacLachlan, K.; Gibson, H.L. Geology and Hydrothermal Alteration of the Hanging Wall Stratigraphy to the Flin Flon—777-Callinan Volcanogenic Massive Sulfide Horizon (NTS 63K12NW and 13 SW); Report of Activities; Manitoba Industry, Trade and Mines, Manitoba Geological Survey: Flin Flon Area, MB, Canada, 2002; pp. 20–34. [Google Scholar]
  52. Byron, J.; Schetselaar, E.; Gibson, H.; Pehrsson, S.; Lafrance, B.; Devine, C.; Ames, D. 3D Reconstruction of Base Metal Zoning in the Flin Flon—Callinan-777 Volcanogenic Massive Sulfide Deposits, Manitoba. Geol. Surv. Can. 2014. [Google Scholar] [CrossRef]
  53. Fedorowich, J.S.; Kerrich, R.; Stauffer, M. Geodynamic evolution and thermal history of the central Flin Flon Domain, Trans-Hudson Orogen: Constraints from structural development, Ar/Ar, and stable isotope geothermometry. Tectonics 1995, 14, 472–503. [Google Scholar] [CrossRef]
  54. Gale, D.F.G.; Lucas, S.B.; Dixon, J.M. Structural relations between the polydeformed Flin Flon arc assemblage and Missi Group sedimentary rocks, Flin Flon area, Manitoba and Saskatchewan. Can. J. Earth Sci. 1999, 36, 1901–1915. [Google Scholar] [CrossRef]
  55. Thomas, D.J. Highlights of investigations around the Flin Flon mine: reassessment of structural history. In Summary of Investigations 1992, Saskatchewan Geological Survey Saskatchewan Energy and Mines; Miscellaneous Report 92-4; Saskatchewan Energy and Mines: Saskatoon, SK, Canada, 1992; pp. 3–15. [Google Scholar]
  56. Rayner, N. New U-Pb zircon ages from the Flin Flon Targeted Geoscience Initiative Project 2006–2009: Flin Flon and Hook Lake blocks, Manitoba and Saskatchewan. Geol. Surv. Can. 2010, 4, 15. [Google Scholar] [CrossRef]
Figure 1. Generalized geological map of the Flin Flon greenstone belt after [33], illustrating the tectonostratigraphic assemblages, the location of the various accretionary assemblages, and major mineral deposits. B = Birch Lake assemblage; FMI = Fourmile Island assemblage; ML = Morton Lake fault zone; S = Sandy Bay assemblage; TB = Tabernor fault zone. The rectangle shows the location of the Flin Flon mining camp.
Minerals 08 00003 g001
Figure 2. Geological map of the Flin Flon mining camp (generalized after [18]). Black circles indicate location of VMS deposits: C = Callinan, F = Flin Flon Main, T = 777, S = Schist Lake deposit. Boxes with diagonal black and white triangles indicate location of mine shafts: N = North Main, S = South Main, T = 777. Abbreviations for fault and fold structures: LCF = Lower Catherine fault, LRF = Lower Railway fault, BRA = Beaver Road anticline, CLS = Carlisle Lake anticline, FFCS = Flin Flon Creek syncline, GLS = Grand Lake Syncline, MRA = Mandy Road anticline, MLS = Mud Lake syncline, PLS = Pipe Line syncline. Line A–A′ = cross-sections shown in Figure 9.
Minerals 08 00003 g002aMinerals 08 00003 g002b
Figure 3. Alteration box plots for footwall outcrop and drillhole samples of the Flin Flon, Callinan and 777 VMS deposits with color symbolization for normative corundum percentages; (a) mafic volcanic host rocks; (b) felsic volcanic host rocks. Rectangles represent least altered volcanic host rocks; numbered arrows represent trend lines associated to particular styles of hydrothermal alteration (after [4]). (1) weak sericite alteration at margins of hydrothermal system; (2) intense proximal footwall sericite-chlorite + pyrite alteration; (3) chlorite-dominated chlorite + sericite + pyrite footwall alteration (both in mafic and felsic volcanic rocks). Purple open diamonds in Figure 3b are alteration box plot coordinates of photomicrographs of felsic volcanic rocks shown in Figure 4.
Minerals 08 00003 g003
Figure 4. Photomicrographs in cross-polarized light of (a) least -altered rhyolite; (b) intensely altered rhyolite. Note strongly-developed foliation in altered rhyolite defined by ribbons with sutured quartz grains and preferred orientation of chlorite. Inset shows values of alteration indices (AI and CCPI) and normative corundum percentages. AI and CCPI alteration box plot coordinates of these samples are shown in Figure 3.
Minerals 08 00003 g004
Figure 5. 3D view of sulfide ore lenses and lithostratigraphic reference holes of the 777 and Callinan VMS deposits along inclined N–S section. Note regional-scale structural repeats of lithostratigraphic units, including the sulfide-mineralized argillite horizon and the massive sulfide ore lenses. White dashed lines indicate traces of e D3 thrust faults. Inset shows view from the north of 3D-modelled surfaces of the thrust-imbricated tops of the Millrock member (Millrock mbr. FW imbr. and Millrock mbr. HW imbr.) with the ore lenses of the 777, Callinan East and Callinan South deposits. UTP FLT: Upper Tailings Pond thrust fault; FFL-LTP FLT: Flin Flon Lake-Lower Tailings Pond thrust fault. Note duplication of the massive sulfide ore zone, with the Callinan North and Callinan South lenses in the footwall and the Callinan East and 777 lenses in the hanging wall of the Upper Tailing pond D3 thrust fault.
Minerals 08 00003 g005
Figure 6. Photographs (from outcrops and mine workings) of rock fabrics in D4 shear zones. (a) SSE plunging dip-lineated LS fabric of chlorite and quartz at Club Lake Fault contact between metabasalt of the Hidden formation (hanging wall) and Missi Group metasedimentary rocks in the footwall (view towards SW); (b) Infolding of meta-arkose (buff to white) of the Missi Group (north) and metabasalt of the Hidden formation (south) at the Club Lake Fault zone (downward view). The mineral-stretching lineation shown in Figure 6a, is parallel to the fold axis; (c) Exposed trace of the Upper Railway shear zone (view towards SE). Note strong development of foliation and sigmoidal foliation fish within felsic lapilli tuff and tuff breccia of the Millrock member with numerous sigmoidal quartz segregates overlain by weakly deformed basalt flows of the Hidden formation (Reservoir member). Wire is approximately 5 m in length; (d) Underground exposure of the Lower Railway fault zone in the hanging wall of the 777 deposit (view towards SW). Note strongly developed foliation, quartz segregations, rootless folding and boudinage of quartz veins. Iron frame mesh size is 5 × 5 cm2.
Minerals 08 00003 g006
Figure 7. Outcrop/drill core photographs of tectonic fabrics in sulfide ore and associated footwall hydrothermal alteration. (a) Mylonitic layering in massive sulfide ore lens of the 777 deposit. Note transposition of thin layers of chlorite-actinolite schist (dark green) and quartz veins (white) alternating with banded pyrite ore. Iron frame mesh size is 5 × 5 cm2; (b) Recrystallized mylonitic banding in pyrite-sphalerite ore lens of the Callinan North deposit; (c) Phyllonitic fabric including asymmetric pressure shadows of pyrite around quartz porphyroclasts (probably derived from dynamic recrystallization of quartz-filled amygdules) and magnetite crystals in a fine-grained quartz-chlorite matrix with pyrite-pyrrhotite stringers in hydrothermally-altered felsic volcanic rocks in the footwall of the 777 ore lenses; (d) Strongly-developed stretching lineation (L–S tectonite) defined by linear quartz-chlorite ribbons developed in hydrothermally-altered rhyolite in the footwall of the Callinan North deposit. Note small white feldspar porphyroclasts; (e) fractured pyrite + magnetite in reflected light with chalcopyrite and pyrrhotite plastic injection veins, Flin Flon Main massive sulfide ore; (f) Triple junction annealing fractures showing near 120° dihedral angles in pyrite porphyroblasts (arrows) in reflected light with pyrrhotite + gold and chalcopyrite plastic injection veins from the Callinan deposit;. (g) Rotated albite porphyroblast in cross-polarized light with quartz inclusion trails and sericite-chlorite wings (arrows) in weakly sericite-chlorite altered rhyolite. Note angle between internal foliation in porphyroblast (Si) and external foliation (Se) both defined by preferred orientation of quartz; (h) Extensional crenulation fabric with S plane defined by chlorite and quartz in strongly chlorite-altered rhyolite (apparent sinistral sense of movement).
Minerals 08 00003 g007
Figure 8. 3D models of Cu/(Cu + Zn) metal zoning in the Flin Flon massive sulfide ore lenses after [52]. Note the strong elongation but intact metal zoning pattern in the 777 and Callinan East ore lenses in parallel orientation to their elongation (which in turn parallels the L4 regional mineral-stretching lineation). This suggests that the massive sulfide ore, on the scale of individual ore lenses, deformed in a relatively homogeneous ductile flow regime.
Minerals 08 00003 g008
Figure 9. NNW-SSE oriented cross sections (Line A–A′ on Figure 2) showing alteration index values computed from drillhole lithogeochemistry on top of the modelled geological structure. (a) CCPI alteration index; (b) AI alteration index; (c) Normative corundum percentage; (d) Occurrences of metamorphic or alteration mineral species from geological log descriptions, including sericite and chlorite. See text for further details on the interpretation.
Minerals 08 00003 g009
Figure 10. Grid pane 3D visualization of the AI alteration index, interpolated on a curvilinear-faulted grid conformable to the structure of the Flin Flon VMS ore system. (a) Grid panes shown together with wire frame models of ore lenses; (b) as (a) with transparent wire frame surface of the D3 Flin Flon Lake Fault; (c) as (b) with transparent visualization of the D3 Upper Tailing Pond Fault; (d) as (c) with transparent surface visualization of D4 shear zones. See text for further details on the interpretation.
Minerals 08 00003 g010
Figure 11. 3D perspective view of isovalue shells defined by domains where the CCPI and AI alteration indices both exceed 95%. These domains represent areas of intense hydrothermal alteration that were stacked and transposed by D3 and D4 episodes of thrust faulting (inset shows view from the top). UTP FLT. = Upper Tailings Pond fault, FFL-LTP FLT = Flin Flon Lake-Lower Tailings Pond fault, Call. E. = Callinan East ore zone, Call. N. = Callinan North ore zone, Call. S. = Callinan South ore zone, FF Main = Flin Flon Main ore zone, 777 = Triple-7 ore zone.
Minerals 08 00003 g011
Figure 12. Model of the tectonic evolution of the Flin Flon VMS deposits and associated footwall hydrothermal alteration. (a) Paleogeographic interpretation of the Flin Flon Main, 777 and Callinan VMS deposits; Rectangle corresponds to area shown in Figure 12c (b) Reconstruction of the VMS deposits and associated footwall hydrothermal alteration after W-vergent third deformation phase of thrust stacking in a brittle to brittle-ductile deformation regime; (c) Reconstruction of the VMS ore zone and associated footwall hydrothermal alteration after fourth deformation phase (D4) of ductile shear. See text for further details on the interpretation. FFL-LTPF = Flin Flon Lake-Lower Tailings Pond fault, UTPF = Upper Tailings Pond fault, URF = Upper Railway fault, LRF = Lower Railway fault, UCG = Upper Catherine fault, CLF = Club lake fault, HLS = Hidden Lake syncline.
Minerals 08 00003 g012
Table 1. Relative root mean square errors (RMSE) for total and altered duplicate samples of the Ishikawa index (AI), Carbonate–chlorite–pyrite index (CCPI) and normative corundum % computed from major oxides ICP and XRF geochemical analyses of drill core and outcrop samples from the footwall of the Flin Flon VMS deposits.
Duplicate Error Analysis Alteration IndicesRMSE ICP-ICPnRMSE XRF-XRFnRMSE ICP-XRFBIAS ICP-XRFn
Total
AI%10.8%4319.2%65.1%1.9%72
CCPI%3.8%437.1%62.2%−0.4%71
Norm. Crn. %39.1%1635.3%22.6%24
Altered
AI % > 603.1%81.79%1.22%5
CCPI % > 600.25%272.6450.99%−0.3%60
Norm. Crn. % > 56.7%811.45%11.6%7

