Article

Rheology of Fly Ash Mixed Tailings Slurries and Applicability of Prediction Models

1
Department of Civil Engineering, University of Seoul, 163 Seoulsiripdae-ro, Dongdaemun-gu, Seoul 02504, Korea
2
Department of Civil, Environmental and Construction Engineering, Texas Tech University, Lubbock, TX 79409-1023, USA
3
Department of Marine and Civil Engineering, Chonnam National University, 50 Daehak-ro, Yeosu 59626, Korea
*
Author to whom correspondence should be addressed.
Minerals 2017, 7(9), 165; https://doi.org/10.3390/min7090165
Submission received: 17 August 2017 / Revised: 4 September 2017 / Accepted: 6 September 2017 / Published: 8 September 2017

Abstract

:
Coal fly ash has potential applications in the management of reactive mine tailings. The shear stress versus shear rate curves obtained during viscometer tests are presented to describe the rheological behaviors of tailings slurries mixed with fly ash. The investigation was conducted on specimens prepared with different fly ash additions as well as prepared at variable conditions of temperature, mixing time, and CaCl2 solution. It was observed that the rheological properties of ash-tailings slurry mixtures are influenced by the hydration of fly ash as well as the particle packing and arrangement. Rheological properties of specimen mixtures were determined from the resulting flow curves using the existing rheological models. The performance of prediction models in calculating the rheological properties of the mixed specimens, as quantified by the root mean square error (RMSE), varied with the mixture constituents, temperature, and time. In general, the Papanastasion, Herschel-Bulkley, Sisko, and Robertson-Stiff models were found to be favorable for use with mixtures of fly ash and tailings slurries, compared to the Bingham, Modified Bingham, Casson, and De Kee models.

1. Introduction

Mining operations invariably result in a vast amount of milling wastes. Tailings are fine-grained materials that remain after valuable metals and minerals have been extracted from ore. They are typically in the form of a slurry that is deposited hydraulically in tailings dams and in-pit impoundments. How to produce the desired flow and material characteristics of the tailings is a major issue facing mining and mineral processing industry. Knowledge regarding the rheological behavior of tailings slurry is necessary to establish the most appropriate conditions for handling and transportation. In addition to the efficient fluidity of the tailings, another challenge of the tailings management is to reduce their environmental impacts. The tailings that contain a variety of residual sulphides may generate the acid rock drainage (ARD) from the oxidation of sulphides, leading to the heavy metal contamination of surface water and groundwater. The reactive tailings can be stabilized by incorporating agents such as cement, lime, fly ash, and organic matters [1,2]. Both tailings and fly ash can be used as the main ingredients in paste backfill production in order to reduce their high volume [3].
Previous studies [4,5,6,7] have shown that the rheology of mineral-water mixtures including tailings slurry and paste is dependent on the size, shape, grade, and surface properties of particles, mineral constituents, solid content, pore fluid chemistry, and chemical additives. However, the rheological investigation of the tailings slurry mixed with fly ash as an additive has attracted only limited attention. Coal fly ash is a coal combustion byproduct, which can be used alone or as an admixture in tailings managements due to its cementitious and alkaline nature [8,9,10,11,12,13,14]. Stanmore and Page [15] measured the yield stress of dense fly ash slurries by a vane technique and stated that the yield stress increased with time owing to the pozzolanic reaction of precipitated calcite. Mahlaba [16] studied the yield stress of saline fly ash paste and noted that the higher salinity in fly ash pastes becomes less flowable paste. Simon and Grabinsky [17] analyzed the apparent yield stress of cemented tailings paste with fly ash and stated that the apparent yield stress increases upon the addition of fly ash due to improved particle packing. Recently, Haiqiang et al. [7] examined the effect of fly ash on the yield stress of cemented tailings paste and demonstrated that the replacement of cement with fly ash can enhance the transportability of the cemented tailings paste.
In this study, the shear stress-shear rate data are measured for fly ash mixed tailings slurries with different concentrations of fly ash. The variables investigated also include temperature, mixing time, and calcium chloride concentration. The rheological properties of ash-tailings slurries are estimated using various rheological models to fit flow curves, and the suitability of rheological models adopted for their calculation is assessed in terms of the root mean square error (RMSE). The present study allows a better understanding of the slurry compositions, temperature, and time effects on the rheology of ash-tailings slurries, which is useful for the design of slurry mixtures.

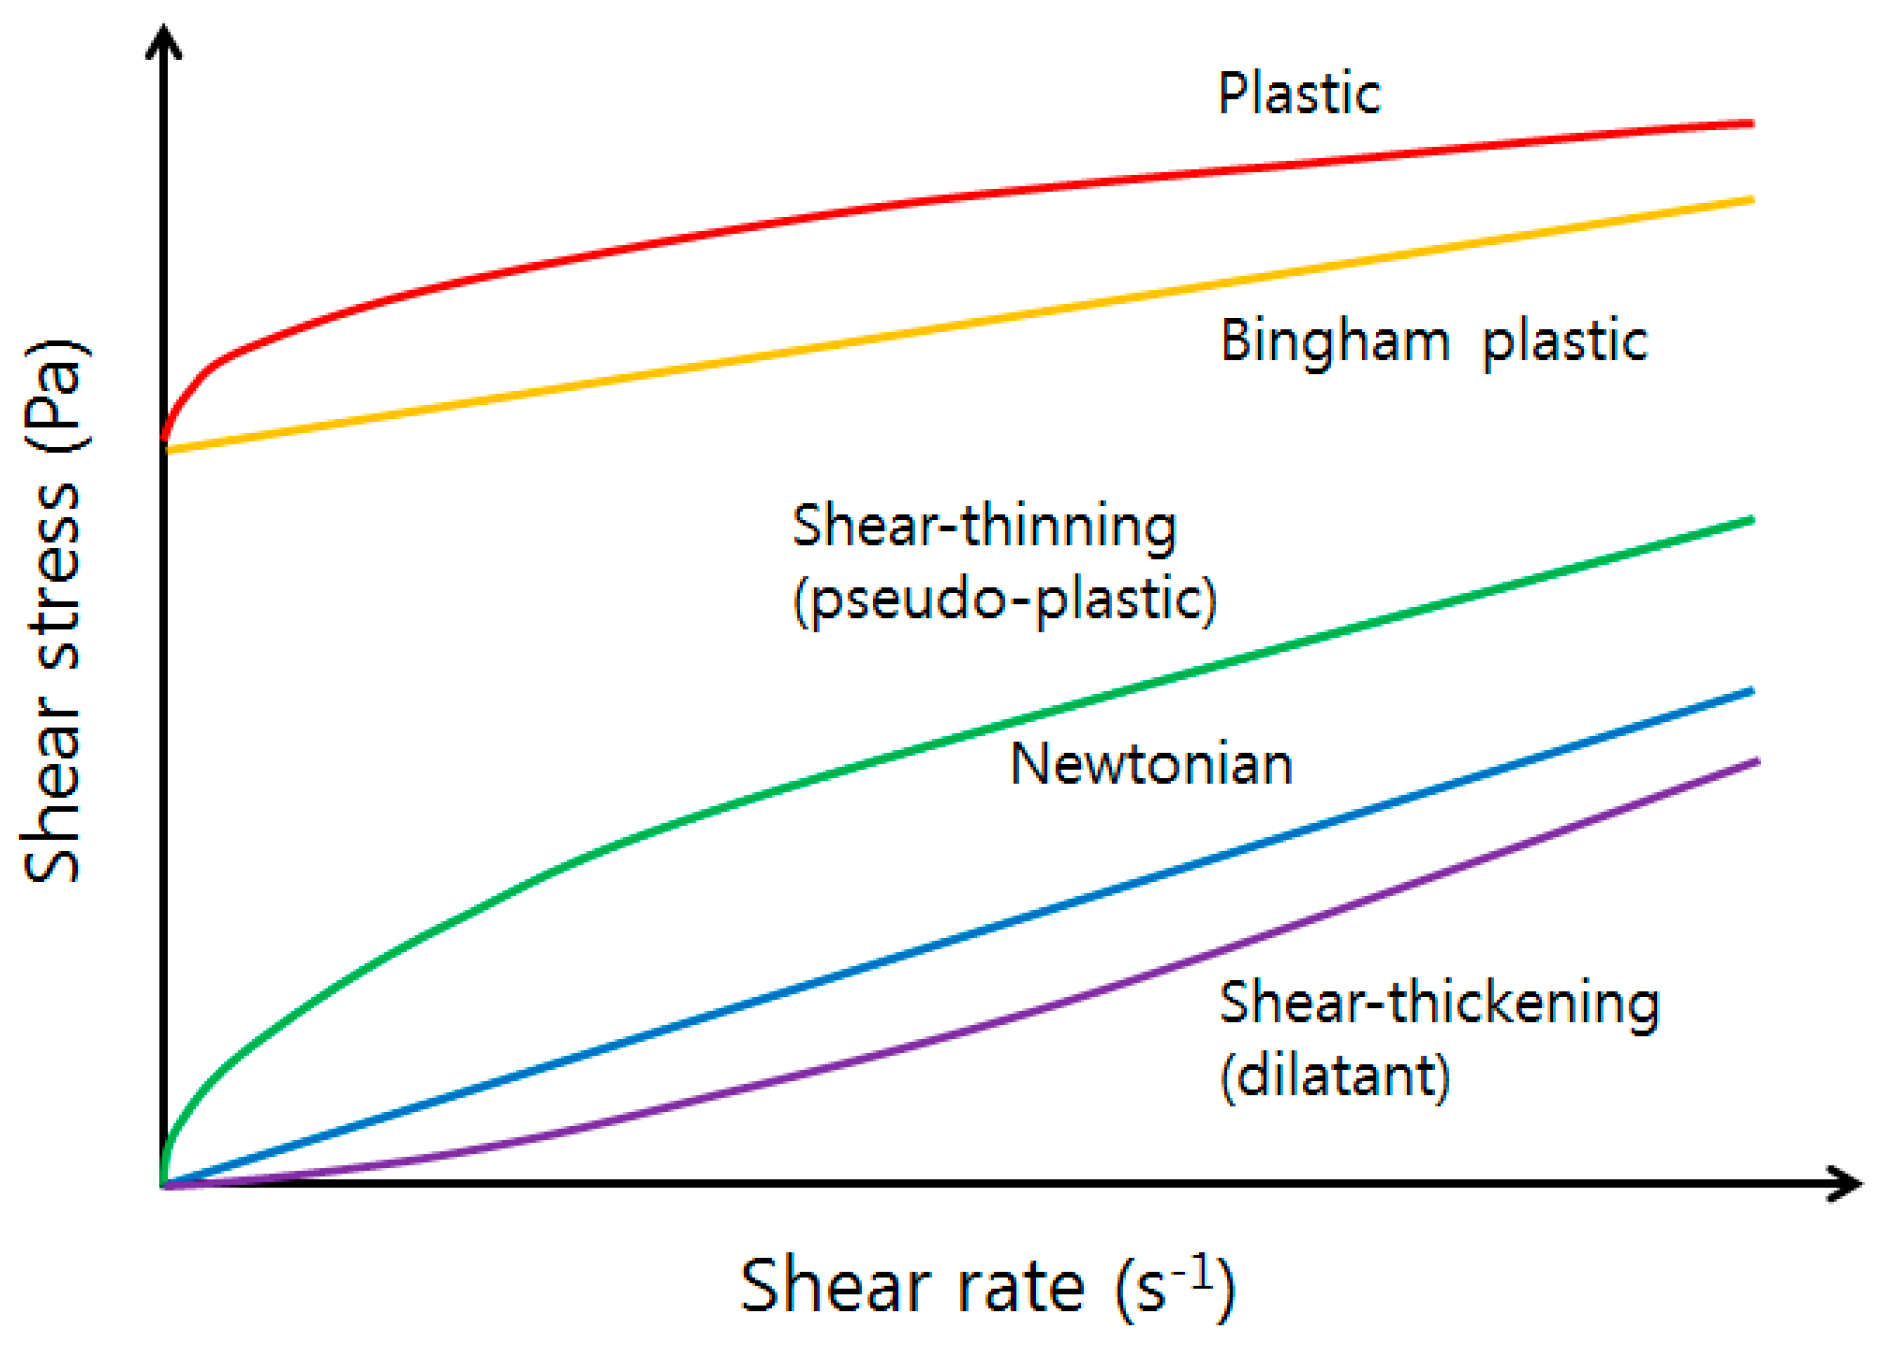
2. Background Theory

The rheology of a material in motion is generally described by a relationship between the shear stress in the material and the rate of shear strain, called the flow curve or rheogram. Examples of the flow curve are illustrated in Figure 1. The most common rheological model is Newton’s law of viscosity, which correlates the shear stress to the shear rate by means of a proportionality constant. By extension, the term viscosity is used to represent the slope of the flow curve. Materials that do not obey Newton’s law of viscosity are referred to as non-Newtonian. For instance, in mineral suspensions, the minimum shear stress is required for material deformation and flow to occur. This type of behavior is known as plastic. For a non-linear flow curve, shear-thinning or shear-thickening response may be observed in a material under flow conditions. The former is when the viscosity decreases with the increasing shear rate and the latter exhibits an opposite trend.
Numerous analytical models exist in the literature for the prediction of rheological characteristics of mineral slurry. Many of these proposed models are either empirically or theoretically established, but highly specific to the experimental data of a particular material. Other models have wider feasibility, but still contain parameters whose values must be obtained empirically, suggesting that no unified model or prediction methodology has been found with universal applicability. Therefore, various rheological models were used in this study as listed below:
Bingham
τ = τ 0 + η p γ
Modified Bingham
τ = τ 0 + η p γ + c γ 2
Casson
τ = τ 0 + η p γ  
De Kee
τ = τ 0 + η p γ exp ( α γ )
Papanastasion
τ = τ 0 [ 1 exp ( β γ ) ] + η p γ
Herschel-Bulkley
τ = τ 0 + K γ n
Sisko
τ = μ γ + K γ n
Robertson-Stiff
τ = K ( γ + b ) n
where, τ 0 is the yield stress (Pa), η p is the plastic viscosity (Pa·s), μ is the viscosity at infinite shear rate (Pa·s), K is the consistency (Pa·sn), and   n is the rate index (dimensionless). α and β are the time-dependent parameters (s), and b and c are the empirical parameters which have dimensionless and Pa·s2 units, respectively.
Model (1) is normally used for rheological investigations on mineral slurries such as tailings slurry [4,18] and Models (2), (3), and (6) are employed in comparative studies of rheological models [6,19]. The yield stress can be determined by Models (1)–(6) and the plastic viscosity can be calculated by Models (1)–(5) [20]. Models (6)–(8) can estimate the consistency and rate index, respectively [21].

3. Materials and Methods
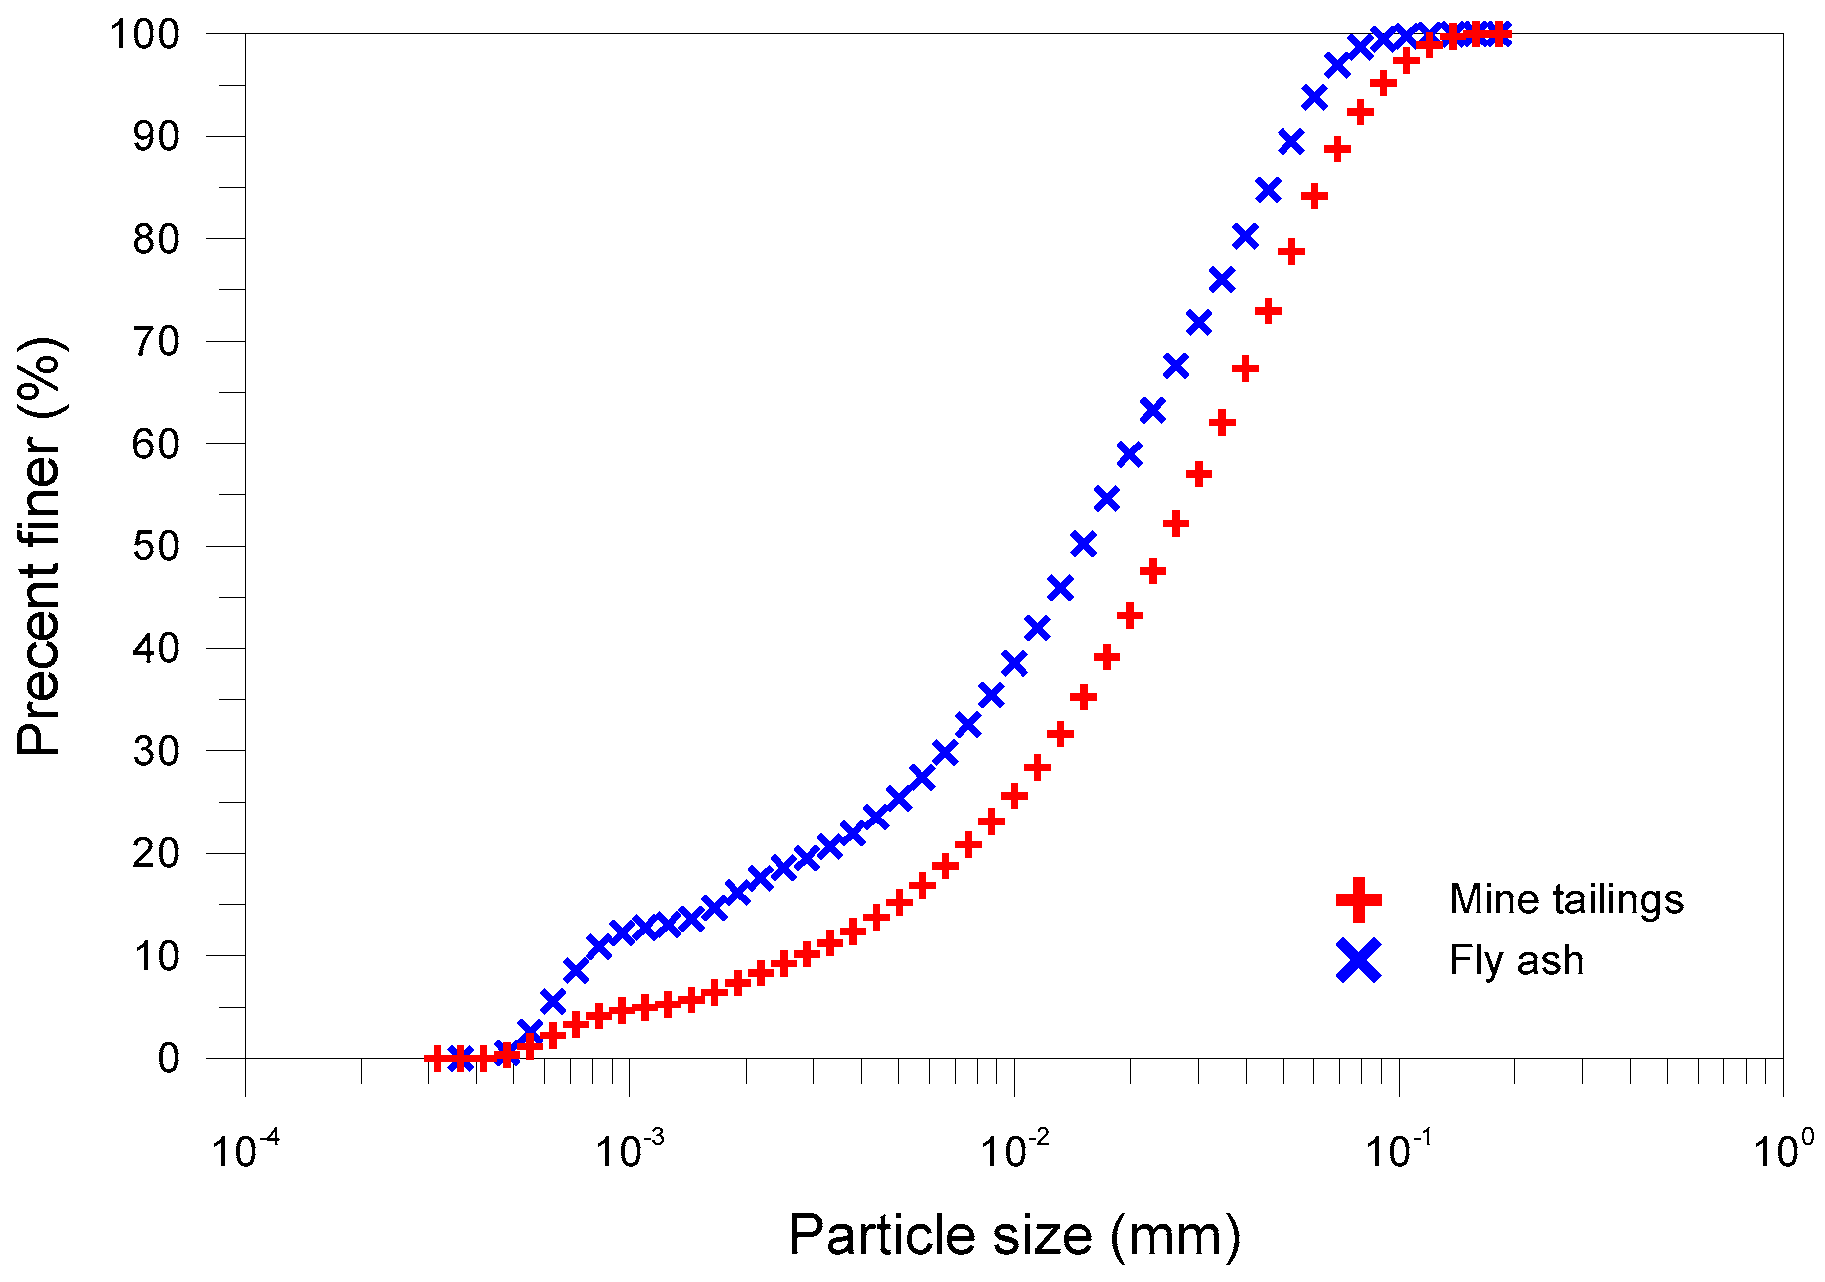
3.1. Materials

The materials used this study include mine tailings, coal fly ash, distilled water, and calcium chloride (CaCl2). The mine tailings and coal fly ash were recovered in the dry state from a gold mine site and an electric power plant, respectively. The particle sizes of tailings and fly ash were measured by a laser diffraction particle size analyzer, and the particle size distribution curves are shown in Figure 2. Both materials are well graded and primarily silt-sized. The tailings had a median particle size around 25.6 μm with 90.6% fines (<75 μm), while the fly ash was finer with a median particle size around 15.1 μm with 97.8% fines. Quartz (37%), amphibole (30%), illite (26%), chlorite (4%), and pyrrhotite (3%) are the typical minerals in tailings, as detected by X-ray diffraction analysis. Yeheyis et al. [9] reported that the net neutralizing potential (NNP) of the tested tailings was −18.46 kg CaCO3/t, calculated using the modified Sobek method [22], indicating that the tailings are net acid generating. The fly ash is classified as off-specification ash, namely it does not meet the criteria for Class C or Class F in accordance with ASTM C618 (American Society for Testing Materials) [23]. The pH values of tailings and fly ash were determined as 8.4 and 11.5, respectively, following ASTM D 4972 [24] and D 5239 [25]. Distilled water was used in preparing the slurry specimens. CaCl2 powder was used as chemical admixture and the addition of CaCl2 to the distilled water allowed for the preparation of the electrolyte solution with various concentrations of 0.05 and 0.2 M.

3.2. Specimen Preparation

Mine tailings generated at ore extraction processing are typically in the form of a slurry that has low solids content and high water content. The volume concentration of tailings within a slurry is denoted as Ct (volume of tailings to tailings slurry ratio). The volume concentration of added fly ash is represented as Cf (volume of fly ash to ash-tailings slurry ratio). The total solid concentration is then Cs (volume of solid particles to ash-tailings slurry ratio), as expressed by Cf + (1 − Cf)Ct. The constituents of the specimen mixtures are summarized in Table 1. The solid concentrations of the ash-tailings slurry mixtures varied between 24% and 32%, which lies in the typical range of thickened tailings for surface disposal [5].
A high-speed mixer with one blade at the end level was used to produce the mixed specimens. The tailings slurries were prepared by mixing mine tailings and distilled water (or CaCl2 solution) in varying proportions by weight. The specified amount of fly ash was added to a tailings slurry and then mixed and homogenized. The slurries tested in this study were subjected to prolonged mixing for up to 70 min under three ambient temperatures, i.e., 5, 25, and 45 °C. The mixing took place in a temperature-controlled environmental chamber. Before the commencement of mixing, all materials were placed inside the chamber to reach the desired ambient temperature for at least 24 h. The first specimen mixture was taken at 10 min after the contact between fly ash and tailings slurry, and placed in a beaker for the first rheological measurement. Subsequently, a new specimen mixture was taken every half-hour.

3.3. Rheological Measurement

Rheological measurements of the ash-tailings slurry mixtures were carried out using a Brookfield DV-II viscometer. All measurements were done in the environmental chamber, as was the mixing. Immediately after introduction in the viscometer, the specimen was pre-sheared at a constant rate for 2 min in order to break down the slurry structure. After 20 s at rest, the specimen was subjected to a hysteresis loop varying from 10 to 200 rpm and back to 10 rpm. The elapsed time for each ascending and descending period was 160 s. Each rotational speed was applied for 10 s to ensure the presence of the steady state before measurement. The downward curve of the viscosity versus rotational speed, which is generally more consistent and repeatable, was converted into the rheogram, i.e., the shear rate versus shear rate curve, using the procedures of Mitchka [26].

3.4. Data Analysis

The rheological models were fitted to measured flow curves using MATLAB, which also calculated the root mean square error (RMSE). The RMSE can be defined as the average squared difference between the predicted and measured values; the lower value of RMSE indicates a smaller error between the predicted and measured values, as given by:
R M S E = i = 1 n ( X p , i X m , i ) 2 n
where X p , i is the predicted values, X m , i is the measured values, and n is the number of data.

4. Results and Discussion

The rheograms for the specimens of ash-tailings slurry mixtures are plotted in Figure 3. It can be seen that the shear stress increases in a nonlinear fashion with the increase in the shear rate, indicating a non-Newtonian behavior. Furthermore, the shear stress shows a decreasing tendency with increasing the shear rate, implying that the slurries behave as a pseudo-plastic material. This is typical for concentrated mineral slurries, which is attributed to the fact that the shear stress breaks the bond between solid particles and the shear rate determines the difficulty with which they will reform. This difficulty in reforming is improved by increasing the shear rate [27].

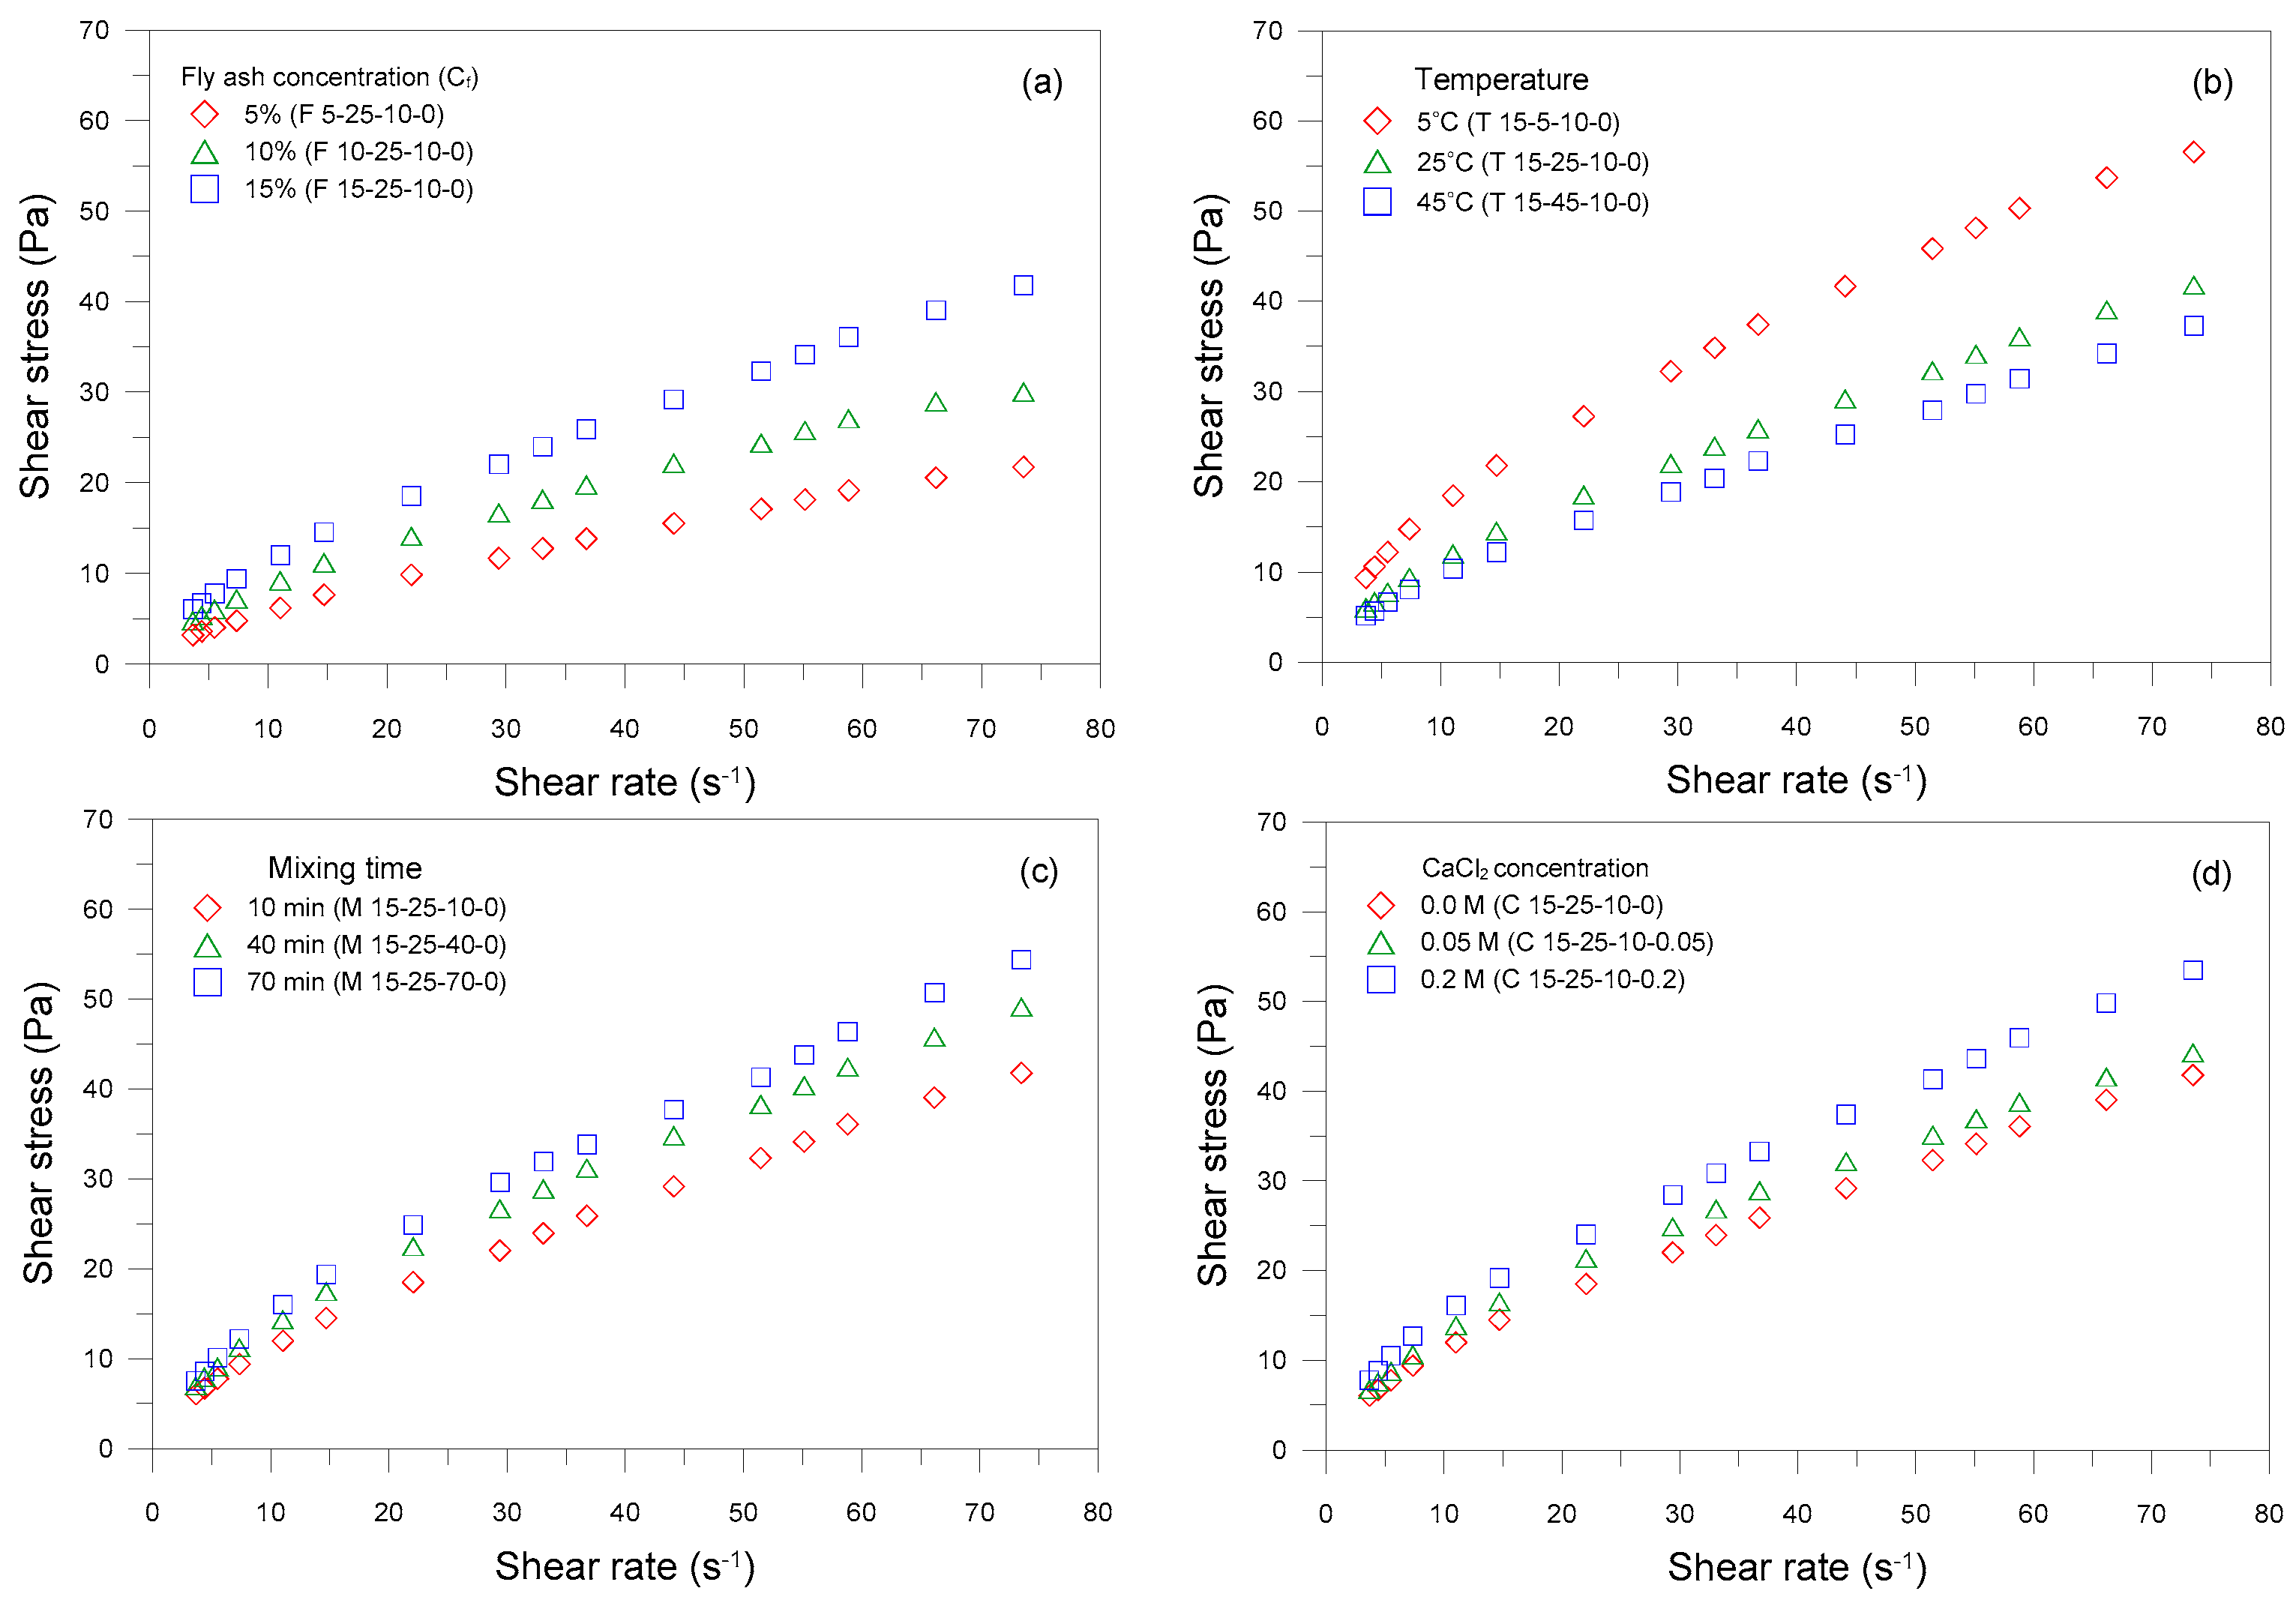
4.1. Effect of Fly Ash Concentration

Figure 3a shows the influence of Cf on the rheograms of ash-tailings slurry mixtures. For a given shear rate, an increase in shear stress is observed with the increasing fly ash content. This is likely due to the higher formation of cementitious and pozzolanic gels such as calcium silicate hydrates (CSH), calcium aluminate hydrates (CAH), and ettringite. The hydrated products surrounding ash particles will bond adjacent tailings particles as well as increase the specific surface area and surface energy, leading to the particle assembly. Another effect of fly ash addition is the increase in the solid concentration within the slurry. When the fly ash is added, the water volume in the tailings particle network within the slurry decreases and the number of direct particle-particle contacts increases. Deng et al. [28] reported that the shear thinning behavior becomes more pronounced as the solid concentration increases, which was not observed in the specimen mixtures. Also, the finer ash particles fill the voids between the larger tailings, thereby making it more difficult for the solid particles to slide past one another during shearing. Similar findings were reported by Sosio and Crosta [29] for binary granular suspensions.

4.2. Effect of Temperature

Figure 3b highlights the influence of temperature on the rheograms of ash-tailings slurry mixtures. At a constant shear rate, the increase of temperature results in slurry mixtures with lower shear stress. This is attributable to the fact that an increase in temperature increases both the ionic and particle activities in addition to the occurrence of aggregation breakdown. However, the difference in shear stresses at different temperatures becomes less sensitive for higher temperatures, indicating that the acceleration of fly ash hydration at higher temperatures produces larger amounts of cementitious products, which in turn increase shear stress. Heikal et al. [30] found that the increase of temperature changes the adsorption capacity of cement pastes, which improves the paste fluidity.

4.3. Effect of Mixing Time

Figure 3c presents the influence of mixing time on the rheograms of ash-tailings slurry mixtures. It is noticed that at a fixed shear strain, the shear stress increases linearly with time. This result implies that the rate of fly ash hydration is apparently constant during the prolonged mixing time, and an ongoing buildup in the network structure bonded by hydration products occurs. Petit et al. [31] explored the effect of time on the rheological properties of highly flowable mortars and revealed that the yield stress increases in a linear fashion with time up to the end of the dormant period for the admixtures considered.

4.4. Effect of CaCl2 Concentration

Figure 3d demonstrates the influence of CaCl2 concentration on the rheograms of ash-tailings slurry mixtures. Higher shear stresses are observed as the CaCl2 concentration of the slurry increases. The increased shear stress is undoubtedly caused by the richness in calcium as the dominant pore fluid cation at a basic environment, induced by adding the alkaline fly ash. Lee et al. [10] noted that CaCl2 accelerates the formation of hydration products and the early strength development in fly ash-stabilized tailings. Moreover, the elevated ionic strength in slurries changes the interparticle interactions arising from the solid-fluid interfacial chemistry and promotes the formation of aggregated and flocculated structures [32], leading to higher shear stress.

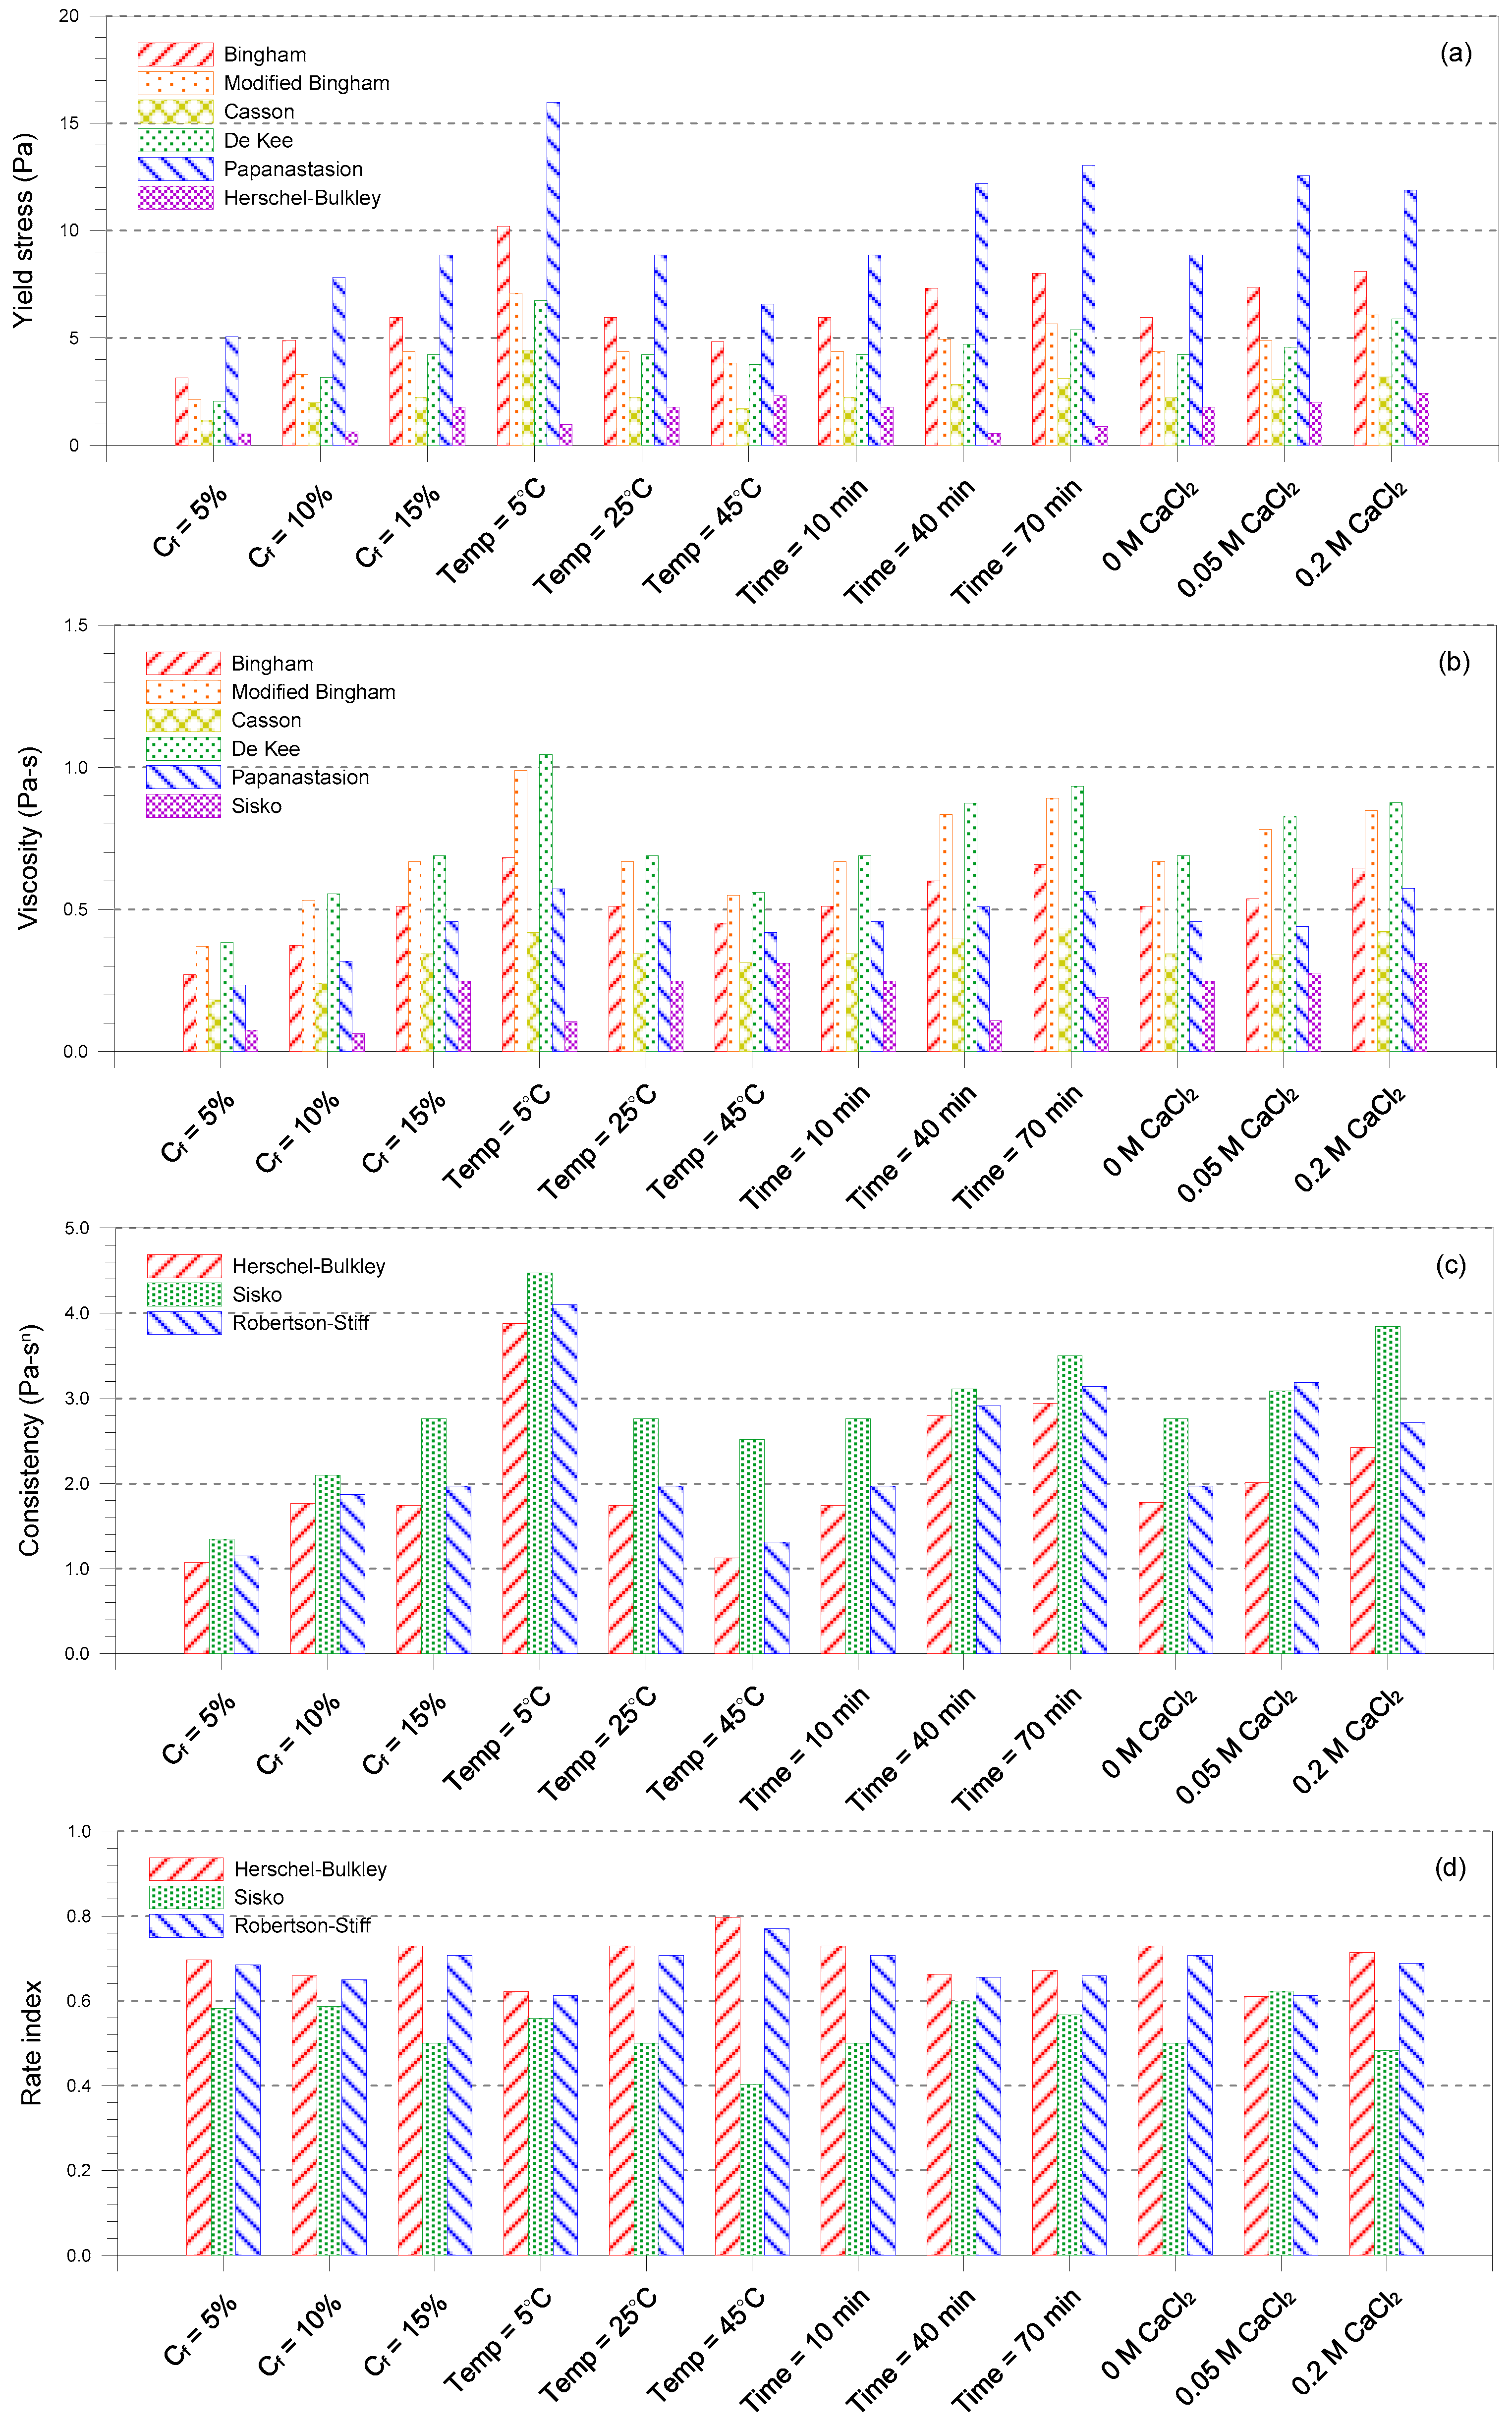
4.5. Determination of Rheological Properties

Figure 4a shows the variation of yield stress for ash-tailings slurry mixtures with different Cf, temperatures, mixing times, and CaCl2 concentrations as estimated by various rheological models. All mixtures have a certain amount of yield stress, indicating that effort is needed to make the slurry flow. In general, yield stress values increase with an increase of Cf, mixing time and CaCl2 concentration, while an opposite trend is observed for the temperature. The Papanastasion model provides the highest yield stress values among all rheological models for all specimen mixtures, probably because this model sophisticatedly reflects the low shear stress against the low shear rate range of the rheogram. The Hershel-Bulkley model evaluates the lowest yield stress values except for the slurry tested at the temperature 45 °C. The modified Bingham and De Kee models gave comparable yield stress values.
Figure 4b displays the plastic viscosity data estimated by the Bingham, Modified Bingham, Casson, De Kee, and Papanastasion models, and the viscosity at infinite shear rate estimated by the Sisko model for ash-tailings slurry mixtures. There is a general tendency for the plastic viscosity to increase with increasing Cf, mixing time and CaCl2 concentration, but to decrease with increasing temperature. These trends are similar to those of yield stress. The highest plastic viscosity is achieved for the De Kee model, followed by the Modified Bingham, Bingham, and Papanastasion models, respectively. The Casson model evaluates the lowest plastic viscosity values among all rheological models for all specimen mixtures. Meanwhile, the viscosity at an infinite shear rate as estimated by the Sisko model consistently increases with increasing the Cf and CaCl2 concentration as well as the temperature. In contrast, the effect of increasing the mixing time does not show a clear trend.
Figure 4c presents the consistency and rate index values estimated by the Herschel-Bulkley, Sisko, and Robertson-Stiff models for ash-tailings slurry mixtures. As seen, increasing the Cf, mixing time and CaCl2 concentration tends to increase the consistency whereas increasing the temperature results in lower values of consistency. Generally, the Sisko model evaluates the highest consistency values, followed by the Robertson-Stiff and Herschel-Bulkley models, respectively. Figure 4d indicates that the consistency values range between 0.404 and 0.798, and the effect of increasing the influencing factors, i.e., Cf, mixing time, temperature, and CaCl2 concentration, does not follow any specific trend.
Table 2 compares the root mean square errors (RMSEs) calculated by various rheological models for ash-tailings slurry mixtures. Higher RMSEs were obtained with the increases in mixing time and CaCl2 and the decrease in temperature, irrespective of the model used. The Bingham model results in the least favorable fitting because the linear shape of the Bingham model does not allow for the accurate fitting of the shear-thinning behavior. In general, the Papanastasion, Herschel-Bulkley, Sisko, and Robertson-Stiff models appear to be more accurate in fitting the measured data for ash-tailings slurry mixtures.

5. Conclusions

The shear stress-shear strain curves of ash-tailings slurries as functions of the fly ash concentration, temperature, mixing time, and CaCl2 concentration were measured and analyzed. The performance of prediction models was assessed in determining the rheological properties of the specimen mixtures. Based on the experimental results and data analysis, the following conclusions can be drawn:
(1)
All specimens of fly ash mixed with mine tailings slurry have a non-Newtonian shear-thinning behavior. The shear stress of specimen mixtures increases with increasing the addition of fly ash to tailings slurry. This may be due to the combined effects of the enhanced structural network bonded by hydration products and the dense particle packing.
(2)
The specimen mixtures at high temperatures have lower values of shear stress, attributable to the increase in ionic mobility and particle crowding breakdown. The higher CaCl2 concentrations result in higher levels of shear stress owing to the acceleration of fly ash hydration. The evolution of shear stress with time is observed to be linear during the mixing time of 70 min.
(3)
Generally, the performance of rheological models is improved for ash-tailings slurry mixtures with shorter mixing times, lower CaCl2 concentrations, and high temperatures. The conventional Bingham model leads to the worst fitting for the tested slurries. The Papanastasion, Herschel-Bulkley, Sisko, and Robertson-Stiff models are shown to yield better fitting of experimental data compared to the other models (Bingham, Modified Bingham, Casson, and De Kee models).
It should be noted that the findings reported in this study are valid for the particular mine tailings and fly ash used. Other tailings and fly ash that contain different minerals may exhibit different rheological characteristics. Further work is required to more thoroughly understand these characteristics.

Acknowledgments

This work was supported by the 2016 Research Fund of the University of Seoul for the Joon Kyu Lee. Junyoung Ko would like to thank the National Research Foundation of Korea (NRF) (Grant No. 2016R1A6A3A03010454) for supporting this research work. Young Sang Kim would like to thank the Ministry of Land, Infrastructure and Transportation of Korean government (Grant No. 17-RDRP-B076564-04) for supporting this research work.

Author Contributions

Joon Kyu Lee performed the experiments and wrote the draft of the paper; Junyoung Ko analyzed the test data; Young Sang Kim assisted with the interpretation of the data and the writing of the paper.

Conflicts of Interest

The authors declare no conflict of interest.

References

  1. Lottermoser, B.G. Mine Wastes: Characterization, Treatment and Environmental Impacts; Springer: New York, NY, USA, 2010. [Google Scholar]
  2. Dold, B. Evolution of acid mine drainage formation in sulphidic mine tailings. Minerals 2014, 4, 621–641. [Google Scholar] [CrossRef]
  3. Yimaz, E.; Fall, M. Paste Tailings Management; Springer: Cham, Switzerland, 2017. [Google Scholar]
  4. Sofra, F.; Boger, D.V. Environmental rheology for waste minimization in the mineral industry. Chem. Eng. J. 2002, 86, 319–330. [Google Scholar] [CrossRef]
  5. Kwak, M.; James, D.F.; Klein, K.A. Flow behavior of tailings paste for surface disposal. Int. J. Miner. Process. 2005, 77, 139–153. [Google Scholar] [CrossRef]
  6. Ding, Z.; Yin, Z.; Liu, L.; Chen, Q. Effect of grinding parameters on the rheology of pyrite-heptane slurry in a laboratory stirred media mill. Miner. Eng. 2007, 20, 701–709. [Google Scholar] [CrossRef]
  7. Haiqiang, J.; Fall, M.; Cui, L. Yield stress of cemented paste backfill in sub-zero environments: Experimental results. Miner. Eng. 2016, 92, 141–150. [Google Scholar] [CrossRef]
  8. Wang, H.L.; Shang, J.Q.; Kovac, V.; Ho, K.S. Utilization of Atikokan coal fly ash in acid rock drainage control from Musselwhite Mine tailings. Can. Geotech. J. 2006, 43, 229–243. [Google Scholar] [CrossRef]
  9. Yeheyis, M.B.; Shang, J.Q.; Yanful, E.K. Long-term evaluation of coal fly ash and mine tailings co-placement: A site-specific study. J. Environ. Manag. 2009, 91, 237–244. [Google Scholar] [CrossRef] [PubMed]
  10. Lee, J.K.; Shang, J.Q.; Wang, H.; Zhao, C. In-situ study of beneficial utilization of coal fly ash in reactive mine tailings. J. Environ. Manag. 2014, 135, 73–80. [Google Scholar] [CrossRef] [PubMed]
  11. Papadakis, V.G. Effect of fly ash on Portland cement systems. Cem. Concr. Res. 1999, 29, 1727–1736. [Google Scholar] [CrossRef]
  12. Wang, A.; Zhang, C.; Sun, W. Fly ash effects. Cem. Concr. Res. 2004, 34, 2057–2060. [Google Scholar] [CrossRef]
  13. Ortega, J.M.; Sánchez, I.; Antón, C.; De Vera, G.; Climent, M.A. Influence of environment on durability of fly ash cement mortars. ACI Mater. J. 2012, 109, 647–656. [Google Scholar]
  14. Ortega, J.M.; Esteban, M.D.; Rodríguez, R.R.; Pastor, J.L.; Ibanco, F.J.; Sánchez, I.; Climent, M.Á. Long-term behaviour of fly ash and slag cement grouts for micropiles exposed to a sulphate aggressive medium. Materials 2017, 10, 598. [Google Scholar] [CrossRef] [PubMed]
  15. Stanmore, B.R.; Page, D.W. Yield stresses and sedimentation in dense flyash slurries. Powder Technol. 1992, 72, 167–175. [Google Scholar] [CrossRef]
  16. Mahlaba, J.S.; Kearsley, E.P.; Kruger, R.A.; Pretorius, P.C. Evaluation of workability and strength development of fly ash pastes prepared with industrial brines rich in SO42− and Cl to expand brine utilization. Miner. Eng. 2011, 24, 1077–1081. [Google Scholar] [CrossRef]
  17. Simon, D.; Grabinsky, M. Apparent yield stress measurement in cemented paste backfill. Int. J. Min. Reclam. Environ. 2013, 27, 231–256. [Google Scholar] [CrossRef]
  18. Huynh, L.; Beattie, D.A.; Fornasiero, D.; Ralton, J. Effect of polyphosphate and naphthalene sulfonate formaldehyde condensate on the rheological properties of dewatered tailings and cemented slurry backfill. Miner. Eng. 2006, 19, 28–36. [Google Scholar] [CrossRef]
  19. Celik, F.; Canakci, H. An investigation of rheological properties of cement-based grout mixed with rice husk ash (RHA). Constr. Build. Mater. 2015, 91, 187–194. [Google Scholar] [CrossRef]
  20. Gullu, H. Comparison of rheological models for jet grout cement mixtures with various stabilizers. Constr. Build. Mater. 2016, 127, 220–236. [Google Scholar] [CrossRef]
  21. Yahia, A.; Khayat, K.H. Analytical models for estimating yield stress of high-performance pseudoplastic grout. Cem. Concr. Res. 2001, 31, 731–738. [Google Scholar] [CrossRef]
  22. Lawrence, R.W.; Wang, Y. Determination of Neutralization Potential in the Prediction of Acid Rock Drainage. Proceeding of the Fourth International Conference on Acid Rock Drainage, Vancouver, BC, Canada, 31 May–6 June 1997; pp. 451–464. [Google Scholar]
  23. American Society for Testing and Materials (ASTM). Standard Specification for Coal Fly Ash and Raw for Calcined Natural Pozzolan for Use in Concrete, C618-15; American Society for Testing and Materials: West Conshohocken, PA, USA, 2015. [Google Scholar]
  24. American Society for Testing and Materials (ASTM). Standard Test Method for pH of Soils, D4972-13; American Society for Testing and Materials: West Conshohocken, PA, USA, 2013. [Google Scholar]
  25. American Society for Testing and Materials (ASTM). Standard Test Methods for Characterizing Fly Ash for Use in Soil Stabilization, D 5239-12; American Society for Testing and Materials: West Conshohocken, PA, USA, 2012. [Google Scholar]
  26. Mitschka, P. Simple conversion of Brookfield R.V.T. readings into viscosity functions. Rheol. Acta 1982, 21, 207–209. [Google Scholar]
  27. Collyer, A.A. Time independent fluids. Phys. Educ. 1973, 8, 333–338. [Google Scholar] [CrossRef]
  28. Deng, X.J.; Klein, B.; Zhang, J.X.; Hallbom, D.; de Wit, B. Time-dependent rheological behavior of cemented backfill mixture. Int. J. Min. Reclam. Environ. 2016, 1–18. [Google Scholar] [CrossRef]
  29. Sosio, R.; Crosta, G.B. Rheology of concentrated granular suspensions and possible implications for debris flow modeling. Water Resour. Res. 2009, 45, 119–127. [Google Scholar] [CrossRef]
  30. Heikal, M.; Morsy, M.S.; Aiad, I. Effect of treatment temperature on the early hydration characteristics of superplasticized silica fume blended cement pastes. Cem. Concr. Res. 2005, 35, 680–687. [Google Scholar] [CrossRef]
  31. Petit, J.Y.; Khayat, K.; Wirquin, E. Coupled effect of time and temperature on variations of yield value of highly flowable mortar. Cem. Concr. Res. 2006, 36, 832–841. [Google Scholar] [CrossRef]
  32. Legay, G.; Dekany, I. Colloid clay science. In Handbook of Clay Science, 2nd ed.; Bergaya, F., Theng, B.K.G., Legaly, G., Eds.; Elsevier Science: Amsterdam, The Netherlands, 2013; pp. 141–245. [Google Scholar]
Figure 1. Schematic flow curves of Newtonian and non-Newtonian materials.
Minerals 07 00165 g001
Figure 2. Particle size distributions of materials tested.
Minerals 07 00165 g002
Figure 3. Effects of (a) fly ash concentration; (b) temperature; (c) mixing time; and (d) CaCl2 concentration on the rheogram of fly ash mixed with tailings slurries.
Minerals 07 00165 g003
Figure 4. Rheological properties estimated by prediction models for fly ash mixed with tailings slurries: (a) yield stress; (b) viscosity; (c) consistency; (d) rate index.
Minerals 07 00165 g004
Table 1. Summary of mixture constituents for rheological measurement.
LabelCt (%)Cf (%)Cs (%)Temperature (°C)Mixing Time (min)CaCl2 Concentration (M)
Effect of fly ash concentration
F 5-25-10-02052425100
F 10-25-10-020102825100
F 15-25-10-020153225100
Effect of temperature
T 15-5-10-02015325100
T 15-25-10-020153225100
T 15-45-10-020153245100
Effect of mixing time
M 15-25-10-020153225100
M 15-25-40-020153225400
M 15-25-70-020153225700
Effect of CaCl2 concentration
C 15-25-10-020153225100
C 15-25-10-0.0520153225100.05
C 15-25-10-0.220153225100.2
Table 2. Root mean square error obtained by various rheological models for specimen mixtures.
Sample IDBMBCDPHBSRS
Cf = 5%0.6200.1810.3000.1660.2360.1200.1240.120
Cf = 10%0.9870.2760.5240.2670.4390.2590.2660.258
Cf = 15%1.0310.4190.4170.3930.2690.2050.1700.220
Temp = 5 °C1.9470.6210.9800.5590.6120.2940.2900.298
Temp = 25 °C1.0310.4190.4170.3930.2690.2050.1700.220
Temp = 45 °C0.7040.3960.2560.3830.1450.2560.2010.274
Time = 10 min1.0310.4190.4170.3930.2690.2050.1700.220
Time = 40 min1.5070.5710.7460.5130.3110.1970.1820.202
Time = 70 min1.6520.8920.8720.8360.2930.5010.4700.508
CaCl2 0 M1.0310.4190.4170.3930.2690.2050.1700.220
CaCl2 0.05 M1.5730.5820.8410.5120.3140.1870.1910.185
CaCl2 0.2 M1.3920.6880.6020.6520.2310.3800.3120.404
Note: B = Bingham; MB = Modified Bingham; C = Casson; D = De Kee; P = Papanastasion; HB = Herschel-Bulkley; S = Sisko; RS = Robertson-Stiff.

