
Selective Separation of Fluorite, Barite and Calcite with Valonea Extract and Sodium Fluosilicate as Depressants


Abstract
:1. Introduction
2. Materials and Methods
2.1. Pure Minerals and Reagents
2.2. Flotation Experiment
2.3. Zeta Potential Measurement
2.4. Molecular Dynamics Simulations
3. Results and Discussions
3.1. Single Mineral Flotation
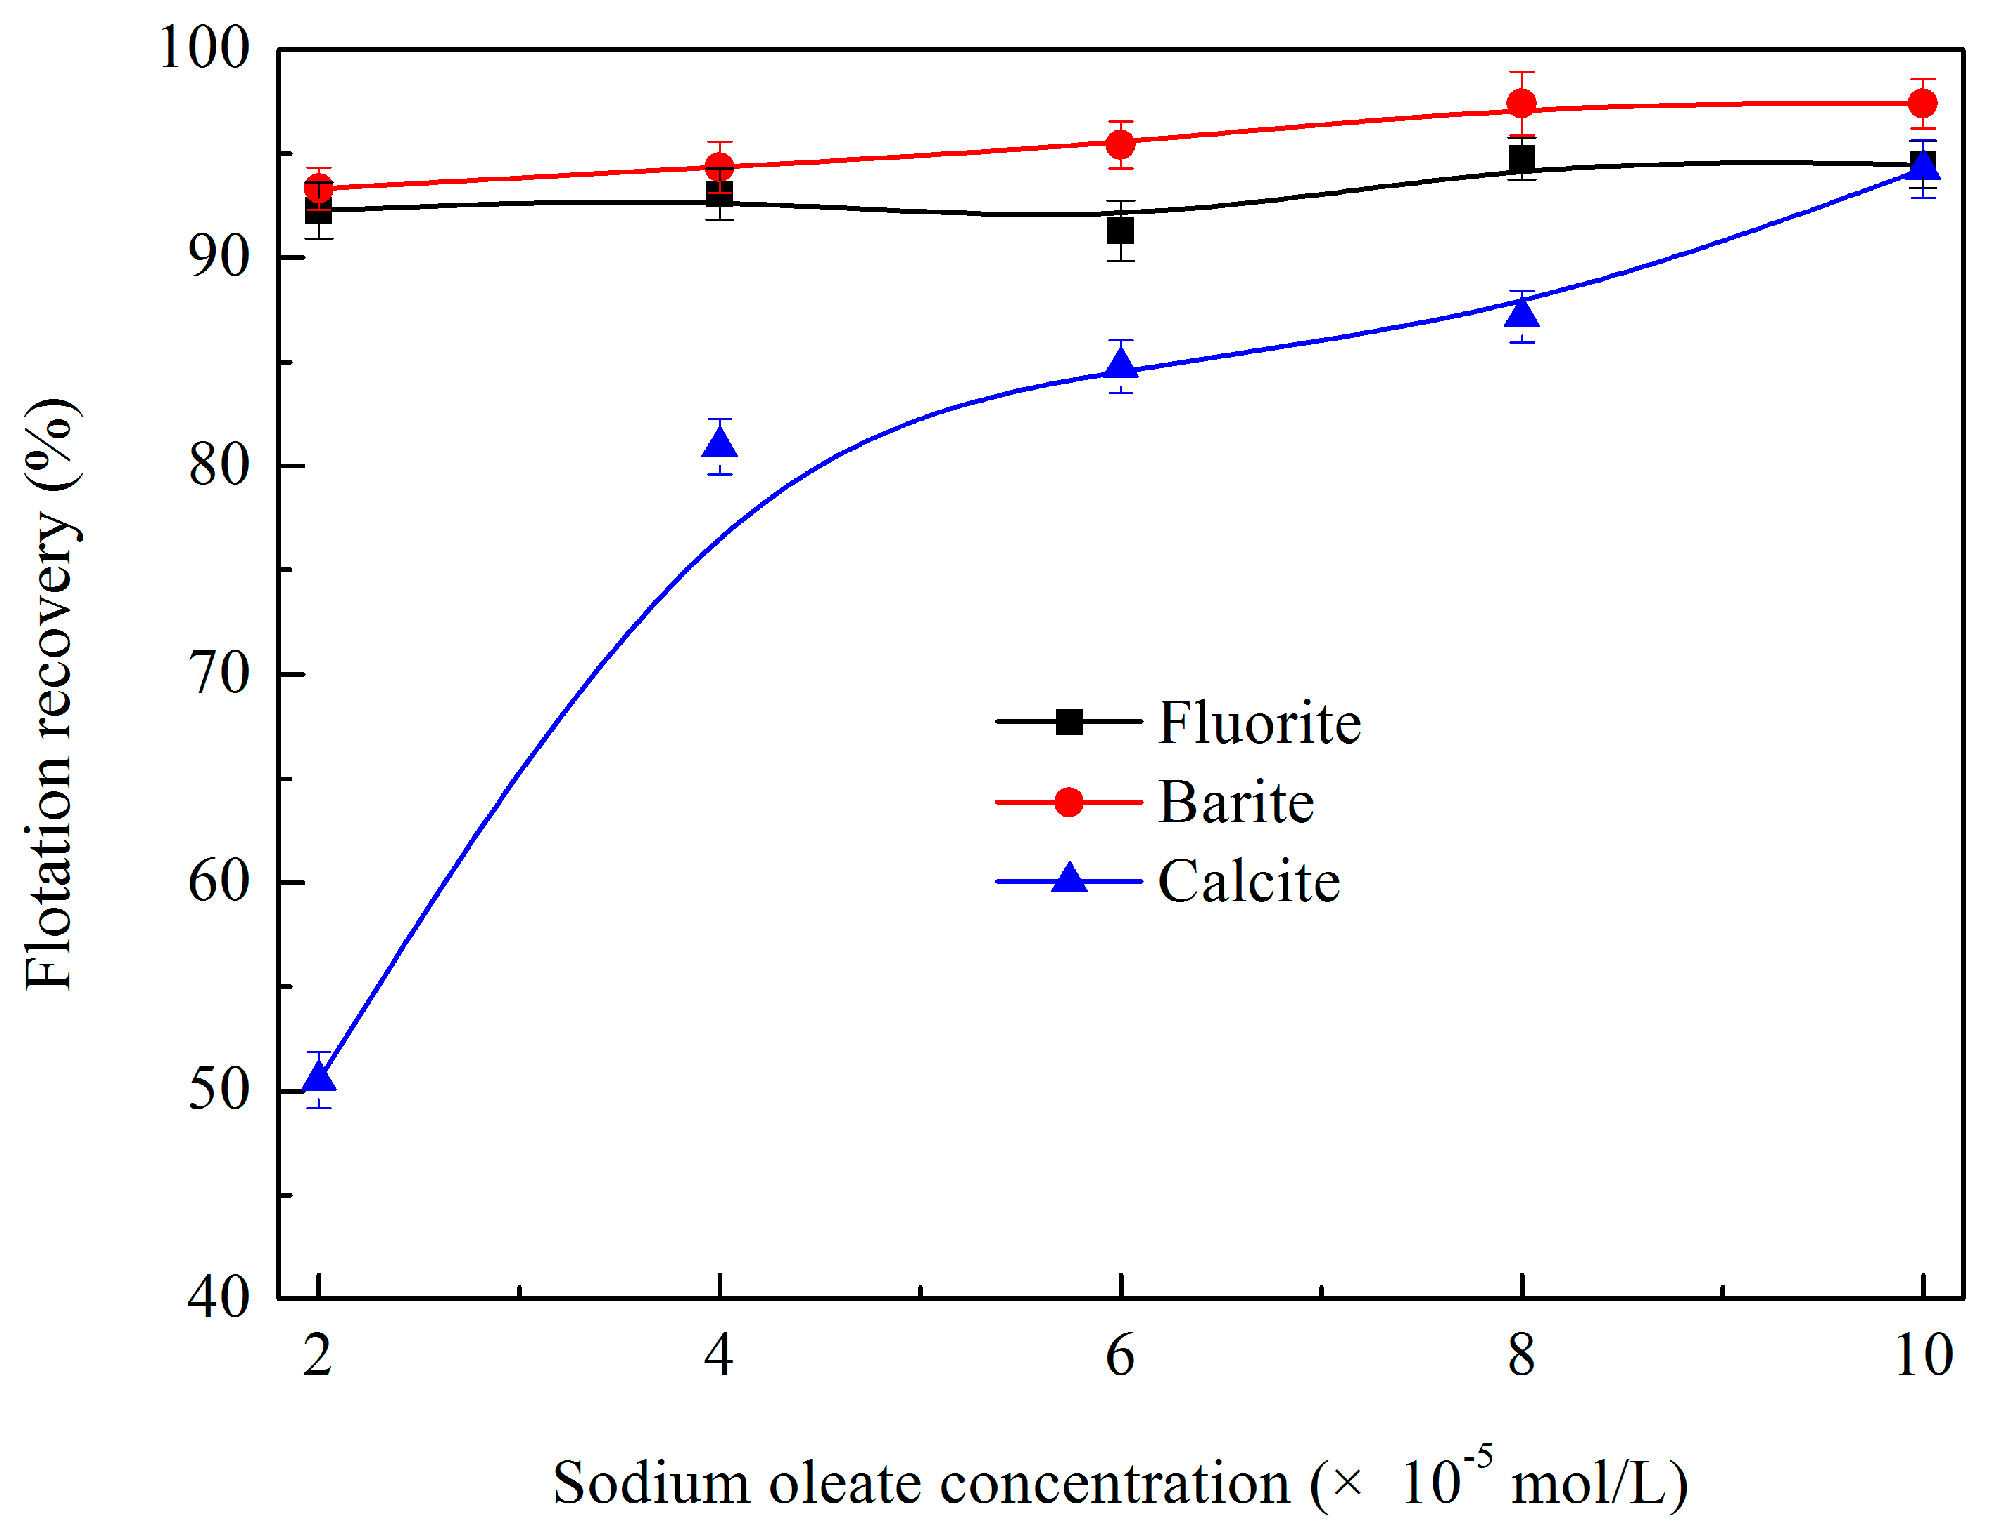
3.1.1. Effects of Sodium Oleate Dosage on Flotation Behaviour
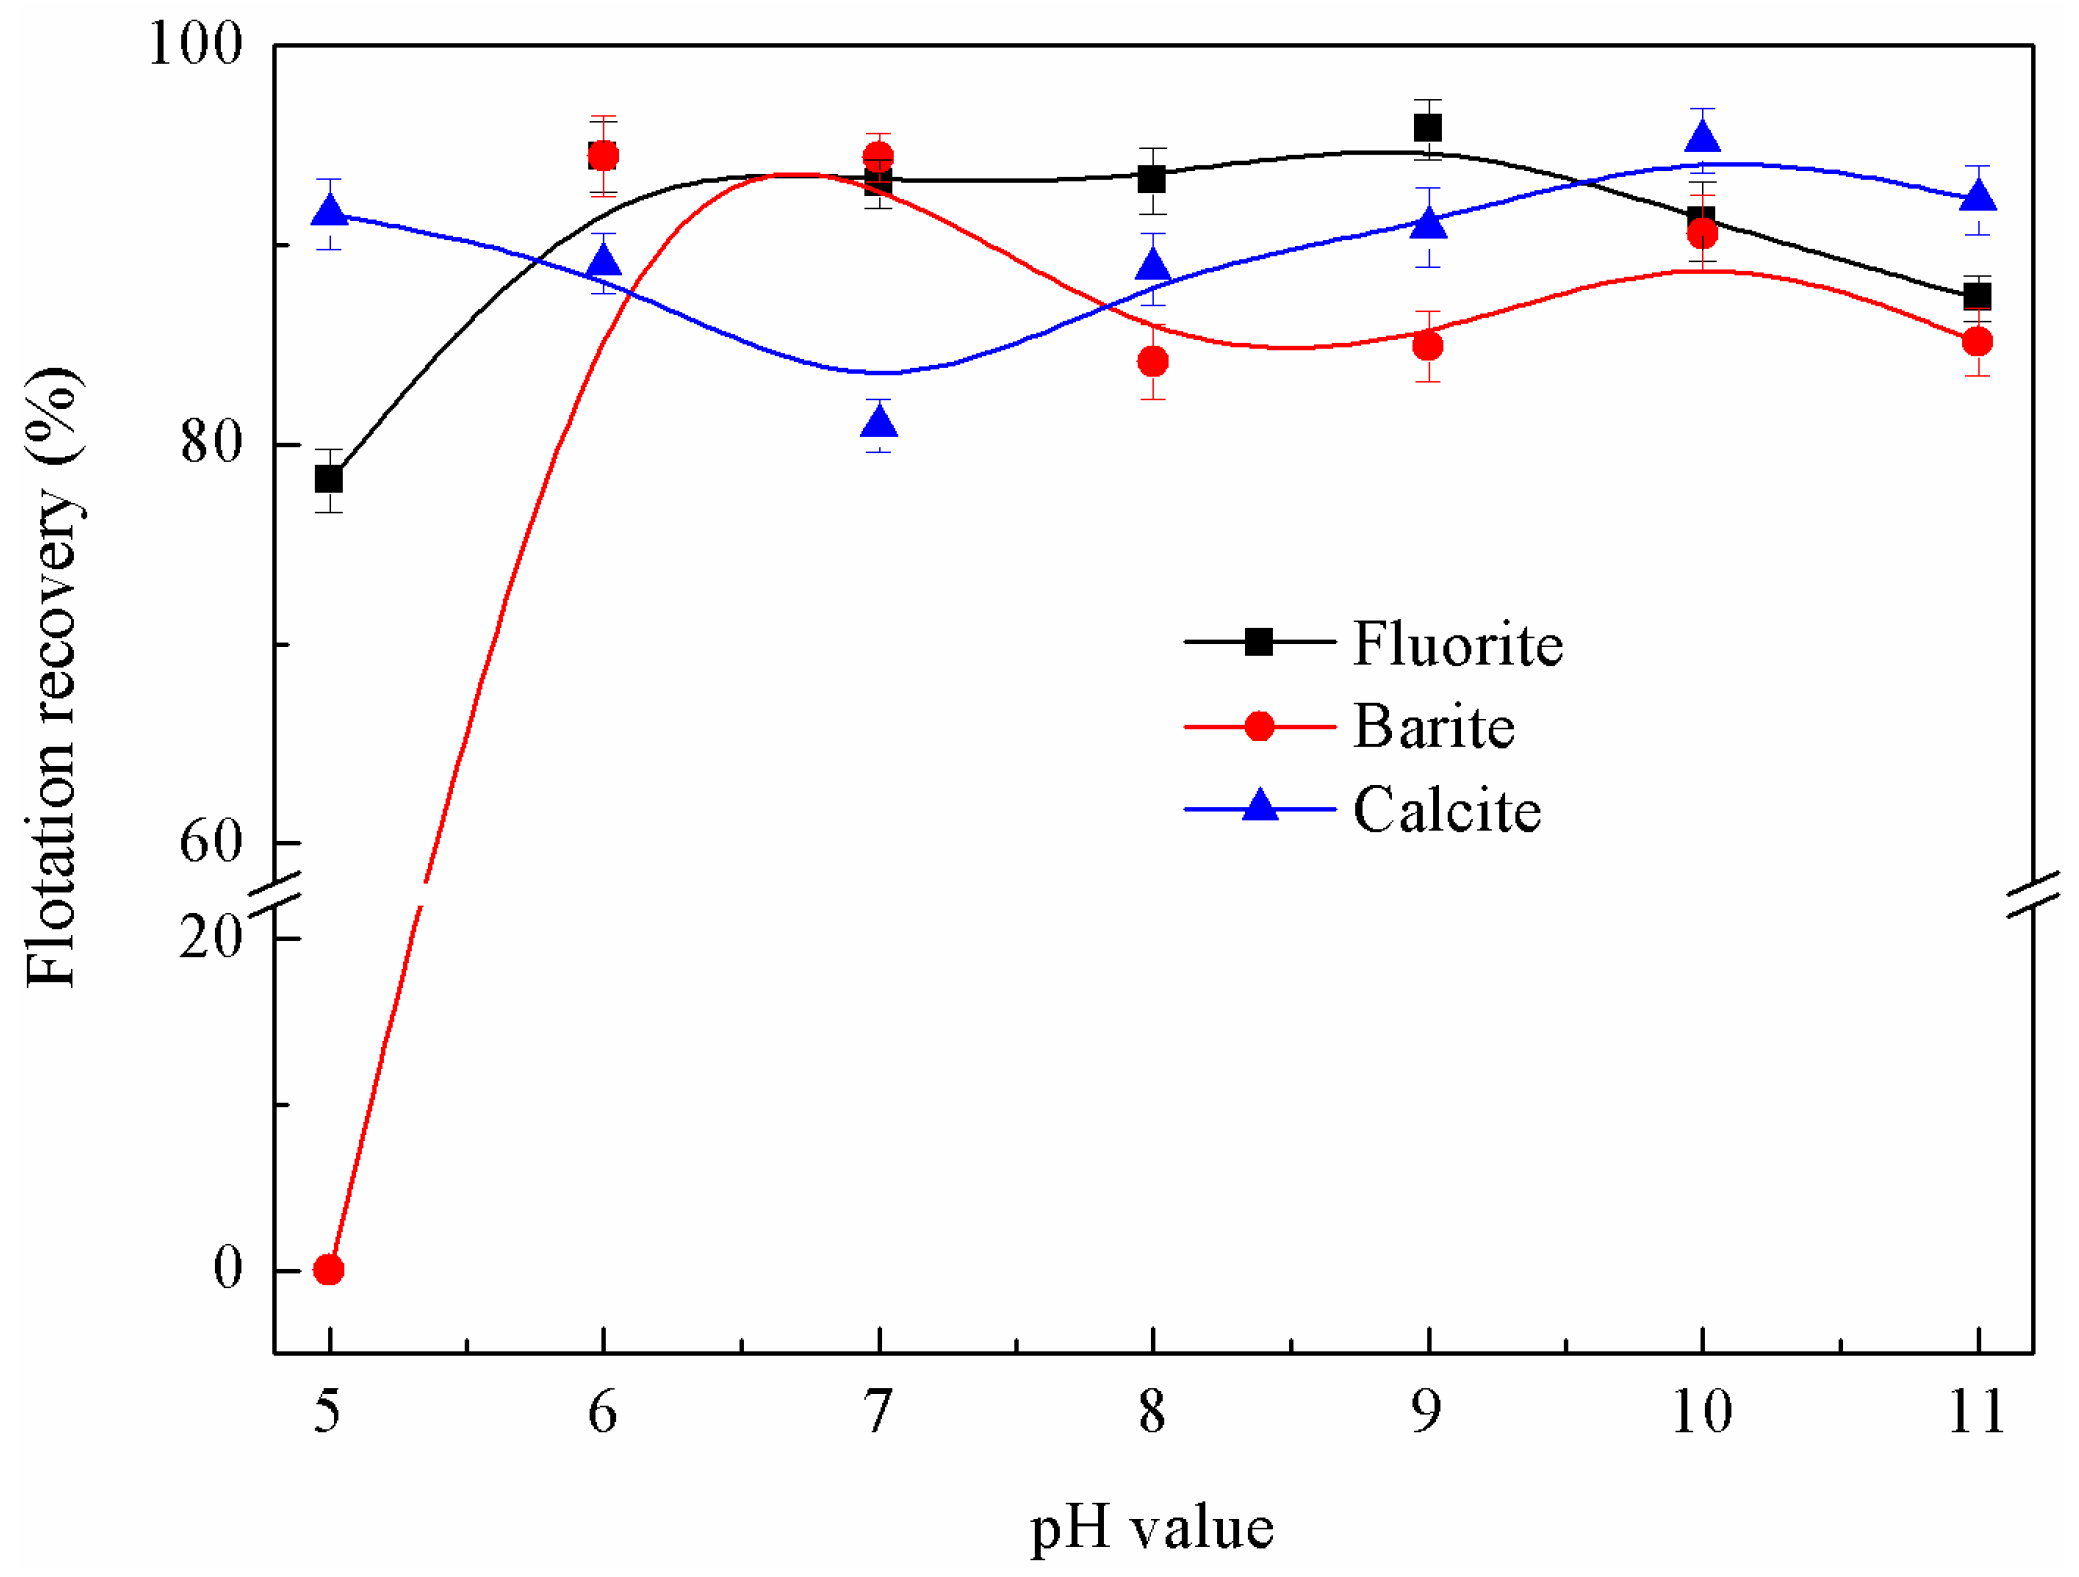
3.1.2. Effects of pH Value on Flotation Behaviour
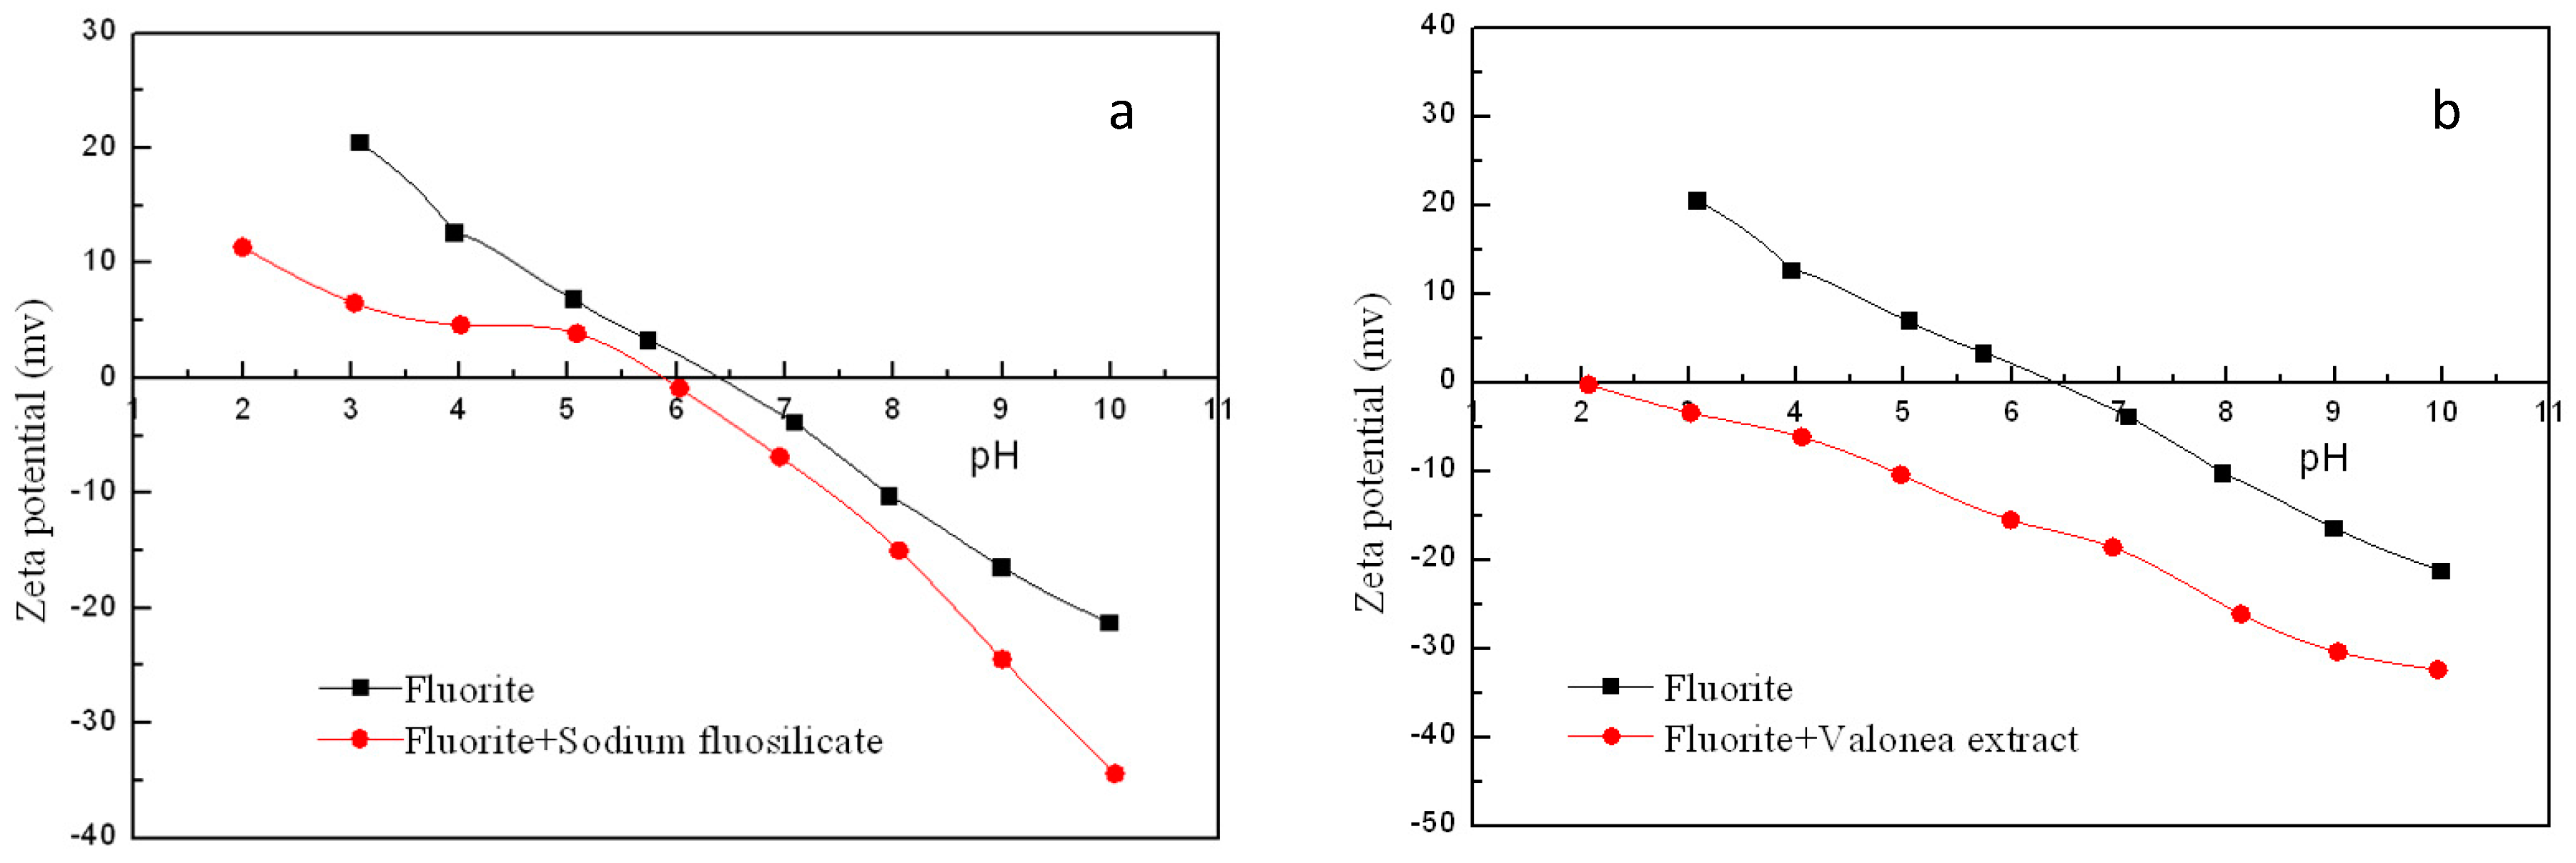
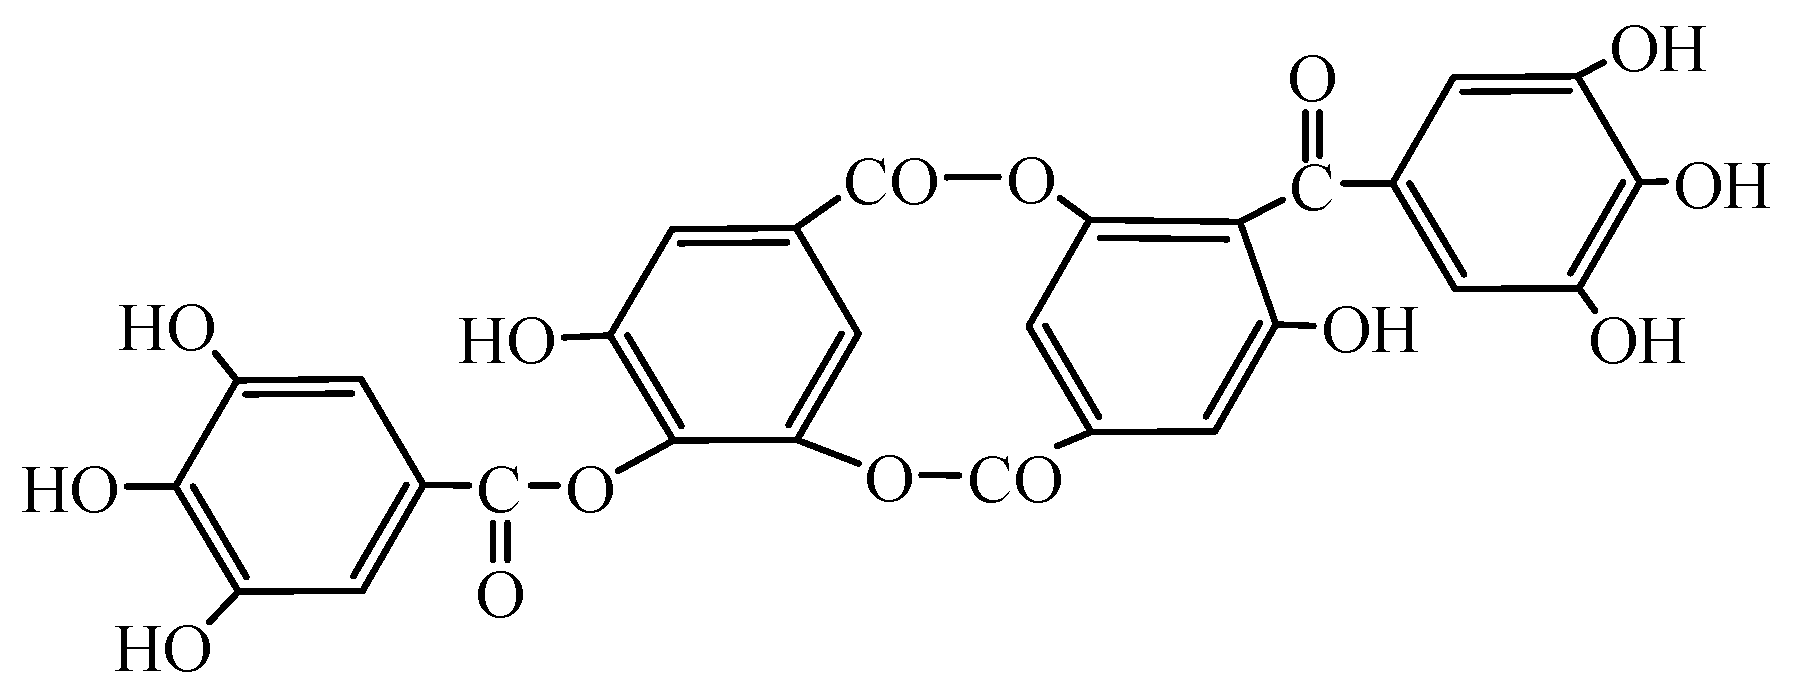
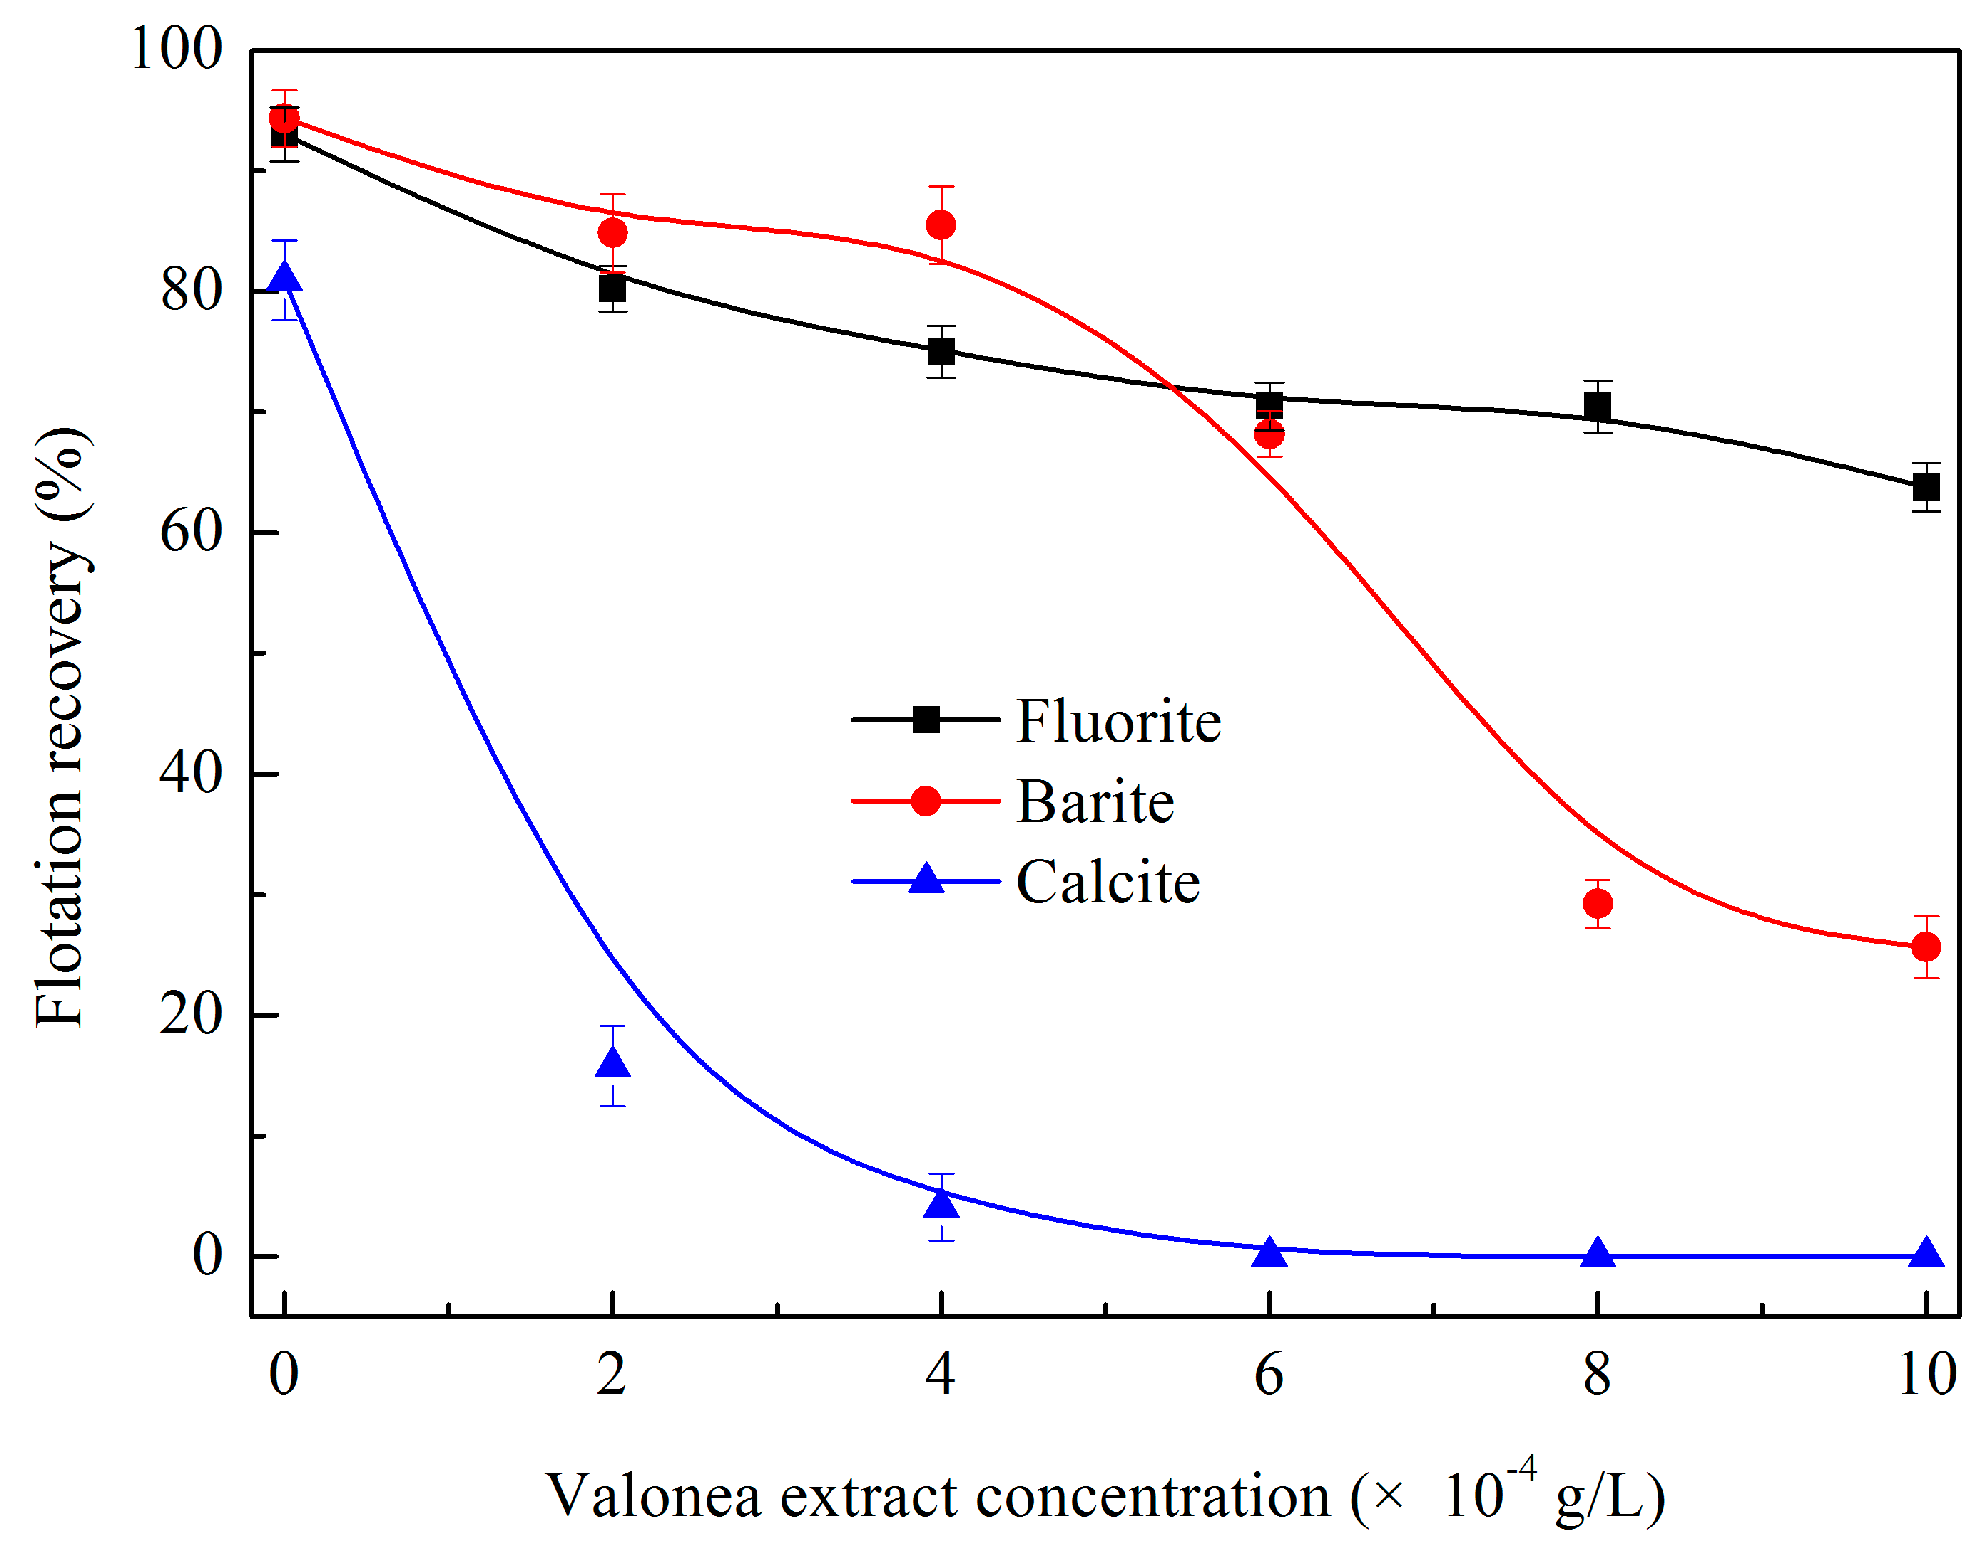
3.1.3. Effects of Valonea Extract Dosage on Flotation Behaviour
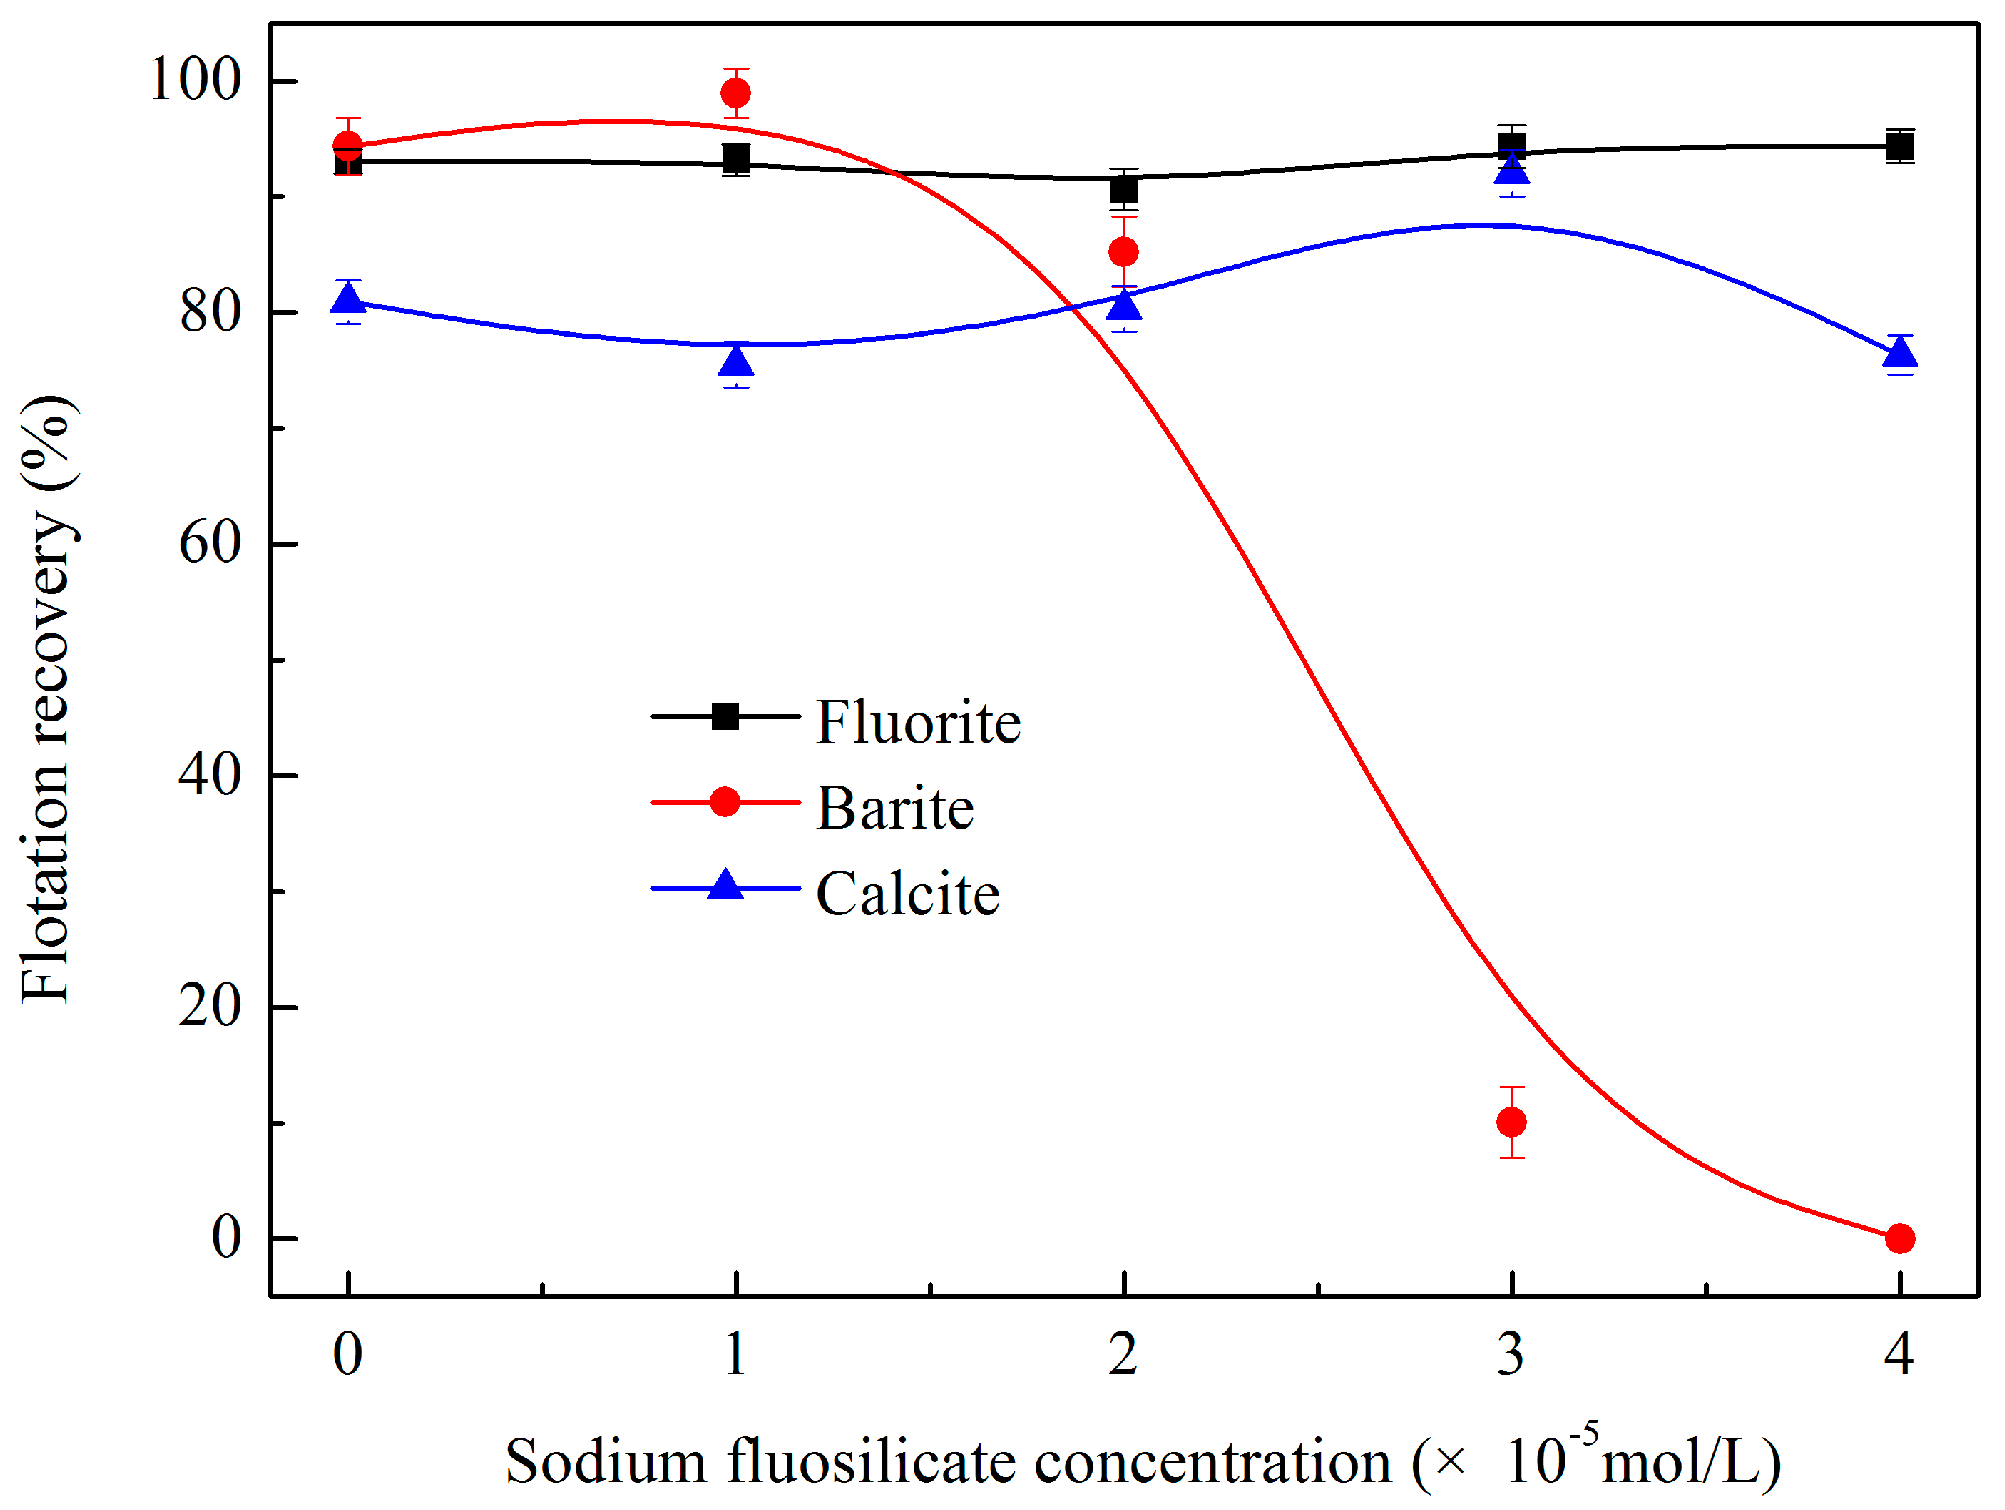
3.1.4. Effects of Sodium Fluosilicate Dosage on Flotation Behaviour
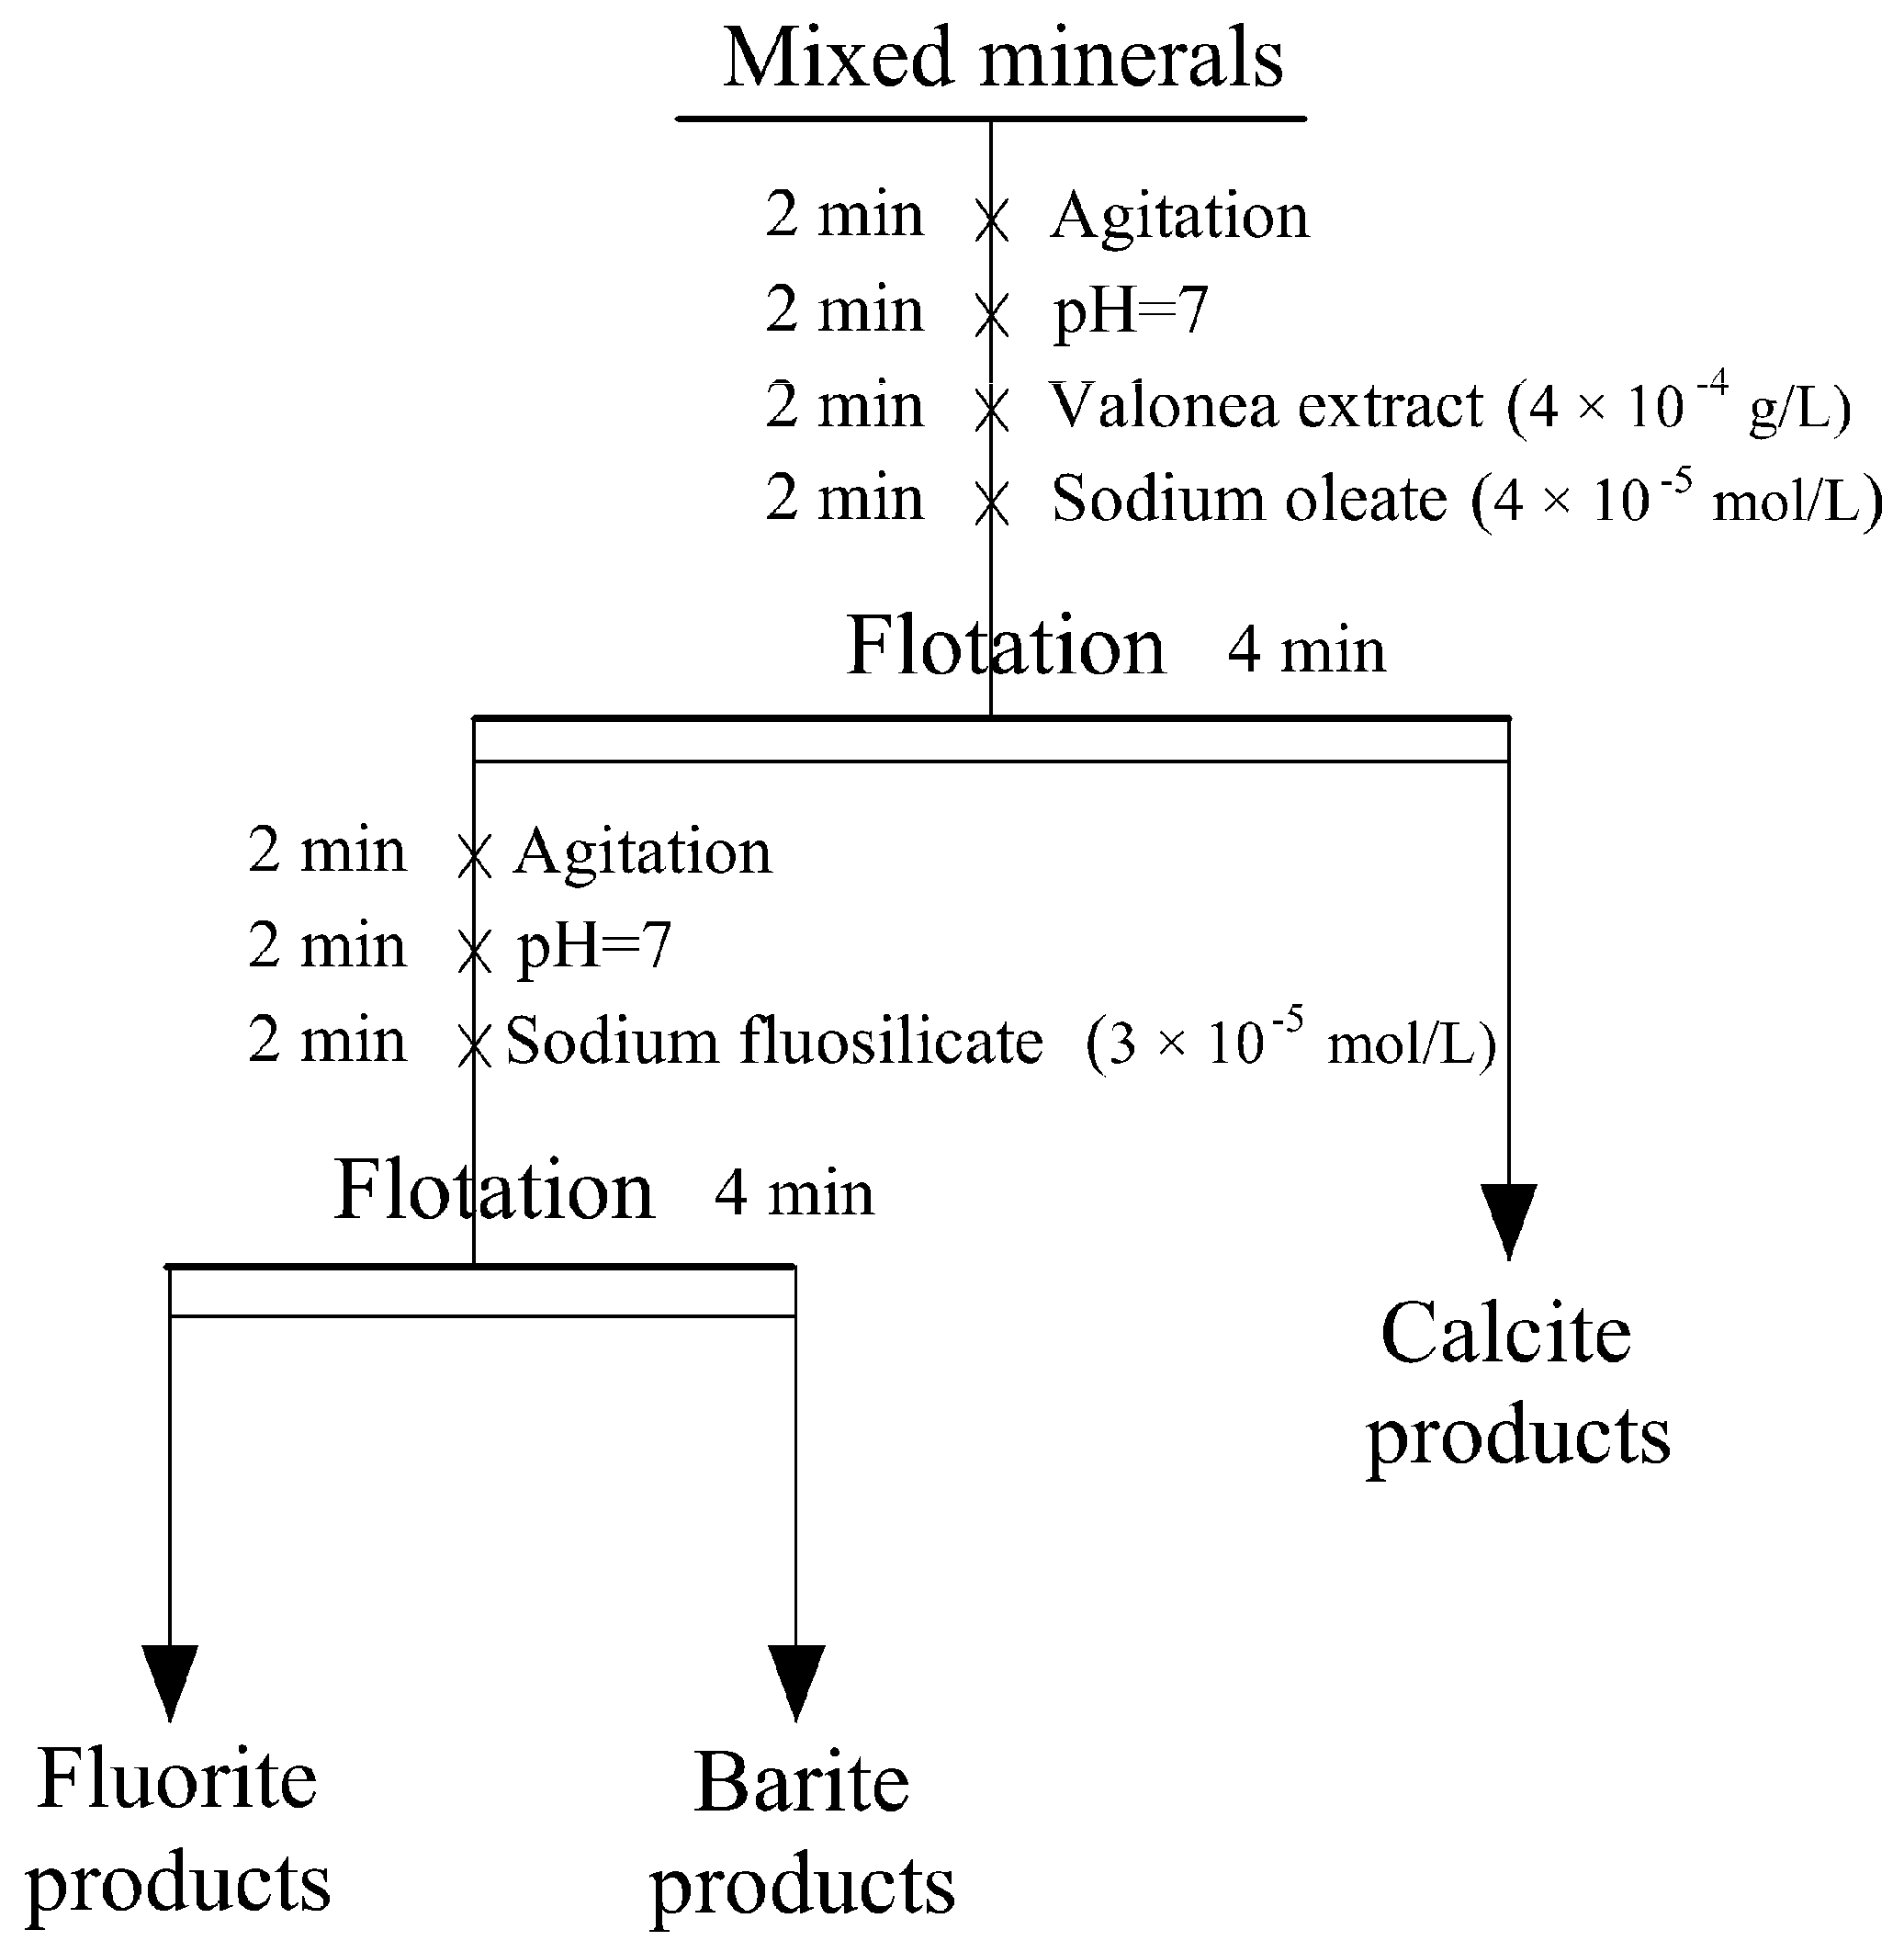
3.2. Flotation Experiment of Mixed Minerals
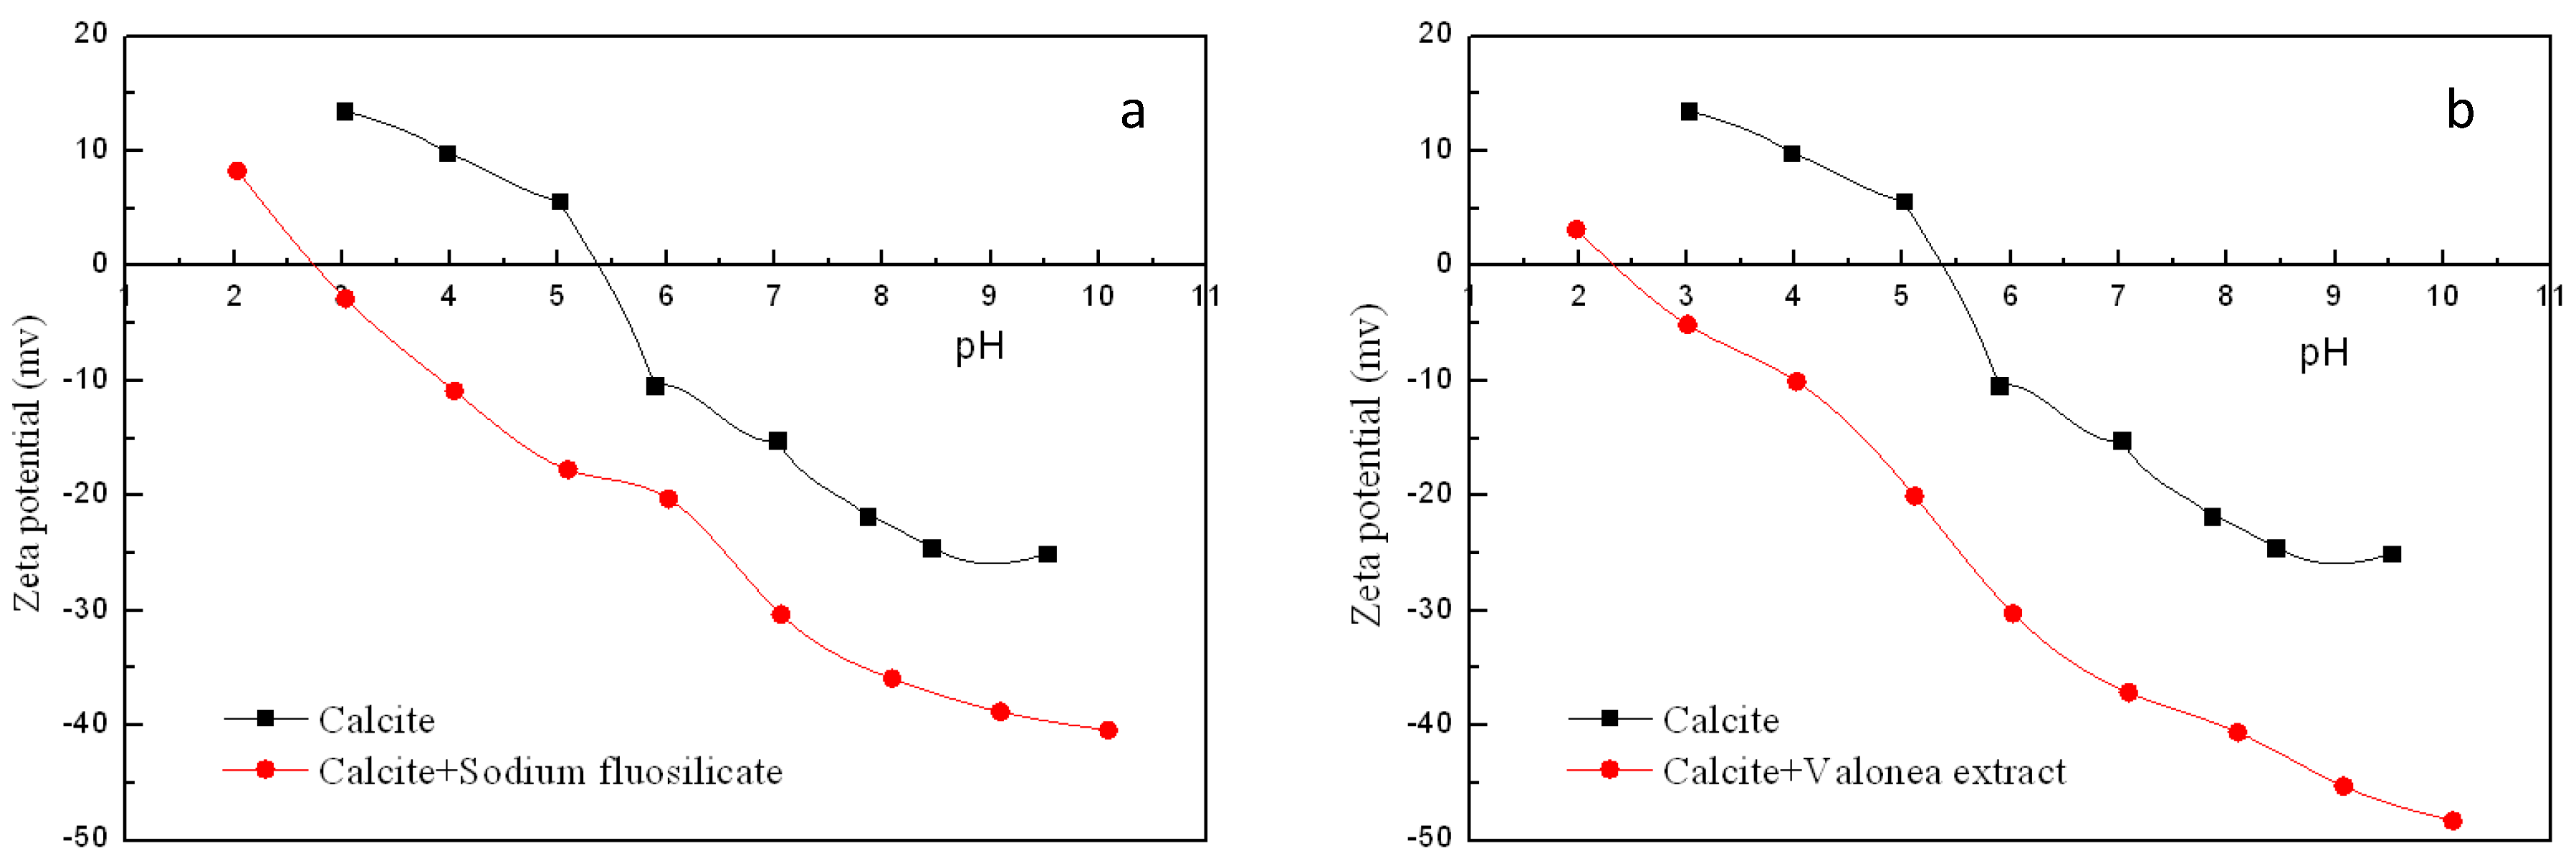
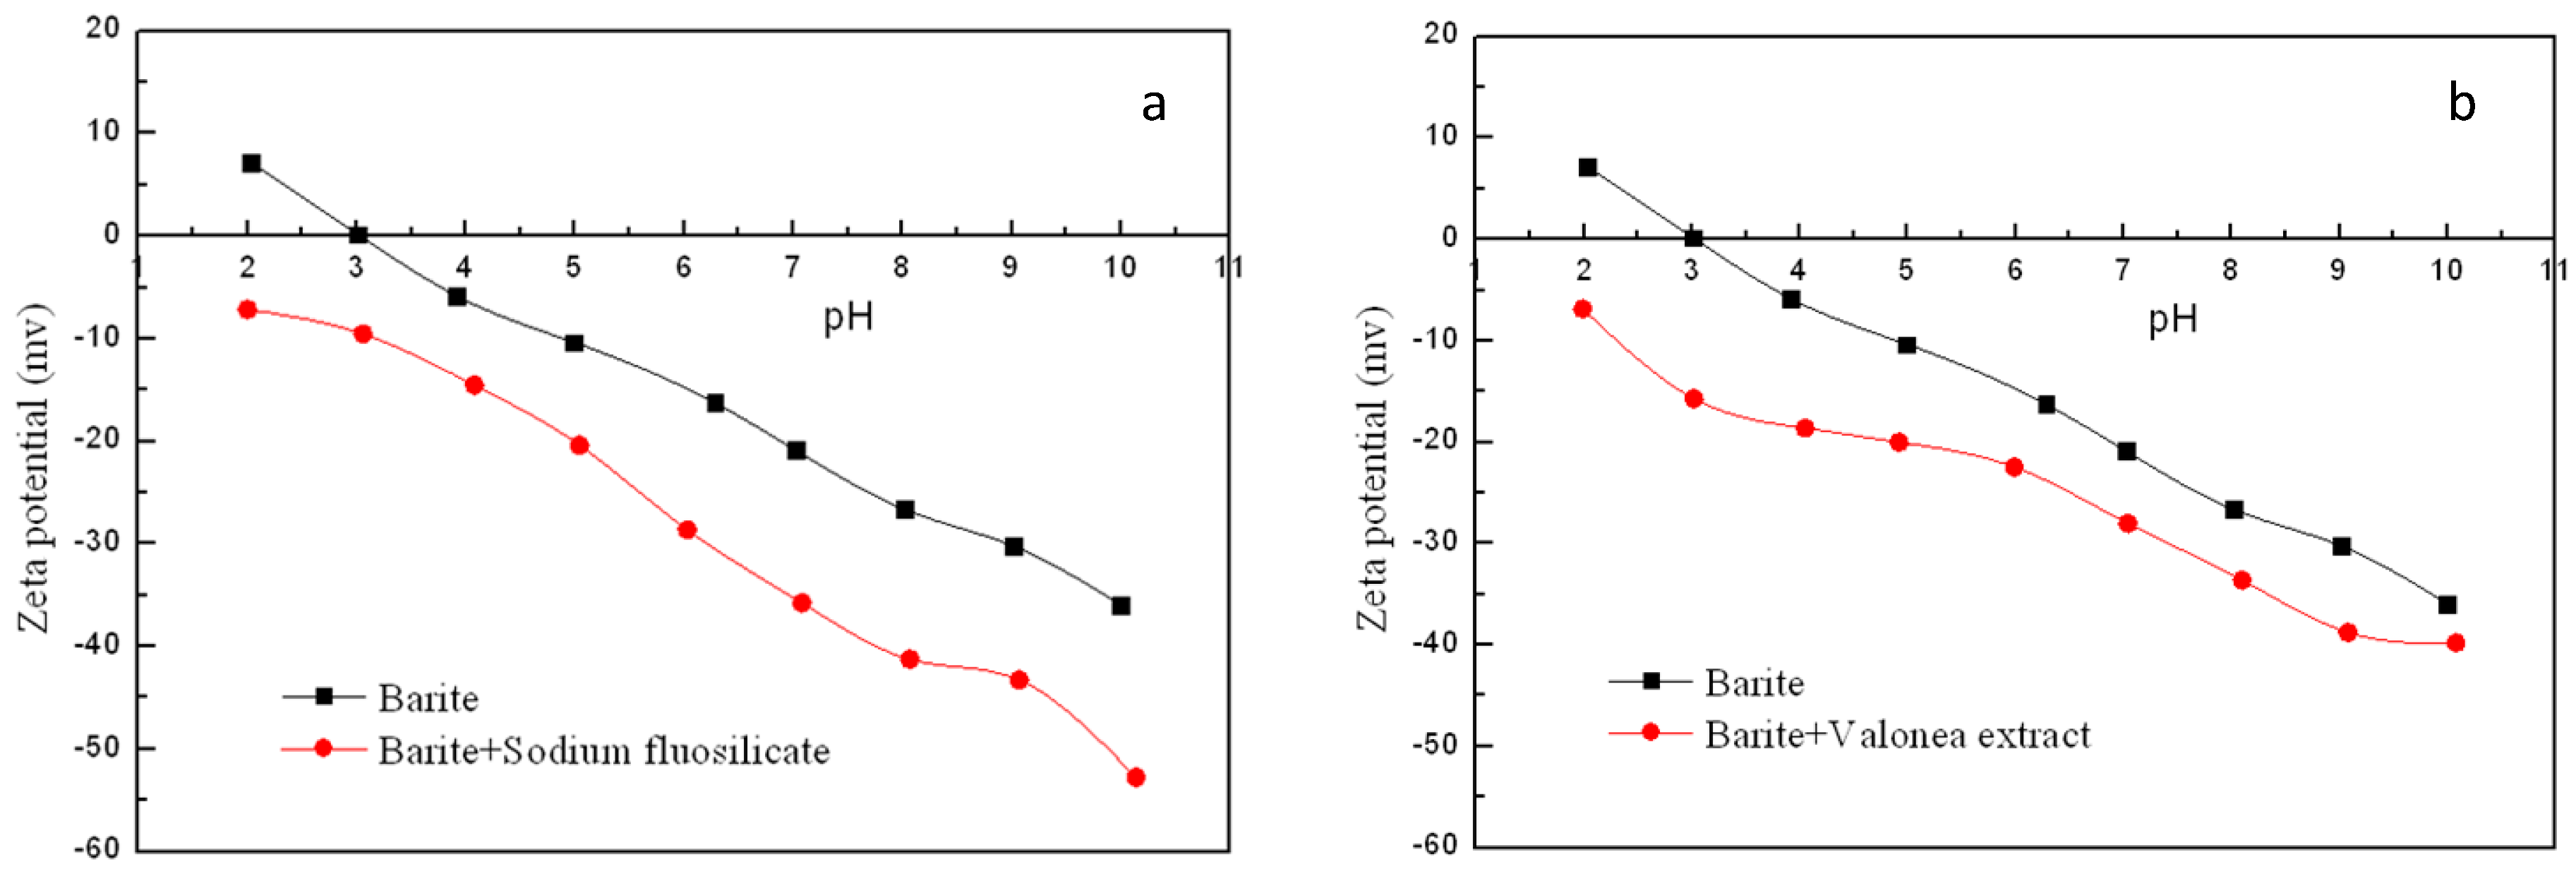
3.3. Zeta Potential Measurement Results
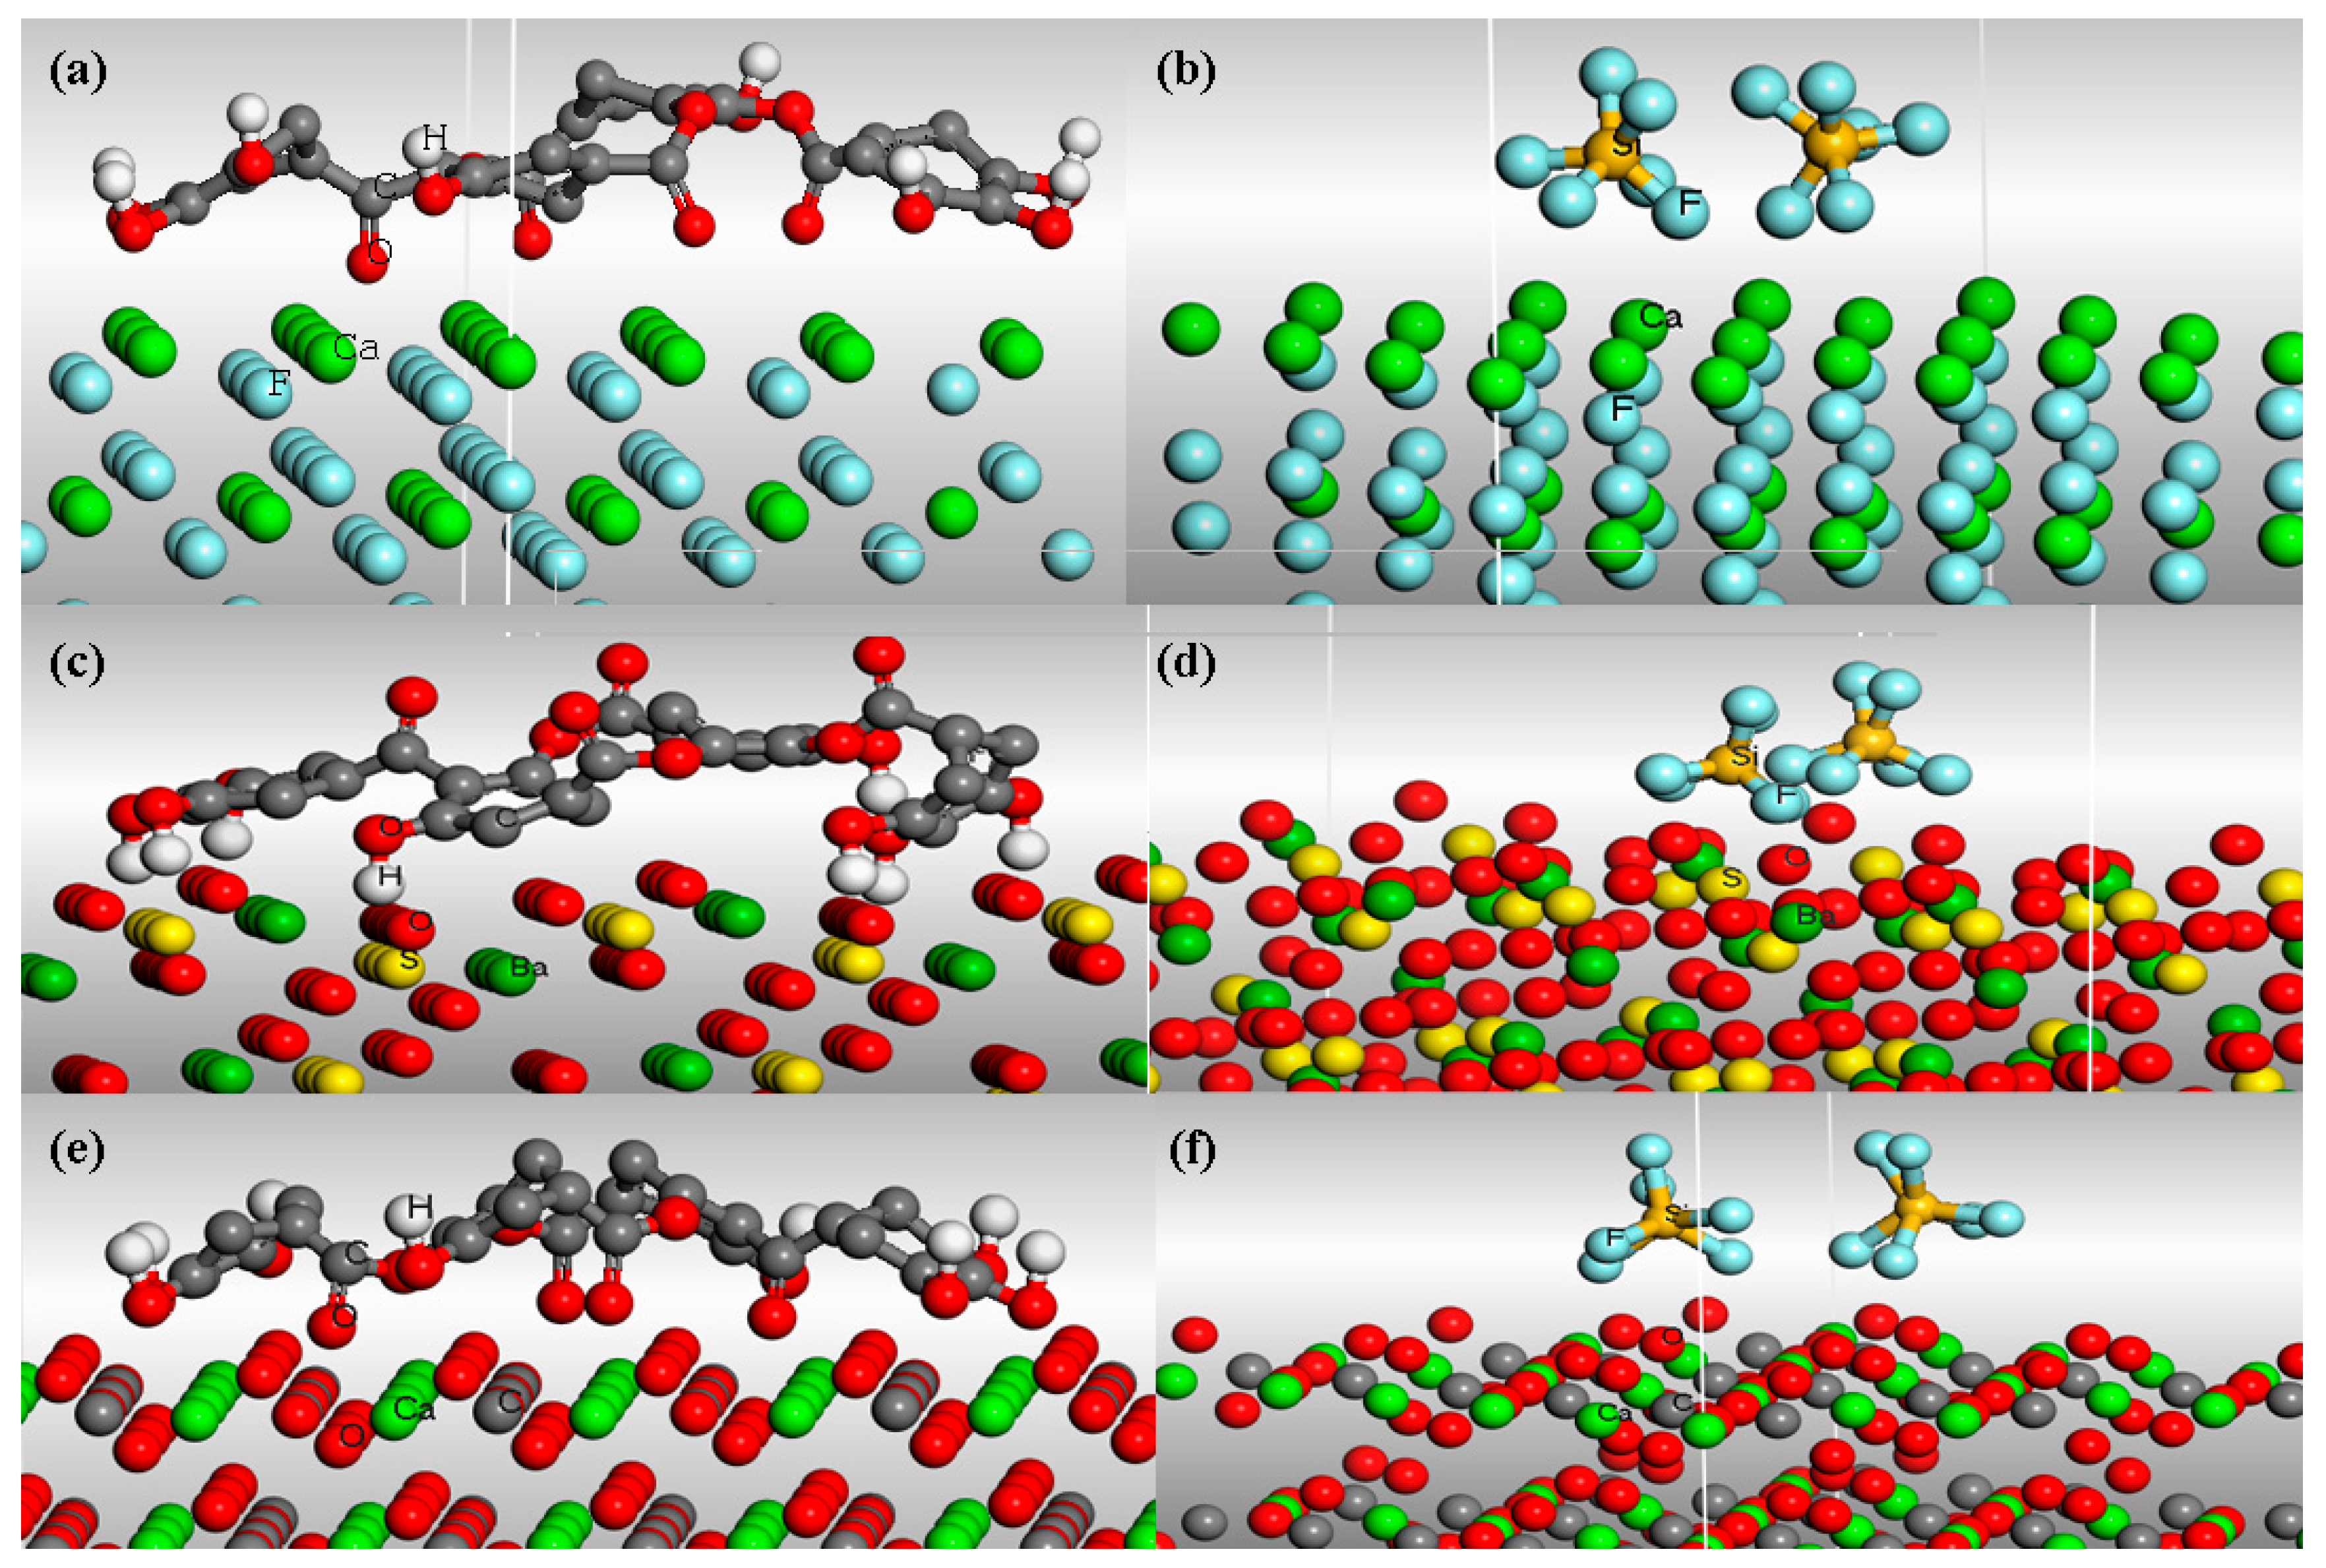
3.4. Computation of Interaction Energy by MD Simulations
4. Conclusions
Acknowledgments
Author Contributions
Conflicts of Interest
References
- Tao, S.J.; Yu, F.T.; Gao, H.M.; Guan, J.F.; Hu, T.H.; Zheng, H.Y. Experimental research on beneficiation of typical fluorite ore in Wuling Mountain. Ind. Miner. Process. 2015, 6, 13–15. [Google Scholar]
- Qian, Y.J.; Gao, L. Study on flotation separation for fluorite and salt minerals of calcite and barite. China Non-Met. Miner. Ind. 2014, 4, 18–21. [Google Scholar]
- Takamori, T.; Tsunnekawa, M. Separation of calcite from fluorite ore by the adsorption-washing-flotation method. CIM 1982, 75, 80. [Google Scholar]
- Schubert, H.; Baldauf, H.; Kramer, W.; Schoenherr, J. Further development of fluorite flotation form ores containing higher calcite contents with oleoylsarcosine as collector. Int. J. Miner. Process. 1990, 30, 185–193. [Google Scholar] [CrossRef]
- Giesekke, E.W.; Harris, P.J. Study of the selective flotation of fluorite from calcite by the use of a single bubble-stream microflotation cell. Int. Conf. Miner. Sci. Technol. 1985, 1, 269–277. [Google Scholar]
- Zhou, T.; Shi, W.H. Experimental research on the beneficiation of a high calcium fluorite mine in Jinta County. Met. Mine 2011, 3, 102–104. [Google Scholar]
- Zhou, W.B.; Chen, J.; Feng, Q.; Song, S.X. The effect of acidized water glass on beneficiation test of Mexico high calcium type fluorite ore. Non-Met. Mines 2013, 36, 31–32. [Google Scholar]
- Yin, W.Z.; Lu, Z.F.; Han, Y.X.; Li, Y.J. Application of NSOH in fluorite ore flotation and its depressing mechanism. J. Northeast. Univ. 2009, 30, 287–290. [Google Scholar]
- Niu, Y.F.; Huang, M. Beneficiation production practice of carbonate-type fluorite ore in Qinglong. Conserv. Util. Miner. Res. 2010, 3, 16–19. [Google Scholar]
- Lu, S.S.; Sun, C.Y. Effect of inorganic anion modifiers on flotability of barite in NaOl flotation system. Nonferr. Met. 2007, 4, 47–49. [Google Scholar]
- Chen, B.; Zhou, X.S.; Li, Z.Z. Experimental study of flotation of fluorite ore. Yunnan Metall. 2004, 33, 14–17. [Google Scholar]
- Li, Y.; Deng, X.L.; Xu, S. Study on the adsorption properties of dextrin on barite and fluorite surface and interaction mechanism. J. Chin. Ceram. Soc. 1997, 25, 317–322. [Google Scholar]
- Wang, S.Y.; Li, X.A.; Xue, W.Y. Mechanism of flotation separation of fluorite and barite with collector naphthenic acid and depressant aluminum sulfate. Non-Met. Mines 1997, 4, 39–41. [Google Scholar]
- Gao, Z.Q. Study on the Complexation of Vanadium Ions with the Tannin Extract. Ph.D. Thesis, Taiyuan University of Technology, Taiyuan, China, 2013. [Google Scholar]
- Hu, Y.H.; Gao, Z.Y.; Sun, W.; Liu, X.W. Anisotropic surface energies and adsorption behaviors of scheelite crystal. Colloids Surf. A Physicochem. Eng. Asp. 2012, 415, 439–448. [Google Scholar] [CrossRef]
- Gocmez, H. The interaction of organic dispersant with alumina: A molecular modelling approach. Ceram. Int. 2006, 32, 521–525. [Google Scholar] [CrossRef]
- Rai, B. Molecular modeling and rational design of flotation reagents. Int. J. Miner. Process. 2003, 72, 95–110. [Google Scholar]
- Pradip, X.; Rai, B.; Rao, T.K.; Krishnamurthy, S.; Vetrivel, R.; Mielczarski, J.; Cases, J.M. Molecular modeling of interactions of diphosphonic acid based surfactants with calcium minerals. Langmuir 2002, 18, 932–940. [Google Scholar] [CrossRef]
- Rai, B.; Sathish, P.; Tanwar, J.; Moon, K.S.; Fuerstenau, D.W. A molecular dynamics study of the interaction of oleate and dodecylammonium chloride surfactants with complex aluminosilicate minerals. J. Colloid Interface Sci. 2011, 362, 510–516. [Google Scholar] [CrossRef] [PubMed]
- Xu, L.H.; Wu, H.Q.; Dong, F.Q.; Wang, L.; Wang, Z.; Xiao, J.H. Flotation and adsorption of mixed cationic/anionic collectors on muscovite mica. Miner. Eng. 2013, 41, 41–45. [Google Scholar] [CrossRef]
- Fa, K.Q.; Jiang, T.; Nalaskowski, J.; Miller, J.D. Interaction forces between a calcium dioleate sphere and calcite/fluorite surface and their significance in flotation. Langmuir 2003, 19, 10523–10530. [Google Scholar] [CrossRef]
- Marinakis, K.I.; Shergold, H.L. Mechanism of fatty acid adsorption in the presence of fluorite, calcite and barite. Int. J. Miner. Process. 1985, 14, 161–176. [Google Scholar] [CrossRef]
- Marinakis, K.I.; Shergold, H.L. Influence of sodium silicate addition on the adsorption of oleic acid by fluorite, calcite and barite. Int. J. Miner. Process. 1985, 14, 177–193. [Google Scholar] [CrossRef]
- Yue, C.L. Research on the floatability of fluorite, barite and calcite. Ind. Min. Process. 2001, 9, 8–10. [Google Scholar]
- Yu, B.Q. Research on the Flotation of Ultra-fine Rare Earth Mineral. Ph.D. Thesis, General Research Institute for Nonferrous Metals, Beijing, China, 2014. [Google Scholar]
- Wang, C.X. The Flotation Theory and Application Study of the Alkaline Rock Type Rare Earth Ore. Ph.D. Thesis, Kunming University of Science and Technology, Kunming, China, 2013. [Google Scholar]
- Ruan, W.; Wang, Y.T. The application of combined reagent in the flotation of PingShui tailings to recycle barite. China Min. Mag. 2009, 18, 224–227. [Google Scholar]
- Yan, Y.; Zheng, G.S.; Zheng, S.L.; Hu, Z.B. Effects of depressant on recycling pyrite from tailings of lead-zinc ore. Ind. Min. Process. 2015, 1, 14–16. [Google Scholar]
- Gao, L.K. The Distribution Floatation Flowsheet and Theoretic of Fine/Micro-Fine Rutile Ores. Ph.D. Thesis, Kunming University of Science and Technology, Kunming, China, 2009. [Google Scholar]
- Zhang, C.H. The Experiment on Recycling of Iorn Minerals from Dahongshan Tailings. Ph.D. Thesis, Kunming University of Science and Technology, Kunming, China, 2011. [Google Scholar]
- Song, N.P.; Zhang, Z.H.; Wu, Y.J.; Li, F.B. The methods of depressing phosphorus impurities in flotation process of molybdenum concentrate. Metal Mine 2009, 7, 183–184. [Google Scholar]


| Component | SO3 | CaO | Cl | BaO | MgO | Al2O3 | SiO2 | SrO | F | Na2O | Cs2O | I | L.O.L a |
|---|---|---|---|---|---|---|---|---|---|---|---|---|---|
| Fluorite | 0.23 | 51.18 | 0.02 | 0.37 | 0.03 | - | 0.10 | 0.02 | 47.44 | - | - | - | 0.63 |
| Barite | 31.69 | 1.50 | 0.02 | 65.15 | - | 0.17 | - | - | - | 0.44 | 0.82 | - | 0.20 |
| Calcite | 0.51 | 54.90 | 0.02 | 1.34 | 0.21 | 0.01 | 0.02 | 0.09 | - | - | - | 0.02 | 42.90 |
| Minerals | Lattice Parameters | |
|---|---|---|
| Experimental | DFT Predicted | |
| Fluorite | a = 5.463 Å, b = 5.463 Å, c = 5.463 Å, α = β = γ = 90° | a = 5.463 Å, b = 5.463 Å, c = 5.463 Å, α = β = γ = 90° |
| Barite | a = 8.881 Å, b = 5.454 Å, c = 7.156 Å, α = β = γ = 90° | a = 8.884 Å, b = 5.458 Å, c = 7.153 Å, α = β = γ = 90° |
| Calcite | a = 4.989 Å, b = 4.989 Å, c = 17.062 Å, α = β = 90°, γ = 120° | a = 4.987 Å, b = 4.987 Å, c = 17.051 Å, α = β = 90°, γ = 120° |
| Samples | Yield (%) | Grade (%) | Recovery (%) | ||||
|---|---|---|---|---|---|---|---|
| CaCO3 | CaF2 | BaSO4 | CaCO3 | CaF2 | BaSO4 | ||
| Calcite products | 28.21 | 33.26 | 42.03 | 24.71 | 93.83 | 26.35 | 15.49 |
| Fluorite products | 32.36 | 1.66 | 94.71 | 3.63 | 5.38 | 68.10 | 2.61 |
| Barite products | 39.43 | 0.20 | 6.33 | 93.47 | 0.79 | 5.55 | 81.90 |
| Mixed minerals | 100.00 | 10.00 | 45.00 | 45.00 | 100.00 | 100.00 | 100.00 |
| Adsorbate | Adsorbent | ||
|---|---|---|---|
| Fluorite | Barite | Calcite | |
| Tannin | −897.38 | −1910.45 | −3169.39 |
| Sodium fluosilicate | −81.74 | −92.46 | −86.24 |
| Water | −16.34 | −21.24 | −31.12 |
© 2017 by the authors. Licensee MDPI, Basel, Switzerland. This article is an open access article distributed under the terms and conditions of the Creative Commons Attribution (CC BY) license ( http://creativecommons.org/licenses/by/4.0/).
Share and Cite
Ren, Z.; Yu, F.; Gao, H.; Chen, Z.; Peng, Y.; Liu, L. Selective Separation of Fluorite, Barite and Calcite with Valonea Extract and Sodium Fluosilicate as Depressants. Minerals 2017, 7, 24. https://doi.org/10.3390/min7020024
Ren Z, Yu F, Gao H, Chen Z, Peng Y, Liu L. Selective Separation of Fluorite, Barite and Calcite with Valonea Extract and Sodium Fluosilicate as Depressants. Minerals. 2017; 7(2):24. https://doi.org/10.3390/min7020024
Chicago/Turabian StyleRen, Zijie, Futao Yu, Huimin Gao, Zhijie Chen, Yongjun Peng, and Lingyun Liu. 2017. "Selective Separation of Fluorite, Barite and Calcite with Valonea Extract and Sodium Fluosilicate as Depressants" Minerals 7, no. 2: 24. https://doi.org/10.3390/min7020024
APA StyleRen, Z., Yu, F., Gao, H., Chen, Z., Peng, Y., & Liu, L. (2017). Selective Separation of Fluorite, Barite and Calcite with Valonea Extract and Sodium Fluosilicate as Depressants. Minerals, 7(2), 24. https://doi.org/10.3390/min7020024