Article

Investigation of Enhanced Leaching of Lithium from α-Spodumene Using Hydrofluoric and Sulfuric Acid

1
School of Minerals Processing and Bioengineering, Central South University, Changsha 410083, China
2
Institute of Chemical Technologies, College of Chemical Engineering, Fuzhou University, Fuzhou 350108, China
*
Authors to whom correspondence should be addressed.
Minerals 2017, 7(11), 205; https://doi.org/10.3390/min7110205
Submission received: 21 August 2017 / Revised: 11 October 2017 / Accepted: 25 October 2017 / Published: 27 October 2017

Abstract

:
An effective method using hydrofluoric and sulfuric acid was proposed to enhance the leaching of lithium from α-spodumene, without calcination that is subjected to 1000 °C for phase transformation. The thermodynamic feasibility of the reactions was firstly verified. Dissolution conditions were tested to maximize the leaching efficiency of lithium and with efficient utilization of hydrofluoric acid (HF) served as evaluation criteria. The results showed that 96% of lithium could be transferred into lixivium with an ore/HF/H2SO4 ratio of 1:3:2 (g/mL/mL), at 100 °C for 3 h. Due to the fact that HF molecules were the main reaction form, the dissolution behaviors were theoretically represented and investigated by dissolution in HF/H2SO4. When combined with chemical elements analyses and characterizations, the results of the dissolution behaviors revealed that α-spodumene and albite were preferentially dissolved over quartz. Insoluble fluoroaluminates, such as AlF3, cryolite (Na3AlF6) and cryolithionite (Na3Li3Al2F12), were generated and might be further partially dissolved by H2SO4. Fluorosilicates, such as K2SiF6, Na2SiF6, or KNaSiF6, were also generated as a part of the insoluble residues. This work provides fundamental insight into the role of HF/H2SO4 played in the dissolution of α-spodumene, and sheds light on a novel and promising process to efficiently extract lithium.

1. Introduction

Lithium, as a strategic metal, is widely applied in lithium-ion batteries and other electrochemical devices due to its fascinating and rechargeable electrochemical properties [1,2]. Moreover, the irreplaceable role of lithium in glass, the ceramic industry, and pharmaceutical applications makes the extraction of lithium an important issue with respect to the rapidly increasing demand for lithium. Generally, lithium is available from brine deposits and some commercial ore sources. Currently, extracting lithium from brine is the dominant method due to the lower manufacturing costs and massive reserves [3,4]. However, extraction from ore sources benefits from a shorter production cycle (usually a matter of days) to lithium carbonate products, as opposed to brines, which often takes months or years to form [5,6]. Therefore, lithium extraction from some commercially applicable ore sources is still important, especially for the preparation of high-purity lithium compounds [5,6].
Spodumene (LiAlSi2O6), has attracted a great deal of interest as one of the most important commercially-applicable lithium ores due to its high theoretical lithium content (up to 8.03% (wt %) Li2O) [7,8]. Various processes, including traditional acid or alkaline digestion, or the recently-proposed roasting using sodium or calcium salts via ion exchange, have been reported to successfully extract lithium from spodumene [9,10,11,12,13]. These extraction processes are generally divided into two modules (Figure 1): One is to transfer lithium into lixivium via dissolution or leaching; while, the other is separation and purification before concentration and conversion to Li2CO3 or other lithium products. The purification principles of module 2 are similar in that pH is often adjusted to precipitate iron, calcium, magnesium, or other metal ions, while in module 1, pretreatments, like calcination at > 1000 °C, are usually used to transform α-spodumene into a much more reactive β phase, as the crystal structure of the α phase is compact and resistant to almost all chemical agents, causing a great deal of energy consumption. More effective strategies should be developed to maximize lithium leaching and reduce production costs.
Hydrofluoric acid, which is capable of dissolving many materials, is specially used for etching SiO2 or silicon compounds in the microelectronic industry [14,15,16]. The HF/HCl system (called mud acid) is usually employed for acidizing in the petrochemical industry [17,18,19]. When combined with the high efficiency of the sulfuric acid process [10], a method using hydrofluoric/sulfuric acid (HF/H2SO4) mixture was proposed to extract lithium from α-spodumene using fluorite (CaF2) [20], or other fluorides, as the source of HF. Figure 1 shows a schematic diagram of the proposed HF/H2SO4 method. This method attempted to directly dissolve α-spodumene without calcination for phase transformation. Dissolution conditions were firstly optimized in the mixed lixivant HF/H2SO4 to maximize the leaching efficiency of lithium. Moreover, the dissolution behavior, which theoretically represented via dissolution in HF/H2SO4, was investigated due to the fact that HF molecules were the actual reactant to dissolve the mineral [17,18,19]. Additionally, the effects on the formation of insoluble intermediates were determined, and were combined with some qualitative and quantitative characterization analyses. This HF/H2SO4 method achieved an efficient leaching of lithium without calcination, and also has no strict requirements on ore grade and deserves intensive investigation.

2. Experimental Section

2.1. Materials and Reagents

The α-spodumene ore sample was obtained from Talison Lithium Pty Ltd., Greenbushes, Australia. The Li2O content in the ore sample was about 5% (wt %) determined using AAS (atomic absorption spectroscopy) analysis. The ore was firstly ground using a planetary ball mill and sieved to a particle size <75 µm prior to performing dissolution experiments. Concentrated sulfuric acid (18.2 M H2SO4, 98% (wt %)) and hydrofluoric acid (22.5 M HF, 40% (wt %)) were employed and were both of an analytical grade. The concentrated sulfuric acid was pre-diluted at a 1:1 (mL/mL) ratio using deionized water.

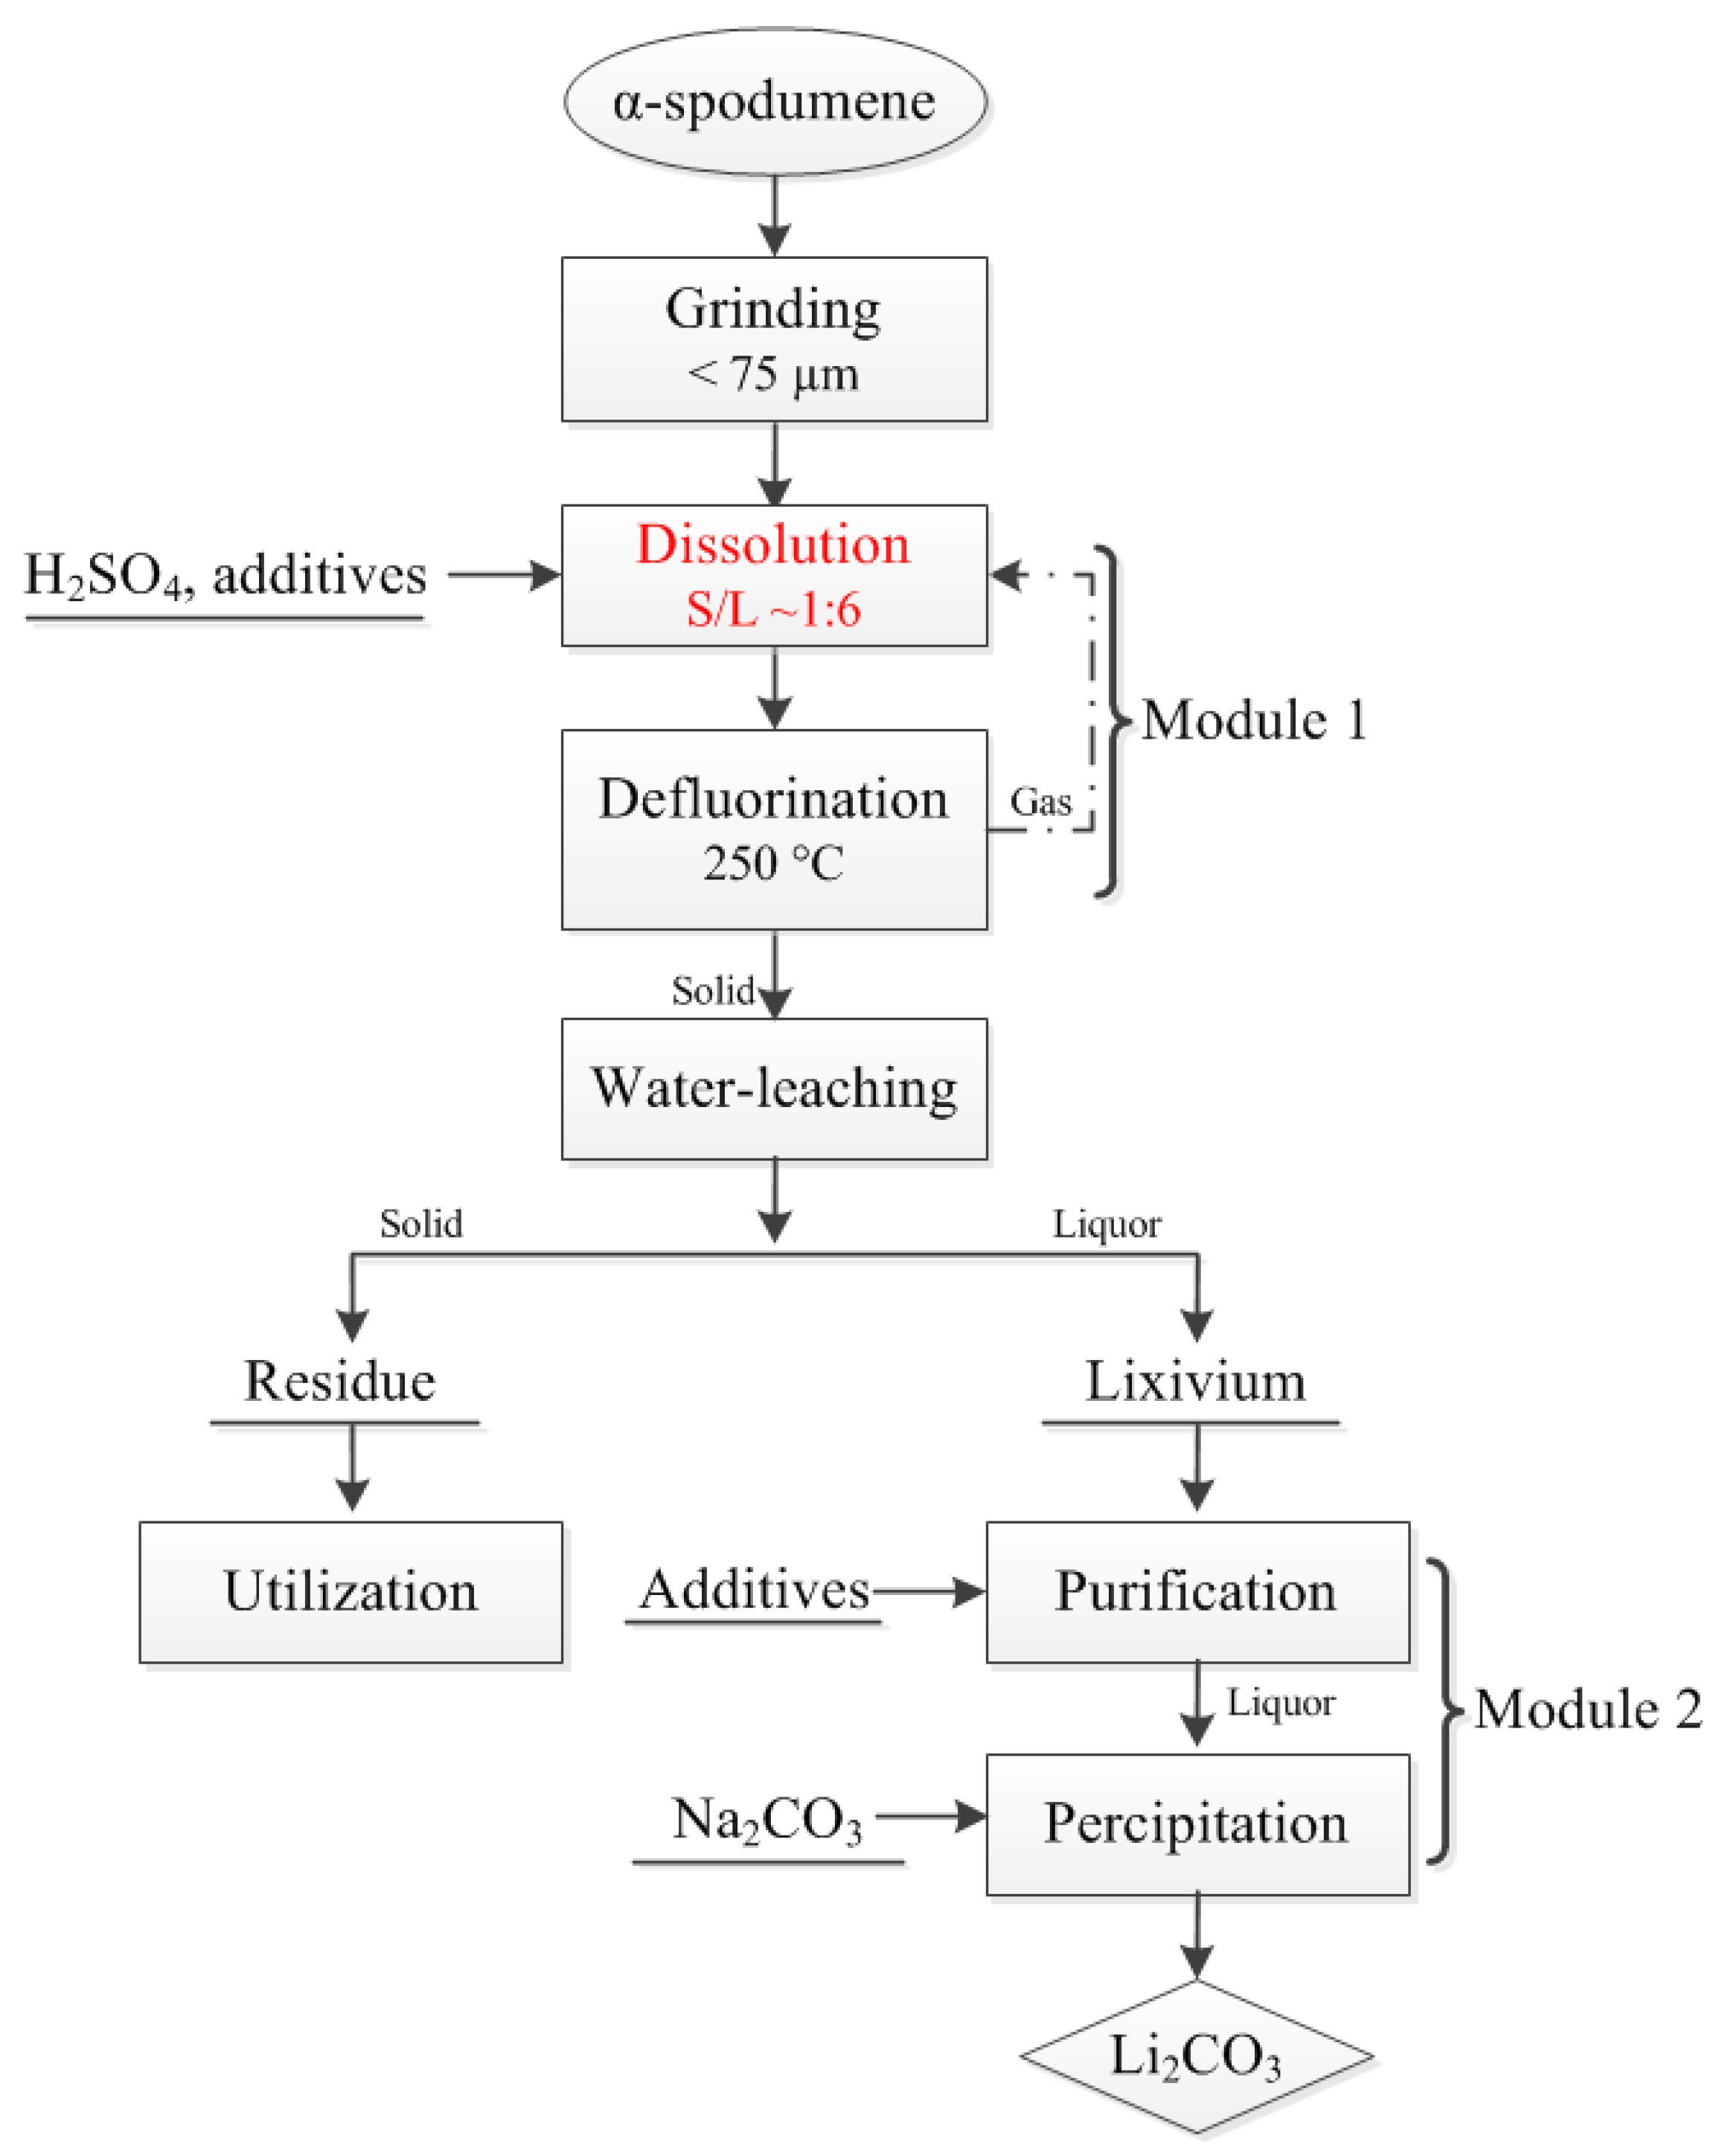
2.2. Experimental Procedures

The dissolution experiments were performed in a 100 mL Teflon crucible, equipped with a magnetic stirring device, and kept at a preset temperature by an oil bath. A specific amount of ore (10 g for the experiment), deionized water, and 1:1 H2SO4 were first mixed and stirred continuously in a reactor. Once the desired temperature (50 to 125 °C) was reached, HF was added and stirring was maintained at 150 rpm for a certain dissolution time. Subsequent water-leaching was carried out at 50 °C with an ore/water ratio of 1:8 (g/mL) and was stirred at 150 rpm for 30 min. When the slurry was cooled to ambient temperature, the liquid and solids were separated by filtration and were subjected to analysis.

2.3. Analytical Methods and Charaterization

The leaching efficiency of lithium (L%) and the percentage of insoluble residues (R%) calculated based on Equations (1) and (2) were used to evaluate the efficiency of the reaction system.
L ( % ) = Q m × V 10 6 × m o r e × w t % × 100 %
R ( % ) = m r e s m o r e × 100 %
Qm: Lithium concentration in lixivium, mg/L; V: Lixivium volume, mL; more: Mass of ore sample, g; wt: Mass fraction of lithium in ore sample, %; mres: Mass of insoluble residues obtained.
The lithium content in solution was determined using atomic absorption spectroscopy (AAS, AA-6800, Shimadzu, Kyoto, Japan) with an uncertainty of 0.5%. Other major element contents in the solids were determined semi-quantitatively via X-ray fluorescence (XRF, model ZSX Primus II, Rigaku, Osaka, Japan) using the pressed bullet method for sample preparation. Major elements, except for Li in lixivium, were determined using an inductively-coupled plasma atomic emission spectrometer (ICP-AES, PS-6, Baird, Boston, MA, USA), with a deviation of 0.3%. X-ray diffraction analysis (XRD, D/max-2550, Rigaku, Osaka, Japan), combined with major elemental analysis, was employed to determine the compositions of the solid phase. Morphological changes during the dissolution were observed and carried out using a field-emission scanning electron microscope (FESEM, MIRA3 LMU, TESCAN, Brno, Czech Republic) equipped with an energy-dispersive X-ray spectrometer (EDX, X-Max20, Oxford, Oxford, UK). Additionally, X-ray photoelectron spectroscopy (XPS, ESCALAB 250Xi, ThermoFisher-VG Scientific, Waltham, MA, USA) was also employed to help further determine the chemical bonds that were generated in the intermediates. Spectra of symbolic elements, such as Al, F, and Si, were obtained, relative to the C 1s binding energy (284.8 eV). In addition, thermo-gravimetric (TG) analyses were performed to determine the thermal decomposition behaviors, using a simultaneous thermal analyzer (STA, STA8000, PerkinElmer, Waltham, MA, USA), which was also important for the utilization of the residues.

3. Results and Discussion

3.1. Chemical Analysis and Characterization of Ore Samples

The ore was mainly α-spodumene (LiAlSi2O6, JCPDS 33-0786), and included some albite (NaAlSi3O8, JCPDS 09-0466) and quartz (SiO2, JCPDS 65-0466). The chemical analysis of the ore sample is listed in Table 1. The detailed XRF analyzed results of the ore sample are listed in Table S1.

3.2. Thermodynamic Analysis

The dissolution of β-spodumene in HF proposed by Rosales et al. [12], given by Reaction (3), combined with further reaction with H2SO4 is expressed by Reaction (4), which can be used to estimate the dissolution of α-spodumene in HF/H2SO4.
LiAlSi 2 O 6 ( s ) + 19 HF ( aq ) LiF ( aq ) + H 3 AlF 6 ( aq ) + 2 H 2 SiF 6 ( aq ) + 6 H 2 O
2 LiAlSi 2 O 6 ( s ) + 24 HF ( aq ) + 4 H 2 SO 4 ( aq ) Li 2 SO 4 ( aq ) + Al 2 ( SO 4 ) 3 ( aq ) + 4 H 2 SiF 6 ( aq ) + 12 H 2 O
The thermodynamic feasibility of Reaction (4) was verified using HSC Chemistry 6.0 software. The thermodynamic properties were obtained from the HSC database [21] and Reference [22]. The results are presented in Table 2 for the temperature range from 0 to 125 °C.
Thermodynamic analysis (∆G° < 0) indicated that the dissolution α-spodumene by HF/H2SO4 could spontaneously occur in the temperature range 0 to 125 °C. However, more investigations should be carried out in order to understand the dissolution process using the HF/H2SO4 method.

3.3 Investigation of Dissolution Conditions

The dissolution process mainly depends on mineral compositions and solution chemistry. Therefore, it is essential to investigate the effects of different factors on the dissolution process to maximize the leaching of lithium. A series of dissolution experiments were carried out under different conditions: Ratio of ore/HF (g/mL), ore/H2SO4 (g/mL), dissolution temperature and time. The stirring speed was set to 150 rpm due to the slight influence of stirring speed and the limitations of the reactor. The subsequent water-leaching process was conducted according to the procedures in Section 2.2. A high leaching efficiency of lithium served as the optimal criterion. Meanwhile, efficient usage of HF and percentage of insoluble residues should also be comprehensively taken into consideration before establishing the optimal dissolution conditions. The detailed AAS analyzed results of the lithium contained in the lixivium under different conditions are listed in Tables S2–S6.

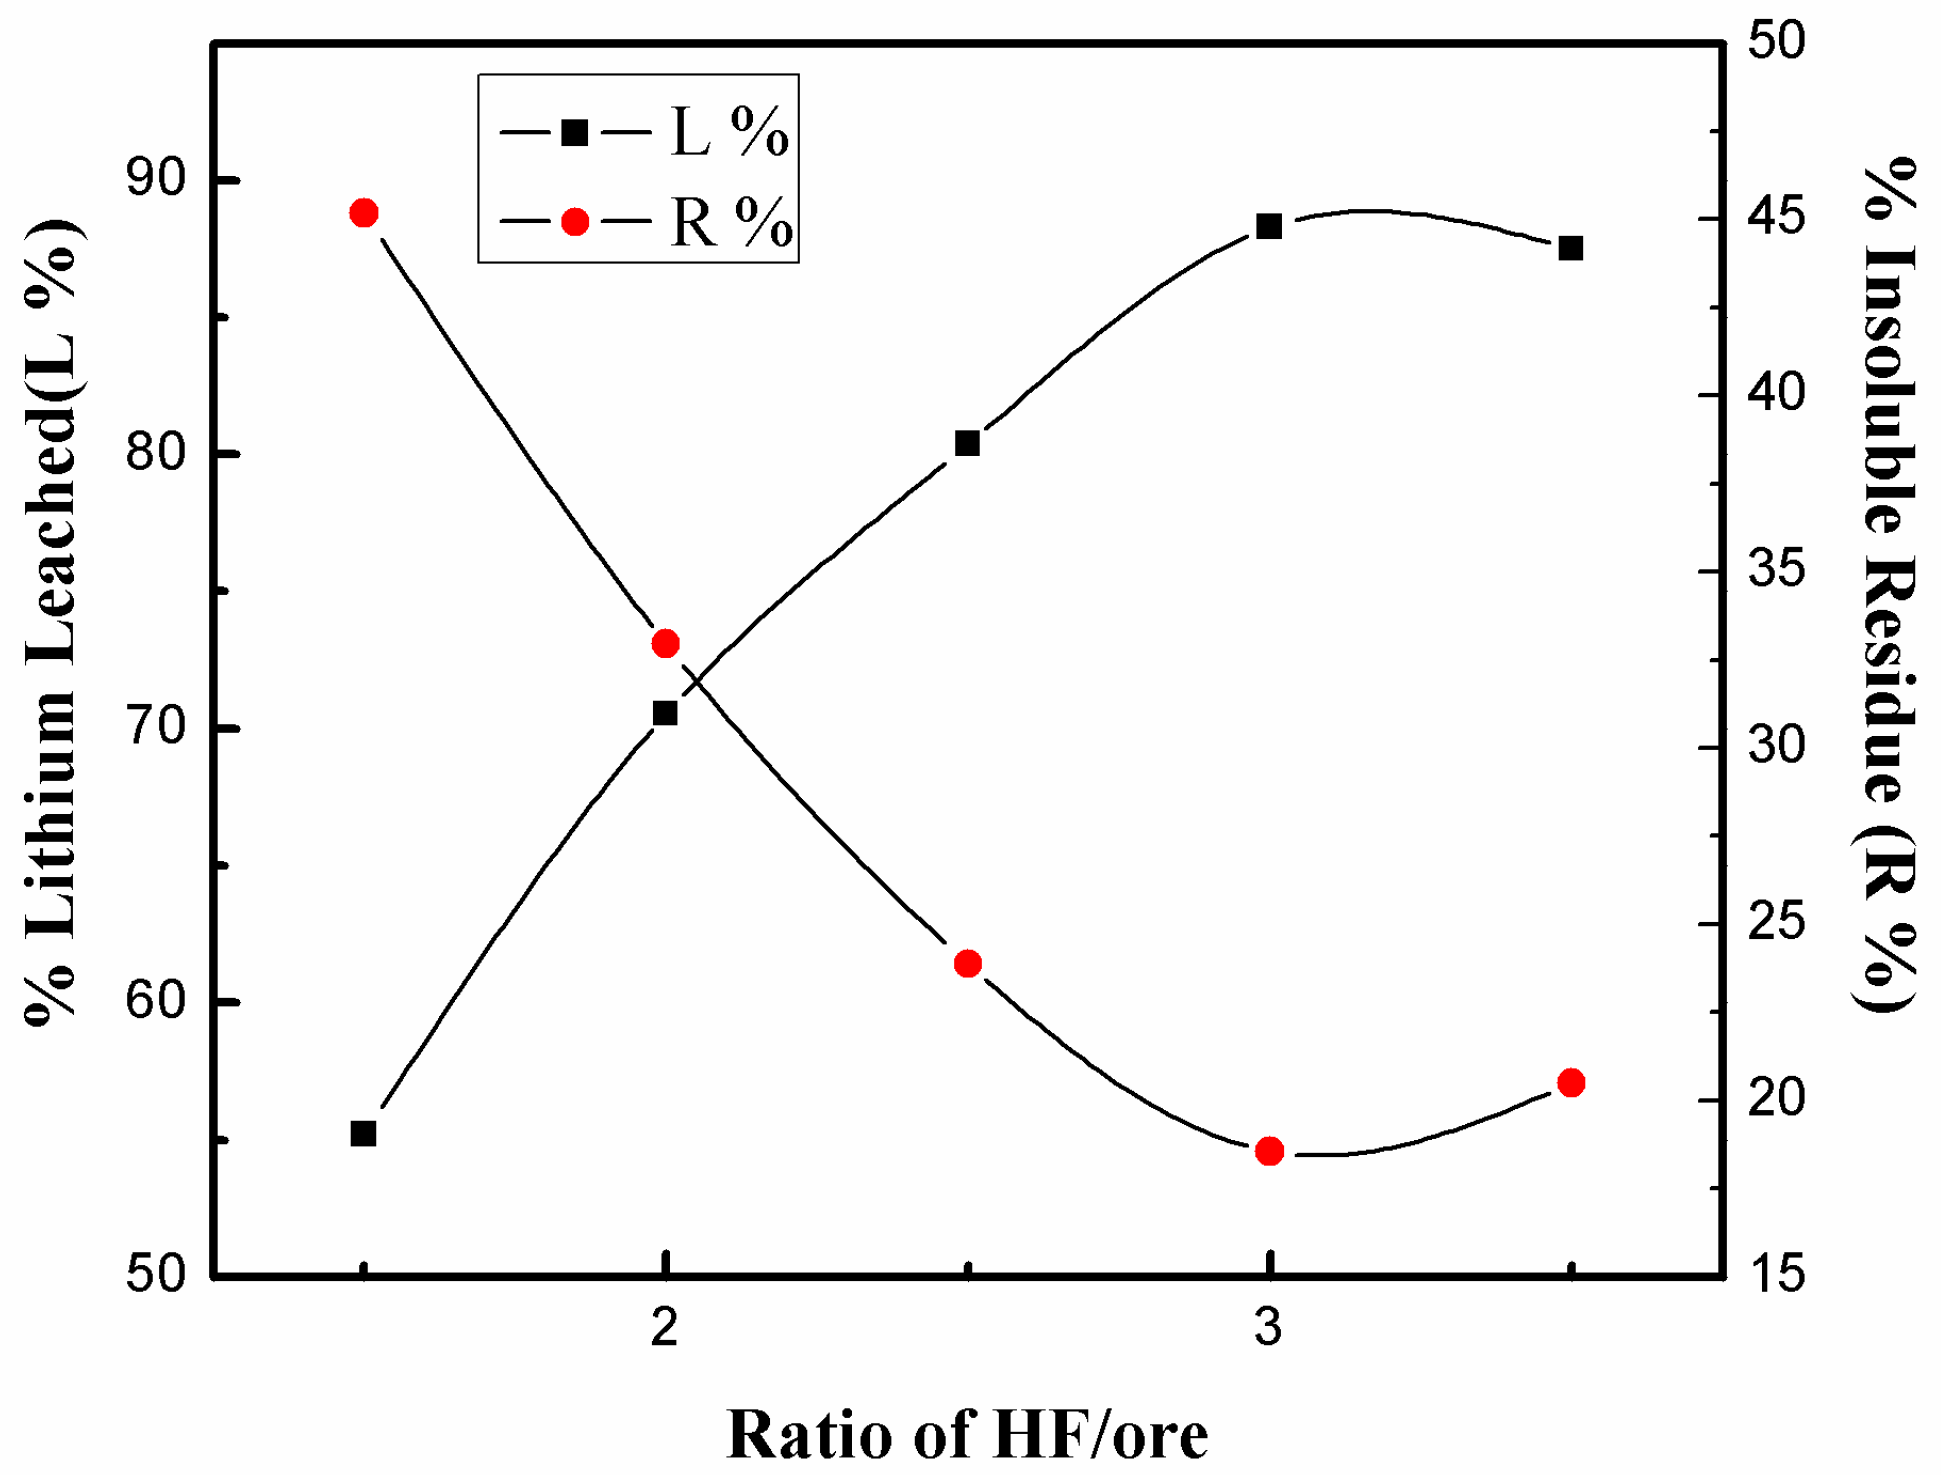
3.3.1. Effect of HF/Ore Ratio

The dissolution processes of feldspar or sandstones in HF or HF/HCl mixtures indicated that the reactions were limited by hydrofluoric acid absorbing onto the mineral surface and forming highly-stable complex fluorides, such as fluorosilicates and fluoroaluminates, due to the outstanding electronegativity of F [17,18,19]. Experiments using different ore/HF (Figure 2) showed that the leaching efficiency of lithium increased with the increase in HF/ore ratio. About 90% of the lithium leached when ore/HF ratio was 1:3, approximating the stoichiometric ratio according to Reaction (3).
However, the increase in ore/HF ratio to 1:3.5 caused a decrease in L% and an increase in R%. The XRD analysis of the residues obtained with ore/HF ratio of 1:3.5 (Figure 3d) showed that more fluorosilicates, such as KNaSiF6 (JCPDS 43-1313) and Na2SiF6, were generated. Additionally, XRD analysis showed that the peak intensities of quartz decreased. The detection of KNaSiF6 (JCPDS 43-1313) at ore/HF ratio less than 1:3, indicates the cleavage of Si–O and dissolution of which is unfavorable due to a high concentration of HF. Rosales [12] deemed that albite starts to dissolve if the amount of HF is over the required stoichiometric ratio, according to Reaction (3). However, peaks of cryolithionite (Na3Li3Al2F12) (JCPDS 22-0416) were generated, even at HF additions under the stoichiometric value. Thus, the selective dissolution of α-spodumene over albite did not take place due to two reasons: (i) the low reactivity of α-spodumene, and (ii) the dissolution process was coupled to the dissolution of albite. However, selective dissolution could still be achieved to a certain extent as the dissolution of quartz can be limited by adjusting the amount of added HF. When considering the leaching efficiency of lithium, along with the efficient utilization of HF, the suitable ratio of ore/HF that could be added was determined as 1:3 (g/mL), and approximated the stoichiometric ratio of Reaction (3).

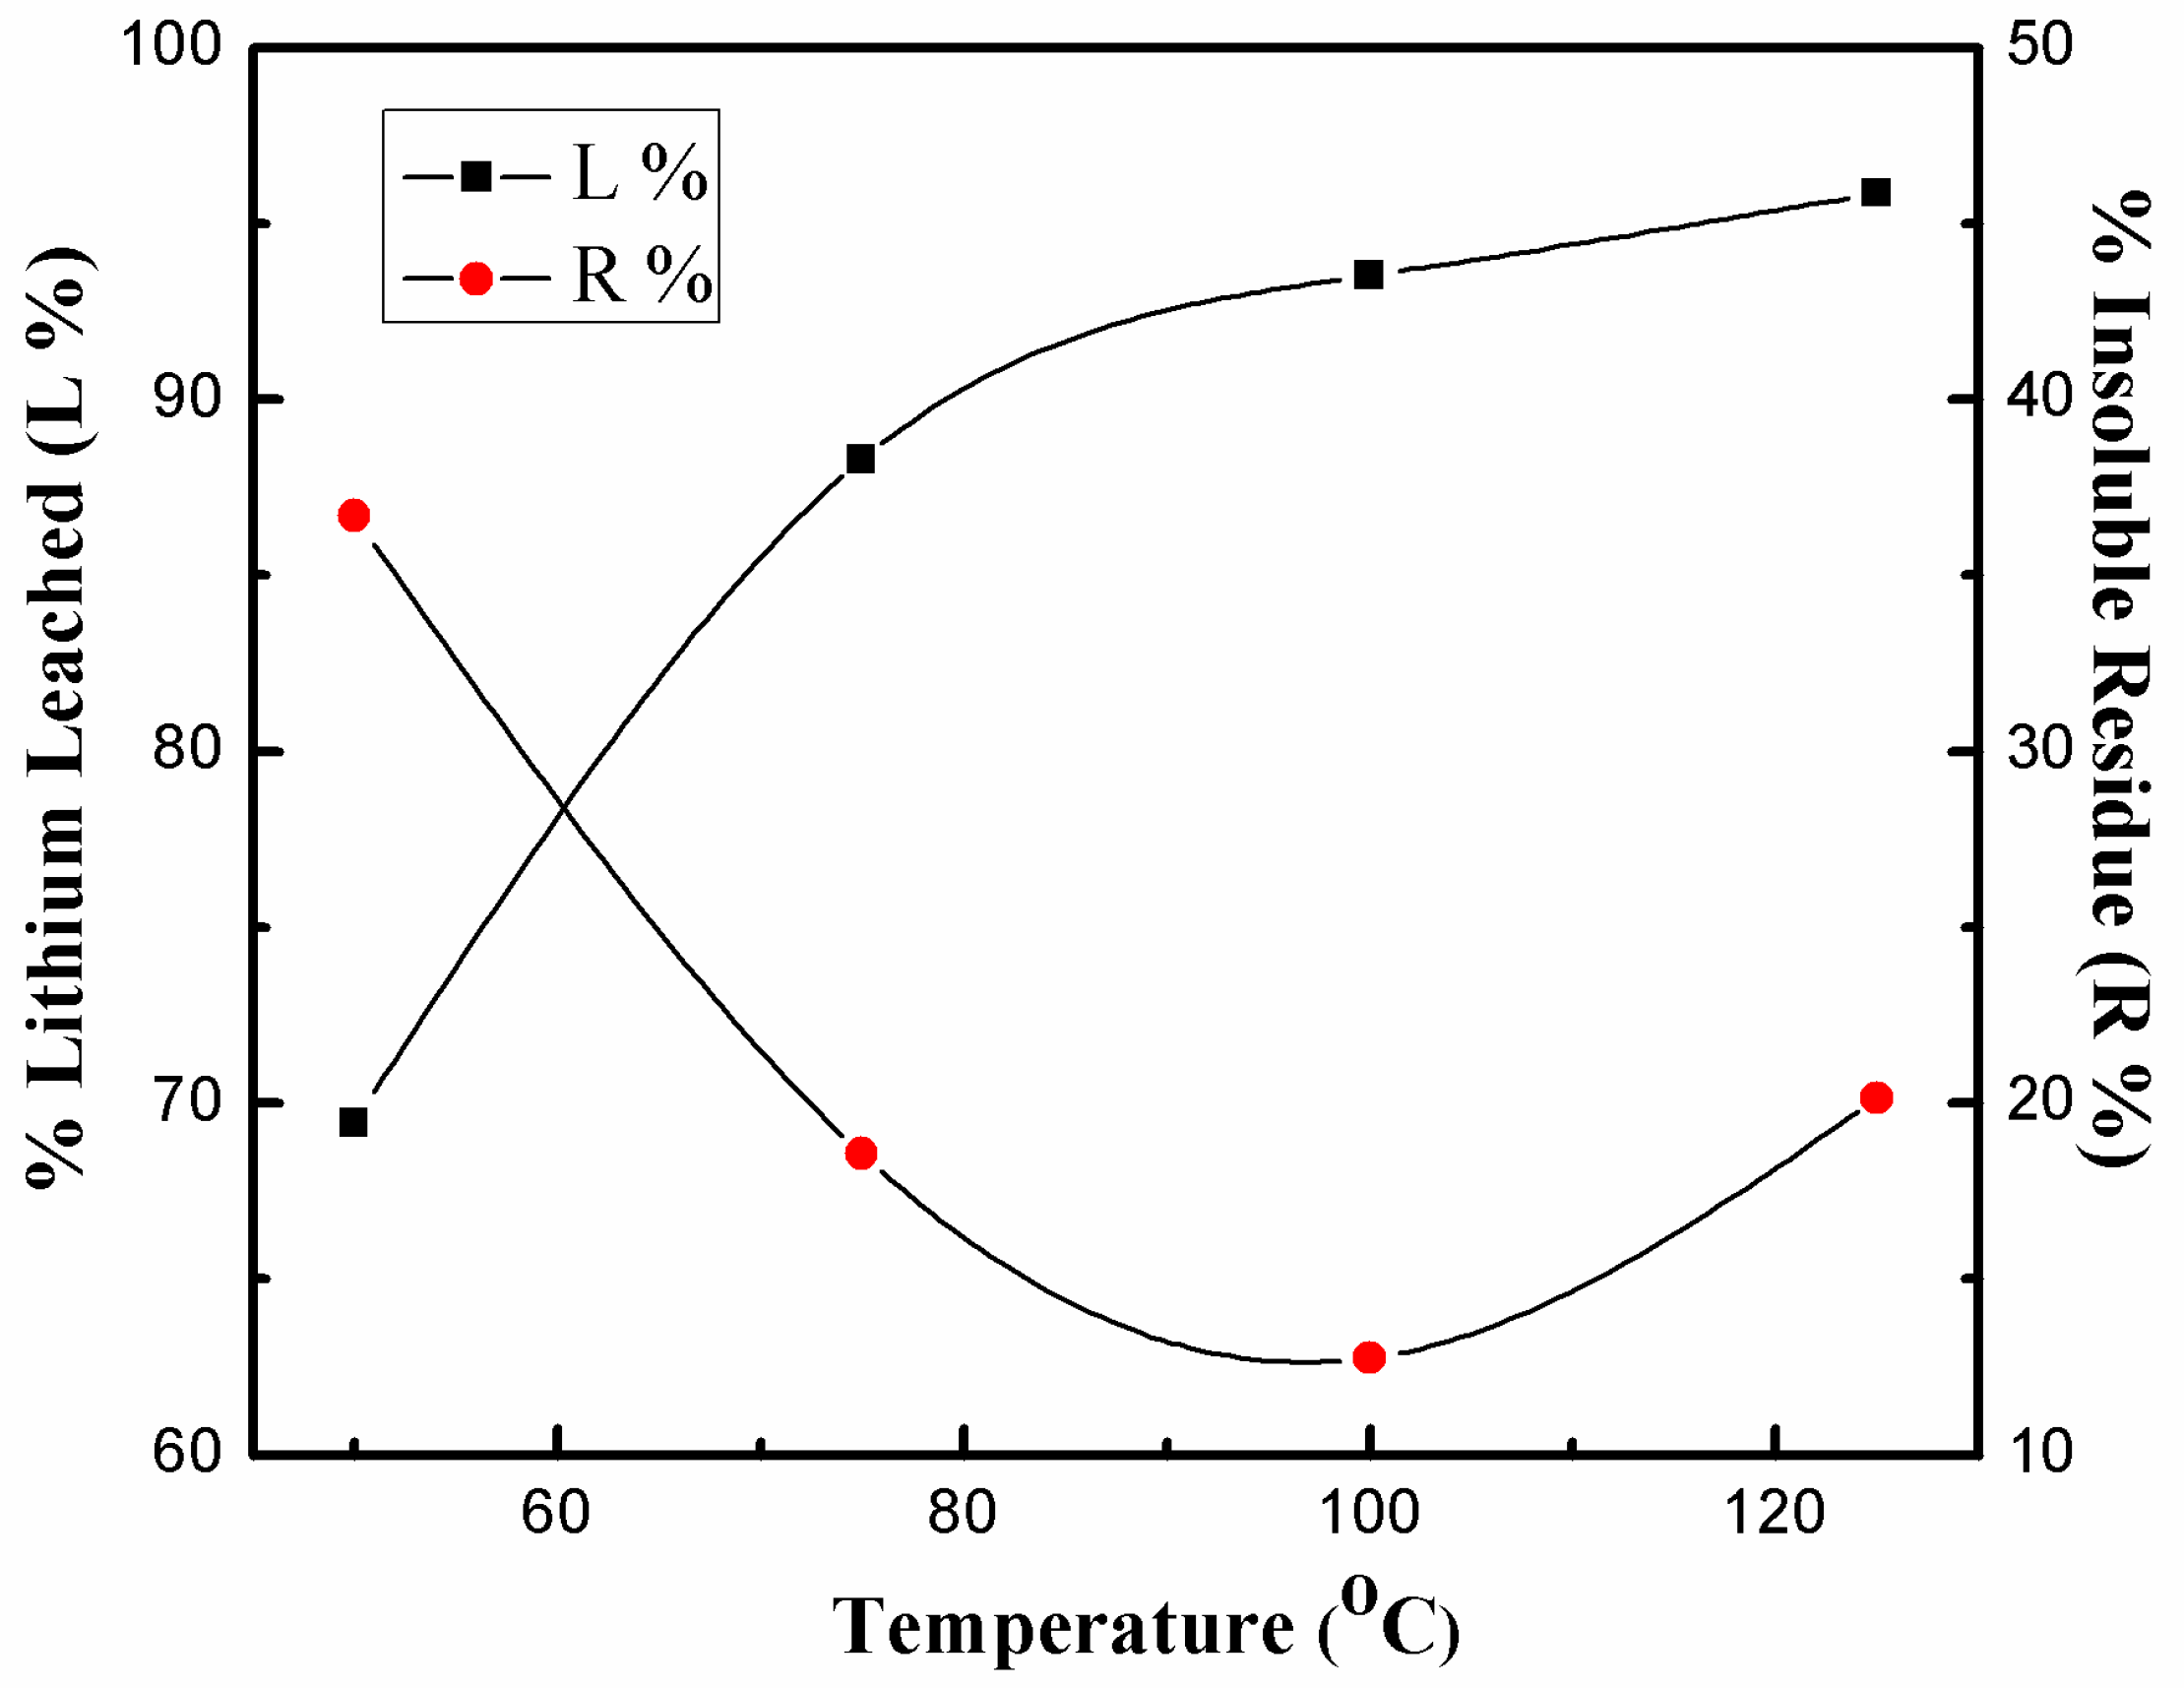
3.3.2. Effect of Dissolution Temperature

Experiments were conducted under different dissolution temperatures, from 50 to 125 °C; Figure 4 shows that lithium leaching accelerated with increasing temperature. However, the XRD analyses of the residues in Figure 5 show that different phases were detected at different temperatures. For instance, typical peaks of Na3Li3Al2F12 at 60.9° were detected at 75 °C, but not at 100 °C, indicating that the formation of residues was dramatically influenced by the temperature. In other words, temperature could influence complexing among ions, such as Li+, Al3+ with F, which are insoluble fluorides, such as Na3Li3Al2F12, K2AlF5, or AlF3, and were generated under different temperatures (Figure 5). Therefore, the dissolution temperature should be strictly controlled due to its significant effect on dissolution behavior. The residue obtained at 125 °C was viscous and could not be compressed for XRD analysis. When considering that the azeotropic system of the HF/H2O mixture has a boiling point of 113 °C [23], the dissolution temperature should not exceed 113 °C. Therefore, a suitable temperature of 100 °C was employed to conduct the dissolution process.

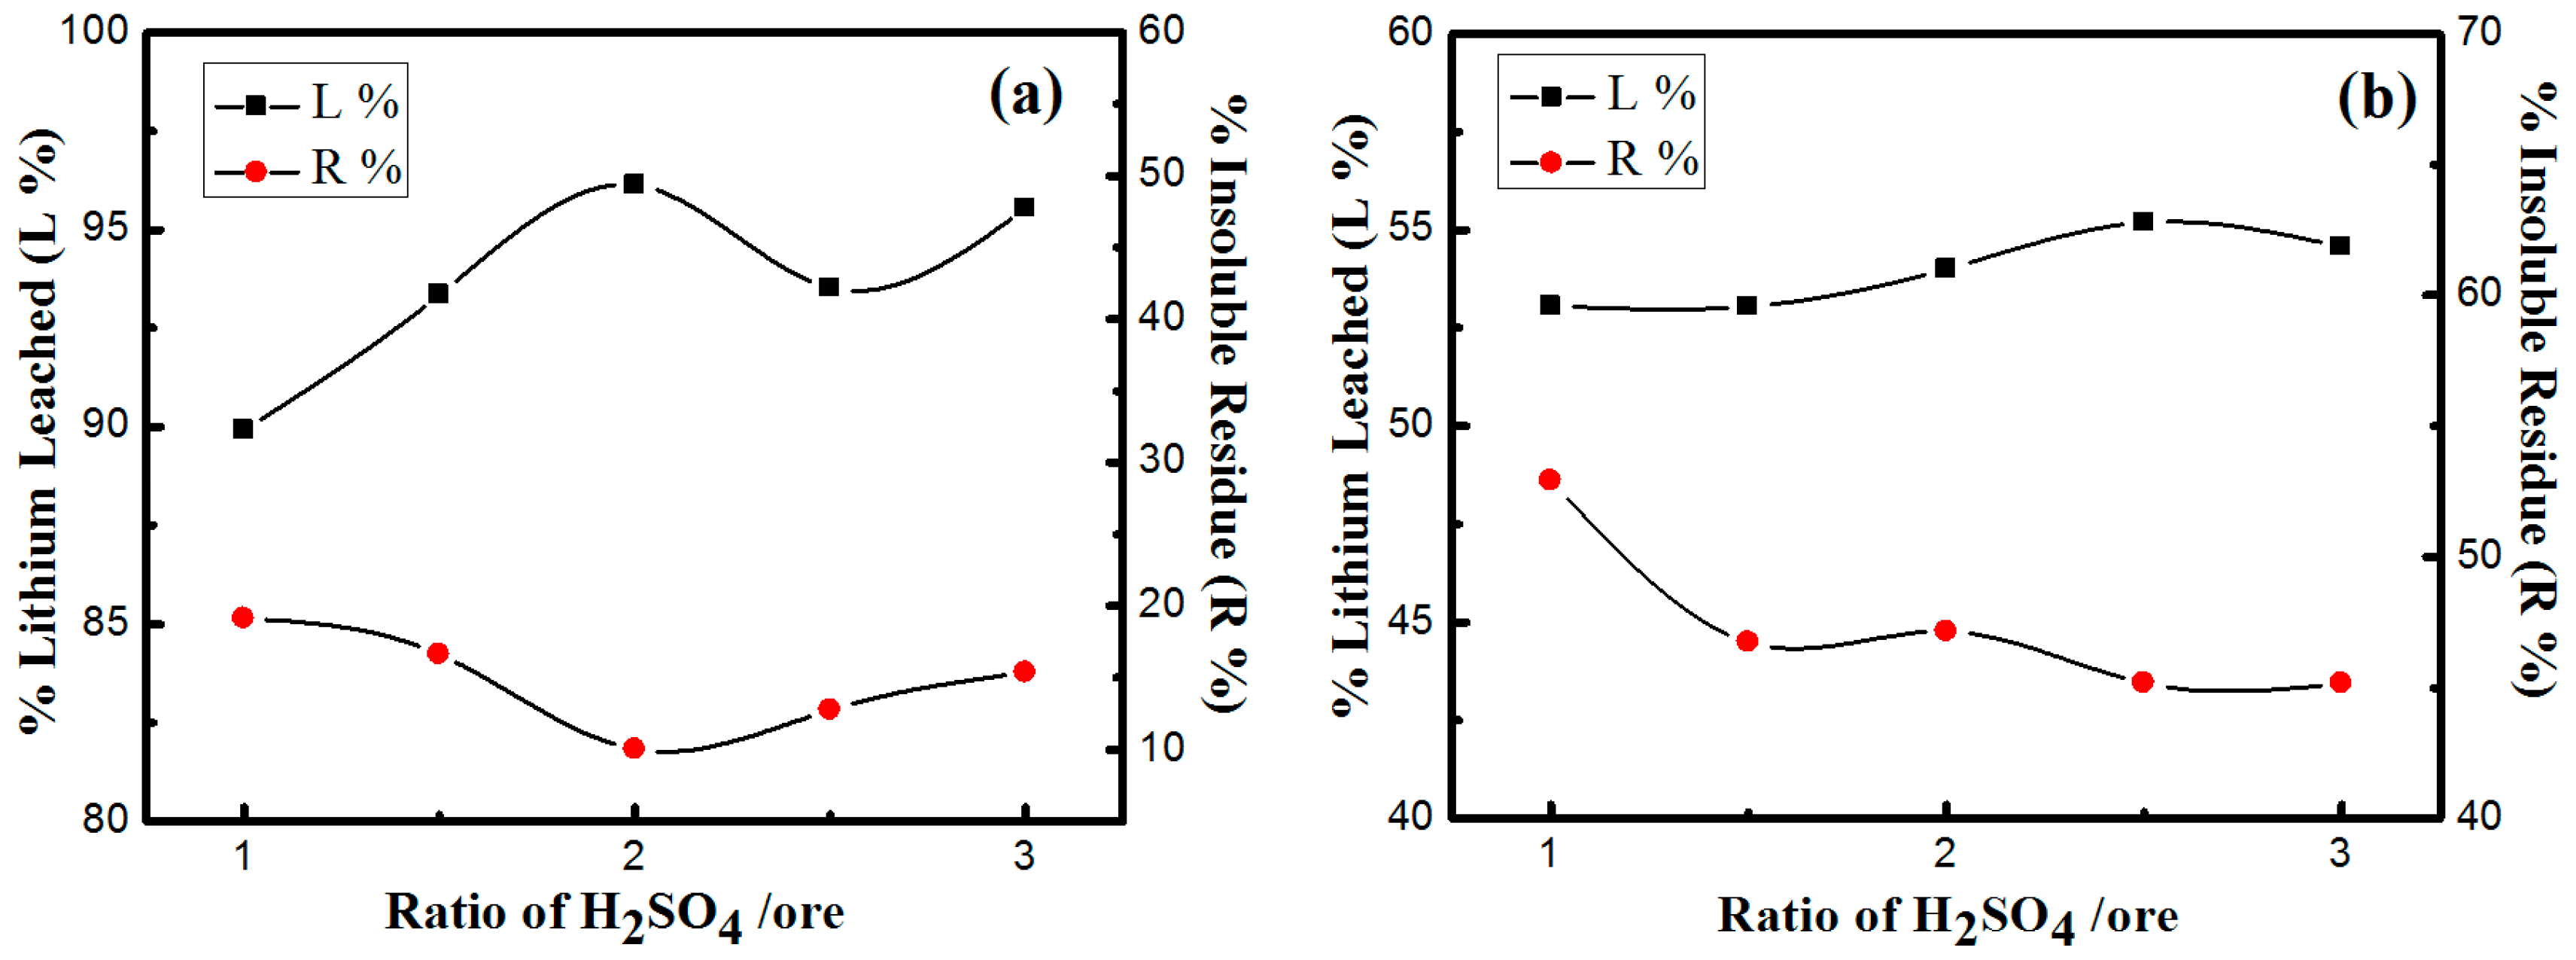
3.3.3. Effects of H2SO4/Ore Ratio

The introduction of H+ by strong acid was reported to play the role of catalysis in the dissolution process by absorbing onto the mineral surface and decreasing the bond strength of Si–O and Al–O by hydroxylation of Si–O and Al–O [17]. More importantly, H2SO4 also plays another important role in converting insoluble fluorides into soluble sulfates (Reaction (5)). The insoluble Li–O, therefore, can be converted into lixivium, as a sulfate, leaving less insoluble residues with the increase of H2SO4/ore ratio. The release of HF is also useful for the recycling and utilization of HF.
2 LiF + H 2 SO 4 Li 2 SO 4 + 2 HF
Figure 6 shows that the increase of H2SO4 promoting lithium leaching (L %), at with sufficient (Figure 6a) or insufficient (Figure 6b) HF was added, according to the stoichiometric of Reaction (3). The leaching efficiency of lithium reached a relative maximum when the ratio of ore/H2SO4 was 1:2. The dissolution of the generated insoluble fluorides by H2SO4 takes place due to the release of release of some HF, which slightly accelerates the dissolution according to Reaction 5. However, the release of HF caused more Al3+, Na+, K+, or even Li+ to be involved in a competition for complexing with F, causing a certain degree of fluctuation in the leaching efficiency of Li (Figure 6a). This assumption could also be verified by the percent of insoluble residues in Figure 6a. Moreover, the XRD analysis (Figure 7) also indicated that higher H2SO4 affected the compositions of intermediates, especially for the complex formed between Al and F. The formation of Na3Li3Al2F12 with a ratio of ore/H2SO4 of 1:2.5 resulted in a decreased leaching efficiency of lithium. Moreover, enhanced the generation of fluosilicates, such as KNaSiF6, were not beneficial for the utilization of HF. A suitable ore/H2SO4 ratio was, therefore, selected as 1:2 to maximize the leaching efficiency of lithium and efficient usage of HF. Additionally, it should be mentioned that the effect of H2SO4 on lithium leaching was not obvious (Figure 6b) when there was insufficient HF, confirming the conclusion that the degree of dissolution was mainly determined by ore/HF ratio.

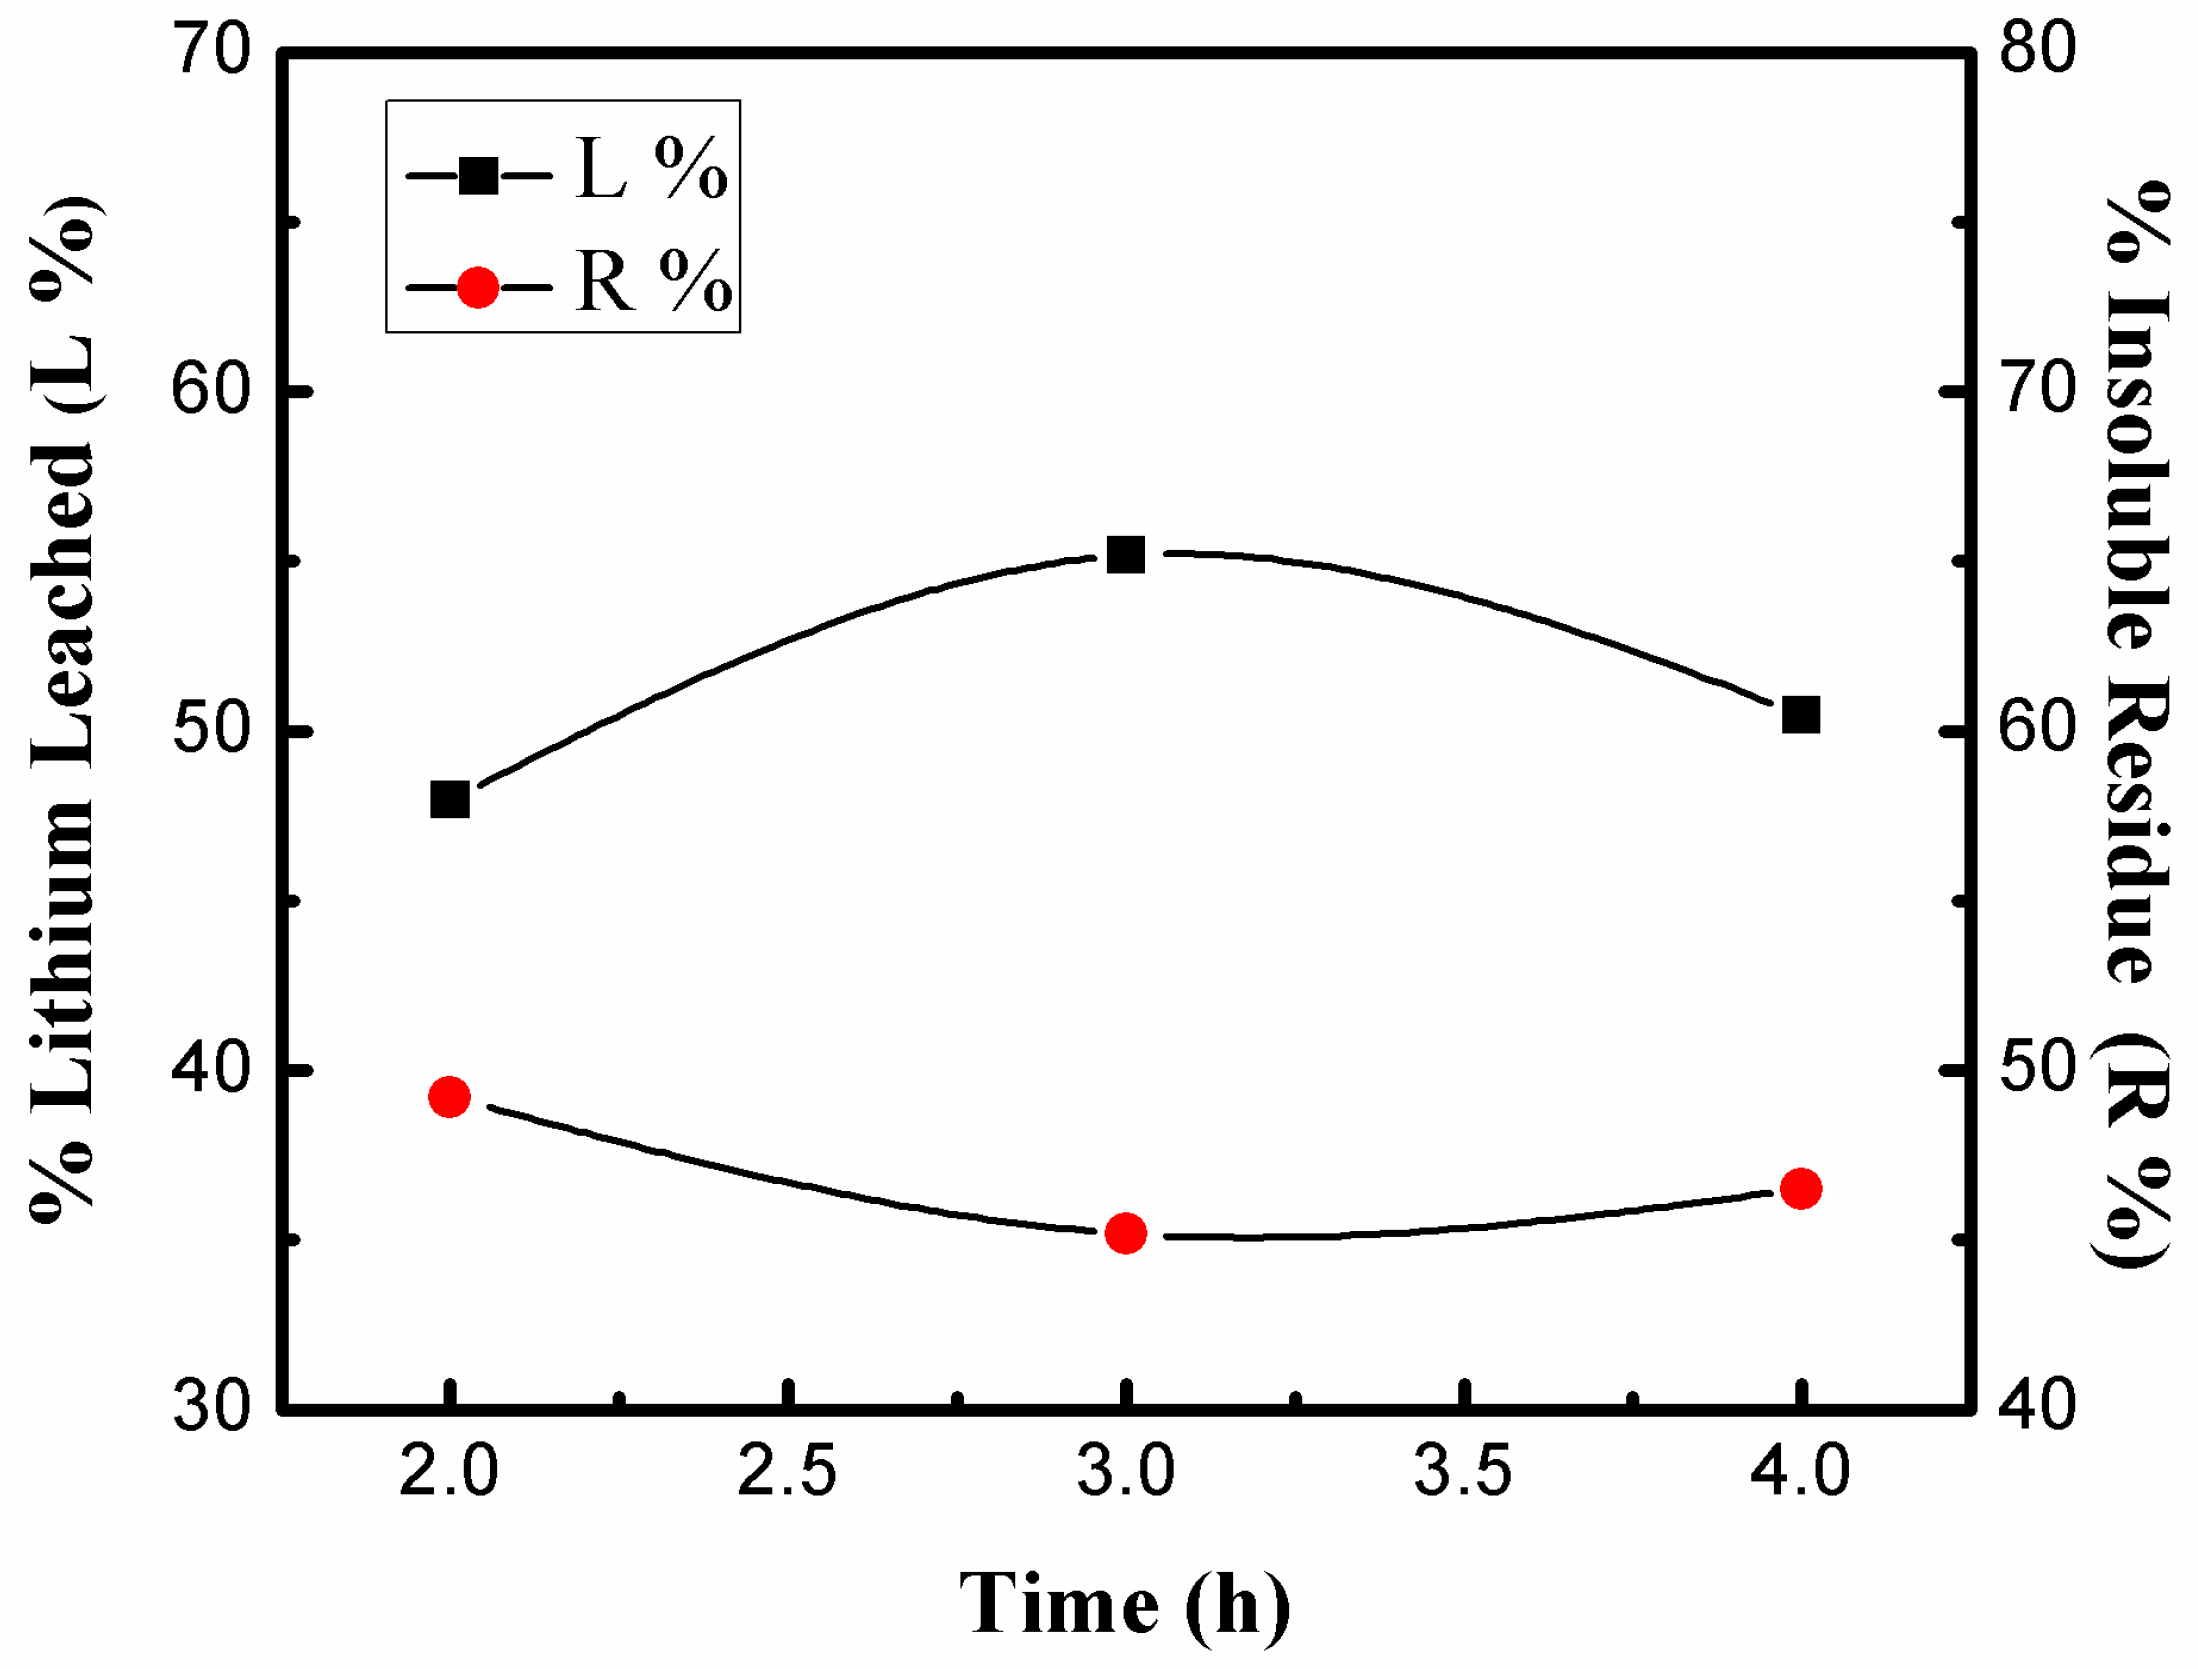
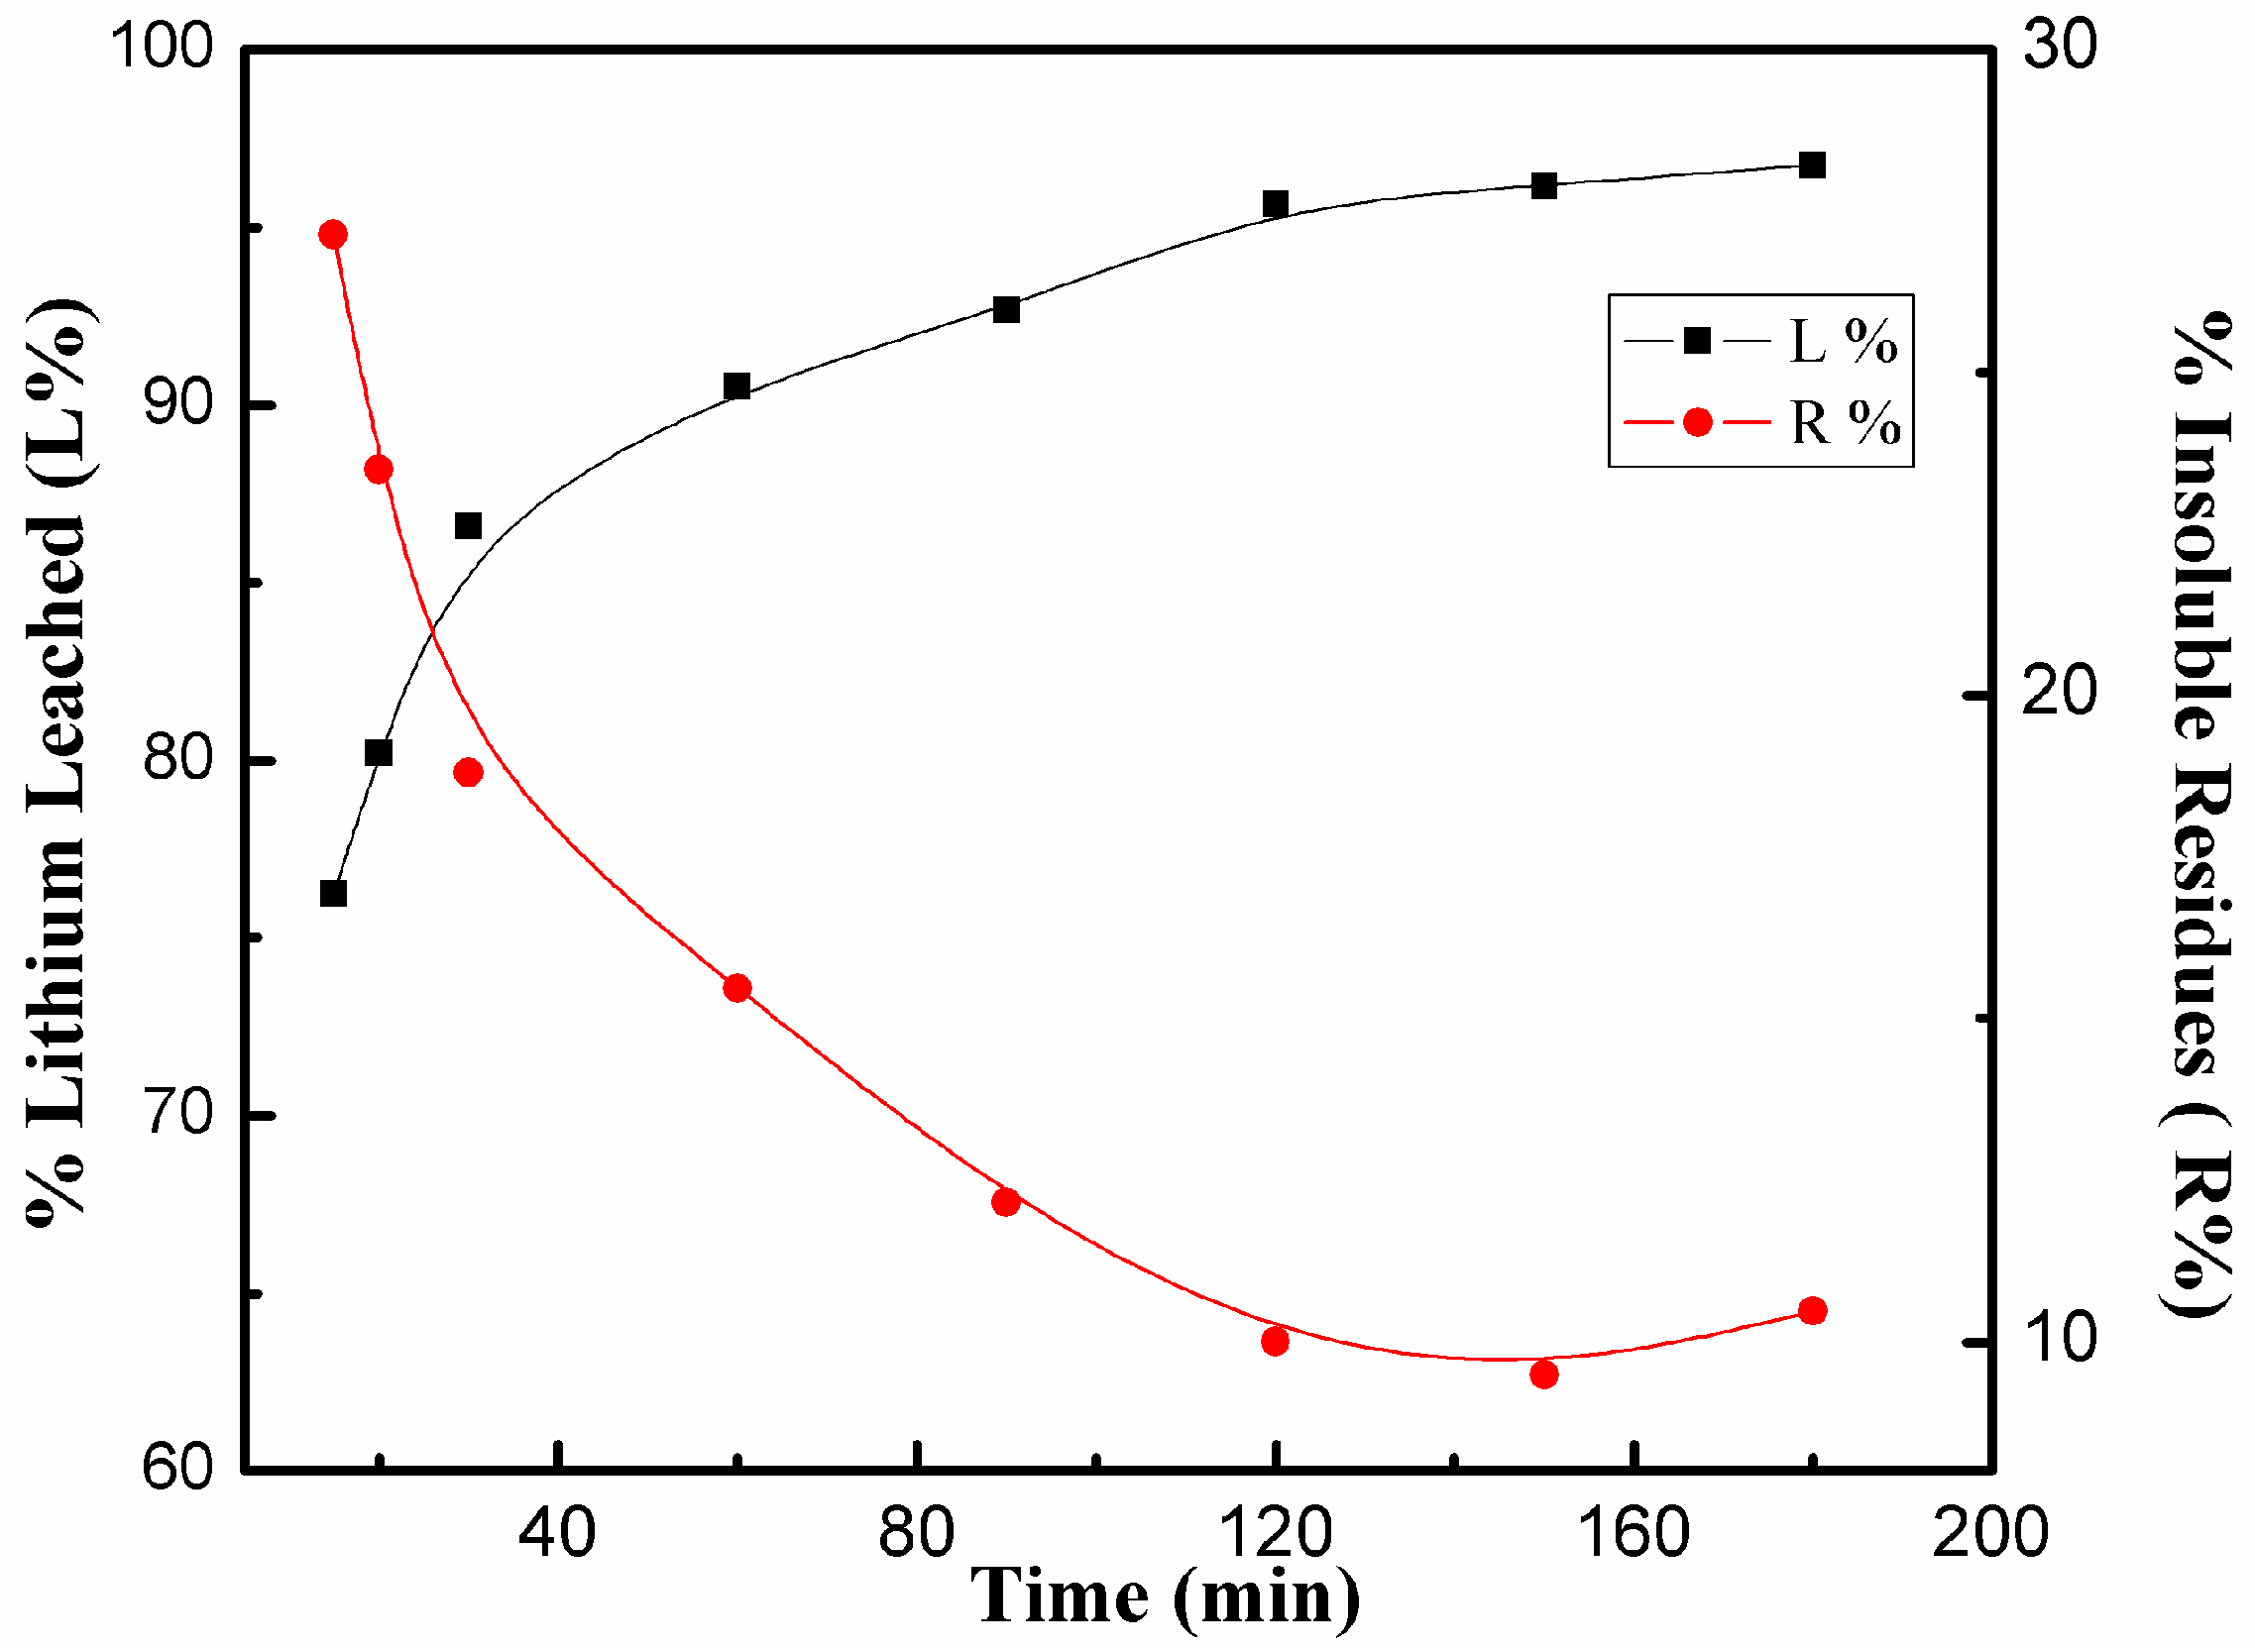
3.3.4. Effects of Dissolution Time

The dissolution time has a slight effect on both L% and R% when the dissolution lasted longer than 2 h (Figure 8). To ensure that dissolution was complete, 3 h was chosen as a suitable dissolution time.
As a brief conclusion, the results of the optimal investigations suggested that the appropriate conditions to dissolve α-spodumene in lixiviant HF/H2SO4 were 100 °C with an ore/HF/H2SO4 ratio of 1:3:2 (g/mL/mL) for 3 h.

3.4. Dissolution Kinetics

In previous studies, the metal cations from silicate-containing feed materials underwent a leaching rate faster than the degradation rate of silica lattice, resulting in an incongruent dissolution between the leaching of cations and the destruction of the lattice [24]. In addition, adsorbed hydrogen or hydroxide ions were able to polarize the mineral surface and to weaken the cation–oxygen bonds to accelerate the dissolution. Therefore, it is essential to carry out further investigation to understand the dissolution behavior for technology design purposes. Therefore, experiments were conducted under optimal conditions for different dissolution times (15–180 min) (Figure 9). The AAS analyses of the lithium contained in the lixivium for different intervals are listed in Table S7. The particle size distribution (D90 22.56 µm) was determined using a laser particle size analyzer (Omec LS-POP(6)). Residues were obtained by sequentially water leaching and heating to dry (at 60 °C) before being analyzed and characterized.

3.5. Characterization of Solids
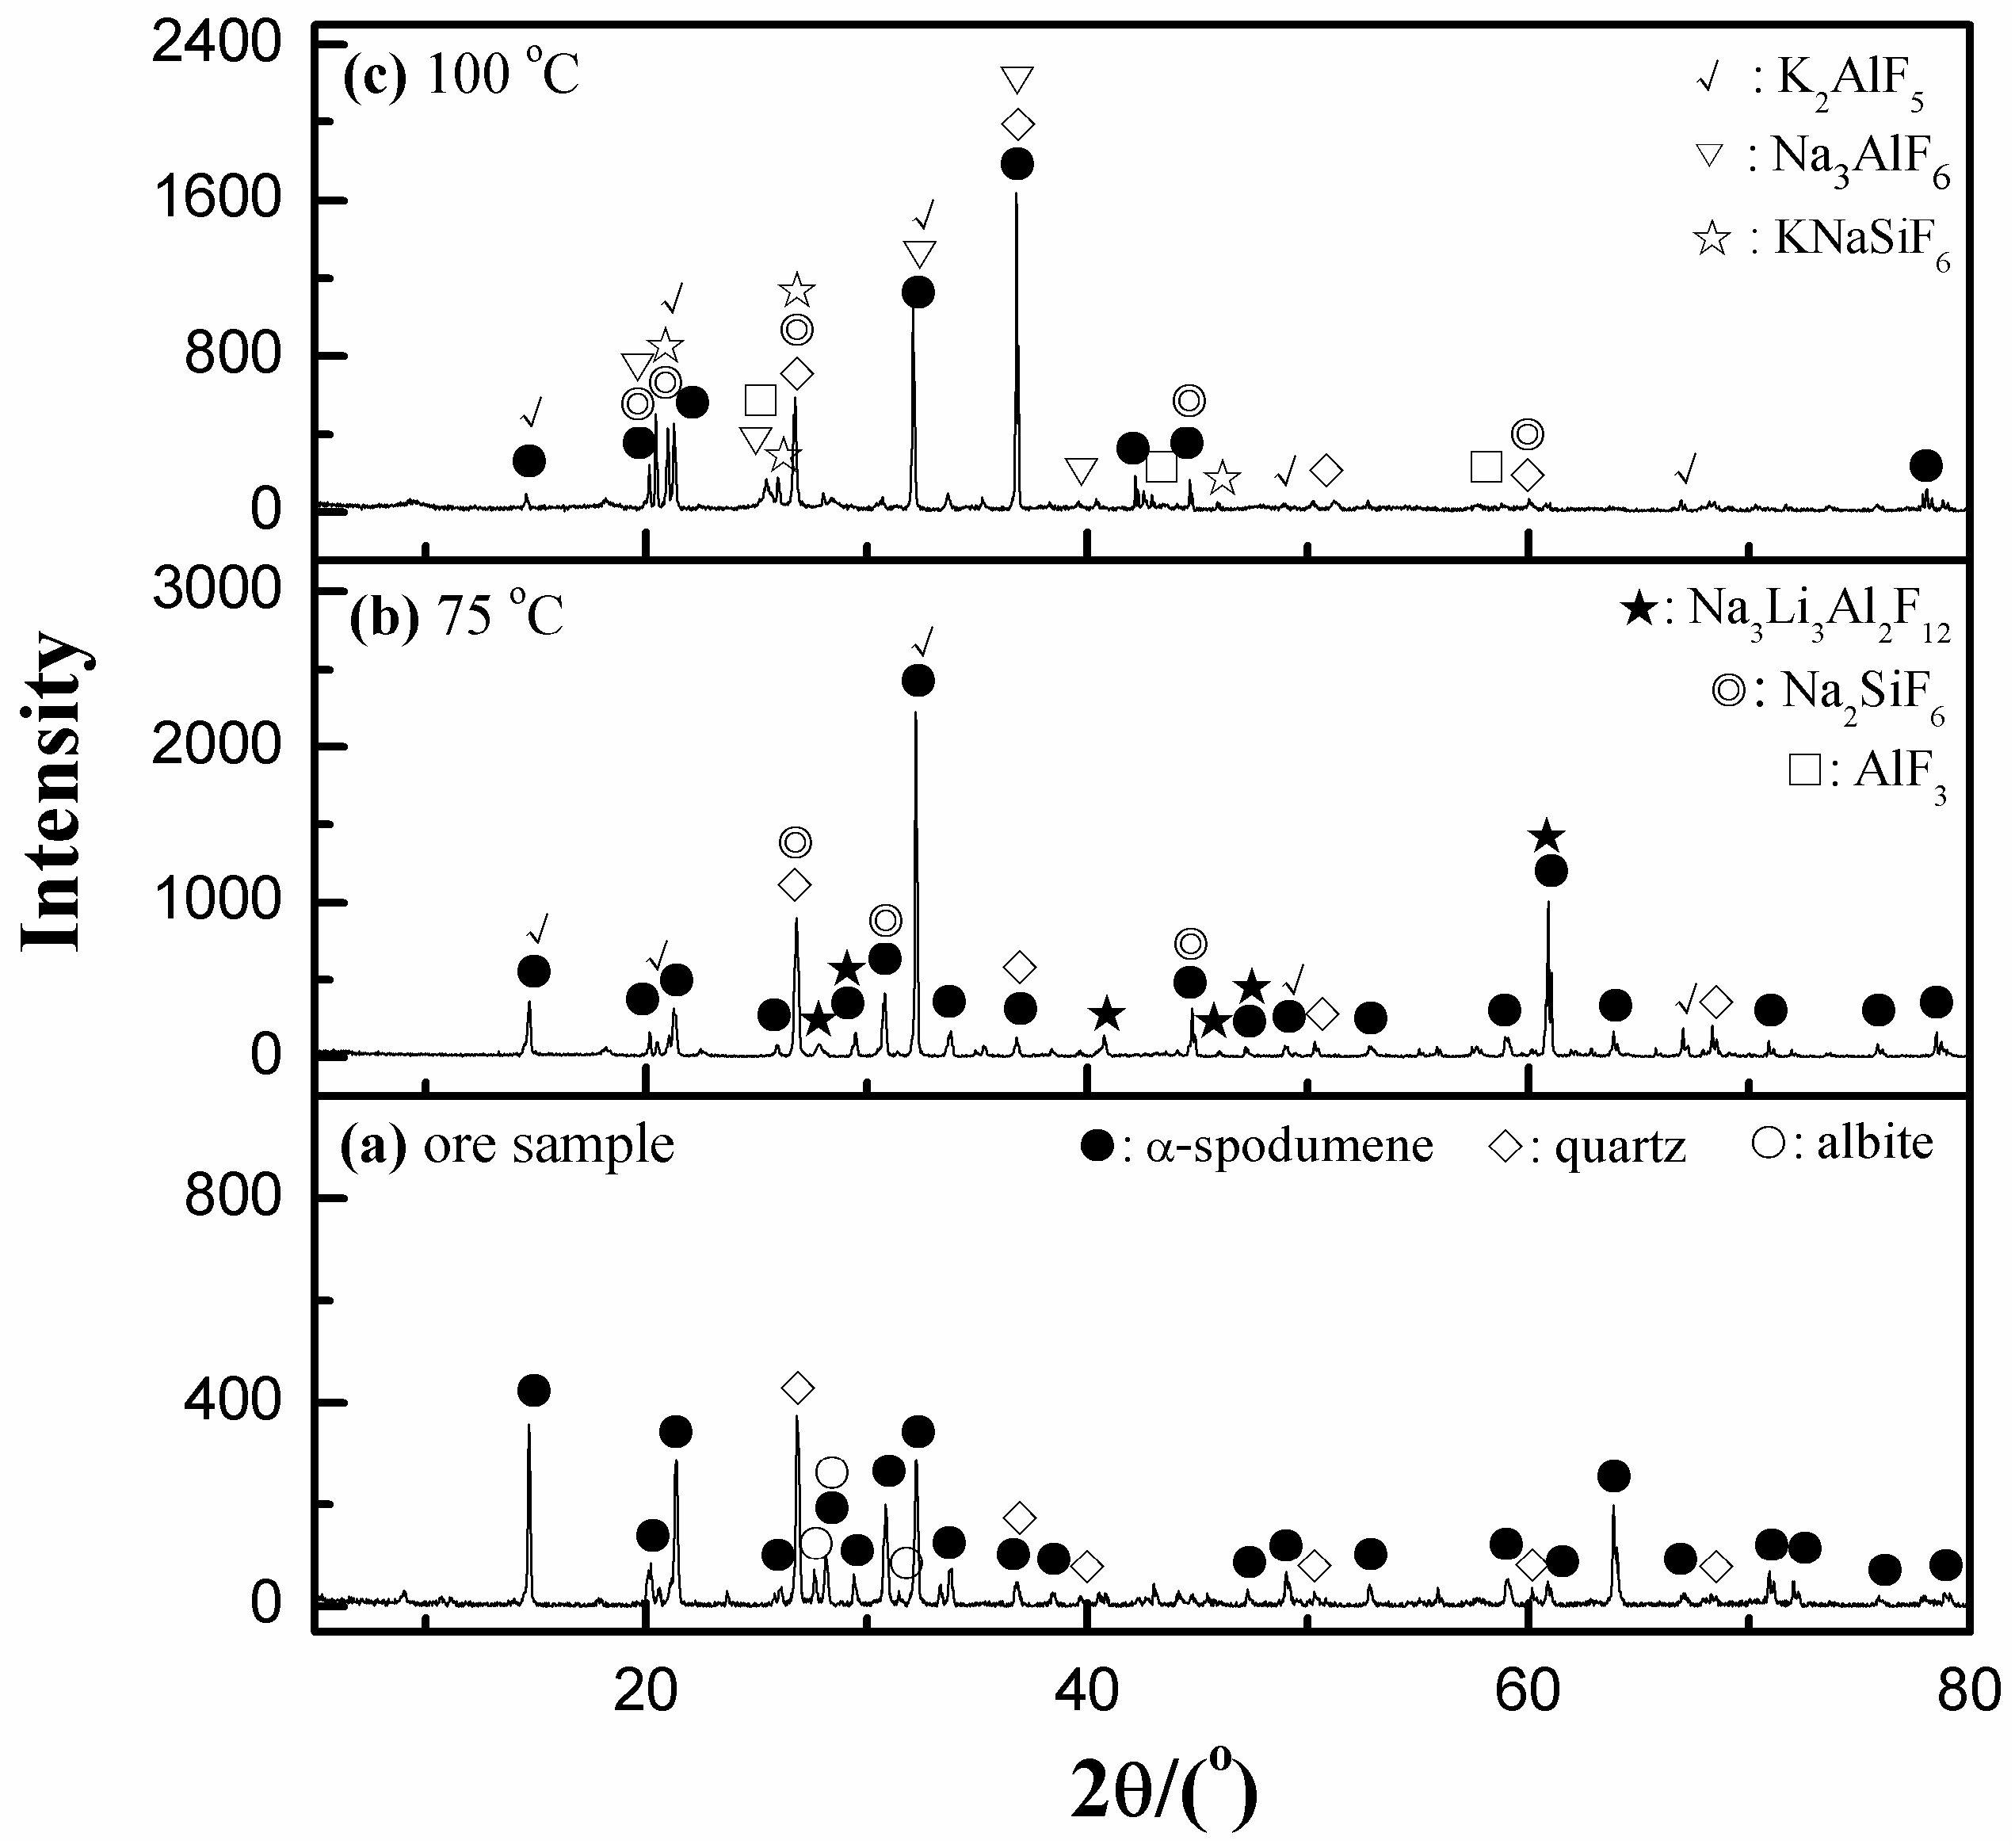
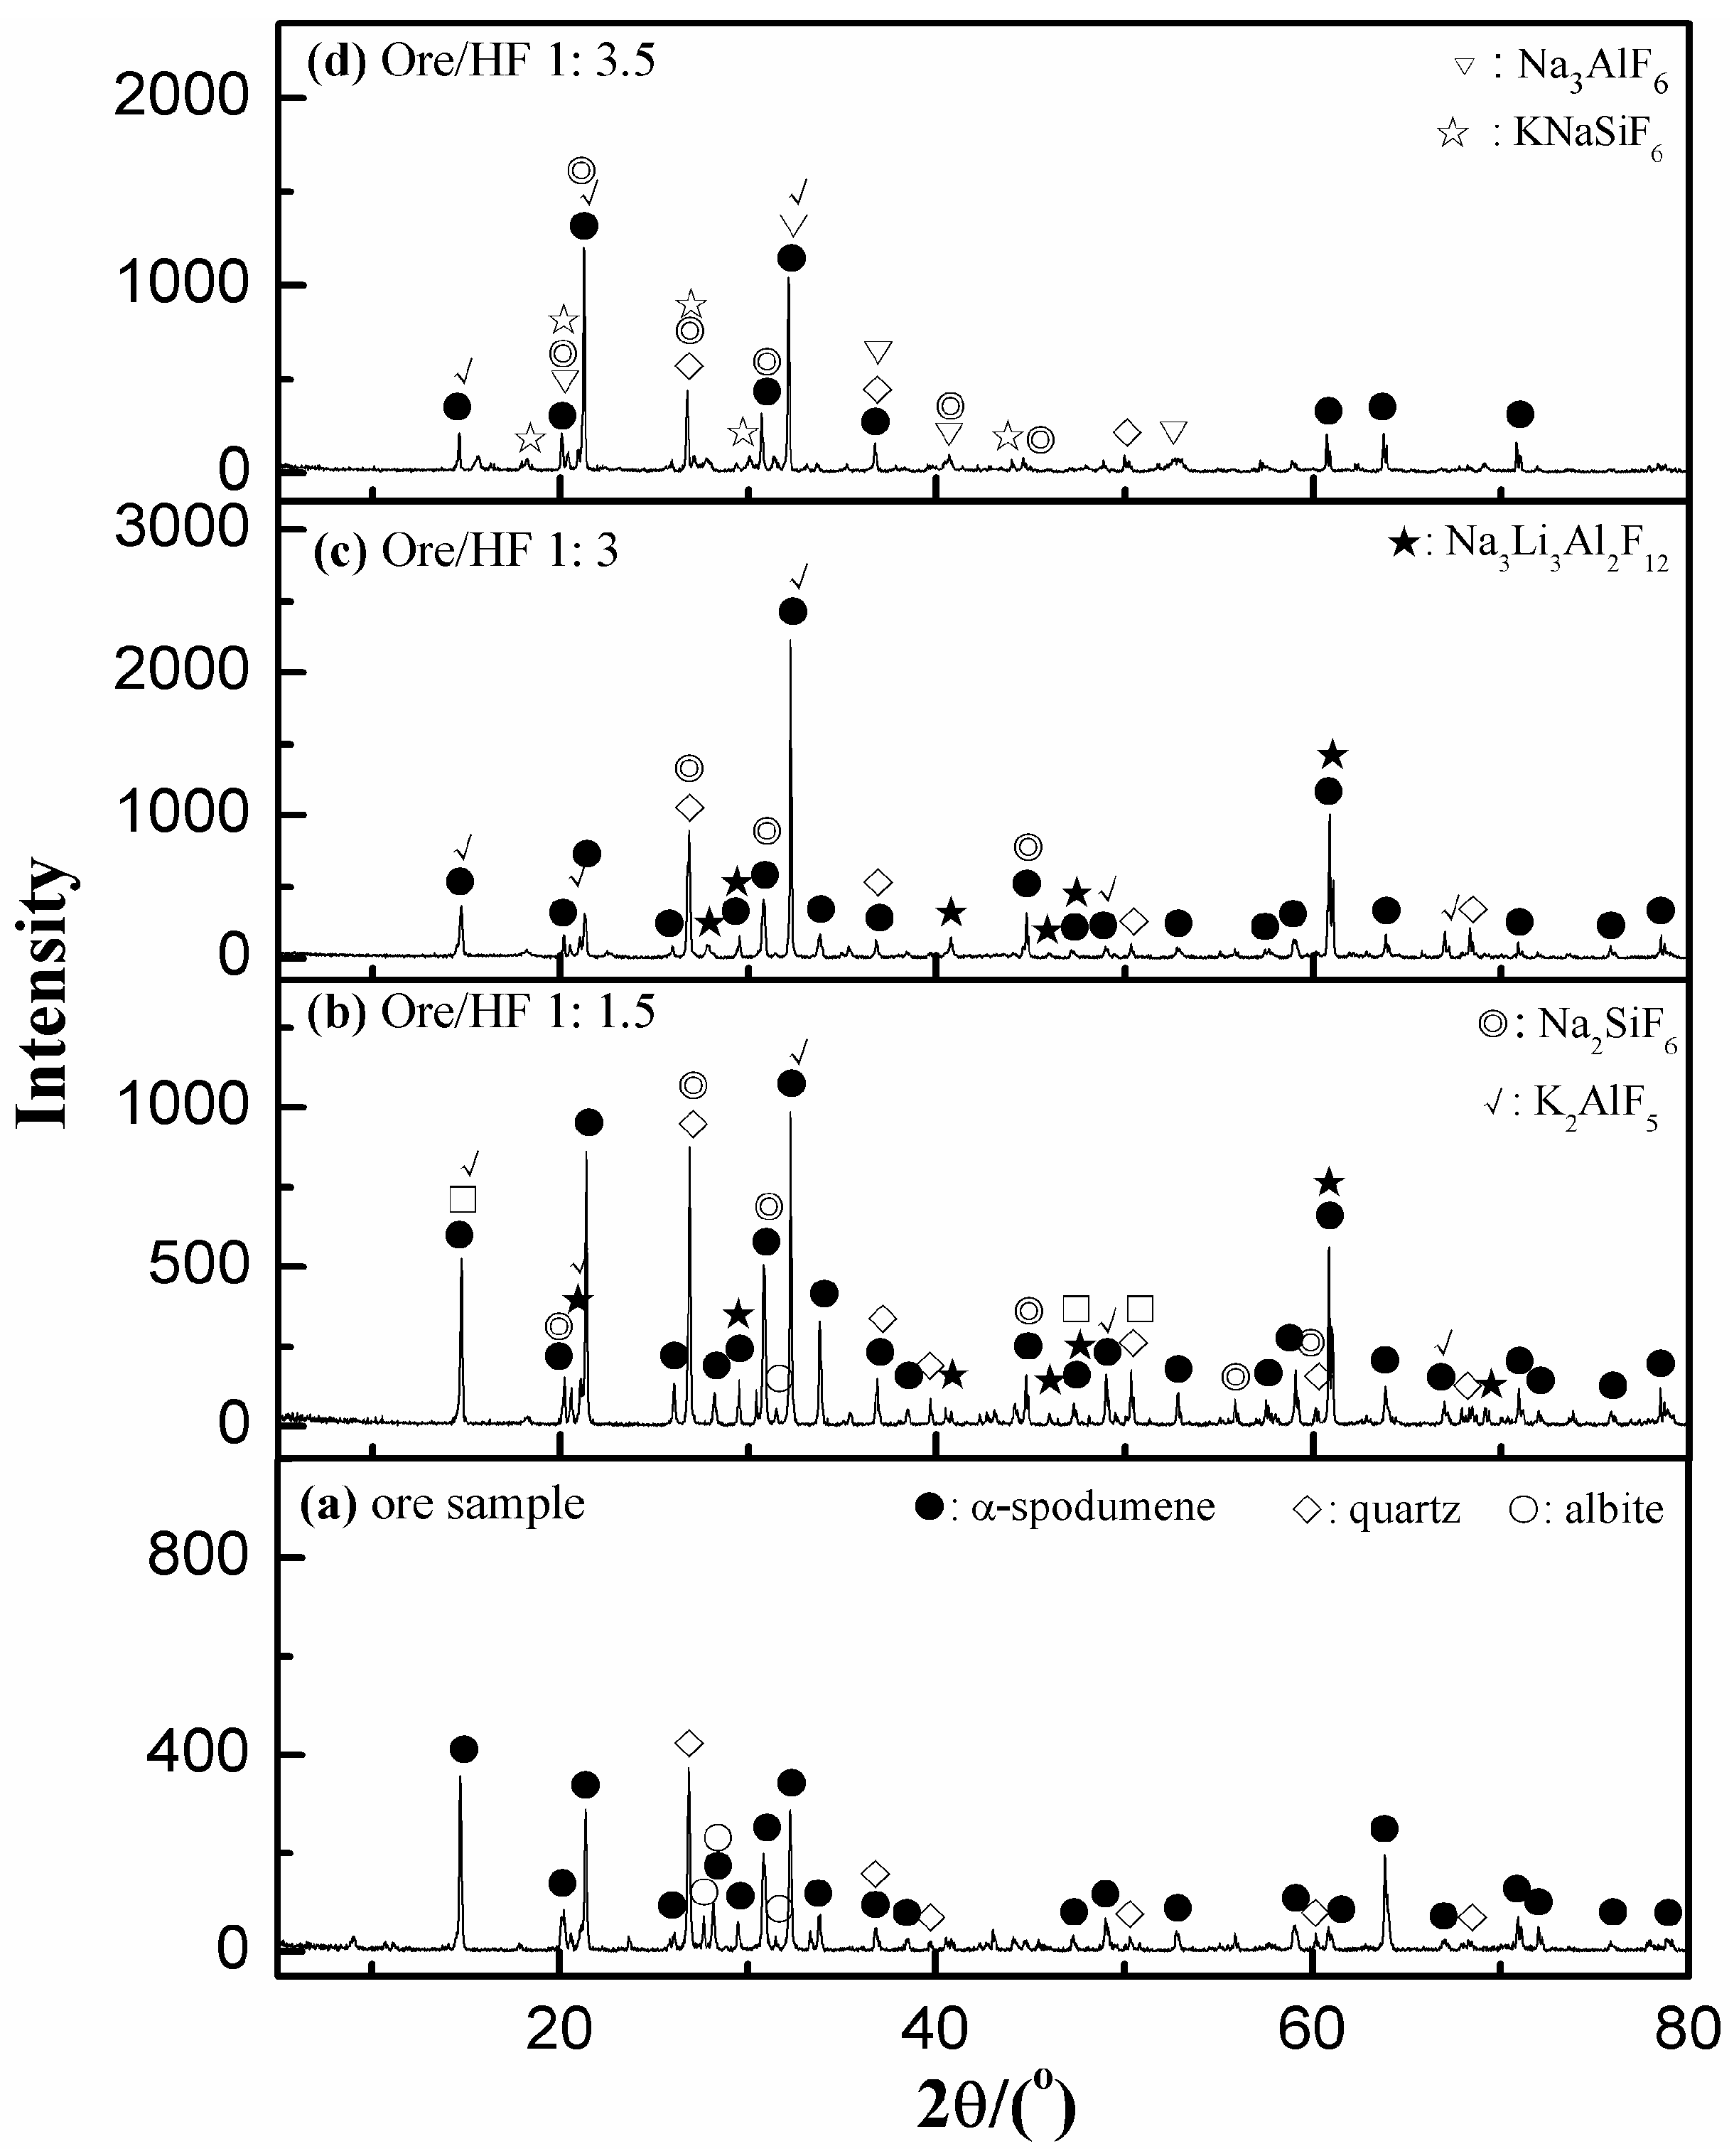
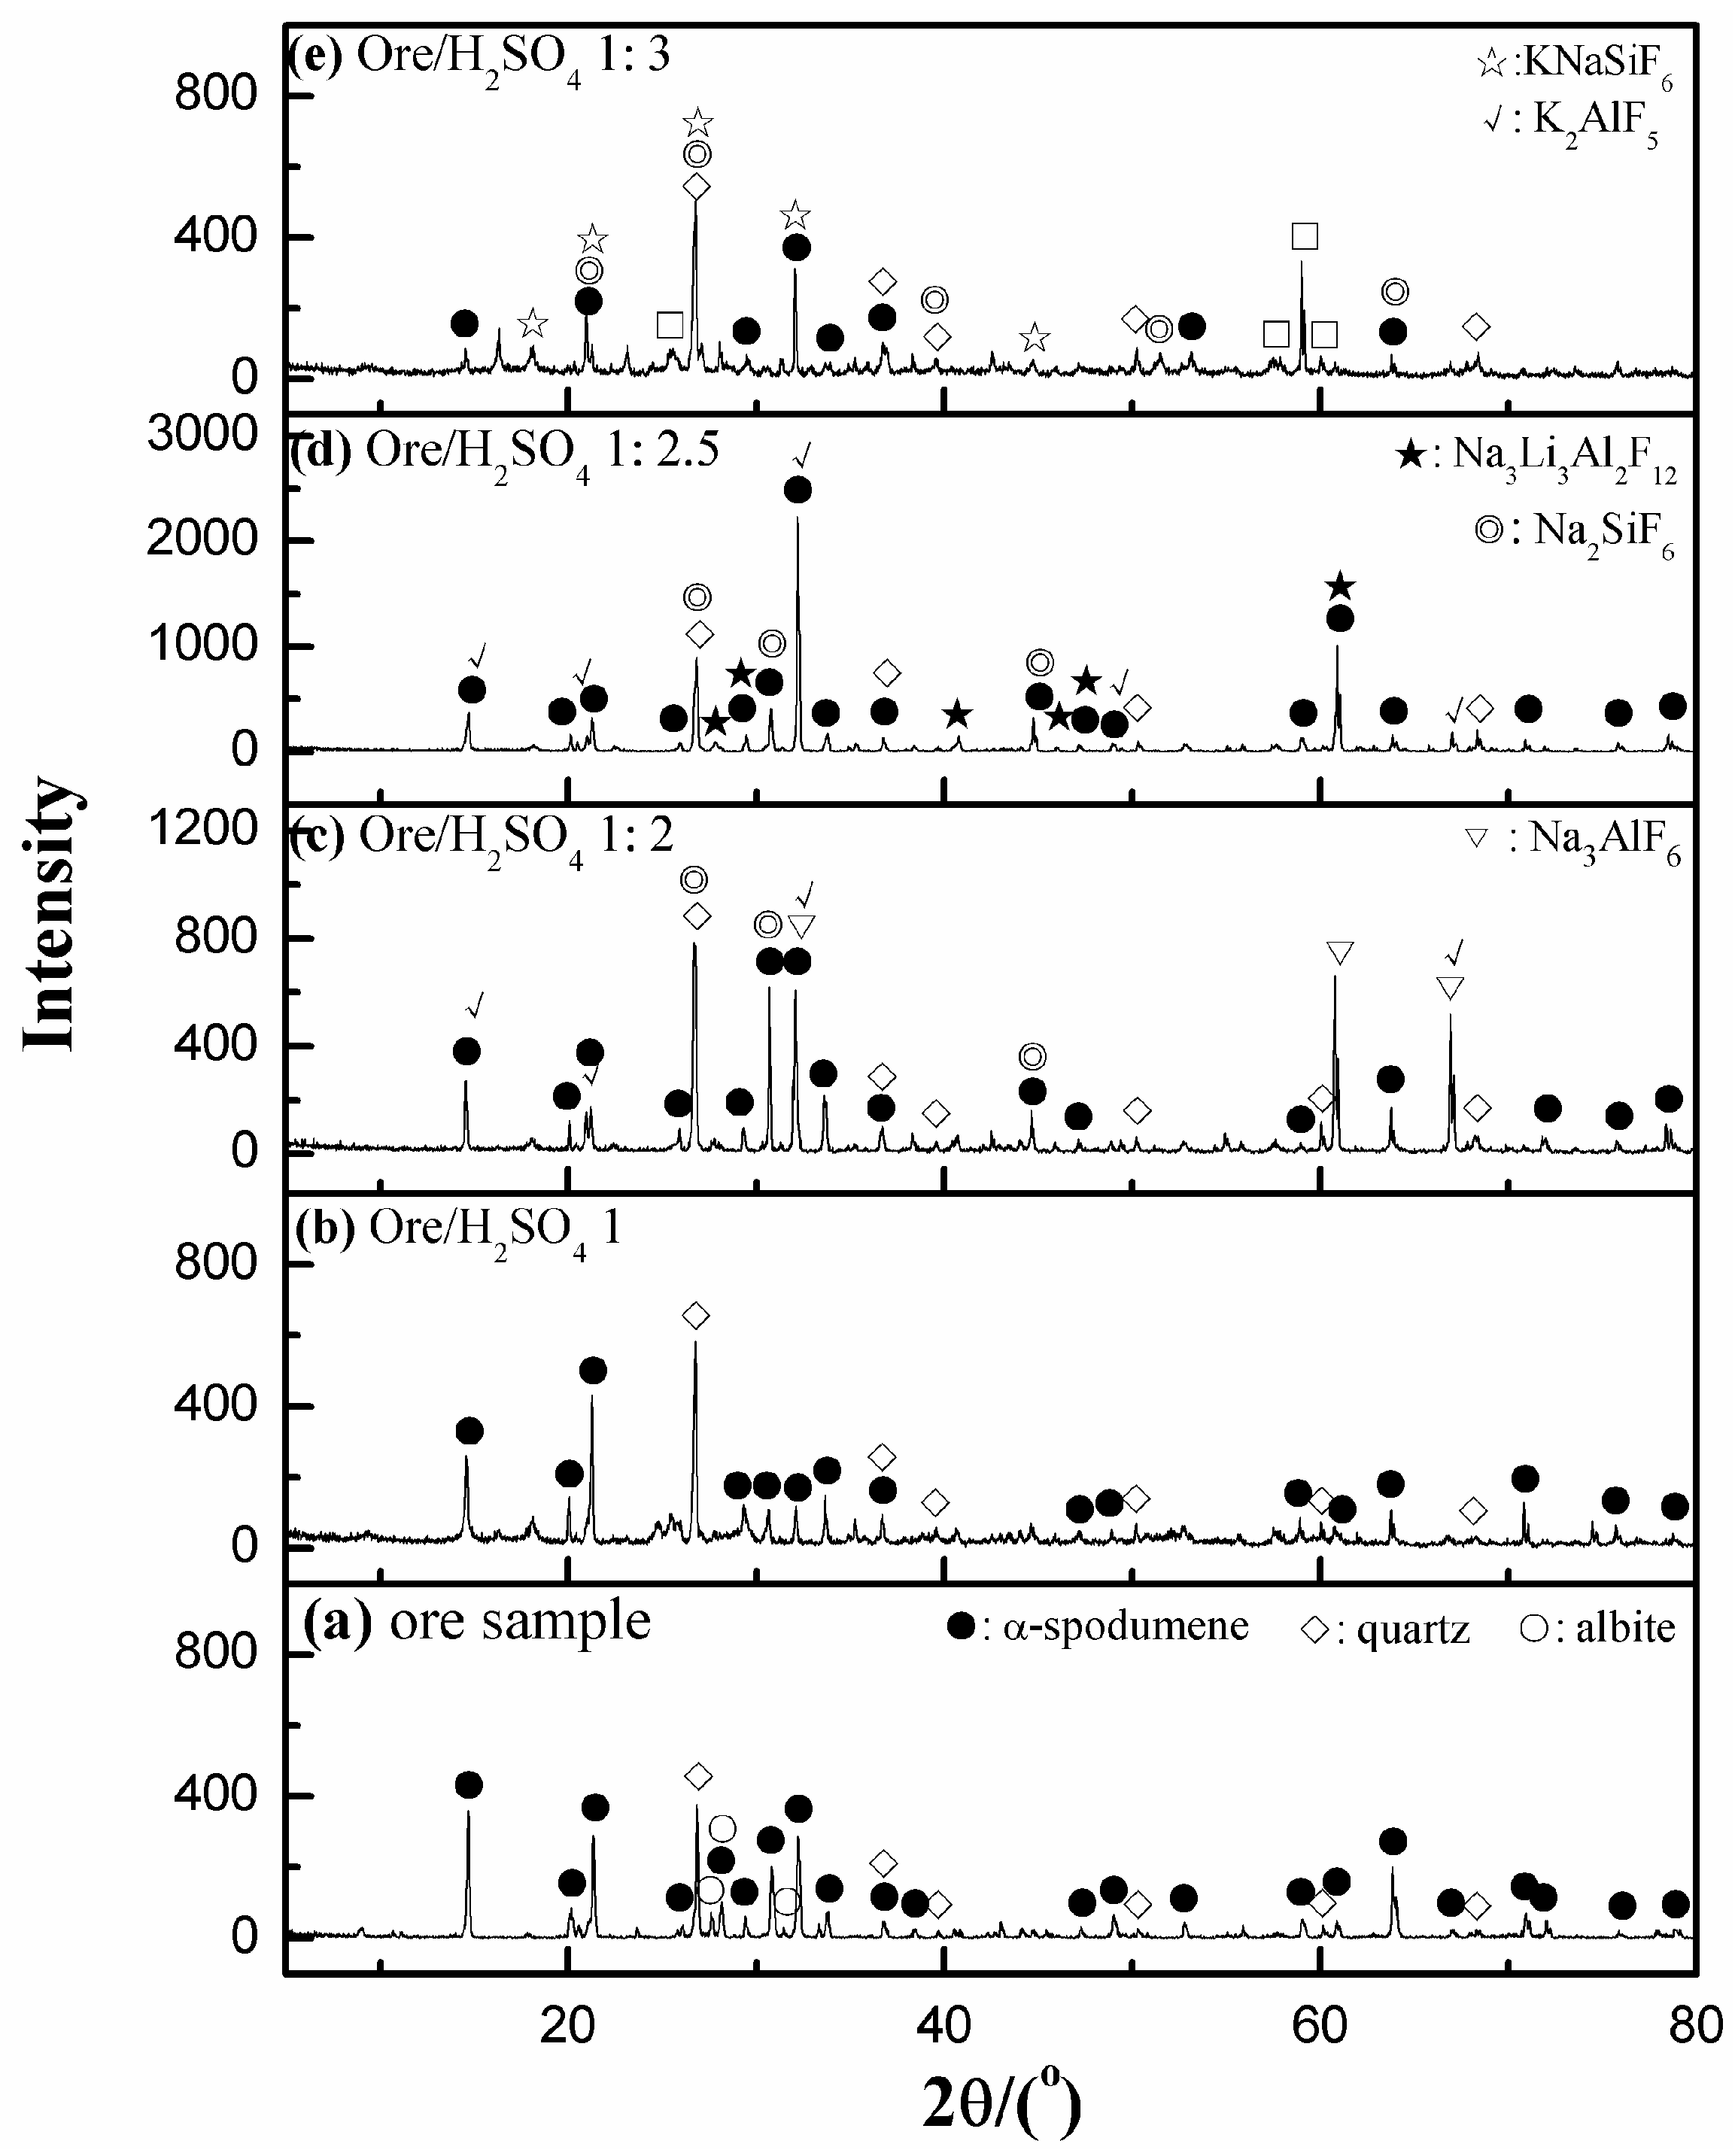
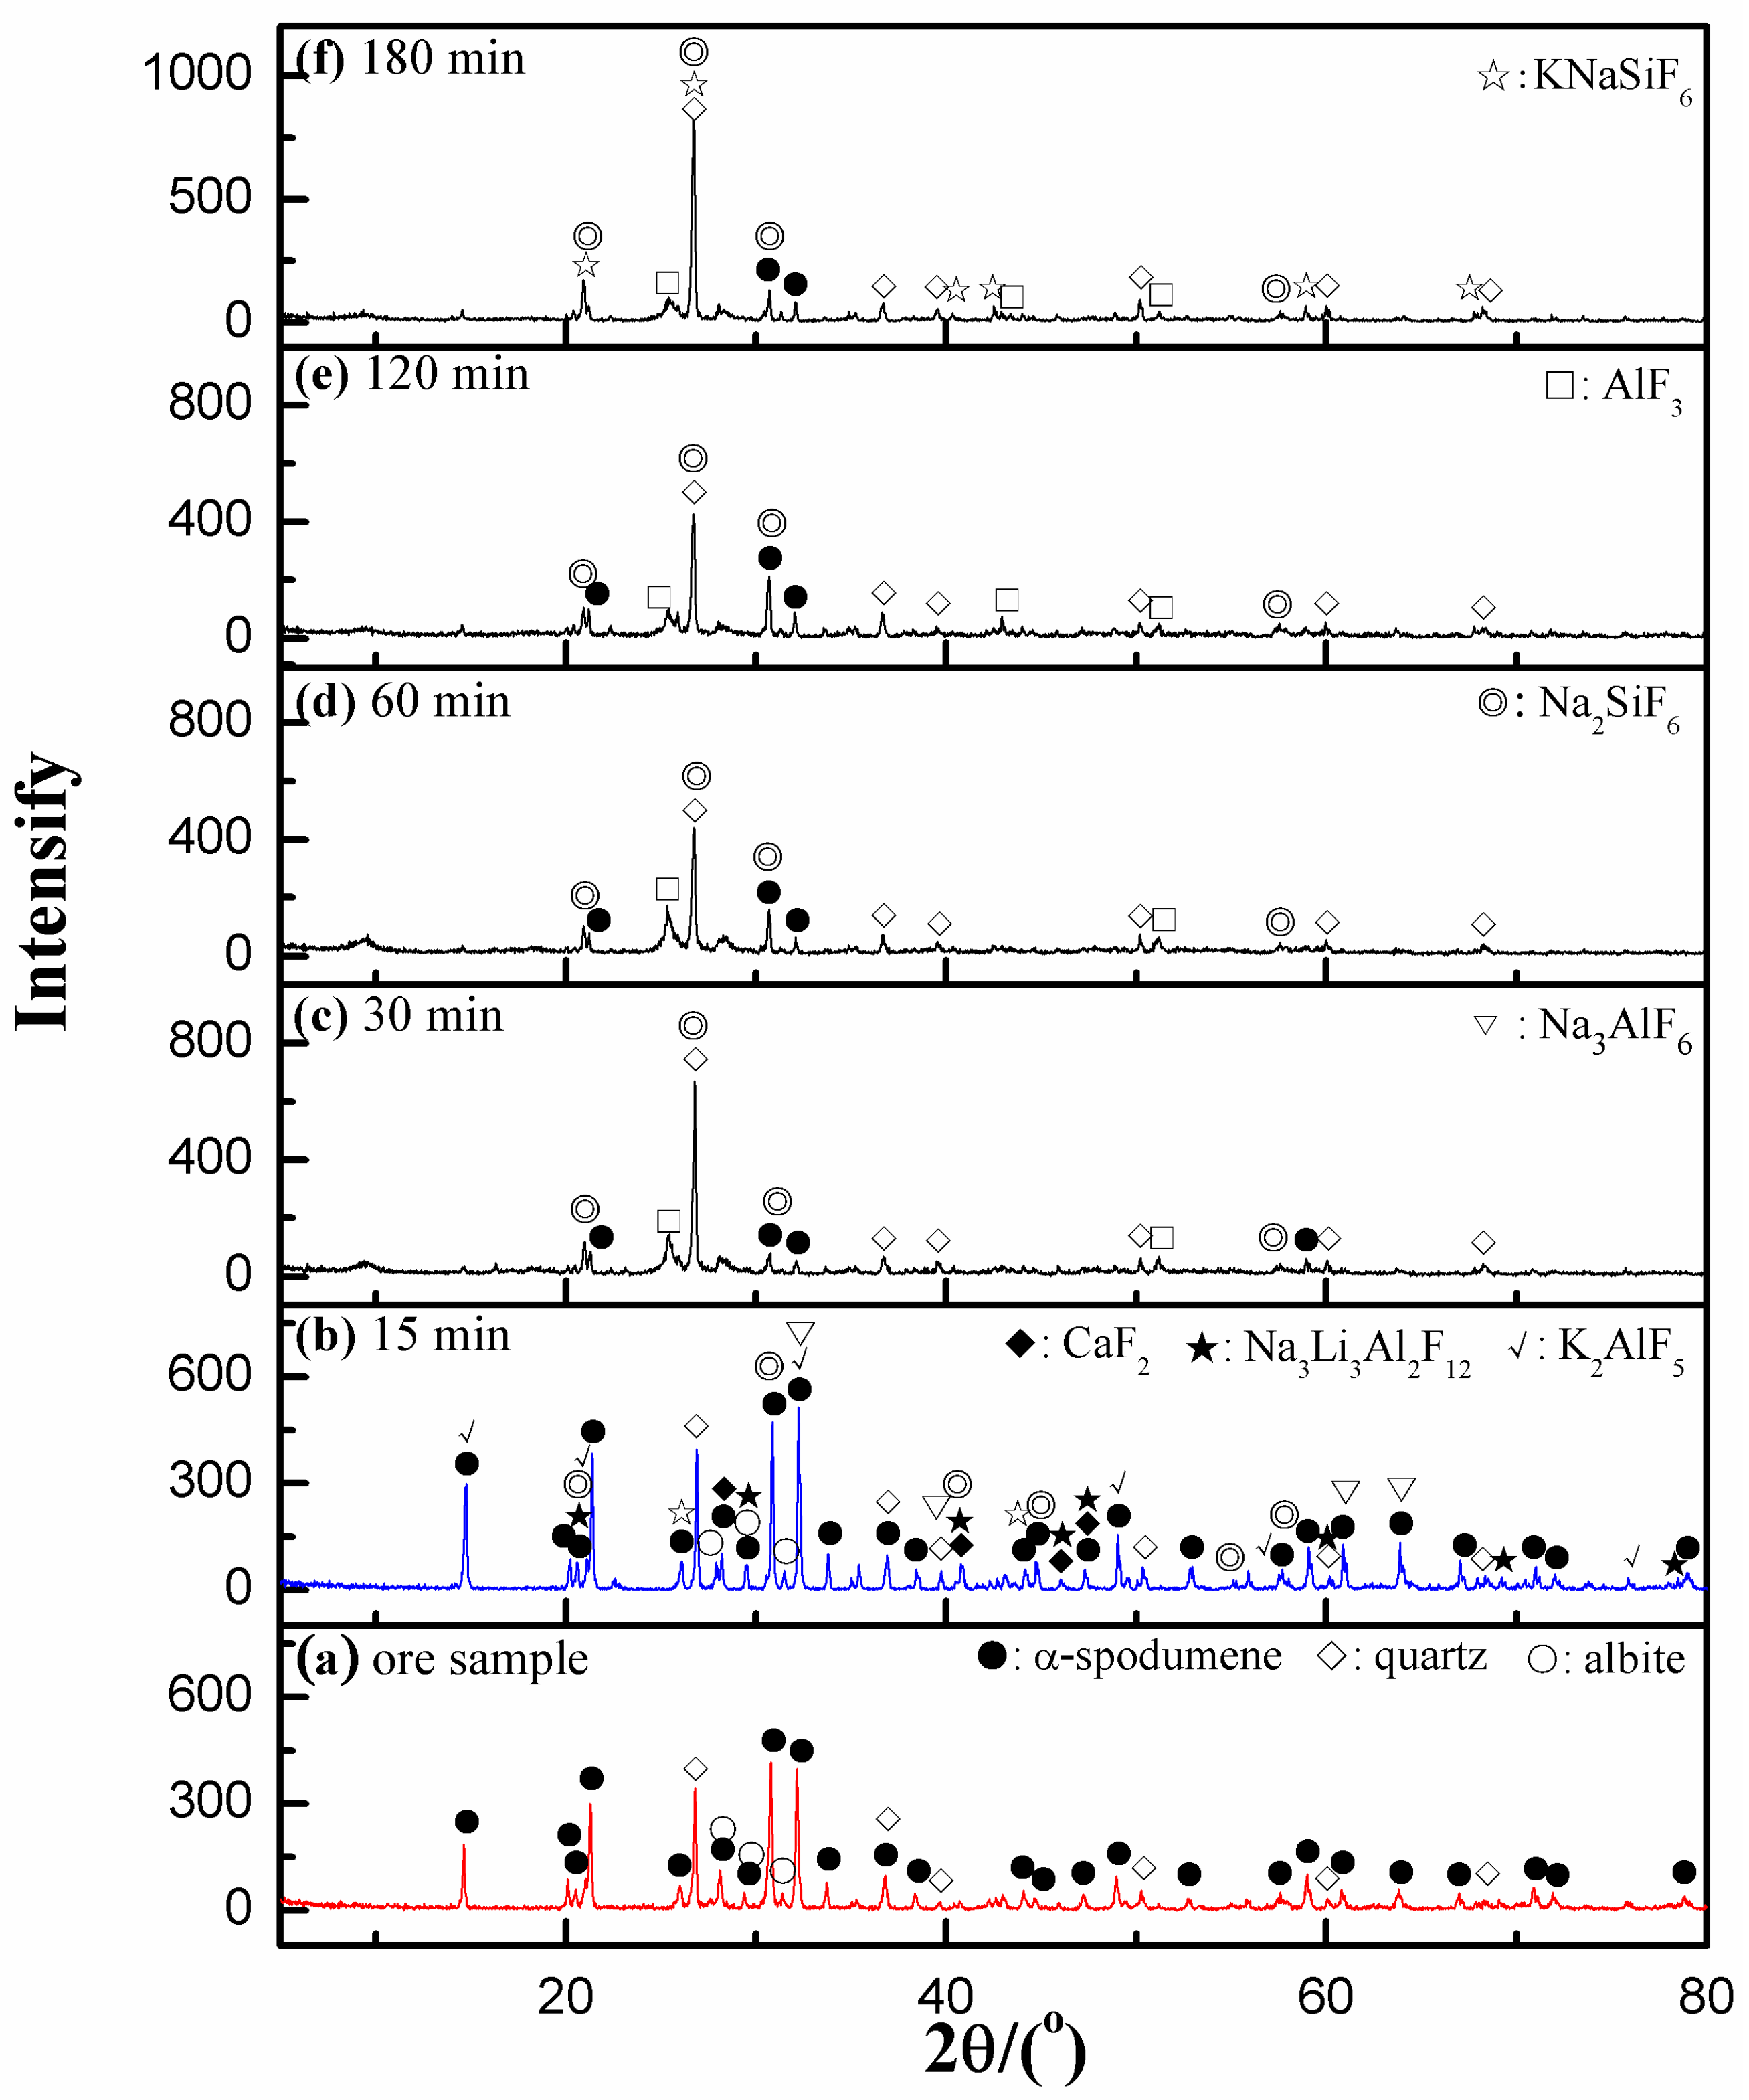
3.5.1. XRD Analyses

The results in Figure 9 showed that the dissolution proceeded to completion as the time increased. The XRD analyses (Figure 10) showed that α-spodumene and albite in the ore sample were gradually dissolved, and that some insoluble fluorides were formed. Typical peaks of quartz remained even after a 3 h leaching period, which indicated that selective dissolution was achieved to a certain extent, and that α-spodumene and albite were preferentially dissolved over quartz. Based on the XRD analysis, we concluded that an extended dissolution time >30 min had a slight effect on lithium leaching due to the fact that differences in the diffraction peaks did not vary obviously from 30 to 180 min. About 85% of the lithium was leached at 30 min; therefore, the dissolution time should last longer than 30 min but not exceed 3 h to maximize lithium leaching and utilize HF efficiently, which was consistent with our previous investigations on the time effects on lithium leaching efficiency in Section 3.3.4.

3.5.2. XPS Analyses

However, other characterization analyses, except for XRD, should be carried out in order to determine the compositions of insoluble intermediates for a further understanding of the dissolution process. The XPS spectra (Figure 11) of some typical elements in residues were analyzed to confirm the generated intermediates. The photoemission peaks were fitted with the Gaussian-Lorentzian (GL) curve-fitting method. The Shirley method was employed to model the spectral background. The C 1s at 284.8 eV was identified using a careful curve-fitting procedure and was used as the binding energy reference. Binding energies of relating elements were fitted using XPS data.
The Al 2p spectrum of residues at 180 min, fitted at 76.49 eV of Al–F [25] (Figure 11d), which was obviously different from 74.39 eV of Al–O contained in the ore sample (Figure 11a) [26]. The three peaks at 74.20, 75.38, and 76.18 eV were fitted with the Al 2p spectrum at 15 min (Figure 11b). Moreover, curves of K–F (683.64 eV), Al–F (685.53 eV), Li–F (686.39 eV) and Ca–F (684.58 eV) were fitted with the F 1s spectrum at 15 min (Figure 11c) [27,28,29,30]. In addition, peak area ratios among K–F, Li–F and Al–F were 0.09:0.82:1; therefore, it can be concluded that aluminum was partially fluorinated at 15 min. As for the F 1s spectrum of residues at 180 min (Figure 11e), two peaks of Al–F and Si–F in Na2SiF6 [31] were fitted. The Si–F bond was fitted with the spectrum of Si 2p at 180 min, except for some unreacted Si–O [32] (Figure 11f).

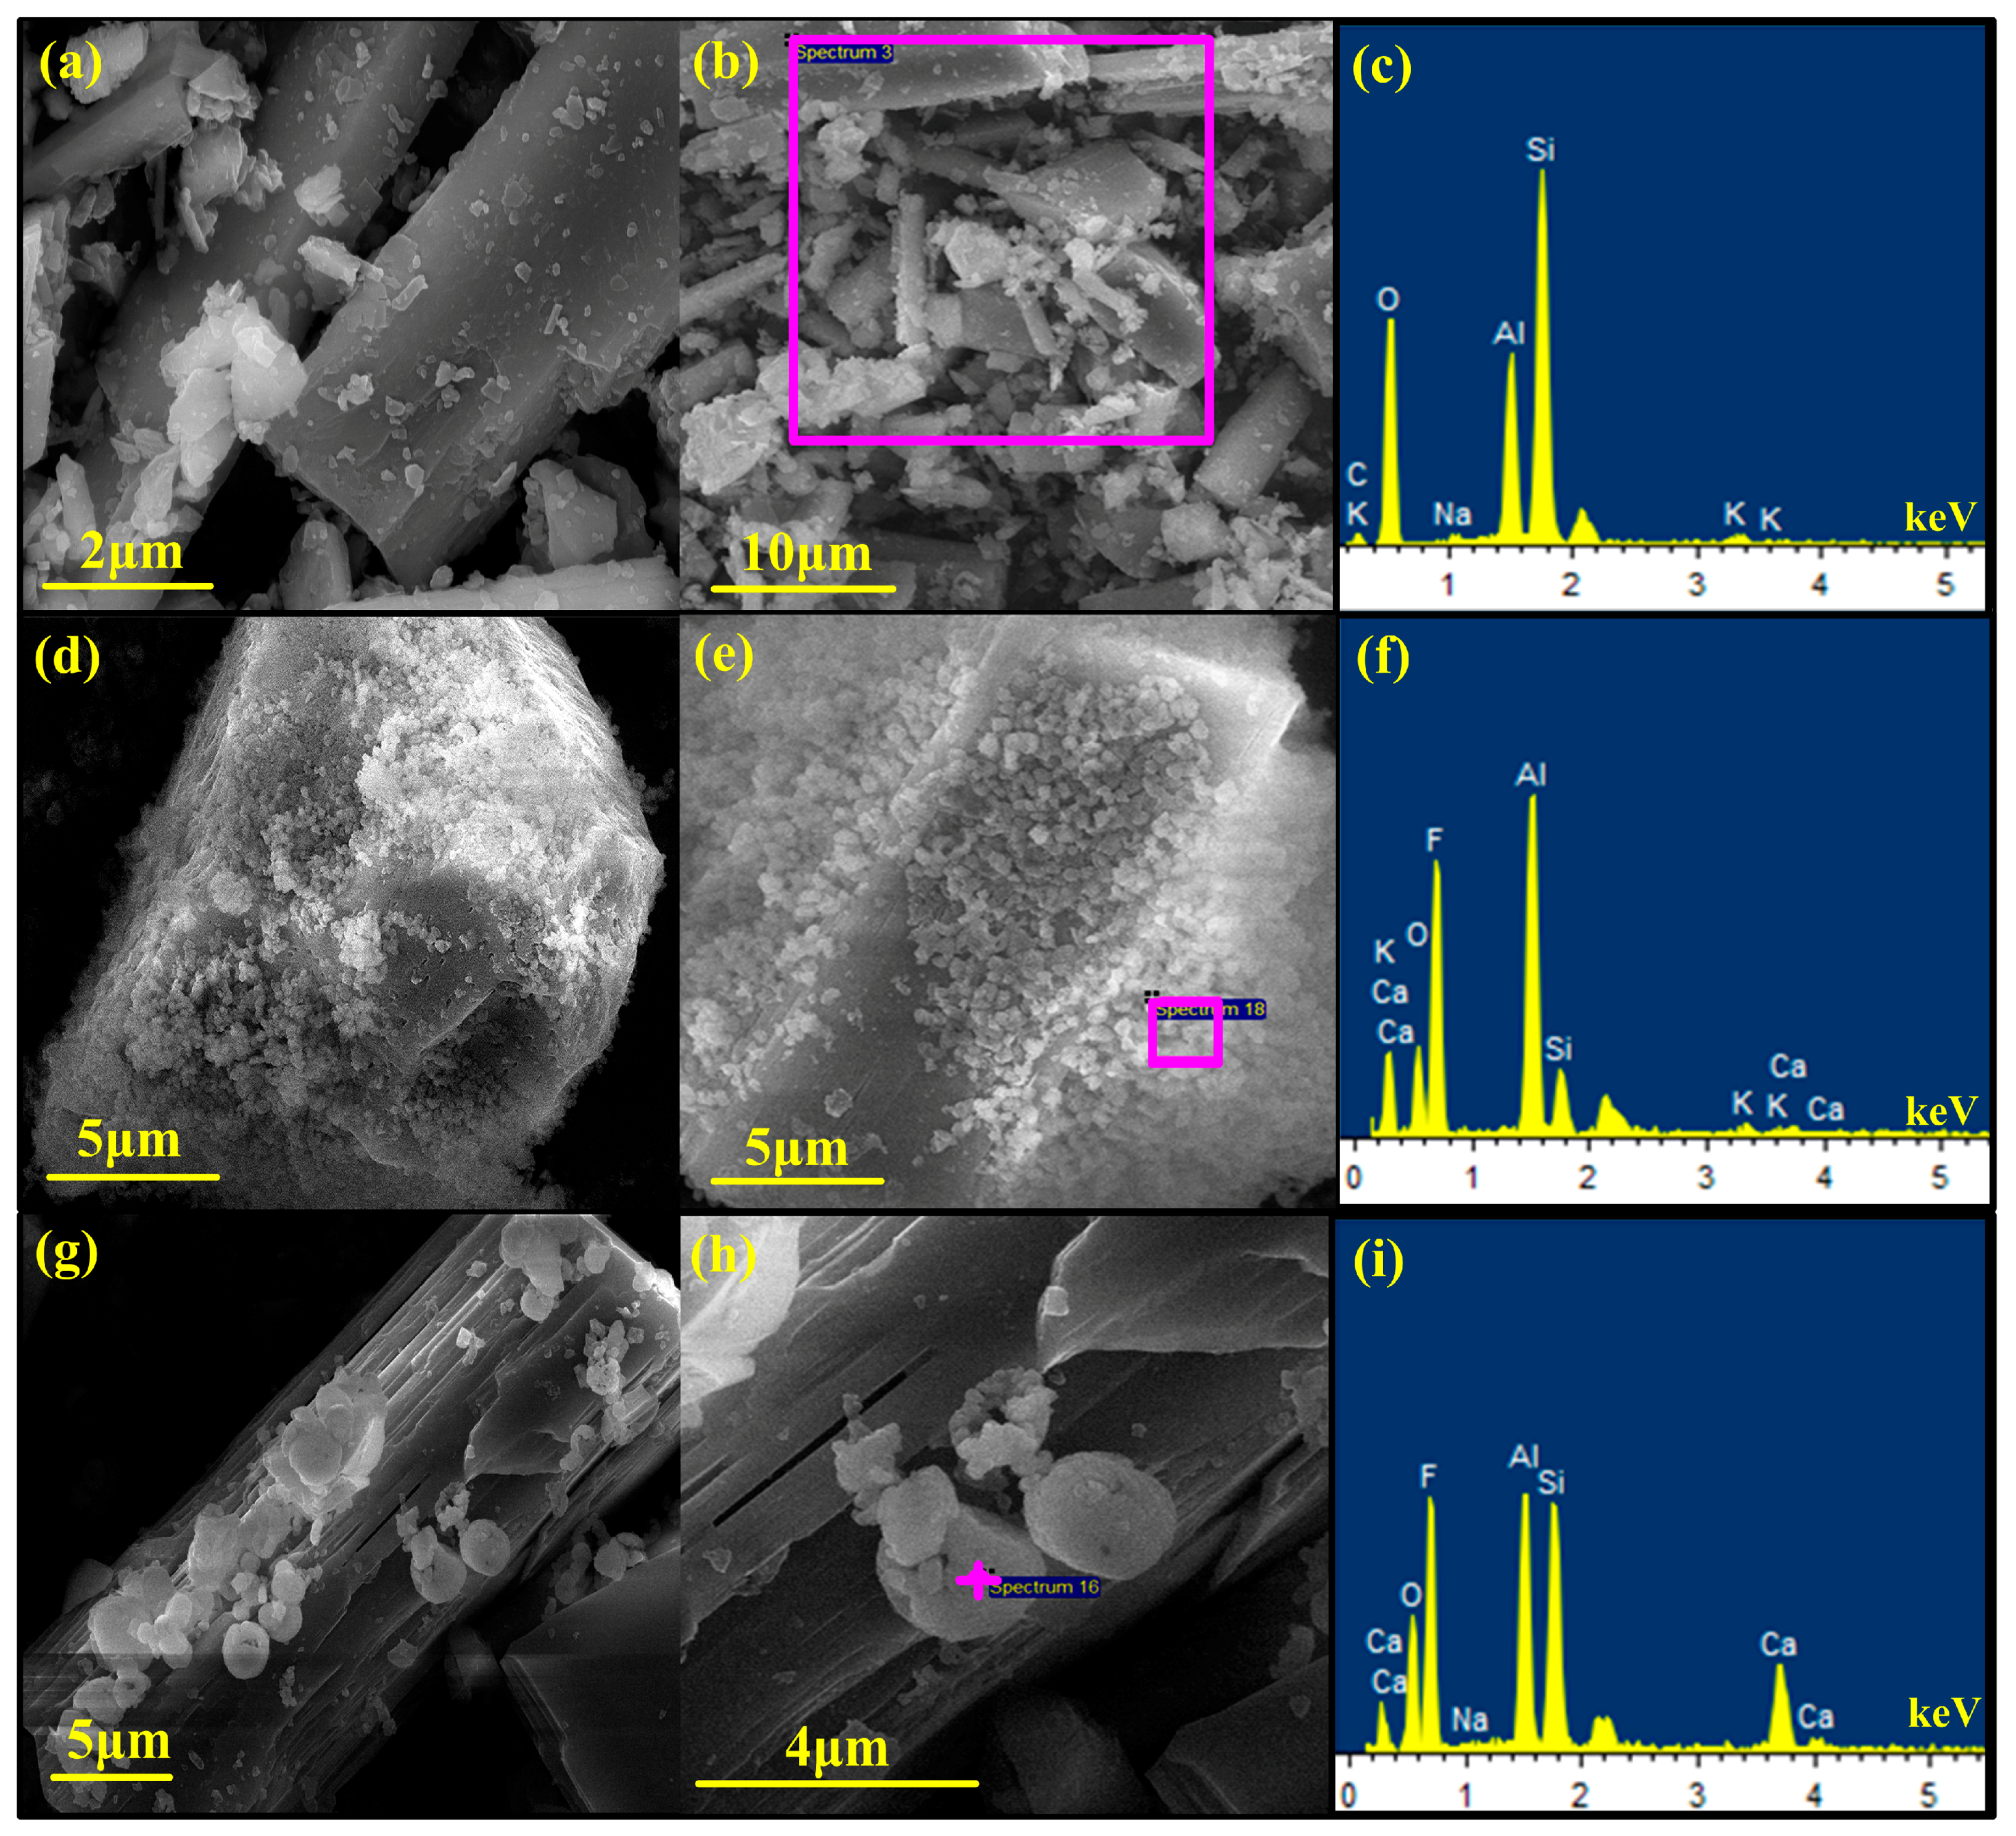
3.5.3. SEM-EDX Analyses

The SEM-EDX images also showed that some insoluble salts were generated and were found around the surface of particle at 15 min (Figure 12d,e), indicating that H+ and HF were first absorbed onto the surface, then penetrated, and gradually reacted with the ore. When combined with the XRD analyses (Figure 10), XPS (Figure 11) and SEM-EDX (Figure 12f), some fluorides, such as Na3AlF6, Na3Li3Al2F12, CaF2, and K2AlF5, were generated. As the reaction continued, the insoluble products attached to the particle surface were gradually dissolved by H2SO4, and this was verified using morphological changes determined with the SEM-EDX analysis of residues at 15 min and 30 min (Figure 12), which were obviously different from the SEM images (Figure 12a,b) of the ore sample with regular surfaces and edges.

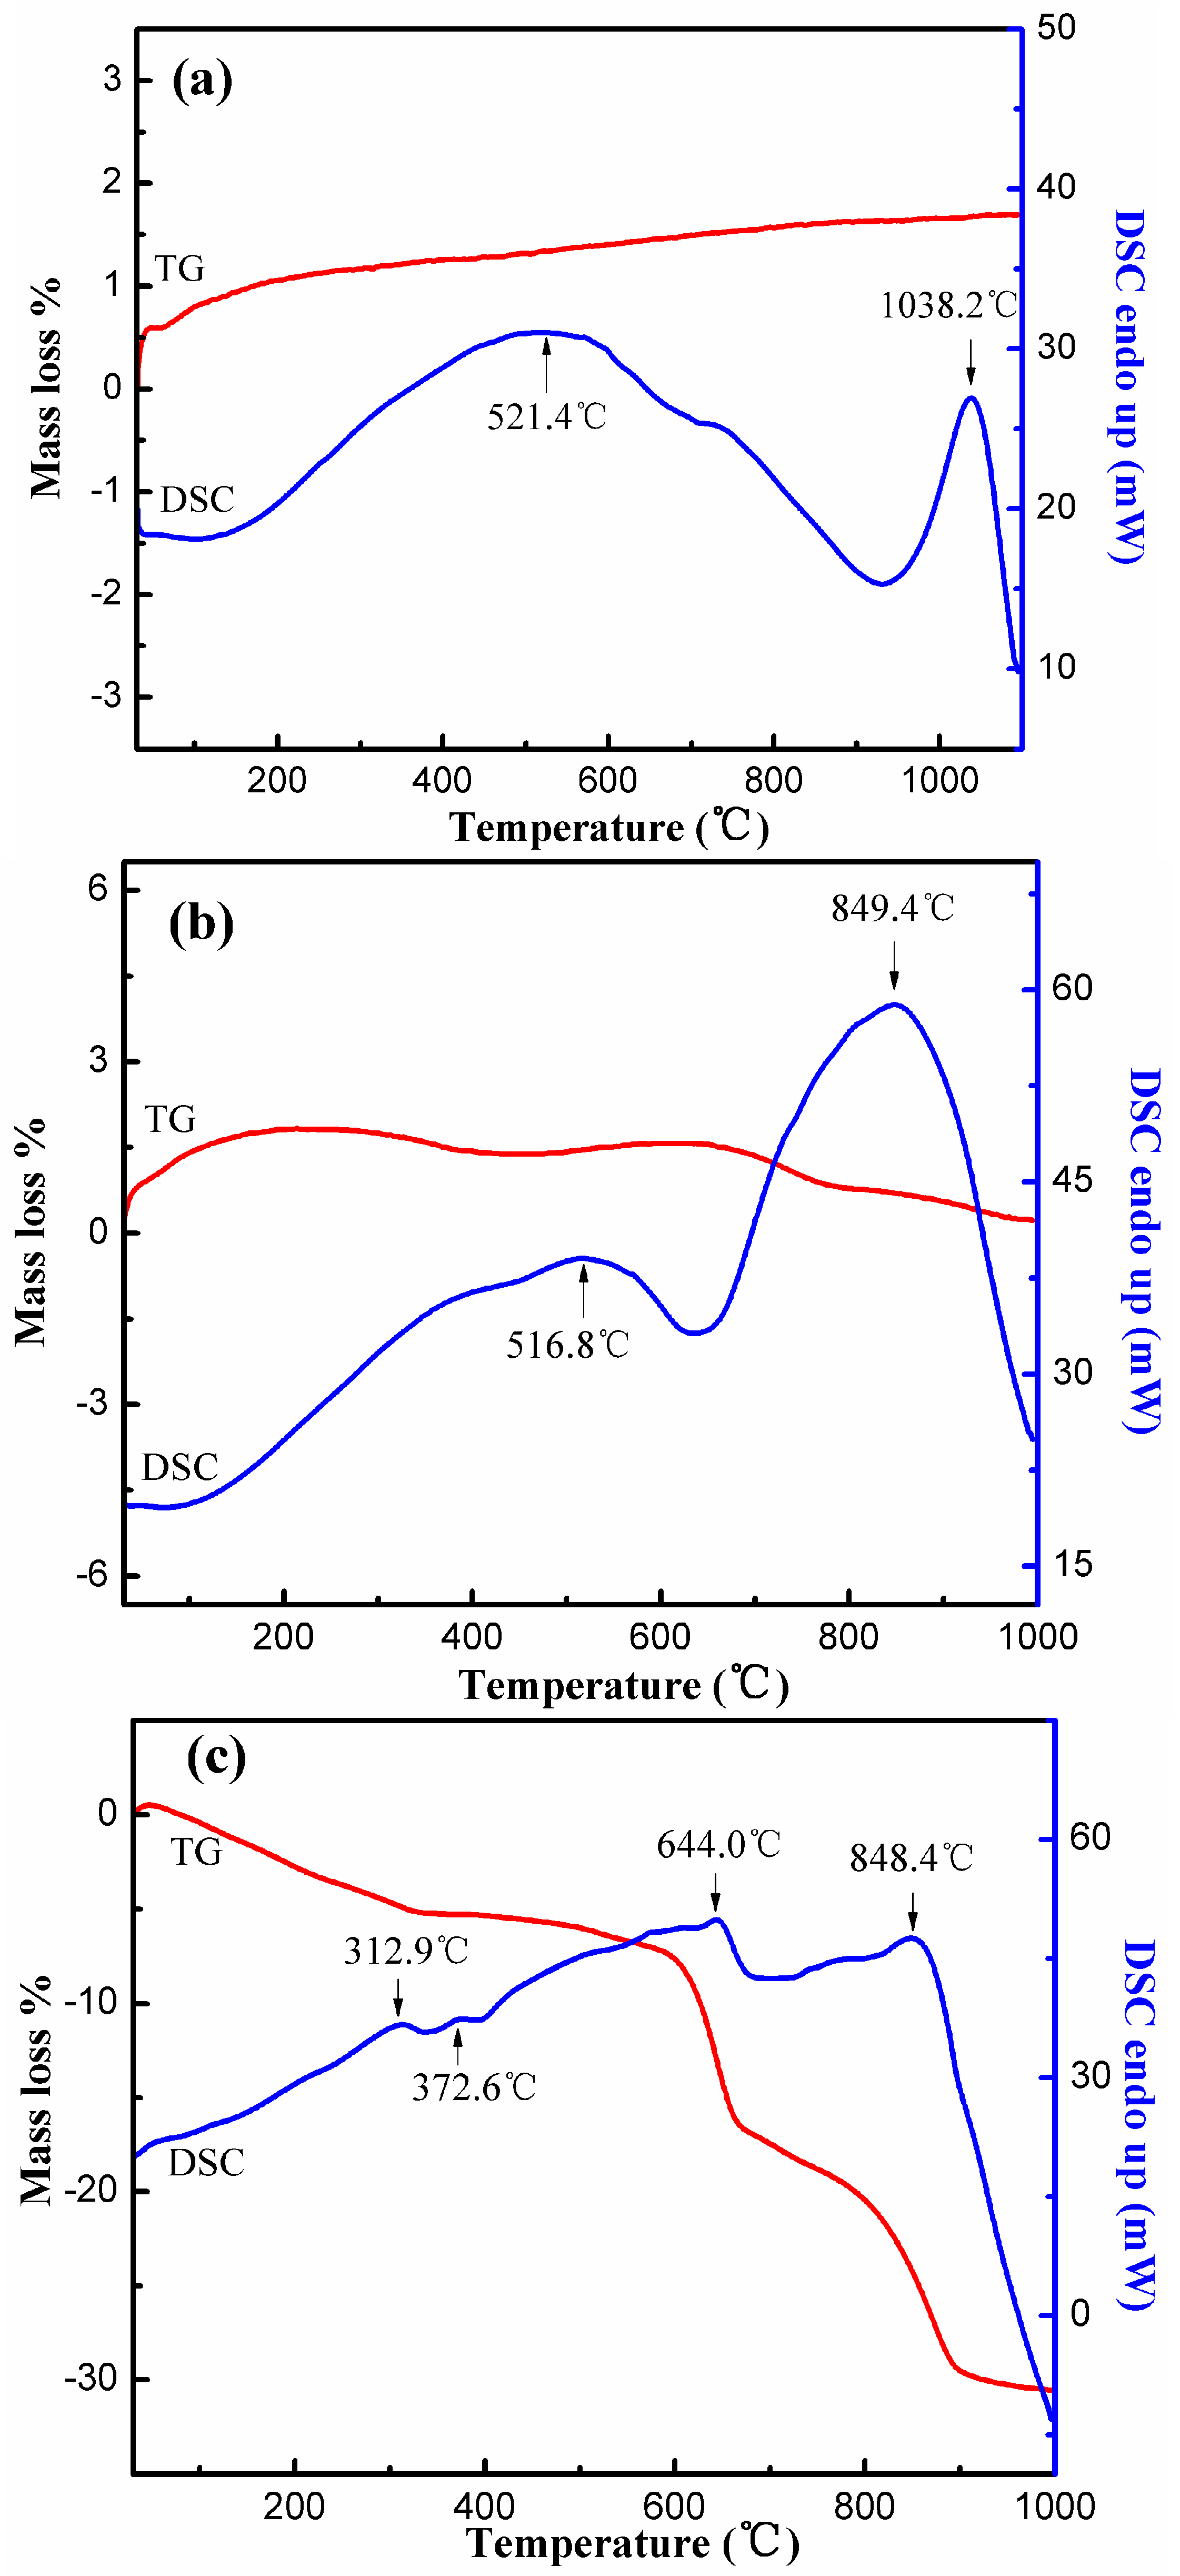
3.5.4. TG-DSC Analyses

The thermal decomposition behavior was investigated in an N2 atmosphere (40 mL/min) using TG-DSC, which was important for both confirmation of generated intermediates and comprehensive utilization of insoluble residues. The TG analysis of the ore sample showed that an obvious endothermic peak (Figure 13a) occurred at 1038.2 °C due to a phase transformation from α-spodumene into the β phase [9]. The phase transformation occurred at 849.4 and 848.4 °C, in residues at 15 min (Figure 13b) and 180 min (Figure 13c), respectively, which could be attributed to the partially-destroyed crystal structure, resulting in a much easier phase transformation at about 800 °C. The endothermic peaks at 521.4 °C of the ore sample, and 516.8 °C of the residues, at 15 min, belonged to the phase transform of albite. The endothermic peaks at 312.9 and 372.6 °C at 180 min could be distributed to the decomposition of Na2SiF6 and KNaSiF6 [33]. The mass decrease at 644.0 °C was mainly caused by the decomposition of AlF3 [34]. The thermal decomposition behaviors were consistent with our speculation on the generated intermediates. The subsequent process of defluorination and utilization of the insoluble residues should pay attention to the temperature.

3.6. Chemical Analysis under Optimal Conditions

The analyses of the chemical elements of lixivium and the residues under optimal conditions are listed in Table 3. The detailed XRF analyzed results of the residues are listed in Table S8. The dissolution of α-spodumene proceeded thoroughly for about 96% of lithium was leached with less than 10% of insoluble residue remained. About 1.51 g/L of lithium was contained in the lixivium before evaporation and precipitation were employed to produce Li2CO3, which was comparable to previous research. Considerable Al was contained in the lixivium, which could be removed and utilized by alum formation according to the processes proposed in our previous works [35,36].
To verify the reliability of the analytical data, the dissolution experiment at 30 min was taken for an example to balance the lithium element during the process. Related data and analytical results are listed in Table 4. The deviation calculated was accredited to 1.3%.

4. Conclusions

A promising strategy was presented to accelerate the leaching of lithium from α-spodumene, using mixed acid HF/H2SO4 as a lixiviant without a phase transformation. More lithium (96%, about 1.5 g/L) could be transferred into lixivium under much more moderate conditions (at 100 °C) as compared to previous methods, before evaporation and precipitation to produce Li2CO3. Additionally, the investigated dissolution behaviors help to understand the role that HF played in the dissolution of silicate. The proposed method achieved an efficient leaching of lithium without strict requirements on ore grade, and has potential applications in the extraction of other valuable elements from silicates.

Supplementary Materials

The following are available online at www.mdpi.com/2075-163X/7/11/205/s1, Table S1: XRF analyzed results of the ore sample; Tables S2–S6: AAS results of lithium contained in the lixivium for the optimal dissolution investigations; Table S7: AAS results of lithium for the dissolution kinetics investigations: Table S8: XRF analyses of insoluble residues under optimal conditions.

Acknowledgments

The authors appreciate the Changsha Research Institute of Mining And Metallurgy for AAS analyses. The research was supported by the National Natural Science Fund of China (Grant No. 51474237) and the National Key Technology R&D Program of China during the 12th Five-year Plan Period (Grant No. 2012BAB10B02).

Author Contributions

Hui Guo, Ge Kuang and Haidong Wang conceived and designed the experiments; Hui Guo, Haizhao Yu and Xiaokang Zhao performed the experiments and analyzed the results; Hui Guo wrote the paper.

Conflicts of Interest

The authors declare no conflict of interest.

Nomenclature

List for different phases in XRD analyses:
symbolphase
α-Spodumene, LiAlSi2O6, JCPDS 33-0786
Albite, NaAlSi3O8, JCPDS 09-0466
Quartz, SiO2, JCPDS 65-0466
Cryolithionite, Na3Li3Al2F12, JCPDS 22-0416
Cryolite, Na3AlF6, JCPDS 82-0216
K2AlF5, JCPDS 52-0735
AlF3, JCPDS 44-0231
KNaSiF6, JCPDS 43-1313
Na2SiF6, JCPDS 72-1115
CaF2, JCPDS 48-9812

References

  1. Goodenough, J.B.; Park, K.S. The Li-Ion Rechargeable Battery: A Perspective. J. Am. Chem. Soc. 2013, 135, 1167–1176. [Google Scholar] [CrossRef] [PubMed]
  2. Vikström, H.; Davidsson, S.; Höök, M. Lithium availability and future production outlooks. Appl. Energy 2013, 110, 252–266. [Google Scholar] [CrossRef]
  3. Kesler, S.E.; Gruber, P.W.; Medina, P.A.; Keoleian, G.A.; Eversond, M.P.; Wallington, T.J. Global lithium resources: Relative importance of pegmatite, brine and other deposits. Ore Geol. Rev. 2012, 48, 55–69. [Google Scholar] [CrossRef]
  4. An, J.W.; Kang, J.D.; Tran, K.T.; Kim, M.J.; Lim, T.; Tran, T. Recovery of lithium from Uyuni salar brine. Hydrometallurgy 2012, 117, 64–70. [Google Scholar] [CrossRef]
  5. Meshram, P.; Pandey, B.D.; Mankhand, T.R. Extraction of lithium from primary and secondary sources by pre-treatment, leaching and separation: A comprehensive review. Hydrometallurgy 2014, 150, 192–208. [Google Scholar] [CrossRef]
  6. Choubey, P.K.; Kim, M.S.; Srivastava, R.R.; Lee, J.C.; Lee, J.Y. Advance review on the exploitation of the prominent energy-storage element: Lithium. Part I: From mineral and brine resources. Miner. Eng. 2016, 89, 119–137. [Google Scholar] [CrossRef]
  7. Xu, L.; Hu, Y.; Wu, H.; Tian, J.; Liu, J.; Gao, Z.; Wang, L. Surface crystal chemistry of spodumene with different size fractions and implications for flotation. Sep. Purif. Technol. 2016, 169, 33–42. [Google Scholar] [CrossRef]
  8. Kwang, S.M.; Fuerstenau, D.W. Surface crystal chemistry in selective flotation of spodumene (LiAl[SiO3]2) from other aluminosilicates. Int. J. Miner. Process. 2003, 72, 11–24. [Google Scholar]
  9. Chen, Y.; Tian, Q.; Chen, B.; Shi, X.; Liao, T. Preparation of lithium carbonate from spodumene by a sodium carbonate autoclave process. Hydrometallurgy 2011, 109, 43–46. [Google Scholar] [CrossRef]
  10. Barbosa, L.I.; Valente, G.; Orosco, R.P.; González, J.A. Lithium extraction from β-spodumene through chlorination with chlorine gas. Miner. Eng. 2014, 56, 29–34. [Google Scholar] [CrossRef]
  11. Barbosa, L.I.; González, J.A.; del Carmen Ruiz, M. Extraction of lithium from β-spodumene using chlorination roasting with calcium chloride. Thermochim. Acta 2015, 605, 63–67. [Google Scholar] [CrossRef]
  12. Rosales, G.D.; del Carmen Ruiz, M.; Rodriguez, M.H. Novel process for the extraction of lithium from β-spodumene by leaching with HF. Hydrometallurgy 2014, 147, 1–6. [Google Scholar] [CrossRef]
  13. Suarez, D.S.; Pinna, E.G.; Rosales, G.D.; Rodriguez, M.H. Synthesis of Lithium Fluoride from Spent Lithium Ion Batteries. Minerals 2017, 7, 81. [Google Scholar] [CrossRef]
  14. Monk, D.J.; Soane, D.S.; Howe, R.T. A review of the chemical reaction mechanism and kinetics for hydrofluoric acid etching of silicon dioxide for surface micromachining applications. Thin Solid Films 1993, 232, 1–12. [Google Scholar] [CrossRef]
  15. Dhar, S.; Seitz, O.; Halls, M.D.; Choi, S.; Chabal, Y.J.; Feldman, L.C. Chemical Properties of Oxidized Silicon Carbide Surfaces upon Etching in Hydrofluoric Acid. J. Am. Chem. Soc. 2009, 131, 16808–16813. [Google Scholar] [CrossRef] [PubMed]
  16. Ghidiu, M.; Lukatskaya, M.R.; Zhao, M.Q.; Gogotsi, Y.; Barsoum, M.W. Conductive two-dimensional titanium carbide ‘clay’ with high volumetric capacitance. Nature 2014, 516, 78–81. [Google Scholar] [CrossRef] [PubMed]
  17. Fogler, H.S.; Lund, K.; McCune, C.C. Acidization III—The kinetics of the dissolution of sodium and potassium feldspar in HF/HCl acid mixtures. Chem. Eng. Sci. 1975, 30, 1325–1332. [Google Scholar] [CrossRef]
  18. Kline, W.E.; Fogler, H.S. Dissolution kinetics: The nature of the particle attack of layered silicates in HF. Chem. Eng. Sci. 1981, 36, 871–884. [Google Scholar] [CrossRef]
  19. Li, N.; Zeng, F.B.; Li, J.; Zhang, Q.; Feng, Y.; Liu, P. Kinetic mechanics of the reactions between HCl/HF acid mixtures and sandstone minerals. J. Nat. Gas Sci. Eng. 2016, 34, 792–802. [Google Scholar] [CrossRef]
  20. Kuang, G.; Chen, Z.; Guo, H.; Li, M. Lithium Extraction Mechanism from α-Spodumene by Fluorine Chemical Method. Adv. Mater. Res. 2012, 524, 2011–2016. [Google Scholar] [CrossRef]
  21. HSC Chemistry Software, version 6.0; Outokumpu Technology Company: Espoo, Finland, 2006.
  22. Ye, D.L.; Hu, J.H. Thermochemical Properties of Inorganic Substances; Metallurgy Industrial Press: Beijing, China, 2002. (In Chinese) [Google Scholar]
  23. Miki, N.; Maeno, M.; Maruhashi, K.; Ohmi, T. Vapor-Liquid Equilibrium of the Binary System HF-H2O Extending to Extremely Anhydrous Hydrogen Fluoride. J. Electrochem. Soc. 1990, 137, 787–790. [Google Scholar] [CrossRef]
  24. Luo, W.; Feng, Q.; Ou, L.; Zhang, G.; Chen, Y. Kinetics of saprolitic laterite leaching by sulphuric acid at atmospheric pressure. Miner. Eng. 2010, 23, 458–462. [Google Scholar] [CrossRef]
  25. Hess, A.; Kemnitz, E.; Lippitz, A.; Unger, W.E.S.; Menz, D.H. Esca, XRD, and IR characterization of aluminum oxide, hydroxyfluoride, and fluoride surfaces in correlation with their catalytic activity in heterogeneous halogen exchange reactions. J. Catal. 1994, 148, 270–280. [Google Scholar] [CrossRef]
  26. Hasha, D.; Saldarriaga, L.S.D.; Saldarriaga, C.; Hathaway, P.E.; Cox, D.F.; Davis, M.E. Studies of silicoaluminophosphates with the sodalite structure. J. Am. Chem. Soc. 1988, 110, 2127–2135. [Google Scholar] [CrossRef]
  27. Morgan, W.E.; Wazer, J.R.V.; Stec, W.J. Inner-orbital photoelectron spectroscopy of the alkali metal halides, perchlorates, phosphates, and pyrophosphates. J. Am. Chem. Soc. 1973, 95, 751–755. [Google Scholar] [CrossRef]
  28. Wagner, C.D. Handbook of X-ray Photoelectron Spectroscopy; Perkin-Elmer Corporation, Physical Electronics Division: Eden Prairie, MN, USA, 1979; pp. 32–65. [Google Scholar]
  29. Ro, C.; Linton, R.W. Characterization of LiF using XPS. Surf. Sci. Spectr 1992, 1, 277–283. [Google Scholar] [CrossRef]
  30. Murch, G.E.; Thorn, R.J. Relation between orbital binding energies and ionicities in alkali and alkaline earth flourides. J. Phys. Chem. Solids 1980, 41, 785–791. [Google Scholar] [CrossRef]
  31. Nefedov, V.I.; Buslaev, Y.A.; Kokunov, Y.V. X-ray electron spectroscopy of alkali metal fluorides and alkaline earth metal fluorides. Zhurnal Neorg. Khim. 1974, 19, 1166–1169. (In Russian) [Google Scholar]
  32. Rueda, F.; Mendialdua, J.; Rodriguez, A.; Casanova, R.; Barbaux, Y.; Gengembre, L.; Jalowiecki, L. Characterization of venezuelan laterites by X-ray photoelectron spectroscopy. J. Electron. Spectrosc. Relat. Phenom. 1996, 82, 135–143. [Google Scholar] [CrossRef]
  33. Frayret, J.; Castetbon, A.; Trouve, G.; Potin-Gautier, M. Solubility of (NH4)2SiF6, K2SiF6, and Na2SiF6 in acidic solutions. Chem. Phys. Lett. 2006, 427, 356–364. [Google Scholar] [CrossRef]
  34. Menz, D.H.; Zacharias, A.; Kolditz, L. A comparison of the thermal behaviour of α-AIF3, and aluminium fluoride hydrates. J. Therm. Anal. Calorim. 1988, 33, 811–815. [Google Scholar] [CrossRef]
  35. Guo, H.; Kuang, G.; Yang, J.X.; Hu, S. Fundamental research on a new process to remove Al3+, as potassium alum during lithium extraction from lepidolite. Metall. Mater. Trans. B 2016, 47, 3557–3564. [Google Scholar] [CrossRef]
  36. Kuang, G.; Li, H.; Hu, S.; Jin, R.; Liu, S.; Guo, H. Recovery of aluminium and lithium from gypsum residue obtained in the process of lithium extraction from lepidolite. Hydrometallurgy 2015, 157, 214–218. [Google Scholar] [CrossRef]
Figure 1. Schematic diagram of fluorine sulfuric acid method to extract lithium from α-spodumene.
Minerals 07 00205 g001
Figure 2. Effect of different mass ratio of HF/ore on the dissolution process (75 °C, ore/H2SO4 1: 2.5, 150 rpm, 3 h).
Minerals 07 00205 g002
Figure 3. X-ray diffraction analysis (XRD) analyses of insoluble residues with different ore/HF: (a) ore sample; (b) ore/HF 1:1.5; (c) ore/HF 1:3 and (d) ore/HF 1:3.5 (75 °C, ore/H2SO4 1:2.5, 150 rpm, 3 h).
Minerals 07 00205 g003
Figure 4. Effects of temperature on the dissolution process (ore/HF/H2SO4 1:3:2.5, 150 rpm, 3 h).
Minerals 07 00205 g004
Figure 5. XRD analyses of insoluble residues at different dissolution temperatures: (a) ore sample; (b) 75 °C and (c) 100 °C (ore/HF/H2SO4 1:3:2.5, 150 rpm, 3 h).
Minerals 07 00205 g005
Figure 6. Effects of H2SO4/ore ratio on the dissolution process: (a) ore/HF 1:3; (b) ore/HF 1:1.5 (75 °C, 150 rpm, 3 h).
Minerals 07 00205 g006
Figure 7. XRD analyses of insoluble residues under different ratios of ore/H2SO4: (a) ore sample; (be) ore/H2SO4: 1, 1:2, 1:2.5 and 1:3, respectively (75 °C, ore/HF 1: 3, 150 rpm, 3 h).
Minerals 07 00205 g007
Figure 8. Effects of dissolution time on the dissolution process (75 °C, ore/HF/H2SO4 1:1.5:2.5, 150 rpm).
Minerals 07 00205 g008
Figure 9. Leaching rate of lithium for α-spodumene dissolved in lixiviant HF/H2SO4 under optimal conditions (100 °C, ore/HF/H2SO4 1:3:2, 150 rpm).
Minerals 07 00205 g009
Figure 10. XRD analyses of residues obtained at different dissolution times under optimal conditions (100 °C, ore/HF/H2SO4 1:3:2, 150 rpm).
Minerals 07 00205 g010
Figure 11. X-ray photoelectron spectroscopy (XPS) spectrums of typical elements in residues for different dissolution times: (a) Al 2p in ore sample; (b,c) Al 2p and F 1s of residues at 15 min; (df) Al 2p, F 1s, and Si 2p of residues at 180 min, respectively.
Minerals 07 00205 g011
Figure 12. SEM and X-ray spectrometer (EDX) images of residues under different dissolution times: (ac) ore sample; (df) 15 min; (gi) 30 min; (100 °C, ore/HF/H2SO4 1:3:2, 150 rpm).
Minerals 07 00205 g012
Figure 13. TG-DSC analyses of the ore sample (a), residues at 15 min (b) and 180 min (c).
Minerals 07 00205 g013
Table 1. Chemical analysis of α-spodumene ore sample.
ElementSiAlLiONaKCaFe
Content, wt %32.6311.432.5641.040.350.680.450.54
Table 2. Thermodynamic calculation results of reaction 2 from 0 to 125 °C.
T, °C∆H°, kJ∆S°, J/K∆G°, kJ
0−572.534715.044−767.848
25−547.462802.860−786.835
50−521.889885.214−807.946
75−495.764963.072−831.058
100−468.9961037.314−856.069
125−441.4611108.725−882.900
Table 3. Chemical analysis of residues and lixivium under optimal conditions.
ElementResidues, wt %Lixivium
Concentration, g/L *Leaching Efficiency a, %
Si20.32
Al15.397.8389
Li 1.5196
O23.82
Na0.120.2191
K0.360.5895
Ca0.19
a Calculated based on the element concentration in lixivium; * equivalent to molar concentration were c(Al) = 0.29 mol/L, c(Li) = 0.216 mol/L, c(Na) = 0.0091 mol/L and c(K) = 0.015 mol/L.
Table 4. Lithium elemental balance taken the 30 min for example. *
Ore SampleLixiviumResidues
Lithium content, g0.25660.22140.0319
Deviation, %1.3%
* more: 10.0239 g; volume of lixivium: 173.0 mL; mres: 1.8853 g with 1.69% Li contained.

