Article

Fault Reactivation Can Generate Hydraulic Short Circuits in Underground Coal Gasification—New Insights from Regional-Scale Thermo-Mechanical 3D Modeling

1
GFZ German Research Centre for Geosciences, Fluid Systems Modelling, Telegrafenberg, 14473 Potsdam, Germany
2
Główny Instytut Górnictwa (Central Mining Institute), Plac Gwarków 1, 40-166 Katowice, Poland
*
Author to whom correspondence should be addressed.
Minerals 2016, 6(4), 101; https://doi.org/10.3390/min6040101
Submission received: 30 June 2016 / Revised: 21 September 2016 / Accepted: 22 September 2016 / Published: 29 September 2016

Abstract

:
Underground coal gasification (UCG) has the potential to increase worldwide coal reserves by utilization of coal deposits not mineable by conventional methods. This involves combusting coal in situ to produce a synthesis gas, applicable for electricity generation and chemical feedstock production. Three-dimensional (3D) thermo-mechanical models already significantly contribute to UCG design by process optimization and mitigation of the environmental footprint. We developed the first 3D UCG model based on real structural geological data to investigate the impacts of using isothermal and non-isothermal simulations, two different pillar widths and four varying regional stress regimes on the spatial changes in temperature and permeability, ground surface subsidence and fault reactivation. Our simulation results demonstrate that non-isothermal processes have to be considered in these assessments due to thermally-induced stresses. Furthermore, we demonstrate that permeability increase is limited to the close reactor vicinity, although the presence of previously undetected faults can introduce formation of hydraulic short circuits between single UCG channels over large distances. This requires particular consideration of potentially present sub-seismic faults in the exploration and site selection stages, since the required pillar widths may be easily underestimated in presence of faults with different orientations with respect to the regional stress regime.

1. Introduction

Underground coal gasification aims at in situ conversion of coal deposits, currently not mineable by conventional methods and production of a high-calorific synthesis gas, applicable for power generation, natural gas substitution and chemical feedstock production. In UCG, target coal deposits are developed by directional drilling and then converted into a synthesis gas by sub-stoichiometric combustion, using gasification agents based on oxygen-enriched air and steam. Synthesis gas constituents are mainly hydrogen, carbon monoxide, carbon dioxide and methane in addition to nitrogen and minor components such as sulfuric acid [1,2,3,4,5,6,7,8].
Apart from the high economic potentials, UCG may effect site-specific environmental impacts, including fault reactivation, induced seismicity and ground surface subsidence. Furthermore, potentially induced changes in overburden hydraulic conductivity may result in pollution of shallow aquifers [9,10]. Especially thermo-mechanical effects and/or fault reactivation may introduce potential migration pathways for hazardous environmental contaminants, mainly composed of organic and inorganic pollutants [4,9,11]. Site-specific coupled thermo-mechanical processes occurring in rocks adjacent to a deep UCG reactor are generally not well known in the field, because of the difficulty to quantify all occurring chemical reactions during the UCG process and their effects on UCG reactor size and shape [12]. Current knowledge on these processes is mainly based on laboratory experiments [13,14,15,16,17,18,19,20,21,22,23] and a few successful UCG field trails. Since the 1930s, more than 50 pilot-scale UCG operations have been carried out worldwide. These developments have been concentrated in the former Union of Soviet Socialist Republics (USSR), Europe, U.S., South Africa, Australia and China and were predominantly undertaken at shallow depths, e.g., at Angren (110 m) in Uzbekistan, Chinchilla (140 m) in Australia, and Hanna (80 m) and Hoe Creek (30–40 m) in the U.S. [3,7,12,24,25,26].
Developing an UCG model to quantify the process performance and to obtain reliable predictions for a new UCG development before proceeding to the gasification stage requires a sound understanding of its physical theory as well as knowledge on how to integrate field test and laboratory data in the analysis [27]. Khan et al. [27] concluded that each potential UCG site will be unique, so that design parameters (i.e., coal seam depth, thickness, inclination, coal properties, moisture content, water influx, etc.) have to be addressed before initiating the site operation and performance parameters are taken into account. Due to the high financial effort associated with UCG field trials, mathematical and numerical modeling has become an important methodology to study the coupled processes influencing UCG performance. However, the complexity of simultaneously occurring physical and chemical processes, such as chemical reactions and their kinetics, transport phenomena (i.e., heat and mass), turbulent flow patterns in the reactor, water influx from the surrounding rock mass and thermo-mechanical processes related to geological boundary conditions and stress regimes is remarkably high [27,28,29]. Almost all previous UCG studies applied one-dimensional (1D) or two-dimensional (2D) models to account for selected coupled processes [10], which only have a limited validity in predicting the performance of UCG field trial operation, especially when considering the generally high heterogeneity and complexity of geological systems. For instance, it is known that 2D models may overestimate the magnitude of ground surface subsidence and stresses in pillars [30]. Consequently, three-dimensional (3D) numerical 3D models, representing known geological features in high details are required for reliable predictions of site-specific UCG performance.
Nowadays, it is possible to develop and apply 3D models of varying complexity due to the significantly lower demand in computational time with the availability and advancement of innovative modeling and coupling techniques as well as parallel computations. In order to enhance the features of a 3D model and to apply the model for the assessment and prediction of UCG performance considering thermo-mechanical impacts, it is imperative to incorporate coal seam properties and geology of the target site into the model. Hereby, our previous findings [31,32] emphasize that model simplifications with regard to the consideration of thermo-mechanical parameters in far-field numerical models can significantly reduce the computational time, while preserving the validity of the numerical results.
Taking into account these findings, coupled simulations based on complex 3D regional-scale models were employed in the present study to assess the potential formation of hydraulic short circuits between single UCG channels. For that purpose, a coupled thermo-mechanical 3D model has been developed to allow investigating the regional-scale geomechanical impacts of a hypothetical UCG operation at the Polish Wieczorek mine located in the Upper Silesian Coal Basin.

2. Materials and Methods

2.1. Numerical Model Geometry, Parametrization and Boundary Conditions

Based on well log data and geological cross-sections of the Polish Wieczorek mine in the Upper Silesian Coal Basin, a 3D structural geological model was implemented and integrated into a numerical thermo-mechanical model. The finite-difference thermo-hydro-mechanical simulator FLAC3D [33] was employed to analyze thermo-mechanical stress changes, displacements and volumetric strain increments around the UCG reactors, using a specifically refined unstructured grid.
Table 1 shows the mechanical parameterization of the subdivided lithological units of the model, carried out using averaged data from Chećko [34], whereby thermal properties for Layers 5–10 were derived from published data (Table 2). Fault properties were assumed with zero cohesion, a friction angle of 20° and dilation angle of 10°. We assigned the FLAC3D Mohr–Coulomb model (elasto-plastic constitutive law) to all lithological layers in the numerical model. The spatial model size is 10 km × 10 km × 5 km, comprising ten lithological units (dipping 8° S), a double fault (dipping 82° NW) penetrating the target coal seam and 13 UCG channels of 2000 m length. Each UCG channel consists of 40 single reactors of 11 m in height, 20 m in width and about 50 m in length. The model is discretized by about 1.5 million elements of 3.66 (close UCG reactor vicinity) to 800 m (model boundaries) extent in horizontal and vertical directions (Figure 1), whereby grid element sizes increase towards the lateral and bottom model boundaries. Further, 28,928 elements were implemented as ubiquitous joint elements, introducing a plane of weakness respecting the fault dip direction and angle. We meshed the model using hexahedral grid elements and maintained a rectangular UCG reactor shape to limit the total amount of elements. Local grid refinements were applied in the near-reactor and near-fault areas to properly account for local thermo-mechanical effects. Hereby, the chosen model size and grid discretization were optimized by grid sensitivity analyses, while the model boundary conditions were maintained at a pre-defined distance to avoid any impact on the simulation results in the area of interest. Velocities perpendicular to the model bottom and to the lateral boundaries were set to zero at the respective model boundaries, while the model top was defined as free surface. Exact fault geometries were considered by the implementation of the previously addressed ubiquitous joint elements to integrate the spatially varying fault dip direction and angle.
Most of hydraulic fracturing test and focal mechanism data indicate the predominance of a strike-slip stress regime with a maximum horizontal stress orientation (SHmax) in northwest to southeast direction (SHmax azimuth of 167°) in the Upper Silesian Coal Basin in Poland [35]. We incorporated this stress regime into the 3D model, whereby the vertical stress gradient results from the gravitational load of the overburden.
After calibrating the numerical model with regard to the present stress regime, an equilibrated mechanical state was achieved. This state served as starting data set for all simulations carried out in the scope of the present study. In order not to overestimate ground surface subsidence and stresses in 3D models as discussed by Adhikary et al. [30], UCG reactor growth is considered to occur simultaneously in 50-m steps along the pre-defined UCG channels, determined by an average gasification front progress of 1 m/day. The selected reactor growth rate is in good agreement with the empirical model presented by Najafi et al. [12], allowing for predication of UCG reactor growth rates under various operational and geological boundary conditions. Data published on previous field-scale UCG activities exhibit reactor growth rates varying from 0.35 to 1.2 m/day. A constant temperature of 1000 °C was applied at the boundary of each active reactor after its excavation, whereby the in situ temperature was set to 30 °C following the local geothermal gradient. The numerical model was calculated until a mechanical equilibrium was achieved following each thermal time step of 50 days duration. The temporal temperature development in the rocks adjacent to the UCG channel was taken into account according to the cool-down process documented by Sarhosis et al. [36]. After the mechanical equilibrium state is achieved, the next reactor growth step is undertaken. Our present simulations neglect pore pressure, and thus pore fluid heat capacity and thermal conductivity are not taken into account, while the driving force for heat transport is conduction. Furthermore, the thermo-mechanical simulations carried out in this study focus on an extreme case of spatial temperature distribution, neglecting fluid flow into and out of the reactor as well as the steam jacket developing in the hanging wall.

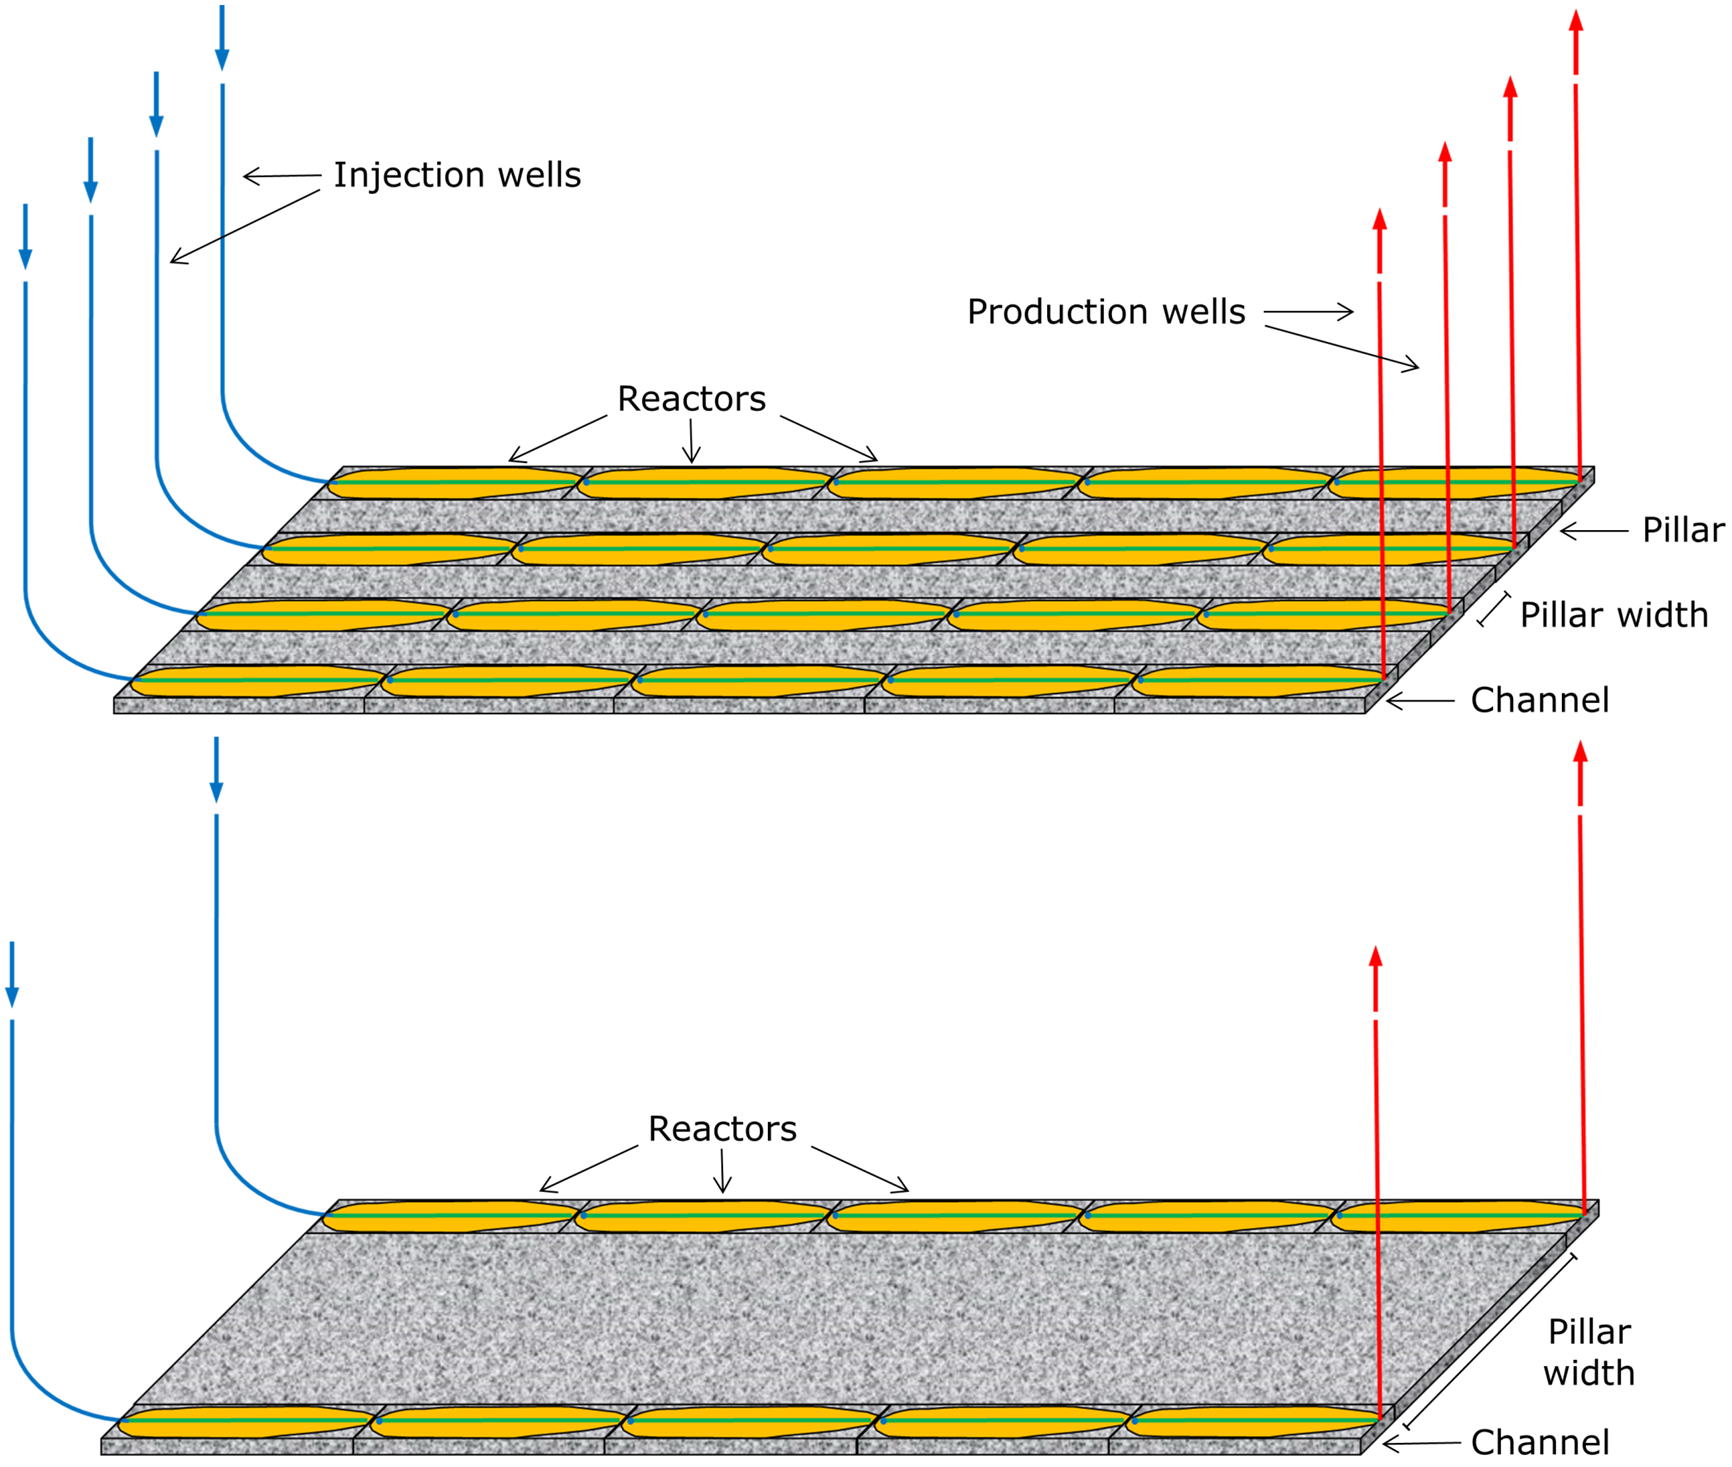
2.2. Scenario Analysis and UCG Panel Design

In order to analyze the impact of temperature and pillar width on the spatial stress distribution and potential changes in rock permeability in the UCG channel vicinity, two UCG designs with pillar widths of 60 and 140 m (schematically shown in Figure 2) were taken into account. Each reactor has a theoretical capacity of 2.97 PJ/a over a lifetime of 5.5 years (2000 days), considering a coal calorific value of 29 MJ/kg.
Identification of potential fluid migration pathways is of utmost interest in UCG operations to avoid hydraulic short circuits between two or more UCG channels as well as between UCG channels and potentially present shallow groundwater aquifers. Hydraulic short circuits between UCG channels render the gasification process uncontrollable in view of pressure and fluid mass balance monitoring and maintenance.
Fluid flow along geological faults is determined by zones of hydraulic weaknesses, generally represented by the fault damage zone, and thus fault integrity assessments has to focus on the identification of such weak fault segments. Using 3D seismic data as a basis for these assessments is state-of-the-art [44]. In tectonic field-work studies (e.g., [45,46,47]), it has been shown that large-scale faults generally represent highly complex zones composed of different fault segments, multiple fault strands, Riedel shears, splay faults, dilatational jogs and relay ramps [44]. These individual fault elements can be sub-seismic, and therefore not apparent in 3D seismic data. However, these faults can become extremely relevant at the intermediate scale in UCG operations, since potential fluid migration pathways in between single UCG channels may be established in case of their reactivation.

3. Simulation Results

In this paragraph, simulation results, such as permeability changes, vertical displacements, stress state at specific fault elements and fault integrity are presented for the six different simulation scenarios considered. First, different horizontal distances between the single UCG channels (60 and 140 m pillar widths) are presented for isothermal (pure mechanical simulation with constant temperature of 30 °C) and non-isothermal settings. In particular, we compare isothermal with non-isothermal simulation results for the scenarios with a 60 m pillar width to assess the thermal impact on induced stresses, resulting in rock expansion occurring in the surrounding lithological layers. Then, varying stress regimes (strike-slip, normal faulting and reverse faulting) and maximum principal stress (SHmax) orientations (normal and parallel to the fault) are investigated in view of fault integrity. For the model set-up with a pillar width of 140 m, the focus was on assessing the impacts of different regional stress regimes, including normal, reverse and strike-slip on fault integrity. Furthermore, we oriented the maximum horizontal stress parallel to the fault to generate maximum shear and reduce normal stresses at the fault plane, and hence trigger fault reactivation, resulting in potential hydraulic short circuits between single UCG channels.

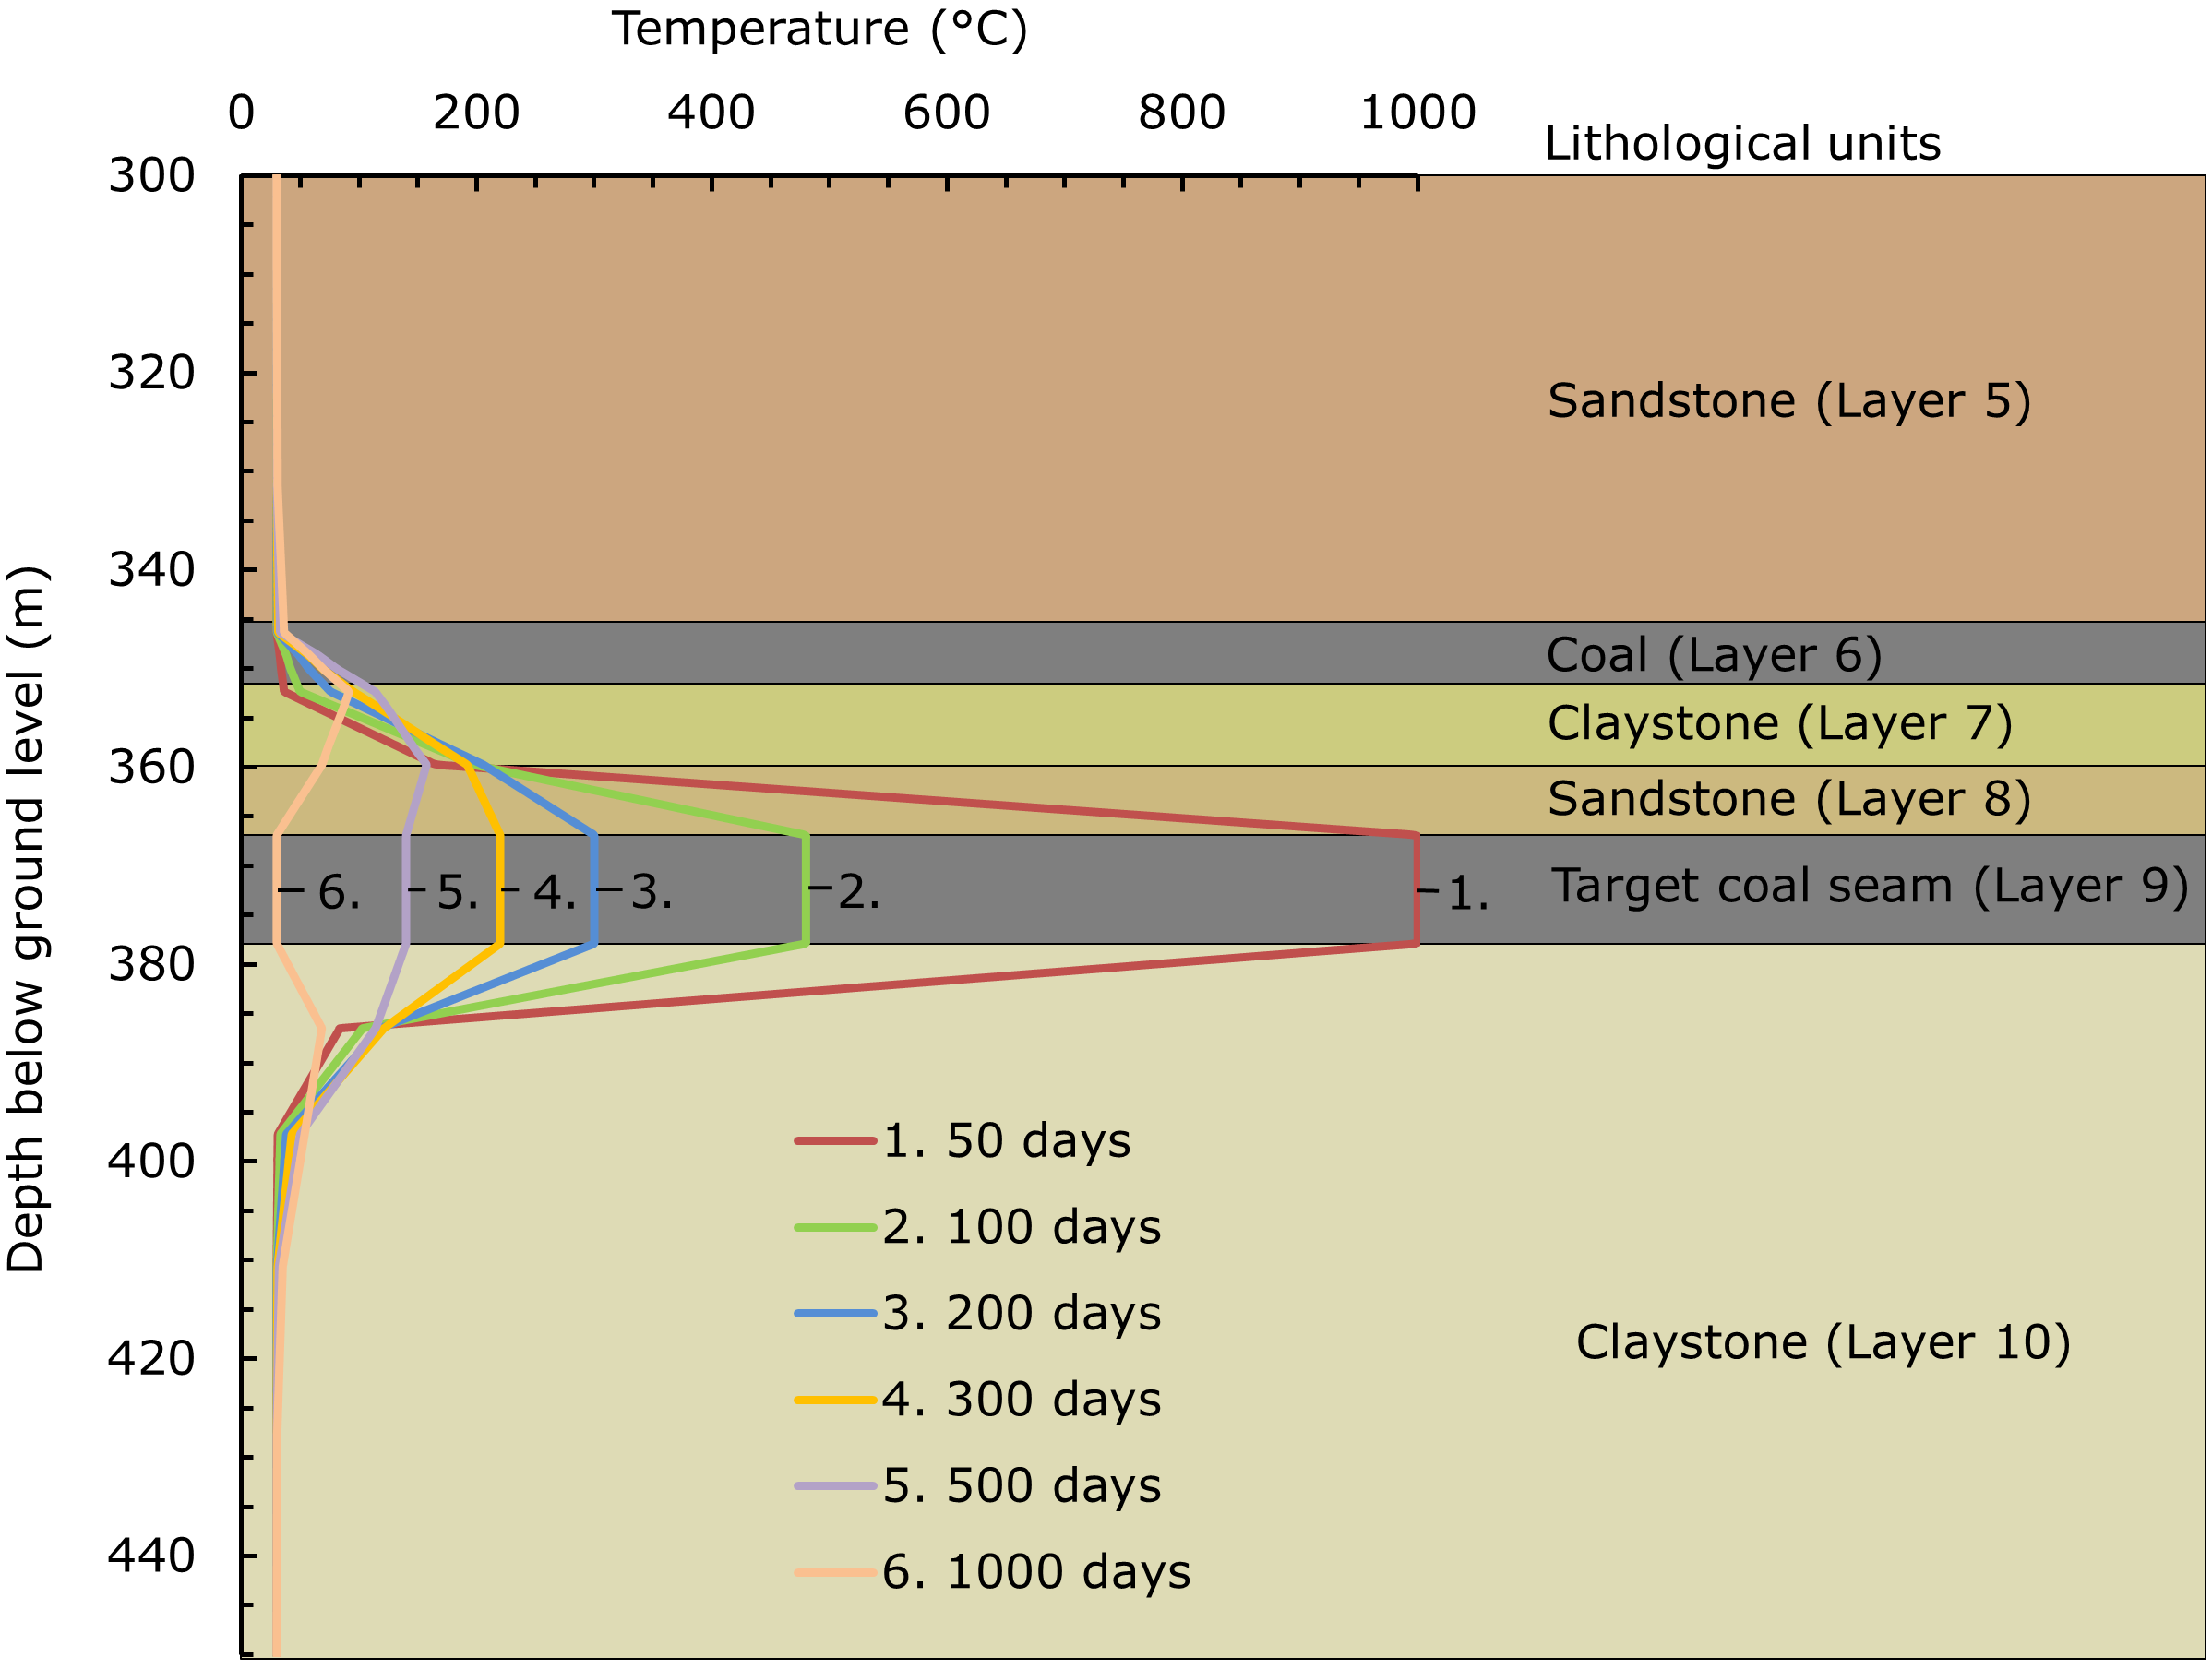
3.1. Vertical Temperature Distribution in the UCG Channel Vicinity

High temperatures during the UCG process generate a high thermal gradient of limited spatial extent, and hence induce thermal stresses in the surrounding rocks. Experimental studies by different authors [13,14,48,49] show that rock strength and behavior at enhanced temperatures differ notably from those at normal temperatures, considering purely mechanical conditions. Figure 3 exemplarily shows the temperature variation along a vertical profile in the UCG channel vicinity (depth of coal seam 367–378 m below ground level) at different times (50, 100, 200, 300, 500 and 1000 days). Since heat conductivity and heat capacity are determined by generally low values in the surrounding lithological layers of the target coal seam, a significant temperature increase (≥200 °C) is induced in the close reactor vicinity (distance up to 7.5 m) only. The varying temperature gradients above and below the target coal seam result from different thermal conductivities depending on the lithology (Table 2).
A comparison of the assessed isothermal and non-isothermal scenarios by means of spatial distribution of permeability, vertical displacements, state of stress at specific fault elements and fault integrity is provided in the following.

3.1.1. Permeability Distribution in the Rocks Surrounding the UCG Channels

The distribution of stresses in the UCG channel surroundings is required for the quantification of mechanical rock behavior and fault integrity as well as the spatial variation in the permeability distribution with time. The latter may affect the potential flow of gasification oxidants and products as well as of groundwater present in the reactor vicinity, potentially determining the gasification process efficiency and environmental impacts. Porosity and permeability changes in the vicinity of UCG reactors can be expressed as function of volumetric strain increment as shown in our previous studies [31,32]. For the assessment of permeability changes, normalized permeabilities with an initially uniform distribution in the model were applied, while average rock-specific porosities, depending on the present lithology were derived from literature and assigned to the respective model layers (Table 3). Based on the calculated volumetric strain increments, a new permeability distribution was derived following Chin et al. [50], using dedicated porosity sensitivity exponents for each geological unit (Table 3).
Figure 4 shows the resulting changes in permeability in the UCG channel vicinity at the end of the operational time for the isothermal and non-isothermal scenarios with a 60 m pillar width. For a proper illustration of these changes, the values are limited to one order of magnitude increase (red elements). For the isothermal scenario, only a limited region at the reactor walls of up to 4 m is affected. In contrast, the changes in positive volumetric strain increment, and hence permeability in the surrounding rocks are mainly temperature-induced as shown in Figure 4 (bottom) for the non-isothermal scenario. A permeability increase by more than one order in magnitude is distributed around the UCG channel and laterally extends up to about 4 m into the coal seam from the channel walls and up to 7 m in vertical direction.

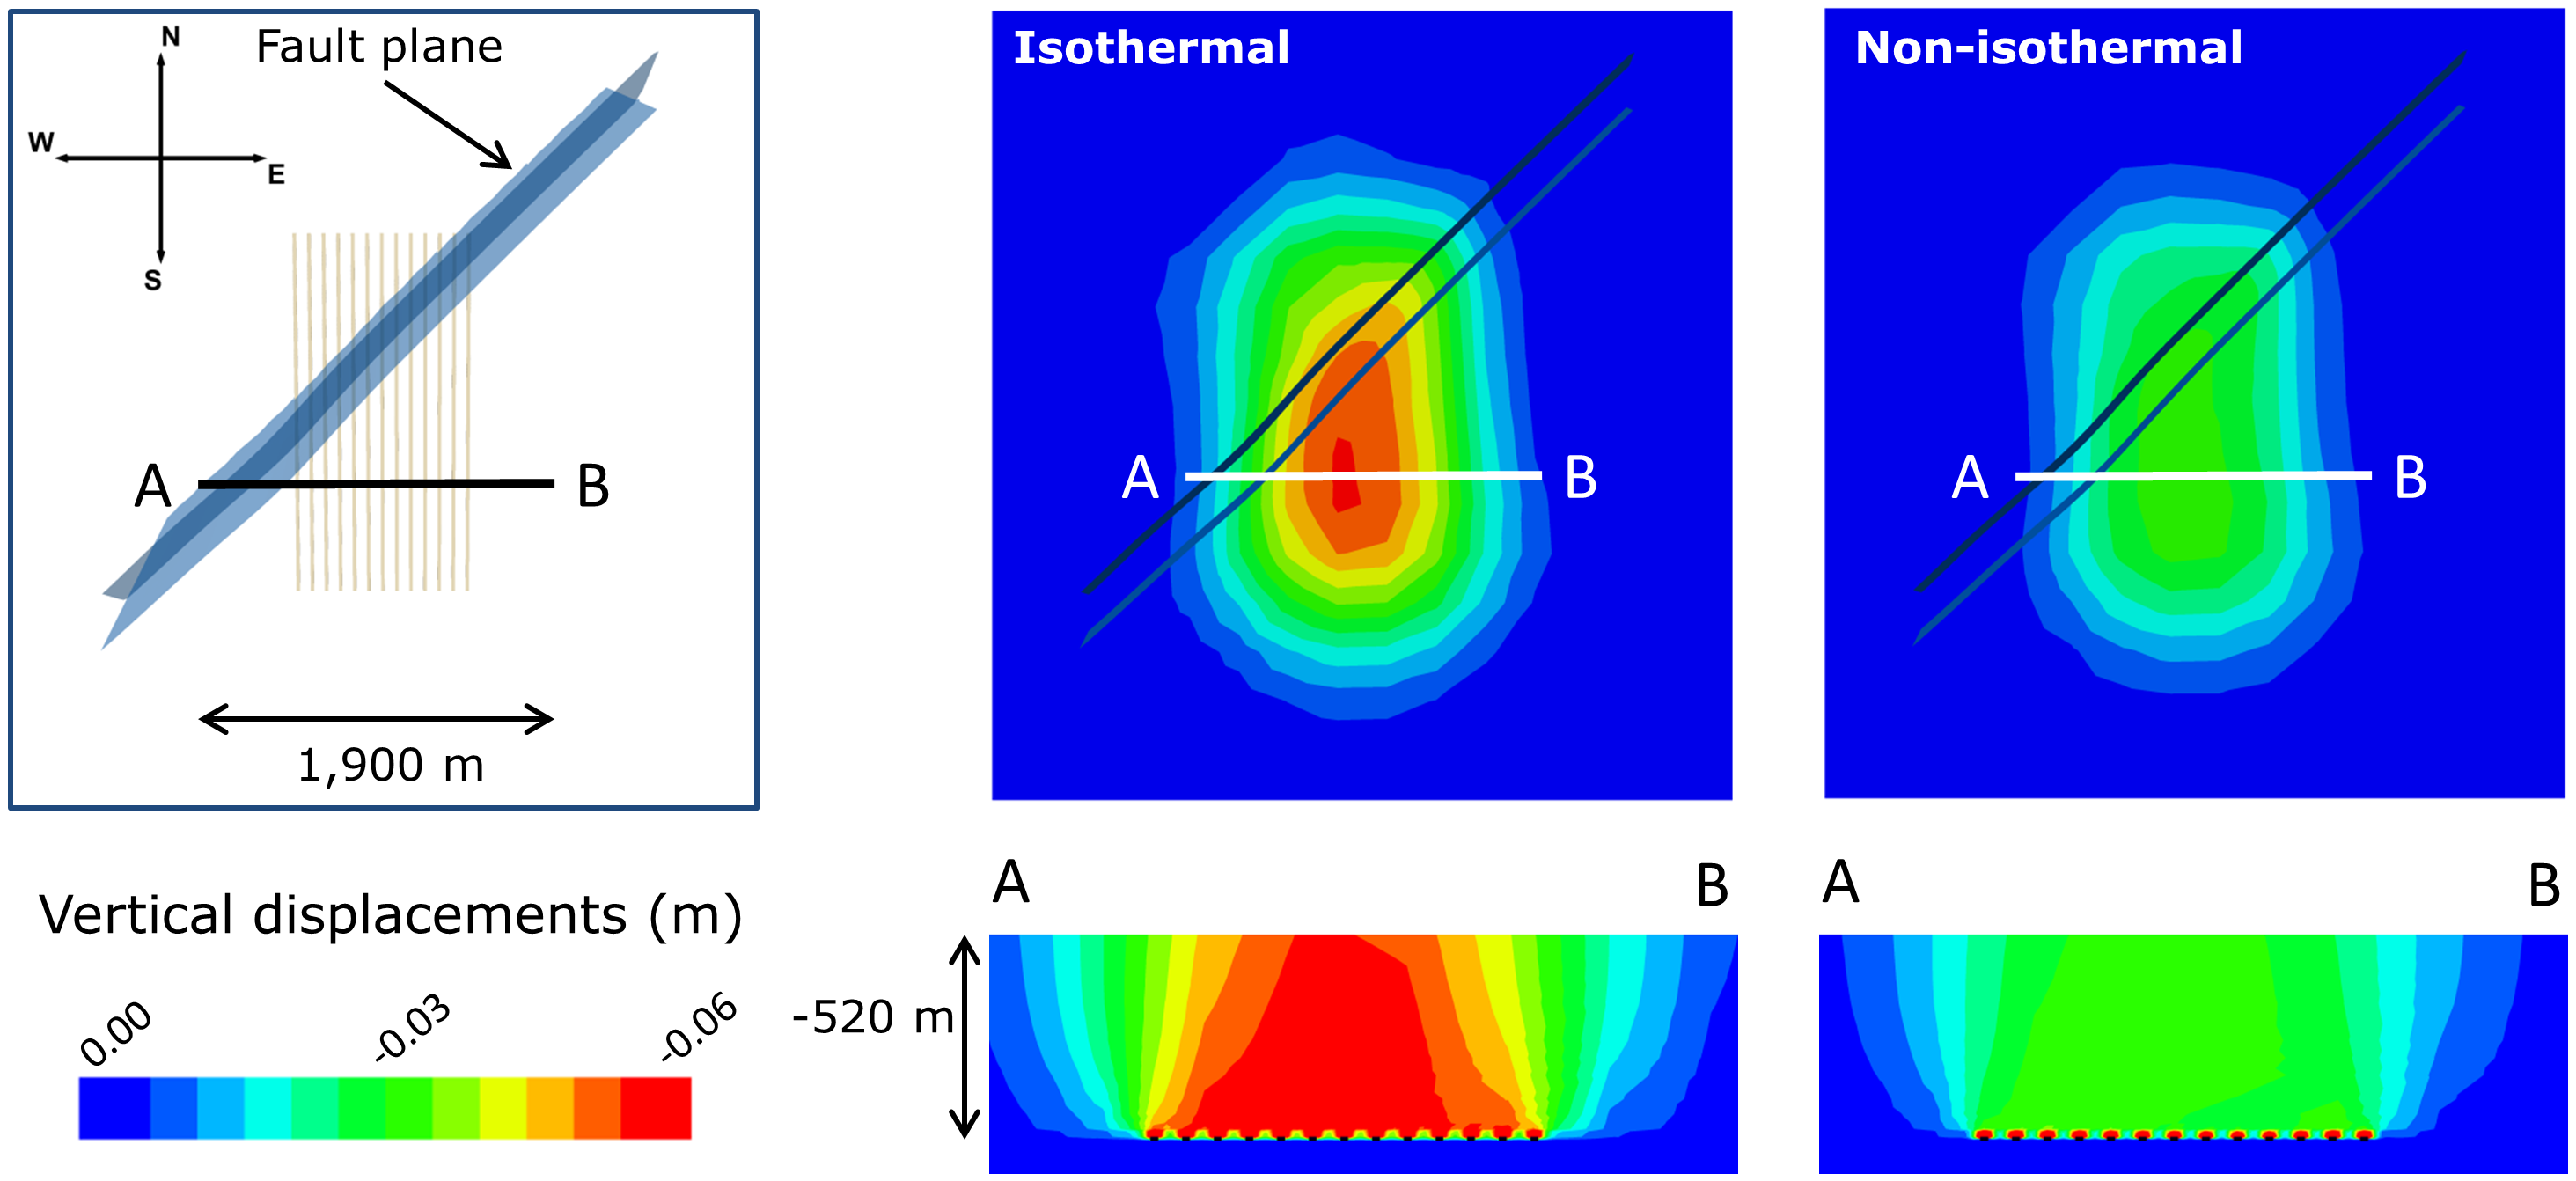
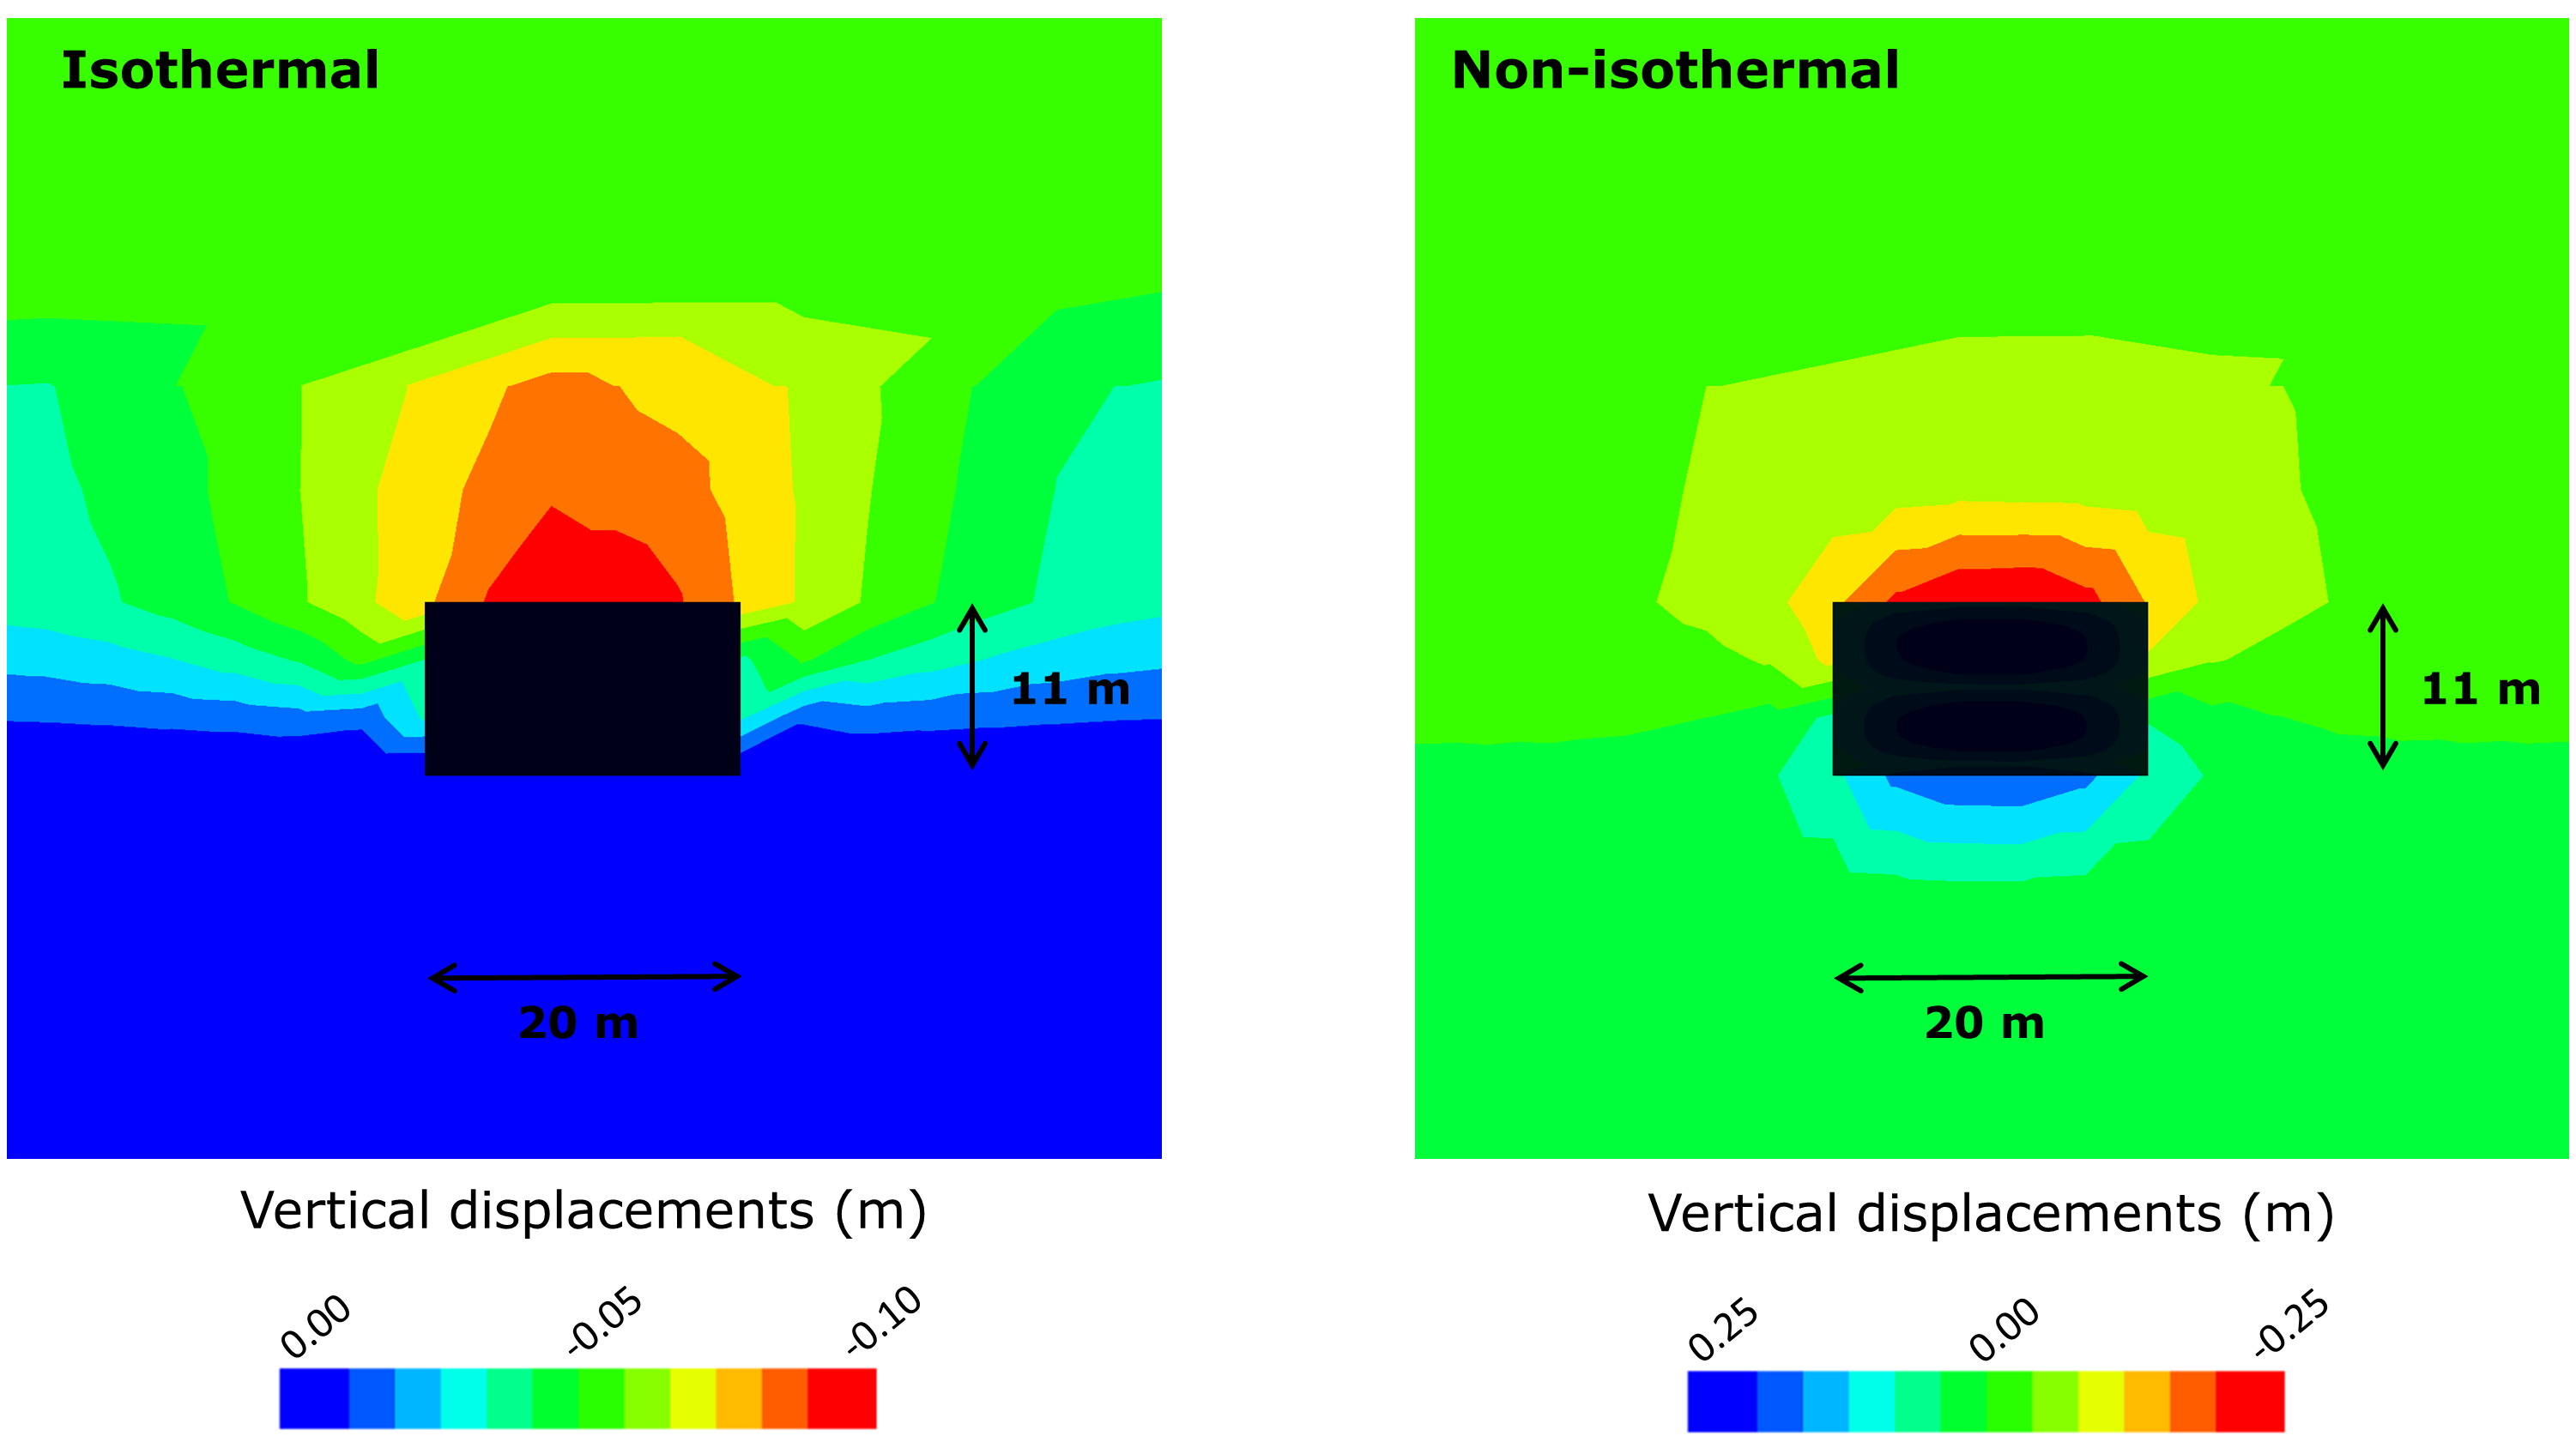
3.1.2. Vertical Displacements at 2000 Days (End of Operation)

Figure 5 shows the vertical displacements induced by mechanical effects related to the excavation of the UCG channels for the isothermal and non-isothermal scenarios with 60 m pillar width at the ground surface (top) and in cross-section views (profiles A–B in Figure 5, bottom). The temperature-induced stresses result in different spatial distributions of vertical displacements. An oval-shaped subsidence pattern above the excavated area is observed in both simulation scenarios, although exhibiting different magnitudes at the surface. The highest vertical ground surface displacement in the isothermal scenario is about −0.055 m, while that in the non-isothermal scenario amount to ca. −0.03 m. The profile views (Figure 5, bottom) show the development of vertical displacements below the ground surface, exposing the highest subsidence with depth increasing from the ground surface down to the excavated channels (−520 m). For the isothermal scenario, the pattern of displacements is less homogeneous compared to that in the non-isothermal scenario.
The different pattern of vertical displacements has its origin in local temperature effects, resulting in high vertical displacements (up to −0.27 m) in the hanging wall as well as positive vertical displacements at the foot wall (thermal expansion of up to 0.24 m), induced by thermal expansion effects (Figure 6, right). For the isothermal simulation scenario, only vertical displacements directly above the reactor of up to −0.10 m (pure mechanical excavation effects) occur in the absence of thermal expansion effects, e.g. at the reactor bottom (Figure 6, left).

3.1.3. Stress States at Fault Elements

Figure 7 illustrates the stress states at the elements intersected by the fault plane in Layers 6 to 10 for the strike-slip stress regime, assessed at end of the operational time in the isothermal (Figure 7, left) and non-isothermal (Figure 7, right) simulations with 60 m pillar widths. Here, fault failure is observed in both simulations, though exhibiting varying characteristics due to the induced thermal stresses in the non-isothermal scenario. Thereby, the maximum normal stress is increasing from 23 to 52 MPa, while the maximum shear stress increases from 7 to approximately 14 MPa, when comparing the isothermal with the non-isothermal simulation, respectively.

3.1.4. Fault Integrity

The fault acts as discontinuity in terms of its mechanical properties, with the lowest values of friction angle and zero cohesion (Table 1). This implies that fault elements represent the region of highest probability for the occurrence of shear and tensile failure. Results of fault integrity assessments for the isothermal (Figure 8, top) and non-isothermal (Figure 8, bottom) scenarios are illustrated in Figure 8. The stepwise channel excavation induces mechanical stresses in the coal pillars and their surrounding rocks. Therefore, shear failure is mostly localized in the close channel vicinity. Tensile failure is not observed at the fault plane in the isothermal scenario. The results do not show any coalescence of reactivated fault regions by means of shear failure in the scenario with 60 m pillar width. Figure 8 (top) shows the results obtained after 2000 days of UCG operation for the non-isothermal scenario. The temperature leads to an increase in shear failure, and further produces tensile failure in the close reactor vicinity as a result of the additionally induced thermal stresses. In this scenario, coalescence of reactivated fault areas by shear failure at the fault plane in adjacent lithological layers above and below the coal seam is observed (Figure 8, bottom). Formation of hydraulic short circuits, and hence the development of potential fluid migration pathways between the respective UCG channels is very likely. Consequently, the decrease in fault integrity is significantly underestimated, if the thermal stresses acting on the coal pillars are neglected, as given in the isothermal simulations.

3.2. Influence of Pillar Width on Fault Stability

Figure 9 (top) shows the coalescence of fault reactivation regions by means of shear and tensile failure, observed at the fault plane for the non-isothermal scenario with 60 m pillar width and that with 140 m pillar width. The patterns of shear and tensile failure are concentrated around the channels, whereby tensile failure induced by thermal stresses is located in close channel vicinity. Areas of failure between the channels do not exhibit any general pattern and create no potential hydraulic short circuits between any channels. In contrast to the 60 m pillar width scenario, a defined coalescence of reactivated fault areas is not observed.

3.3. Influence of Stress Regime on Fault Stability

According investigations on recent stress regimes in Poland, the heterogeneity in the present stress field is very high. Jarosinski [35,52,53] summarized an extensive set of stress-related data for Poland, taking into account borehole breakout analyses, hydraulic leak-off tests, earthquake focal mechanism solutions and regional intraplate motions derived from GPS measurements. These data allow for assumptions regarding geodynamics in specific Polish geological basins, with the presence of frequent breakouts showing that tectonically driven anisotropy of horizontal stresses is a common feature. The SHmax direction in Eastern Poland is roughly N–S oriented and differs significantly from the stress regime in Western Europe. Jarosinski [35] reported that this deviation is produced by the tectonic push from the south, which is successively compensated in the Upper Silesian Basin segment. Furthermore, stress directions are also ambiguous due to the interplay of several additional tectonic factors in the western part of Poland. Although most of hydraulic fracturing data and earthquake focal mechanism solutions indicate the presence of a strike-slip stress regime in Eastern Poland, the limited data available from Western Poland suggest the presence of a normal faulting stress regime [35,53].
In order to assess the impact of different stress regimes and SHmax orientations on fault integrity, we conducted a sensitivity analysis, considering two strike-slip stress regimes (SHmax perpendicular and parallel to the fault plane), one normal and one reverse faulting stress regime scenario. In all cases, coupled simulations were run with the parameterization of the non-isothermal 140 m pillar width scenario. Figure 10 shows the fault integrity at 2000 days (end of operation), where the largest reactivated fault area by shear and tensile failure develops for the strike-slip faulting regime, in which the SHmax orientation is parallel to the fault plane. Here, areas of shear and tensile failure expose a clear coalescence below the coal seam in the western part of the fault (Figure 10, distant view). For the normal faulting stress regime, a similar characteristic of the fault areas, reactivated by tensile failure compared to the previously described scenario can be noticed. However, a coalescence of reactivated fault areas by shear failure is not observed, since areas of shear failure are much less pronounced. The smallest reactivated fault area in this comparison is observed for the reverse faulting stress regime (Figure 10, bottom). In that scenario, only close reactor vicinities are affected by a lower occurrence of shear and tensile failure, compared to the strike-slip stress regime with the SHmax orientation parallel to the fault plane. For the reverse faulting stress regime scenario, coalescence of reactivated fault areas is not observed in the simulations. The impact of SHmax orientations on fault reactivation becomes obvious by comparing the two strike-slip regime scenario simulation results. Larger areas of shear and tensile failure mainly occur in layers above and below the target coal seam.
The perpendicular SHmax orientation towards the fault plane leads to a notable reduction in fault reactivation. Compared to the strike-slip stress regime, the normal and the reverse faulting stress regimes indicate the same characteristics of rock failure in the coal seam. For the layers above and below, this also applies for the reverse faulting stress regime. Here, a slightly smaller area of shear and an even smaller area of tensile failure with similar characteristics are observed. Nevertheless, in the normal faulting stress regime a larger fault reactivation area forms in the adjacent rock layers, compared to the strike slip regime, especially for the areas of tensile failure. Significant differences become apparent in the comparison of the reverse and normal faulting stress regimes as well. Here, especially the tensile failure characteristics of the reverse faulting regime differ from the normal faulting one, since their lowest extent is observed here. For the undertaken simulations and model set-up, the strike-slip faulting regime with SHmax parallel to the fault plane and the reverse faulting regime encompass the worst- and best-case scenarios, respectively.

4. Discussion

The impacts of enhanced and high temperatures on thermo-mechanical rock properties have been investigated during the last decades to improve process quantification and prediction in different engineering topics, including nuclear waste disposal, geothermal heat recovery and UCG [14,15,38,48,54,55]. Hereby, the linear thermal expansion coefficient was identified as one of the key parameters, governing volumetric and stress changes in rocks exposed to high temperatures (≥200 °C). Enhanced temperatures can induce high internal thermal stresses as a consequence of the thermal-expansion characteristics of different minerals, likely to result in thermal cracking and a decrease in rock strength [13,14,48,54,56].
Our simulation results show the impact of high temperatures, comparing isothermal and non-isothermal scenarios in a complex 3D model setting in the context of UCG operation, considering stress states at fault elements, permeability changes in UCG channel vicinity, vertical displacements and fault integrity in terms of hydraulic short circuit formation. Since heat conductivity and heat capacity are determined by generally low values for sedimentary rocks (Table 2), a significant temperature increase (≥200 °C) is only induced in the close UCG reactor vicinity. Figure 3 shows that the maximum extent of high temperature (≥200 °C) from the reactor boundary is about 7.5 m (reached after 200 days).
Further, the reliable prediction and management of mining-induced surface subsidence is one of the environmentally challenging issues in the context of coal mining (e.g., Adhikary et al. [30]; Sury et al. [9]). Luo et al. [57] developed a UCG subsidence prediction methodology and showed that overlying strata and ground surface subsidence behavior in UCG operation is relatively similar to that in conventional longwall coal mining. Depending on UCG panel design, channel dimensions and coal seam depth, the maximum surface subsidence calculated by Li et al. [58] (0.039 m) and Sirdesai et al. [10] (0.038 m) is in the range of our simulation results (0.055 m). Even if the strength of overlying strata above the gasified coal seams can increase under the influence of temperature as suggested by Li et al. [58] and observed in experiments by Liu et al. [48] at temperatures between 100 and 450 °C due to cementation reactions effecting weakening, increasing temperature tends to a general decrease in rock strength [13,54,59]. However, microstructural changes in mineralogy and the associated variation in strength are not considered in our simulations. In fact, vertical displacements at the ground surface calculated in our simulations are about 50% higher in the isothermal scenario and notably less homogeneous compared to those in the non-isothermal one at the end of the operational time. At that moment, the non-isothermal simulation has not achieved a thermo-mechanical equilibrium state due to sustained thermally-induced stresses, whereby the high temperatures effect a thermal expansion of the heated surrounding rocks in the affected strata. Considering the development of high vertical displacements in the UCG channel vicinity (Figure 6), it becomes obvious that the simulated displacements are related to thermally-induced stresses.
Thermo-mechanical stresses due to coal extraction and thermal loading, resulting from the UCG process also induce permeability changes. Permeability, in consideration of the difference between hydrostatic and UCG reactor pressure, controls fluid in- and outflow into and out of the reactor, respectively [31,60]. Figure 4 illustrates that permeability changes resulting from isothermal and non-isothermal simulations exhibit significant deviations in the close UCG channel vicinity. Here, fluid flow is likely to be affected by the local permeability increase, which is of relevance in the determination of the temporal and spatial steam jacket extent, surrounding a UCG reactor [60,61,62]. Nevertheless, isothermal and non-isothermal simulations of both 60 m pillar width scenarios show that permeability changes only occur in close UCG channel vicinity, whereby hydraulic short circuit formation between single channels is not observed in the absence of geologic faults. Therefore, the increase in local permeability due to mechanical and thermal stresses does not compromise UCG operation for a pillar width of 60 m. Simulation results rather suggest that pillar widths of 30 m (equals a coal-seam-thickness-to-pillar-width-ratio of about 1:3) would suffice to avoid hydraulic short circuit formation between single UCG channels in our study area.
However, similar to conventional longwall mining, where roof support by coal pillars is required, dimensions of pillars are relevant in UCG operations when using the CRIP technology. In this case, a protection pillar is left in the coal seam to mitigate the formation of stress peaks in the hanging wall during the gasification of each channel. This avoids uncontrolled fluid cross-flow and isolates single channels during their operation, minimizing ground surface subsidence and allowing the channels to be flushed and/or cooled at the end of UCG operation [63]. However, a wider protection pillar results in a lower coal yield, and thus counteracts economic aspects of UCG operation. Najafi et al. [63] presented an approach to estimate the required protection pillar width in CRIP-based UCG operation and compared purely mechanical with thermo-mechanical simulations. They showed that temperature induces thermal stresses and reduces the pillar strength, what is also demonstrated in the present study. However, Najafi et al. [63] focused on side abutment stresses occurring around the pillars, whereby a maximum lateral failure zone of about 3.25 m in a 3.5 m thick coal seam was observed. They did not consider fault planes as regions of mechanical weakness and potential fluid migration pathways in their model. Our fault integrity analyses show that shear and tensile failure significantly increase due to thermal stress propagation, what may result in a coalescence of shear failure. If distances between UCG channels are not sufficiently high, this behavior can trigger fault reactivation, and therefore form potential hydraulic short circuits between single UCG channels, but also generate mining-induced seismicity [64,65].
In addition to variable pillar width, different stress regimes were considered in the coupled thermo-mechanical simulations to assess their impact on fault integrity in terms of hydraulic short circuit formation. The results show a significant influence of the stress field and SHmax orientation on fault integrity. Even for a pillar width of 140 m, a coalesce of reactivated fault areas is feasible as shown for the scenario based on a strike-slip stress regime with the SHmax orientation parallel to the fault plane (Figure 10, second sub-figure). Simulations assessing fault integrity exhibit a high uncertainty if only limited data on the local stress regime is available. Additionally, non-detectable sub-seismic faults of various orientations can create hydraulic conduits between UCG reactors and shallower strata, and thus generate environmental hazards related to UCG operation, such as migration of UCG pollutants into shallow freshwater aquifers. In this context, thermo-mechanical processes are the key for quantification of potential leakage pathway formation and the potential for groundwater contamination [66]. A large fault, as implemented in the present model, would be highly undesirable and can impede UCG in practice. The risks include gas losses, contaminant migration and uncontrolled water influx [3]. However, recent numerical simulations on fault reactivation are mainly associated to hydraulic fracturing [67], CO2 storage [68,69] and geothermal heat recovery [70], whereas the process of fault reactivation was not yet adequately represented in the field of underground coal gasification [27].

5. Summary and Conclusions

In the present study, we investigated the impact of the temperature distribution in the vicinity of an UCG reactor on hydraulic conductivity changes, ground surface subsidence, and especially on the fault integrity at a hypothetical commercial-scale underground coal gasification site by coupled thermo-mechanical simulations. For that purpose, we carried out six simulation scenarios, considering two different pillar widths and four different stress regimes, using a 3D thermo-mechanical model with a double fault. Model parameterization was undertaken using comprehensive well log data and geological cross-sections from the Polish Wieczorek coal mine in the Upper Silesian Basin. A simulation time of 2000 days was investigated, considering the time-dependent heat conduction experienced during UCG reactor growth and progress of UCG channels, realized by a simultaneous stepwise excavation of the single UCG reactors of 50 m length.
High temperatures applied at the reactor boundary determine stress changes by thermally-induced strains as presented in the comparison of stress states at the fault elements (Figure 7). Neglecting temperature effects in complex regional-scale UCG simulations by running purely mechanical simulations, which in turn would significantly increase the computational efficiency of the simulations, is not feasible, since shear and tensile failure would be notably underestimated. A significant temperature increase (≥200 °C) is only induced in the close reactor vicinity (7.5 m).
Although the difference in surface subsidence is negligibly small (−0.03 to −0.055 m) between the isothermal and non-isothermal simulations, and possibly even underestimated at specific time steps, high differences are apparent above and below the UCG channels. High vertical displacements (up to −0.27 m) in the hanging wall as well as positive vertical displacements at the foot wall (up to 0.24 m) are observed in the non-isothermal scenario. The absence of thermal effects (no thermal expansion) leads to significantly lower vertical displacements of −0.10 m in the isothermal simulation scenario. The permeability change derived from the calculated volumetric strain increment is limited to the close UCG reactor vicinity. The range with the highest spatial permeability increase, exceeding a factor of more than ten is less than the coal seam thickness and almost identical to the high-temperature region (≥200 °C). Consequently, one may assume that the increase in permeability in the close UCG channel vicinity does not form hydraulic short circuits, and thus not compromise a commercial-scale UCG operation with low pillar widths in the absence of geologic faults.
However, our simulation results also show that fault reactivation can significantly contribute to formation of hydraulic short circuits between single UCG channels by means of fault shear and tensile failure. In general, isothermal simulations underestimate the development of potential hydraulic short circuits. Further, formation of hydraulic short circuits can induce fractures, linking UCG channels to previously isolated shallow freshwater aquifers. Hence, a significantly larger pillar width between single UCG channels may be required to avoid running an uncontrolled UCG operation in our study area, whereby a coal-seam-thickness-to-pillar-width-ratio of about 1:14 ensures a safe operation. However, selected pillar widths determine the coal yield, and thus UCG economics, even though ground surface subsidence is reduced by increased pillar widths. Consequently, sub-seismic faults, not detected by seismic and drill-core interpretations, can form potential fluid migration pathways. The extent of fault reactivation strongly depends on the local stress regime and orientation of the maximum horizontal stress towards the fault plane (Figure 10). Our undertaken scenario-based sensitivity analysis on fault integrity, considering four different stress regimes reveals their high impact on the fault reactivation characteristics. The strike-slip stress regime with the SHmax orientation parallel to the fault plane represents the worst-case scenario of possible shear and tensile failure in the present study.
One limitation of the presented study is the fact that fluid flow is not considered in the model, so that the effect of the steam jacket is not taken into account, resulting in a probable overestimation of the spatial temperature increase in the vicinity of the UCG channels. Another limitation is determined by the chosen reactor shape (quadrilateral instead of radial), reducing the UCG reactor stability due to a limitation of the arching effect. These assumptions were made to maintain a good balance between the required computational time and model accuracy.
In conclusion, sub-seismic faults of unknown orientations can exhibit a major threat for a safe, environmental-friendly and economical UCG operation and require careful consideration by 3D coupled numerical modeling, involving the assessment of uncertainties regarding the fault parameters and regional stress regime. Considering these insights, 3D models become increasingly important to obtain reliable assessments of UCG impacts, despite the still high computational effort. Site-specific UCG assessments should therefore comprise sufficient geological data to constrain the pattern of structural overprints that may influence the integrity of present and undetected fault systems, local coal seams and their overlaying strata. Considering these data, coupled 3D thermo-mechanical UCG modeling provides a solid foundation for optimal UCG channel design and assessment of its operational and environmental impacts, supporting to overcome the enormous challenges in UCG commercialization.

Acknowledgments

The authors gratefully acknowledge the funding received from the EU-FP7 TOPS project (grant 608517) funded by the European Union (EU) and the discussions with the project partners. The authors would also like to thank Markus Nennewitz (University of Potsdam, Germany) for support in data review and pre-processing. Furthermore, we are grateful for the constructive comments provided by the anonymous reviewers, improving the manuscript’s quality.

Author Contributions

Christopher Otto and Thomas Kempka designed research; Krzysztof Kapusta and Krzysztof Stańczyk provided unpublished geological and coal-related data for the study area; Christopher Otto performed research; Christopher Otto and Thomas Kempka analyzed data; and Christopher Otto and Thomas Kempka wrote the paper.

Conflicts of Interest

The authors declare no conflict of interest.

References

  1. Blinderman, M.S.; Saulov, D.N.; Klimenko, A.Y. Forward and reverse combustion linking in underground coal gasification. Energy 2008, 33, 446–454. [Google Scholar] [CrossRef]
  2. Nakaten, N.; Kötting, P.; Azzam, R.; Kempka, T. Underground coal gasification and CO2 storage support Bulgaria’s low carbon energy supply. Energy Procedia 2013, 40, 212–221. [Google Scholar] [CrossRef]
  3. Burton, E.; Friedmann, J.; Upadhye, R. Best Practices in Underground Coal Gasification; Contract No. W-7405-Eng-48; Lawrence Livermore National Laboratory: Livermore, CA, USA, 2006.
  4. Friedmann, S.J.; Upadhye, R.; Kong, F.M. Prospects for underground coal gasification in carbon-constrained world. Energy Procedia 2009, 1, 4551–4557. [Google Scholar] [CrossRef]
  5. Kempka, T.; Plötz, M.L.; Schlüter, R.; Hamann, J.; Deowan, S.A.; Azzam, R. Carbon dioxide utilisation for carbamide production by application of the coupled UCG-urea process. Energy Procedia 2011, 4, 2200–2205. [Google Scholar] [CrossRef]
  6. Bhutto, A.W.; Bazmi, A.A.; Zahedi, G. Underground coal gasification: From fundamentals to applications. Prog. Energy Combust. Sci. 2013, 39, 189–214. [Google Scholar] [CrossRef]
  7. Yang, D.; Koukouzas, N.; Green, M.; Sheng, Y. Recent development on underground coal gasification and subsequent CO2 storage. J. Energy Inst. 2015. [Google Scholar] [CrossRef]
  8. Klebingat, S.; Kempka, T.; Schulten, M.; Azzam, R.; Fernandez-Steeger, T.M. Innovative thermodynamic underground coal gasification model for coupled synthesis gas quality and tar production analyses. Fuel 2016, 183, 680–686. [Google Scholar] [CrossRef]
  9. Sury, M.; White, M.; Kirton, J.; Carr, P.; Woodbridge, R. Review of Environmental Issues of Underground Coal Gasification; University of Liège Belgium: Liège, Belgium, 2004. [Google Scholar]
  10. Sirdesai, N.; Singh, R.; Sing, T.N.; Ranjith, P.G. Numerical and experimental study of strata behavior and land subsidence in an underground coal gasification project. Int. Assoc. Hydrol. Sci. 2015, 372. [Google Scholar] [CrossRef]
  11. Couch, G. Underground Coal Gasification; CCC/151; IEA Clean Coal Centre: London, UK, 2009. [Google Scholar]
  12. Najafi, M.; Jalali, S.M.E.; KhaloKakaie, R.; Forouhandeh, F. Prediction of cavity growth rate during underground coal gasification using multiple regression analysis. Int. J. Coal Sci. Technol. 2015, 2, 318–324. [Google Scholar] [CrossRef]
  13. Tian, H.; Kempka, T.; Yu, S.; Ziegler, M. Mechanical properties of sandstones exposed to high temperature. Rock Mech. Rock Eng. 2016, 49, 321–327. [Google Scholar] [CrossRef]
  14. Tian, H.; Ziegler, M.; Kempka, T. Physical and mechanical behavior of claystone exposed to temperatures up to 1000 °C. Int. J. Rock Mech. Min. Sci. 2014, 70, 144–153. [Google Scholar] [CrossRef]
  15. Tian, H.; Kempka, T.; Xu, N.X.; Ziegler, M. Physical properties of sandstones after high temperature treatment. Rock Mech. Rock Eng. 2012, 45, 1113–1117. [Google Scholar] [CrossRef]
  16. Tian, H.; Kempka, T.; Xu, N.; Ziegler, M. A modified Mohr-Coulomb failure criterion for intact granites exposed to high temperatures. In Clean Energy Systems in the Subsurface: Production, Storage and Conversion; Hou, M.Z., Xie, H., Were, P., Eds.; Springer Series in Geomechanics and Geoengineering; Springer: Berlin, Germany, 2013; pp. 379–393. [Google Scholar]
  17. Tian, H.; Ziegler, M.; Kempka, T. Mechanical behavior of claystone exposed to high temperatures and its possible impacts on the stability of a deep nuclear waste repository. In Rock Mechanics: Achievements and Ambitions; Cai, M., Ed.; Taylor & Francis Group: London, UK, 2012; pp. 193–199. [Google Scholar]
  18. Tian, H. Development of a Thermo-Mechanical Model for Rocks Exposed to High Temperatures during Underground Coal Gasification; No. RWTH-CONV-143478; RWTH Aachen University: Aachen, Germany, 2013. [Google Scholar]
  19. Wolf, K.H.; Bruining, H. Modelling the interaction between underground coal fires and their roof rocks. Fuel 2007, 86, 2761–2777. [Google Scholar] [CrossRef]
  20. Hettema, M.H.H.; Wolf, K.H.A.A.; de Pater, C.J. The influence of steam pressure on thermal spalling of sedimentary rock: Theory and experiments. Int. J. Rock Mech. Min. Sci. 1998, 35, 3–15. [Google Scholar] [CrossRef]
  21. Kapusta, K.; Stańczyk, K. Pollution of water during underground coal gasification of hard coal and lignite. Fuel 2011, 90, 1927–1934. [Google Scholar] [CrossRef]
  22. Stańczyk, K.; Smoliński, A.; Kapusta, K.; Wiatowski, M.; Świdrowski, J.; Kotyrba, A.; Rogut, J. Dynamic experimental simulation of hydrogen oriented underground gasification of lignite. Fuel 2010, 89, 3307–3314. [Google Scholar] [CrossRef]
  23. Stańczyk, K.; Howaniec, N.; Smoliński, A.; Świądrowski, J.; Kapusta, K.; Wiatowski, M.; Grabowski, J.; Rogut, J. Gasification of lignite and hard coal with air and oxygen enriched air in a pilot scale ex situ reactor for underground gasification. Fuel 2011, 90, 1953–1962. [Google Scholar] [CrossRef]
  24. Durucan, S.; Korre, A.; Shi, J.Q.; Idiens, M.; Stańczyk, K.; Kapusta, K.; Rogut-Dabrowska, A.; Kempka, T.; Wolf, K.H.; Younger, P.; et al. TOPS: Technology options for coupled underground coal gasification and CO2 capture and storage. Energy Procedia 2014, 63, 5827–5835. [Google Scholar] [CrossRef]
  25. Klimenko, A.Y. Early ideas in underground coal gasification and their evolution. Energies 2009, 2, 456–476. [Google Scholar] [CrossRef]
  26. Sajjad, M.; Rasul, M.G. Review on the Existing and Developing Underground Coal Gasification Techniques in Abandoned Coal Seam Gas Blocks: Australia and Global Context. In Proceedings of the 1st International e-Conference on Energies, Online, Switzerland, 14–31 March 2014.
  27. Khan, M.; Mmbaga, J.; Shirazi, A.; Trivedi, J.; Liu, Q.; Gupta, R. Modelling Underground Coal Gasification—A Review. Energies 2015, 8, 12603–12668. [Google Scholar] [CrossRef]
  28. Nitao, J.J.; Camp, D.W.; Buscheck, T.A.; White, J.A.; Burton, G.C.; Wagoner, J.L.; Chen, M. Progress on a new integrated 3-D UCG simulator and its initial application. In Proceedings of the International Pittsburgh Coal Conference (PCC), Pittsburgh, PA, USA, 12–15 September 2011.
  29. Nourozieh, H.; Kariznovi, M.; Chen, Z.; Abedi, J. Simulation Study of Underground Coal Gasification in Alberta Reservoirs: Geological Structure and Process Modeling. Energy Fuels 2010, 24, 3540–3550. [Google Scholar] [CrossRef]
  30. Adhikary, D.; Khanal, M.; Jayasundara, C.; Balusu, R. Deficiencies in 2D Simulation: A Comparative Study of 2D Versus 3D Simulation of Multi-seam Longwall Mining. Rock Mech. Rock Eng. 2016, 49, 2181–2185. [Google Scholar] [CrossRef]
  31. Otto, C.; Kempka, T. Thermo-Mechanical Simulations of Rock Behavior in Underground Coal Gasification Show Negligible Impact of Temperature-Dependent Parameters on Permeability Changes. Energies 2015, 8, 5800–5827. [Google Scholar] [CrossRef]
  32. Otto, C.; Kempka, T. Thermo-mechanical Simulations Confirm: Temperature-dependent Mudrock Properties are Nice to have in Far-field Environmental Assessments of Underground Coal Gasification. Energy Procedia 2015, 76, 582–591. [Google Scholar] [CrossRef]
  33. Itasca Consulting Group Inc. Advanced Three-Dimensional Continuum Modelling for Geotechnical Analysis of Rock, Soil and Structural Support. In FLAC3D Software Version 5.01. User’s Manual; Itasca Consulting Group, Inc.: Minneapolis, MN, USA, 2014. [Google Scholar]
  34. Chećko, J. Analysis of geological, hydrogeological and mining conditions in the area of the developed georeactor located in KWK ‘Wieczorek’ mine. Prz. Górn. 2013, 69, 37–45. [Google Scholar]
  35. Jarosinski, M. Recent tectonic stress field investigations in Poland: A state of the art. Geol. Q. 2006, 50, 303–321. [Google Scholar]
  36. Sarhosis, V.; Yang, D.; Sheng, Y.; Kempka, T. Coupled Hydro-thermal Analysis of Underground Coal Gasification Reactor Cool Down for Subsequent CO2 Storage. Energy Procedia 2013, 40, 428–436. [Google Scholar] [CrossRef]
  37. Byerlee, J. Friction of Rocks. Pure Appl. Geophys. 1978, 116, 615–626. [Google Scholar] [CrossRef]
  38. Somerton, W.H. Thermal Properties and Teemperature-Related Behavior of Rock/Fluid Systems; Chilingarian, G.V., Ed.; Elsevier Science Publishers H.V.: Amsterdam, The Netherlands, 1992; Volume 53. [Google Scholar]
  39. Speight, J.G. Handbook on Coal Analysis; Winefordner, J.D., Ed.; Wiley: Hoboken, NJ, USA, 2005. [Google Scholar]
  40. Tan, Q.; Luo, X.; Li, S. Numerical modeling of thermal stress in a layered rock mass. In Proceedings of the the 42nd U.S. Rock Mechanics Symposium (USRMS), San Francisco, CA, USA, 29 June–2 July 2008.
  41. Małkowski, P.; Niedbalski, Z.; Hydzik-Wiśniewska, J. The Change of Structural and Thermal Properties of Rocks Exposed to High Temperatures in the Vicinity of Designed Geo-Reactor. Arch. Min. Sci. 2013, 58, 465–480. [Google Scholar]
  42. Cała, M.; Stopkowicz, A.; Kowalska, M.; Blajer, M. Modelling of thermal phenomena in the rock mass in the vicinity of a georeactor. Prz. Górn. 2014, 11, 76–85. [Google Scholar]
  43. Blinderman, M.S.; Ergo Exergy Technologies Inc., Montreal, QC, Canada. Personal communication, 2016.
  44. Ligtenberg, J.H. Detection of Fluid migration pathways in seismic data: Implications for fault seal analysis. Basin Res. 2005, 17, 141–153. [Google Scholar] [CrossRef]
  45. Price, N.J.; Cosgrove, J.W. Analysis of Geological Structures; Cambridge University Press: Cambridge, UK, 1990. [Google Scholar]
  46. Van der Zee, W. Dynamics of Fault Gouge Development in Layered Sand Clay Sequences. Ph.D. Thesis, RWTH Aachen University, Aachen, Germany, 2002. [Google Scholar]
  47. Koledoye, B.A.; Aydin, A.; May, E. A new process-based methodology for the analysis of shale smear along normal faults in the Niger Delta. Am. Assoc. Pet. Geol. Bull. 2003, 87, 445–463. [Google Scholar] [CrossRef]
  48. Liu, X.; Zhang, C.; Yuan, S.; Fityus, S.; Sloan, S.W.; Buzzi, O. Effect of High Temperature on Mineralogy, Microstructure, Shear Stiffness and Tensile Strength of Two Australian Mudstones. Rock Mech. Rock Eng. 2016, 49, 3513–3524. [Google Scholar] [CrossRef]
  49. Hettema, M.H.H.; Wolf, K.A.A.; de Pater, C.J. Thermo-mechanical properties of roof rock of coal for underground gasification. In Topics in Applied Mechanics; Springer: Berlin, Germany, 1993. [Google Scholar]
  50. Chin, L.Y.; Rajagopal, R.; Thomas, L.K. Fully Coupled Geomechanics and Fluid-Flow Analysis of Wells With Stress-Dependent Permeability. SPE J. 2000, 5, 2–6. [Google Scholar] [CrossRef]
  51. Min, O.K. Finite Element Modeling of Thermo-Mechanical Responses Associated with Underground Coal Conversion; Ohio State University: Columbus, OH, USA, 1983. [Google Scholar]
  52. Jarosinski, M. Ongoing tectonic reactivation of the Outer Carpathians and its impact on the foreland: Results of borehole breakout measurements in Poland. Tectonophysics 2005, 410, 189–216. [Google Scholar] [CrossRef]
  53. Jarosinski, M. Recent tectonic stress regime in Poland based on analyses of hydraulic fracturing of borehole walls. Prz. Geol. 2005, 53, 863–872. [Google Scholar]
  54. Liu, X.; Yuan, S.; Sieffert, Y.; Fityus, S.; Buzzi, O. Changes in Mineralogy, Microstructure, Compressive Strength and Intrinsic Permeability of Two Sedimentary Rocks Subjected to High-Temperature Heating. Rock Mech. Rock Eng. 2016, 49, 2985–2998. [Google Scholar] [CrossRef]
  55. Min, K.B.; Rutqvist, J.; Tsang, C.F.; Jing, L. Thermally induced mechanical and permeability changes around a nuclear waste repository—A far-field study based on equivalent properties determined by a discrete approach. Int. J. Rock Mech. Min. Sci. 2005, 42, 765–780. [Google Scholar] [CrossRef]
  56. David, C.; Menendez, B.; Darot, M. Influence of stress-induced and thermal cracking on physical properties and microstructure of La Peyratte granite. Int. J. Rock Mech. Min. Sci. 1999, 36, 433–448. [Google Scholar] [CrossRef]
  57. Luo, Y.; Coertzen, M.; Dumble, S. Comparison of UCG Cavity Growth With CFD Model Predictions. In Proceedings of the Seventh International Conference on CFD in the Minerals and Process Industries (CSIRO), Melbourne, Australia, 9–11 December 2009; pp. 1–5.
  58. Li, H.; Guo, G.; Zha, J.; Yuan, Y.; Zhao, B. Research on the surface movement rules and prediction method of underground coal gasification. Bull. Eng. Geol. Environ. 2016, 75, 1133–1142. [Google Scholar] [CrossRef]
  59. Evans, B.W.; Kohlstedt, D.L. Rheology of rocks. In Rock Physics & Phase Relations: A Handbook of Physical Constants; American Geophysical Union: Washington, DC, USA, 1995; Volume 3, pp. 148–165. [Google Scholar]
  60. Blinderman, M.S.; Anderson, B. Underground Coal Gasification for Power Generation: High Efficiency and CO2-Emissions. In Proceedings of the ASME 2004 Power Conference, Baltimore, MD, USA, 31 March–1 April 2004; pp. 473–479.
  61. Blinderman, M.S.; Jones, R.M. The Chinchilla IGCC Project to Date: Underground Coal Gasification and Environment. In Proceedings of the Gasification Technologies Conference, San Francisco, CA, USA, 27–30 October 2002.
  62. Plumb, O.A.; Klimenko, A. The stability of evaporating fronts in porous media. J. Porous Media 2010, 13, 145–155. [Google Scholar] [CrossRef]
  63. Najafi, M.; Jalali, S.M.E.; KhaloKakaie, R. Thermal–mechanical–numerical analysis of stress distribution in the vicinity of underground coal gasification (UCG) panels. Int. J. Coal Geol. 2014, 134–135, 1–16. [Google Scholar] [CrossRef]
  64. Sen, A.T.; Cesca, S.; Bischoff, M.; Meier, T.; Dahm, T. Automated full moment tensor inversion of coal mining-induced seismicity. Geophys. J. Int. 2013, 195, 1267–1281. [Google Scholar] [CrossRef]
  65. Hasegawa, H.S.; Wetmiller, R.J.; Gendzwill, D.J. Induced seismicity in mines in Canada—An overview. Pure Appl. Geophys. 1989, 129, 423–453. [Google Scholar] [CrossRef]
  66. Vorobiev, O.; Morris, J.; Antoun, T.; Friedmann, S.J. Geomechanical Simulations Related to UCG Activities. In Proceedings of the International Pittsburgh Coal Conference, Pittsburgh, PA, USA, 29 September–2 October 2008.
  67. Rutqvist, J.; Rinaldi, A.P.; Cappa, F.; Moridis, G.J. Modeling of fault reactivation and induced seismicity during hydraulic fracturing of shale-gas reservoirs. J. Pet. Sci. Eng. 2013, 107, 31–44. [Google Scholar] [CrossRef]
  68. Tillner, E.; Langer, M.; Kempka, T.; Kühn, M. Fault damage zone volume and initial salinity distribution determine intensity of shallow aquifer salinisation in subsurface storage. Hydrol. Earth Syst. Sci. 2016, 20, 1049–1067. [Google Scholar] [CrossRef]
  69. Cappa, F.; Rutqvist, J. Modeling of coupled deformation and permeability evolution during fault reactivation induced by deep underground injection of CO2. Int. J. Greenh. Gas Control 2011, 5, 336–346. [Google Scholar] [CrossRef]
  70. Jacquey, A.B.; Cacace, M.; Blöcher, G.; Scheck-Wenderoth, M. Numerical Investigation of Thermoelastic Effects on Fault Slip Tendency during Injection and Production of Geothermal Fluids. Energy Procedia 2015, 76, 311–320. [Google Scholar] [CrossRef]
Figure 1. Geometry of the coupled thermo-mechanical 3D UCG model with the implemented double fault (blue) from three different perspectives: orientation of the maximum horizontal stress (SHmax) and lateral model dimensions in: plane-view (top left); 3D cross-section view (bottom left); and close-up 3D cross-section view (right) with the target coal seam and UCG channels considering a coal pillar width of 60 m. The model comprises ten lithological units with a target coal seam thickness of 11 m at depths from 370 to 580 m.
Minerals 06 00101 g001
Figure 2. Conceptual design of the UCG CRIP (Controlled Retracting Ignition Point) methodology for different reactor-to-pillar-width ratios applied in our assessment: ratio of 1:3 (60 m pillar width) (top); and ratio of 1:7 (140 m pillar width) (bottom), modified after Blinderman [43].
Minerals 06 00101 g002
Figure 3. Temperature variation along a vertical profile through the coal seam (Layer 9) at different simulation times. The high temperature (≥200 °C) region is limited to the close channel vicinity and reaches a maximum extent of 7.5 m after 200 days of simulation above and 50 days below the target coal seam (Layer 9).
Minerals 06 00101 g003
Figure 4. Normalized permeability changes (-) for the: isothermal (top); and non-isothermal (bottom) scenarios with a pillar width of 60 m show significant differences in their spatial distribution due to the lack of temperature-induced stress effects in the non-isothermal scenario.
Minerals 06 00101 g004
Figure 5. Plane views of the vertical displacement distribution at the ground surface (top) and cross-sections (bottom) for the isothermal (middle) and non-isothermal (right) scenarios after 2000 days of simulation (end of operation). The location of the UCG channels and the fault plane with regard to the plotted cross-section is illustrated in the upper left sub-figure.
Minerals 06 00101 g005
Figure 6. Vertical displacements in close vicinity of one UCG channel located at the A–B profile shown in Figure 5 for the: isothermal (left) and non-isothermal (right) scenarios.
Minerals 06 00101 g006
Figure 7. Normal versus shear stress plots for the fault elements in: isothermal simulation (left); and non-isothermal simulation (right) at end of the operational time. Coulomb failure line plotted as dashed red line.
Minerals 06 00101 g007
Figure 8. 3D view (left) and close view (right) of shear and tensile failure occurring at the fault plane in the isothermal (top) and non-isothermal (bottom) scenarios with 60 m pillar widths at a simulation time of 2000 days (end of UCG operation). UCG channels are represented by transparent grey shapes.
Minerals 06 00101 g008
Figure 9. 3D distant (left) and close (right) views of shear and tensile failure at the fault plane for the non-isothermal scenarios with 60 m (top) and 140 m (bottom) pillar widths at a simulation time of 2000 days (end of UCG operation).
Minerals 06 00101 g009
Figure 10. 3D distant (left) and close (right) views of shear and tensile failure at the fault plane in (from top to bottom) the two strike-slip (SHmax perpendicular to the fault plane and SHmax parallel to the fault plane) as well as the normal and reverse faulting stress regimes for the non-isothermal scenario with 140 m pillar width at a simulation time of 2000 days (end of UCG operation).
Minerals 06 00101 g010
Table 1. Mechanical parameters used for all undertaken simulation runs (from Chećko [34]).
Lithological UnitsYoung’s Modulus (GPa)Tensile Strength (MPa)Friction Angle 1 (°)Cohesion 2 (MPa)Poisson’s Ratio (-)Density (kg·m−3)Dilation Angle (°)
Sandstone (Layer 1)7.52.03114.90.212115-
Claystone (Layer 2)8.22.73119.00.272458-
Shale (Layer 3)8.22.33117.20.252399-
Claystone (Layer 4)7.82.63118.20.272397-
Sandstone (Layer 5)8.82.03115.90.212407-
Coal (Layer 6)0.70.6313.80.351281-
Claystone (Layer 7)8.03.83110.90.272465-
Sandstone (Layer 8)8.51.93115.30.212262-
Target coal seam (Layer 9)0.70.6313.80.351281-
Claystone (Layer 10)803.83110.90.272465-
Fault--200--10
1 Friction angle derived from Byerlee [37]; 2 cohesion determined by means of compressive strength and friction angle.
Table 2. Thermal parameters applied for Layers 5–10 in all simulation runs (from Somerton [38], Speight [39], Tan et al. [40], Małkowski et al. [41] and Cała et al. [42]).
Lithological UnitsLinear Thermal Expansion Coefficient (K−1)Specific Heat Capacity (J·kg−1·K−1)Thermal Conductivity (W·m−1·K−1)
Sandstone (Layer 5)1.6 × 10−512104.67
Coal (Layer 6)3.3 × 10−511300.5
Claystone (Layer 7)7.9 × 10−59702.57
Sandstone (Layer 8)1.6 × 10−512104.67
Target coal seam (Layer 9)3.3 × 10−511300.5
Claystone (Layer 10)7.9 × 10−59702.57
Table 3. Initial averaged data applied for permeability variation analysis (from Somerton [38]; Tian et al. [14] and Min [51]).
Lithological UnitsInitial Values 1
ϕiNormalized kin
Claystone (Layer 7)0.0875113
Sandstone (Layer 8)0.06113
Target coal seam (Layer 9)0.02113
Claystone (Layer 10)0.0875113
1 The initial values are ϕi = porosity, ki = permeability and n is a power-law exponent (porosity sensitivity exponent) as described in Chin et al. [50] and Otto and Kempka [31,32].

