Article

Selective Flocculation Enhanced Magnetic Separation of Ultrafine Disseminated Magnetite Ores

1
College of Resource and Environment Engineering, Wuhan University of Science and Technology, Wuhan 430081, China
2
Hubei Key Laboratory for Efficient Utilization and Agglomeration of Metallurgic Mineral Resources, Wuhan 430081, China
3
Hubei Collaborative Innovation Center for High Efficient Utilization of Vanadium Resources, Wuhan 430081, China
*
Author to whom correspondence should be addressed.
Minerals 2016, 6(3), 86; https://doi.org/10.3390/min6030086
Submission received: 13 May 2016 / Revised: 9 August 2016 / Accepted: 12 August 2016 / Published: 23 August 2016

Abstract

:
Simple magnetic separation for a certain magnetite mine with ultrafine disseminated lean ores has resulted in low performance, as the fine sizes and aggregation of ground mineral particles have caused inefficient recovery of the ultrafine minerals. In this study, we attempt to increase the apparent sizes of target mineral particles, and improve the separation indices, by using a multi-stage grinding-dispersion-selective flocculation-weak magnetic separation process. The results showed that under the conditions of 500 g/t sodium hexametaphospate (SHMP) as dispersant, 750 g/t carboxymethyl starch (CMS) as flocculant, agitating at 400 rpm for 10 min, with slurry pH 11, and final grinding fineness of 93.5% less than 0.03 mm, the obtained concentrate contained 62.82% iron, with recovery of 79.12% after multi-stage magnetic separation. Compared to simple magnetic separation, the concentrate’s iron grade increased by 1.26%, and a recovery rate by 5.08%. Fundamental analysis indicated that, in a dispersed state of dispersion, magnetite particles had weaker negative surface charges than quartz, allowing the adsorption of negative CMS ions via hydrogen bonding. Consequently, the aggregate size of the initial concentrate increased from 24.30 to 38.37 μm, accomplishing the goal of selective flocculation, and increasing the indices of separation.

Graphical Abstract

1. Introduction

Hematite and magnetite are the two main minerals in China’s numerous iron ore sources. As easily processed mineral resources become depleted, iron ores that are low-grade, fine or mixed, and generally difficult to separate have become our current focus of research and exploitation [1,2]. This includes ultrafine disseminated iron ores [3], where the target minerals are largely disseminated at a −0.045 mm level, and fine grinding is needed to liberate. However, ultrafine fine mineral particles often lead to severe slime coating issues, contributing to unfavorable separation performance using traditional separation processes [4,5].
Much work has been done on the beneficiation of ultrafine disseminated hematite, and different separation techniques have been developed, e.g., hydrophobic and selective flocculation, The selective flocculation-desliming-flotation process has been successfully adopted in industrial practice [6,7]. In this process, separation is achieved by using polymer reagents’ adsorptive and connective effect to flocculate target minerals in the highly dispersed slurry, while leaving gangue minerals in suspension [8,9].
The beneficiation of ultrafine disseminated magnetite also suffers from ultrafine particles, low relative susceptibility and poor performance. Current work on such minerals has been limited to the optimization of conventional processes. For example, a certain ultrafine disseminated magnetite mine in Qinghai, China evaluated the separation process of multi-stage grinding-multi-stage magnetic separation-combined direct/indirect flotation of concentrate, the obtained concentrate contained 60.11% iron, with 60.20% recovery, when the final grinding fineness is −0.030 mm at 80% [10]. Some mines in Liaoning, China tested with a multi-stage grinding-multi-stage separation process, with the obtained concentrate contained 63.29% iron, with 69.42% recovery, when the final grinding fineness is −0.074 mm at 99.38% [11]. The latter process, although simple and short, still fails to resolve the core issues of the target minerals lost to tailings, aggregation of particles, and its final performance below the expectation.
In this study, we use polymeric selective flocculation to improve the performance of the beneficiation process of an ultrafine disseminated magnetite mine in Gansu, China, and examine the variations in fineness and surface properties of mineral particles before and after flocculation. The obtained results could provide useful information on the optimization of similar magnetic separation processes.

2. Characterization of the Raw Ore

2.1. Composition and Relative Concentration

The main chemical components of the ore are shown in Table 1, and the mineral components shown in Table 2. Table 3 shows the distribution of chemical iron phases.
It can be seen from Table 1 that the raw ore has a total iron grade of 28.36%, with low concentrations of sulfur and phosphorus (at 0.02% and 0.26%), and a high SiO2 content at 43.02%.
Table 2 shows that the ores main metallic mineral is magnetite, with some siderite and hematite. The main gangue mineral is quartz, accounting for 28.7% of the total minerals. Other gangue minerals include feldspar, ankerite, dolomite, etc. Table 2 also shows that the iron content largely occurs as magnetite, with a distribution ratio of 88.75%, with some remaining iron in the forms of siderite, hematite, pyrite and iron silicate, making this a low-grade magnetite ore.

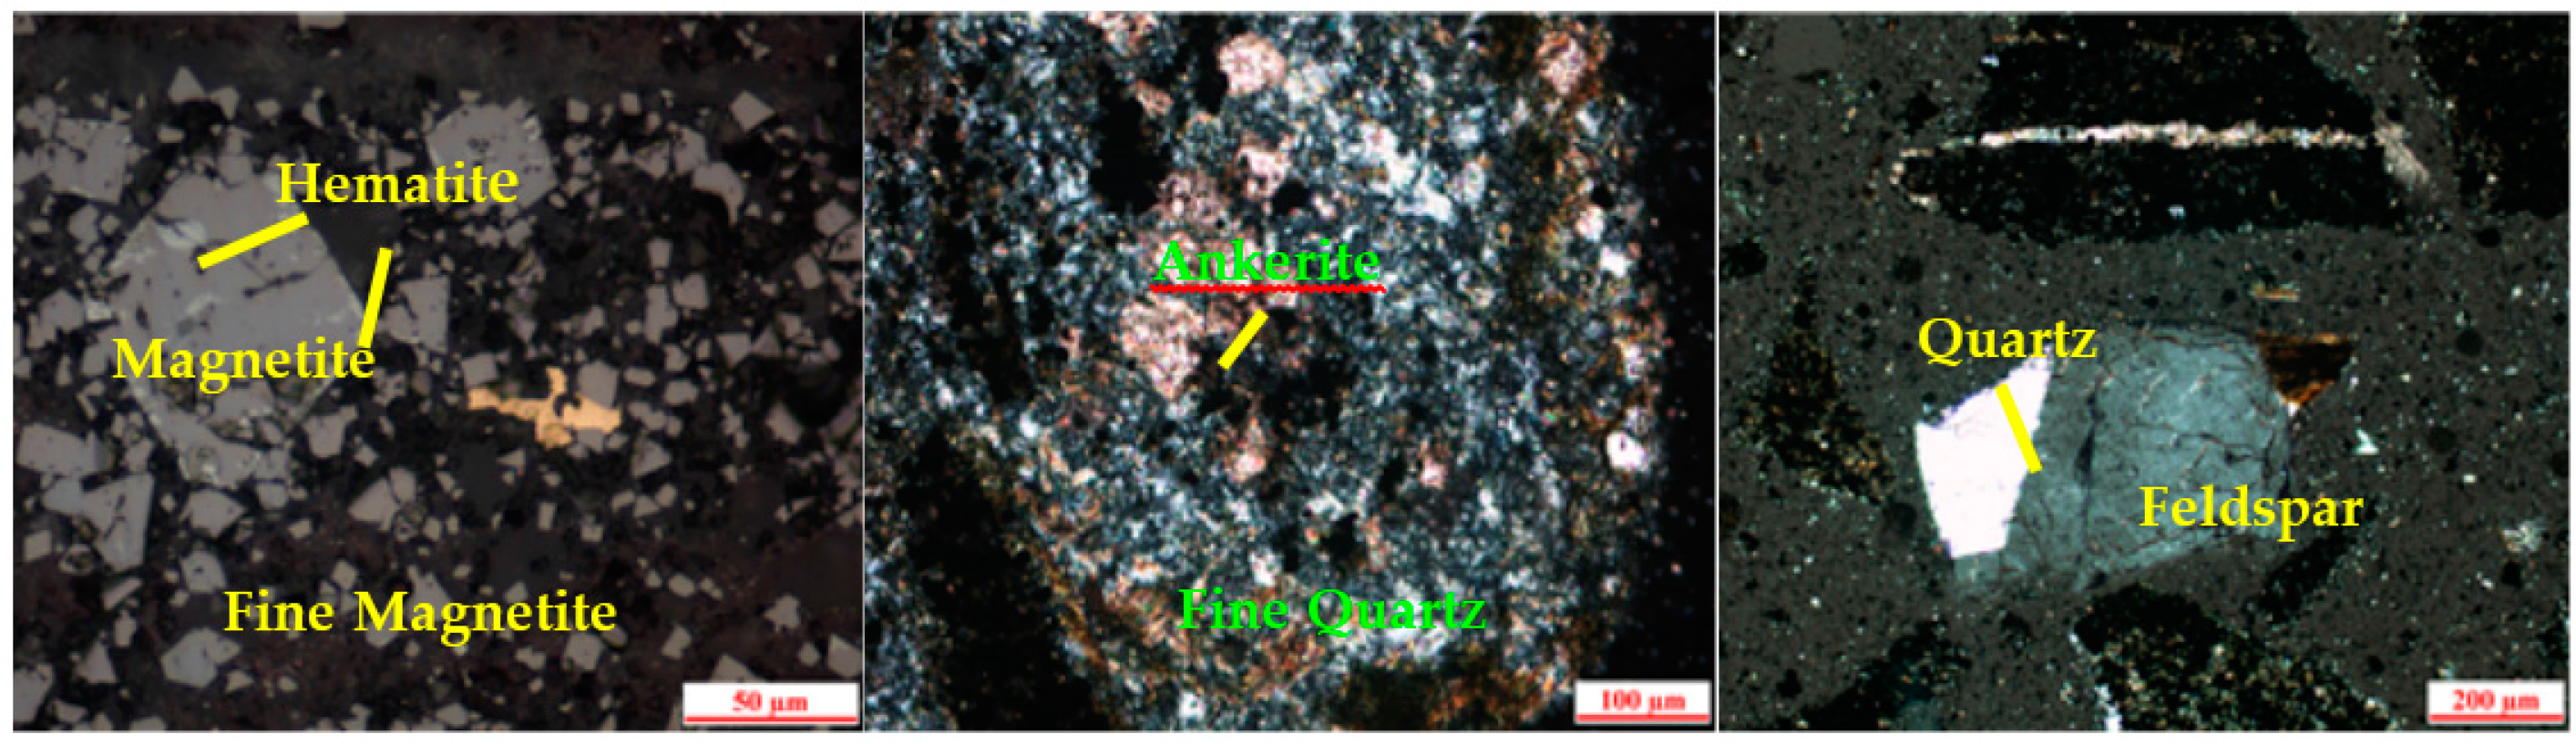
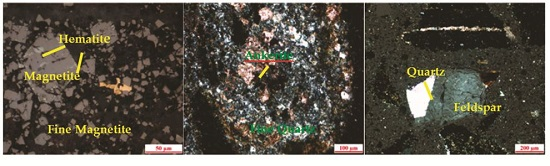
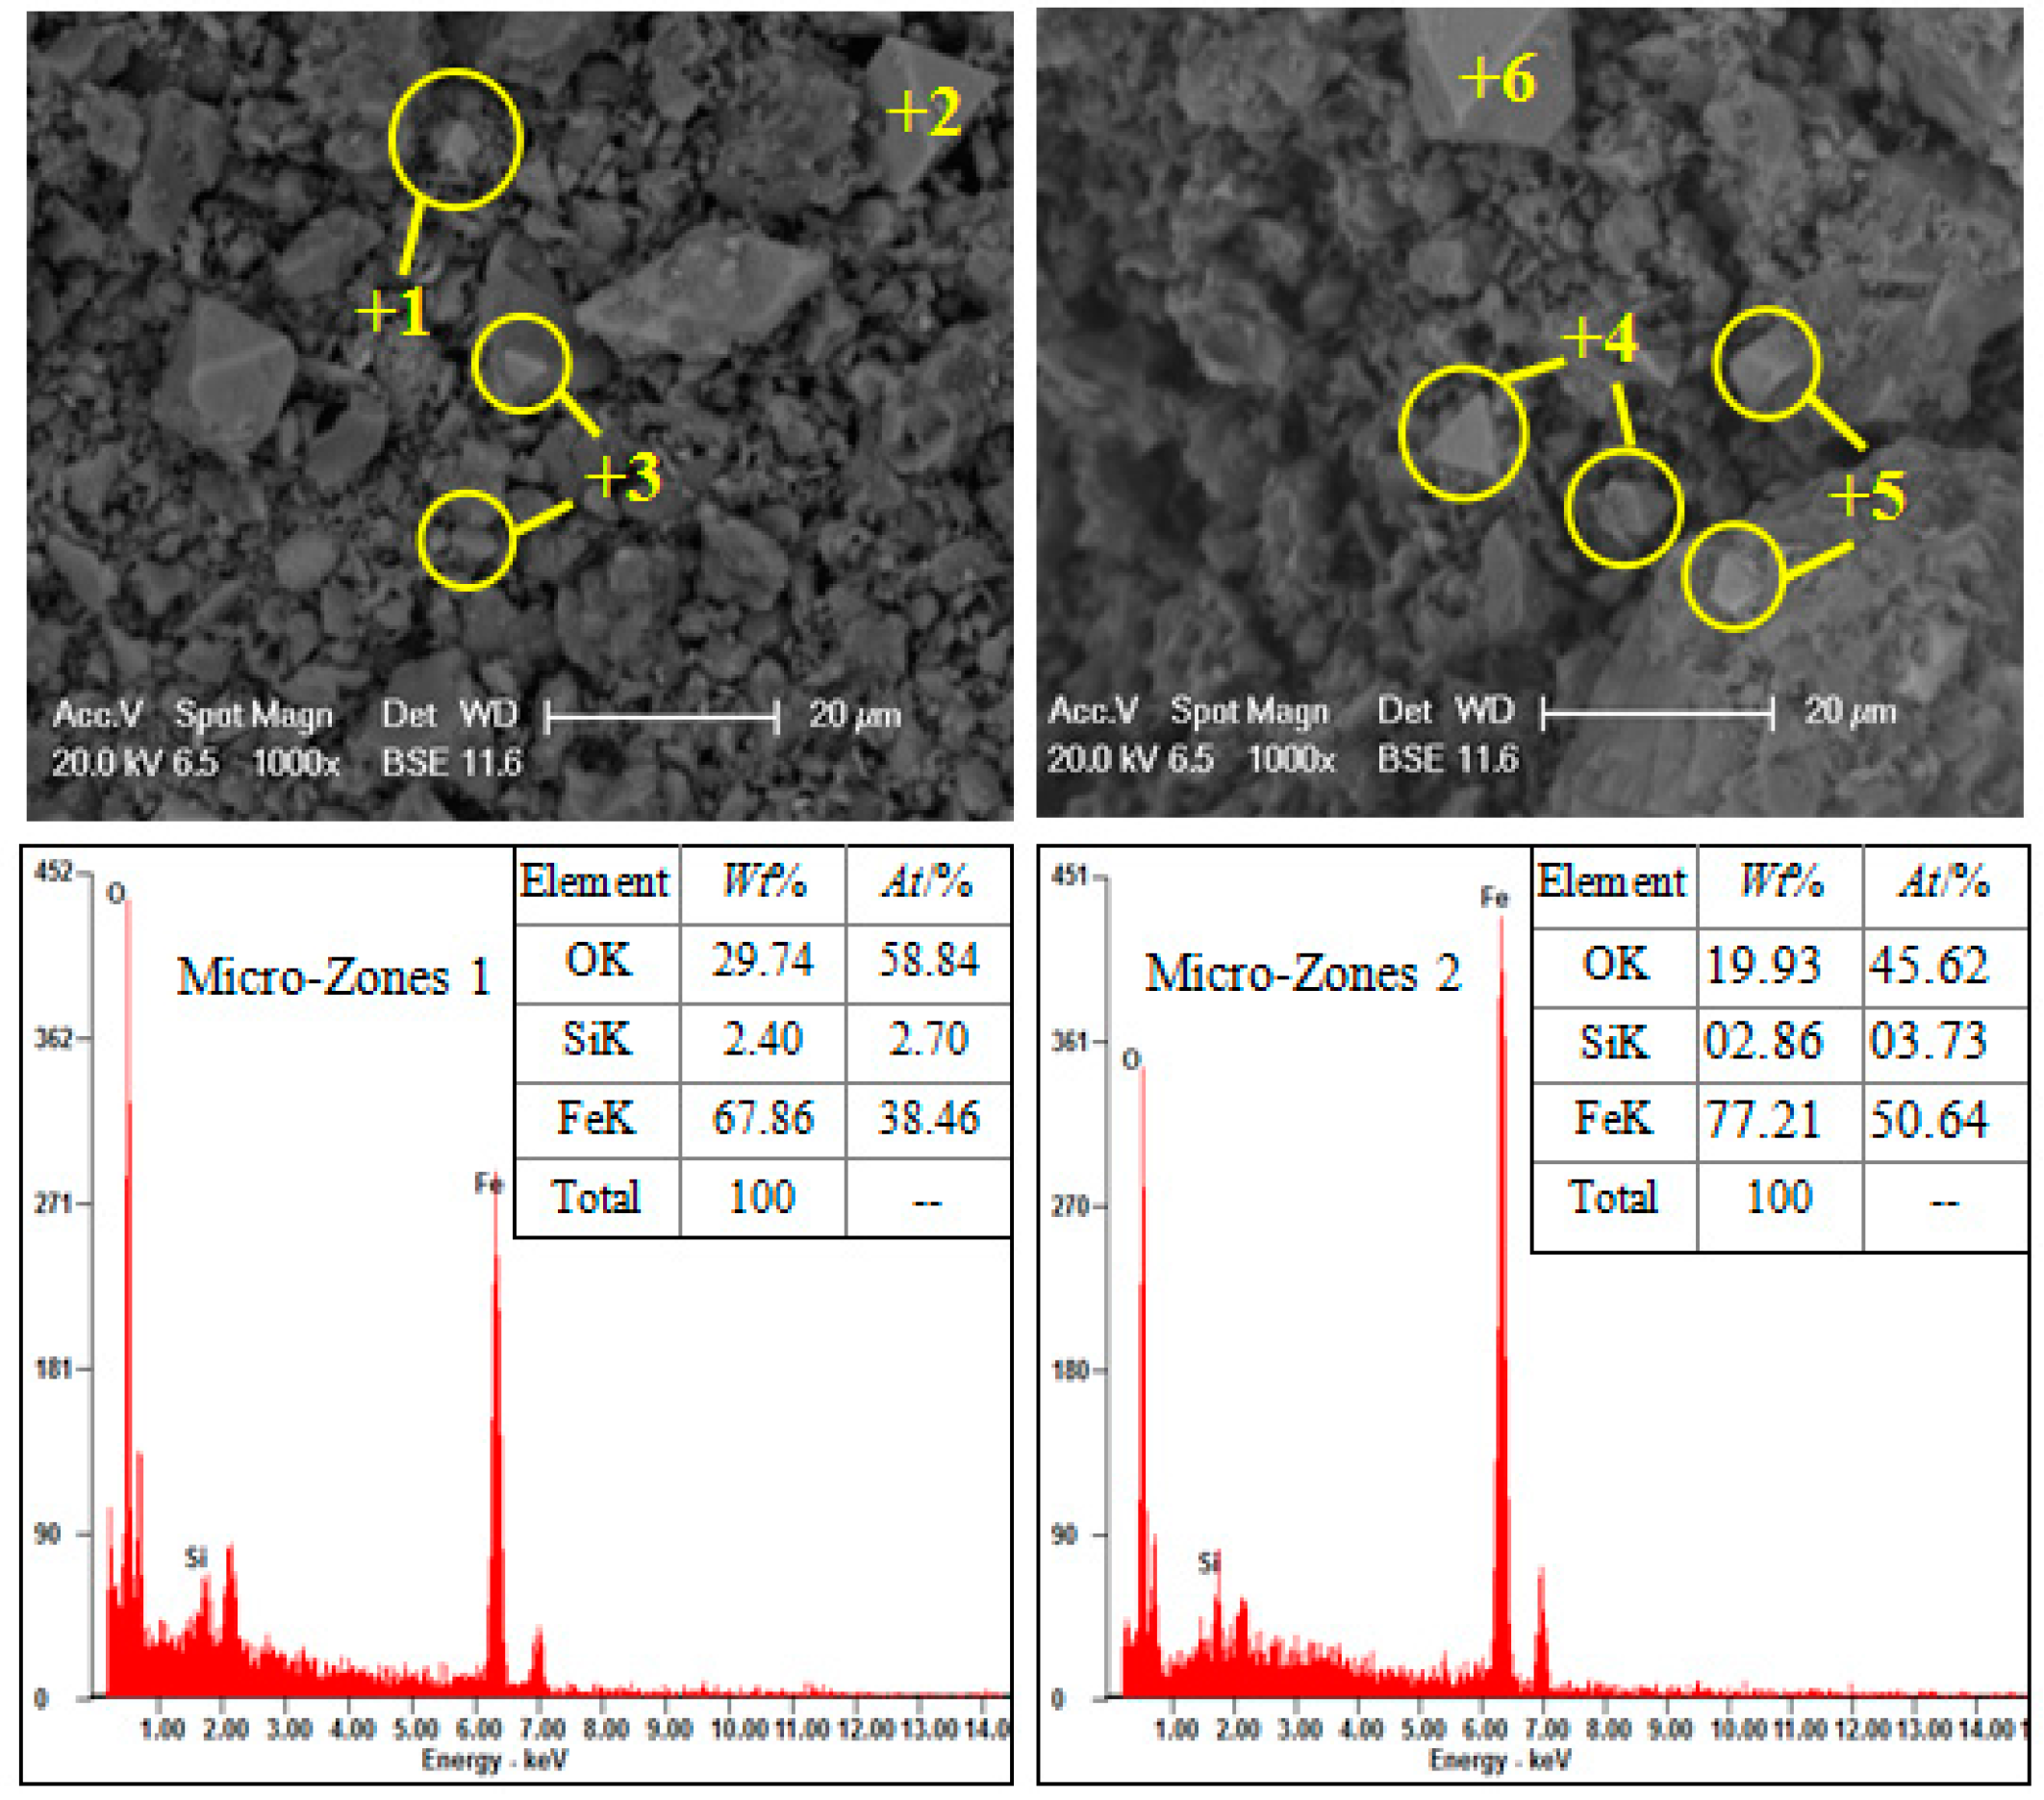
2.2. Dissemination of Main Minerals

In order to obtain the particle size and combination characteristics of main minerals, a DMLP polarizing microscope (Leica Microsystems GmbH, Wetzlar, Germany) with both reflected and transmitted light was used to examine the dissemination of magnetite and quartz in the ore. The sample prepared to test was crashed to −3 mm. The results are shown in Figure 1.
Magnetite: the main ferrous mineral of the ore, occurring as euhedral and semi-euhedral fine grains that are disseminated or densely disseminated in gangue minerals, with occasional metasomatism at the edges by hematite; its distribution is non-uniform dissemination of largely fine grains, the fineness size is below 0.1 mm; particularly, 90% of the grains are of fineness −0.038 mm and 99% −0.074 mm.
Quartz: the main gangue mineral, with occasional coarse grains, generally scattered, or in joint adhesion with feldspar; ultrafine quartz in aggregated grains or veins are common; dissemination is highly non-uniform, the fineness size is below 0.15 mm; particularly, 50% of the grains are of fineness −0.038 mm and 87% −0.074 mm.
The primary ferrous and gangue minerals are ultrafine grains in a complex disseminative relationship, which classifies the ore as an ultrafine disseminated, lean magnetite ore with high difficulty of separation.

2.3. Test Methods

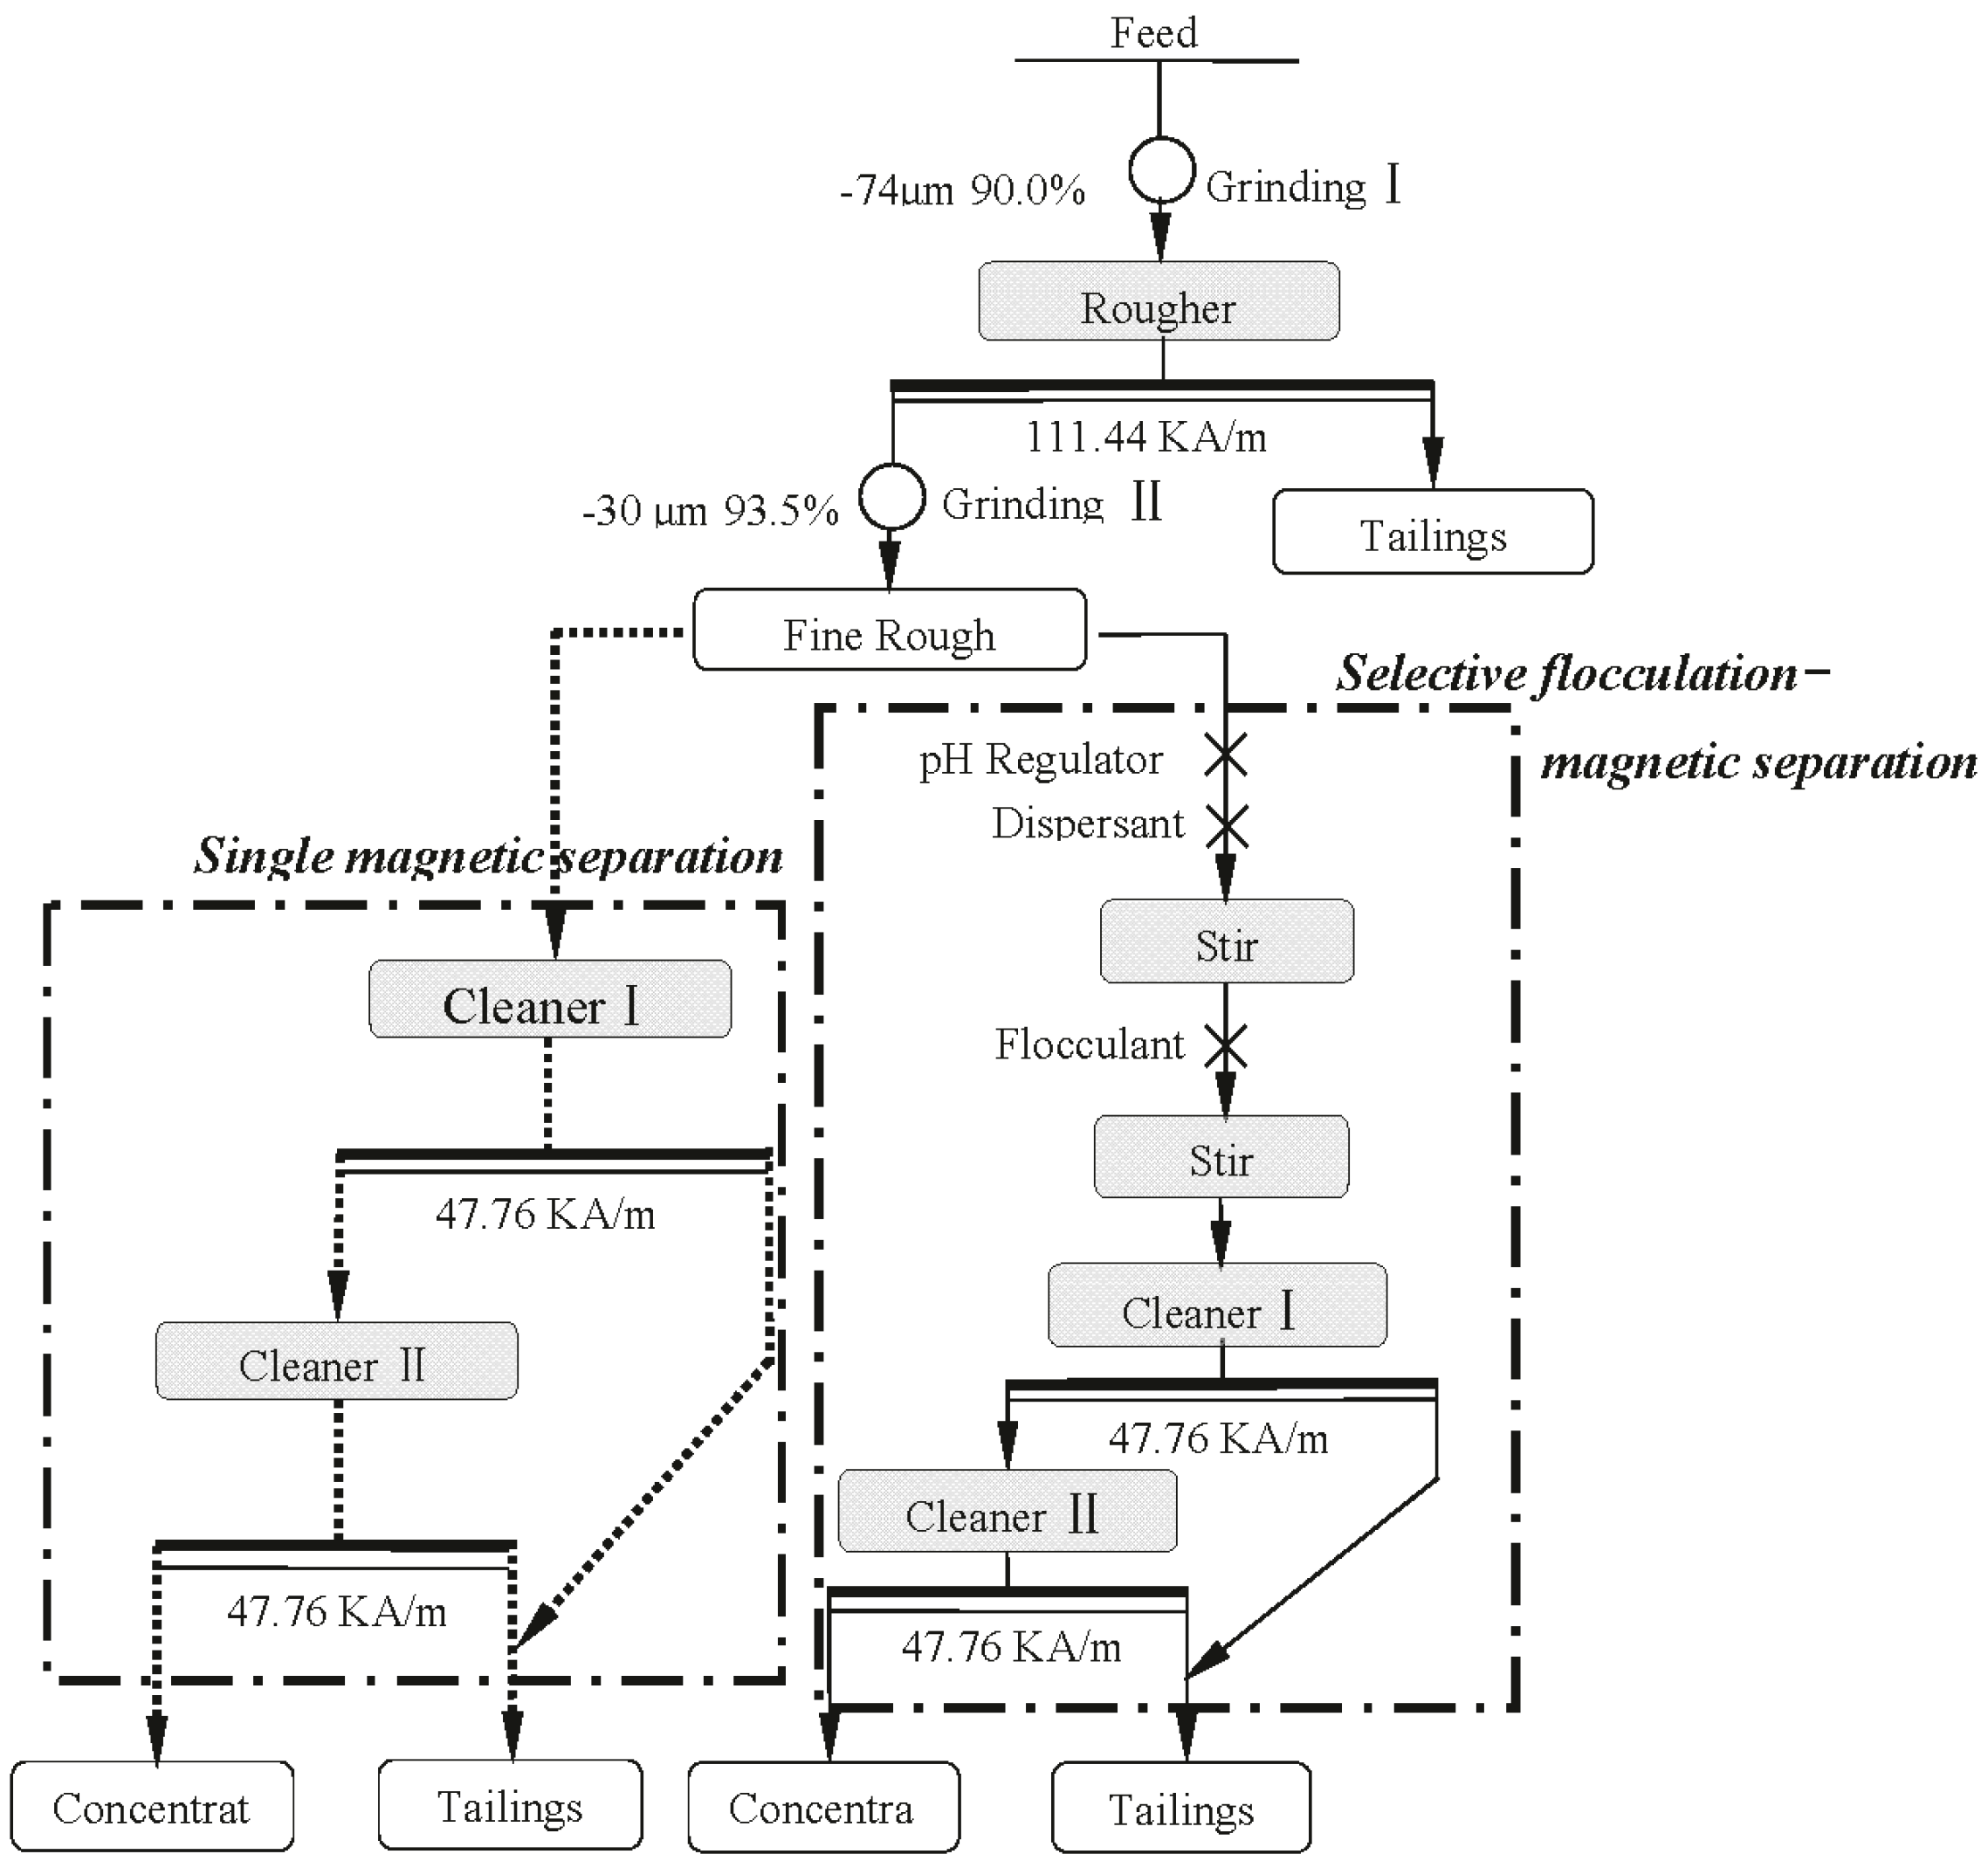
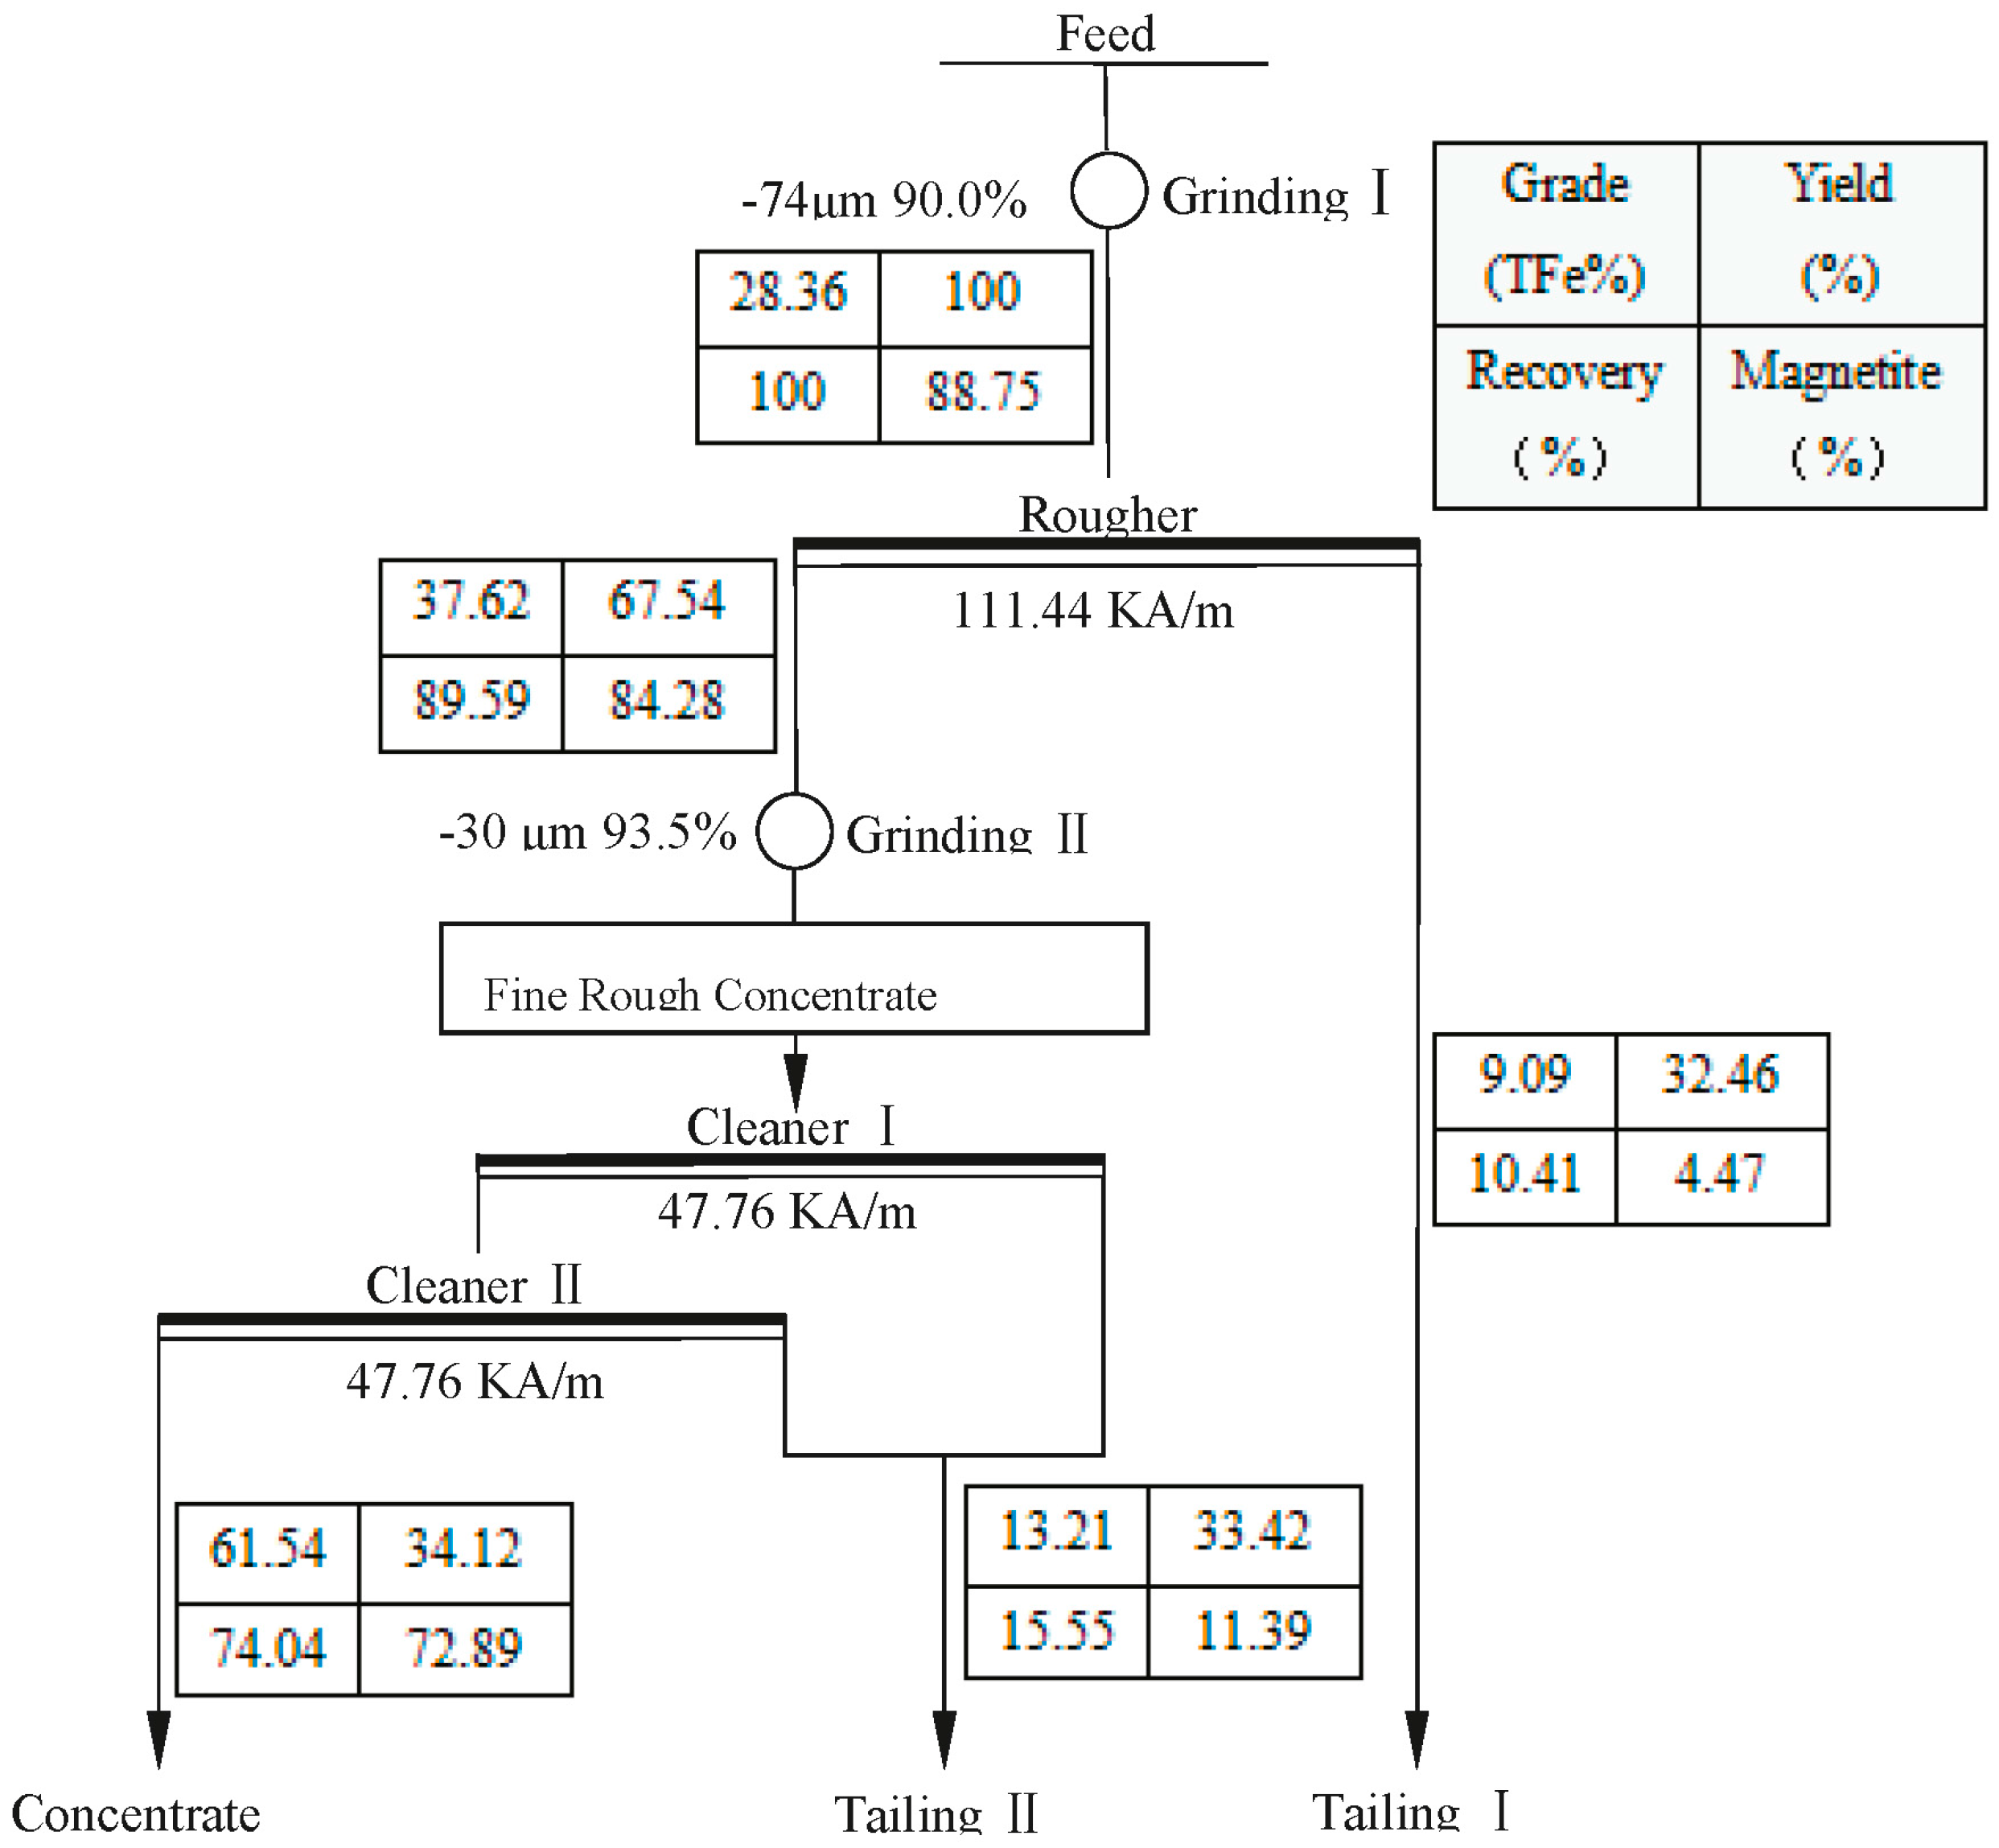
2.3.1. Simple Magnetic Separation Process

The test device is a low-intensity magnetic drum separator (Changsha Research Institute of Mining And Metallurgy, Changsha, China). The process includes an initial grinding and separation, a discard of tailings, and a second grinding and separation. The optimal grinding fineness and strength of magnetic field are determined by prior testing. The workflow is shown in the part of Figure 2 marked by dotted lines.

2.3.2. Selective Flocculation-Magnetic Separation Process

The process includes dispersion, selective flocculation, and weak magnetic separation. The grinding fineness and magnetic strength are unchanged. The workflow is shown in the part of Figure 2 marked by solid lines.
(a) Dispersion Tests
The finely ground slurry is diluted to 15 wt %, with dispersant added, and pH adjusted (using HCl and NaOH), agitated for 5 min at the speed of 800–1000 r/min, and settled for 10 min. The sediment is weighed, and the dispersion is calculated using the following equation:
Dispersion = Total specimen weight Sediment weight after 10min Total specmen weight × 100 % ;
(b) Flocculation Tests
The dispersed slurry is placed in a mixer, with flocculants added and pH adjusted (using HCl and NaOH), and with 5–10 drops of kerosene added. The mixture is agitated for 10 min at speed of 200–1000 r/min before magnetic separation, and the results of separation indices are analyzed.

3. Test Results and Analysis

3.1. Simple Magnetic Separation Tests

The optimal process and its conditions have been determined by early exploratory tests, with the final parameters and indicators shown in Figure 3.
It can be seen that the simple process can obtain concentrate containing 61.54% iron, with 74.04% recovery from the raw magnetite ore. While the iron grade can meet the industrial requirements, the recovery rate is less than desired. The weight changes show that 10.41% and 15.55% of iron are lost to tailings I and II, respectively, which correspond to 4.47% and 11.39% occurrences in the raw ore. Since the lost iron in tailings II has a higher grade and loss rate, and accounts for a larger proportion of the ore, the study will focus on analyzing tailings II to find out the cause of lost iron, and take measures to increase the recovery rate.
Figure 4 shows the results of Scanning Electronic Microscopy (SEM, Philips, Amsterdam, The Netherlands) and Electron Probe Microanalysis (EPMA, Philips, Amsterdam, The Netherlands) on tailings II. SEM shows that octahedral particles occur frequently in tailings II, which when combined with EPMA results of micro-zones 1 and 2, are proven to be magnetite. Magnetite generally occurs as singular particles, such as those in micro-zones 1, 2, and 6, but some are also seen aggregated with gangue minerals, such as micro-zone 5.Ultrafine magnetite particles below 5 μm in size are commonly sighted, e.g., in micro-zones 1, 2, 3, and 4, and occasionally there are magnetite particles below 10 μm, e.g., micro-zone 6. It can be concluded that a significant amount of magnetite has been lost to tailings during the beneficiation, affecting the final separation indices, which may be caused by these particles being finer than the minimum capabilities of the device, or by their aggregation with gangue minerals.
Figure 5 shows the particle size distributions of the finely ground initial concentrate, the final concentrate, and tailings II. As can be seen, the finely ground initial concentrate has particularly finer particles, with 88.31% of minerals at −25 μm, and 35.24% at −5 μm. After separation, mineral particles below 5 μm only accounts for 9.68% of the final concentrate, while as much as 47.1% of tailings II are below 5 μm. There are reasons to believe that most fine magnetite particles have been lost to tailings during the separation, leading to the low recovery [12]. This is consistent with the results of SEM analysis.

3.2. Selective Flocculation-Magnetic Separation Tests

Having reached the conclusion that ultra fine mineral particles are the cause of the simple separation process’s low performance, we adopt a polymeric selective flocculation-magnetic separation process, in hope of reducing aggregation between target minerals and gangue minerals, increasing the apparent sizes of target mineral particles, and improving the performance indices.

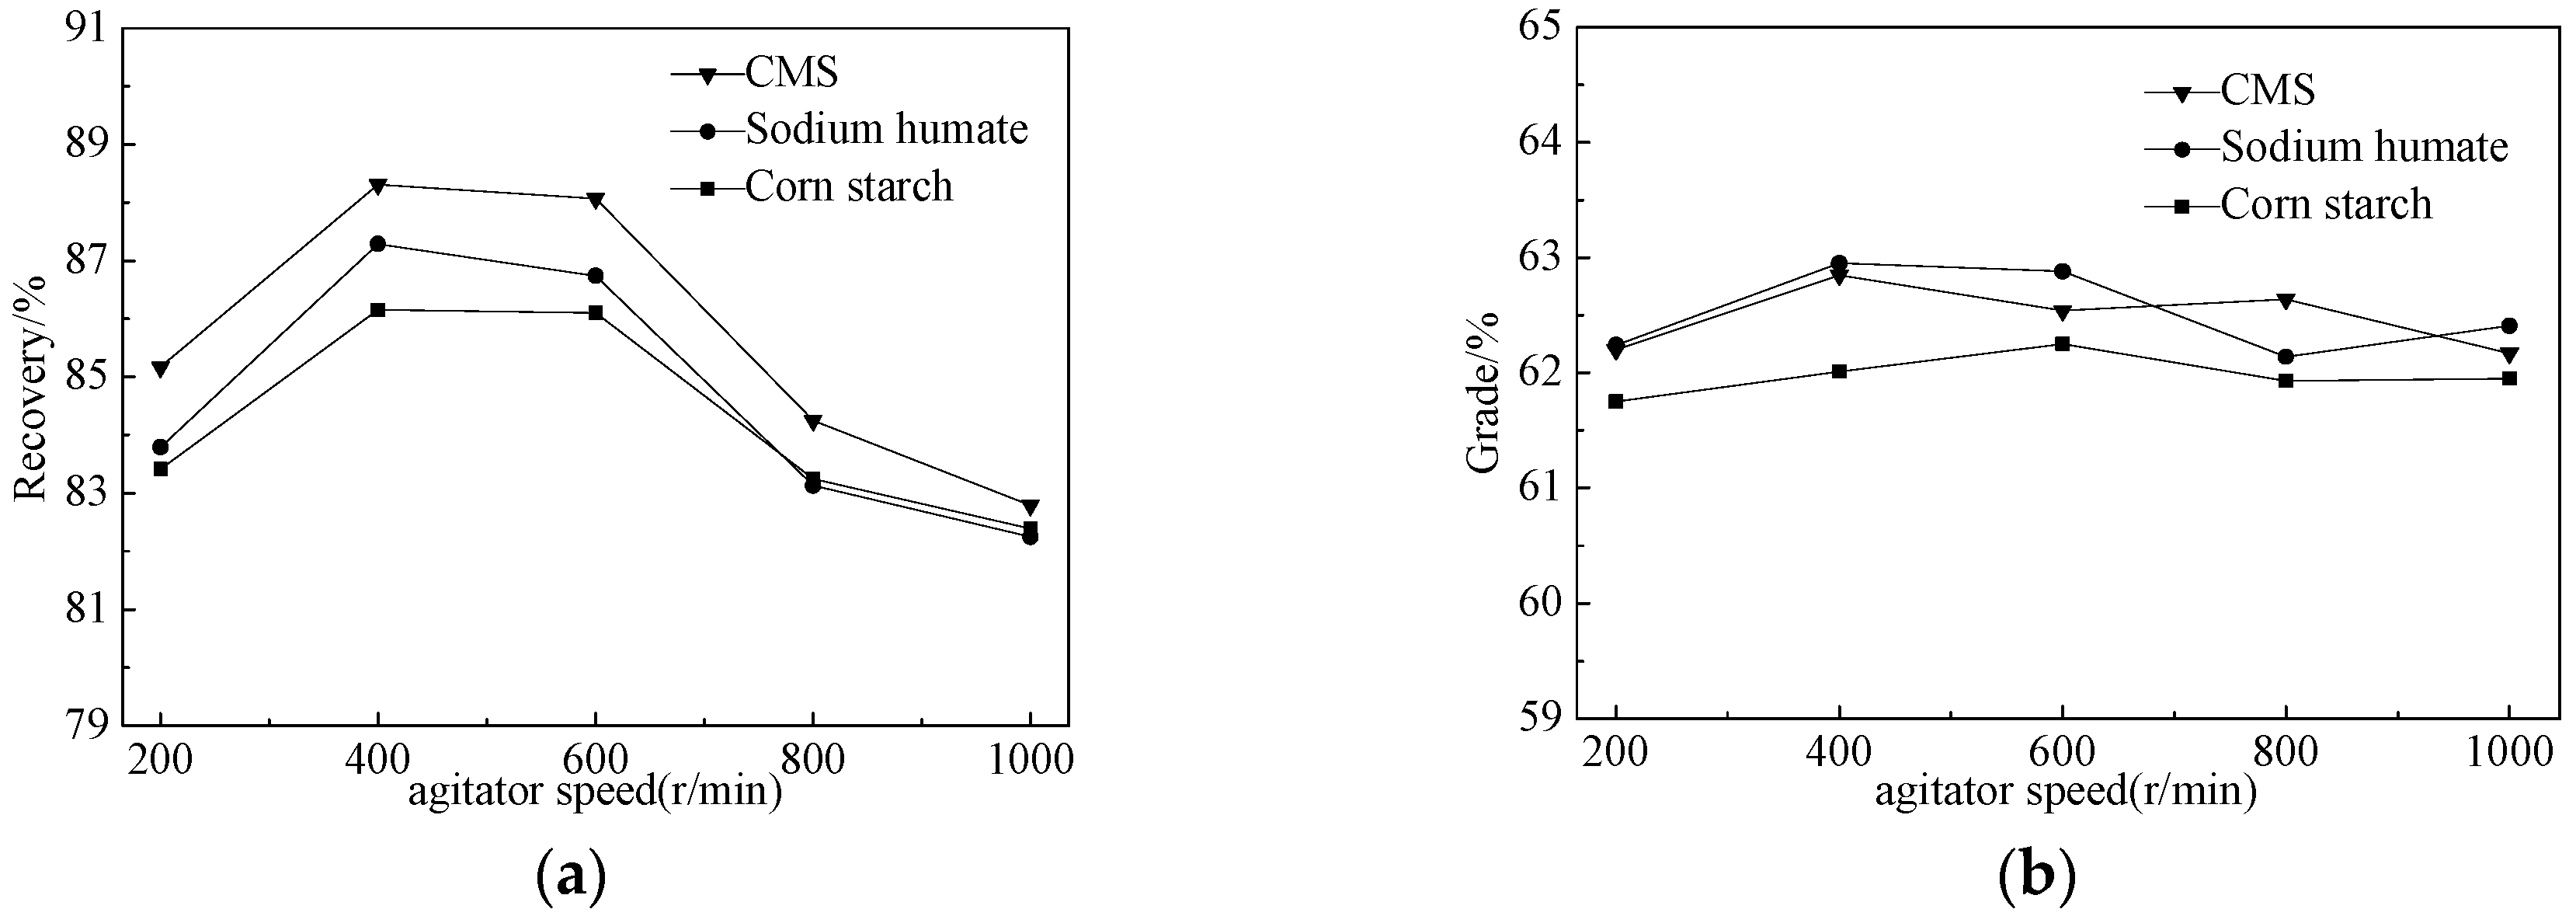
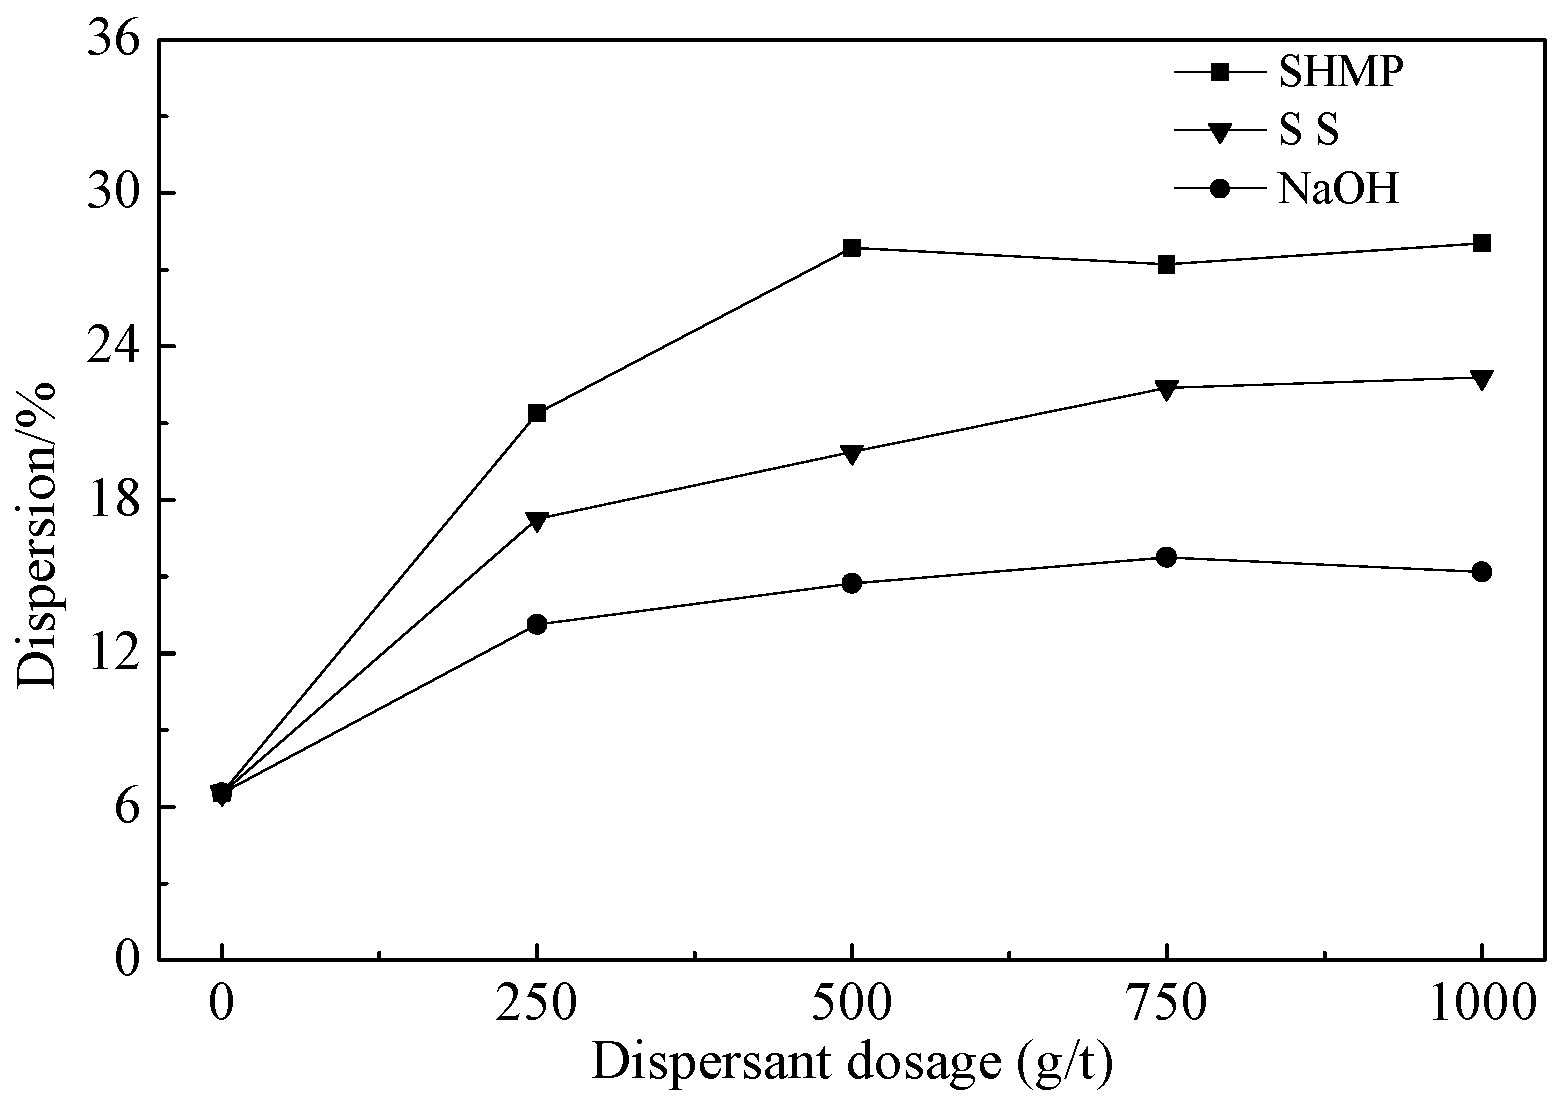
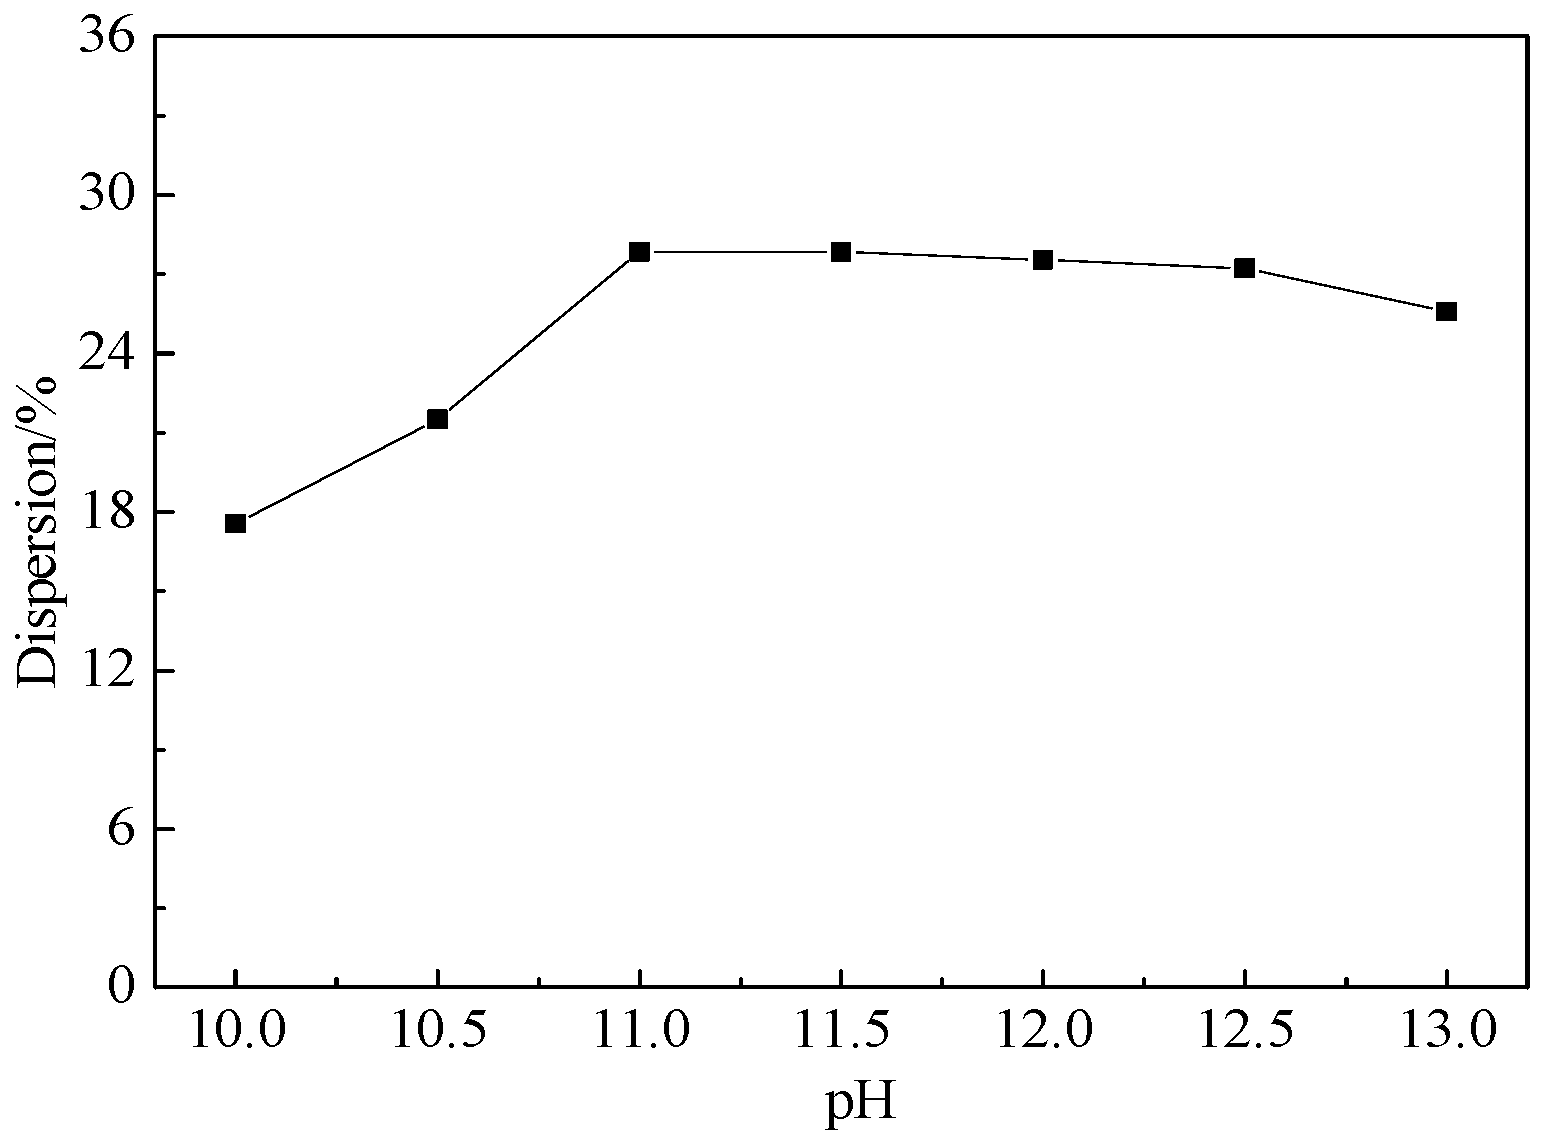
3.2.1. Dispersion Tests

Good dispersion of minerals in water is an important prerequisite for successful selective flocculation. The dispersion tests utilized sodium hexametaphosphate (SHMP), sodium silicate (SS), and NaOH to study the effect of dispersants and their dosages. For SHMP and SS, the slurry has a pH of 10–11. The results are shown in Figure 6.
It can be seen in Figure 6 that, as the amounts of dispersing agents increase, the dispersion rates first increase greatly, then tend toward stabilization. The dispersion effectiveness of the agents, ranking from high to low are: SHMP, SS, and NaOH. SHMP has the best effect when applied at 500 g/t, resulting in an increase in dispersion rate from 6.54% to 27.85%.
With SHMP at 500 g/t, we tested the effect of slurry pH on dispersion rate, with results shown in Figure 7.
As can be seen in Figure 7, the slurry’s dispersion rate shows a remarkable increase when its pH increases from 10 to 11, then tends toward stabilization when its pH continues to increase. Therefore the optimal slurry pH is determined to be 11.
Next, measurements were made on the surface potentials of magnetite and quartz minerals under different conditions, for analysis of the mechanism through which SMHP and pH affected dispersion using DLVO theory.
As shown in Figure 8, both increasing the slurry’s pH and the addition of SHMP can cause the zeta potential of magnetite and quartz particles to decrease. This is due to the solid particles adsorbing the introduced OH or the phosphate radicals ionized from SHMP. According to classical DLVO theory, the stable dispersion of the ultrafine mineral particle system is moderated by the equilibrium between the attractive van der Waals force and the repulsive double layer force, and the latter is proportional to the square of particle surface charge. Thus, the increase of pH and the addition of SHMP could decrease the zeta potential and increase the negative charges on particle surfaces, causing the slurry’s dispersion rate to increase. It can also be noted from Figure 7 that, for slurry pH higher than 8, quartz is still more negatively charged than magnetite after adding SMHP, which provided a favorable condition for selective flocculation of magnetite from silica, as discussed below.

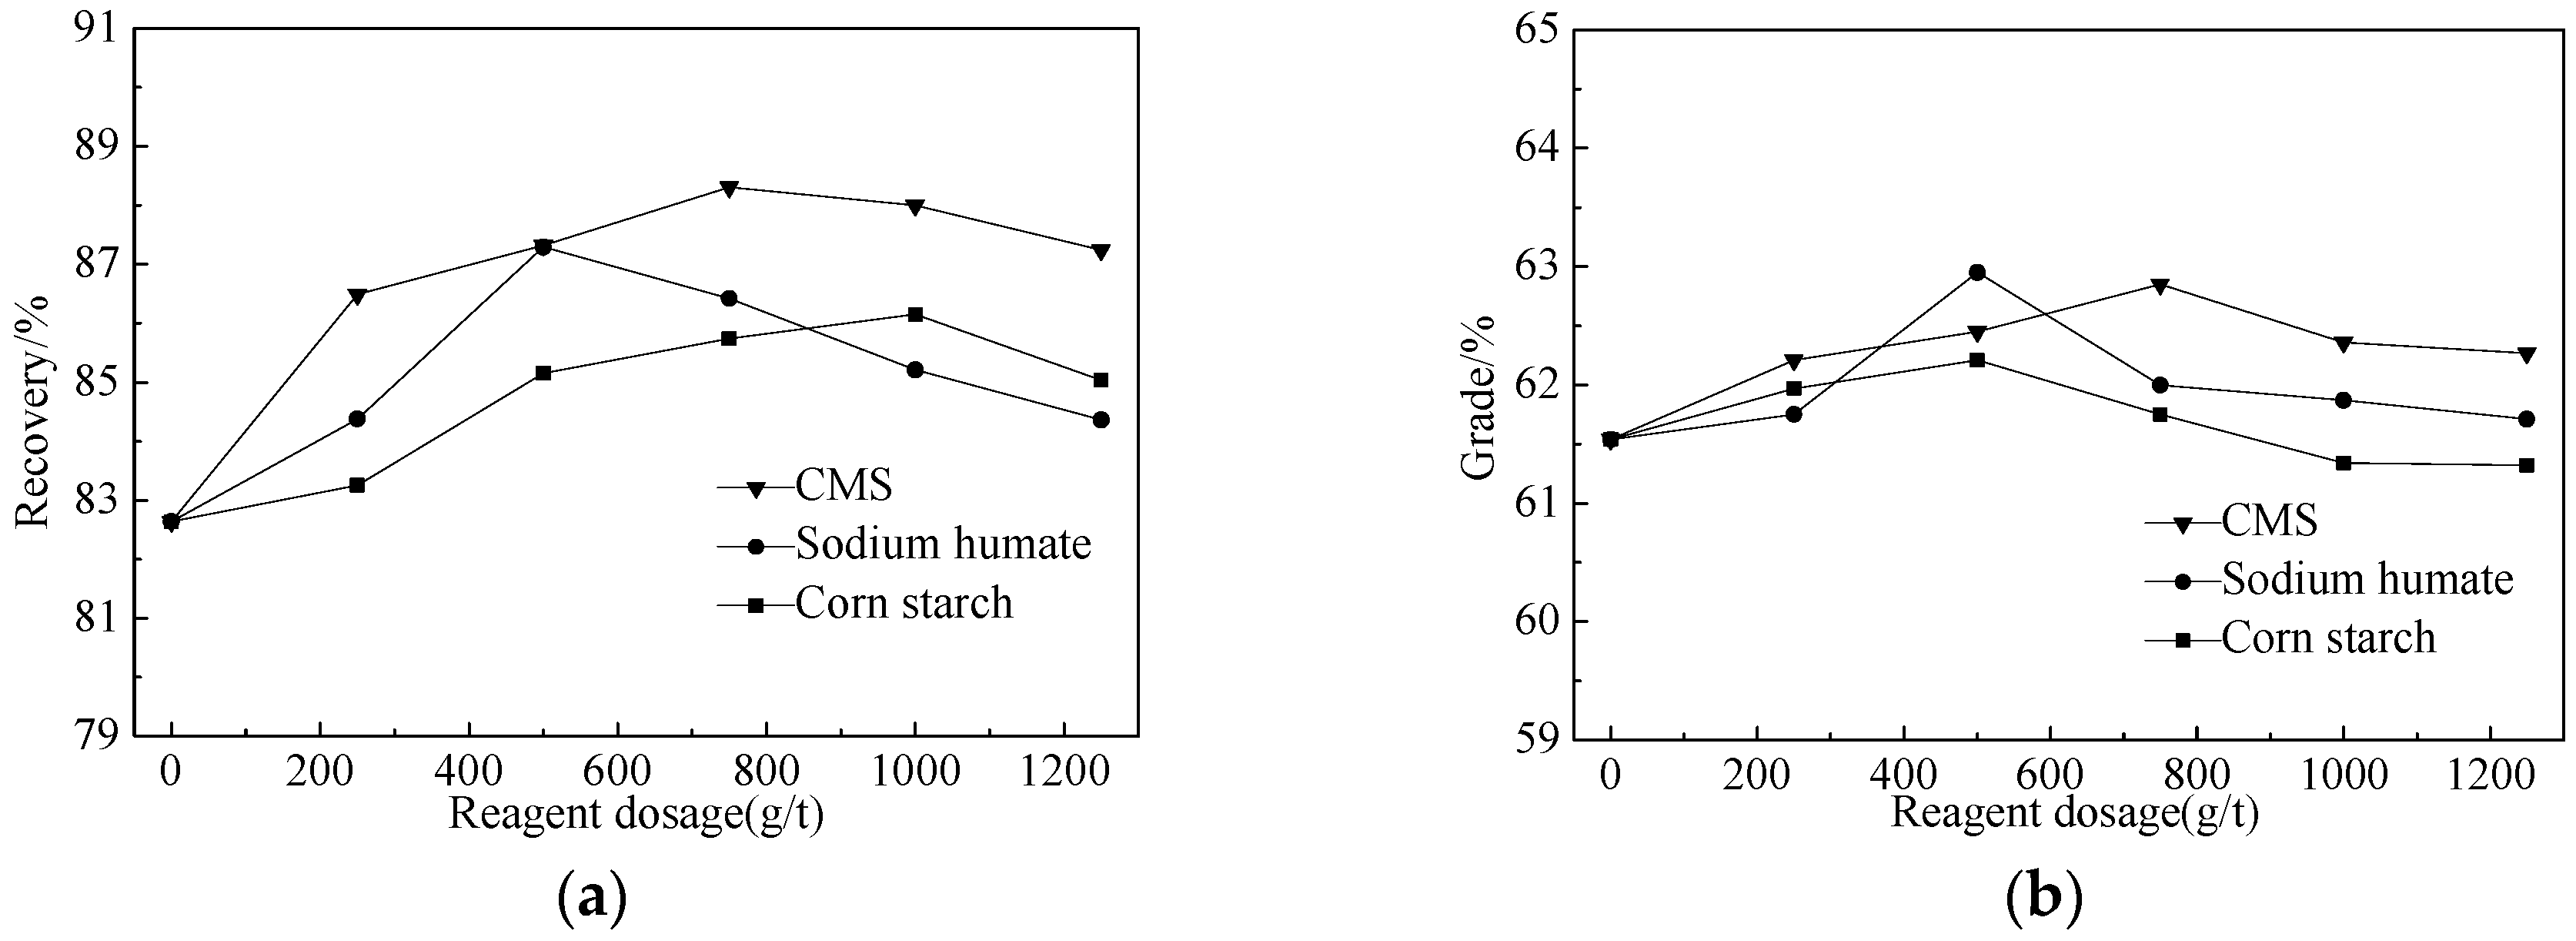
3.2.2. Flocculation Tests

Based on preliminary work on selective flocculation and flotation of ultrafine disseminated magnetite ores, the initial candidates for flocculants were carboxymethyl starch (CMS), sodium humate, and common corn starch.
The effects of flocculant types and amounts on concentrate indices were tested using magnetic separation at pH 10–11, agitated at 400 r/min for 10 min. The results are shown in Figure 9.
Figure 9a depicts the effects of flocculant types and amounts on iron recovery. As flocculants increase, the recovery could reach a maximum. This is because too little flocculant is ineffective, while too much flocculant causes excessive adsorption on particle surfaces, breaking up initially aggregated colloids, in a process called “colloid protection” [13] or “over-dosing” effect. Figure 9b shows the effects of flocculant types and amounts on iron grades, which while less significant, still display an increase over the results without flocculants. This increase is due to the flocculants impediment of aggregation between different types of mineral particles.
Overall, the best effects on concentrate indices are reached at 750 g/t for CMS, 500 g/t for sodium humate, and 1000 g/t for corn starch.
The effects of agitator speed were tested under the conditions of 750 g/t CMS, 500 g/t sodium humate, or 1000 g/t corn starch, using slurry pH 10–11 and agitation time 10 min. The results are shown in Figure 10.
Figure 10a depicts the effects of agitator speed on concentrate recovery rate, which are notable, and display similar trends for the flocculants. The recovery rates increase when the speed increases from 200 to 400 r/min because lower speeds cannot induce sufficient contact and adsorption between flocculants and magnetite particles. On the other hand, overly fast agitation can break up the formed flocs and disrupt the flocculation process.
Figure 10b shows the effects of agitation speed on iron grade, which are less significant, varying between the 61.5%–63% range.
Combining the results of dispersion and flocculation tests, it can be concluded that the optimal conditions are: SHMP at 500 g/t for the dispersant; CMS at 750 g/t for the flocculant; slurry pH at 11; and agitation at 400 r/min for 10 min. The resultant concentrate has a grade of 62.82%, with an operational recovery rate of 88.31% and a total recovery rate of 79.12%. Compared to simple magnetic separation, the iron grade has been increased by 1.26%, and the recovery rate increased by 5.08%.

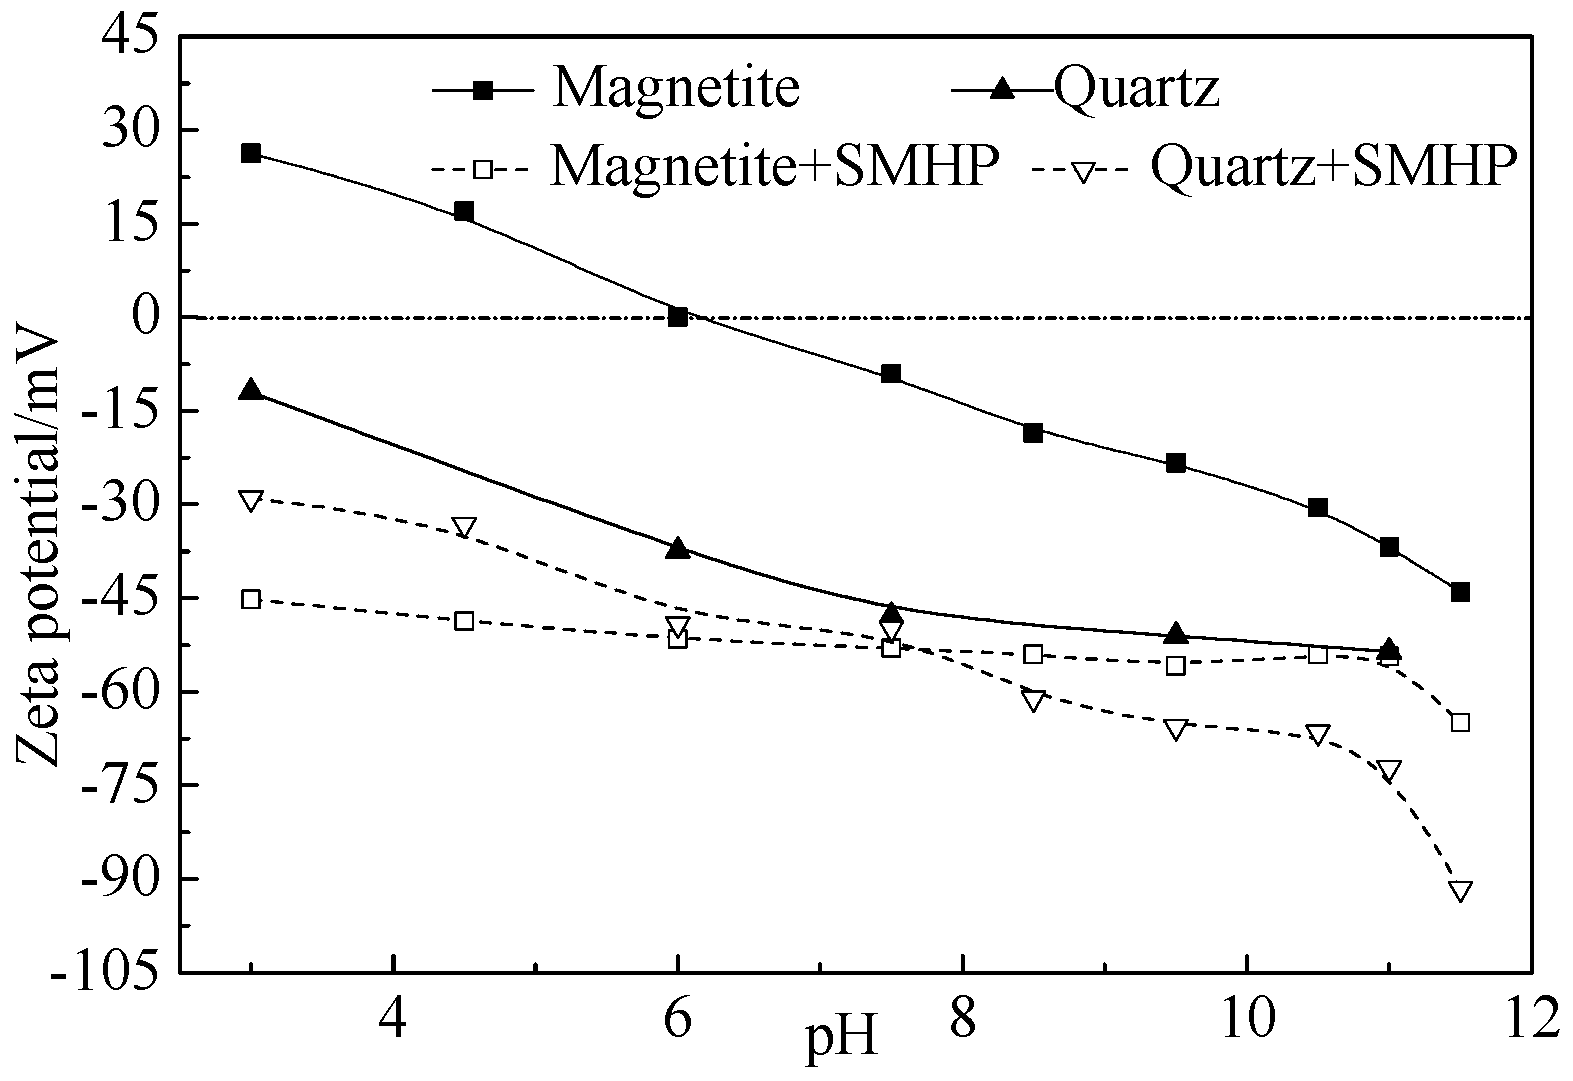
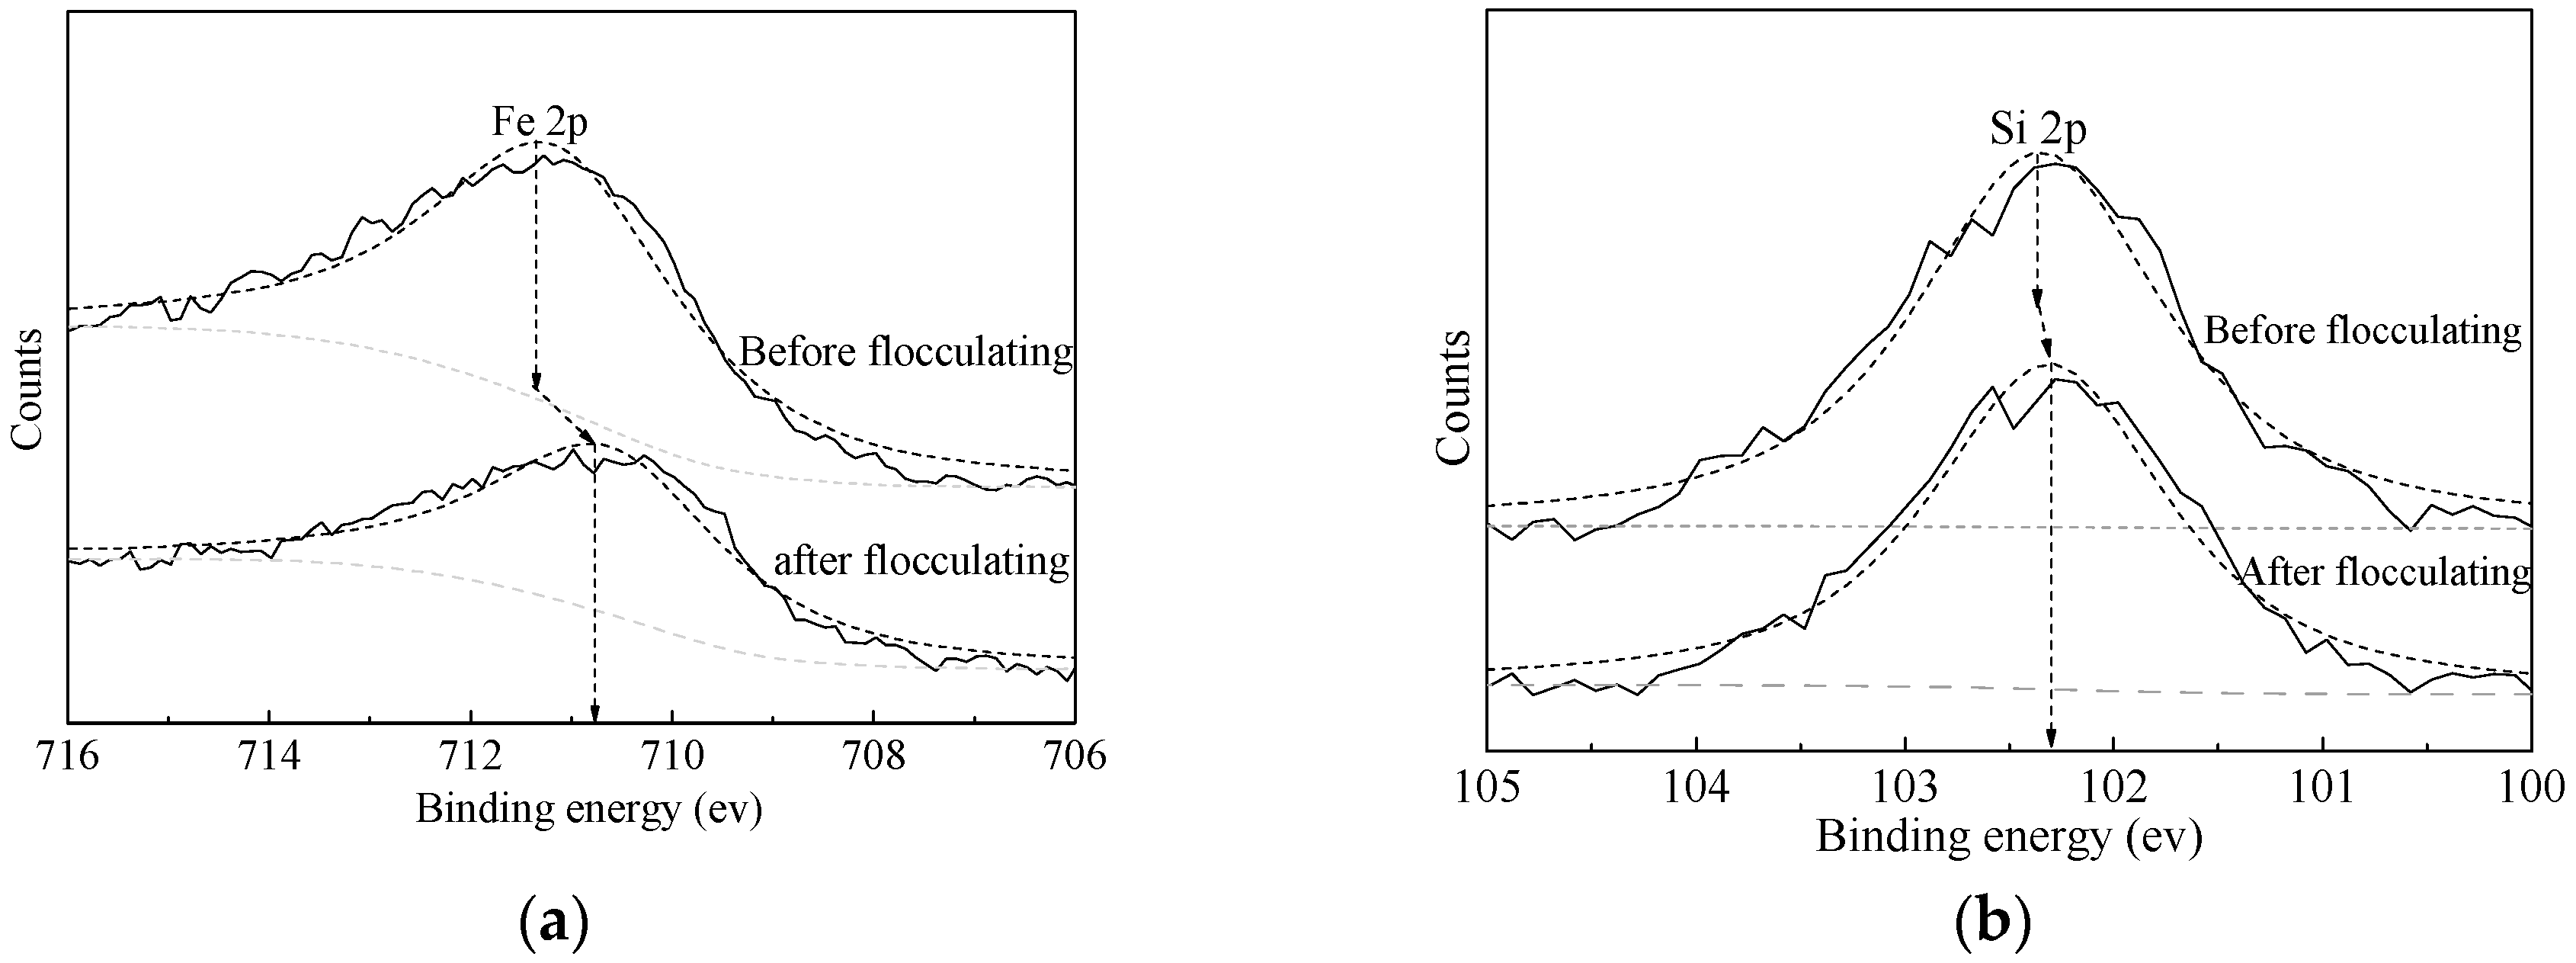
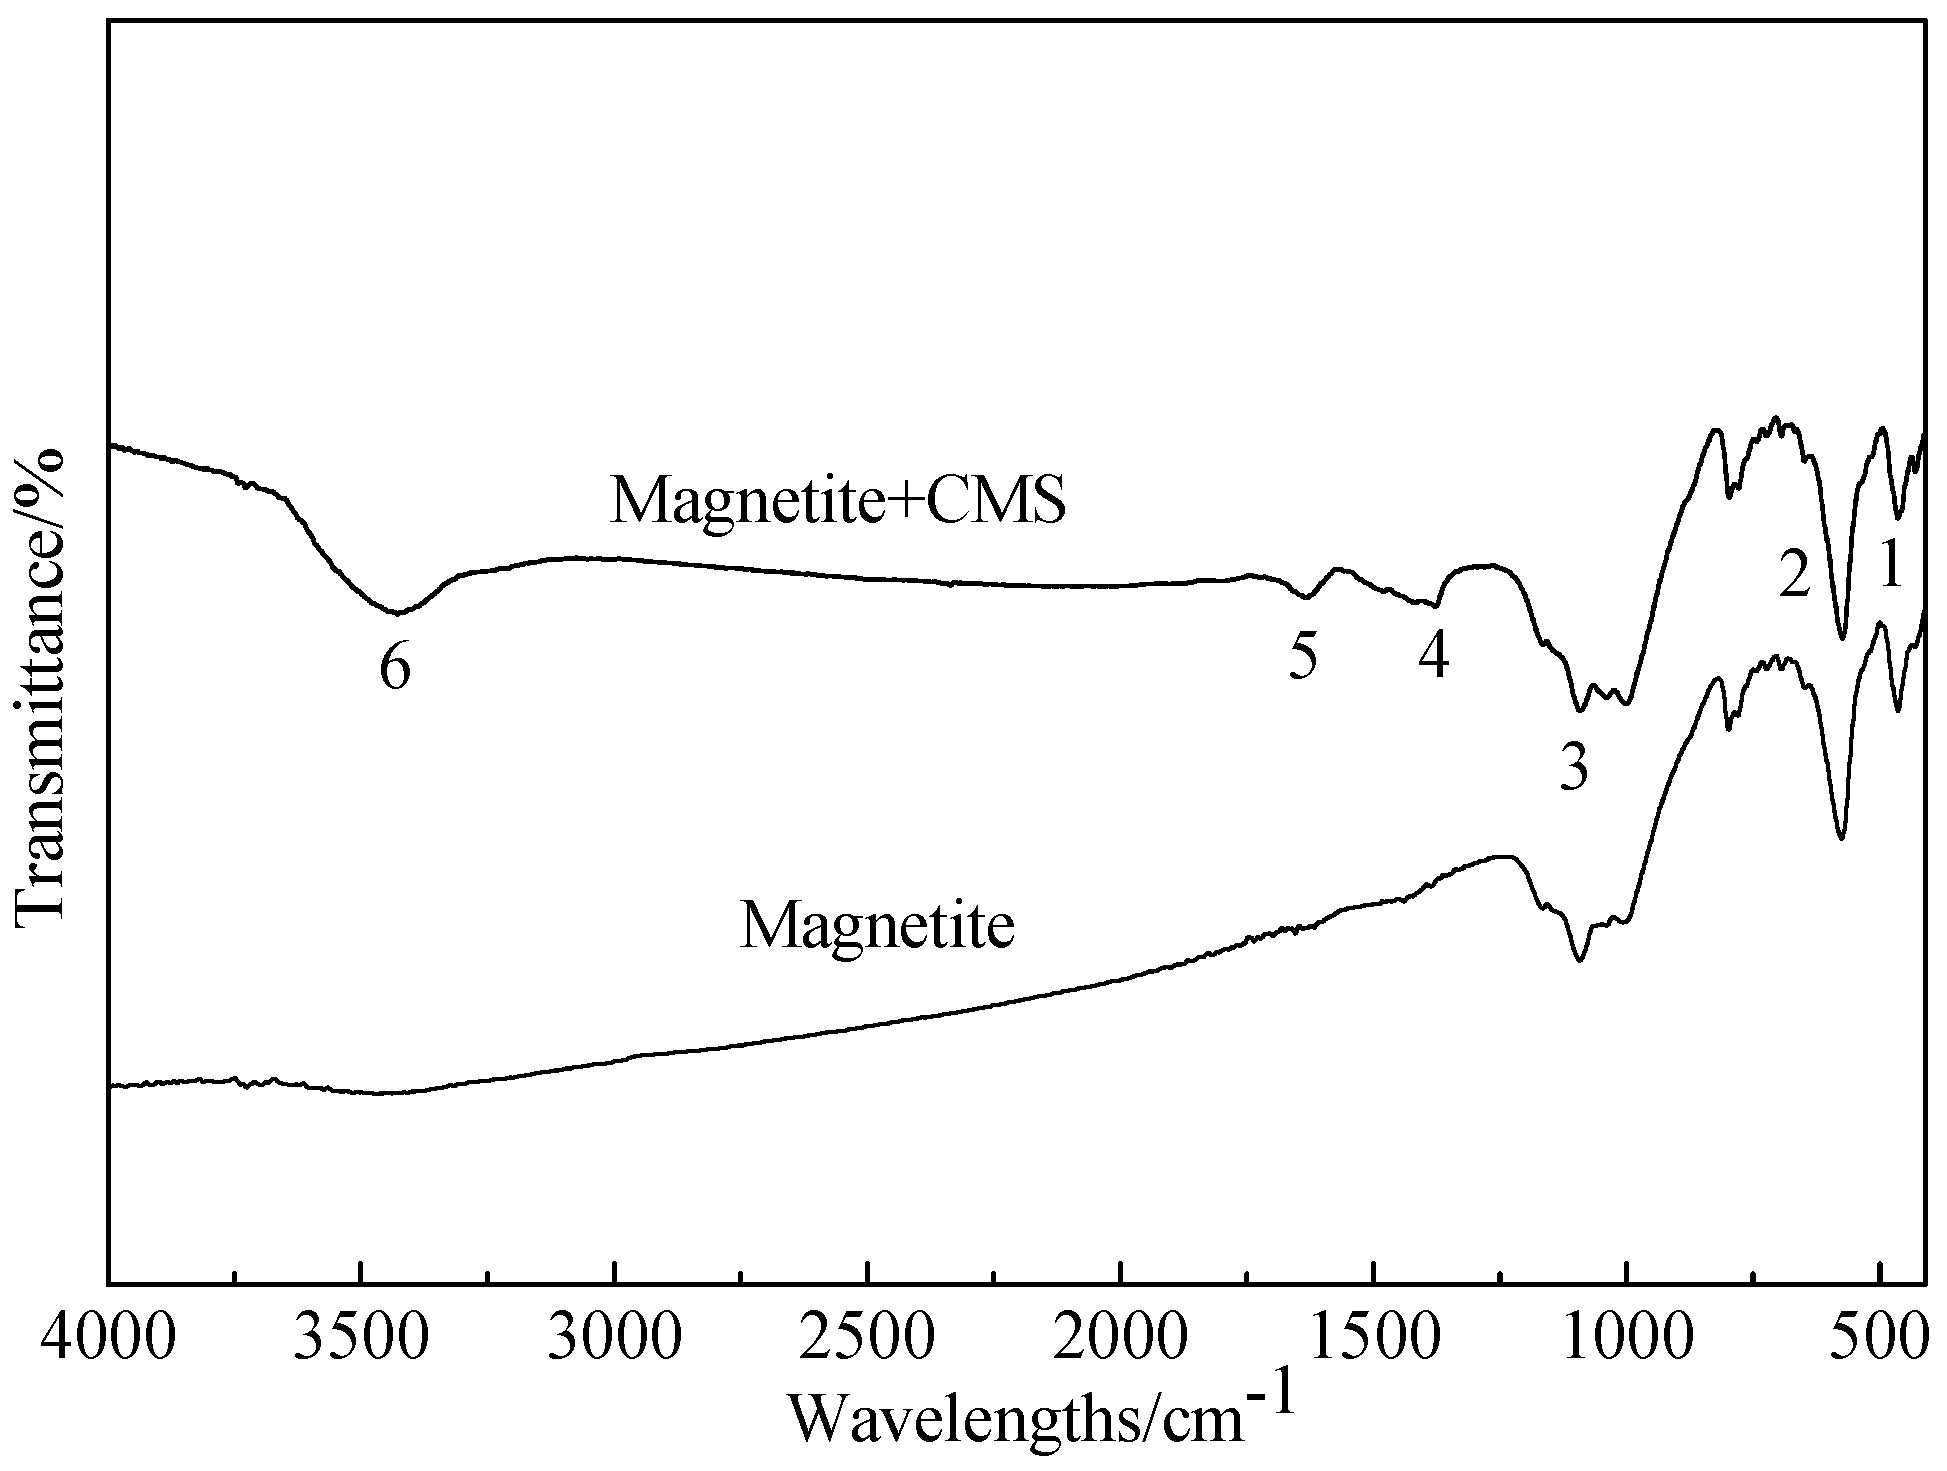
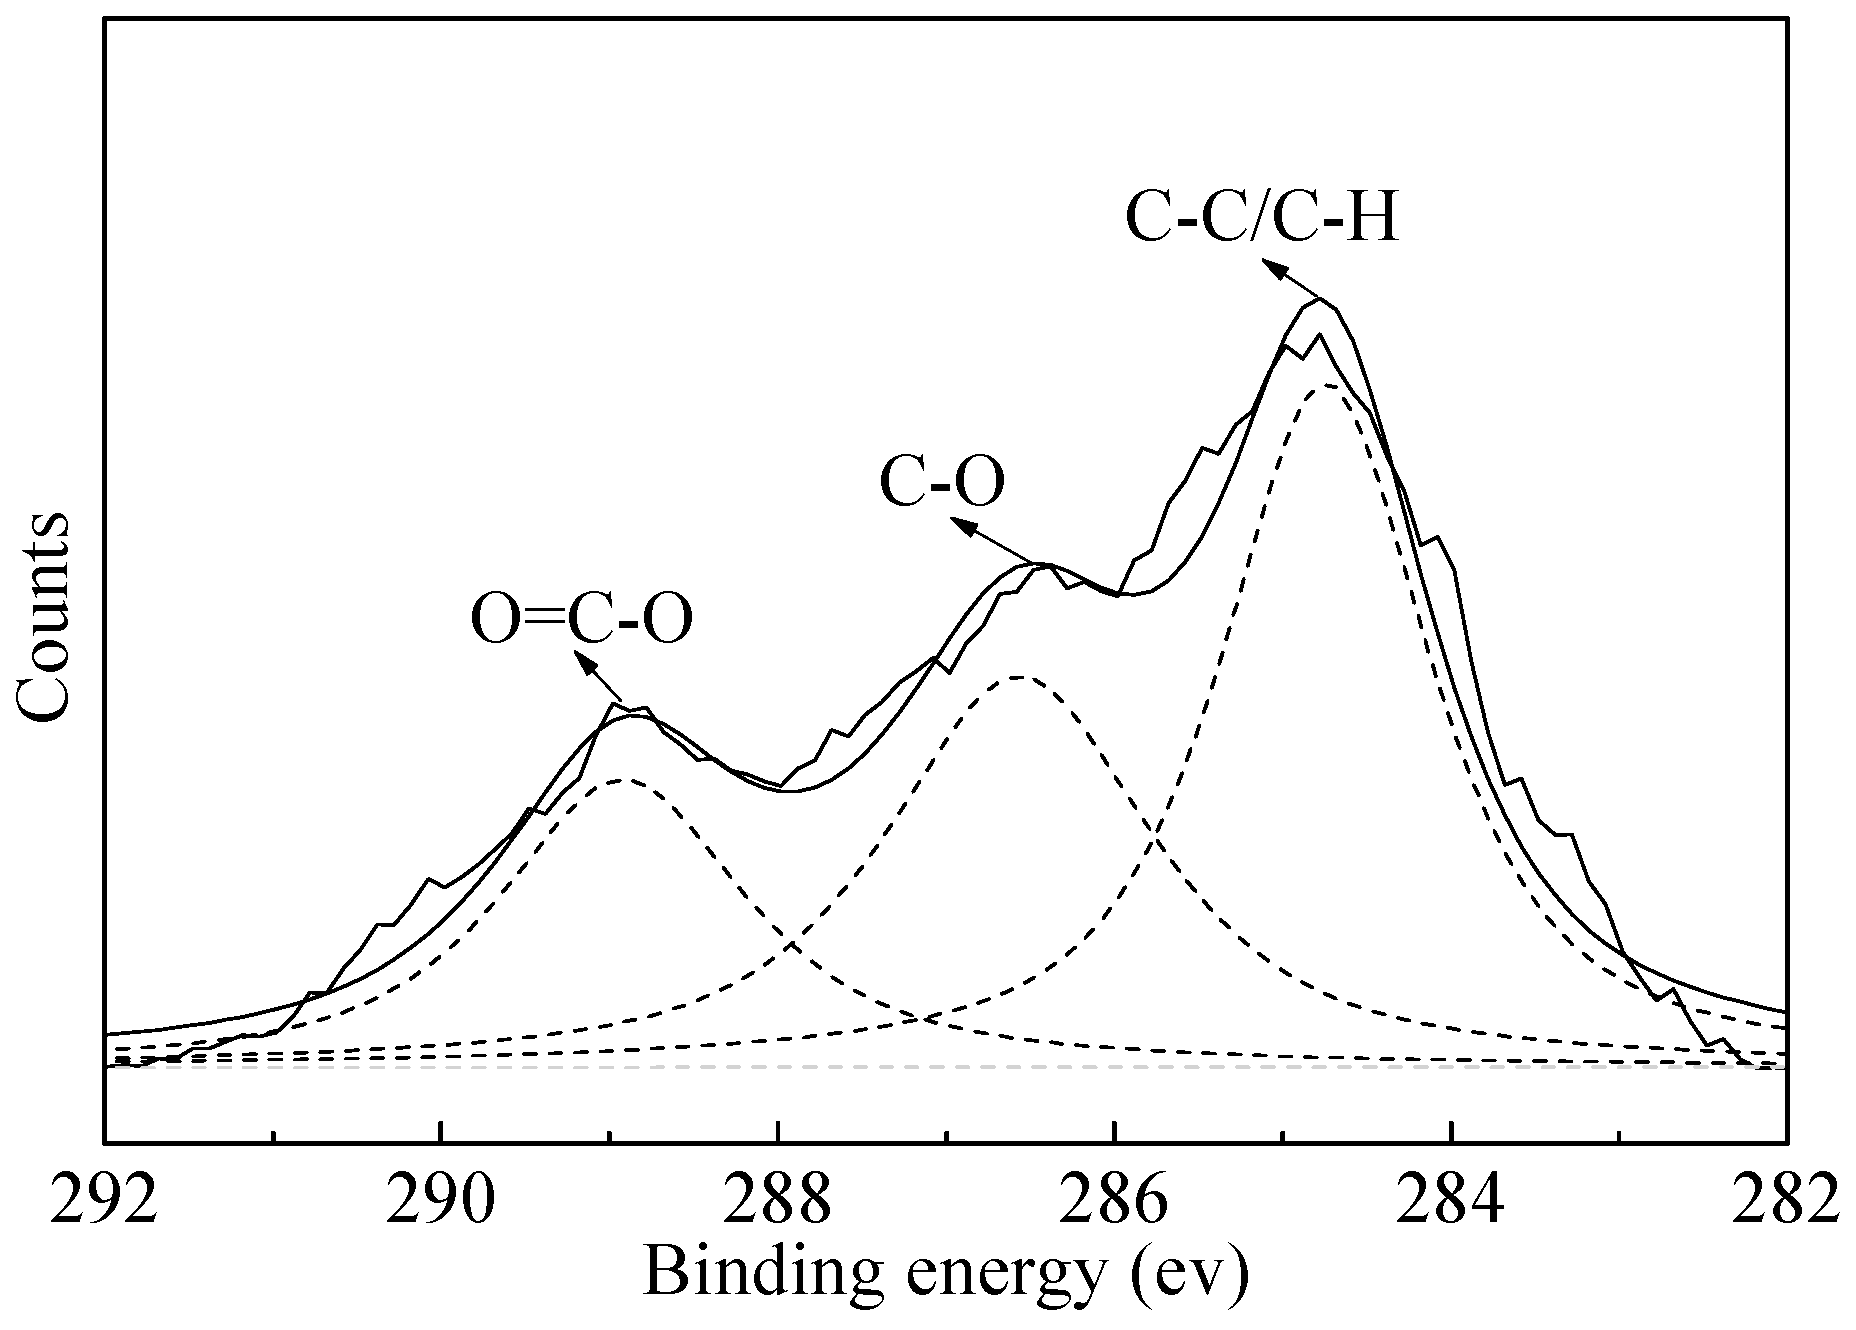
3.2.3. Analysis of Flocculation Mechanism

In order to analyze the selective mechanism of the polymeric flocculant’s adsorption on mineral surfaces, we conducted separate dispersion-selective flocculation tests on the initial concentrate, pure magnetite minerals, and pure quartz. The fineness variations before and after flocculation using a laser fineness analyzer, with results in Figure 11. The magnetite minerals before and after flocculation are rinsed with deionized water for infrared spectral analysis, shown in Figure 12.
As seen in Figure 11, the initial concentrate’s particle sizes show a general trend of increase after flocculation, with the average size increasing by 57.90%, from 24.30 to 38.37 μm. The other minerals also show an increase, with pure magnetite’s average particle size increasing by 79.52% from 12.45 to 22.35 μm, while pure quartz’s average particle increases only by 7.53% from 7.97 to 8.97 μm. This means that while CMS has flocculating effects on both magnetite and quartz, the effect is significantly biased toward magnetite. Thus, the selective flocculation of magnetite is the main cause of the initial concentrate’s fineness increase after flocculation.
Figure 12 shows that the main absorption frequencies for the minerals are: the Fe–O flexural vibration absorption peak at band 1 (471 cm−1) and band 3 (1080 cm−1); the Fe–O stretching vibration peak at band 2 (543 cm−1); the –OH flexural vibration peak at band 4 (1400 cm−1) and band 6 (3445 cm−1); the COO–asymmetrical stretching vibration peak at band 5 (1624 cm−1) [14]. Here, the bands 4, 5, and 6 are absorption peaks of the CMS functional group. Thus, we know that adsorption of CMS had occurred on the surfaces of magnetite particles. The adsorption between organic polymeric flocculants and mineral particles generally depends on electrostatic attraction, van der Waals force and hydrogen bonds. As the magnetite particles in this dispersion condition have negative surface charges, the adsorption with the negative CMS ions should not be caused by electrostatic attraction, but by hydrogen bonding. Since magnetite is less negatively charged than silica (Figure 7), the adsorption of CMS on magnetite by hydrogen bonding would be more favored than that on silica.
To further understand the selective adsorption of CMS, the flocculated initial concentrate was analyzed using XPS (Thermo Electron, Waltham, MA, USA), with results shown in Figure 13 and Figure 14, and Table 3 and Table 4.
Figure 13 and Table 3 show the fitting results for C1s binding energy spectrum. Three main binding energy peaks are found, which are, respectively, the C–C/C–H bond (binding energy 284.73 eV), the C–O bond (binding energy 286.54 eV), and the O=C–O bond (binding energy 288.85 eV). These peaks are not found on pre-flocculation minerals, indicating that adsorption of CMS on concentrate particles had occurred post-flocculation [15], which is consistent with the results of infrared spectral analysis.
Figure 14 and Table 4 show the fitting results for Fe 2p and Si 2p binding energy spectra. Figure 14a shows the XPS-fitted peak for Fe3O4 [16]. For pre-flocculation, the binding energy of Fe 2p is 711.35 eV. After-flocculation, it is 710.78 eV, which shifts 0.57 eV toward decreasing. This may be due to fact that the –OH and –COOH radicals of CMS, which are electronegative, have combined with oxygen atoms on the magnetite surfaces to form hydrogen bonds (O–H...O–Fe), increasing the density of the electron cloud around Fe–O, thereby decreasing the binding energy [17]. Figure 14b depicts the XPS-fitted peak for SiO2, where the binding energy of Si 2p is 102.37 eV pre-flocculation, and 102.29 eV post-flocculation. After flocculation, the binding energy of Si 2p had shifted 0.08eV toward decrease, which is less than a 0.1 eV shift, and smaller than the shift that occurred to Fe 2p.
Overall, the adsorption of CMS on magnetite surfaces cause magnetite particles to aggregate, increasing their sizes, largely due to the formation of hydrogen bonds between –OH and –COOH in CMS and oxygen atoms on particle surfaces. Under the same dispersion conditions, the negative surface charges of quartz particles are stronger, and the hydrogen bond-forming effect was unable to overcome electrostatic repulsion to cause adsorption of negative CMS ions.

4. Conclusions

(1)
The tested magnetite ore from Gansu has a complex composition. It has a total iron grade of 28.36%, with magnetite as its main ferrous mineral, and quartz and feldspar as the main gangue minerals. The magnetite occurs as ultrafine particles, in dissemination or dense dissemination between gangue minerals, with relatively little singular scattered occurrence. The dissemination fineness is −0.038 mm at 90%.
(2)
Through tests, we developed a multi-stage grinding-dispersion-selective flocculation-weak magnetic separation process. The optimum conditions are: 500 g/t sodium hexametaphosphate (SHMP) as dispersant, 750 g/t carboxymethyl starch (CMS) as flocculant, agitated at the speed of 400 rpm for 10 min, using slurry pH of 11, and final grinding fineness −0.03 mm at 93.45%. The tests resulted in a concentrate with iron grade 62.82%, operational recovery rate 88.31%, and total recovery rate 79.12%. Compared to simple magnetic separation, the concentrate’s iron grade had been increased by 1.26 percentage points, and the recovery rate by 5.08%.
(3)
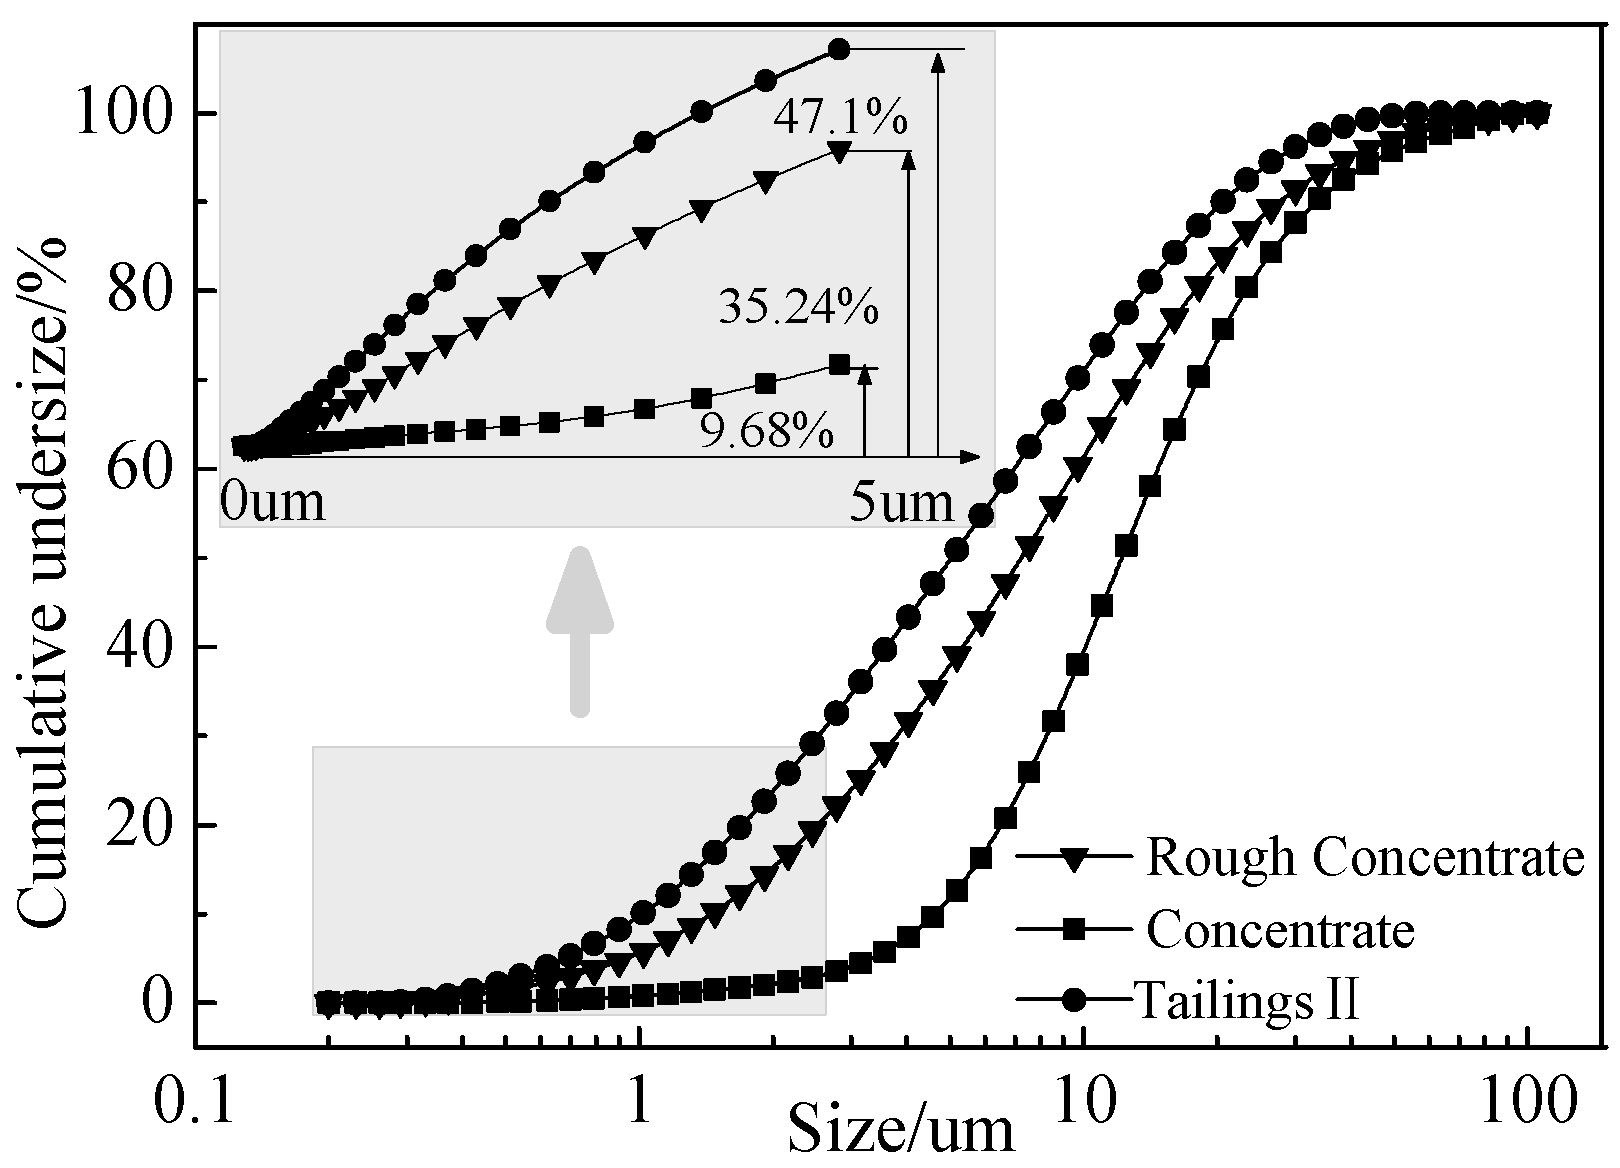
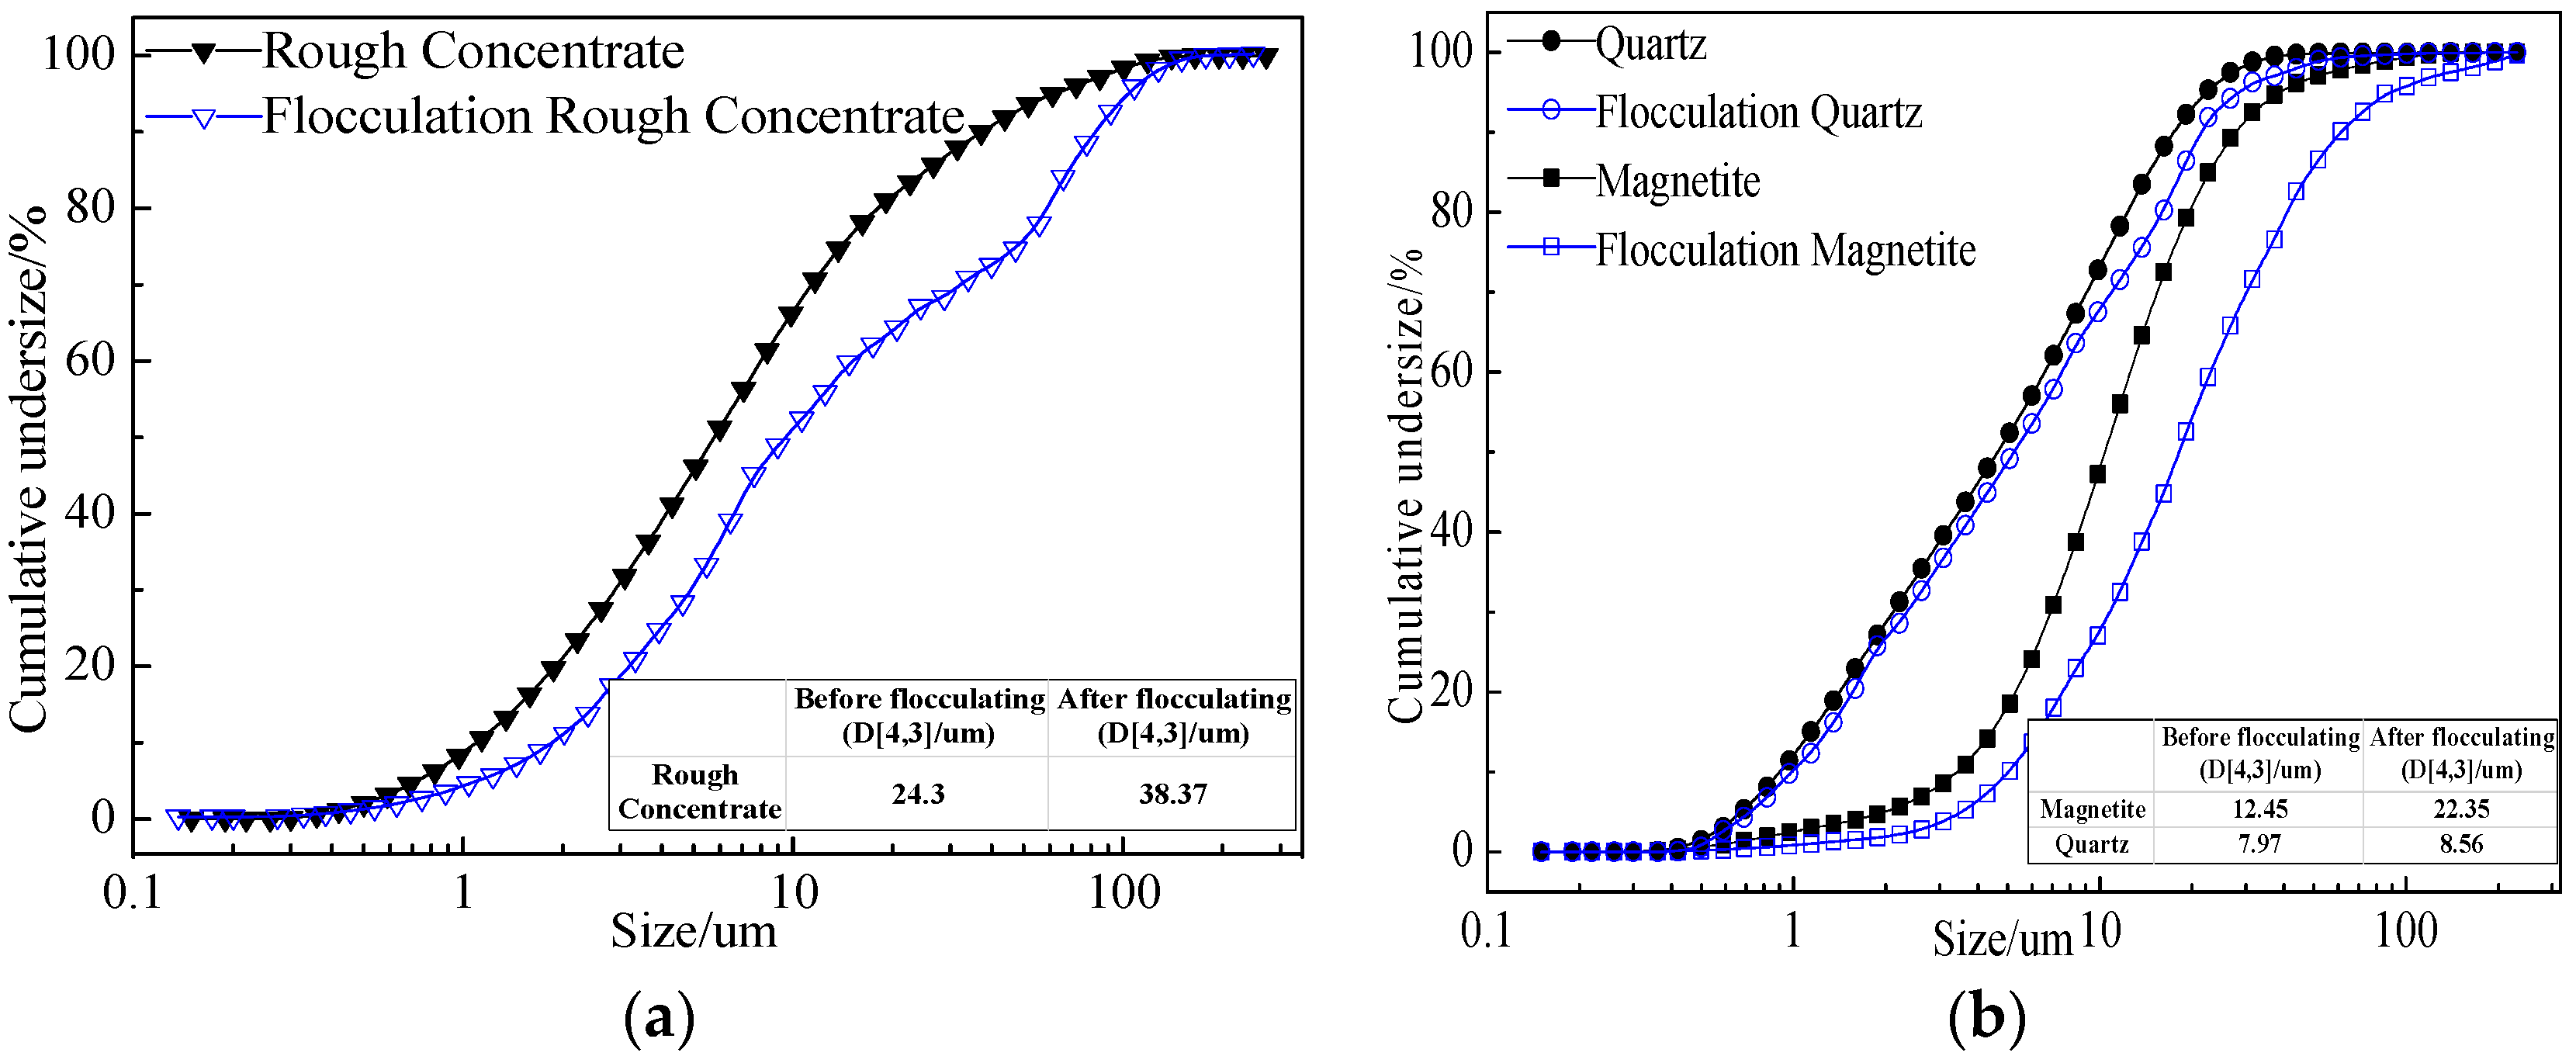
FTIR and XPS analyses show that the negative CMS ions allow selective adsorption on magnetite particle surfaces through hydrogen bonding and electrostatic forces on the surfaces, causing a significant shift of the Fe binding energy; the final particle sizes of post-flocculation concentrate had increased from 24.30 to 38.37 μm. This process has accomplished the goal of selective flocculation, and increased the separation indices.

Author Contributions

Tao Su, Tiejun Chen and Peiwei Hu had the original idea for the study. Tao Su performed the experiments and analyzed the data. Tao Su and Tiejun Chen wrote and edited the initial drafts of the manuscripts, and all authors contributed to reading and approving the final manuscript.

Conflicts of Interest

The authors declare no conflict of interest.

Abbreviations

The following abbreviations are used in this manuscript:
SHMPSodium Hexametaphosphate
SSSodium Silicate
CMSCarboxymethyl Starch
BEBinding Energy

References

  1. Wu, P.; Lv, X.; Qiu, J. Study on the mineral processing of a super low grade and microgranular magnetite ore. J. Mineral. Petrol. 2015, 35, 7–12. [Google Scholar]
  2. Tang, X.; Yu, Y.; Chen, W. Study on rational beneficiation technology of lean iron ore with fine disseminated minerals. Min. Metall. Eng. 2010, 1, 41–43. [Google Scholar]
  3. Su, T.; Chen, T.J.; Zhang, Y.M. The separation study on micro-fine disseminated and low-grade magnetite. Min. Res. Dev. 2015, 35, 38–42. [Google Scholar]
  4. Wei, S.; Sonsie, R.; Forbes, E.; Franks, G.V. Flocculation/flotation of hematite fines with, anionic temperature responsive polymer acting as a selective flocculant and collector. Miner. Eng. 2015, 77, 64–71. [Google Scholar]
  5. Santana, R.C.; Ribeiro, J.A.; Santos, M.A. Flotation of fine apatitic ore using micro bubbles. Sep. Purif. Technol. 2012, 98, 402–409. [Google Scholar] [CrossRef]
  6. Ravishankar, S.A.; Pradip; Khosla, N.K. Selective flocculation of iron oxide from its synthetic mixtures with cays: A comparison of polyacrylic acid and starch polymers. Int. J. Miner. Process. 1995, 43, 235–247. [Google Scholar] [CrossRef]
  7. Weissenborn, P.K.; Warren, L.J.; Dunn, J.L. Selective flocculation of ultrafine iron ore 2. Mechanism of selective flocculation. Colloids Surf. A Physicochem. Eng. Asp. 1995, 99, 29–43. [Google Scholar] [CrossRef]
  8. Abro, M.I.; Pathan, A.G.; Memon, A.R.; Sirajuddin. Dual polymer flocculation approach to overcome activation of gangue minerals during beneficiation of complex iron ore. Powder Technol. 2013, 245, 281–291. [Google Scholar] [CrossRef]
  9. Dogu, I.; Arol, A.I. Separation of dark-colored minerals from feldspar by selective flocculation using starch. Powder Technol. 2004, 139, 258–263. [Google Scholar] [CrossRef]
  10. Liu, C.J. Experiment study on the beneficiation of a micro-fine magnetite ore from Qinghai. Metal Mine 2009, 6, 52–55. [Google Scholar]
  11. Li, S.C.; Zhang, J.X.; Li, Z.H. Experiment study on process mineralogy and beneficiation of micro-fine magnetite ore from Liaoning. Min. Metall. Eng. 2012, 32, 312–315. [Google Scholar]
  12. Arol, A.I.; Aydogan, A. Recovery enhancement of magnetite fines in magnetic separation. Colloids Surf. A Physicochem. Eng. Asp. 2004, 232, 151–154. [Google Scholar] [CrossRef]
  13. Huang, Y.; Han, G.; Liu, J.; Wang, W. A facile disposal of Bayer red mud based on selective flocculation desliming with organic humics. J. Hazard. Mater. 2016, 301, 46–55. [Google Scholar] [CrossRef] [PubMed]
  14. Hui, R.H.; Guan, C.X.; Hou, D.Y. Study on IR characteristics of carboxylic acid and their salts. J. Anshan Teach. Coll. 2001, 3, 95–98. [Google Scholar]
  15. Mikhlin, Y.; Karacharov, A.; Tomashevich, Y. Cryogenic XPS study of fast-frozen sulfide minerals: Flotation-related adsorption of N-butyl xanthate and beyond. J. Electron Spectrosc. Relat. Phenom. 2016, 206, 65–73. [Google Scholar] [CrossRef]
  16. Cai, Y.; Pan, Y.; Xue, J. Comparative XPS study between experimentally and naturally weathered pyrites. Appl. Surf. Sci. 2009, 255, 8750–8760. [Google Scholar] [CrossRef]
  17. Li, S.; Wang, B.; Feng, W. Synchrotron radiation photoelectron spectroscopy study of dextrant-coated Fe3O4 magnetic nanoparticles. Nucl. Technol. 2009, 32, 251–255. [Google Scholar]
Figure 1. Optical microscope images of simples.
Minerals 06 00086 g001
Figure 2. The flow-sheet of process.
Minerals 06 00086 g002
Figure 3. The quantity-quality flow-sheet of simple magnetic separation.
Minerals 06 00086 g003
Figure 4. Scanning Electronic Microscopy (SEM) and Electron Probe Microanalysis (EPMA) analysis on tailings II.
Minerals 06 00086 g004
Figure 5. The particle size distributions of products.
Minerals 06 00086 g005
Figure 6. The effect of dispersants and their amounts.
Minerals 06 00086 g006
Figure 7. Dispersion rate at different slurry pH.
Minerals 06 00086 g007
Figure 8. The zeta potential of magnetite and quartz particles.
Minerals 06 00086 g008
Figure 9. The effects of flocculant types and amounts on concentrate. (a) Iron recovery; (b) Iron grades.
Minerals 06 00086 g009
Figure 10. The effects of agitator speed on concentrate. (a) Iron recovery; (b) Iron grades.
Minerals 06 00086 g010
Figure 11. (a) The particle size distributions of rough concentrate before and after flocculation; (b) The particle size distributions of magnetite and quartz before and after flocculation.
Minerals 06 00086 g011
Figure 12. Infrared spectral analysis.
Minerals 06 00086 g012
Figure 13. C1 XPS of the flocculated initial concentrate.
Minerals 06 00086 g013
Figure 14. Fe 2p3/2 and XPS spectrum before and after flocculation. (a) Fe3O4; (b) SiO2.
Minerals 06 00086 g014
Table 1. Main chemical components of raw ores.
ComponentTFeSiO2Al2O3FeOCaOMgOSP
Amount %28.3643.025.5113.451.672.030.020.26
Table 2. Mineral components of raw ores.
MineralMagnetiteSideriteHematiteQuartzFeldsparDolomiteSericiteAnkeriteCalcite
Amount %33.82.41.528.710.47.83.23.72.7
Table 3. Fitting results for each binding energy peak.
Chemical StateC
C–C/C–HC–OO=C–O
BE (eV)284.73286.54288.85
Table 4. Fitting results for each binding energy peak. a: Binding energy peak after flocculation; b: Binding energy peak before flocculation.
SpeciesFeSi
Fe3O4SiO2
Binding energy (BE) (eV) a711.35102.37
BE (eV) b710.78102.29
Shift (eV)0.570.08

