Article

An Underground Air-Route Temperature Prediction Model for Ultra-Deep Coal Mines

1
College of Mining Engineering, Taiyuan University of Technology, Taiyuan 030024, China
2
College of Safety Engineering, China University of Mining and Technology, Xuzhou 221116, China
3
Department of Mining Engineering, West Virginia University, Morgantown, WV 26505, USA
*
Authors to whom correspondence should be addressed.
Minerals 2015, 5(3), 527-545; https://doi.org/10.3390/min5030508
Submission received: 17 May 2015 / Revised: 31 July 2015 / Accepted: 3 August 2015 / Published: 25 August 2015
(This article belongs to the Special Issue Advanced Underground Mine Ventilation and Monitoring Systems)

Abstract

:
Due to modern mining methods deployed in recent years, production of coal mines has been expanded significantly compared to thirty years ago. As a consequence, the mining depth of coal mines is becoming ever deeper. A common world-wide problem that underground coal mines are currently experiencing is the hazard caused by the underground hot environment, which also promotes a great need of reliable mitigation measures to assist mine operators controlling the heat stress for miners as well as maintaining the normal operation of the mine. In this paper, a model for underground air-route temperature prediction in ultra-deep mines based on previous findings was developed. In developing this model, the idea of heat balance was used to establish the temperature calculation equation. Various underground heat sources (air compress, wall oxidation, underground heat, machinery, etc.) are covered in the model to improve the prediction accuracy. In addition, a PC-based numerical tool was also developed to aid users using such a mathematical model. Finally, a few temperature measurements for an ultra-deep underground coal mine were performed to demonstrate the applicability of the proposed mathematical prediction model.

1. Introduction & Background Information

Mining works over a long period have been going ever deeper for the extraction of mineral resources. One of the serious problems associated with depth is the heat produced as a result of increasing geothermal gradient, air compression, and ground water. According to the Chinese government official report released in 2007 [1], among the state owned coal mines, 28.5% of coal mines in China have a depth over 600 m and from more than 70 mines temperatures in working faces exceed 26 °C and 30 of them are over 30 °C. In addition, the highest temperature in an underground working face can achieve 37 °C [1]. Currently, the depth of a typical coal mine is increasing at a rate of more than 20 m annually in China [2]. The hot environment in deep underground coal mines in China causes serious problems for mine operators. The same thing occurs in other countries as well. For example, the air temperature in western South Africa underground gold mines rises to 50 °C at a depth of 3300 m. The temperature in the Fengyu lead-zinc ore mine in Japan is up to 80 °C at a depth of 500 m [3].
The thermal stress due to the high temperature in deep mines affects not only the health, but also the safety performance of miners. Employees working in deep mines are exposed to a high temperature and coupled with strenuous work causes dehydration. Such working conditions can lead to various levels of heat disorders, including heat cramps, heat exhaustion, heat collapse, and heat stroke. The most serious and dangerous one is heat stroke which can be fatal or cause multiple organ failures. Heat can also affect a worker’s attention, hand-to-eye coordination, mental acuity, and other neurological functions, which contribute to mine accidents [4]. The work efficiency of persons working in a hot, humid working environment is reduced as work must be carried out at a slower pace to avoid the body overheating and additionally, dexterity and coordination, a person’s ability to observe irregular faint optical signs, to stay alert and to make quick decisions are adversely affected by the thermal strain. Studies of a 3-h drilling operation conducted under varying room temperatures show that the best results were achieved at 84 °F (29 °C), and the performance was reduced to 75% capacity at a room temperature of 91 °F (33 °C), to 50% at 96 °F (35 °C), and to 25% at 99 °F (37 °C). The study also shows that the upper limit for the best performance of a novice is 77 °F (25 °C) [5].
A prediction of the underground air temperature is required to make heat control plans effectively and economically. In order to control heat in underground mines, it is important to calculate or estimate the amplitude of the heat flow from each source. The total heat gain will be matched by the air-cooling requirements. From administrative perspectives, the prediction of the underground air temperature will help to make a selection and acclimatization plan for workers working in hot and humid work areas. The South Africa mining industry has made significant progress in reducing the incidence of heat strokes through prior selection and acclimatization of miners. Acclimatization is a long-term adjustment of an individual to stress. An acclimatized person can perform many tasks in a hot and humid work site whereas a non-acclimatized person cannot work. For example, a person should be given enough time to adapt to a hot work site where the wet bulb globe temperature (WBGT) may exceed 79 °F (26 °C). A recommended six-day acclimatization schedule calls for miners to work in a hot work site for 50% of the time on the first work day, and an additional 10% of time on the days that follow the first day [5].
The control of heat in mines can be realized through a combination of ventilation, refrigeration, and cooling. Bossard [6] provided ways to calculate the magnitude of the heat flow gained from heat sources to the mine air in an underground mine. Torres and Singh studied thermal stress and human feelings in underground mining [7]. Cong et al., designed an air cooling system using a low-temperature water spay to control heat hazard in mines [8]. He [3] developed a High Temperature Exchange Machinery System (HEMS) for deep mine heat hazard control under the principle of extracting cold energy from mine water inrush. This cooling system was applied in several deep coal mines in China. It firstly extracts cold energy from mine water inrush to cool working faces; then uses the heat extracted by HEMS to supply heat to buildings and bath water instead of using a boiler. Wang, et al. [9] proposed research to evaluate the thermal status of the human body by considering parameters from both the human body and the surrounding environment. Wagner studied the major methods of cooling deep and ultra-deep mines [10]. His research showed that the deciding factor behind the choice of surface or underground cooling of ventilation air is the auto-compression of ventilation air. The application of chilled service water together with ice slurry was found to be the most cost effective way of mine cooling by Wagner. The amount of water required for mine cooling was reduced by using ice slurry as the cooling medium. Therefore, the cost of pumping water to the underground working faces was reduced.
In summary, the proper prediction of the temperature in underground working environments is significant for mine operation and plays important roles such as:
  • Reasonable assessment of the heat stress for underground miners
  • Proper use of mitigation measures against thermal damages to improve working efficiency;
  • Providing accurate fundamental data for calculating the cooling load once a system is designed;
  • Efficient selection of the cooling medium and reduction of the refrigeration cost;
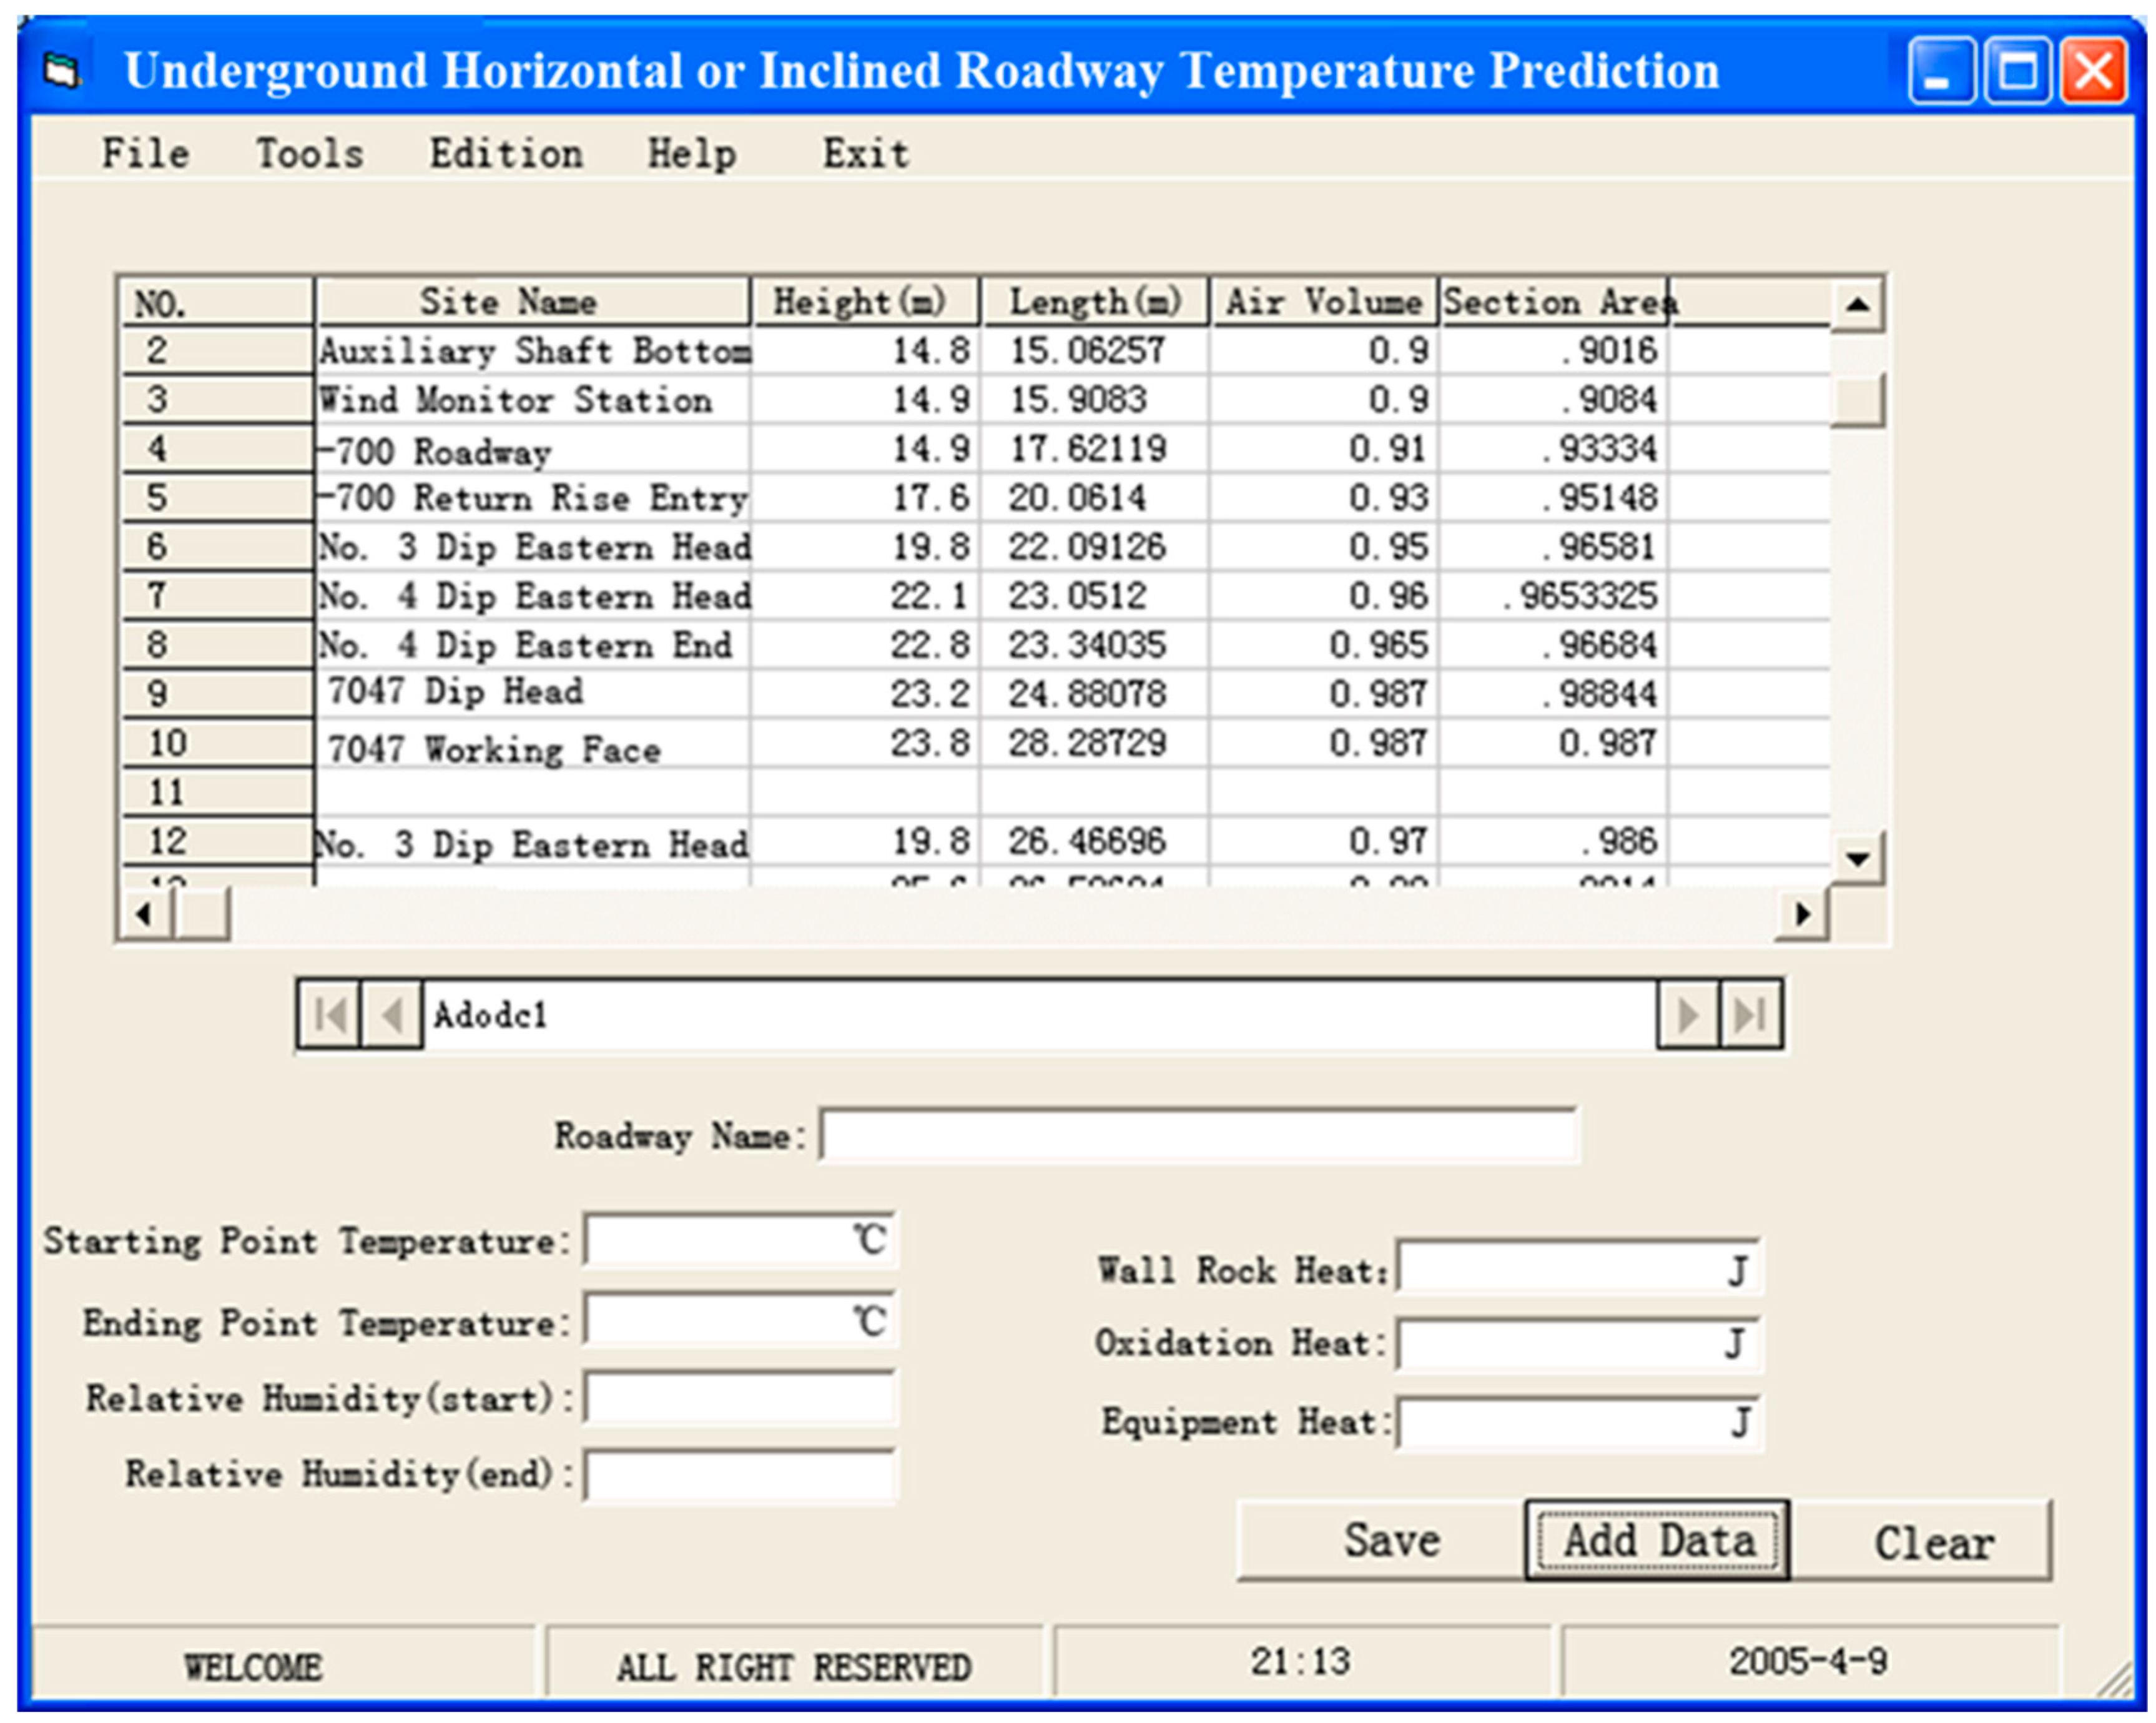
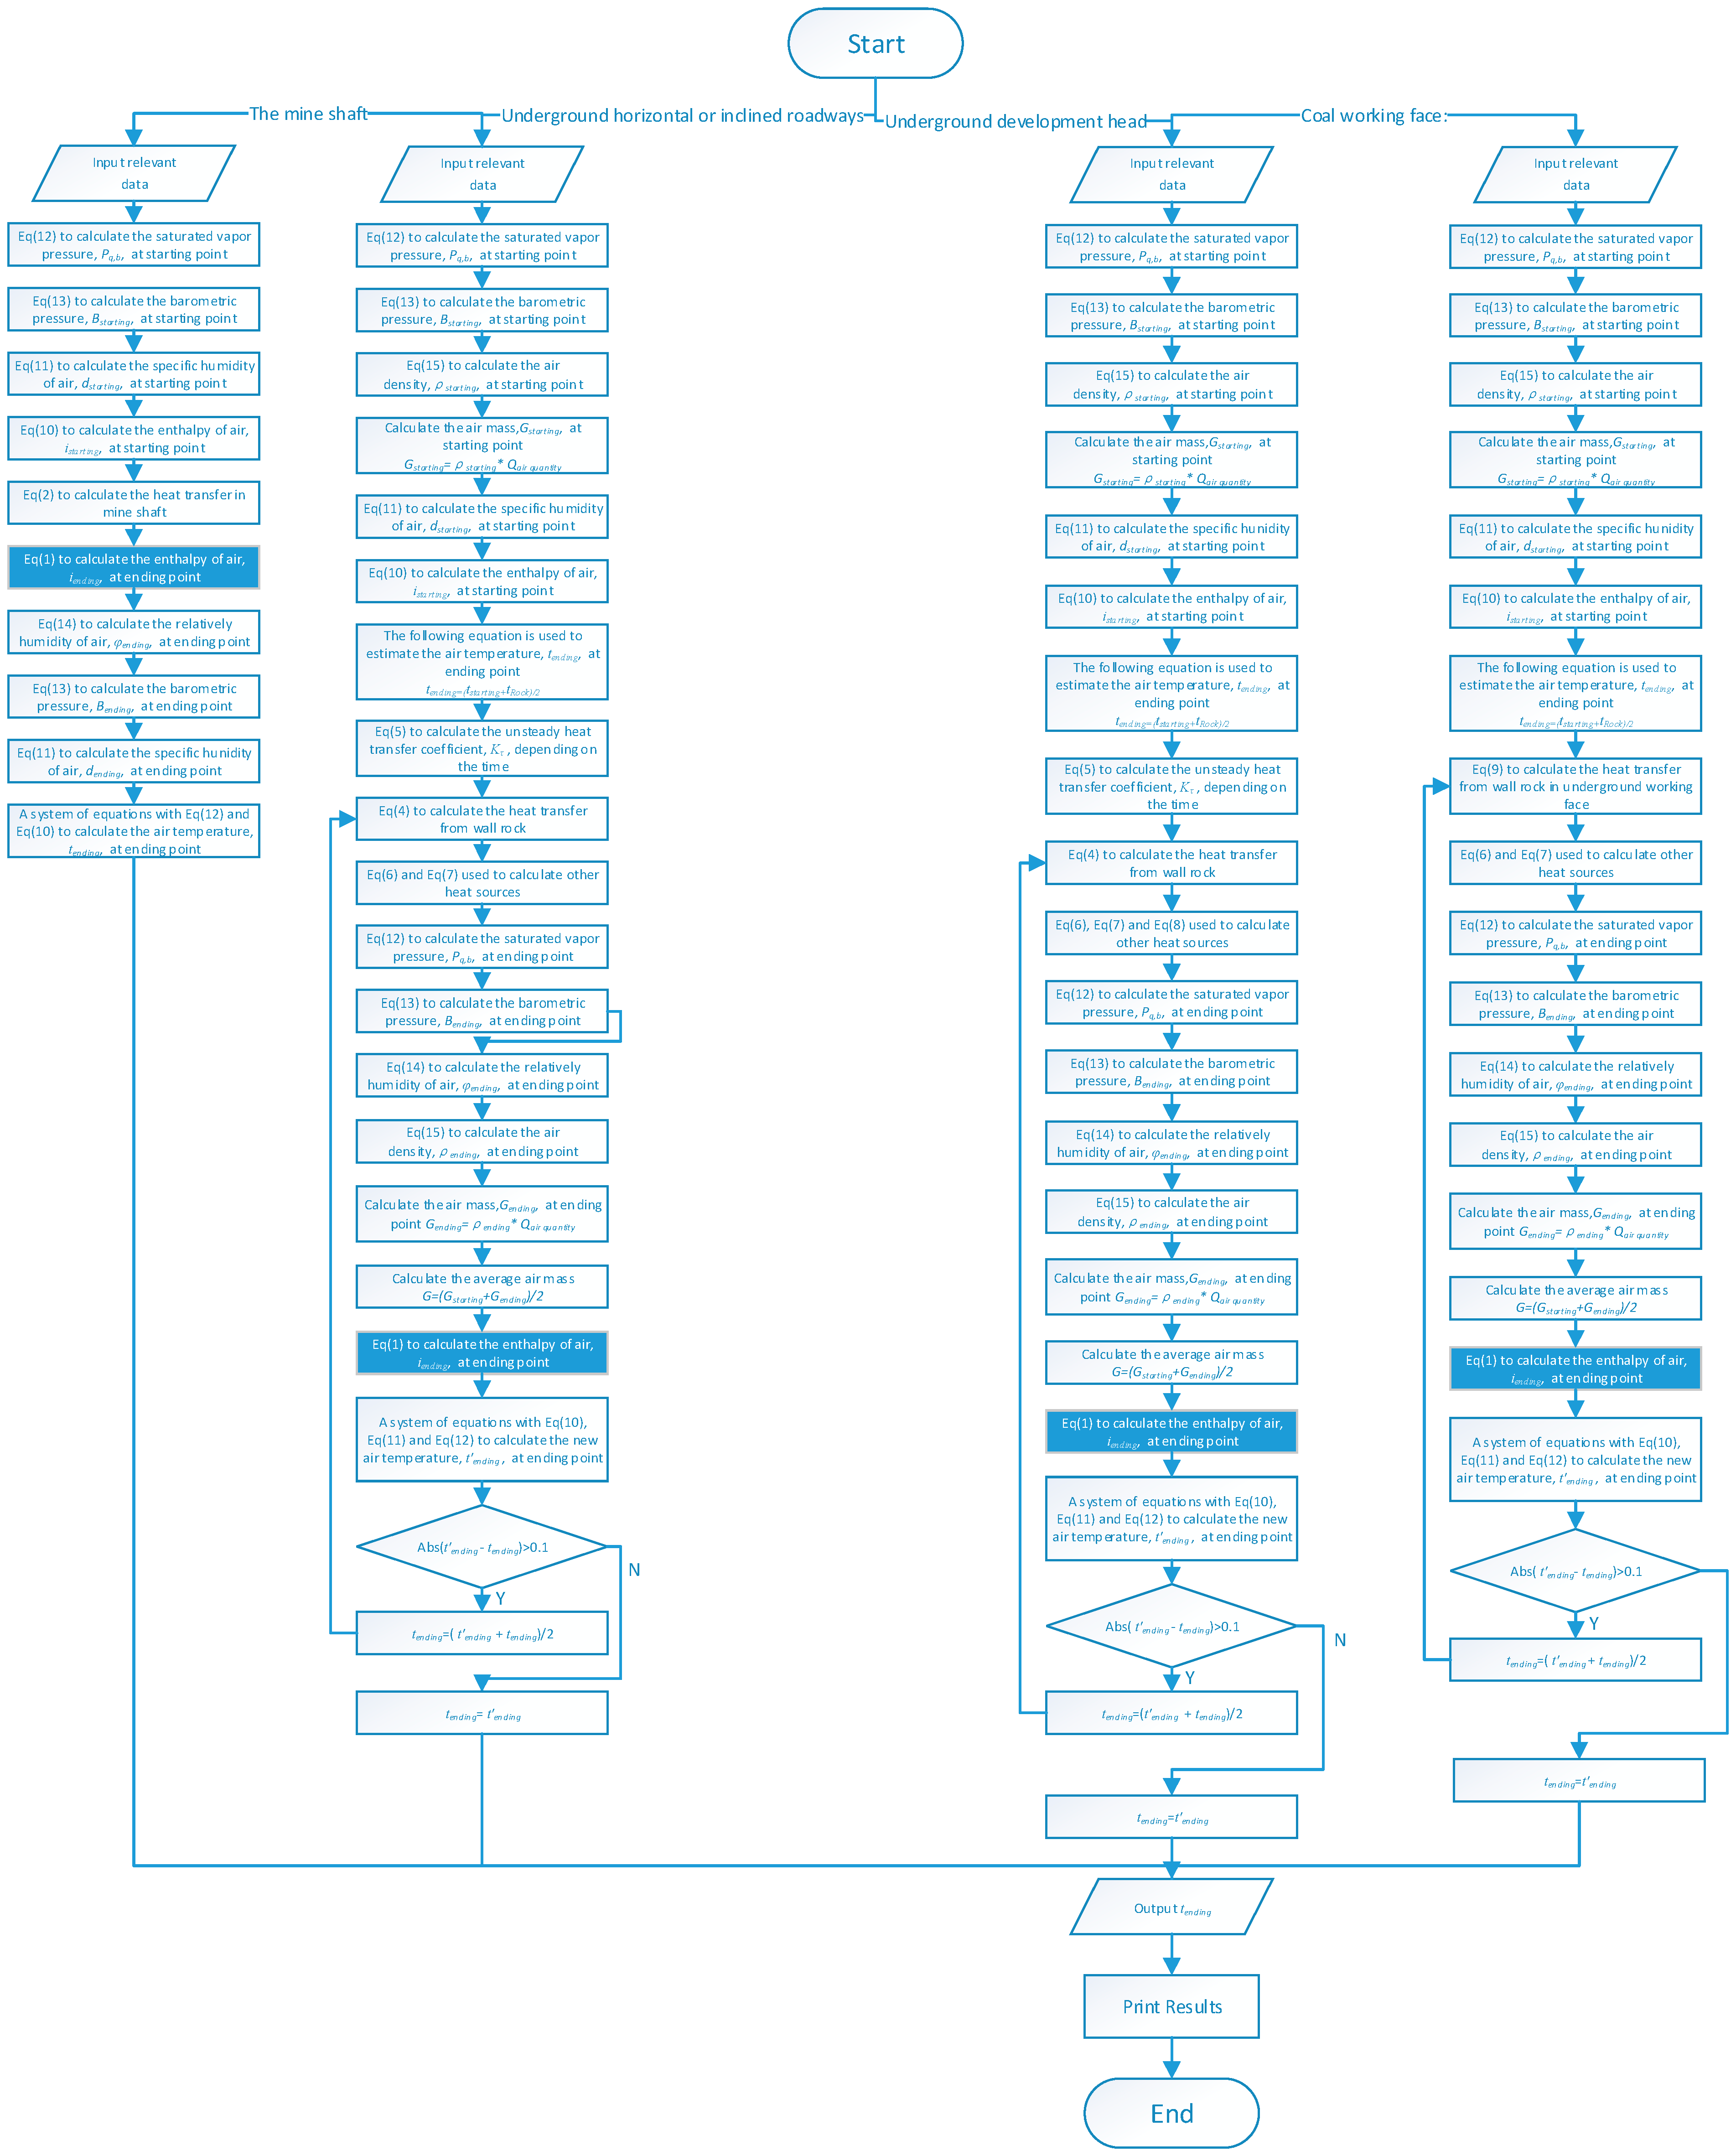
Therefore, to have better heat control in underground mines, accurate air temperature is the key for mine operators. Due to the complex environmental conditions in underground mines, the air temperature varies in deep mines due to several types of heat transfer processes. In this paper, a model for predicting the underground air-route temperature for ultra-deep mines based on previous findings is developed. In addition, a numerical tool is also developed to facilitate the calculations. The following sections start by introducing the basic mathematical models which make up the backbone of the computer program. Then, the flowchart is described and a user-interface is developed for implementing the algorithm. Finally, a comparison with the measured data shows that this model has a wide applicability and could be applied in operations.

2. The Mathematical Model

2.1. Overview of Underground Heat Sources

Major heat sources in underground mines which are capable of modifying the environment conditions include: Auto-compression, wall rock, underground water, machinery, and light. Other potential sources of heat in mines include human metabolism, oxidation, blasting, rock movement, and pipelines [11].

2.1.1. Auto-Compression

When air flows from the surface down a mine shaft, it is compressed and heated in the same way as occurs in a compressor. Auto-compression occurs when the potential energy is converted to thermal energy [11]. The temperature increase due to auto-compression can be up to 10 °C per kilometer of vertical depth, whether in a shaft or in a decline [12]. The heat from air auto-compression would be more significant in deeper mines as it increase with the vertical depth. Also it is obvious that mines sunk in hot areas are hot work sites due to the effect of hot surface air combining with the auto-compression.

2.1.2. Wall Rock

The underground mines at deeper depth encounter hotter levels of the earth crust due to the geothermal gradient. The geothermal gradient of the upper crust is generally between 15 and 40 °C/km [12]. The temperature difference between rock and air cause the heat flow from rock to air, which is the major source of the heat source in underground mines. A survey has shown that in deep mines, heat transfer from the rock mass contributes more than 75% of total mine heat load [10]. The heat transfer rate is primarily dependent on the thermal properties of rock and the temperature difference between the rock and air. Another key factor is moisture as moisture lowers heat transfer resistance at the interface and lowers air dry-bulb temperature [11].

2.1.3. Underground Water

There are two different water sources encountered in underground mines: ground water and mine water. The water temperature approaches or even exceeds that of the rock as water and heat are derived from the surrounding rock or geothermal sources [11]. The heat transfer from water to mine air is mainly through evaporation, which increases the latent heat of the air.

2.1.4. Machinery and Lighting

Nearly all the energy consumption of machinery underground adds heat to the mine air. The power losses and most of the work done are converted directly to heat or indirectly through friction [11]. The commonly used power equipment in mines is electrical, compressed-air, or internal-combustion (diesel) machinery. The heat produced by diesel powered equipment is equivalent to about 90% of the calorific value of the total fuel consumed. The electrical substations, fans, and non-submersible pumps all dissipate a portion of the electrical energy supplied to them as heat to the mine air. Almost all of the power of the conveyor belts is consumed in overcoming friction between the belts and moving material on the horizontal. The heat of friction is transferred to the mine atmosphere [6].

2.2. Assumptions Made in the Model

The following assumptions were made in developing the underground air-route temperature prediction program model:
(1)
The shape of all underground roadways is assumed to be circular;
(2)
The underground rock is isotropic homogenous material;
(3)
Compared to the radial temperature gradient, the axial temperature gradient can be negligible in rock;
(4)
A uniform air temperature distribution is assumed on the same cross section of roadway;
(5)
The virgin-rock temperature is assumed be uniform everywhere at the same elevation;
(6)
There is no air-leakage occurring underground, which means travelling air volume quantity is conserved anywhere within a specified tunnel.

2.3. Descriptions of Mathematical Model

When surface air is introduced into a mine, both the temperature and humidity are affected. The contributing factors include:
(7)
Variations of temperature and humidity on the surface;
(8)
Heat and water exchange between the surrounding rock of mine and ventilation air;
(9)
Air auto-compression heat;
(10)
Oxidation heat from ore body, coal, and timbers;
(11)
Heat from electrical and mechanical equipment and other sources.
Within these influence factors, the first one can be observed with the aid of historical data. The third, fourth and fifth heat sources are nothing to do with the air temperature. Hence, they are easily calculated. The second heat source is related to the temperature and the humidity of the ventilation air. It may bring some difficulties when deriving results.
According to the law of heat conservation, the heat change of ventilation air in an underground tunnel should be equal to the summation of external heat changed over a period of time. The setup of the mathematical equation is:
Q = G ( i 2 i 1 )
where Q is the summation of heat generated within a specified underground tunnel, J/h; G is the ventilation air mass, kg/h; i1 and i2 are the enthalpy of air when inflowing and outflowing from the specified underground tunnel.
Generally speaking, once the initial condition is known, i2 can be calculated by Equation (1). In addition, the air temperature can be determined by using thermodynamics equations. Hence, it can be seen that the fundamental of air temperature prediction is to establish a quasi-steady heat transfer and balance the equations.

2.4. Heat from the Mine Shaft

Very similar to the way in which gas in a compressor responds, air entering a mine through a shaft is compressed and heated as it flows downward. Air auto-compression occurs when potential energy is converted to thermal energy [11]. However, on considering the interchange of heat and water content in the shaft, the temperature may not increase at 1 °C/100 m as for theoretical calculations [13]. Therefore, based on observation statistics in some Chinese mines, the following equation was used to calculate the heat due to the compression:
Q S h a f t = 0.976 G ( 273 + t 1 ) [ ( 1 + 0.0124 h 101.325 + 0.012 H ) 0.286 1 ]
where: QShaft is the heat transfer in the mine shaft, J/h; G is the ventilation air mass, kg/h; t1 is the air temperature at the surface, °C; h is the height of the mine shaft, m. H is the elevation of the mine shaft head, m.

2.5. Heat from Wall Rock

The temperature of subsurface rock rises steadily with depth. The so-called virgin-rock temperature is the most important factor affecting the subsurface temperature. It keeps at a constant value between about 15–50 m beneath the surface. Then, it increases with depth at approximately a uniform rate (or geothermal gradient). The virgin-rock temperature can be calculated as:
t R o c k 1 = t R o c k 0 + H R o c k 0 H R o c k 1 G R
where: tRock–1 is the virgin-rock temperature at subsurface elevation point 1, °C; tRock–0 is the constant temperature beneath the surface, °C; HRock–0 is the elevation for constant temperature, m; HRock–1 is the elevation at subsurface elevation point 1, m; GR is the geothermal gradient, m/°C.
After opening roadways underground, due to the temperature difference between the virgin-rock and airflow, heat transfer from the wall rock to the ventilation air occurs. However, this process is not only unsteady but also complex. The amount of heat transferred is highly dependent on ventilation time, rock properties, etc. By applying thermodynamic analyses, the following equation is used to calculate the heat transfer [13]:
Q R o c k = k τ U L ( t ¯ R o c k t ¯ A i r )
where: QRock is the heat transfer from the wall rock to ventilation air in unit time, J/h; kτ is the unsteady heat transfer coefficient, J/(m2·h·°C); The value of kτ is highly dependent on the ventilation time and can be determined by Equation (5); U is the perimeter of the underground roadway, m; L is the length of underground roadway, m; t ¯ R o c k is the average virgin-rock temperature at the beginning and end of the roadway, °C; t ¯ R o c k is the average air temperature at the beginning and end of the roadway, °C.
To justify the unsteady heat transfer coefficient kτ, depending on the ventilation time, it can be determined as:
K τ = { 1 1 + λ g 2 α R . [ λ g 2 R + b 2 τ ( 1 + λ g 2 α R ) ]   0.5 λ g 0.65 ( C g γ g ) 0.2 α 0.15 R 0.4 τ 0.2       When the ventialtion time is less than 10 years         When the ventialtion time is more than 10 years
where: kτ is the unsteady heat transfer coefficient, J/(m2·h·°C); λg is the coefficient of rock thermal conductivity, J/(m·h·°C); α is the heat transfer coefficient of wall rock, J/(m2·h·°C); it can be calculated as α =  2 ε G 0.8 U 0.2 S , where ε is the roughness of rock wall; G is the ventilation air mass, kg/h; U is the perimeter of underground roadway, m; S is the cross-sectional area of underground roadway, m2; R is the hydraulic radius of underground roadway, m; R = 0.564 S ; b is rock heat storage coefficient, J/(m2·h0.5·°C); b = 2 λ g C g γ g ε , where Cg is the rock specific heat, J/(kg·°C); γg is the rock density, kg/m3; τ is the ventilation time, hours.

2.6. Heat from Roadway Wall Oxidation

Oxidation processes involving the mineral, backfill, and timber oxidized with oxygen in mines could contribute heat to the mine air [11]. It can be a very important source of heat [14]. The heat amount for the oxidation, which is considered for the wall oxidation process, can be calculated by:
Q O x i d a t i o n = U L q W a l l
where: QOxidation is the oxidation heat transfer from the wall, J/h; qWall is the coefficient wall oxidation of heat transfer, J/(m2·h); Table 1 lists the values for different types of roadways; U is the perimeter of the underground roadway, m; L is the length of the underground roadway, m.
Table 1. Recommended values for different qWall.
Roadway TypeqWall J/(m2·h)
Mine working face6.28 × 104
Intake or return of working face1.46 × 104
Rock drift or rock roadway support by roofbolts or shotcrete1.57 × 104
Mine mains or coal drift2.72 × 104

2.7. Heat from Underground Machinery

Underground machinery, such as the working face shear, belt conveyor, etc. can convert electrical power into heat. Then the air temperature could be increased. Calculation of the heat gain from machinery proceeds from a knowledge of the total power and load factors, which are listed as:
Q M a c h i n e r y = ϕ 1 ϕ 2 ϕ 3 τ R A 24 N
where: QMachinery is the heat generated from machinery, J/h; ϕ1 is the installation factor (ratio of motor maximum consumption power to rated power), usually taken around 0.7; ϕ2 is the simultaneous factor (ratio of summation of used motor rated power to the total rated power); ϕ3 is the load factor, usually taken around 0.4–0.5; τR is the machinery running time per day, h/d; A is the conversion factor, A = 3.6 × 10⁶ J/h; N is the machinery rated power, kW.
The equation to calculate the heat generated by an auxiliary fan in an underground mine development head is:
Q A . F a n = 80 G P F η M η F
where: QA.Fan is the heat generated from the auxiliary fan, J/h; GAir is the ventilation air mass, kg/h; PF is the auxiliary fan working pressure, Pa; ηM is the motor efficiency; ηF is the fan efficiency.

2.8. Heat from Wall Rock in Underground Working Face

The heat from wall rock in an underground working face is similar to the heat from wall rock in a normal roadway. Hence, a similar equation is used to calculate the heat:
Q W . F a c e = α F U w L w ( t ¯ R o c k t ¯ A i r )
where: QW.Face is the heat transfer from the wall rock around the working face to ventilation air in unit time, J/h; αF is the heat transfer coefficient of wall rock around the working face, J/(m2·h·°C); it can be calculated as αF = 5.3 + 3.6v, where v is the air velocity at the working face, m/s; Uw is the perimeter of the working face, m; Lw is the length of the working face, m; t ¯ R o c k is the average virgin-rock temperature at the beginning and end of the working face, °C; t ¯ A i r is the average air temperature at the beginning and end of the working face, °C.

2.9. Temperature Calculation Using Thermodynamic Equations

The enthalpy of air, which is the sum of the enthalpies of dry air and water vapor, can be expressed as:
i = 1.005 t + 0.001 d ( 25016 + 1.884 t )
where: i is the enthalpy of moist air, Kg/m3; t is the temperature, °C; d is the specific humidity, kg/kg;
The equation of specific humidity (weight of water vapor contained per unit weight of dry air) can be calculated as:
d = 0.622 φ P q , b B φ P q , b
where: d is the specific humidity of moist air, kg/m3; B is the barometric pressure, Pa; φ is the relatively humidity, %; Pq,b is the saturated vapor pressure, Pa.
The saturation vapor pressure Pq,b is the pressure of a vapor when it is in equilibrium with the liquid phase. It is solely dependent on the temperature. The empirical equation to calculate Pq,b is shown as (when the temperature is between 0–200 °C):
P q , b = exp ( C 1 T + C 2 + C 3 T + C 4 T 2 + C 5 T 3 + C 6 l n ( T ) )
where: Pq,b is the saturated vapor pressure, Pa; T is the absolute temperature, K; C1–5 are coefficients, which are equal to −5800.2206; 0.41764768 × 10⁻⁴; 1.3914993; −0.14452093 × 10⁻⁷; −0.04860239 and 6.5459673, respectively.
The barometric pressure at an elevated underground level can approximately be estimated as:
B = 101325 ( 1 + H 44300 ) 5.256
where: B is the barometric pressure, Pa; H is the elevation below the seal level, m.
The relatively humidity relationship between two points is:
φ 2 = φ 1 + k φ L 1 2
where: φ1 and φ2 are the relatively humilities at point 1 and 2, %; L1–2 is the distance between two points, m; kφ is the relatively humidity gradient, 1 m . The value of kφ is highly dependent on the underground environmental condition. In most cases, it can be determined by field measurements or historical statistics.
Density of moist air can be calculated by Equation (15):
ρ= 0.00348 B T 0.001315 φ P q , b T
where: ρ is the density of moist air, kg/m3; T is the absolute temperature, K; B is the barometric pressure, Pa; φ is the relatively humidity; Pq,b is the saturated vapor pressure, Pa.

3. Calculations Strategies for Different Underground Roadways

Underground roadways are connected with each other to form a network. Different roadways serve different functions in coal mining production. In consideration of heat source distribution in the subsurface and of the characteristics that underground roadways possess, the following four conditions can be identified:
  • The mine shaft: it is a very unique tunnel for underground coal mining because the spatial form of it is vertical. Generally, comparing to the great number of underground roadways that a mine has, there may only be a few shafts serving for hoist and ventilation purposes. The biggest heat sources for the shaft are the heat from wall rock and air auto-compression. However, due to watering, the heat from wall rock is used up by a water evaporation process. Hence, air auto-compression is the only significant heat source.
  • Underground horizontal or inclined roadways: There are several heat sources that can affect the air temperature increasing, which include heat from wall rock, underground water, oxidation, machinery, air compression, etc. In most cases, only the heat from wall rock and wall oxidation are important factors [15]. Therefore, these two are considered in this program model.
  • Underground development head: this roadway is similar to the above one. However, the major difference is its dead-end opening. Artificial ventilation must be applied in order to circulate the air for diluting contaminants. Hence, an auxiliary fan is used and the heat generated by fan must be considered.
  • Coal working face: The coal is cut by a longwall shearer in this roadway. Once the coal contacts oxygen, the oxidation process can bring an amount of heat. In addition, the shearer, conveyor or other electrical equipment can also be heat sources to increase the air temperature.

4. Algorithm Implementation

4.1. States of the Numerical Tool

In order to avoid time-consuming and tedious calculation work, a feasible computer program needs to be developed. With the help of using Visual Basic computer language, the authors computerized the mathematical model into an underground air-route temperature prediction software program. Users can easily input the data into the featured visualized program interface. Then, the calculation can be automatically performed and the finial prediction results can be outputted in tabular format and exported into a Microsoft Excel spreadsheet. Figure 1 shows the screenshot of the main interface of the underground temperature prediction program.
When the program is run, the main interface is shown as below:
Figure 1. Main interface of underground temperature prediction program.
Minerals 05 00508 g001

4.2. The Flow Chart

As mentioned in “Calculations Strategies” in the previous section, different types of underground roadways may consider different underground heat sources. Hence, different calculation procedures should be implemented. In the developed underground air-route temperature prediction program, four types of underground roadways have been organized, which are the mine shaft, the underground horizontal or inclined roadway, the underground development head and the coal working face. A corresponding flow chart of the program is listed as in Figure 2. It can be seen that the trial-and-error method is used in the program. The temperature prediction result could be outputted once convergence is met.
Figure 2. Calculation flow chart of the program.
Minerals 05 00508 g002

5. Application Case Study

5.1. Information about a Typical Coal Mine

To examine the reliability of the developed mathematical model and developed software program, a typical ultra-deep underground mine was chosen as the study problem. This mine is located in the central part of China. The geology survey shows that the constant temperature of the subsurface rock is 16 °C with a depth of 30 m. The average geothermal gradient of the coal mine is 3.24 °C/100 m. Currently, the mining production elevation level is −700 m. Field measurement of the rock virgin temperature is already as high as 37.70 °C. In addition, the next production level is planned at −980 m. It can be seen that such a high temperature environment could bring serious problems to miners’ health and safety as well as production efficiency.

5.2. Air-Route Descriptions and Graphical Representation

In this study, a total of three air-routes were chosen to validate the reliability of the prediction results. In Figure 3, the distribution of prediction points is presented. The routes are designed by following the air flow direction until the end including the underground working face and development head, which is described as:
  • Rout <1>: 1 (Surface) → 2 (Mine shaft bottom) → 3 (Airflow observation station) →4 (−700 North level airflow split point) →11 (−700−4 level roadway) → 12 (−700−4 level roadway) → 13 (7407 air-intake entry) → 14 (7407 working face head ) → 15 (7407 working face end)
  • Rout <2>: 1 (Surface) → 2 (Mine shaft bottom) → 3 (Air measuring station) →4 (−700 level airflow split point) → 21 (−700−3 level roadway) → 22 (−700−3 level roadway) → 23 (−700−3 level roadway) → 24 (7301 air-intake entry) → 25 (7301 working face head ) → 26 (7301 working face end)
  • Rout <3>: 1(Surface) →2 (Mine shaft bottom) → 3 (Air measuring station) → 31 (−700 South level airflow split point) → 32 (−700 level roadway) → 33 (−700 level roadway)→ 34 (Dip head entry in south area) → 35 (Dip head entry in south area) → 36 (Mine development head)
Figure 3. The prediction route and distribution of measurement points.
Minerals 05 00508 g003

5.3. Prediction Results and Comparisons

Table 2, Table 3 and Table 4 list the input parameters when using the computer program to calculate the predicted air temperature at each prediction point for the three routes. Table 5, Table 6 and Table 7 show the derived results from the computer program. In addition, in order to check the calculation reliability, the in-mine field temperature measurements are also included for comparison reasons. Figure 4 shows the calculated difference between predicted and field measured temperature. It can be seen that the biggest difference is 1.1 °C. Most results agree well with one other. Hence, this mathematical model has better accuracy and reliability.
Table 2. Input parameters for route <1>.
No.Parameter NamesSymbol in EquationsUnit12341112131415
Site Name
Mine ShaftMine Shaft BottomAirflow observation Station−700 North Level Airflow Split Point−700−4 Level Roadway−700−4 Level Roadway7407 Air-Intake Entry7407 Working Face Head7407 Working Face End
Parameter Values
1Ventilation air massGkg/h8185--------
2Coefficient of rock thermal conductivityλgJ/(m·h·°C)9627753498369836983698369836987987
3Toughness of rock wallεmm11.51.51.51.51.52.02.53.0
4The perimeter of underground roadwayUm32.112.510.110.19.69.68.713.213.2
5The cross-sectional area of underground roadwaySm219.515.312.612.611.811.810.915.215.2
6The rock specific heatCgJ/(kg·°C)83782685285285285285210461046
7Rock densityγgkg/m3170926522567256725672567256715681568
8Ventilation timeτyear15.614.813.85.64.82.81.811
9The length of underground roadwayLm7801012045016025160360167
10Coefficient wall oxidation of heat transferqWallJ/(m2·h)2.8 × 1041.3 × 1041.3 × 1041.7 × 1041.7 × 1041.9 × 1042.3 × 1045.77.2 × 104
11machinery running time per dayτRh/d---16--161616
12Machinery rated powerNkw 1251261300
13Air quantityQm3/min678949564985258422362156171616001600
14Air velocity in working facevm/s--------3.5
15Absolute elevationHm−710−710−705−708−715−715−709−712−713
Table 3. Input parameters for route <2>.
No.Parameter names in EquationsSymbolUnit1234212223242526
Site Name
Mine ShaftMine Shaft BottomAirflow Observation Station−700 North Level Airflow Split Point−700−3 Level Roadway−700−3 Level Roadway−700−3 Level Roadway7301 Air-Intake Entry7301 Working Face Head7301 Working Face End
Parameter Values
1Ventilation air massGkg/h8185---------
2Coefficient of rock thermal conductivityλgJ/(m·h·°C)96277534983698369836983698369836987987
3Toughness of rock wallεmm11.51.51.51.51.52.02.02.53.0
4The perimeter of underground roadwayUm32.112.510.110.19.69.68.78.713.213.2
5The cross-sectional area of underground roadwaySm219.515.312.612.611.811.810.910.915.215.2
6The rock specific heatCgJ/(kg·°C)83782685285285285285285210461046
7Rock densityγgkg/m31709265225672567256725672567256715681568
8Ventilation timeτyear15.614.813.85.65.13.81.91.911
9The length of underground roadwayLm780101203704601326060286163
10Coefficient wall oxidation of heat transferqWallJ/(m2·h)2.8 × 1041.3 × 1041.3 × 1041.7 × 1041.7 × 1041.9 × 1042.3*1042.3 × 1045.7 × 1047.2 × 104
11machinery running time per dayτRh/d---16--16161616
12Machinery rated powerNkw 1251251261300
13Air quantityQm3/min6789495649852401215920131517151714001400
14Air velocity in working facevm/s---------3.5
15Absolute elevationHm−710−710−705−708−718−718−720−720−723−723
Table 4. Input parameters for route <3>.
No.Parameter NamesSymbolUnit123313233343536
Site Name
Mine ShaftMine Shaft BottomAir Measuring Station−700 South Level Airflow Split Point−700 Level Roadway−700 Level RoadwayDip Head Entry in South AreaDip Head Entry in South AreaMine Development Head
Parameter Value
1Ventilation air massGkg/h8185--------
2Coefficient of rock thermal conductivityλgJ/(m·h·°C)9627753498369836992699269926997997
3Toughness of rock wallεmm11.51.51.51.52.03.03.55.0
4The perimeter of underground roadwayUm32.112.510.19.69.68.78.76.26.2
5The cross-sectional area of underground roadwaySm219.515.312.611.811.810.910.99.49.4
6The rock specific heatCgJ/(kg·°C)83782685285285285285210461046
7Rock densityγgkg/m3170926522567256725672567256715681568
8Ventilation timeτyear15.614.813.83.11.81.10.80.50.2
9The length of underground roadwayLm78010120252601202606010
10Coefficient wall oxidation of heat transferqWallJ/(m2·h)2.8 × 1041.3 × 1041.3 × 1041.7*1041.9*1042.3 × 1042.3 × 1045.7 × 1048.2 × 104
11machinery running time per dayτRh/d-------1616
12Machinery rated powerNkw-------126120
13Air quantityQm3/min678949561986198619861986880460460
14Absolute elevationHm−710−710−705−788−788−812−812−825−825
15The auxiliary fan working pressurePFPa 6003200
16The motor efficiencyηM%-------7082
17The fan efficiencyΗF% 6582
Figure 4. Comparison of predicted and field measured temperature.
Minerals 05 00508 g004
Table 5. Derived temperature prediction results from the computer program for route 1.
Site NumberSite NameTemperature at Starting Point (°C)Temperature Prediction at End Point (°C)Measured Temperature at End Point (°C)D-Value (°C)
1Surface14.614.8514.80.05
2Mine shaft bottom14.815.0614.90.16
3Airflow observation station14.915.9115.90.01
4−700 North level airflow split point15.917.6217.60.02
11−700−4 level roadway17.620.0619.80.26
12−700−4 level roadway19.822.0922.1−0.01
137407 air-intake entry22.123.0522.80.25
147407 working face head22.823.3423.20.14
157407 working face end23.224.8823.81.08
Table 6. Derived temperature prediction results from the computer program for route 2.
Site NumberSite NameTemperature at Starting Point (°C)Temperature Prediction at end Point (°C)Measured Temperature at End Point (°C)D-Value (°C)
1Surface14.614.8514.80.05
2Mine shaft bottom14.815.0614.90.16
3Airflow observation station14.915.9115.90.01
4−700 North level airflow split point15.916.2116.60.39
21−700−3 level roadway16.618.4618.80.34
22−700−3 level roadway18.822.8622.6−0.26
23−700−3 level roadway22.623.1523.70.55
247301 air-intake entry23.723.8324.30.47
257301 working face head24.325.125.50.4
267301 working face end26.127.08 29.8−0.36
Table 7. Derived temperature prediction results from the computer program for route 3.
Site NumberSite NameTemperature at Starting Point (°C)Temperature Prediction at End Point (°C)Measured Temperature at End Point (°C)D-Value (°C)
1Surface14.614.8514.80.05
2Mine shaft bottom14.815.0614.90.16
3Air measuring station14.915.9115.90.01
31−700 South level airflow split point16.417.3617.10.26
32−700 level roadway17.119.2619.10.16
33−700 level roadway19.121.0620.60.46
34Dip head entry in south area20.623.3323.20.13
35Dip head entry in south area23.229.1281.1
36Mine development head2829290

6. Conclusions

Accurate evaluation and prediction of the air temperature increase in underground coal mines can provide very valuable information for mine operators in order to take preventive measures for mitigating thermal problems for miners as well as improving their health. In order to deal with such a problem, by consideration of various heat sources and their roles in increasing the temperature, a mathematical model was proposed for providing air-temperature prediction in mines and a numerical tool and interface was also developed. This program provides a versatile, reliable, and easy-to-use tool for users who care about or operate in underground ventilation management.
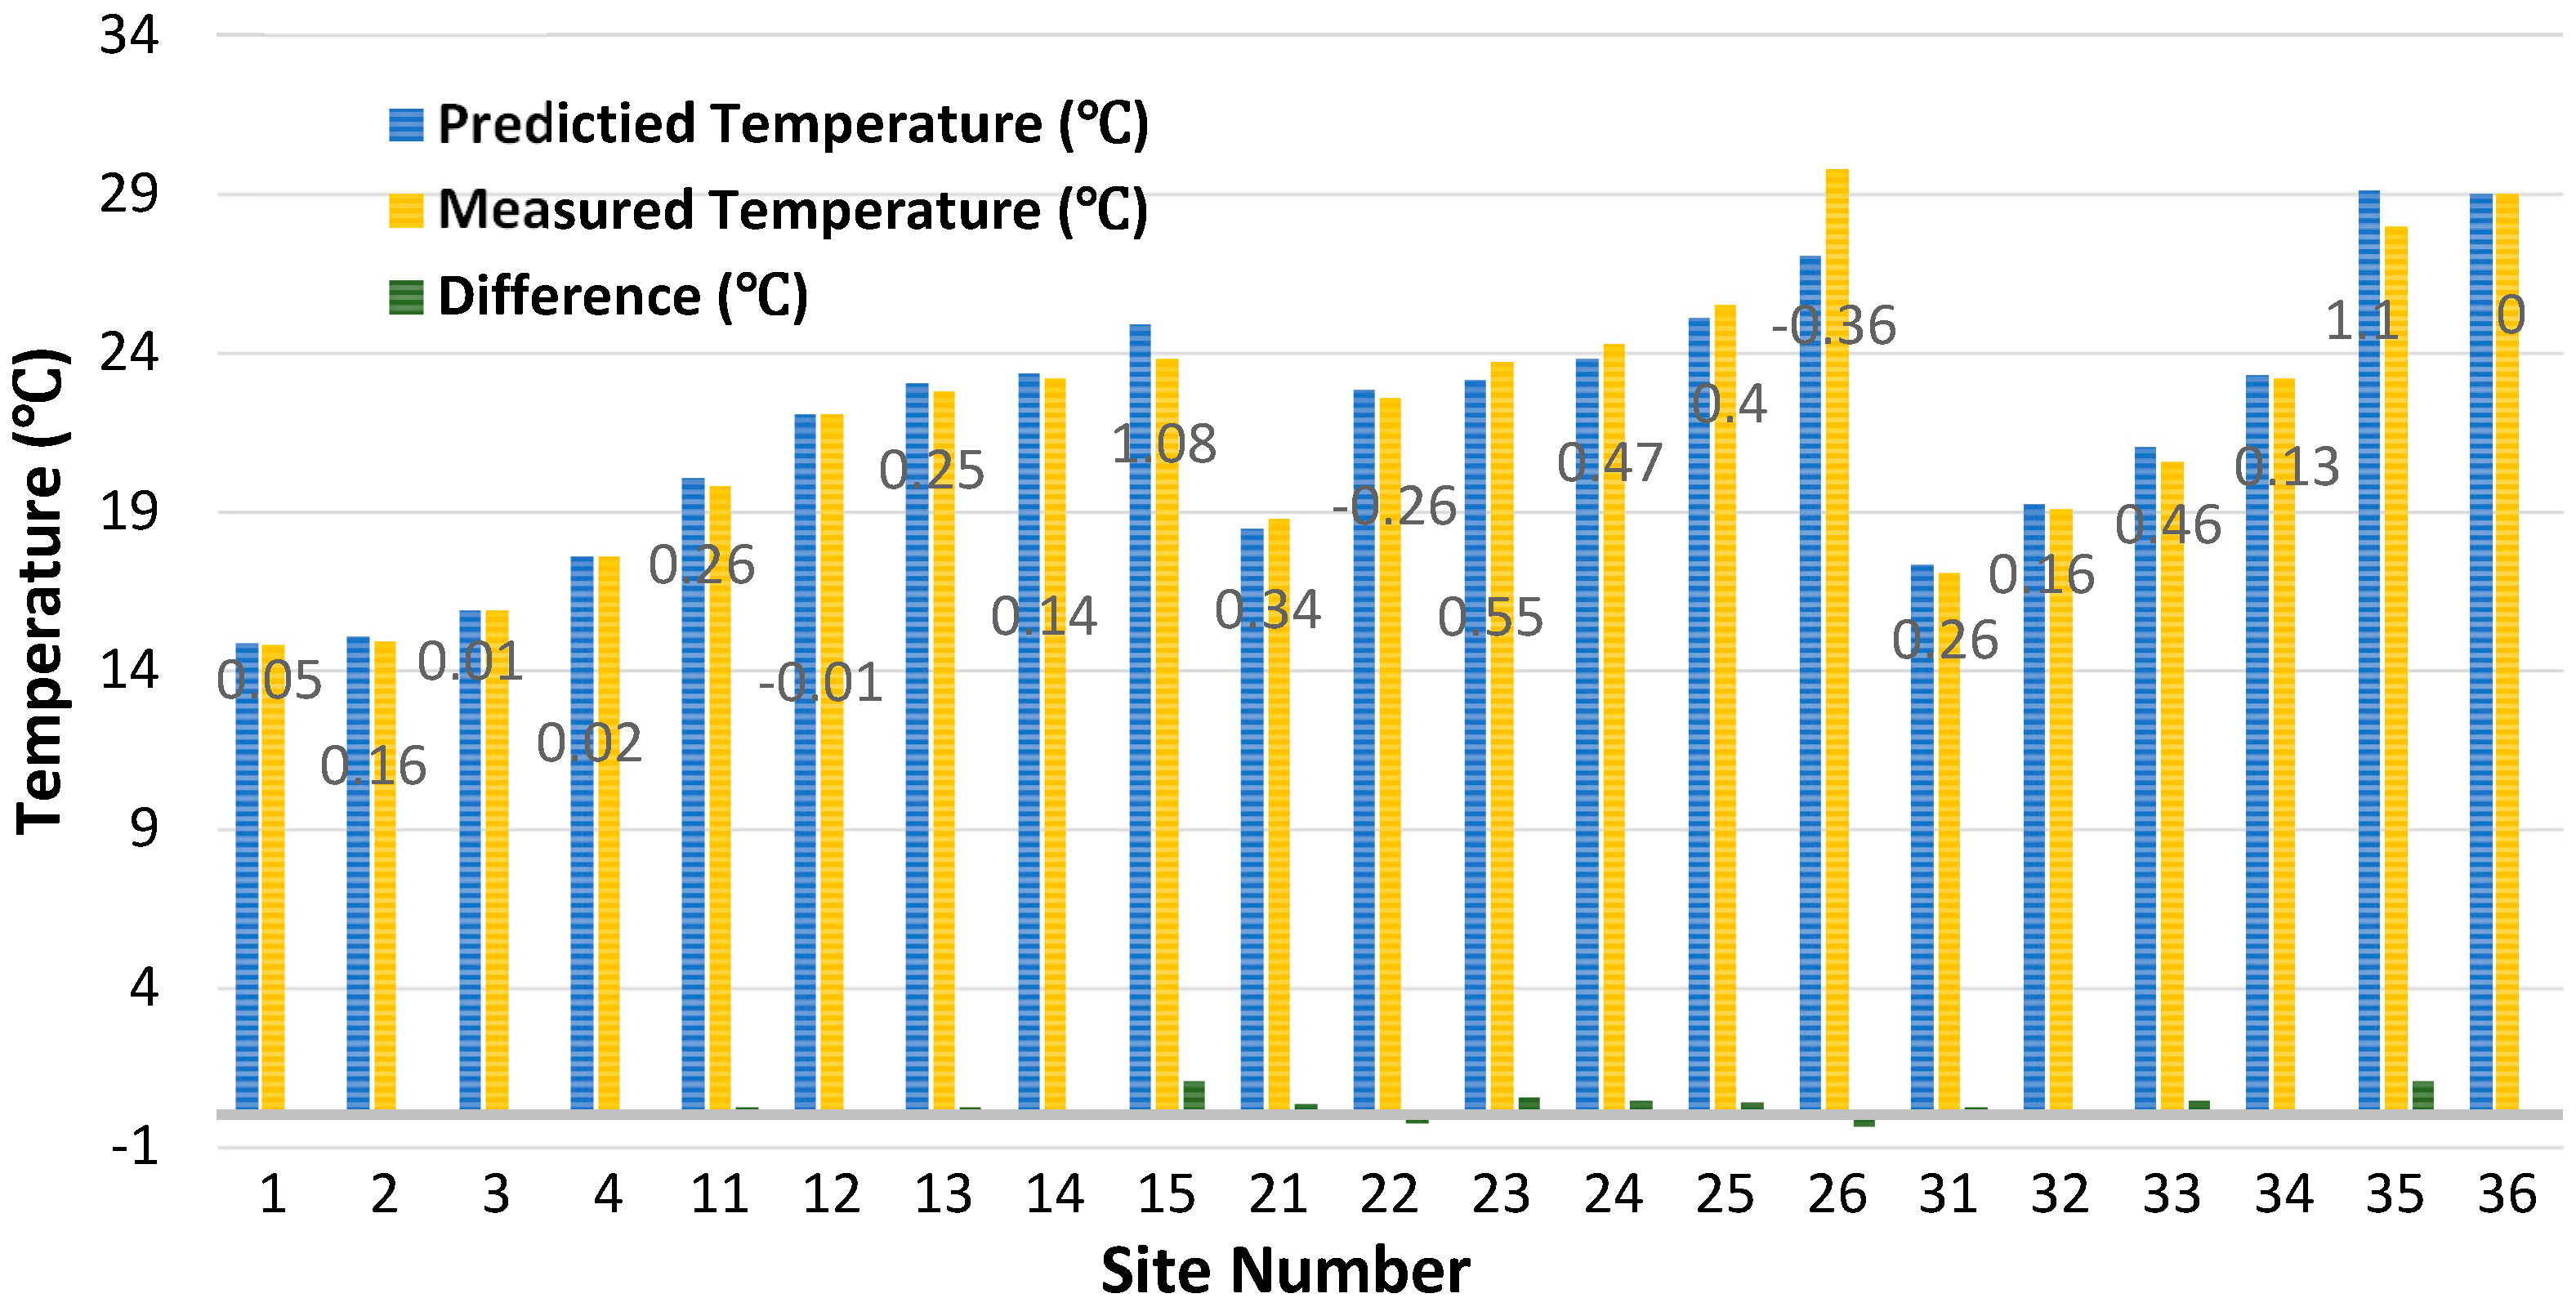
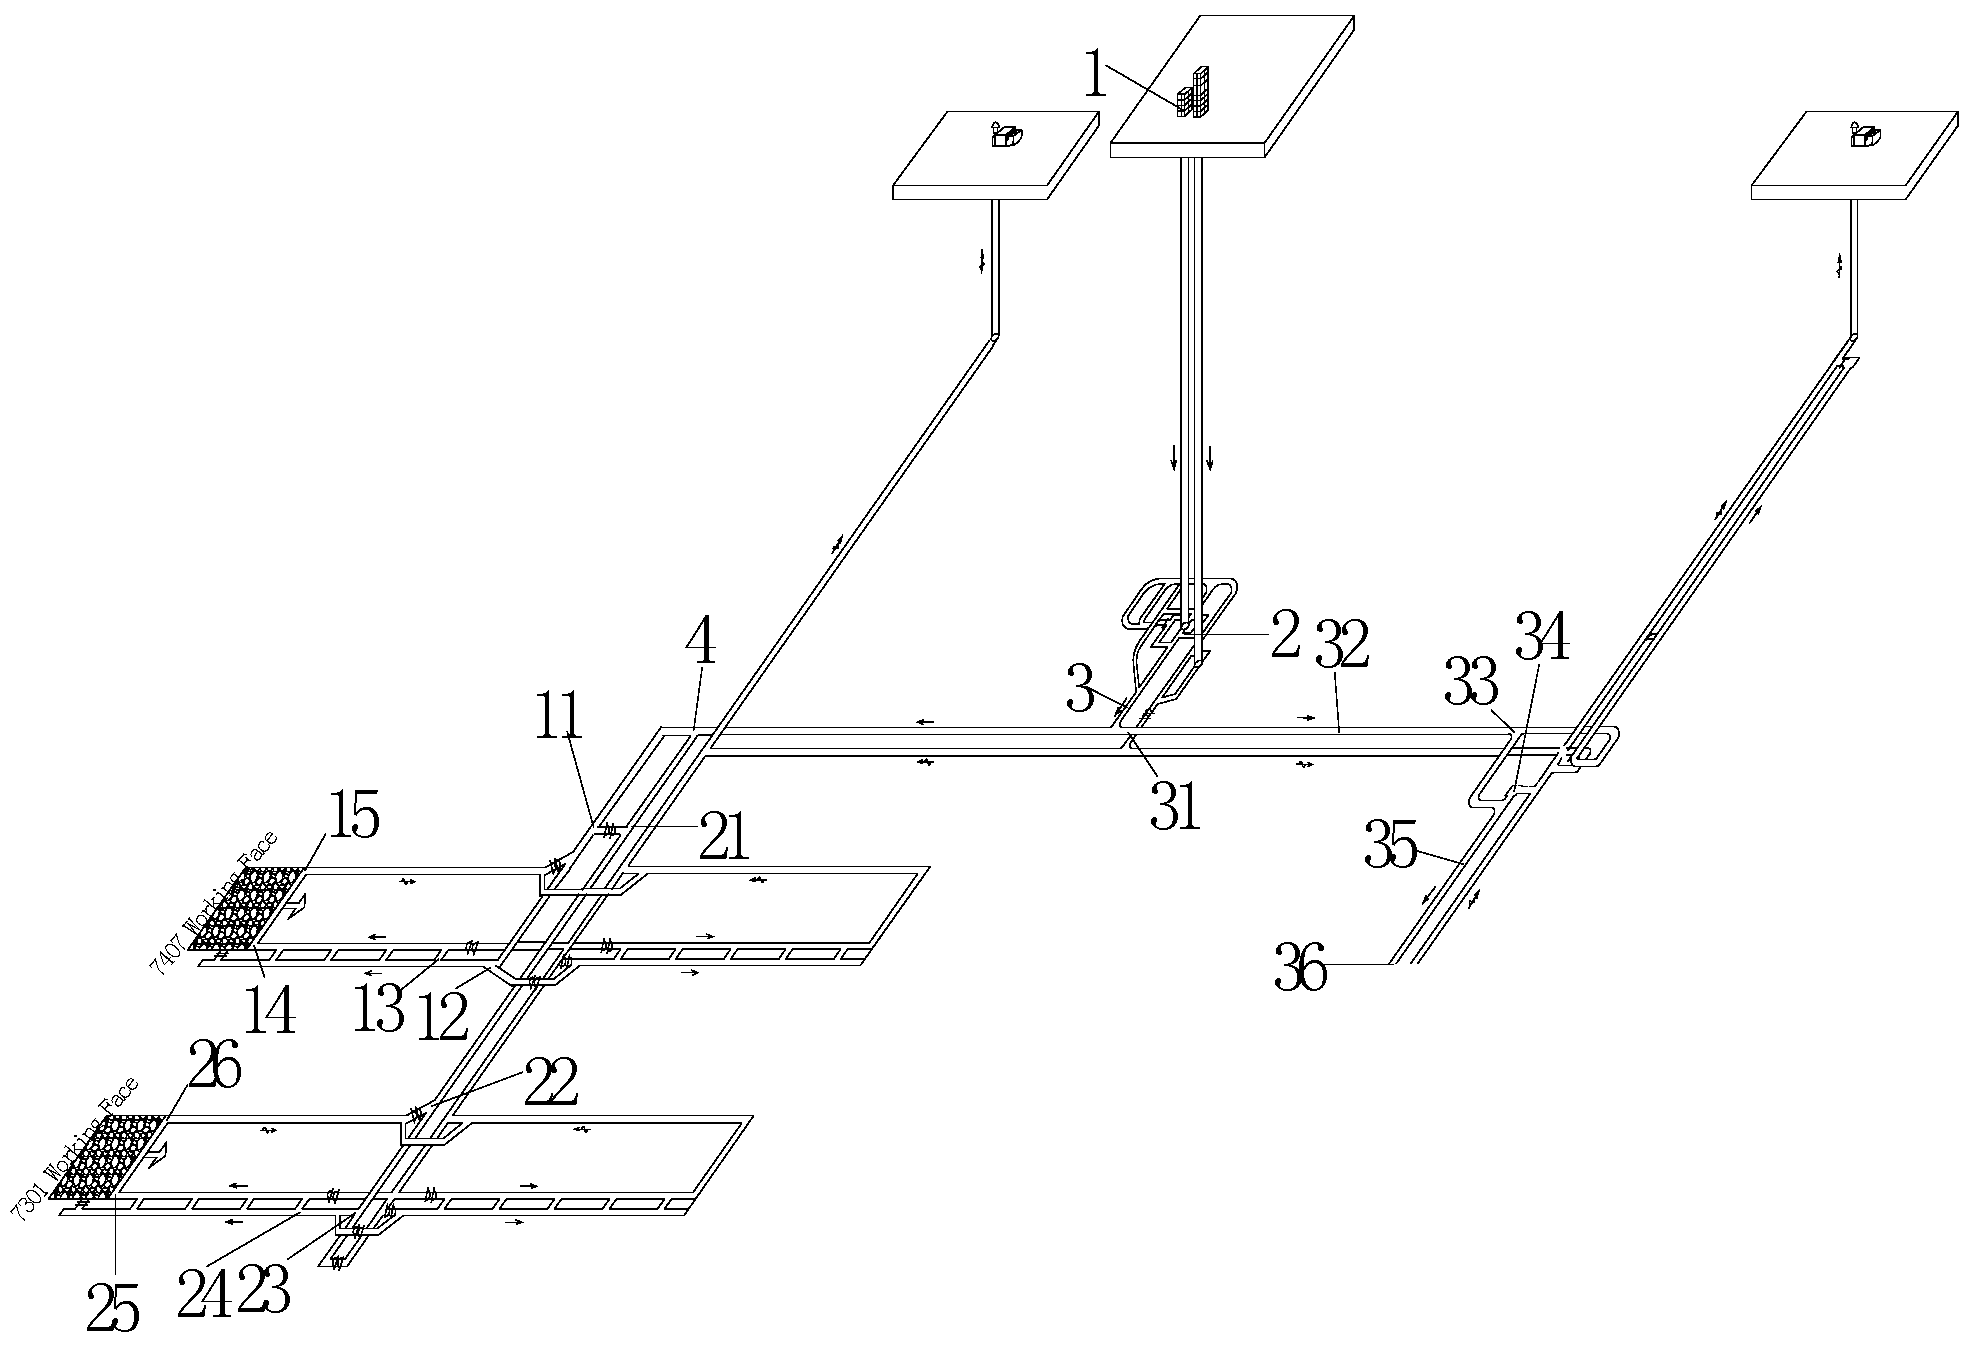
Based on the case study, the proposed underground air-route temperature prediction model appears to represent the characteristics of temperature increase underground. Various underground heat sources (air compression, wall oxidation, underground heat, machinery, etc.) are covered by the model. By applying the law of heat conservation, a mathematical solution for deriving temperature was proposed via thermodynamic equations. A testing case for an ultra-deep underground coal mine demonstrated the accuracy of the prediction model. However, the following points should be improved in future research; (a) more types of underground heat sources should be covered and the related calculation equations should be derived. Considering the structure of the developed model, incorporating new heat sources and expanding the model capability are not difficult; (b) an in-depth analysis of moisture exchange in underground roadway walls should also be performed. The latent heat energy may change the air temperature due to such an exchange.

Acknowledgments

This work is financially supported by grants from the National Science Foundation of China (Grant No.51304203), the Natural Science Foundation of Jiangsu Province of China for Youths (Grant No. BK20130191) and Specialized Research Fund for the Doctoral Program of Higher Education (Grant No. 20130095120001); the authors are appreciating for these supports.

Author Contributions

Shuai Zhu and Shiyue Wu conceived and designed the mathematical model and field testing, Jianwei Cheng deals with the math calculation and analyzes the data and improve the paper quality, Siyuan Li improves the figure works and writes the part of introduction; Mingming Li collects the background materials.

Conflicts of Interest

The authors declare no conflict of interest.

References

  1. SACMS (2007). State Administration of Coal Mine Safety. Available online: http://www.chinasafety.gov.cn/2007-02/28/content_220502.htm (assessed on 8 August 2015).
  2. SACMS (2012). State Administration of Coal Mine Safety. Available online: http://www.china.com.cn/policy/txt/2011-12/07/content_24092977.htm (accessed on 8 August 2015).
  3. He, M. Application of HEMS cooling technology in deep mine heat hazard control. Min. Sci. Technol. 2009, 3, 269–275. [Google Scholar] [CrossRef]
  4. Brake, R. Fluid Consumption, Sweat Rates and Hydration Status of Thermally Stressed Underground Miners and the Implications for Heat Illness and Shortened Shifts. Available online: http://www.qrc.org.au/conference/_dbase_upl/2001_spk024_brake.pdf (accessed on 4 August 2015).
  5. United States Disbursing Officer Administration. Heat Stress in Mining; United States Disbursing Officer Administration: Washington, DC, USA, 2014. [Google Scholar]
  6. Bossard, F. Calculating underground mine air-cooling requirements. In Proceedings of the 6th US Mine Ventilation Symposium, Salt Lake, UT, USA, 21–23 June 1993.
  7. Torres, F.; Singh, R. Thermal State and Human Comfort in Underground Mining. In Developments in Heat Transfer; Aurelio, M., Bernardes, S., Eds.; INTECH Open Access Publisher: Rijeka, Croatia, 2011. [Google Scholar]
  8. Jian, C.G.; Su, W.; Zhang, H.; Yang, F. Application of cold water spray in mine heat hazard control. Appl. Mech. Mater. 2011, 71–78, 2375–2381. [Google Scholar] [CrossRef]
  9. Wang, S.; Ren, T.; Zhang, T.; Liang, Y.; Xu, Z. Hot environment—Estimation of thermal comfort in deep underground mines. In Proceedings of the 12th Coal Operators’ Conference, Wollongong, Australia, 16–17 February 2012; University of Wollongong & the Australasian Institute of Mining and Metallurgy: Wollongong, Australia, 2012; pp. 241–248. [Google Scholar]
  10. Wagner, H. The management of heat flow in deep mines (Part 2). Geomechan. Tunn. 2011, 4, 157–163. [Google Scholar] [CrossRef]
  11. Hartman, H.L.; Mutmansky, J.M.; Ramani, R.V.; Wang, Y.J. Mine Ventilation and Air Conditioning; Wiley-Interscience: Hoboken, NJ, USA, 1997. [Google Scholar]
  12. Payne, T.; Mitra, R. A review of heat issues in underground metalliferous mines. In 12th U.S./North American Mine Ventilation Symposium; University of Nevada: Reno, NV, USA, 2008. [Google Scholar]
  13. Qin, Y.; Hou, Q. Environmental Engineering in Mines; Wuhan Industrial University Press: Wuhan, China, 1989. [Google Scholar]
  14. Du Plessis, J. Ventilation and Occupational Environment Engineering in Mines; Mine Ventilation Society of South Africa: Johannesburg, South Africa, 2014. [Google Scholar]
  15. Yang, D.; Yang, T. Thermal Environments in Mine and Its Control; Metallurgical Industry Press: Beijing, China, 2009. [Google Scholar]

