Article

Potentiostatically Poised Electrodes Mimic Iron Oxide and Interact with Soil Microbial Communities to Alter the Biogeochemistry of Arctic Peat Soils

by
Elliot S. Friedman
1,
Kimberley E. Miller
2,
David A. Lipson
2 and
Largus T. Angenent
1,*
1
Department of Biological and Environmental Engineering, Cornell University, Ithaca, NY 14853, USA
2
Department of Biology, San Diego State University, San Diego, CA 92182, USA
*
Author to whom correspondence should be addressed.
Minerals 2013, 3(3), 318-336; https://doi.org/10.3390/min3030318
Submission received: 16 August 2013 / Revised: 11 September 2013 / Accepted: 13 September 2013 / Published: 23 September 2013
(This article belongs to the Special Issue Interactions between Microbes and Minerals)

Abstract

:
Dissimilatory metal-reducing bacteria are ubiquitous in soils worldwide, possess the ability to transfer electrons outside of their cell membranes, and are capable of respiring with various metal oxides. Reduction of iron oxides is one of the more energetically favorable forms of anaerobic respiration, with a higher energy yield than both sulfate reduction and methanogenesis. As such, this process has significant implications for soil carbon balances, especially in the saturated, carbon-rich soils of the northern latitudes. However, the dynamics of these microbial processes within the context of the greater soil microbiome remain largely unstudied. Previously, we have demonstrated the capability of potentiostatically poised electrodes to mimic the redox potential of iron(III)- and humic acid-compounds and obtain a measure of metal-reducing respiration. Here, we extend this work by utilizing poised electrodes to provide an inexaustable electron acceptor for iron- and humic acid-reducing microbes, and by measuring the effects on both microbial community structure and greenhouse gas emissions. The application of both nonpoised and poised graphite electrodes in peat soils stimulated methane emissions by 15%–43% compared to soils without electrodes. Poised electrodes resulted in higher (13%–24%) methane emissions than the nonpoised electrodes. The stimulation of methane emissions for both nonpoised and poised electrodes correlated with the enrichment of proteobacteria, verrucomicrobia, and bacteroidetes. Here, we demonstrate a tool for precisely manipulating localized redox conditions in situ (via poised electrodes) and for connecting microbial community dynamics with larger ecosystem processes. This work provides a foundation for further studies examining the role of dissimilatory metal-reducing bacteria in global biogeochemical cycles.

Graphical Abstract

1. Introduction

High-latitude soils contain vast reservoirs of carbon (nearly twice the amount in the atmosphere) and currently act as a net carbon sink [1,2,3]. However, it is unclear how Arctic warming, which is projected to be greater than average global warming [4], will alter the balance between carbon uptake via photosynthesis and release through microbial decomposition [5,6,7]. Globally, wetlands are the single largest natural methane source, and those located in high-latitude regions account for 10%–30% of wetland methane emissions [8,9]. Global methane models are highly subject to assumptions and small changes in parameters, including those related to redox inhibition, can change predicted outputs by as much as a factor of two [9]. The subsurface microbiota that decomposes organic matter play a crucial role in carbon cycling in wetland soils and sediments, however, the dynamics of competing microbial populations are poorly understood [7,10,11]. Competing forms of microbial respiration have different nutrient requirements, growth rates, and metabolic products, which can have implications for other ecosystems members (e.g., plants, invertebrates). To better model greenhouse gas emissions and carbon dynamics at the landscape and global scales, we need to further our understanding of the underlying microbial biogeochemistry [12].
Over the past 25 years, it has become apparent that bacteria capable of reducing insoluble compounds (i.e., metal oxides and humic substances) are ubiquitous in soils and sediments [13,14,15,16]. These bacteria achieve extracellular electron transfer through a variety of different mechanisms and can be utilized to produce power in microbial fuel cells [17,18,19], produce chemicals in microbial electrolysis cells [20,21,22], and remediate organic contaminants in the subsurface [23,24,25,26]. While humans have successfully exploited the ability of microbes to perform extracellular electron transfer in bioengineered systems, the role that extracellular electron transfer plays in natural environments, such as soils, is less clear [27]. The impact that extracellular electron transfer processes have on carbon cycling in anoxic soil is of particular interest because dissimilatory metal-reducing bacteria (DMRB) may compete with other forms of anaerobic respiration for carbon sources and nutrients. Extracellular electron processes dominate microbial processes in peatland ecosystems ranging from mid- (46° N) to high- (71° N) latitudes [28,29,30]. For example, recent work has shown that the reduction of ferric iron and humic substances is a major respiratory process in Arctic peat soils, accounting for between 40% and 63% of total ecosystem respiration [29,30], with similar results found in an ombrotrophic (i.e., a hydrologically isolated environment receiving all water and nutrients from precipitation) bog in Michigan, USA [28]. However, it is relatively uncertain how competition between different microbial respiratory pathways affects larger-scale ecosystem processes (e.g., carbon release).
Previously, we have demonstrated the ability of subsurface bioelectrochemical systems (BESs) to interact with DMRB in situ [31]. In these soil-based BESs, an inexhaustible electron acceptor (poised graphite electrode mimicking the redox potential of iron(III)- and humic acid-compounds) is provided for iron- and humic acid-reducing microbes. Here, these BESs were installed as a tool to manipulate localized redox conditions (via poised electrodes) of tundra peat soils and examine changes in both microbial community structure and ecosystem function (e.g., greenhouse gas emissions). We hypothesized that the addition of an inexhaustible source of electron acceptor for DMRB would outcompete microbial processes with a lower thermodynamic yield (i.e., methanogenesis). Soil chambers were installed in three replicate ice-wedge polygons within a medium-aged drained-thaw lake basin outside Barrow, Alaska. Some soil chambers contained no electrodes, while others contained nonpoised or poised electrodes at either shallow (6 cm) or deep depths (14 cm) below the soil surface. For the poised electrodes, we potentiostatically controlled (0.1 VSHE) the working electrode (WE) of these three-electrode BESs within soils chambers for a period of five weeks. This potential is used in laboratory BESs to grow DMRB at electrodes, and was chosen to promote favorable conditions for DMRB in the subsurface. We measured methane and carbon dioxide emissions from all soil chambers three times per week, and also measured environmental parameters (i.e., soil temperature, pH, dissolved oxygen, soil conductivity, oxidation-reduction potential). At the end of the experiment, biofilms from nonpoised and poised electrodes, as well as control soils, were collected for soil microbiome characterization.

2. Results and Discussion

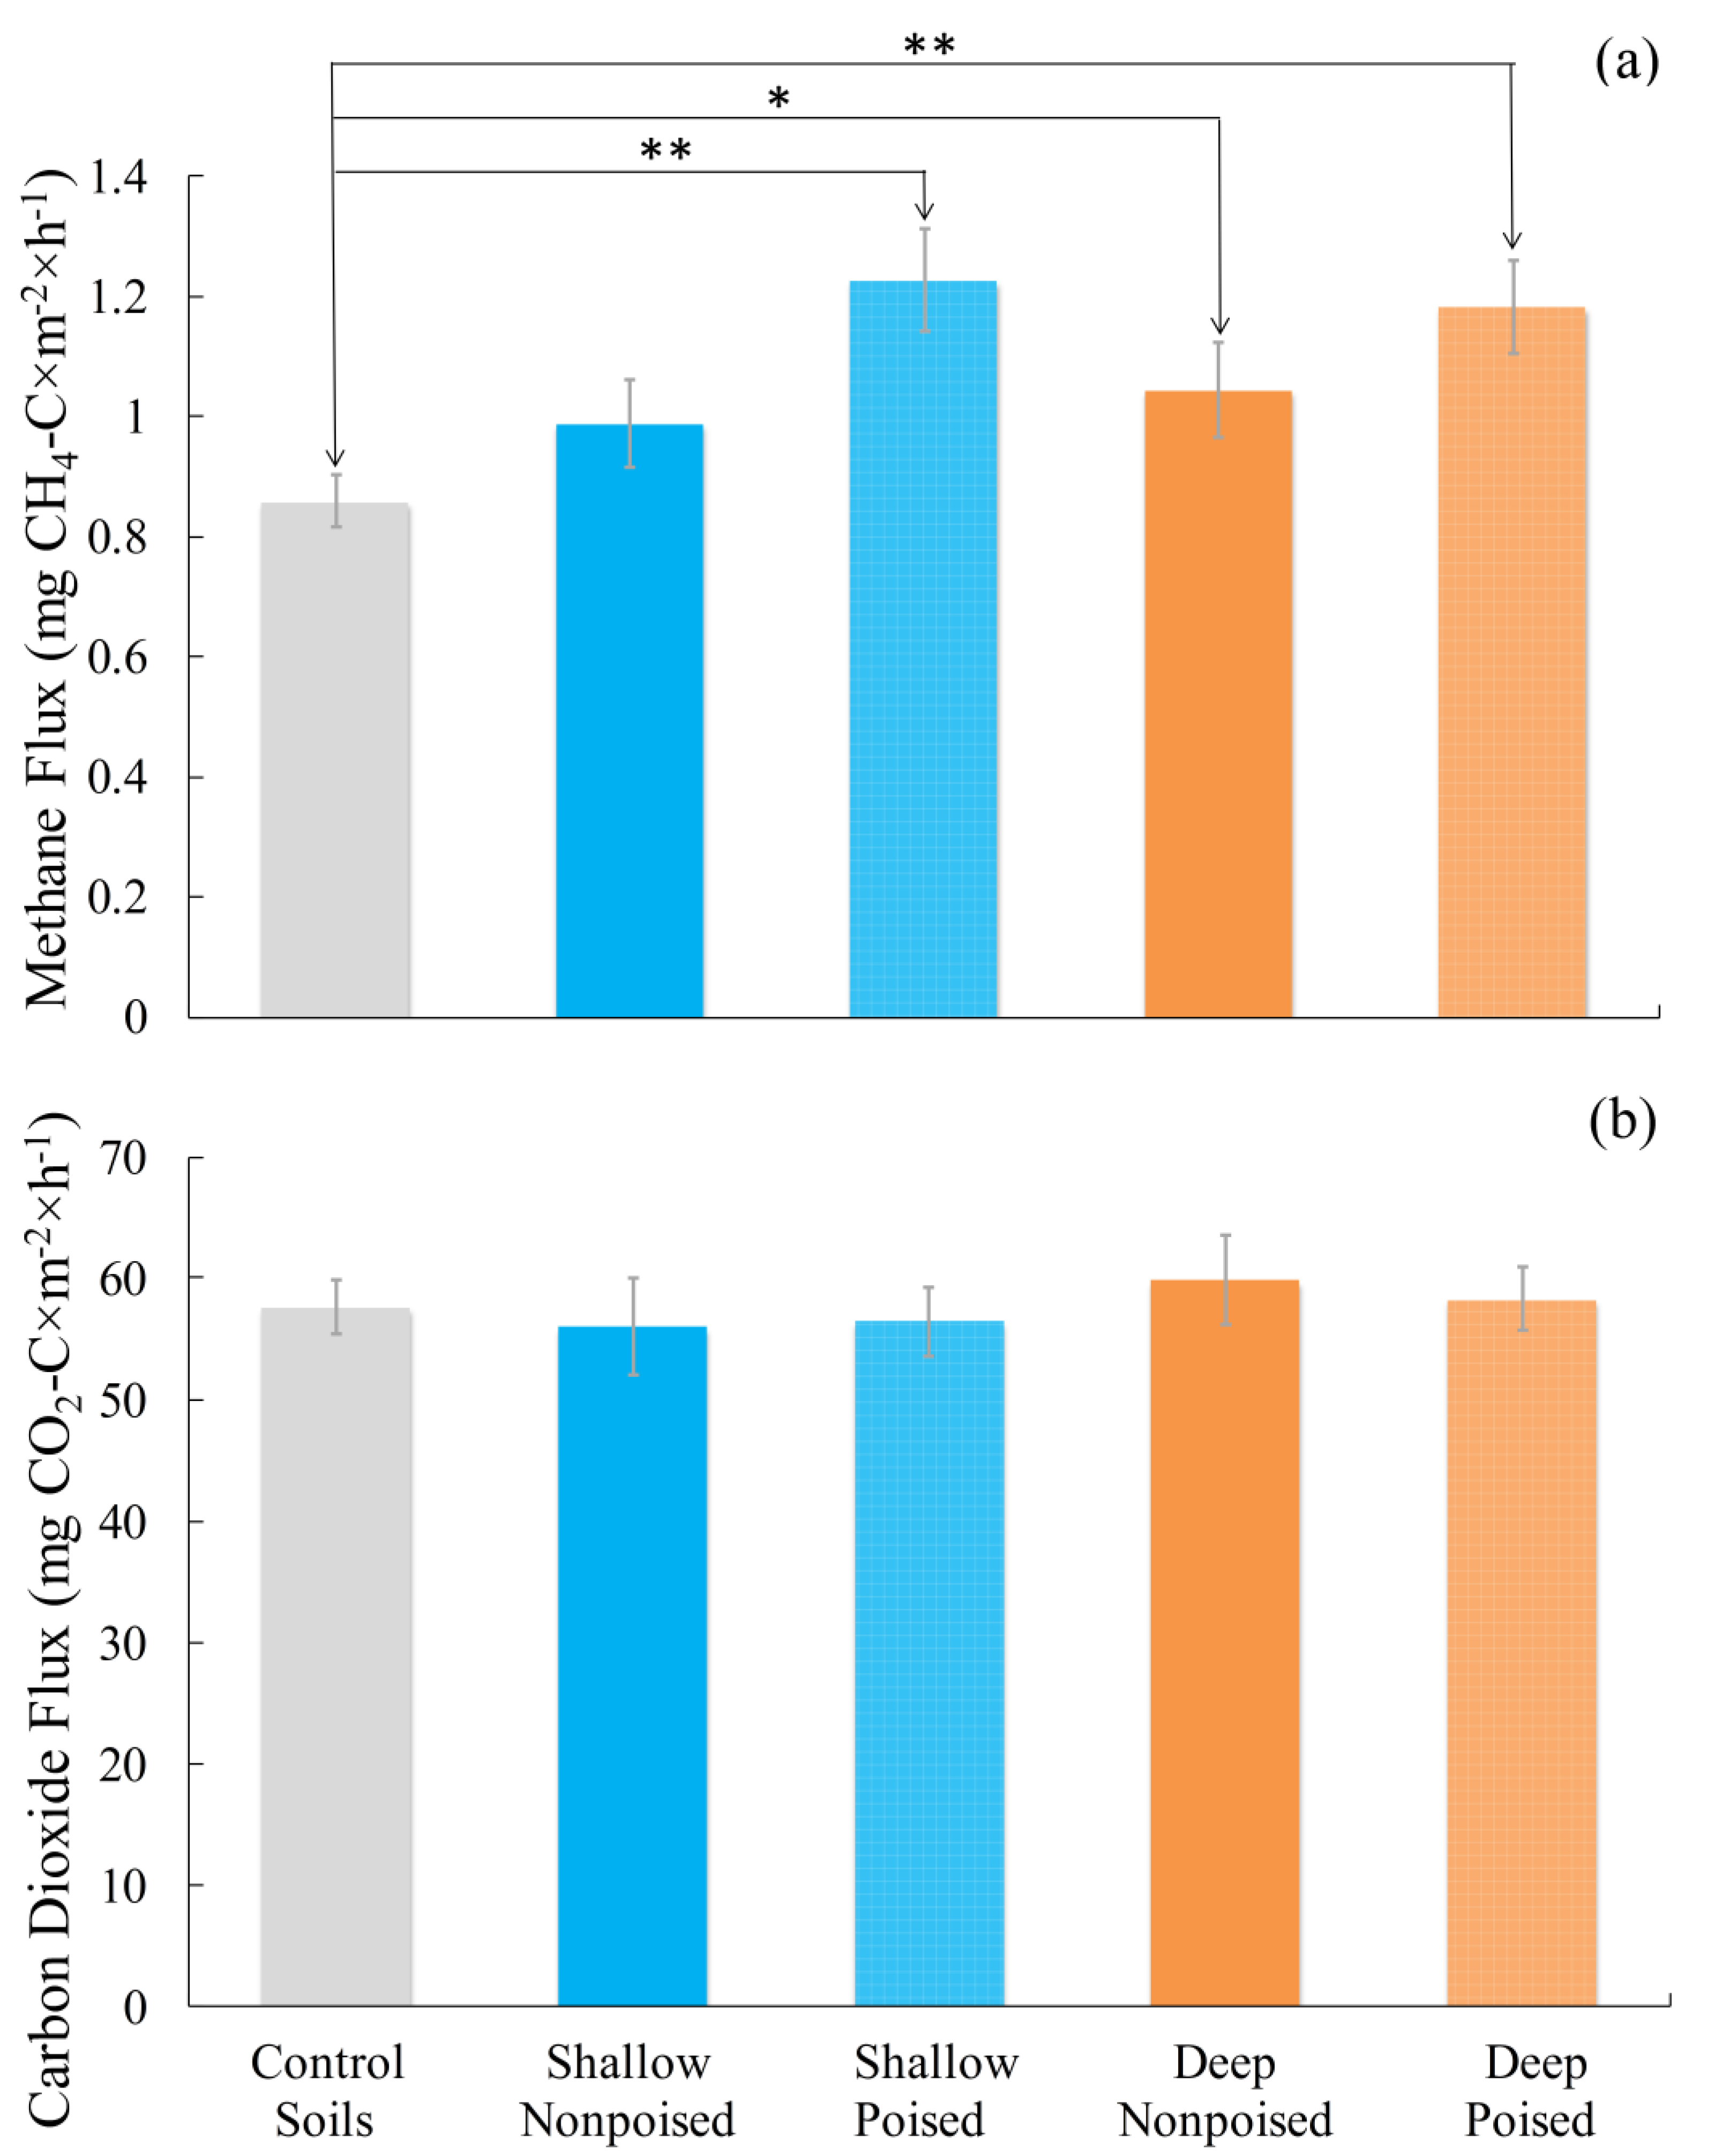
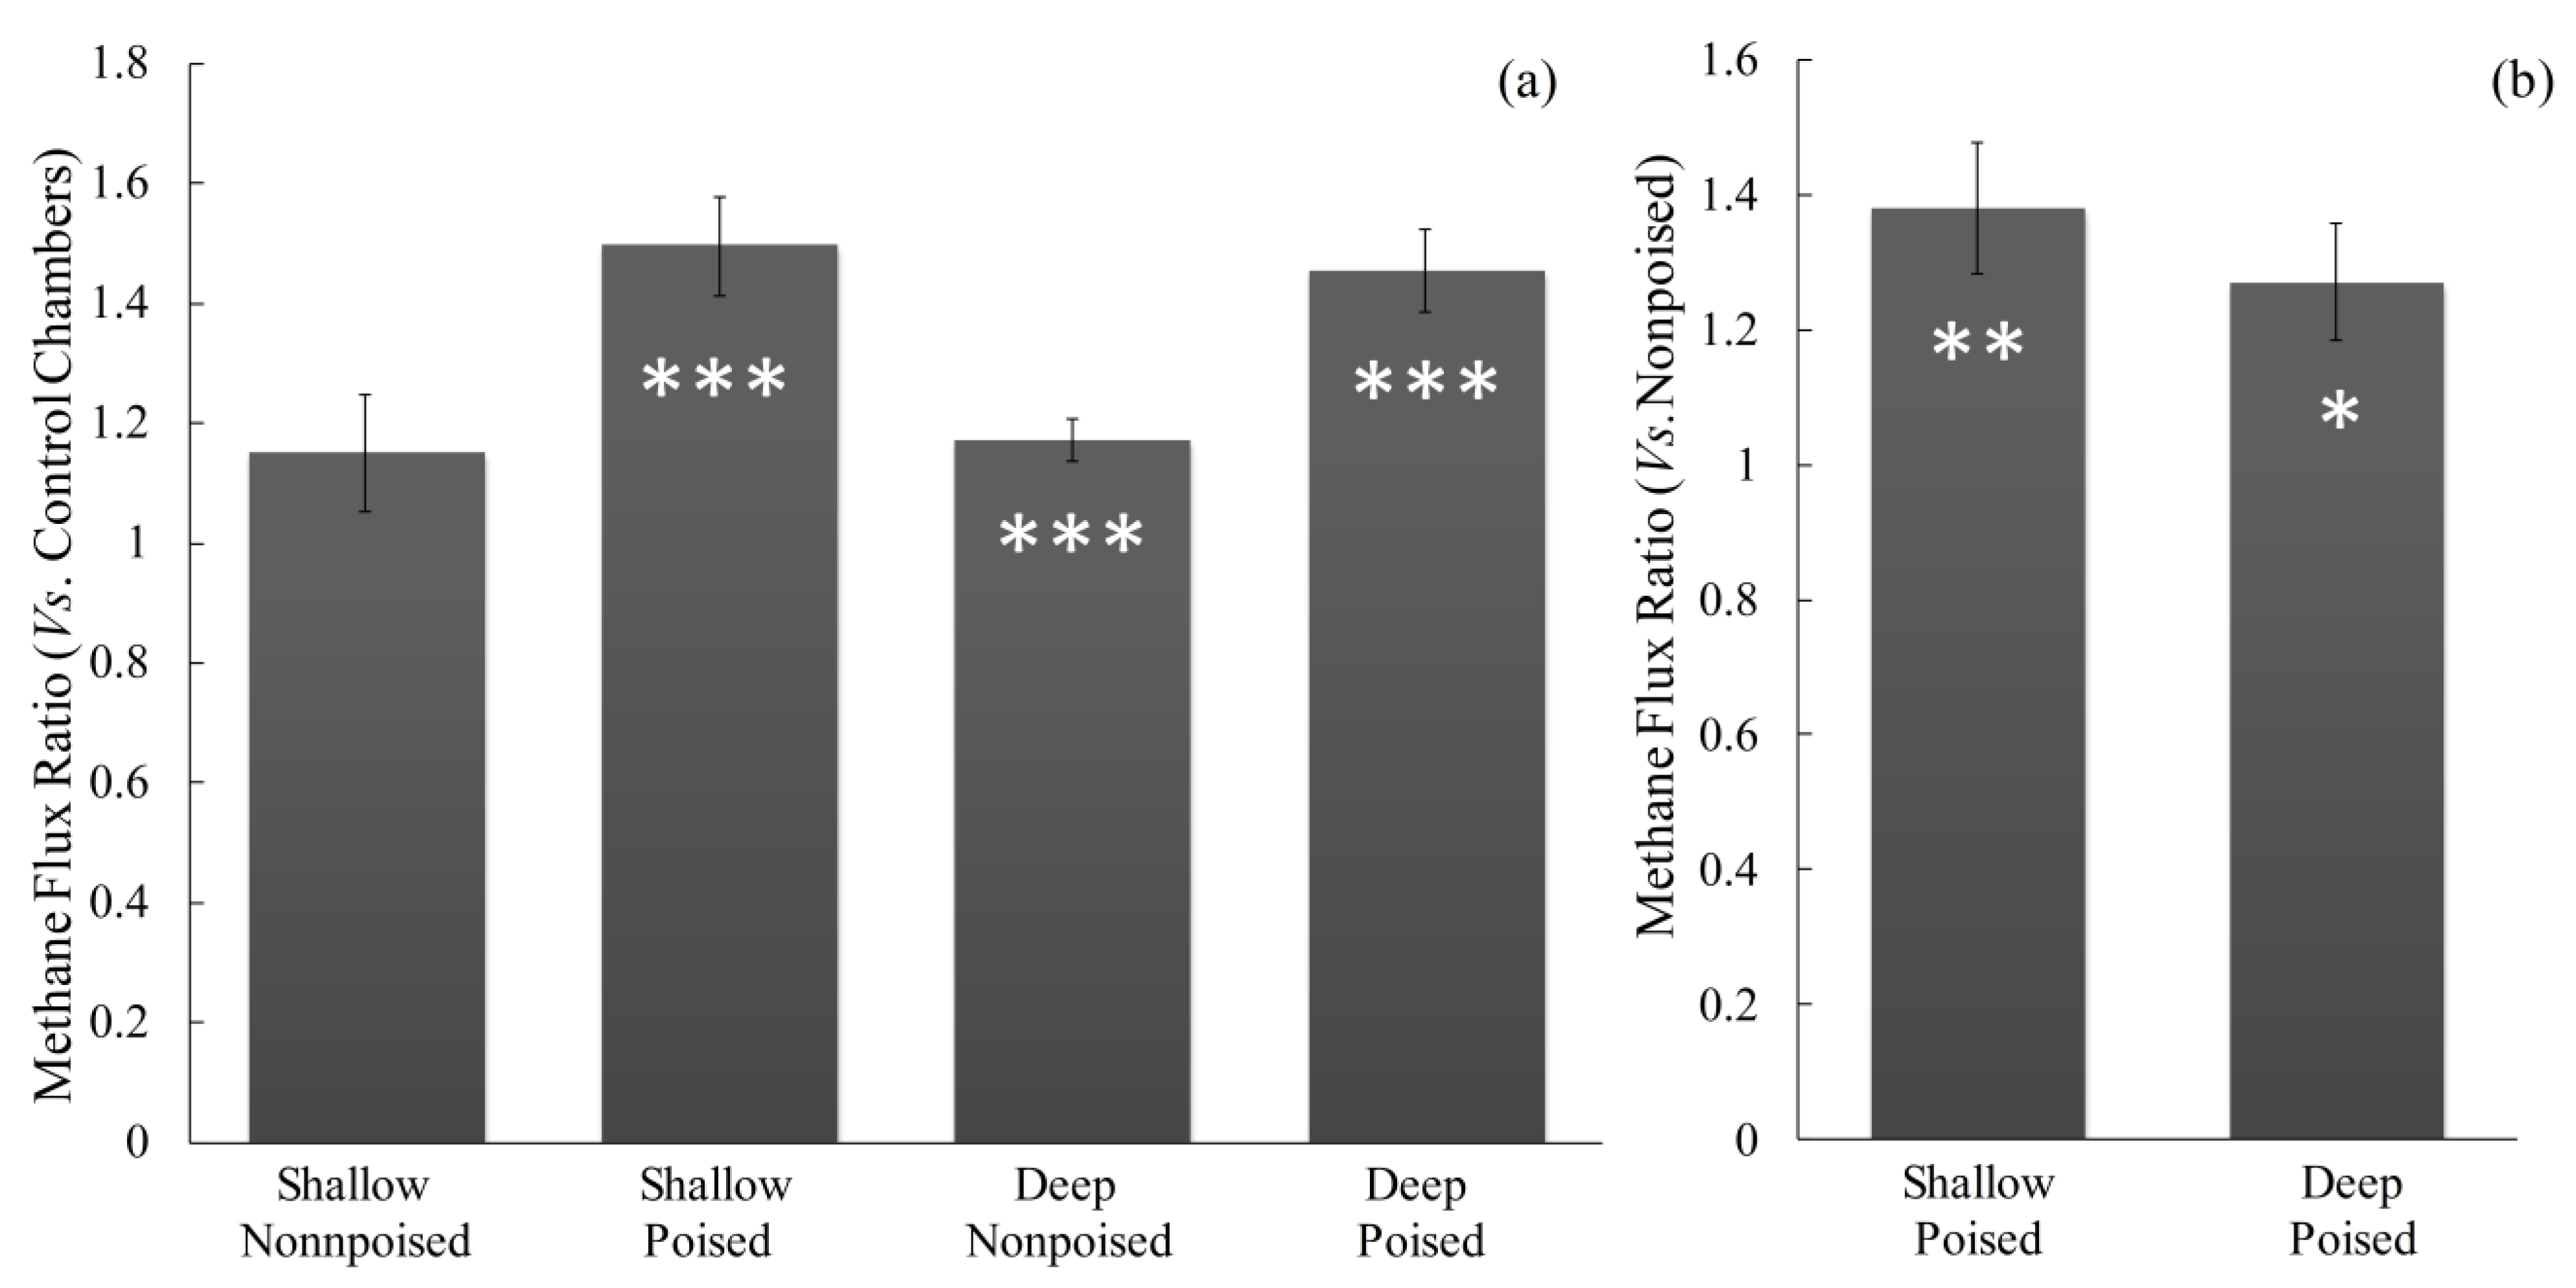
2.1. Electrodes Stimulate Methane Emissions Compared to Soils without Electrodes

For electrodes located at both shallow (6 cm) and deep (14 cm) depths, the chambers with graphite electrodes (nonpoised and poised) had higher methane emissions than control chambers (Figure 1a); there were no significant differences in CO2 emissions (p > 0.48; Figure 1b). Nonpoised electrodes at shallow and deep depths increased methane emissions by 15% (p = 0.13) and 22% (p = 0.03), respectively. The poised electrodes stimulated methane emissions by 43% at the shallow depth and 38% at the deep depth compared to the control chambers (p < 0.0001 for both depths) (Figure 1a).
To account for temporal variations in methane emissions due to, for example, changing weather conditions during the course of the experiment, we compared methane emissions from different chambers by calculating the daily methane emission ratio for chambers with one electrode (either nonpoised and poised) vs. control chambers with only soil. These ratios confirmed that nonpoised electrodes at shallow depths did not significantly alter methane emissions (Figure 2a). Conversely, poised electrodes at both depths and nonpoised electrodes at deep depths did significantly increase methane emissions (p < 0.001, Figure 2a).
Figure 1. Average (a) methane and (b) carbon dioxide fluxes from the five different soil chamber types over a five-week experimental period. Chambers with nonpoised electrodes had higher methane fluxes (a) than the control chambers, but the largest differences from the control were in the chambers with poised electrodes. There were no significant differences in carbon dioxide emissions between different chamber types (b). Error bars indicate standard error and statistically significant differences at the p = 0.05 (*) and p = 0.0001 (**) are noted. We used two-sample t-test.
Minerals 03 00318 g001
Figure 2. Average (a) methane flux ratios for the chambers with electrodes vs. the control chambers and (b) for the chambers with poised electrodes vs. those with nonpoised electrodes. Ratios were calculated on each measurement day to account for temporal variations in methane flux based on temperature, precipitation, and other variables. The values shown in the graphs represent the average methane flux ratio over the course of the experiment, and error bars indicate standard error. Significant differences at p = 0.05 (*), p = 0.01 (**), and p = 0.001 (***) using Bonferroni correction are noted.
Minerals 03 00318 g002

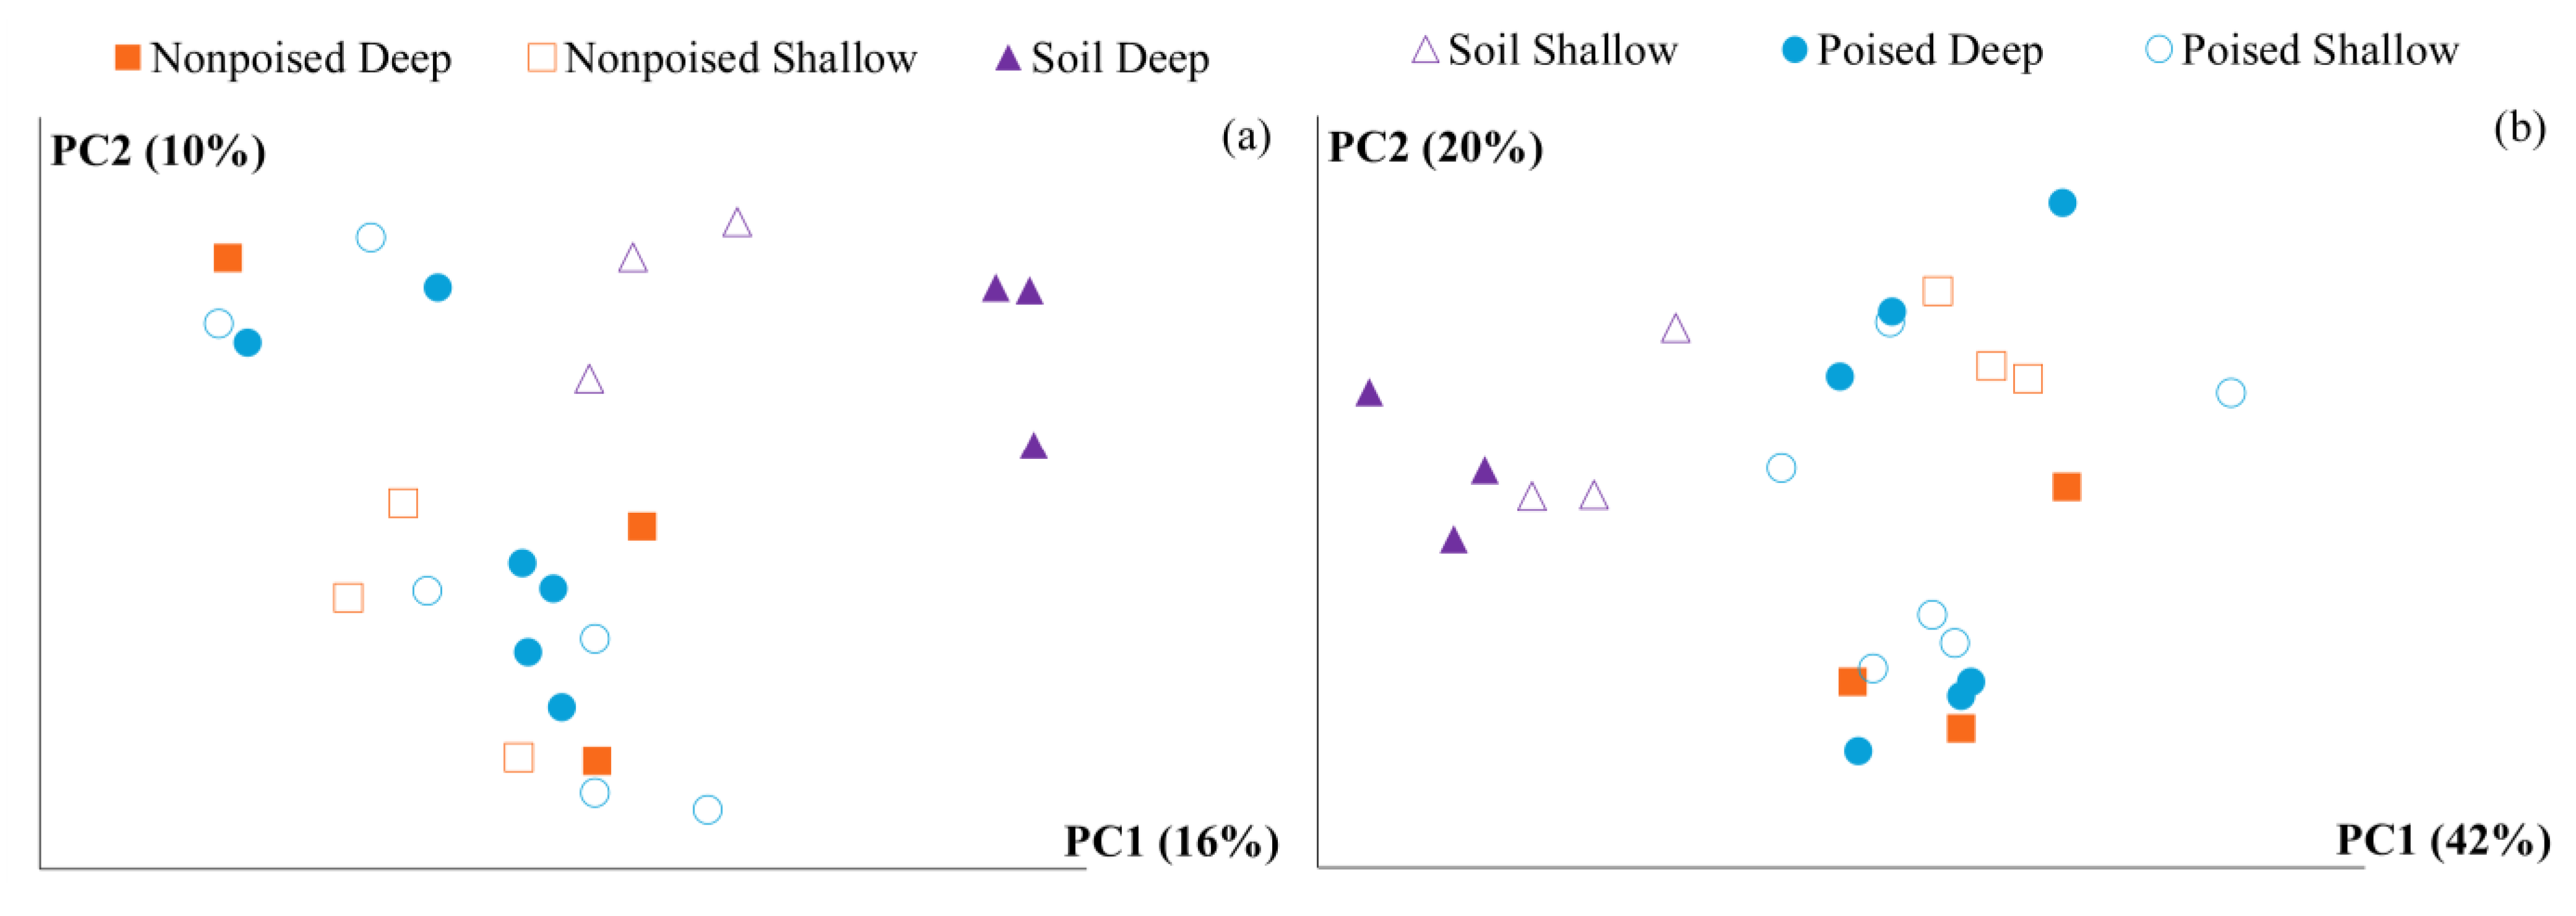
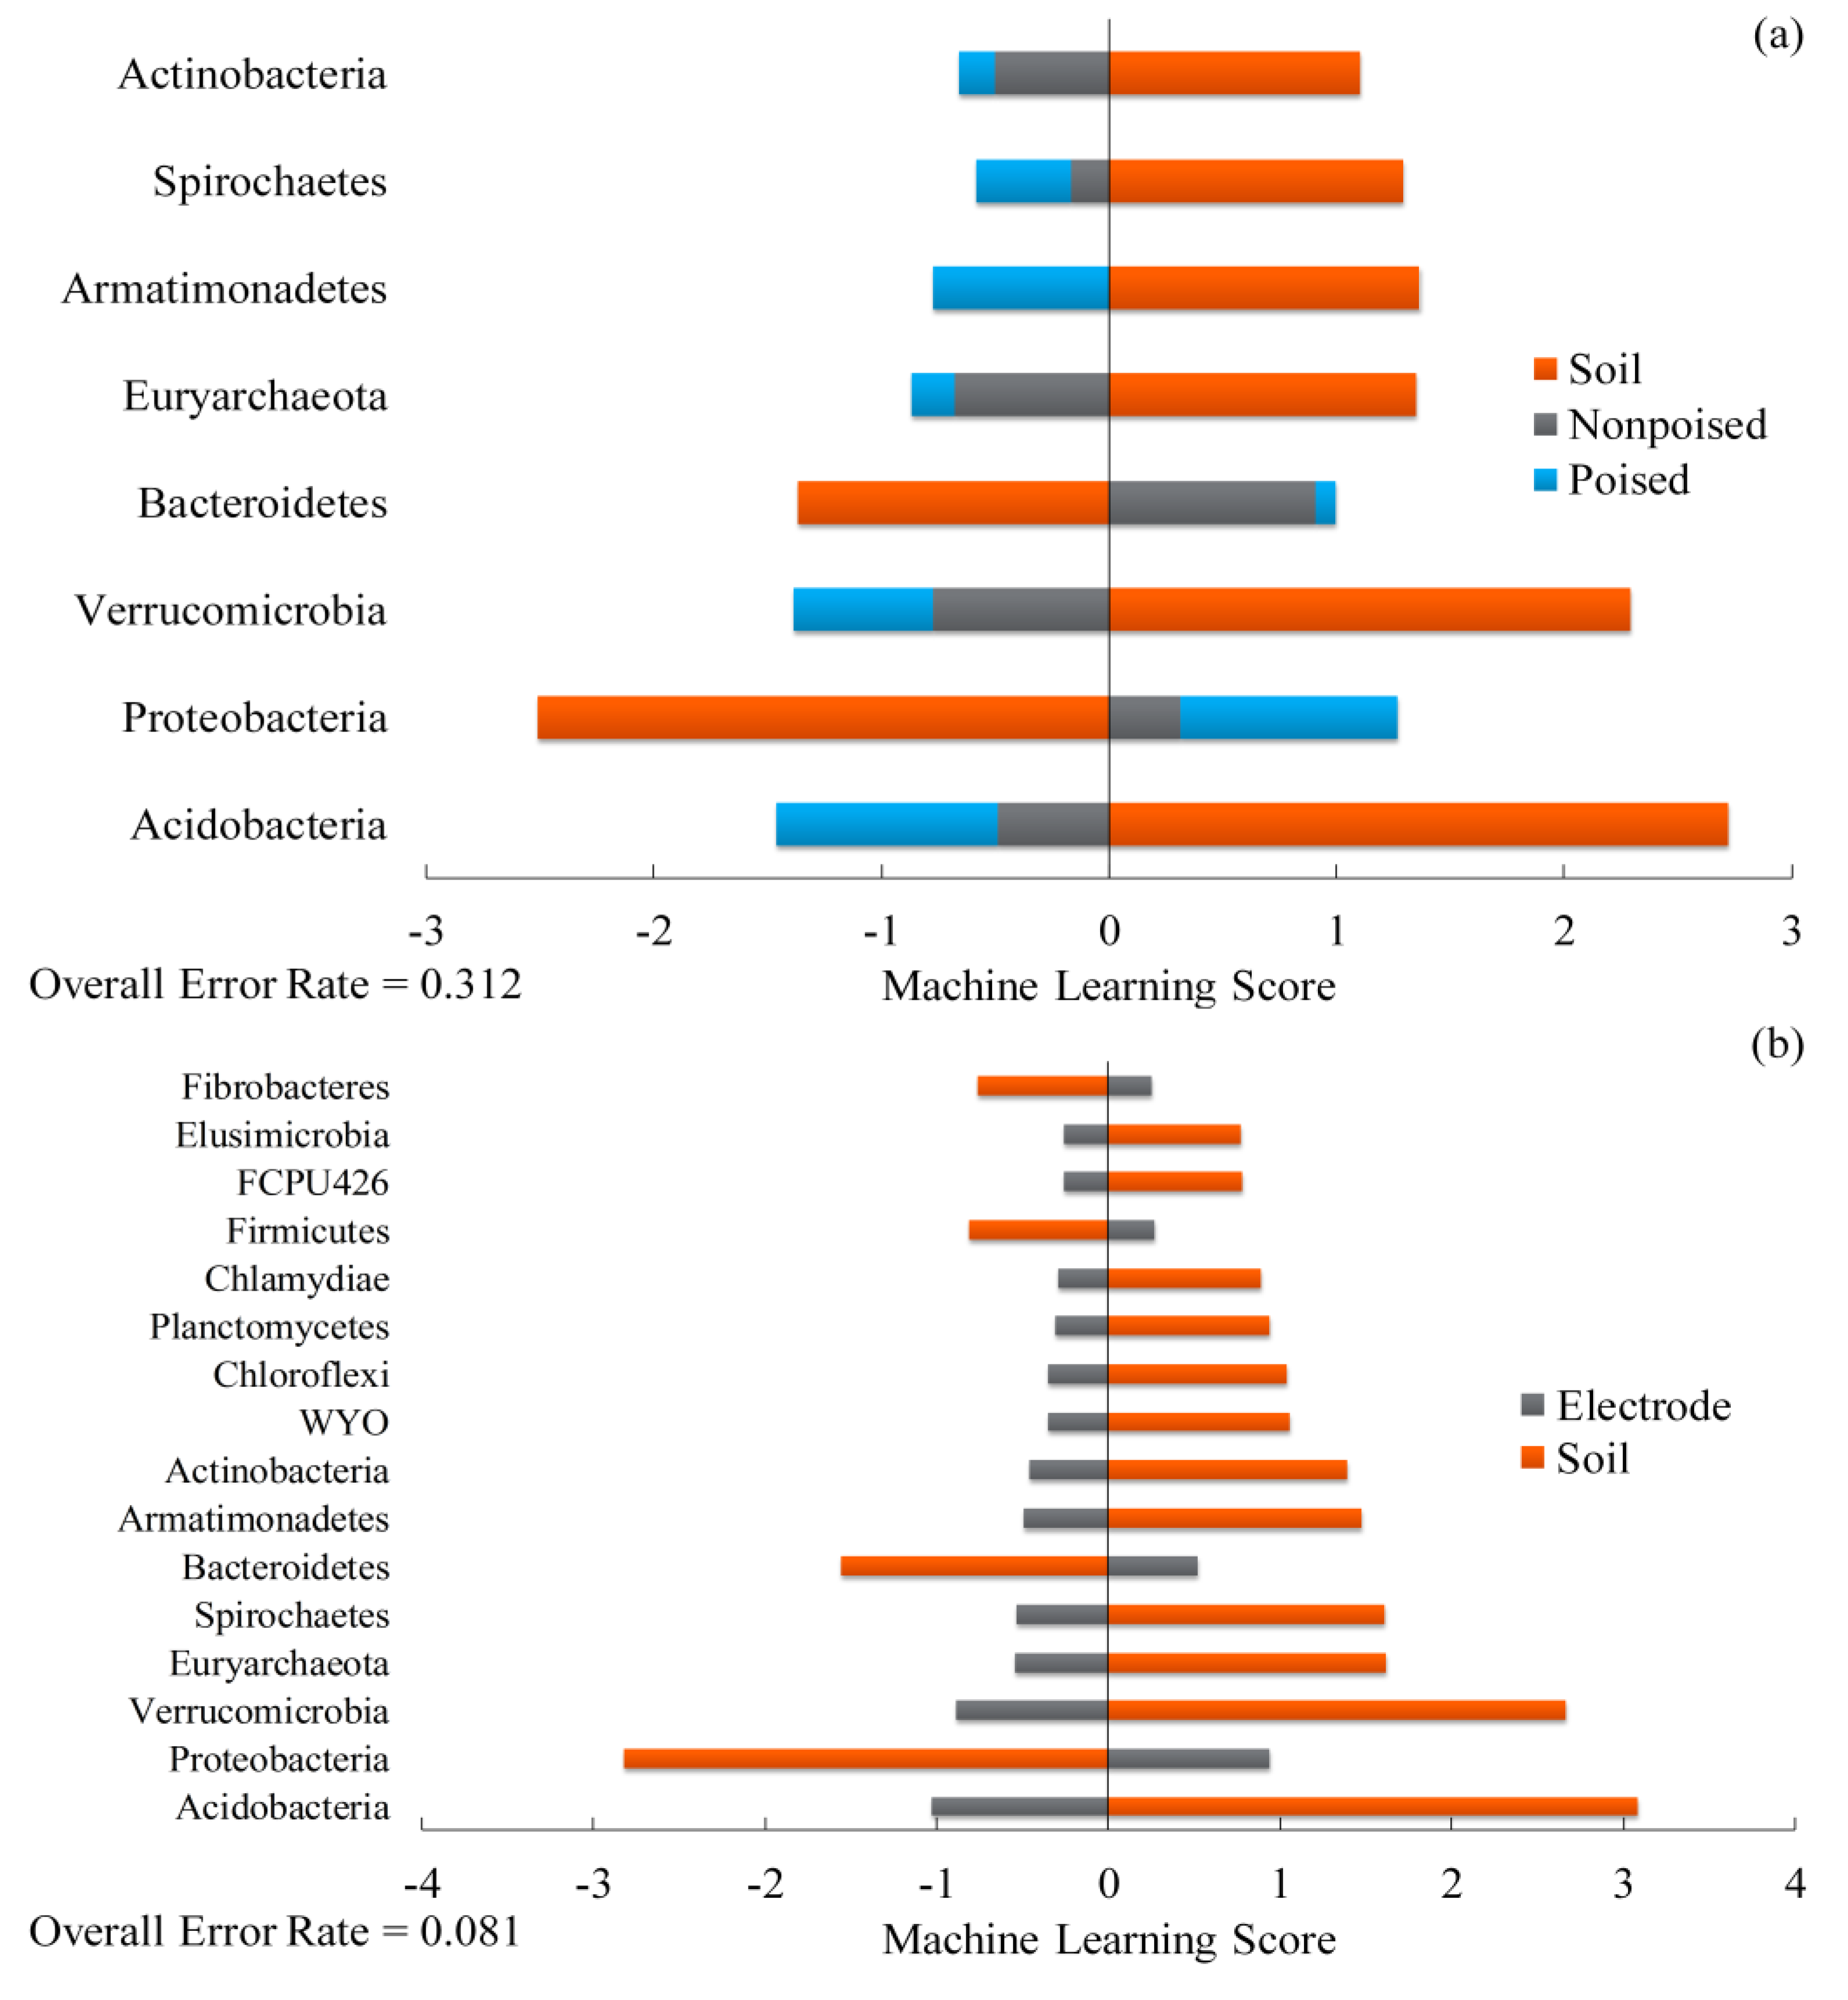
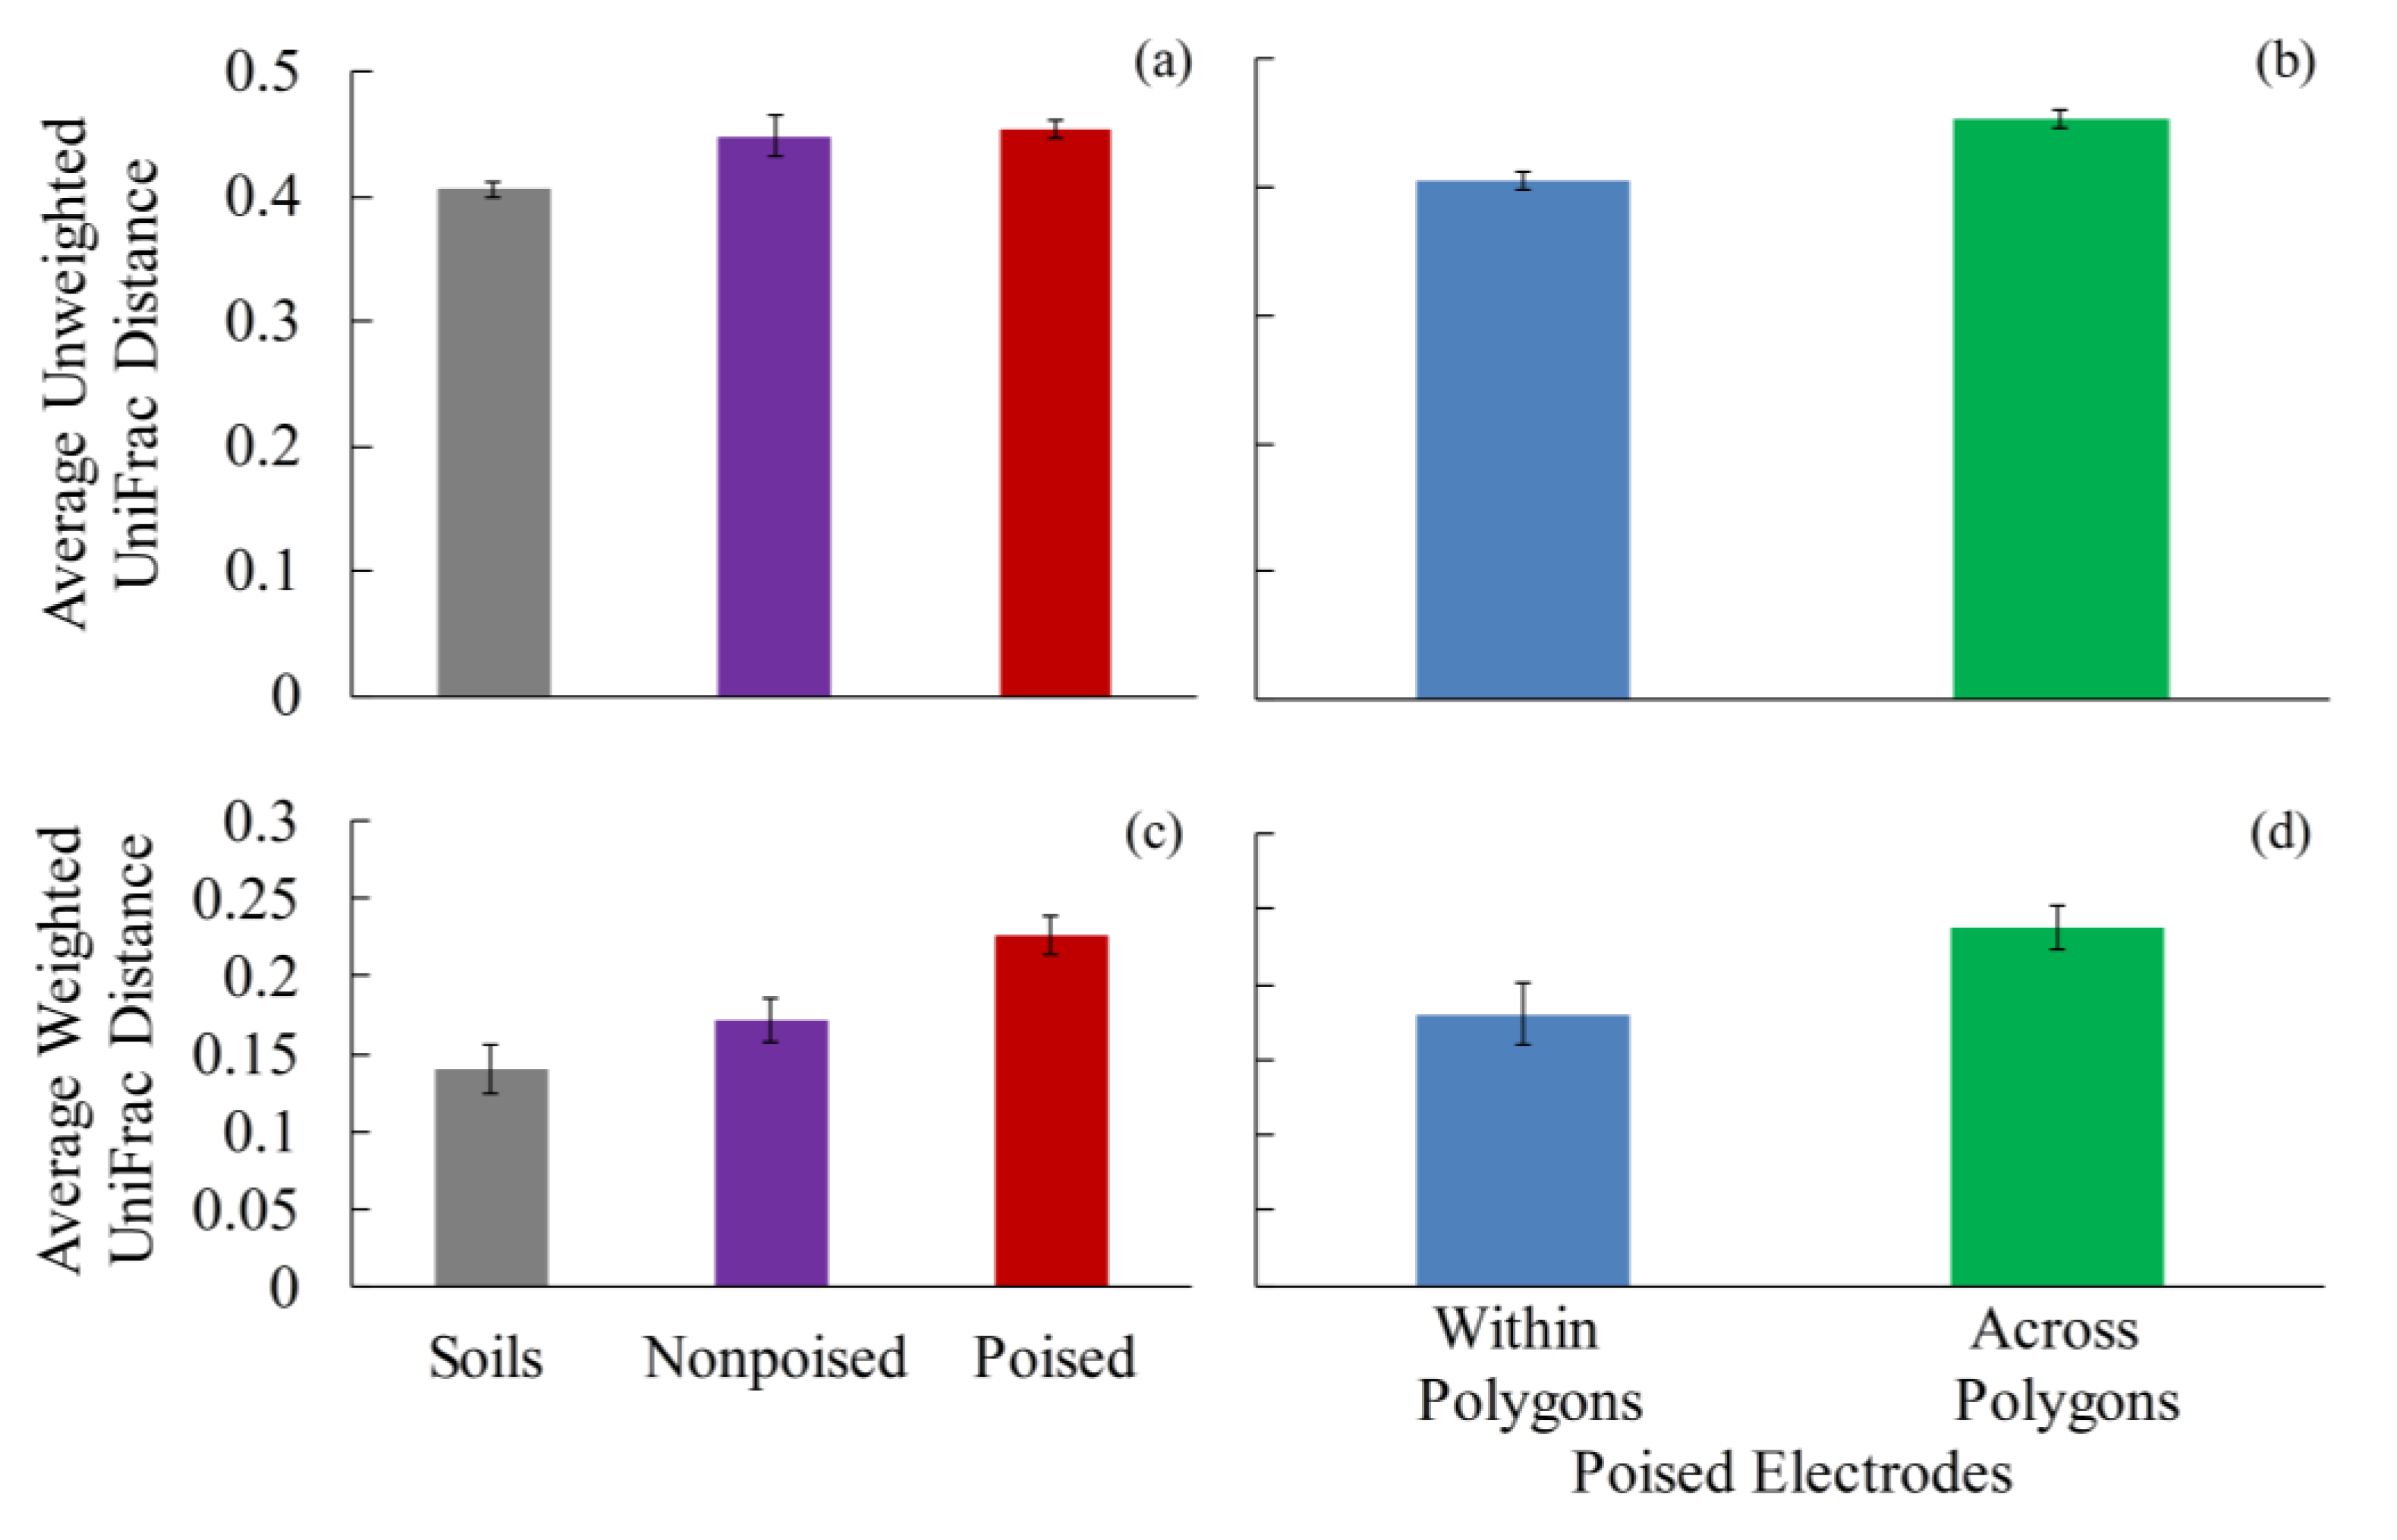
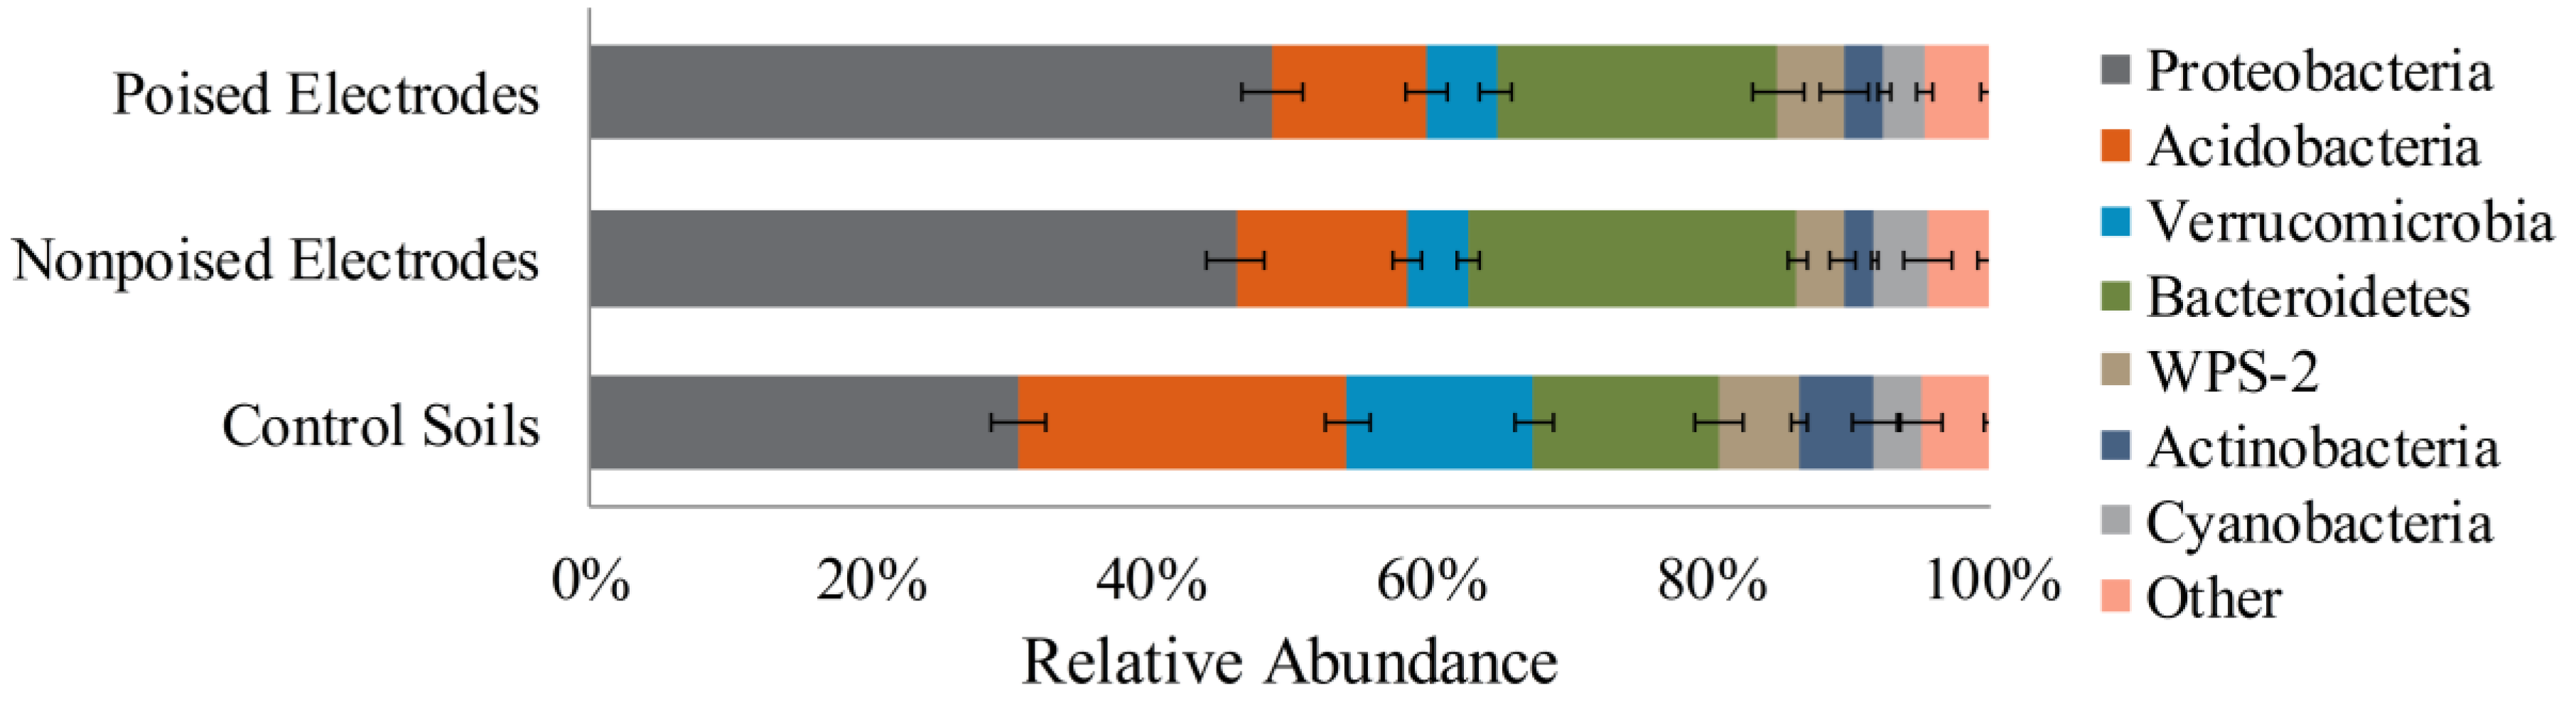
2.2. Electrodes Stimulate a Change in Microbiome

At the end of the five-week experiment, biofilms were harvested from both nonpoised and poised working electrodes and soils in the control chamber to determine the effects of bioelectrochemical manipulation on microbial community structure. We analyzed the microbiomes of 24 samples and with a total sequence count used in our analysis of 4,620,649, the average assigned sequences per sample was 140,166. We achieved an average operational taxonomic units (OUT) assignment of 72.6%. Characterization of 16S rRNA gene sequences revealed significant changes in community structure when electrodes were deployed; the most noticeable differences occurred at the shallow depth. At this depth, the largest differences occurred in the phyla of proteobacteria, acidobacteria, verrucomicrobia, and bacteroidetes (Figure 3). In all three types of samples (i.e., soil, nonpoised electrode, and poised electrodes), these four phyla accounted for 80%–85% of the total microbial populations. The phylum proteobacteria, which includes many DMRB [32,33,34], accounted for 30.5% of the microbial community in control soils, but comprised 41.6% and 48.7% of the community in biofilms harvested from nonpoised and poised electrodes, respectively. In addition, bacteroidetes, which are carbohydrate-consuming anaerobic bacteria and are commonly found in soils and sediments, were also more prevalent in nonpoised (23.5%) and poised (20%) electrode communities than soil communities (13.3%). Meanwhile, percentages of acidobacteria and verrumicrobia decreased in electrode samples (Figure 3). Acidobacteria, which are oligotrophs that prefer low pH environments, had a higher relative abundance in control soils (23.5%) than nonpoised (12.2%) and poised (11%) electrode communities; this result suggests an increase in carbon and/or nutrient availability with electrode deployment, as acidobacteria have been shown to be outcompeted by other microbes when conditions shift from nutrient-poor to nutrient-rich [35]. Verrucomicrobia populations were also lower in poised (5%) and nonpoised (4.4%) samples than control soils (13.3%). Verrucomicrobia is a diverse group of microbes which include species with many possible homologies to proteobacteria [36], and which include species that are capable of methane oxidation [37,38]. The latter poses the possibility that increased methane fluxes from chambers could be due to a decrease in methane utilization, rather than or in addition to stimulating methane production. However, this would need to be verified experimentally, while a mechanism for this is elusive.
Figure 3. Relative abundance of the seven most prevalent bacterial phyla from shallow soil and biofilm samples at the end of a five-week experimental period. Proteobacteria, acidobacteria, verrucomicrobia, and bacteroidetes accounted for >80% of the microbial communities in all three sample types. Error bars indicate standard error, calculated from taxonomic composition of all samples from a given type (i.e., soils, nonpoised electrodes, poised electrodes).
Minerals 03 00318 g003
Beta diversity, which is the differentiation in community structure between individual samples, was calculated using both unweighted and weighted UniFrac distances [39]. Principal coordinates analysis of the UniFrac distances (Figure 4) showed that the weighted method explained more (62%, Figure 4b) of the variation in community structures than the unweighted method (26%, Figure 4a) in the first two principal coordinates. This makes sense because the weighted method includes the relative abundance of OTUs within samples, while the unweighted method does not (it only differentiates based on OTU variation), and we already found abundance differences (Figure 3). In both unweighted and weighted methods, microbial communities from control soil samples were more similar to each other than those from electrode biofilm samples. We did not observe an obvious grouping of electrode communities based on the depth of application, whether the electrode was nonpoised or poised, or based on the specific polygon that the sample was from. This beta diversity analysis mirrors our results from alpha diversity analysis in which electrodes vs. soils showed a diversion in community composition, while the composition was more similar between nonpoised and poised electrodes (Figure 3).
Figure 4. Beta diversity analysis of microbial communities showed using both (a) unweighted and (b) weighted UniFrac principal coordinates. Both unweighted and weighted analysis reveals clustering of soil samples at deep (filled triangles) and shallow (open triangles) depths, however difference in communities from nonpoised (squares) and poised (circles) electrodes are less distinct. Weighted UniFrac, which takes the sequence abundance into account, explains more of the variation in the first two principal coordinates (62% of variation explained) than the unweighted UniFrac analysis (26% of variation explained).
Minerals 03 00318 g004
To determine which OTUs were predictive of sample type (i.e., control soil, nonpoised electrode, or poised electrode), we applied a machine learning method using the pamR package for R [40]. This approach developed an algorithm to predict the sample type of an unknown sample based on microbiome structure by identifying specific OTUs that are predictive (i.e., the OTUs that have characteristic changes between sample types). This algorithm utilized 30 phyla to predict sample type; of the eight most highly predictive phyla, only two (proteobacteria and bacteroidetes) had positive machine learning scores for the electrodes (i.e., high abundance of these phyla indicated the sample was from an electrode community) (Figure 5a). Using three sample types yielded a high error rate of 0.312 (i.e., the algorithm would incorrectly predict the sample type of an unknown sample 31.2% of the time). However, when nonpoised and poised electrodes were grouped together and analyzed against soil communities, the machine learning approach was able to predict sample history (i.e., soil vs. electrode) with a low error rate (0.081) (Figure 5b). In this case, there were 43 predictive phyla utilized in the algorithm; of the 16 most predictive of these phyla, only four (proteobacteria, bacteroidetes, firmicutes, and fibrobacteres) had positive machine learning scores for electrode samples (i.e., a higher abundance of these communities in a sample was indicative of an electrode sample). The remaining 12 phyla had negative machine learning scores for electrode samples. These results suggest that inserting an electrode into the soil: (i) changes the community structure in a nonrandom fashion (predictive); and (ii) decreases overall microbiome diversity, increasing the abundance of a few prominent phyla at the expense of less prominent community members.
Figure 5. Machine learning analysis of soil and biofilm communities from shallow samples reveals the major difference is between communities with an electrode and those without one. When communities are grouped into soil, nonpoised electrodes, and poised electrodes (a), of the 30 phyla used to create the algorithm, there are eight phyla that are highly predictive of sample type, however the error rate is high (0.312) and trends (positive or negative scores) are always the same between nonpoised and poised electrodes. Grouping all electrode samples (both nonpoised and poised) together (b) results in a better ability to predict sample history (error rate = 0.081). In addition, there are 43 phyla used to predict sample history and, of the 16 most predictive phyla, higher abundance of 12 phyla predict the sample to be from a soil sample.
Minerals 03 00318 g005
Alpha diversity, beta diversity, and machine learning analysis of microbial communities all revealed distinct shifts in microbiome structure when an electrode was added to soil, regardless of whether the electrode was nonpoised or poised. One possible explanation for this shift is that the large conductive graphite electrode allows for electron transport over longer distances (i.e., beyond the microbial scale) (especially if the nonpoised electrode spans oxygen gradients in which case the graphite acts as a bioelectrochemical snorkel [41]). Another possible explanation for this shift is that the graphite electrode provides a surface for biofilm growth, which could enrich for biofilm-producing microbes and alter nutrient and substrate dynamics. This alteration in nutrient and substrate dynamics could make certain microbes better suited for growth, and promote their abundance over other less well-suited community members. A nonconductive material could be used to tease apart the mechanisms of community change on the nonpoised electrodes (i.e., biofilm attachment effects vs. conductivity of the electrode).

2.3. Changes in Methane Emissions Correspond to Changes in Microbial Communities

Chambers with either nonpoised or poised electrodes exhibited stimulation in methane emissions and a shift in microbial community structure compared with control chambers. Although the soils in chambers containing nonpoised and poised electrodes were disturbed when electrodes were installed and the soils in the control chambers were not, it is unlikely that this had a significant effect on microbial community structure or greenhouse gas emissions since the chambers and electrodes were installed a week prior to the beginning of measurements, which allowed ample time for the saturated soils to recover from any perturbation [42]. While a hypothesis based on a thermodynamic analysis of microbial respiratory processes would have forecasted a decrease in methane emissions with our BES tool that provided an enlarged chance for iron(III)- and humic acid-reduction, we observed the opposite here (an increase in methane emission). In another study where we placed these electrodes in anaerobic sediments of riparian zones (i.e., an area of land adjacent to a river or stream) in the Northeast of the U.S., the hypothesis based on thermodynamics did hold and we observed a lower methane emission rate [43]. The deviation from the hypothesis here may be specifically related to the peat soils in which we placed our electrodes.
The Arctic climate is known to inhibit decomposition of plant matter [44], which suggests the existence of a buildup of nondegraded organic material (i.e., lignocellulose) in these ecosystems. Since the decomposition of plant matter is achieved via a complex mixed microbial community [45], a bottleneck at the top of this microbial food web would result in retarded downstream processes (e.g., fermentation, iron reduction, and methanogenesis). If either nonpoised or poised electrodes stimulated the breakdown of nondegraded organic material through syntrophic product removal (i.e., increasing the consumption of inhibitory products), the bottleneck at the top of the microbial food web would have widened, resulting in a larger carbon flux through the ecosystem. In other words, the placement of electrodes may have stimulated the breakdown of complex organic matter into acetate, CO2, and hydrogen (H2) to fuel both iron reduction and methanogenesis. This possibility is supported by the marked increase (50%–76%) in bacteroidetes abundance in samples from electrodes (Figure 3), because bacteroidetes are known for their ability to degrade complex organic matter [46]. This theory would provide an explanation for the increases in methane emissions that we observed in chambers with either nonpoised or poised electrodes.

2.4. Poised Electrodes Further Stimulate Methane Emissions with Minimal Changes in Microbiome Structure

Applying a potential to electrodes further stimulated overall methane emissions (mg CH4-C × m−2 × h−1) beyond those observed in chambers with nonpoised electrodes (Figure 1a), although the difference between overall average emissions from chambers with nonpoised and poised electrodes was not significantly different at the shallow (24% increase in emissions, p = 0.07) or deeper depths (13% increase in emissions, p = 0.26) (Figure 1a). To again account for temporal variations in methane emissions, we calculated daily methane emission ratios of chambers with poised electrodes vs. nonpoised electrodes. These ratios indicated that poised electrodes did stimulate methane emissions at both depths compared to nonpoised electrodes (p < 0.01, Figure 2b), and suggests that poising electrodes further stimulated the breakdown of nondegraded organic material. Differences between electrodes located at shallow and deep depths are most likely due to a variety of factors, including: a higher mean soil temperature at shallow depths [5.8 °C vs. 7.0 °C for shallow and deep depths, respectively (p < 0.0001)]; differences between carbon stocks, hydrology, redox conditions, and nutrient availability between depths [47]; and the potential for gases produced at deeper soil depths to be consumed by methane oxidizers or trapped in the subsurface due to diffusion limitations [48].
Alpha diversity of microbial community structure (Figure 3) and principal coordinates analysis of UniFrac distances (beta diversity, Figure 4) did not reveal any differences between microbial communities located at nonpoised and nonpoised electrodes. Another way of visualizing differences between communities is to look at the UniFrac distance between different samples (where a UniFrac distance of 0 indicates identical communities and a distance of 1 indicates completely distinct communities) (Figure 6). In this case, we looked at two scenarios using both unweighted and weighted UniFrac distances: (1) the average distances between samples of different types (i.e., control soils, nonpoised electrodes, poised electrodes) (Figure 6a,c); and (2) the average distances between samples from poised electrodes within the same polygon and across replicate polygons (Figure 6b,d). Samples from control soils were more similar than samples from nonpoised and poised electrodes (Figure 6a,c) using both the unweighted UniFrac distances (ANOVA p = 0.06) and weighted UniFrac distances (ANOVA p = 0.003), which suggests that the electrodes changed microbial communities but not in a uniform way across different samples. This was confirmed by looking at the average UniFrac distances between poised electrode samples within and across replicate polygons (Figure 6b,d). The average UniFrac distance between samples across replicate polygons was greater than the distance between samples within polygons for both the unweighted UniFrac distances (p = 0.004) and weighted UniFrac distances (p = 0.07), indicating that the response of microbiomes to bioelectrochemical manipulation was similar within a given polygon but different across polygons. Despite their proximity to one another, the replicate polygons did have slight differences in environmental conditions, suggesting that communities will respond differently to bioelectrochemical manipulation depending on specific environmental factors (e.g., temperature, pH) (Figure 7).
Despite minimal changes in microbial community structure, poising electrodes increased methane emissions. It is possible that while there were minimal changes in microbial community structure, poising an electrode resulted in changes in the metabolic processes of certain microbes, eventually leading to stimulation in methane emissions. This would require proteomic and transcriptomic investigation to determine the specific metabolic functions of microbes. Regardless, it is clear that applying a potential to electrodes in Arctic soils stimulates methane emissions, however the mechanisms are unclear and were not elucidated by analysis of microbiome structure.
Figure 6. Average unweighted (a,b) and weighted (c,d) UniFrac distances between samples of different types. Microbial communities in soil samples from different polygons were more similar than communities from nonpoised and poised electrodes using both unweighted (one-way ANOVA, p = 0.06) and weighted UniFrac (one-way ANOVA, p = 0.008) distances (a,c). Additionally, microbial communities from poised electrodes within the same polygon were more similar than communities from poised electrodes in the other polygons using both unweighted (two-sample t-test, p = 0.004) and weighted (two-sample t-test, p = 0.07) UniFrac distances (b,d).
Minerals 03 00318 g006
Figure 7. Environmental data from the three polygons studied during this experiment: (a) pH; (b) soil temperature; (c) dissolved oxygen; (d) oxidation-reduction potential; and (e) soil conductivity. Data was collected from both 7 and 10 cm depths over the five-week long experiment. Despite the close proximity (all within a ~10 m radius), there were differences in (a) pH, (c) dissolved oxygen, (d) oxidation-reduction potential, and (e) soil conductivity across polygons. Polygon C had a lower pH and higher dissolved oxygen than polygons A and B, while polygon A had a lower soil conductivity than polygons A and C. Oxidation-reduction potential showed the largest difference across polygons; polygon A had the lowest (most reducing) potential while polygon C had the highest (most oxidizing) potential.
Minerals 03 00318 g007

3. Experimental Section

Field Location and Experimental Setup. Field experiments were located in the Biocomplexity Experiment site, which is a medium-aged (50–300 years old) drained-thaw lake basin located within the Barrow Environmental Observatory in Barrow, AK, USA [49,50,51]. Nine soil chambers were deployed in the depressed center of each of three adjacent ice-wedge polygons (total of 27 soil chambers), which are saturated for most or all of the summer [30]. Within each polygon, we installed three control chambers (with only soil and no electrode), two chambers with nonpoised electrodes (one chamber with an electrode at 6 cm and one chamber with an electrode at 14 cm below soil surface), and four chambers with poised electrodes (two chambers with an electrode at 6 cm and two chambers with an electrode at 14 cm below soil surface). Both soil chambers and electrodes were inserted after first making small incisions with a serrated knife to minimize disruption to the soil. In the control chambers, an electrode incision was not made, because a void without subsequently placing in an electrode could have provided an artificial avenue for prolonged oxygen diffusion into anaerobic soils.
Bioelectrochemical Systems. For the working and counter electrodes, 8 cm × 2.5 cm × 0.6 cm blocks were machined from medium-extruded graphite plates (GT01135, Graphite Store, Buffalo Grove, IL, USA). Holes (1.5875 mm) were drilled in the top of the blocks and the exposed end of a 3 m length of 18-gauge stranded copper wire was inserted into the hole. The electrical connection was reinforced with a conductive carbon adhesive (#12664, Electron Microscopy Sciences, Hatfield, PA, USA), and the connection was sealed using a urethane adhesive (#4024, Hardman, Sound Bend, IN, USA). The working electrode was poised at 0.1 VSHE using a microcontroller-based potentiostat [31] and an Ag/AgCl reference electrode (RE), and electrical current was recorded (Figure A1).
Soil Chamber Construction. Soil chambers were constructed from 20 cm lengths of 10.15 cm diameter polyvinyl-chloride (PVC) pipe. When buried in the soil, 14 cm of each chamber was below the soil surface, with 6 cm above the surface. An 8 cm × 8 cm portion was removed from the subsurface section of the soil chamber, and replaced with an anion exchange membrane (AMI-7001S, Membranes International, Glen Rock, NJ, USA). The WE and RE were placed inside the soil chamber, while the counter electrode was placed outside the chamber to ensure that cathodic activity did not influence gas flux measurements. A 10.15 cm PVC slip cap was used as the top of the soil chamber. To ensure an airtight seal, a rubber gasket was placed around the outside of the soil chamber and the cap was then placed on the chamber over the gasket. Two 0.635 cm barbed brass pipe fittings were attached to the top of the cap and sealed with urethane adhesive, and 45 m of 0.318 cm tubing (#57328, U.S. Plastics, Lima, OH, USA) was attached to each fitting. One tube was connected to the input of a gas analyzer (Fast Greenhouse Gas Analyzer, Los Gatos Research, Mountain View, CA, USA) while the other tube was connected to the output. Connections to the gas analyzer were made using Swagelok tube fittings (SS-405-2 & SS-400-6, Swagelok Western New York, West Henrietta, NY, USA). A 0.635 cm cylindrical septum (AT6526, Grace Davison Discovery Science, Deerfield, IL, USA) was affixed to the PVC cap with urethane adhesive, and during measurements the chamber was vented with a 21G needle (#305129, VWR, USA) to prevent pressure differentials within the soil chamber.
Measurements. Carbon dioxide and methane concentrations were measured every Monday, Wednesday, and Friday using the gas analyzer. To do this, the PVC cap was placed on the soil chamber and measurement of CH4 and CO2 concentrations (ppm) began. There was a delay of approximately 45 s between the time that the PVC cap was placed on the chamber and the time that CH4 and CO2 concentrations began to increase. Data was recorded every s for 5 min from the point when CH4 and CO2 concentrations began to increase. After analysis was complete, the PVC cap was removed from the chamber, placed on its side, and ambient air was pumped through the tubing and gas analyzer for 3 min before beginning the next measurement. CH4 and CO2 flux rates were calculated as the slope of the linear regression line over the 5 min measurement period (300 data points). R2 values for all 405 measurements were greater than 0.7, and were greater than 0.9 for 399 of the 405 measurements.
Soil temperature (°C), pH, redox potential (mV), dissolved oxygen (mg/L), and soil conductivity (µS/cm) were measured with a portable multiparameter meter and probes (Orion* 5-Star Meter, pH/ATC Triode 9107WMMD, DO probe 083010MD, Conductivity cell 013010MD, Thermo Scientific, Pittsburgh, PA, USA). Measurements were taken at 7 cm and 10 cm below the soil surface from two locations in each polygon. Soil water was collected weekly from within each soil chamber for analysis of Fe2+ and Fe3+ using porous soil moisture samplers (#220300, Rhizosphere, Wageningen, The Netherlands) and vacutainers (VT6430, BD, Franklin Lakes, NJ, USA).
Microbial Community Analysis. Soil samples were collected from each of the three polygons for sequencing on 8, 15, 28 July and 11 August 2012. Background samples were collected from both the depressed, saturated centers of the polygons and the elevated, dry rims. Soils were sampled using a sterile serrated knife from two depths (0–7 cm and 7–14 cm below the surface) and stored in Bitran bags (#19-240-150, Fischer Scientific, Waltham, MA, USA). Upon the completion of the experiment, biofilm samples were collected from all working- and counter-electrodes by scraping the biofilms into a 15 mL centrifuge tube (#93000-026, VWR, Radnor, PA, USA) with a sterile razor blade. Both soil and biofilm samples (~0.25–3 g) were placed on wet ice in the field and stored at −20 °C within 2 h of collection. Genomic DNA was extracted using a PowerSoil® DNA Isolation Kit (MoBio, Carlsbad, CA, USA), and samples were PCR amplified and sequenced according to the protocols from the Earth Microbiome Project [52]. In short, triplicate 25 µL PCR reactions were conducted using: 13 µL grade water, 10 µL mastermix (5 Prime Hot MasterMix, Catalog # 2200110, 5 Prime, Fischer Scientific, USA), 0.5 µL 515f forward primer [53], 0.5 µL 806r barcoded reverse primer [54], and 1 µL template DNA. Reactions were run under the following conditions: 94 °C for 3 min; then 94 °C for 45 s, 50 °C for 60 s, and 72 °C for 90 s (repeated 25 times); 72 °C for 10 min, and then hold at 4 °C. Triplicate PCR products were pooled, confirmed with gel electrophoresis, cleaned using the MoBio UltraClear PCR Clean-Up Kit (#12500, MoBio, Carlsbad, CA, USA) according to the manufacturer’s instructions, pooled at equimolar ratios, and sequenced using an Illumina HiSeq (Illumina, San Diego, CA, USA) (Online sequence data access [55]; study id: 1692; study name: Friedman_arctic_peat_soil). The resulting sequences were assigned to barcodes, grouped into OTUs, and analyzed using the Quantitative Insights Into Microbial Ecology (QIIME v1.6) platform [54]. Machine learning analysis was performed using the pamR package in R [41,56].

4. Conclusions

This work demonstrates a research tool combining electrochemical, ecological, and microbial techniques to study complex subsurface ecosystems. Both nonpoised and poised electrodes stimulated methane emissions (15%–43%) from Arctic peat soils and altered microbial community structure. Analysis of alpha and beta diversity of soil communities and the application of machine learning techniques demonstrated that there was a large difference in microbial communities between samples (enrichment for already dominant proteobacteria and bacteroidetes phyla) from soils and those from either nonpoised or poised electrodes, although there were minimal differences in microbiome structure between samples from nonpoised and poised electrodes. Despite this, poising the electrode did stimulate methane emissions beyond those from nonpoised electrodes. We suspect that the stimulation of methane emissions is due to a bottleneck in the microbial food web at the initial breakdown of nondegraded organic material that is stimulated by both nonpoised and poised electrodes, which in turn stimulates downstream microbial processes (including methanogenesis). The mechanism of this stimulation is unknown, but could be due to physical effects from the electrode, electron transport across the electrode surface, or the stimulation of syntrophic product removal. Regardless, these results suggest that there is a potential for increased carbon release from Arctic soils under changing conditions, and we must understand the biogeochemical relationships that govern microbial processes to be able to predict the responses of these systems to changing conditions.

Acknowledgments

The authors would like to acknowledge the Earth Microbiome Project (EMP) and Rob Knight (University of Colorado at Boulder) for 16S rRNA gene amplification and sequencing, Cristina Solis (LA Academy) for assistance in conducting field work, and Jeffrey Werner (SUNY Cortland) and James Gossett (Cornell University) for helpful discussions. This work was funded by the U.S. NSF Grant #0808604.

Conflicts of Interest

The authors declare no conflict of interest.

References

  1. Tarnocai, C.; Canadell, J.G.; Schuur, E.A.G.; Kuhry, P.; Mazhitova, G.; Zimov, S. Soil organic carbon pools in the northern circumpolar permafrost region. Glob. Biogeochem. Cycles 2009, 23, GB2023. [Google Scholar] [CrossRef]
  2. Schuur, E.A.G.; Bockheim, J.; Canadell, J.G.; Euskirchen, E.; Field, C.B.; Goryachkin, S.V.; Hagemann, S.; Kuhry, P.; Lafleur, P.M.; Lee, H.; et al. Vulnerability of permafrost carbon to climate change: Implications for the global carbon cycle. Bioscience 2008, 58, 701–714. [Google Scholar] [CrossRef]
  3. Schuur, E.A.G.; Abbott, B.W.; Bowden, W.B.; Brovkin, V.; Camill, P.; Canadell, J.G.; Chanton, J.P.; Chapin, F.S., III; Christensen, T.R.; Ciais, P.; et al. Expert assessment of vulnerability of permafrost carbon to climate change. Clim. Chang. 2013, 119, 359–374. [Google Scholar] [CrossRef]
  4. Solomon, S.; Qin, D.; Manning, M.; Chen, Z.; Marquis, M.; Averyt, K.B.; Tignor, M.; Miller, H.L. Climate Change 2007: The Physical Science Basis; Contribution of Working Group I to the Fourth Assessment Report of the Intergovernmental Panel on Climate Change; Cambridge University Press: Cambridge, UK, 2007. [Google Scholar]
  5. Natali, S.M.; Schuur, E.A.G.; Rubin, R.L. Increased plant productivity in Alaskan tundra as a result of experimental warming of soil and permafrost. J. Ecol. 2012, 100, 488–498. [Google Scholar] [CrossRef]
  6. Lee, H.; Schuur, E.A.G.; Inglett, K.S.; Lavoie, M.; Chanton, J.P. The rate of permafrost carbon release under aerobic and anaerobic conditions and its potential effects on climate. Glob. Chang. Biol. 2012, 18, 515–527. [Google Scholar] [CrossRef]
  7. Graham, D.E.; Wallenstein, M.D.; Vishnivetskaya, T.A.; Waldrop, M.P.; Phelps, T.J.; Pfiffner, S.M.; Onstott, T.C.; Whyte, L.G.; Rivkina, E.M.; Gilichinsky, D.A.; et al. Microbes in thawing permafrost: The unknown variable in the climate change equation. ISME J. 2012, 6, 709–712. [Google Scholar] [CrossRef]
  8. Riley, W.J.; Subin, Z.M.; Lawrence, D.M.; Swenson, S.C.; Torn, M.S.; Meng, L.; Mahowald, N.M.; Hess, P. Barriers to predicting changes in global terrestrial methane fluxes: Analyses using CLM4Me, a methane biogeochemistry model integrated in CESM. Biogeosciences 2011, 8, 1925–1953. [Google Scholar] [CrossRef]
  9. Meng, L.; Hess, P.G.M.; Mahowald, N.M.; Yavitt, J.B.; Riley, W.J.; Subin, Z.M.; Lawrence, D.M.; Swenson, S.C.; Jauhiainen, J.; Fuka, D.R. Sensitivity of wetland methane emissions to model assumptions: Application and model testing against site observations. Biogeosci. Discuss. 2011, 8, 6095–6160. [Google Scholar] [CrossRef]
  10. Schmidt, M.W.I.; Torn, M.S.; Abiven, S.; Dittmar, T.; Guggenberger, G.; Janssens, I.A.; Kleber, M.; Kogel-Knabner, I.; Lehmann, J.; Manning, D.A.C.; et al. Persistence of soil organic matter as an ecosystem property. Nature 2011, 478, 49–56. [Google Scholar] [CrossRef]
  11. Bell, T.H.; Callender, K.L.; Whyte, L.G.; Greer, C.W. Microbial competition in polar soils: A review of an understudied but potentially important control on productivity. Biology 2013, 2, 533–554. [Google Scholar] [CrossRef]
  12. Schuur, E.A.G.; Abbott, B. Climate change: High risk of permafrost thaw. Nature 2011, 480, 32–33. [Google Scholar] [CrossRef]
  13. Lovley, D.R.; Coates, J.D.; Blunt-Harris, E.L.; Phillips, E.J.P.; Woodward, J.C. Humic substances as electron acceptors for microbial respiration. Nature 1996, 382, 445–448. [Google Scholar] [CrossRef]
  14. Tender, L.M.; Reimers, C.E.; Stecher, H.A., III; Holmes, D.E.; Bond, D.R.; Lowy, D.A.; Pilobello, K.; Fertig, S.J.; Lovley, D.R. Harnessing microbially generated power on the seafloor. Nat. Biotechnol. 2002, 20, 821–825. [Google Scholar] [CrossRef]
  15. Nealson, K.H.; Saffarini, D. Iron and manganese in anaerobic respiration: Environmental significance, physiology, and regulation. Annu. Rev. Microbiol. 1994, 48, 311–343. [Google Scholar] [CrossRef]
  16. Venkateswaran, K.; Dollhopf, M.E.; Aller, R.; Stackebrandt, E.; Nealson, K.H. Shewanella amazonensis sp. nov., a novel metal-reducing facultative anaerobe from Amazonian shelf muds. Int. J. Syst. Evol. Bacteriol. 1998, 48, 965–972. [Google Scholar] [CrossRef]
  17. He, Z.; Minteer, S.D.; Angenent, L.T. Electricity generation from artificial wastewater using an upflow microbial fuel cell. Environ. Sci. Technol. 2005, 39, 5262–5267. [Google Scholar] [CrossRef]
  18. Fornero, J.J.; Rosenbaum, M.; Angenent, L.T. Electric power generation from municipal, food, and animal wastewaters using microbial fuel cells. Electroanal. 2010, 22, 832–843. [Google Scholar] [CrossRef]
  19. Logan, B.E.; Hamelers, B.; Rozendal, R.; Schroder, U.; Keller, J.; Freguia, S.; Aelterman, P.; Verstraete, W.; Rabaey, K. Microbial fuel cells: Methodology and technology. Environ. Sci. Technol. 2006, 40, 5181–5192. [Google Scholar] [CrossRef]
  20. Villano, M.; Aulenta, F.; Beccaru, M.; Majone, M. Microbial generation of H2 or CH4 coupled to wastewater treatment in bioelectrochemical systems. Chem. Eng. Trans. 2010, 20, 163–168. [Google Scholar]
  21. Rosenbaum, M.; Aulenta, F.; Villano, M.; Angenent, L.T. Cathodes as electron donors for microbial metabolism: Which extracellular electron transfer mechanisms are involved? Bioresour. Technol. 2011, 102, 324–333. [Google Scholar] [CrossRef]
  22. Cusick, R.D.; Bryan, B.; Parker, D.S.; Merrill, M.D.; Mehanna, M.; Kiely, P.D.; Liu, G.L.; Logan, B.E. Performance of a pilot-scale continuous flow microbial electrolysis cell fed winery wastewater. Appl. Microbiol. Biotechnol. 2011, 89, 2053–2063. [Google Scholar] [CrossRef]
  23. Huang, D.Y.; Zhou, S.G.; Chen, Q.; Zhao, B.; Yuan, Y.; Zhuang, L. Enhanced anaerobic degradation of organic pollutants in a soil microbial fuel cell. Chem. Eng. J. 2011, 172, 647–653. [Google Scholar] [CrossRef]
  24. Strycharz, S.M.; Gannon, S.M.; Boles, A.R.; Franks, A.E.; Nevin, K.P.; Lovley, D.R. Reductive dechlorination of 2-chlorophenol by Anaeromyxobacter dehalogenans with an electrode serving as the electron donor. Environ. Microbiol. Rep. 2010, 2, 289–294. [Google Scholar] [CrossRef]
  25. Morris, J.M.; Jin, S.; Crimi, B.; Pruden, A. Microbial fuel cell in enhancing anaerobic biodegradation of diesel. Chem. Eng. J. 2009, 146, 161–167. [Google Scholar] [CrossRef]
  26. Strycharz, S.M.; Woodard, T.L.; Johnson, J.P.; Nevin, K.P.; Sanford, R.A.; Loffler, F.E.; Lovley, D.R. Graphite electrode as a sole electron donor for reductive dechlorination of tetrachlorethene by Geobacter lovleyi. Appl. Environ. Microbiol. 2008, 74, 5943–5947. [Google Scholar] [CrossRef]
  27. Heitmann, T.; Goldhammer, T.; Beer, J.; Blodau, C. Electron transfer of dissolved organic matter and its potential significance for anaerobic respiration in a northern bog. Glob. Chang. Biol. 2007, 13, 1771–1785. [Google Scholar] [CrossRef]
  28. Keller, J.K.; Takagi, K.K. Solid-phase organic matter reduction regulates anaerobic decomposition in bog soil. Ecosphere 2013, 4. [Google Scholar] [CrossRef]
  29. Lipson, D.A.; Raab, T.K.; Goria, D.; Zlamal, J. The contribution of Fe(III) and humic acid reduction to ecosystem respiration in drained thaw lake basins of the Arctic Coastal Plain. Glob. Biogeochem. Cycles 2013, 27, 399–409. [Google Scholar] [CrossRef]
  30. Lipson, D.A.; Jha, M.; Raab, T.K.; Oechel, W.C. Reduction of iron (III) and humic substances plays a major role in anaerobic respiration in an Arctic peat soil. J. Geophys. Res. Biogeosci. 2010, 115, G00I06. [Google Scholar] [CrossRef]
  31. Friedman, E.S.; Rosenbaum, M.A.; Lee, A.W.; Lipson, D.A.; Land, B.R.; Angenent, L.T. A cost-effective and field-ready potentiostat that poises subsurface electrodes to monitor bacterial respiration. Biosens. Bioelectron. 2012, 32, 309–313. [Google Scholar] [CrossRef]
  32. Lonergan, D.J.; Jenter, H.L.; Coates, J.D.; Phillips, E.J.; Schmidt, T.M.; Lovley, D.R. Phylogenetic analysis of dissimilatory Fe(III)-reducing bacteria. J. Bacteriol. 1996, 178, 2402–2408. [Google Scholar]
  33. Gault, A.G.; Ibrahim, A.; Langley, S.; Renaud, R.; Takahashi, Y.; Boothman, C.; Lloyd, J.R.; Clark, I.D.; Ferris, F.G.; Fortin, D. Microbial and geochemical features suggest iron redox cycling within bacteriogenic iron oxide-rich sediments. Chem. Geol. 2011, 281, 41–51. [Google Scholar] [CrossRef]
  34. Kostka, J.E.; Nealson, K.H. Dissolution and reduction of magnetite by bacteria. Environ. Sci. Technol. 1995, 29, 2535–2540. [Google Scholar] [CrossRef]
  35. Inceoglu, O.; Al-Soud, W.A.; Salles, J.F.; Semenov, A.V.; van Elsas, J.D. Comparative analysis of bacterial communities in a potato field as determined by pyrosequencing. PLoS One 2011, 6, e23321. [Google Scholar] [CrossRef]
  36. Hou, S.B.; Makarova, K.S.; Saw, J.H.W.; Senin, P.; Ly, B.V.; Zhou, Z.M.; Ren, Y.; Wang, J.M.; Galperin, M.Y.; Omelchenko, M.V.; et al. Complete genome sequence of the extremely acidophilic methanotroph isolate V4, Methylacidiphilum infernorum, a representative of the bacterial phylum Verrucomicrobia. Biol. Direct 2008, 3, 26. [Google Scholar] [CrossRef]
  37. Freitas, S.; Hatosy, S.; Fuhrman, J.A.; Huse, S.M.; Welch, D.B.M.; Sogin, M.L.; Martiny, A.C. Global distribution and diversity of marine Verrucomicrobia. ISME J. 2012, 6, 1499–1505. [Google Scholar] [CrossRef]
  38. Pol, A.; Heijmans, K.; Harhangi, H.R.; Tedesco, D.; Jetten, M.S.M.; Op den Camp, H.J. Methanotrophy below pH1 by a new Verrucomicrobia species. Nature 2007, 450, 874–878. [Google Scholar] [CrossRef]
  39. Lozupone, C.; Knight, R. UniFrac: A new phylogenetic method for comparing microbial communities. Appl. Environ. Microbiol. 2005, 71, 8228–8235. [Google Scholar] [CrossRef]
  40. Tibshirani, R.; Hastie, T.; Narasimhan, B.; Chu, G. Diagnosis of multiple cancer types by shrunken centroids of gene expression. Proc. Natl. Acad. Sci.USA 2002, 99, 6567–6572. [Google Scholar] [CrossRef]
  41. Erable, B.; Etcheverry, L.; Bergel, A. From microbial fuel cell (MFC) to microbial electrochemical snorkel (MES): Maximizing chemical oxygen demand (COD) removal from wastewater. Biofouling 2011, 27, 319–326. [Google Scholar] [CrossRef] [Green Version]
  42. Hoover, C.M. Field Measurements for Forest Carbon Monitoring: A Landscape Scale Approach; Springer: Berlin, Germany, 2008. [Google Scholar]
  43. Friedman, E.S. Bioelectrochemical Systems as Tools to Study Subsurface Biogeochemical Processes; Cornell University: Ithaca, NY, USA, 2013. [Google Scholar]
  44. Callaghan, T.V.; Bjorn, L.O.; Chernov, Y.; Chapin, T.; Christensen, T.R.; Huntley, B.; Ims, R.A.; Johansson, M.; Jolly, D.; Jonasson, S.; et al. Effects on the function of arctic ecosystems in the short- and long-term perspectives. Ambio 2004, 33, 448–458. [Google Scholar]
  45. Agler, M.T.; Wrenn, B.A.; Zinder, S.H.; Angenent, L.T. Waste to bioproduct conversion with undefined mixed cultures: The carboxylate platform. Trends Biotechnol. 2011, 29, 70–78. [Google Scholar] [CrossRef]
  46. Thomas, F.; Hehemann, J.H.; Rebuffet, E.; Czjzek, M.; Michel, G. Environmental and gut bacteroidetes: The food connection. Front. Microbiol. 2011, 2, 93. [Google Scholar] [CrossRef]
  47. Olefeldt, D.; Roulet, N.T. Effects of permafrost and hydrology on the composition and transport of dissolved organic carbon in a subarctic peatland complex. J. Geophys. Res. Biogeosci. 2012, 117, G01005. [Google Scholar] [CrossRef]
  48. Lee, H.; Schuur, E.A.G.; Vogel, J.G. Soil CO2 production in upland tundra where permafrost is thawing. J. Geophys. Res. Biogeosci. 2010, 115, G01009. [Google Scholar] [CrossRef]
  49. Hinkel, K.M.; Eisner, W.R.; Bockheim, J.G.; Nelson, F.E.; Peterson, K.M.; Dai, X.Y. Spatial extent, age, and carbon stocks in drained thaw lake basins on the Barrow Peninsula, Alaska. Arct. Antarct. Alp. Res. 2003, 35, 291–300. [Google Scholar] [CrossRef]
  50. Hinkel, K.M.; Paetzold, F.; Nelson, F.E.; Bockheim, J.G. Patterns of soil temperature and moisture in the active layer and upper permafrost at Barrow, Alaska: 1993–1999. Glob. Planet. Chang. 2001, 29, 293–309. [Google Scholar] [CrossRef]
  51. Zona, D.; Oechel, W.C.; Kochendorfer, J.; Paw U, K.T.; Salyuk, A.N.; Olivas, P.C.; Oberbauer, S.F.; Lipson, D.A. Methane fluxes during the initiation of a large-scale water table manipulation experiment in the Alaskan Arctic tundra. Glob. Biogeochem. Cycles 2009, 23, GB2013. [Google Scholar] [CrossRef]
  52. Gilbert, J.A.; Meyer, F.; Jansson, J.; Gordon, J.; Pace, N.; Tiedje, J.; Ley, R.; Fierer, N.; Field, D.; Kyrpides, N.; et al. The Earth Microbiome Project: Meeting report of the “1st EMP meeting on sample selection and acquisition” at Argonne National Laboratory October 6th 2010. Stand. Genomic Sci. 2010, 3, 249–253. [Google Scholar] [CrossRef]
  53. Caporaso, J.G.; Lauber, C.L.; Walters, W.A.; Berg-Lyons, D.; Huntley, J.; Fierer, N.; Owens, S.M.; Betley, J.; Fraser, L.; Bauer, M.; et al. Ultra-high-throughput microbial community analysis on the Illumina HiSeq and MiSeq platforms. ISME J. 2012, 6, 1621–1624. [Google Scholar] [CrossRef]
  54. Caporaso, J.G.; Kuczynski, J.; Stombaugh, J.; Bittinger, K.; Bushman, F.D.; Costello, E.K.; Fierer, N.; Pena, A.G.; Goodrich, J.K.; Gordon, J.I.; et al. QIIME allows analysis of high-throughput community sequencing data. Nat. Methods 2010, 7, 335–336. [Google Scholar] [CrossRef]
  55. Earth Microbiome Project Home Page. Available online: http://www.microbio.me/emp/ (accessed on 18 September 2013).
  56. R Core Team. R: A Language and Environment for Statistical Computing. Available online: http://www.R-project.org (accessed on 18 September 2013).

Appendix

Figure A1. Electrical current from poised electrodes at shallow (a) and deep (b) depths recorded by microcontroller-based potentiostats. At the shallow depth (a), all electrodes begin with similar currents and then change over the course of the five-week experiment, with the currents in polygon A increasing by ~40 µA in the middle of the experiment. Electrical current is more erratic in electrodes at deep depths (b).
Minerals 03 00318 g008

