Article

Integrating Remote Sensing and Aeromagnetic Data for Enhanced Geological Mapping at Wadi Sibrit-Urf Abu Hamam District, Southern Part of Nubian Shield

1
Geology Department, Faculty of Science, Al-Azhar University, Nasr City, Cairo 11884, Egypt
2
Abdullah Alrushaid Chair for Earth Science Remote Sensing Research, Geology and Geophysics Department, King Saud University, Riyadh 1145, Saudi Arabia
3
Department of Geology, Tanta University, Tanta 31527, Egypt
4
College of Engineering, Northern Border University, Arar 73213, Saudi Arabia
5
Nuclear Materials Authority, P.O. Box 530, El-Maadi, Cairo 11728, Egypt
*
Author to whom correspondence should be addressed.
Minerals 2025, 15(6), 657; https://doi.org/10.3390/min15060657
Submission received: 23 April 2025 / Revised: 7 June 2025 / Accepted: 10 June 2025 / Published: 18 June 2025
(This article belongs to the Section Mineral Exploration Methods and Applications)

Abstract

:
The present study aims to characterize complex geological structures and significant mineralization using remote sensing and aeromagnetic studies. Structural lineaments play a crucial role in the localization and concentration of mineral deposits. For the first time over the study district, a combination of aeromagnetic data, Landsat 9, ASTER, and PRISMA hyperspectral data was utilized to enhance the characterization of both lithological units and structural features. Advanced image processing techniques, including false color composites, principal component analysis (PCA), independent component analysis (ICA), and SMACC, were applied to the remote sensing datasets. These methods enabled effective discrimination between Phanerozoic rock formations and the complex basement units, which comprise the island arc assemblage, Dokhan volcanics, and late-orogenic granites. The local and deep magnetic sources were separated using Gaussian filters. The Neoproterozoic basement rocks were estimated using the radial average power spectrum technique and the Euler deconvolution technique (ED). According to the RAPS technique, the average depths to shallow and deep magnetic sources are approximately 0.4 km and 1.6 km, respectively. The obtained ED contacts range in depth from 0.081 to 1.5 km. The research area revealed massive structural lineaments, particularly in the northeast and northwest sides, where a dense concentration of these lineaments was identified. The locations with the highest densities are thought to signify more fracturization in the rocks that are thought to be connected to mineralization. According to the automatic lineament extraction methods and rose diagram, NW-SE, NNE-SSW, and N-S are the major structural directions. These trends were confirmed and visually represented through textural analysis and drainage pattern control. The lithological mapping results were validated through field observations and petrographic analysis. This integrated approach has proven highly effective, showcasing significant potential for both detailed structural analysis and accurate lithological discrimination, which may be related to further mineralization exploration.

1. Introduction

The Arabian–Nubian Shield (ANS) is a prominent Neoproterozoic geological province that spans both sides of the Red Sea and the Gulf of Aden, encompassing the Nubian Shield in northeastern Africa and the Arabian Shield in the western Arabian Peninsula. It consists mainly of rocks dating from approximately 980 to 535 million years ago, interspersed with older Archean and Paleoproterozoic fragments [1,2]. The ANS formed within the broader context of a supercontinent cycle, as outlined by [3], occurring between the breakup of Rodinia (circa 900–720 Ma) [4] and the assembly of Gondwana (circa 650–530 Ma), which coincides with the East African orogeny [5]. Geochemical analyses—particularly the presence of non-radiogenic initial strontium (Sr) and radiogenic initial neodymium (Nd) isotopic compositions in igneous rocks—provide strong evidence that the Arabian–Nubian Shield (ANS) represents juvenile crust formed during the Neoproterozoic era [2].
The tectonic evolution of the Arabian–Nubian Shield (ANS) has been interpreted through several conceptual models. One of the earliest, proposed by [6], describes four distinct stages: an initial oceanic phase involving the formation of oceanic crust and ophiolites; a subsequent island arc phase characterized by volcanic and plutonic activity; followed by two batholithic phases—first calc-alkaline, then alkaline—indicating a progression in magmatic processes over time. An alternative model, presented by [7,8], outlines three main stages: an early subduction phase that produced island arc volcanic and sedimentary sequences; a continental collision phase resulting from the convergence of East and West Gondwana, which formed the East African Orogen; and a final post-collisional phase, marked by the stabilization of the ANS crust.
The Arabian–Nubian Shield (ANS) consists of juvenile Neoproterozoic rocks (dated between 870 and 540 Ma), formed during a supercontinent cycle [9,10], and is interspersed with older Archean to Paleoproterozoic structural remnants. It is one of the largest and most well-preserved orogenic belts of the newly formed Proterozoic crust on Earth [10,11,12]. Due to its significant geological relevance, the ANS has been the focus of extensive research, covering a wide range of disciplines including geodynamics, structural geology, geophysics, and economic geology [13,14,15,16,17,18,19,20,21,22,23,24,25,26,27,28,29,30].
The South Eastern Desert of Egypt, a segment of the broader Eastern Desert, holds substantial geological significance. Renowned for its intricate geological evolution, diverse lithological units, and abundant mineral resources, this region features a complex assembly of tectonic terranes that were accreted and deformed during the Pan-African orogeny—a major mountain-building episode that led to the development of the Arabian–Nubian Shield. The area is primarily composed of Neoproterozoic juvenile continental crust, formed through magmatic arc accretion followed by post-tectonic magmatic activity [31].
The integration of remote sensing and aeromagnetic data has proven to be an effective approach for identifying structural and lithological features. While magnetic data reveal information about the magnetic properties of rocks both at the surface and at depth, remote sensing datasets—such as ASTER, Landsat 9, and PRISMA hyperspectral imagery—capture spectral characteristics limited to surface materials. A key goal of aeromagnetic surveys is to link magnetic anomalies with underlying tectonic structures. This is based on the principle that the size and spatial distribution of magnetic anomalies reflects the geological history of the rocks. As a result, large-scale magnetic surveys typically exhibit non-random patterns of anomalies [30]. In mineral exploration, integrating geophysical and geochemical datasets offers a range of valuable applications.
This region is sparsely referenced, except for one paper after [16] that addressed the study of the types of alteration zones in the studied rocks, in addition to studying the mineralization of the placer sediments there. This study is the first in the region to combine ASTER, Landsat 9, and PRISMA hyperspectral images with a detailed analysis of aeromagnetic data, aiming to achieve the best geological separation, which provides new insights into the prevailing tectonic trends affecting the region. Furthermore, aeromagnetic data can reveal the geometry of magnetized sources [9,21], which may be linked to mineralization. Recently, the delineation of edges and contacts in aeromagnetic data has proven to be an effective method for interpreting geological structures.

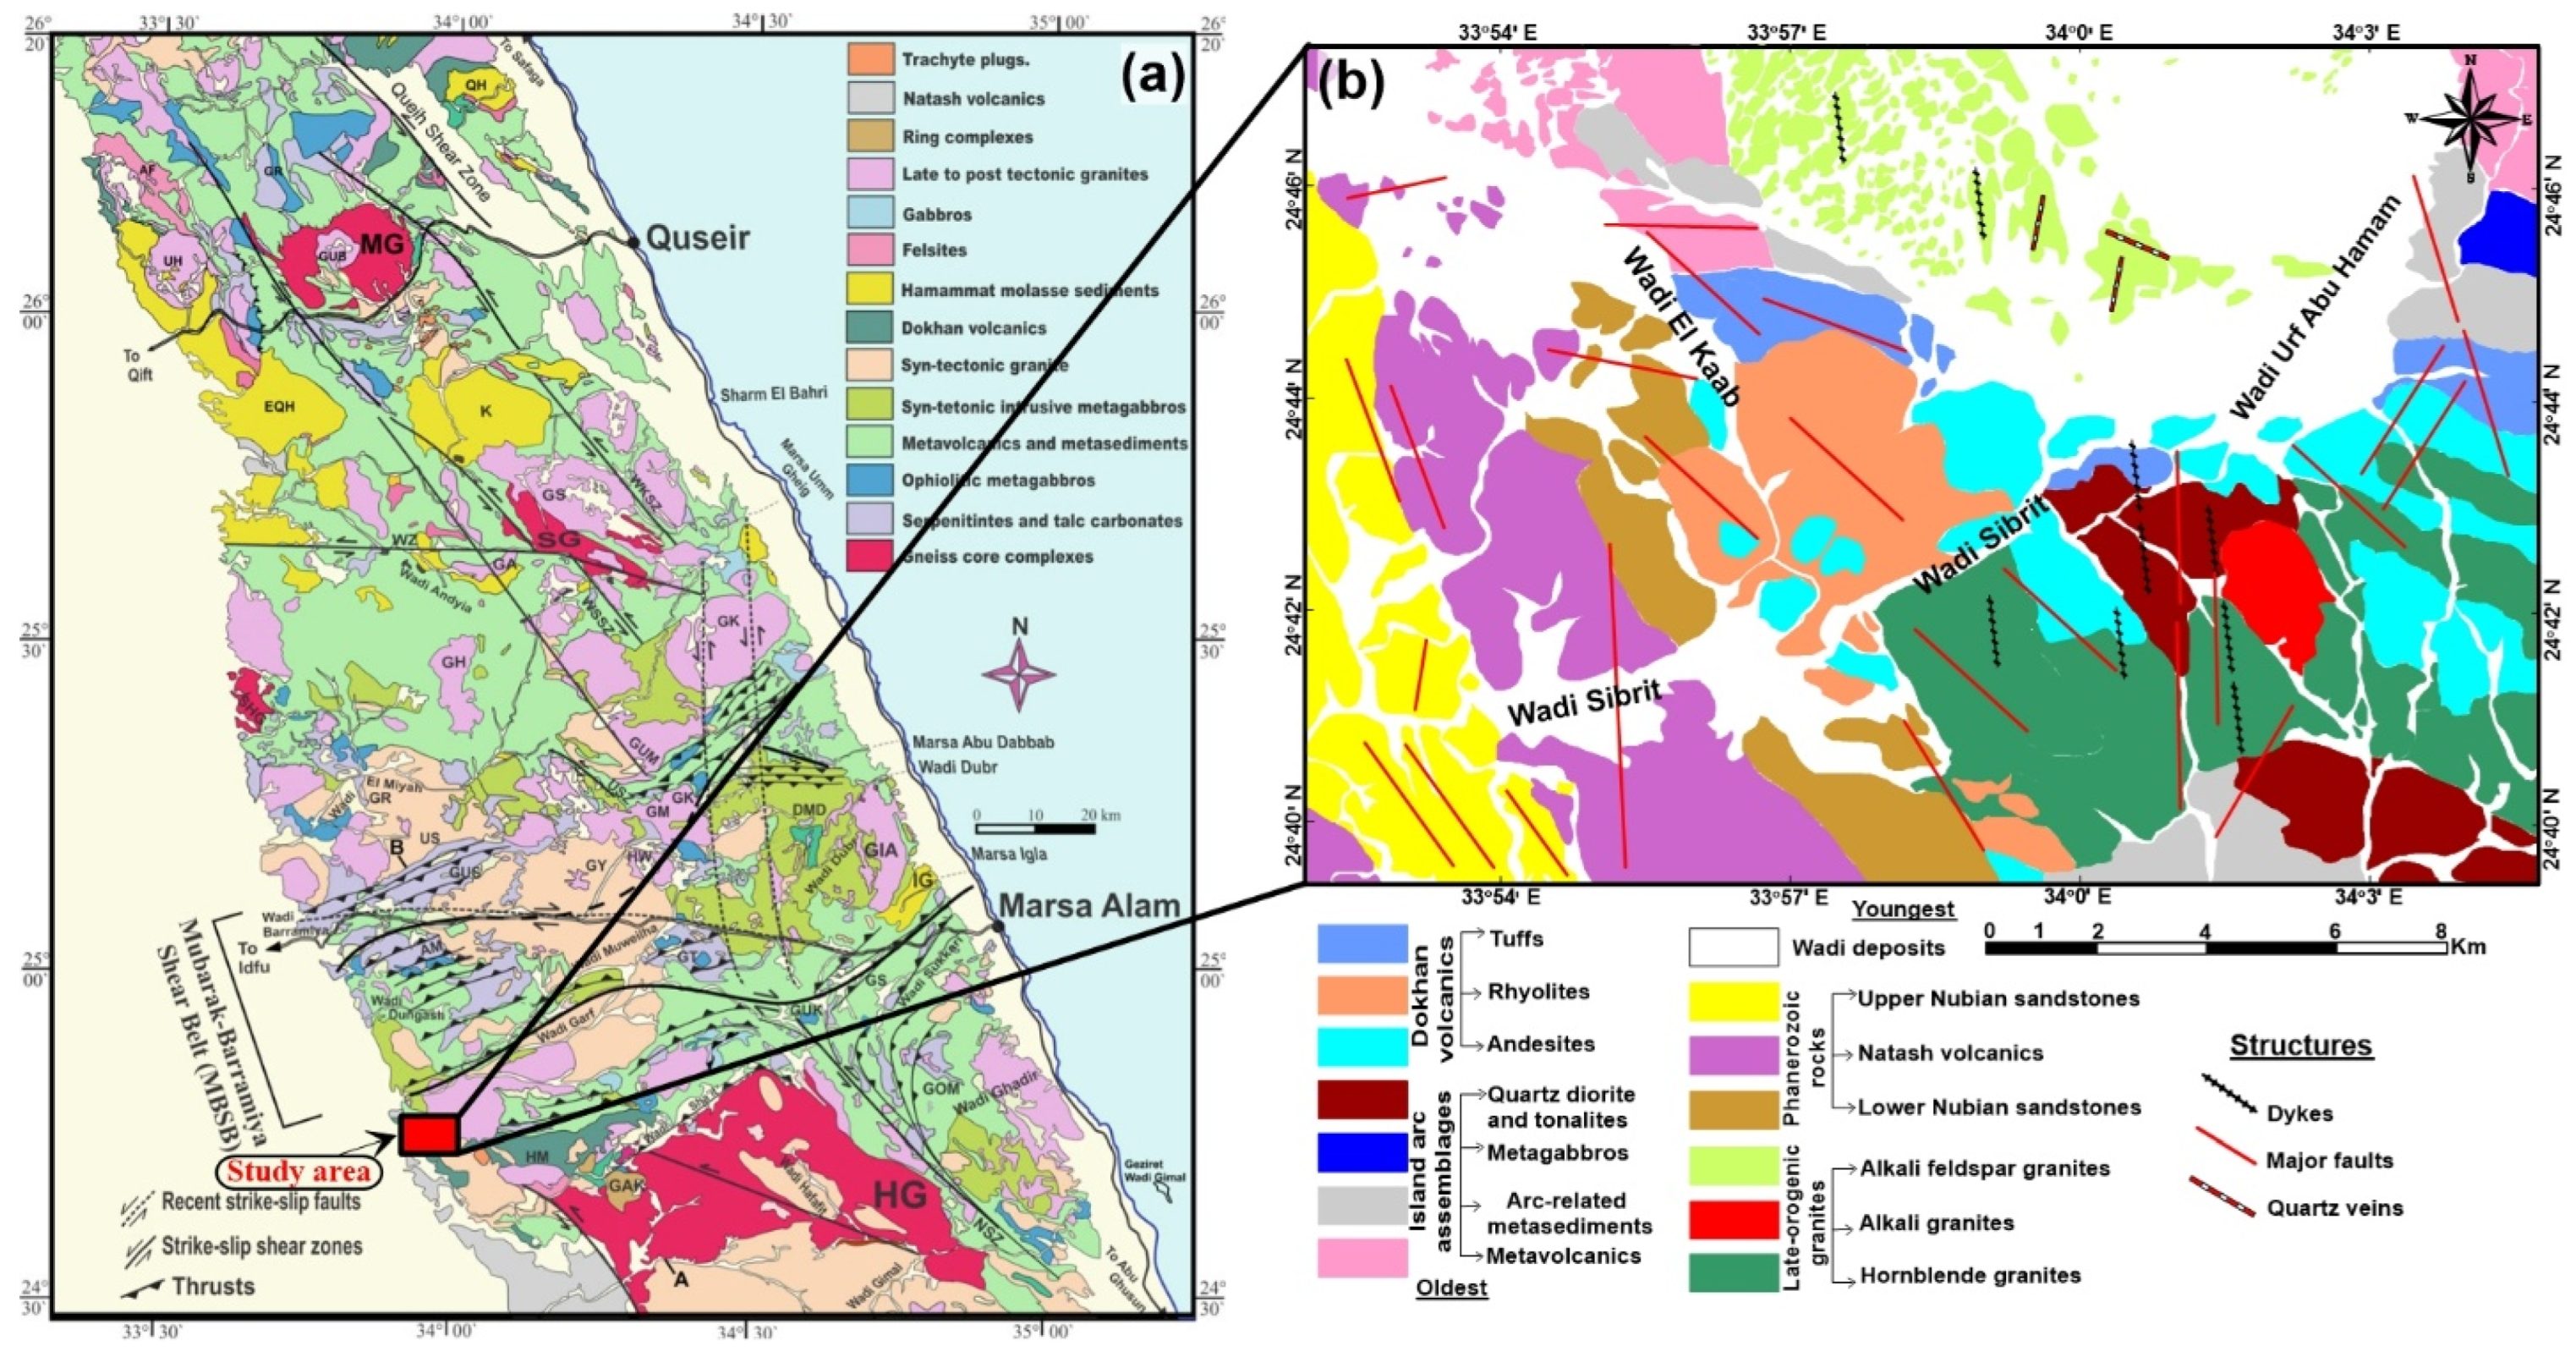
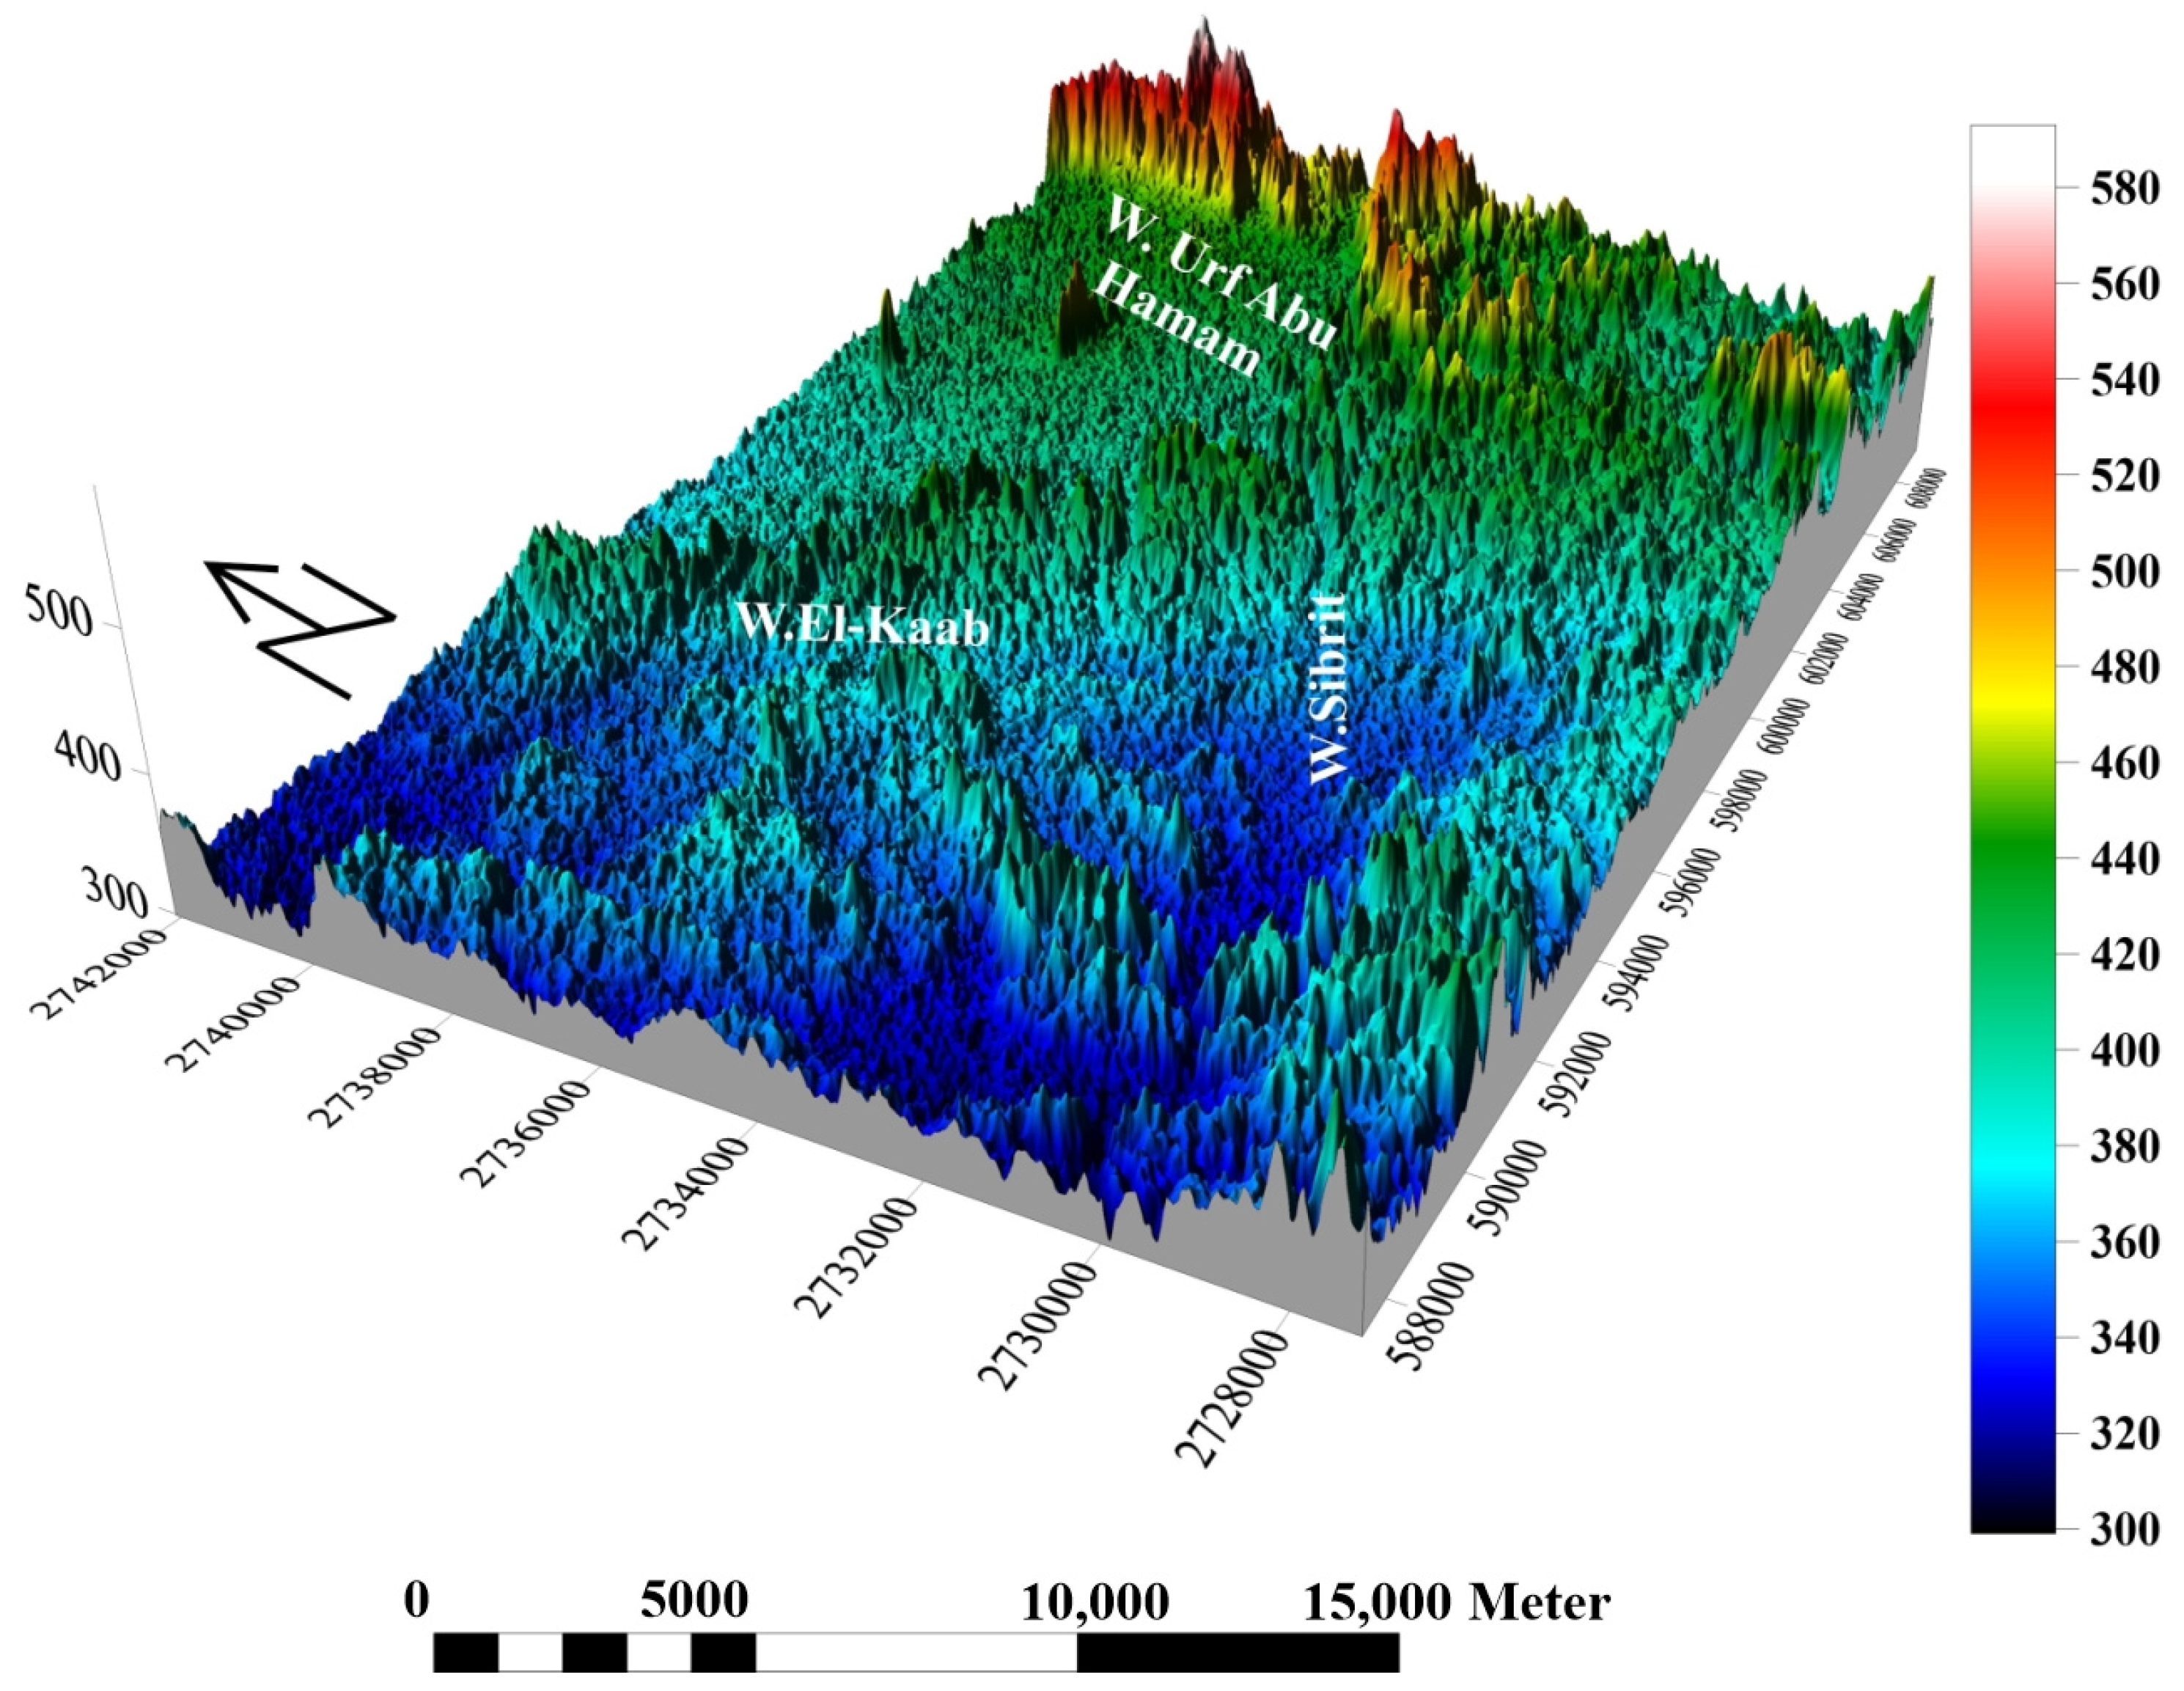
2. The Study District and Geological Setting

The basement complex in Egypt consists of Precambrian rocks, covering about 10% of the country’s area. It is mainly exposed in the Eastern Desert along the Red Sea, the southern Sinai Peninsula, and the Uwienat area in the southwestern Desert. The basement rocks include a variety of lithologies such as gneisses, metavolcanics, metasediments, and granitoids [30]. These rocks have undergone multiple phases of deformation and metamorphism, contributing to the complex geological history of the region.
Wadi Sibrit and Urf Abu Hamam are located between latitudes 24°40′–24°47′ N and longitudes 33°52′–34°05′ E along the Idfu-Marsa Alam Road [31] (Figure 1a). They are part of the South Eastern Desert of Egypt and cover about 400 km2 of crystalline basement rocks on the Umm Qubur and Umm Rashid topographic sheets (Nos. NG 36 C6a and NG 36 C6c) [32] (Figure 1b). The terrain of the study region is primarily marked by topographic features that exhibit a range of low to moderate relief, with elevations fluctuating between 307 and 604 m above sea level. This topographical variation is further accentuated by the presence of small, irregularly shaped landmasses reminiscent of low hills, ridges, and areas exhibiting extensive weathering (Figure 2).
The studied area records both the early and late stages of the Pan-African orogeny. The early stage is characterized by island arc assemblages, whereas the late stage includes continental arc-related rocks, primarily calc-alkaline in composition. Neoproterozoic basement complexes occupy the eastern portion of Wadi Sibrit, while the western portion is covered with sedimentary rocks (Nubian sandstone facies) with extrusion of Wadi Natash volcanic flows and volcaniclastic deposits with their weathered products. The basement rocks in the study district are represented by Neoproterozoic metavolcanics (metabasalts), metasediments, metagabbro–diorite complex, Dokhan volcanics (rhyolite, andesite, and dacite), hornblende granites, alkali granites, alkali feldspar granites, and phanerozoic rocks (lower Nubia sandstones, Natash volcanics, and Upper Nubia sandstones).

3. Materials and Methods

This study employs a multifaceted approach, integrating field investigations, magnetic instrumentation, and multispectral and hyperspectral remote sensing data.

3.1. Aeromagnetic Data

3.1.1. Aeromagnetic Survey

In 1983, the Aero-Services organization conducted an aeromagnetic survey in the study region as part of the Mineral, Petroleum, and Groundwater Assessment Program (MPGAP). A proton magnetometer (Varian, V-85) was selected for the aerial survey due to its high sensitivity (0.01 nT). The flight path was northeast–southwest and consisted of 25° and 225° crossed lines separated by 1.5 km lines. The flight path followed tie-lines with an azimuth of 135 degrees and 315 degrees and a separation of 5 km. For more accurate results from the survey, the control time was synchronized with worldwide time through shortwave radio [33]. After cleaning and plotting the data, a complete map of the aeromagnetic intensity was produced. In this investigation, digitized data followed primary data collection, and the results are shown as a colored fill on a map (Figure 3a).
To minimize the unintended modification of magnetic anomaly sizes, forms, and positions, the processing in this investigation began with a reduction to the magnetic Northern pole (RTP). In order to analyze and delineate the shallow and deep subsurface structures in the study area, the filtering approach (regional, residual, and tilt derivative filters) was applied. Through quantitative interpretation, we calculated the depths of the basement complex and shallow subsurface structures (contacts) in the region under consideration. The depth of regional and residual sources was determined by averaging the power spectrum from all directions. For this study, we used the specialist computer application Oasis Montaj to analyze and process the aeromagnetic data [34].

3.1.2. Reduction to Magnetic Pole (RTP)

The field, reduced to the pole at a fixed point above the measurement plane, is expressed in the frequency domain as described by [35].
L(θ) = 1/[sin(Iα) − i × cos(I) × cos(D + θ)] × 2, if (Iα < I), Iα = I
where I = geomagnetic inclination, Iα = inclination for amplitude correction (never less than I), D = geomagnetic declination, θ = wavenumber direction, and i = imaginary component.

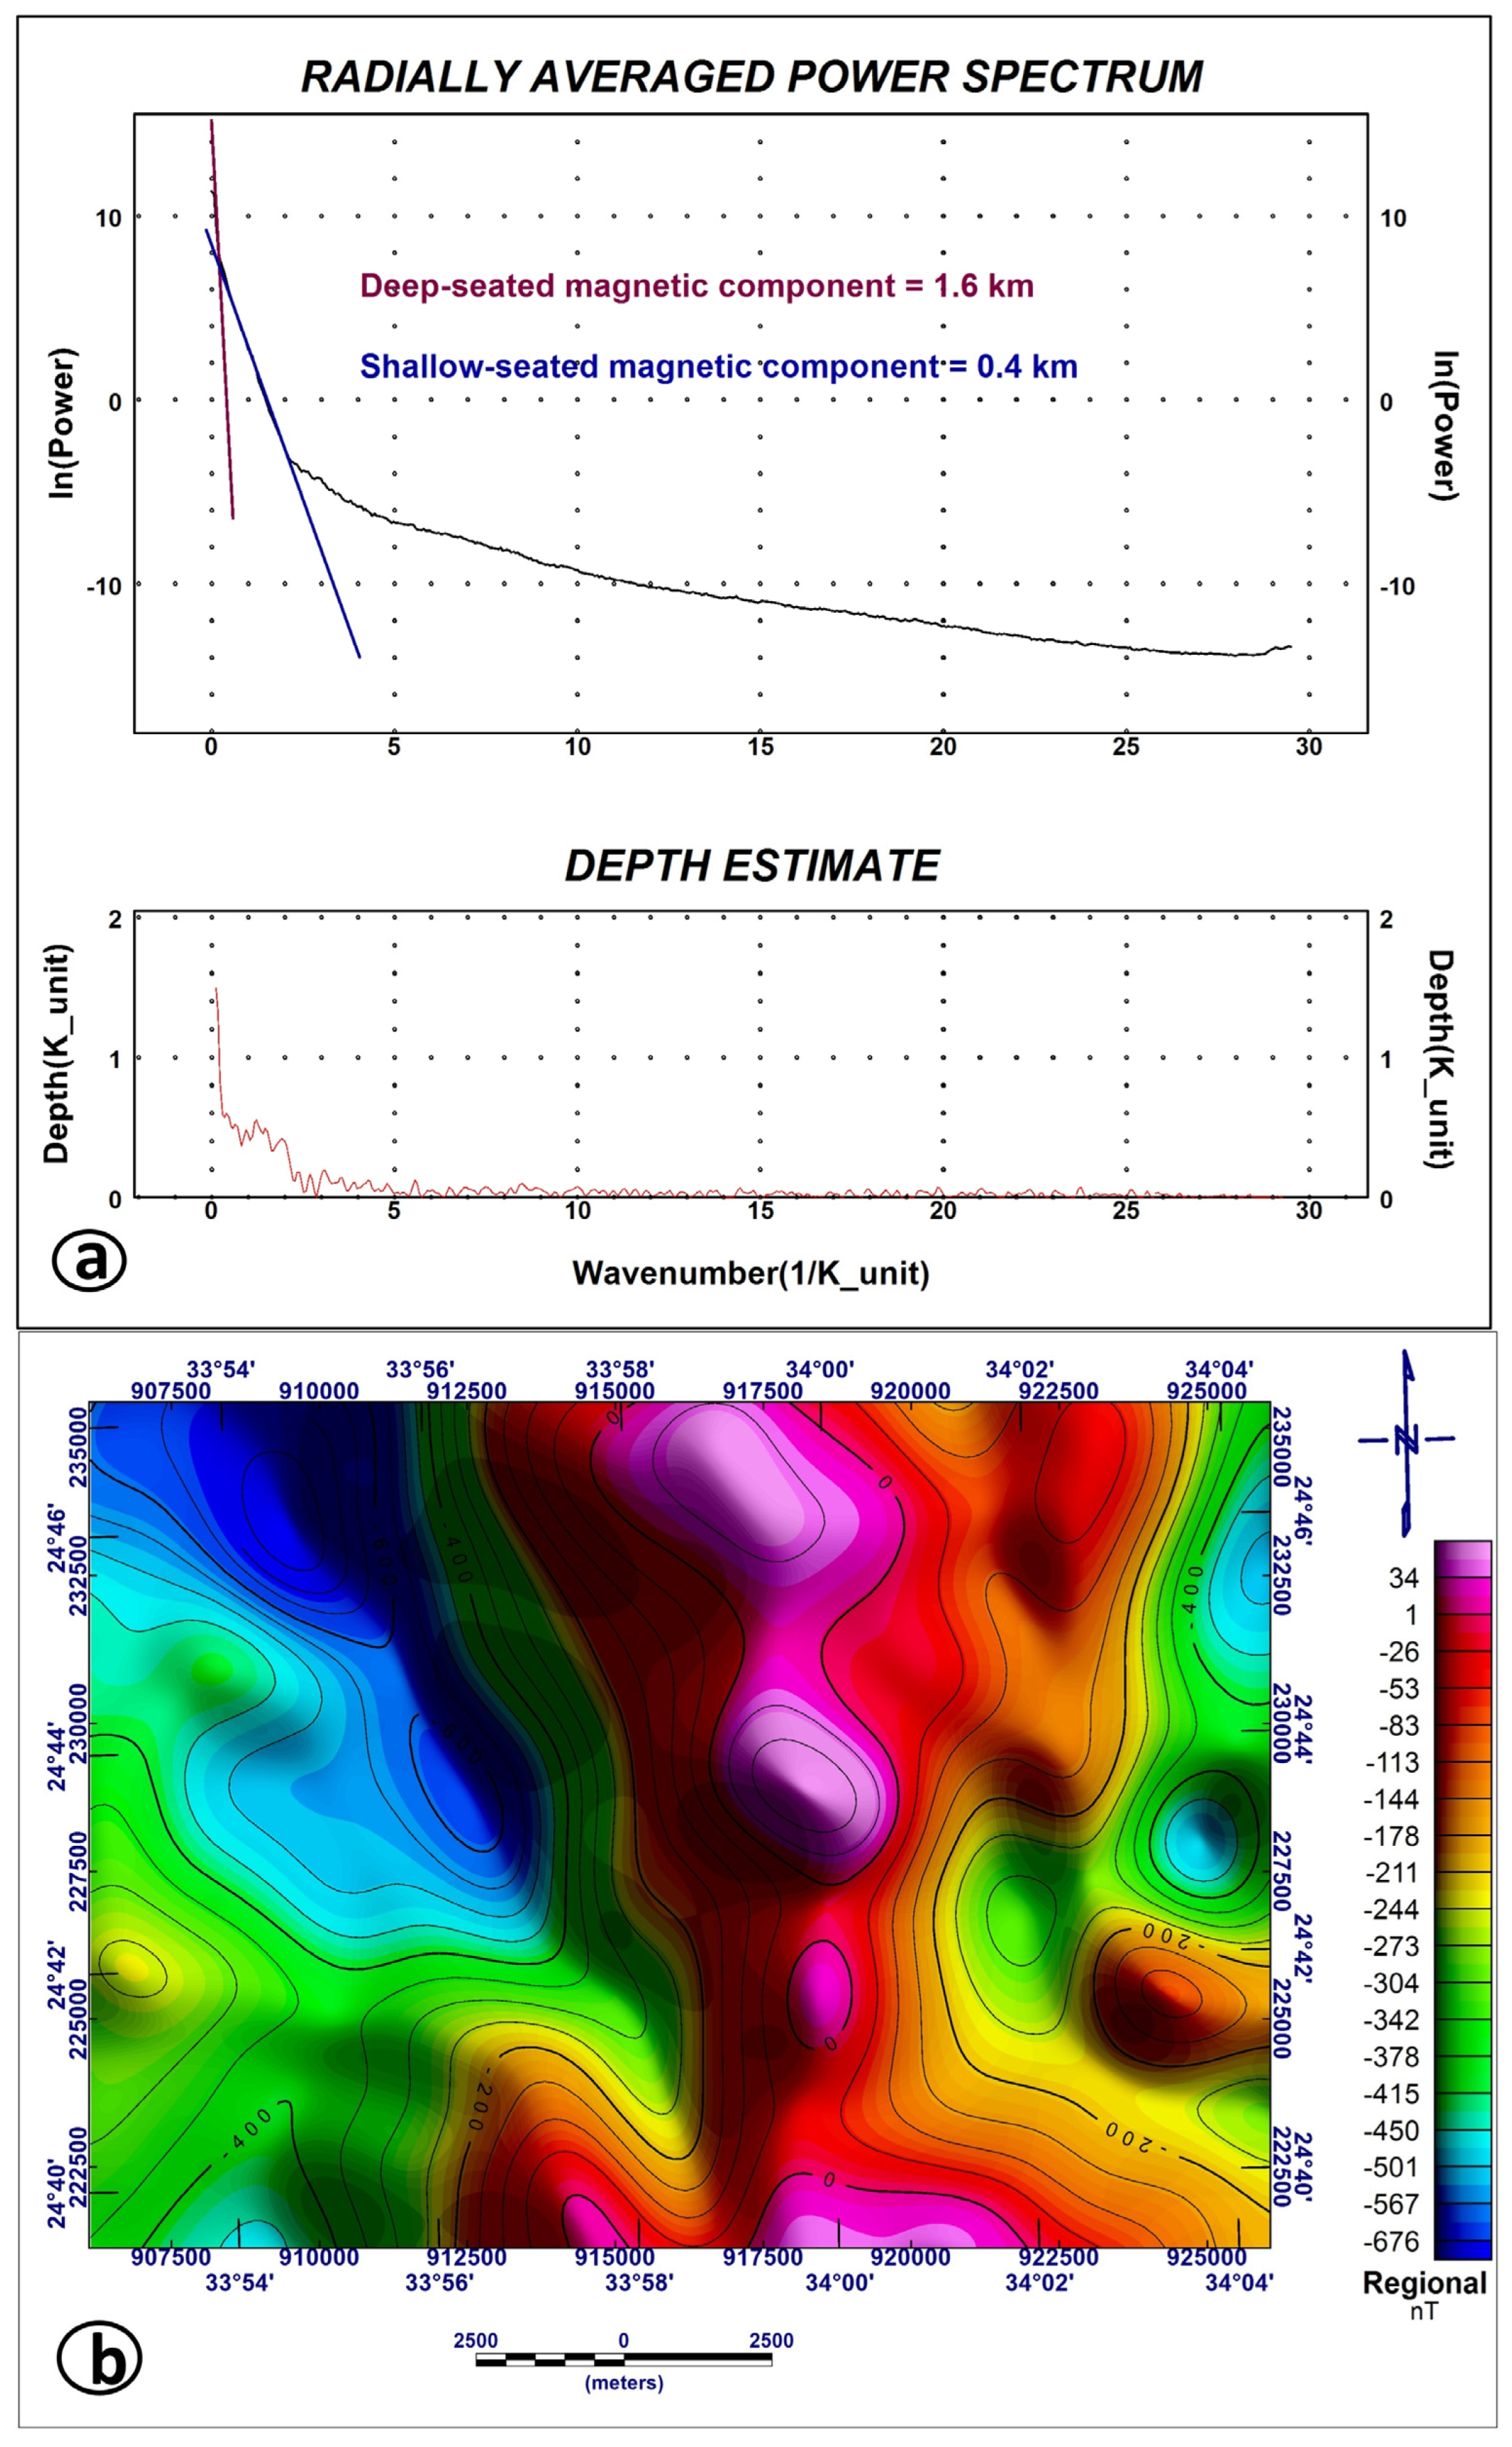
3.1.3. Radially Averaged Power Spectrum

The computation of RAPS involves performing a 2D Fourier transform on the magnetic anomaly data, followed by averaging the power spectrum over concentric rings centered at the origin. The resulting curve is then analyzed to determine the slope of different spectral segments, which can be correlated with the depths of magnetic sources [36].
h = − S/4π
where h = depth, and S = slope of the log (energy) spectrum. These estimates can be used as a rough guide to the depth of the gravity or the magnetic source.

3.1.4. Tilt Derivative (TDR)

The Tilt Depth Reduction (TDR) method is a technique used in geophysics to enhance the edges of magnetic sources. It is based on the tilt angle, which helps identify the horizontal locations of geological bodies at different depths and inclination angles [37]. It is calculated by dividing the vertical derivative by the total horizontal derivative [38].
.”TDR = tan − 1 (VDR/THDR)

3.1.5. Euler Deconvolution

Euler deconvolution is a widely used technique in geophysics for interpreting potential field data, such as gravity and magnetic anomalies. It helps estimate the location and depth of anomaly sources by relating the measured field and its gradient components to the source position, incorporating a structural index that represents the degree of homogeneity [39,40,41,42]. Euler deconvolution is expressed in Equation (4).
X X 0 T X + y y 0 T y + Z Z 0 T Z = n B T
When applying Euler’s expression to profile- or line-oriented data (a 2D source), the x-coordinate represents the distance along the profile, while the y-coordinate is maintained at zero throughout the profile. Consequently, Equation (4) is reformulated into the structure of Equation (5):
X X 0 T X + Z Z 0 T Z = n B T
where (X0, Z0) is the position of a 2D magnetic source whose total field T is detected at (X, Z). The total field has a regional value of B, and n is a measure of the fall-off rate of the magnetic field.

3.2. Remote Sensing

This research integrates multispectral (Landsat 9 and ASTER) and hyperspectral (PRISMA) remote sensing data to enhance the characterization of exposed lithologies and major structural features. Landsat 9 was chosen for its superior radiometric resolution, while ASTER’s effectiveness in geological mapping, particularly due to its six SWIR bands, made it a valuable addition. PRISMA hyperspectral data were specifically employed to provide a more detailed characterization of the complex basement rock regions.
The internal calibration system ensures high-quality spectral data. Both PRISMA and Landsat data were processed to Level 2 and geometrically registered within a GIS environment to ensure accurate spatial correspondence for subsequent analysis. The ASTER Level 1b data obtained on 7 October 2007 was used to apply the remote sensing techniques used in this investigation. Using the WGS-84 datum, the images were pre-georeferenced to the UTM zone 36 North projection. The pre-processing of ASTER data includes crosstalk correction, atmospheric correction of the data, pixel resampling (spatial resolution), and area of interest. The ASTER datasets used in this study underwent crosstalk correction. On the SWIR subsystems of the ASTER datasets, the FLAASH atmospheric correction method was used.

Data Processing Methods

Several processing methods, such as false color composite (FCC), color ratio composites (CRCs), and principal component analysis (PCA), were used for lithological mapping using ArcGIS version 10.1 software (Esri, Redlands, CA, USA) and ENVI (Environment for Visualizing Images, http://www.exelisvis.com) version 5.3.
According to the false color composite (FCC) images, the different spectral bands of the remote sensing data were selected and combined in RGB color composite images to achieve the best false color composite images showing the best lithological separation in the study district. Specifically, the ASTER band combinations 4-3-2 (RGB) and 7-3-1 (RGB) were used, as these have proven effective in highlighting lithological contrasts and surface features relevant to geological interpretation.
Band rationing is a useful technique for differentiating distinct rock types because the primary variations in the visible, near-infrared, and shortwave-infrared spectral areas are located along the slopes of the reflectivity curves. The rationing procedure reduces topographic slope-induced first-order brightness effects and increases minute color differences across materials [43]. The topography variation and the brightness difference associated with grain size change are suppressed using band ratio pictures [44]. The application of band ratio in mineral detection and lithological mapping has been used successfully in the Arabian–Nubian Shield, as well as worldwide (e.g., [44,45,46,47]). In this study, several band ratios were applied according to the most common band ratios for lithological mapping in the Eastern Desert.
The selection of specific ASTER band ratios, e.g., 4/7, 3/4, 2/1 and 6/8, 4/5, 2/4, was based on extensive visual evaluation, aiming to achieve optimal lithological discrimination. These combinations consistently outperformed others in enhancing lithological contrasts across the study district. The chosen band ratios are supported by previous studies (e.g., [48,49,50,51]).
A multivariate statistical method called principal component analysis (PCA) chooses uncorrelated linear combinations of variables (called eigenvector loadings) so that each successively extracted linear combination, or principal component (PC), has a lower variance [52]. A typical approach of analysis for correlated multi-variable datasets is principal component analysis (PCA), which involves mathematically transforming the original data, which are ordered according to the axis of highest variability for constructing new non-correlated components. The selected principal components (PCs) were carefully chosen based on both visual interpretation and the amount of information they contain. For instance, the RGB combination of PC5, PC2, and PC1 was used, where PC1 and PC2 capture the highest variance due to their high eigenvalues, while PC5 contributes additional detail by highlighting subtle spectral variations. This combination collectively enhances lithological discrimination in the study district.
Independent component analysis (ICA) is a robust statistical method employed in remote sensing to decompose composite signals into their constituent, statistically independent sources. Distinct from principal component analysis (PCA), which prioritizes variance maximization, ICA’s objective is to isolate components exhibiting statistical independence, effectively capturing unique, non-redundant information. This is particularly advantageous in remote sensing, where disparate classes (e.g., lithologies) may possess overlapping spectral responses. Through the application of ICA to multispectral or hyperspectral data, the deconvolution of these mixed signals is facilitated, enhancing the precision of image classification, and lithological discrimination.
The Sequential Maximum Angle Convex Cone (SMACC) algorithm is a fully automated method primarily used for endmember identification and unmixing in hyperspectral data. Unlike conventional techniques that can struggle with high correlations in such data, SMACC, as its name implies, models data as a convex cone. It iteratively builds this cone by selecting endmembers based on the largest angle relative to the existing cone. Throughout this process, SMACC continuously generates and refines abundance maps, ensuring non-negative abundances for all identified endmembers. The algorithm concludes when all data vectors fall within the defined tolerance of the convex cone [53,54,55]. SMACC is an endmember extraction method that iteratively pinpoints pure spectral signatures. It works by building a convex cone and progressively refining its selection of representative spectra based on the maximum angle between potential endmembers and the cone. Applied here to hyperspectral PRISMA data, SMACC enables more accurate lithological mapping.

3.3. Field and Laboratory Investigations

A description of the field relationships and structural contexts of the rock units revealed in the research areas is included in the field study. The study district’s fieldwork was completed in March 2016; however, a new geological map was created utilizing field observations and remapping of Landsat data. The field study included a description of field relations and the structural settings of the rock units exposed in the studied district. About 80 thin sections were petrographically studied in detail by using a polarized microscope. These thin sections were studied under a polarizing microscope (Optika B-353POL) combined with a digital camera at the Department of Geology, Faculty of Sciences, Al-Azhar University, Egypt.

4. Results

4.1. Magnetic Results

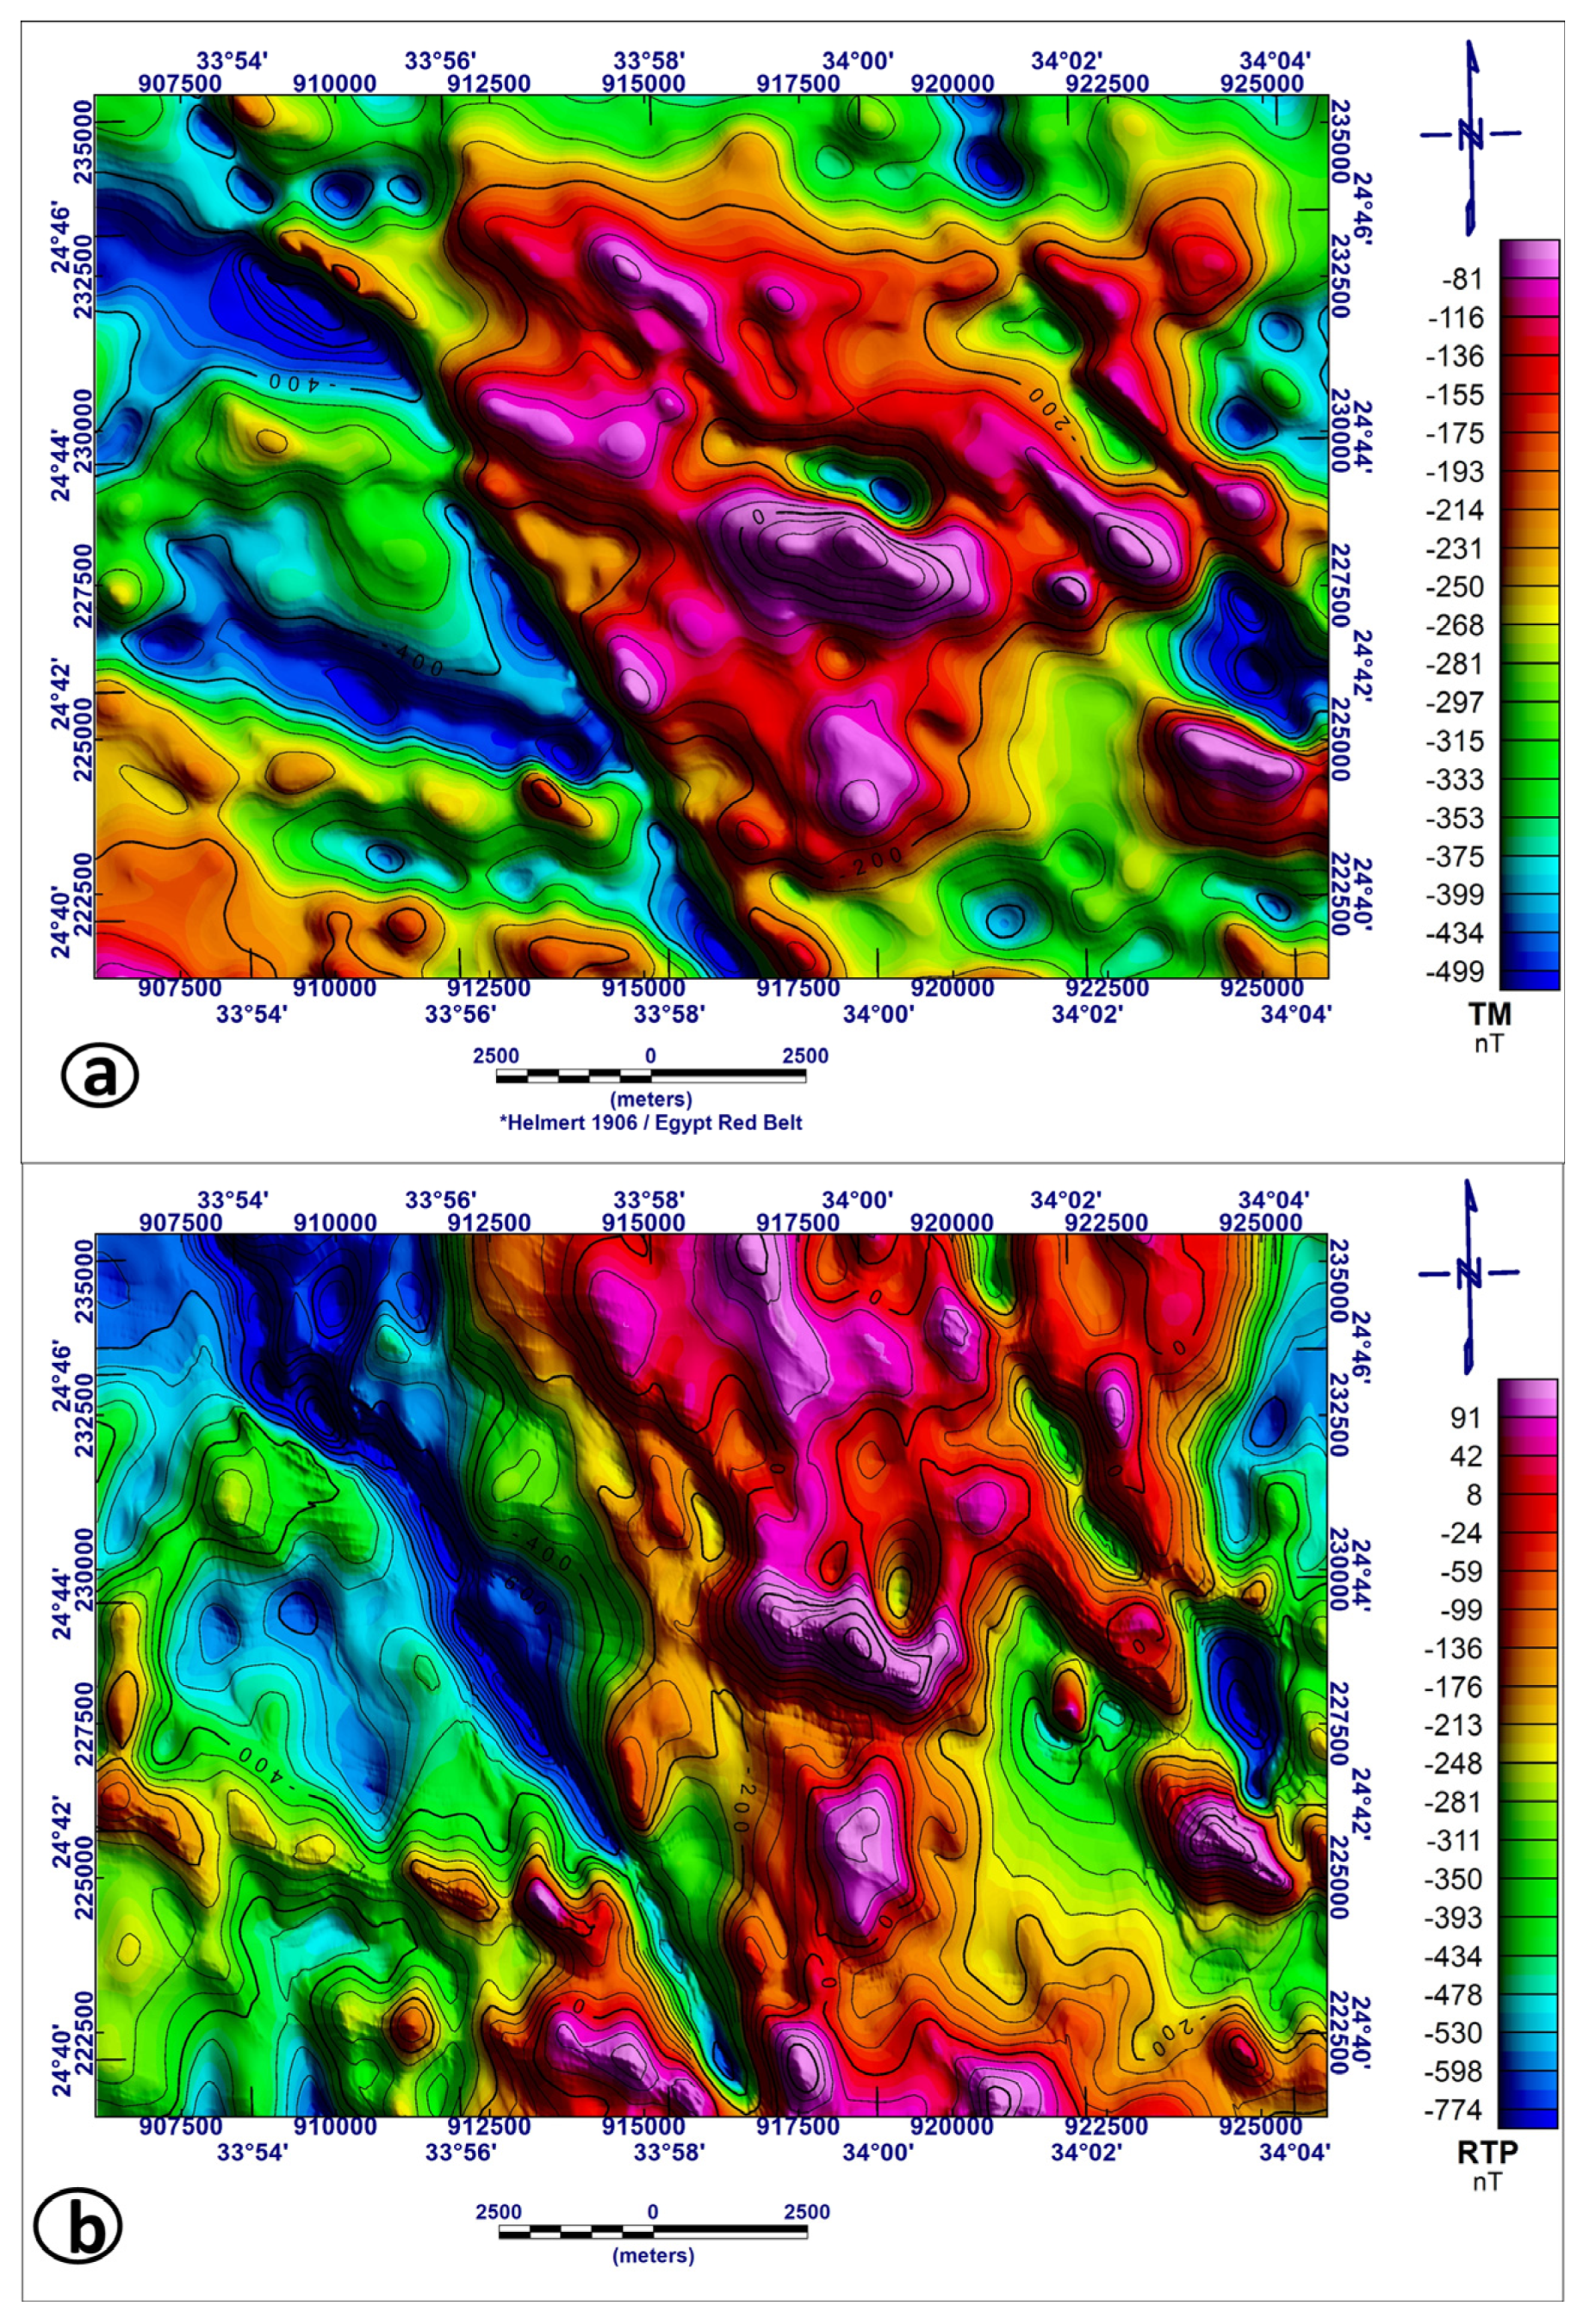
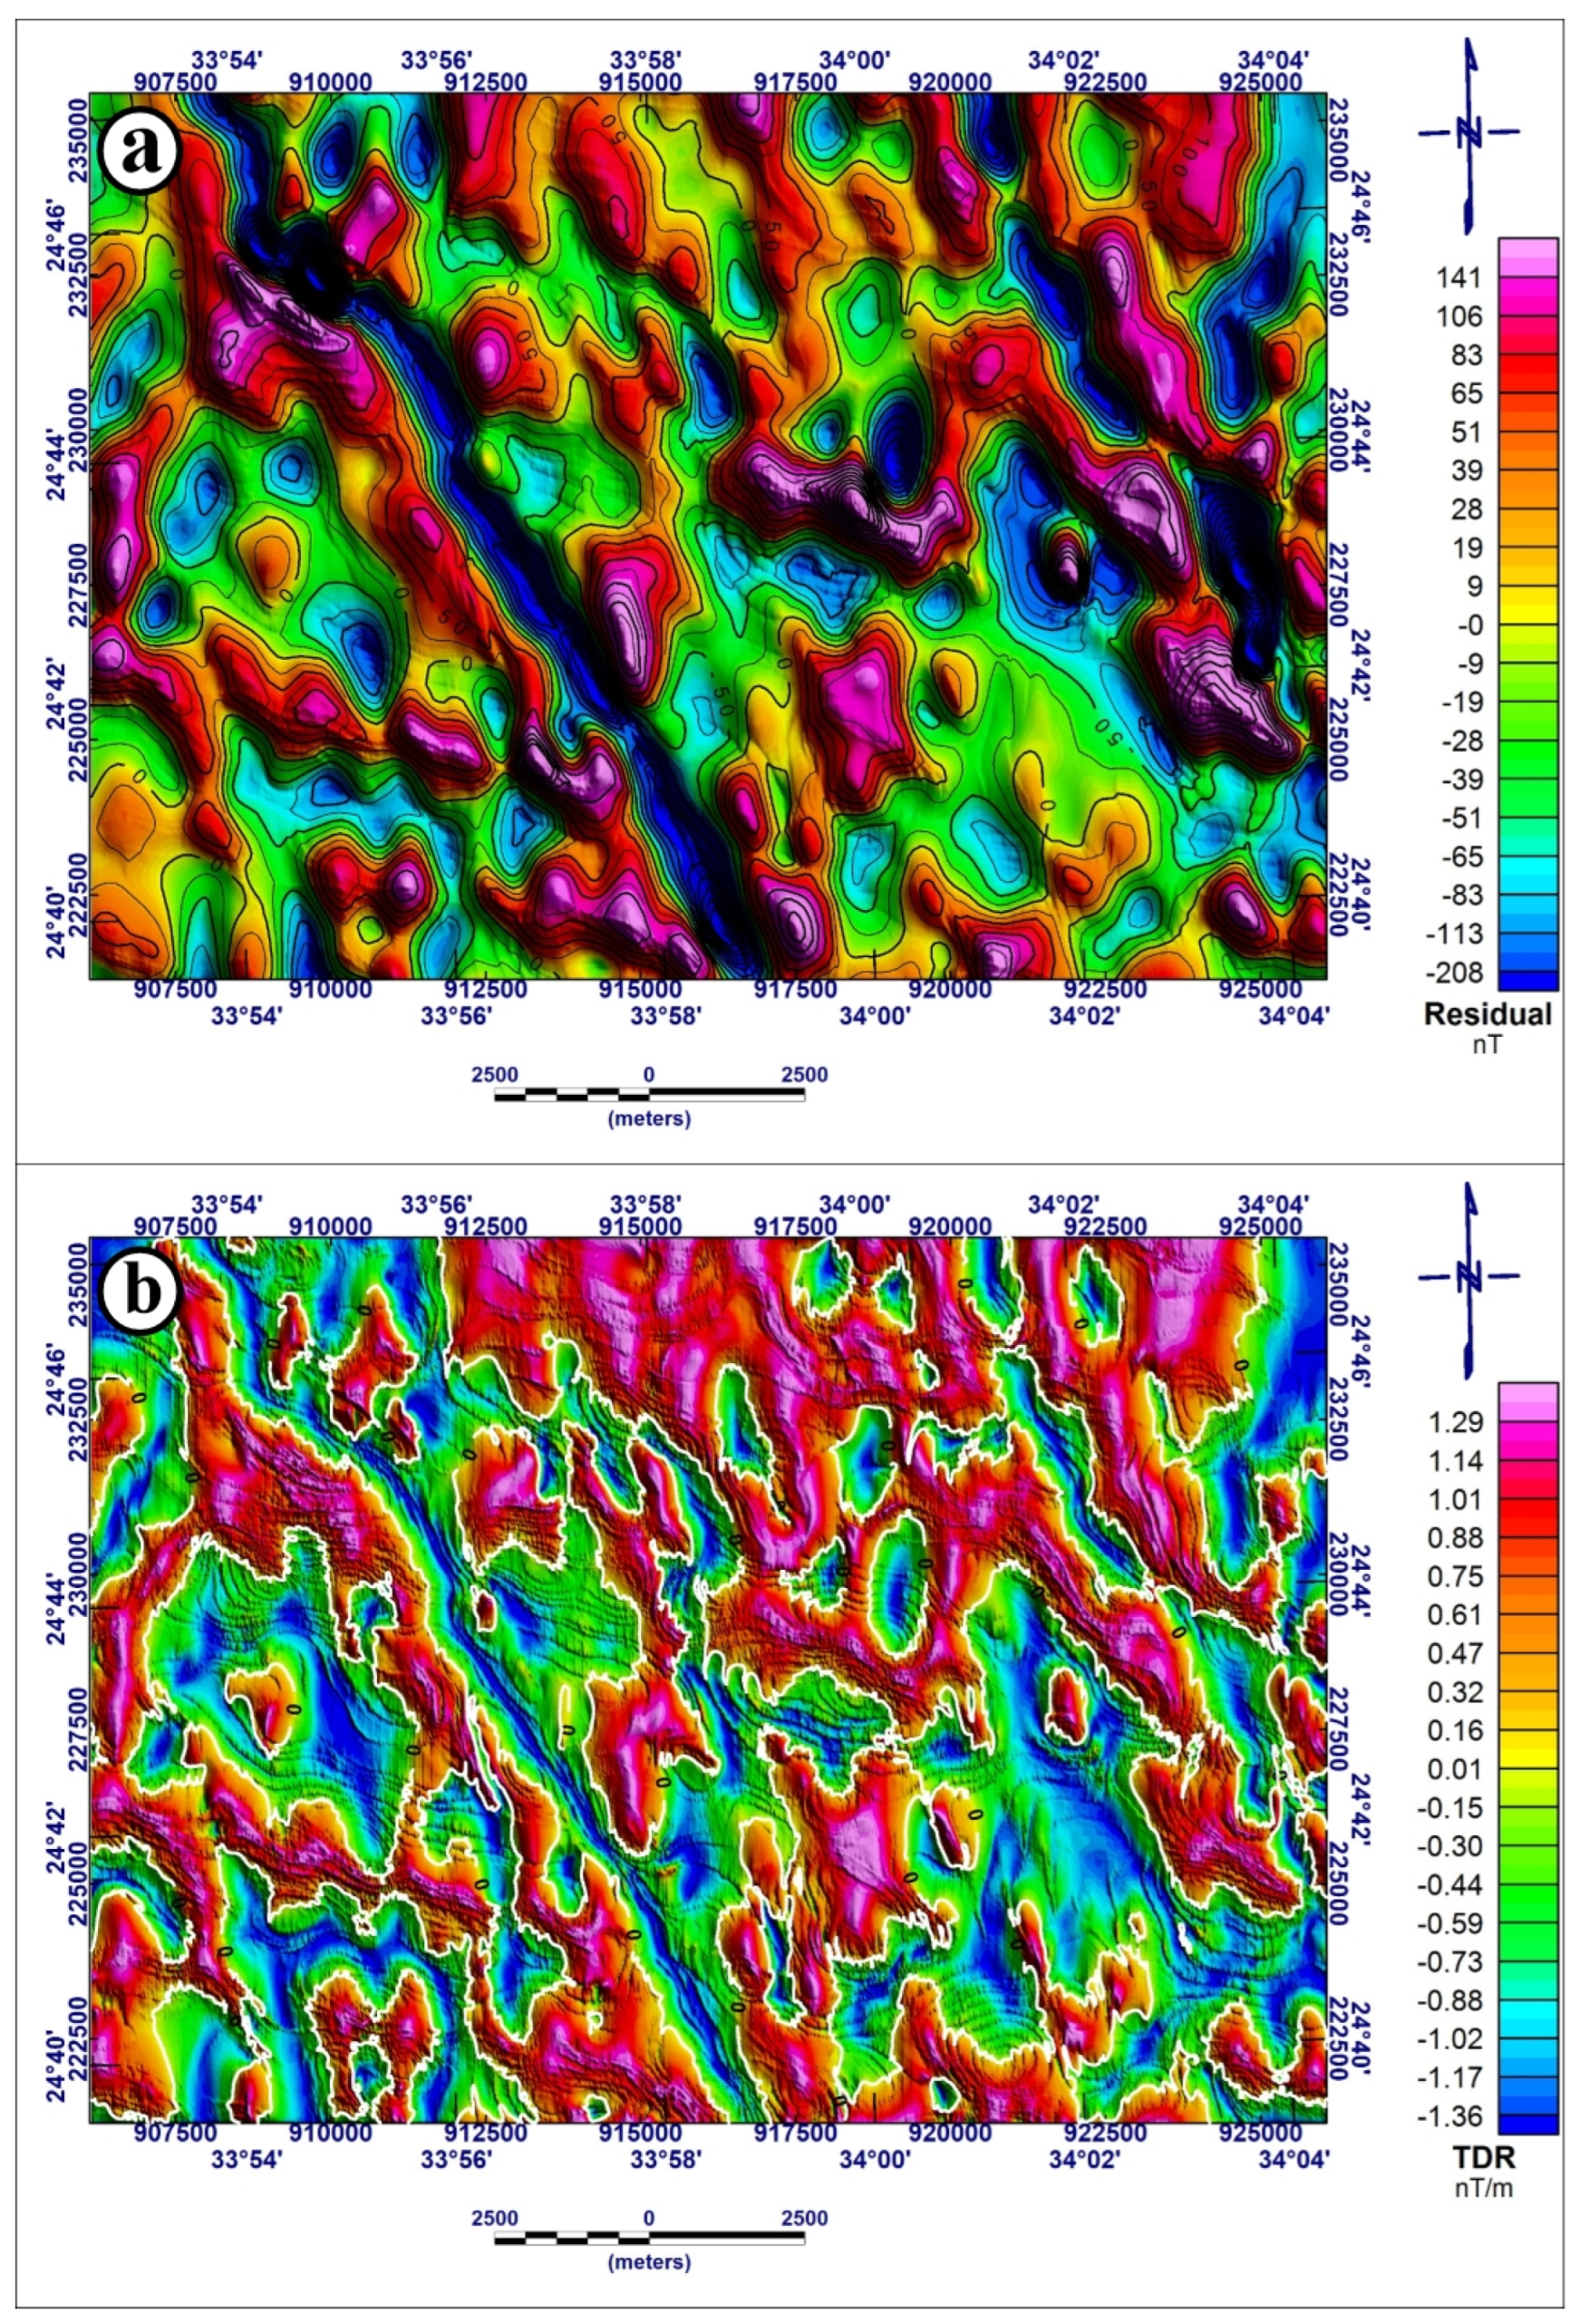
4.1.1. The Total Intensity Magnetic Map

The total intensity magnetic map (Figure 3a) depicts the lateral variations in the magnetic characteristics of the underlying rocks. Consequently, the magnetic expression of the various structural features is contingent upon the existence and magnitude of their magnetic contrasts. The qualitative interpretation of a magnetic map starts with a visual examination of the shapes and trends of the most significant anomalies. The features that control the description of magnetic anomalies are the relative location, the amplitude of the positive and negative anomalies, the elongation, the areal extension, and the sharpness of the anomaly, as seen by the spacing between the contours. In many cases, constructive geologic information can be obtained directly from the magnetic map [40].
The aeromagnetic data were corrected for the IGRF (42,425 nT) to isolate crustal magnetic sources. The magnetic anomalies were derived by subtracting the IGRF, effectively removing the Earth’s core-generated field. The aeromagnetic dataset reveals a pronounced magnetic anomaly contrast across the study area, with values ranging from −81 nT (relatively high) in the central region to −499 nT (significantly lower) in the eastern and western sectors. This spatial variation in magnetic intensity provides critical insights into the subsurface lithological and structural framework of the region. The central part of the study area exhibits elevated magnetic anomalies (up to −81 nT), characterized by a distinct, spatially coherent magnetic high. This anomaly is interpreted to reflect the presence of granitic intrusions, which typically host ferromagnetic minerals such as magnetite or ilmenite. In contrast, subdued magnetic signatures (−499 nT) dominate the eastern and western flanks, suggesting lithologies with low magnetic susceptibility, consistent with sedimentary sequences or weakly magnetized rocks.

4.1.2. Reduced to the Pole

The aeromagnetic data reduced to the magnetic pole (RTP) (Figure 3b) using inclination (32.8°) and declination (1.9°) reveal a magnetic anomaly field spanning 91 nT (positive) to −744 nT (negative), delineating contrasting litho-tectonic domains. A pronounced positive anomaly (+91 nT) in the central zone correlates with magnetite-rich granitic intrusions associated with regional magmatic activity. Conversely, the peripheral negative anomalies (−744 nT) in the eastern and western sectors align with weakly magnetic sedimentary sequences and weakly magnetized rocks, suggesting basin development or tectonic depocenters. The magnetic anomaly exhibits dominant NW, NNW-SSE, N-S, NNE-SSW, and E-W trends, closely paralleling the orientations of major faults (NW, NNE, N-S, NNW) (Figure 2). These structural lineaments likely governed magma emplacement pathways, basin architecture, and crustal deformation, reflecting reactivation of pre-existing crustal weaknesses under extensional, transcurrent, or collisional regimes. The spatial correlation between magnetic highs and granitic rocks, alongside lows linked to sedimentary cover, underscores a tectonic–magmatic framework shaped by alternating phases of crustal melting, fault-driven subsidence, and sedimentation. The alignment of magnetic trends with fault systems further implies structural control over both intrusive emplacement and basin evolution, consistent with polyphase tectonic activity in a dynamic orogenic setting.

4.1.3. Low- and High-Pass Map

To emphasize the structural features influencing the study area, the RTP magnetic maps were divided into regional and residual components. This separation was carried out using the fast Fourier transform method in the frequency domain, with filtering based on power energy spectrum analysis of both magnetic and gravity data. Fourier spectral analysis is widely used for interpreting potential field data, especially for estimating subsurface depths. Over time, various researchers have refined and enhanced this technique [41].
Radially averaged power spectrum: The deep-seated magnetic component has a frequency range of 0 to 0.2 cycles per grid unit, while the near-surface magnetic component has a frequency range of 0.2 to 2.3 cycles per grid unit, as shown in Figure 4a. The appropriate frequency bands were applied to generate both the low-pass (regional) map (Figure 4b) and the high-pass (residual) map (Figure 5a). The power spectrum curve of the study area (Figure 4a) was used to estimate the depths of the deep and shallow magnetic sources, which are approximately 1.6 and 0.4 km, respectively.
The low-pass (regional) map (Figure 4b) was generated by filtering the RTP data to retain frequencies <0.2 cycles/grid unit, corresponding to deep sources. The high-pass (residual) map (Figure 5a) was derived by subtracting the regional field from the RTP data. The separation process is designed to differentiate between regional and residual anomalies. The low-pass magnetic map displays deep-seated bodies that create large-scale anomalies with amplitudes ranging from −676 to 34 nT. The central region of the study area is marked by positive anomalies that extend from the northern to the southern region and trend north–south. The western and eastern parts of the study area are characterized by low magnetic anomalies with trends in the NNW-SSE, N-S, NNE-SSW, and E-W directions, respectively.
High-pass (residual): The residual map construction is one of the best-known quantitative methods for evaluating a potential map, where the measured field comprises the effects of all nearby bodies. However, the delineations were performed after residualizing the magnetic intensity data, which meant taking out the regional effects with a high-pass Gaussian residual filter to obtain a residual anomaly magnetic intensity map. The residuals focus on weaker features that are confused by strong deep-seated effects in the original map [42]. The high-pass RP magnetic map (Figure 5a) displays a collection of tiny irregular negative and positive anomalies with steep gradients ranging from −208 to 149 nT. The trends of the aforementioned anomalies are NNW-SSE, N-S, NNE-SSW, and E-W. This could be caused by changes in the near-surface structural elements of the rock or by lateral differences in the magnetic intensity found in the various rock units.

4.1.4. Tilt Derivative

Various edge detection techniques usually employed in potential field maps, specifically gravity and magnetic fields, include tilt derivative (TDR) or tilt angle [43,44]. The tilt derivative can image the horizontal boundaries of magnetic sources with high resolution and performs well as an edge detector because it is ultra-sensitive for detecting source boundaries, where the zero contours of the tilt derivative can be used to track magnetic contacts. The tilt derivative map (Figure 5b) was derived from the RTP magnetic data. This map highlights most of the magnetic sources and offers a clear depiction of the distribution of magnetic anomalies. The zero contour lines on the map provide an excellent representation of the magnetic anomaly distribution. The zero contours show the contacts between the highly polarized sources, which are mainly igneous, and the less polarized sources of sedimentary rocks at the same measuring level; these contacts may represent faults. The white lines on the map represent the zero contour lines, which separate the green (negative values) and red (positive values) colors. These lines are visible on the color scale bar. The main direction of the magnetized sources extends from NNW-SSE, N-S, NNE-SSW, and E-W. This map shows alternating positive and negative values. The positive values reach up to 1.29 nT/m, while the negative values reach −1.36 nT/m.

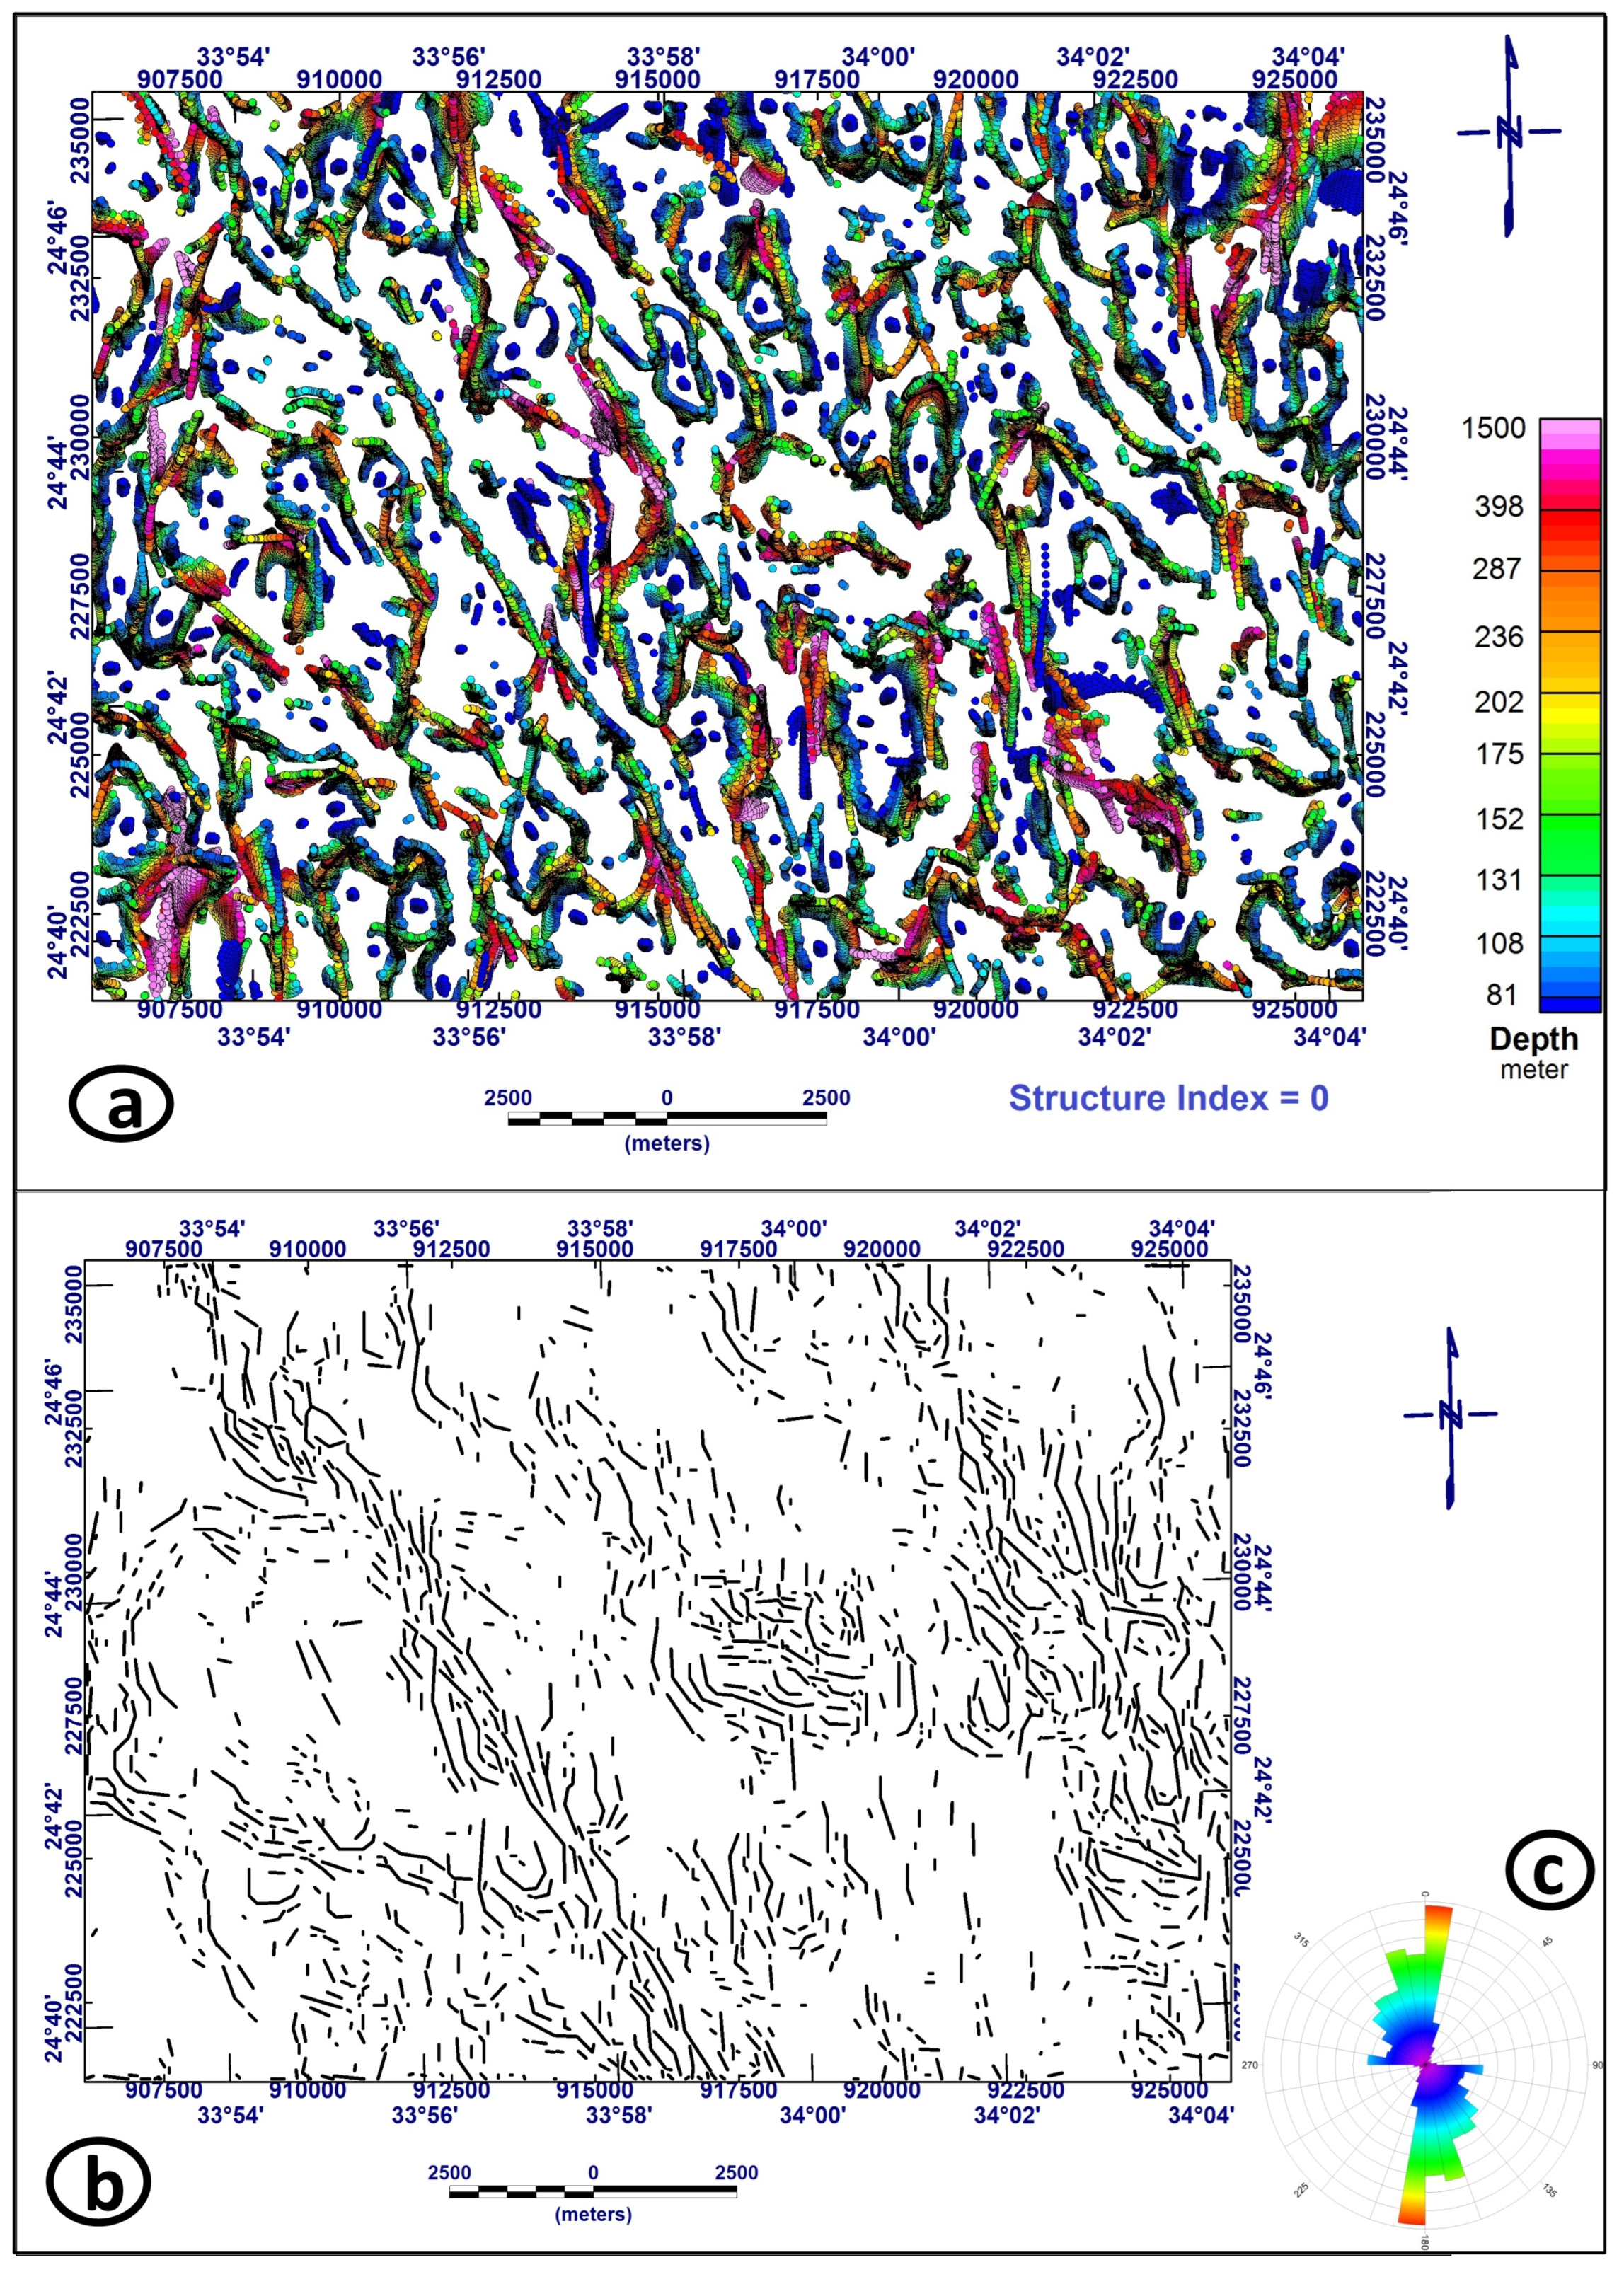
4.1.5. Euler Deconvolution

The Euler deconvolution (ED) method is employed to combine geological and geophysical constraints into a depth map that shows the contact structural index (SI). The amplitude function of ED is consistently positive and not dependent on the body magnetization direction [45]. The ED method primarily relies on the SI, which is directly related to the shape of the contributing source. The optimal source locations are identified based on the least square inversion of the data within a specified window length. The variations in SI values assist in identifying different magnetic bodies. Figure 6a illustrates the application of Euler deconvolution to reduced-to-pole (RTP) magnetic data for mapping magnetic contact distributions, delineating their spatial positions and depths across multiple computational intervals. The analysis was conducted using Oasis Montaj software with a structural index (SI) of 0, consistent with magnetic contact geometries [46]. The results reveal NNW-SSE-, N-S-, NNE-SSW-, and E-W-trending contacts, with estimated depths ranging from 0.081 km to 1.5 km adjacent to basin structures and/or uplifted crustal blocks. Comparative analysis with the RTP map (Figure 3) indicates the clustering of step faults along zones of positive and negative magnetic anomalies, interpreted as uplifted and downthrown blocks, respectively. Directional trends such as NNW-SSE, N-S, NNE-SSW, and E-W are commonly derived from lineament maps (Figure 6b), which represent structural features like faults, fractures, and geological boundaries. These trends provide insights into the tectonic framework and stress orientations of a region (Figure 6c).

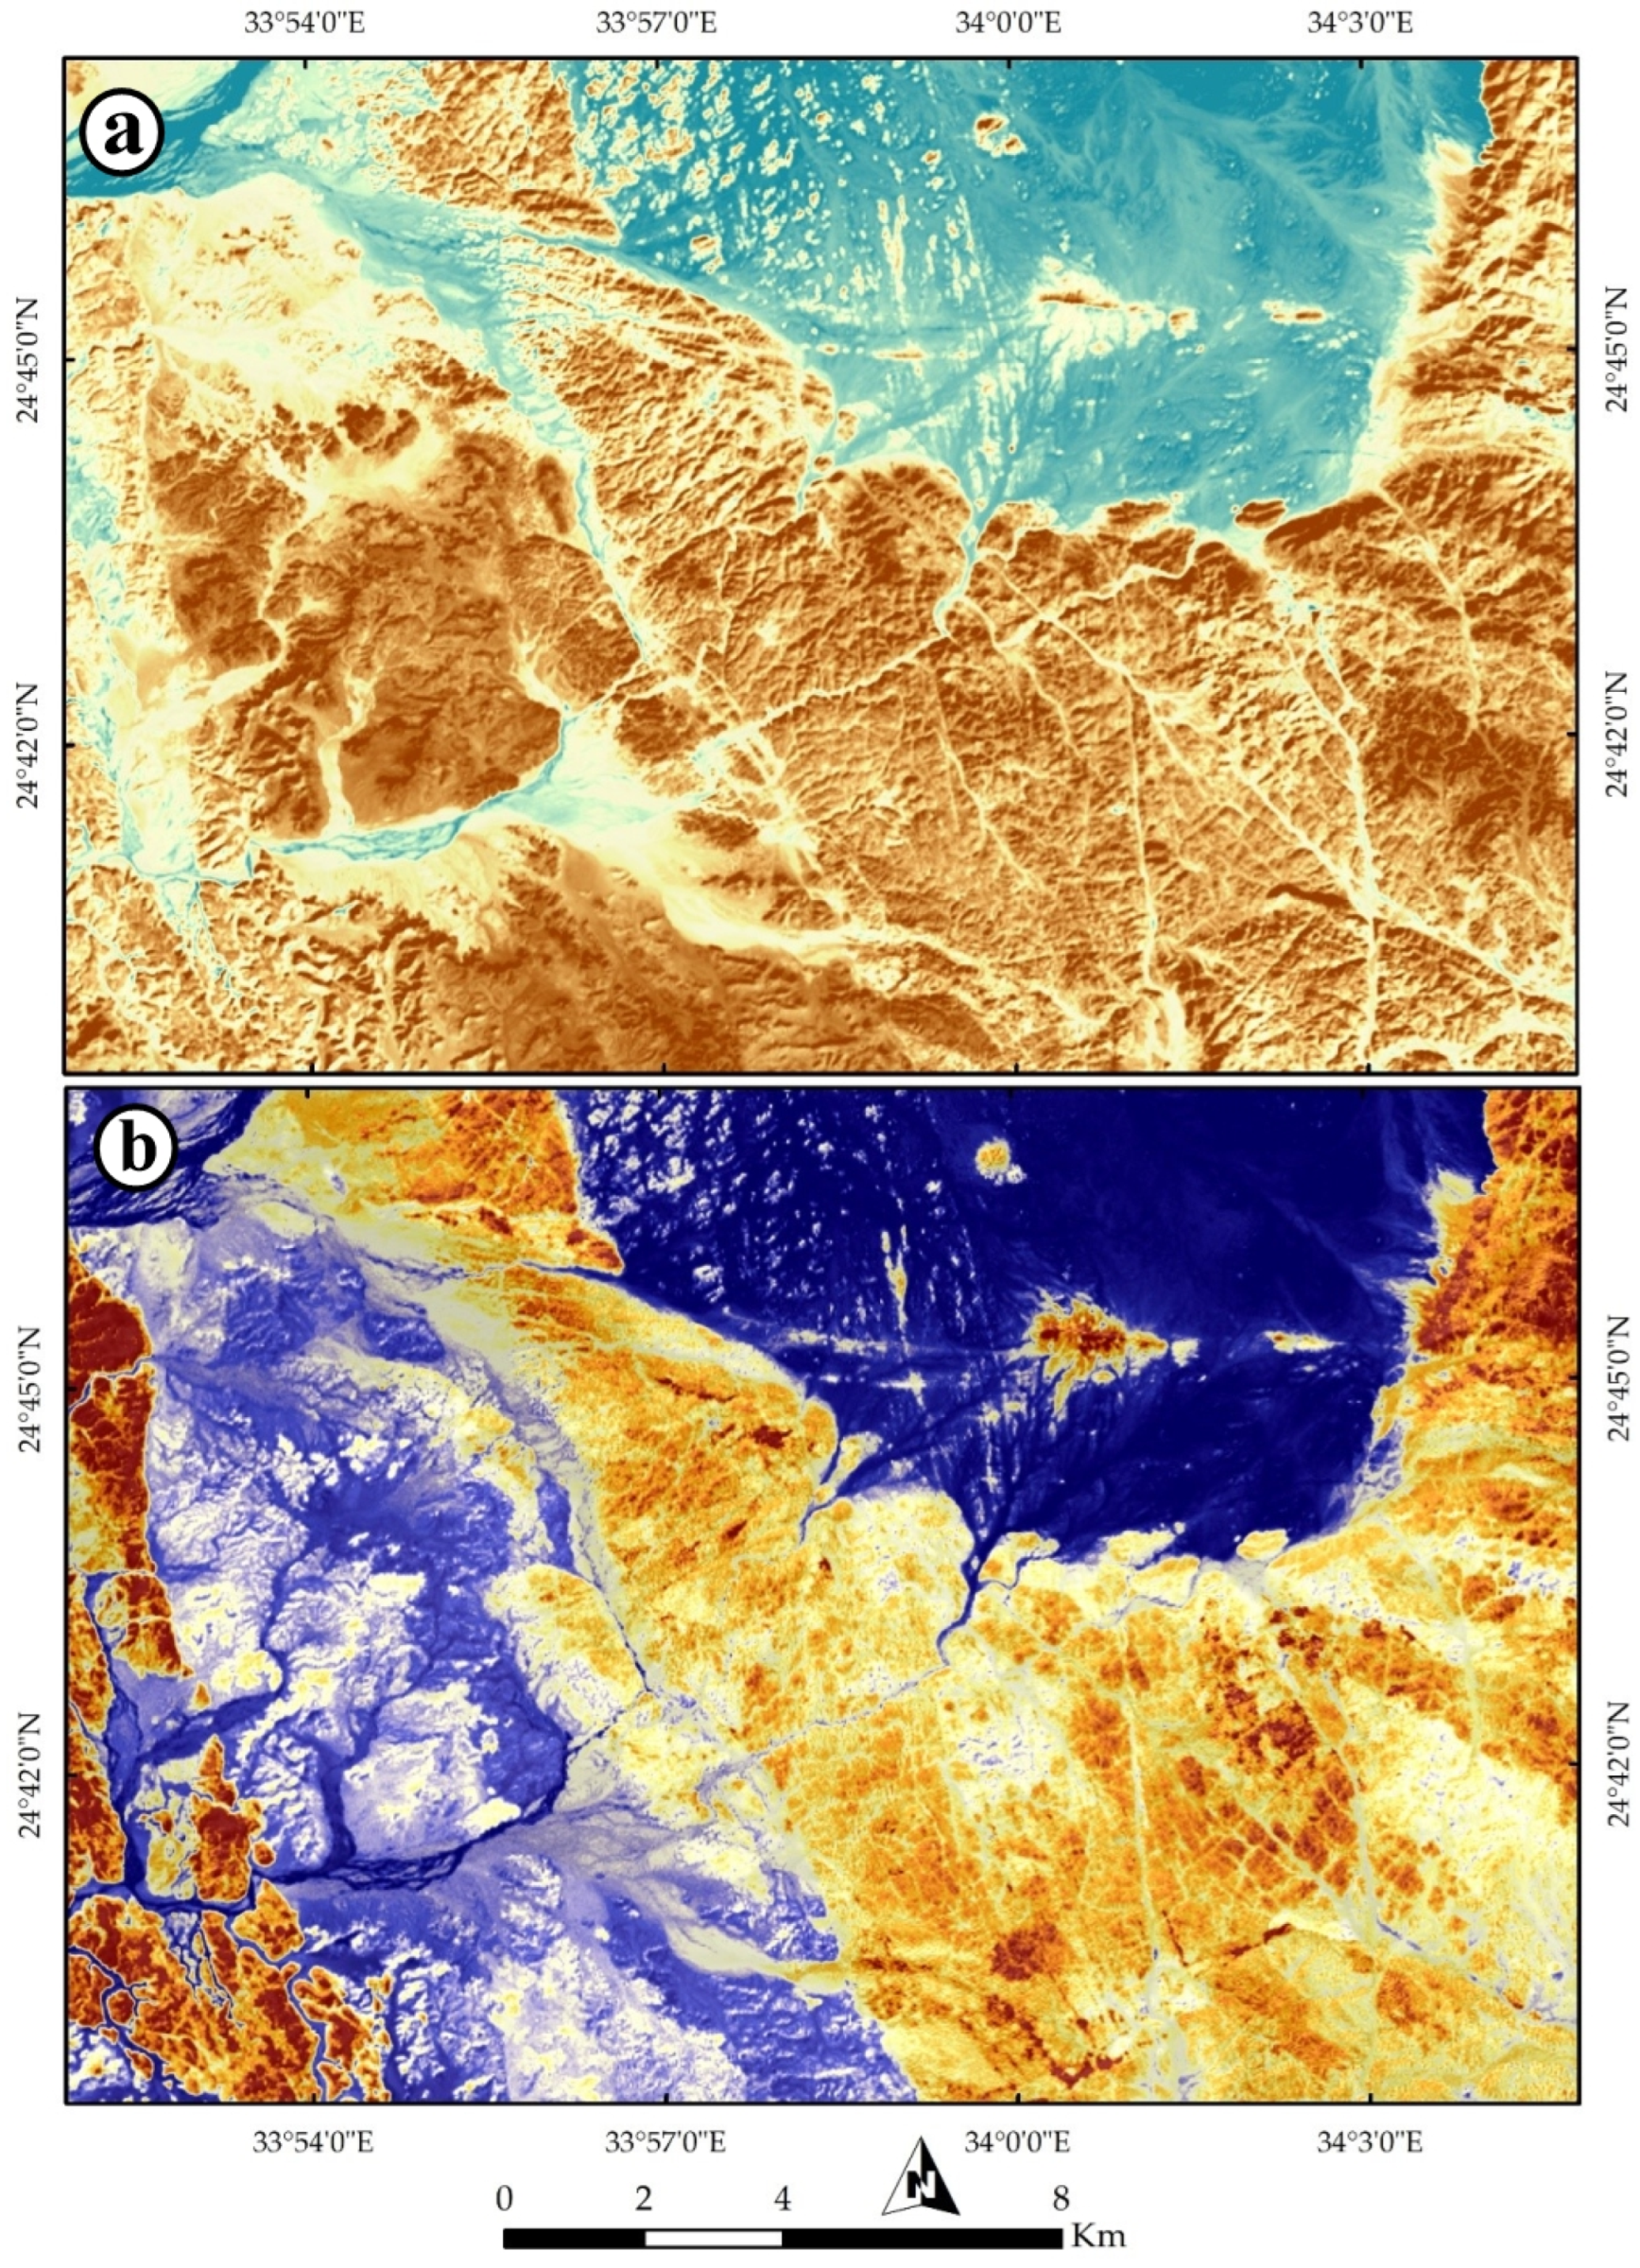
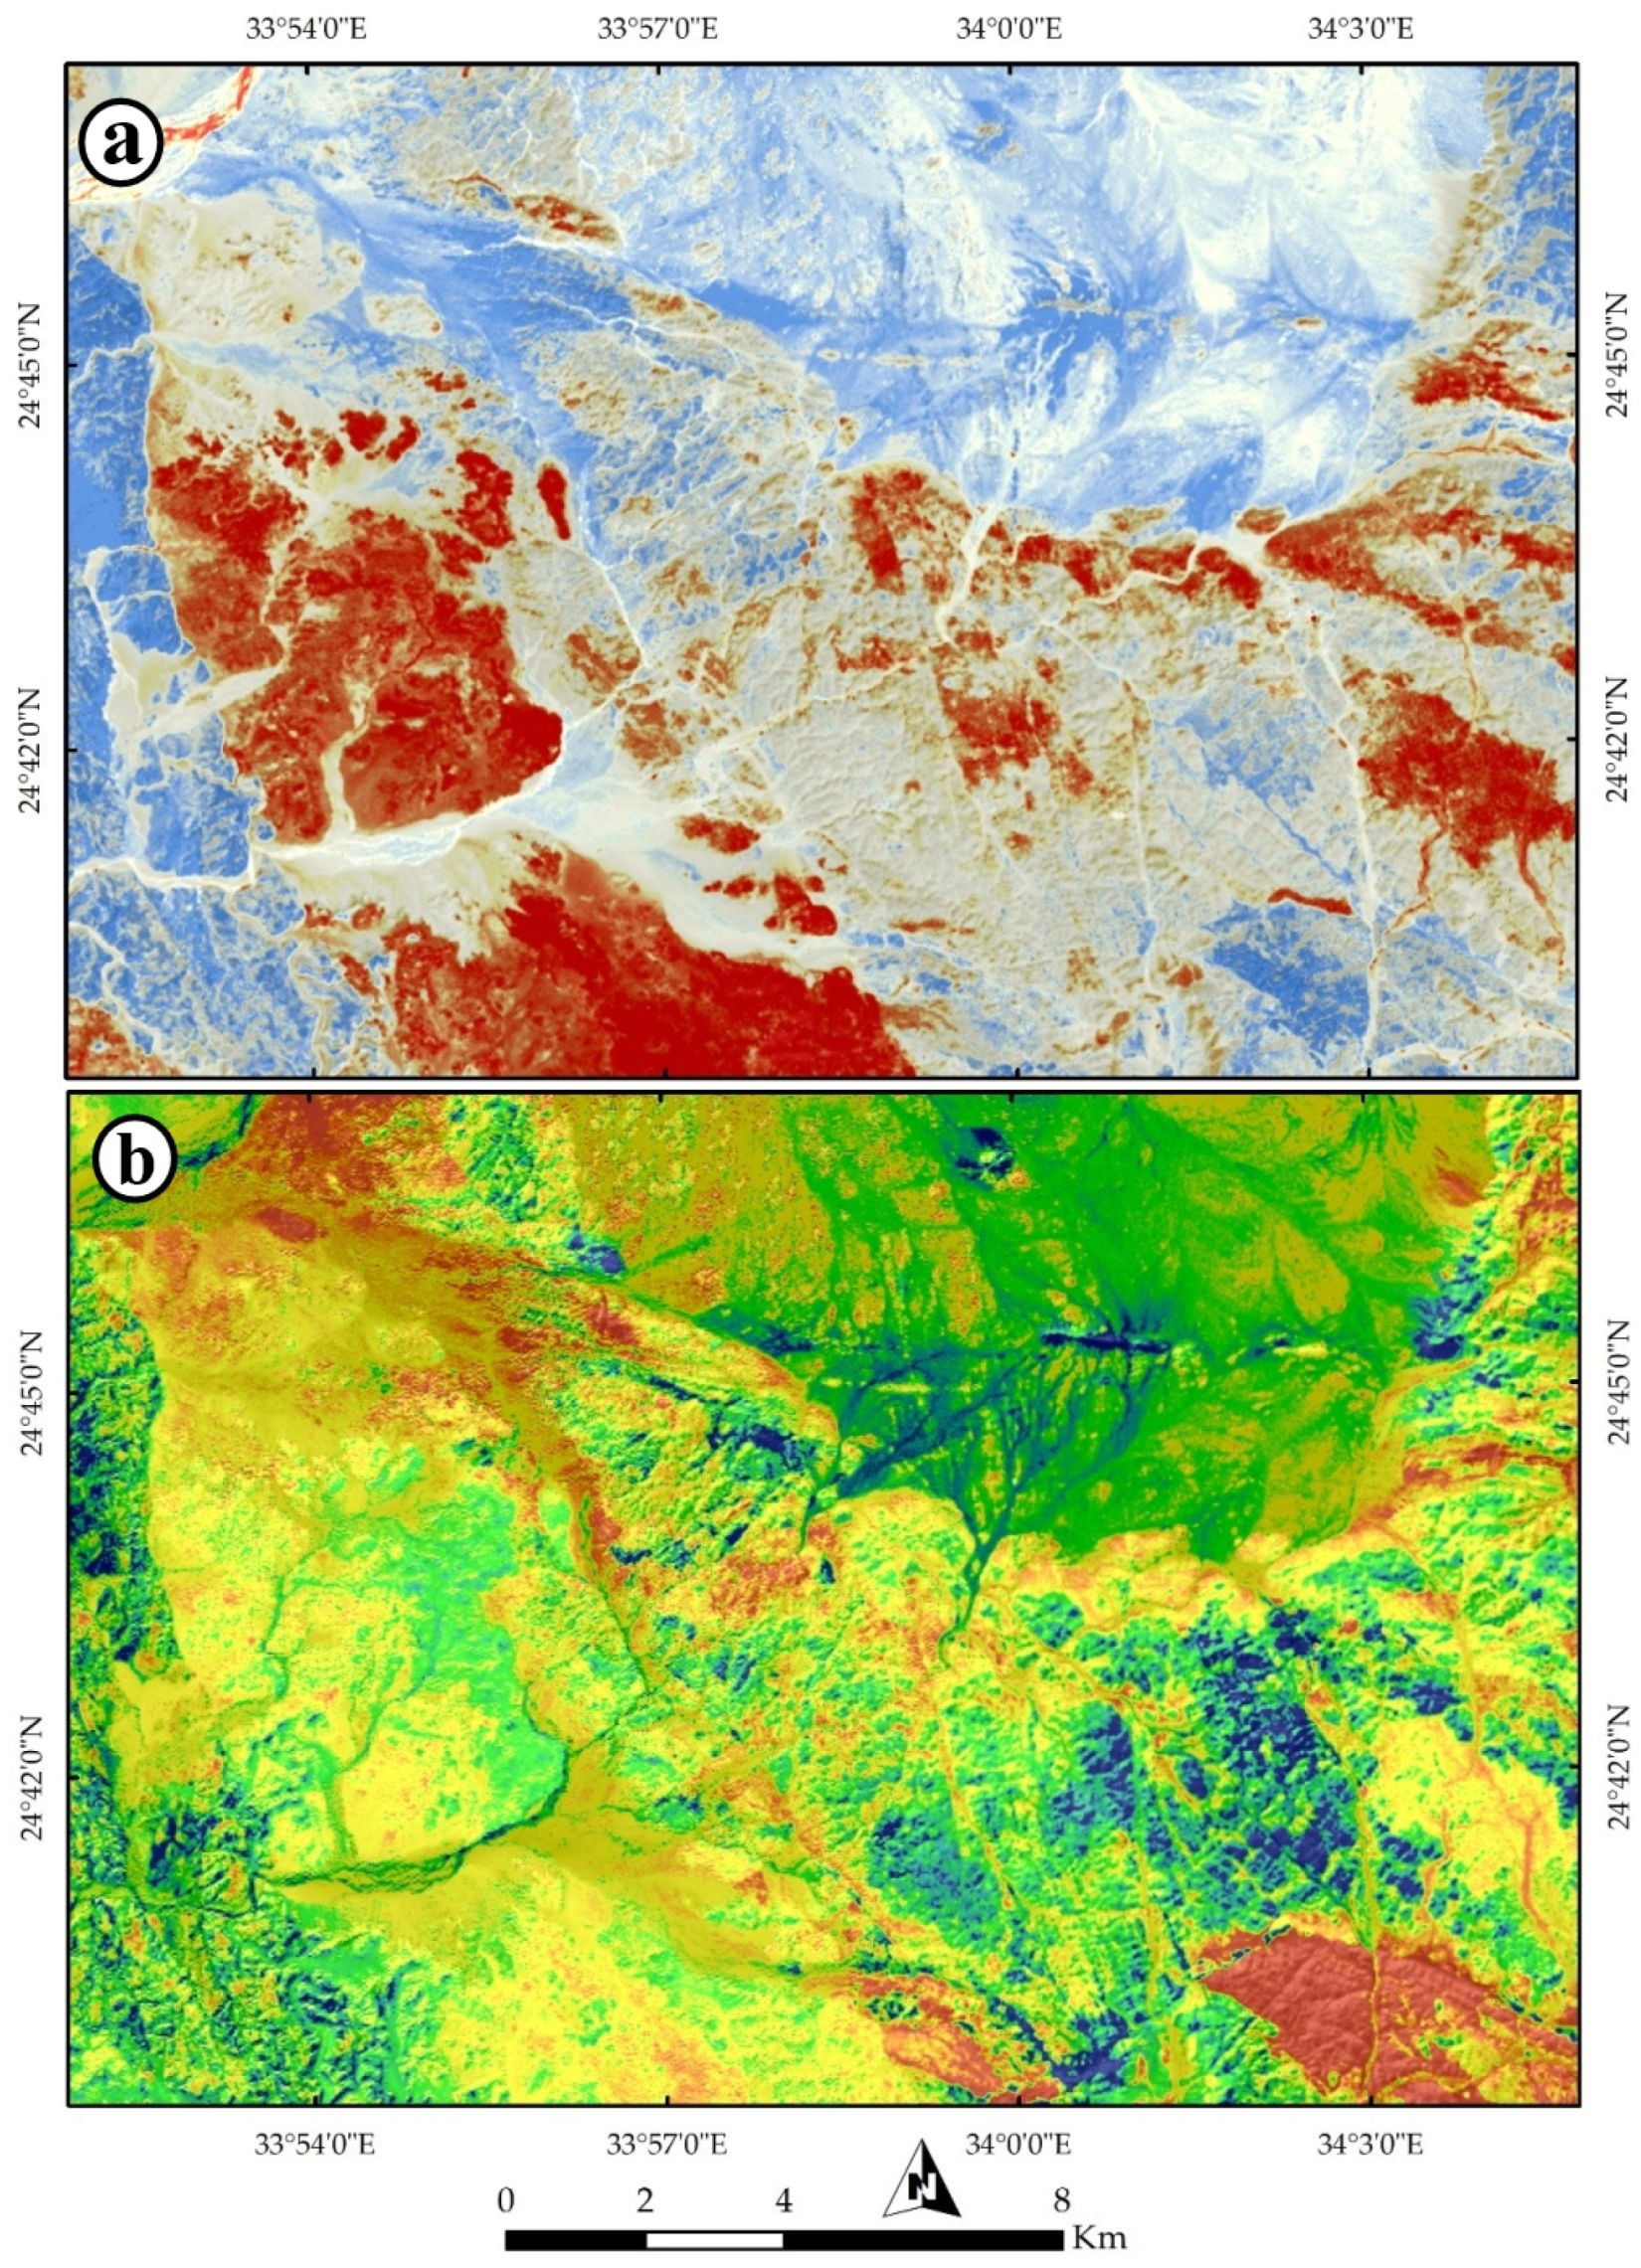
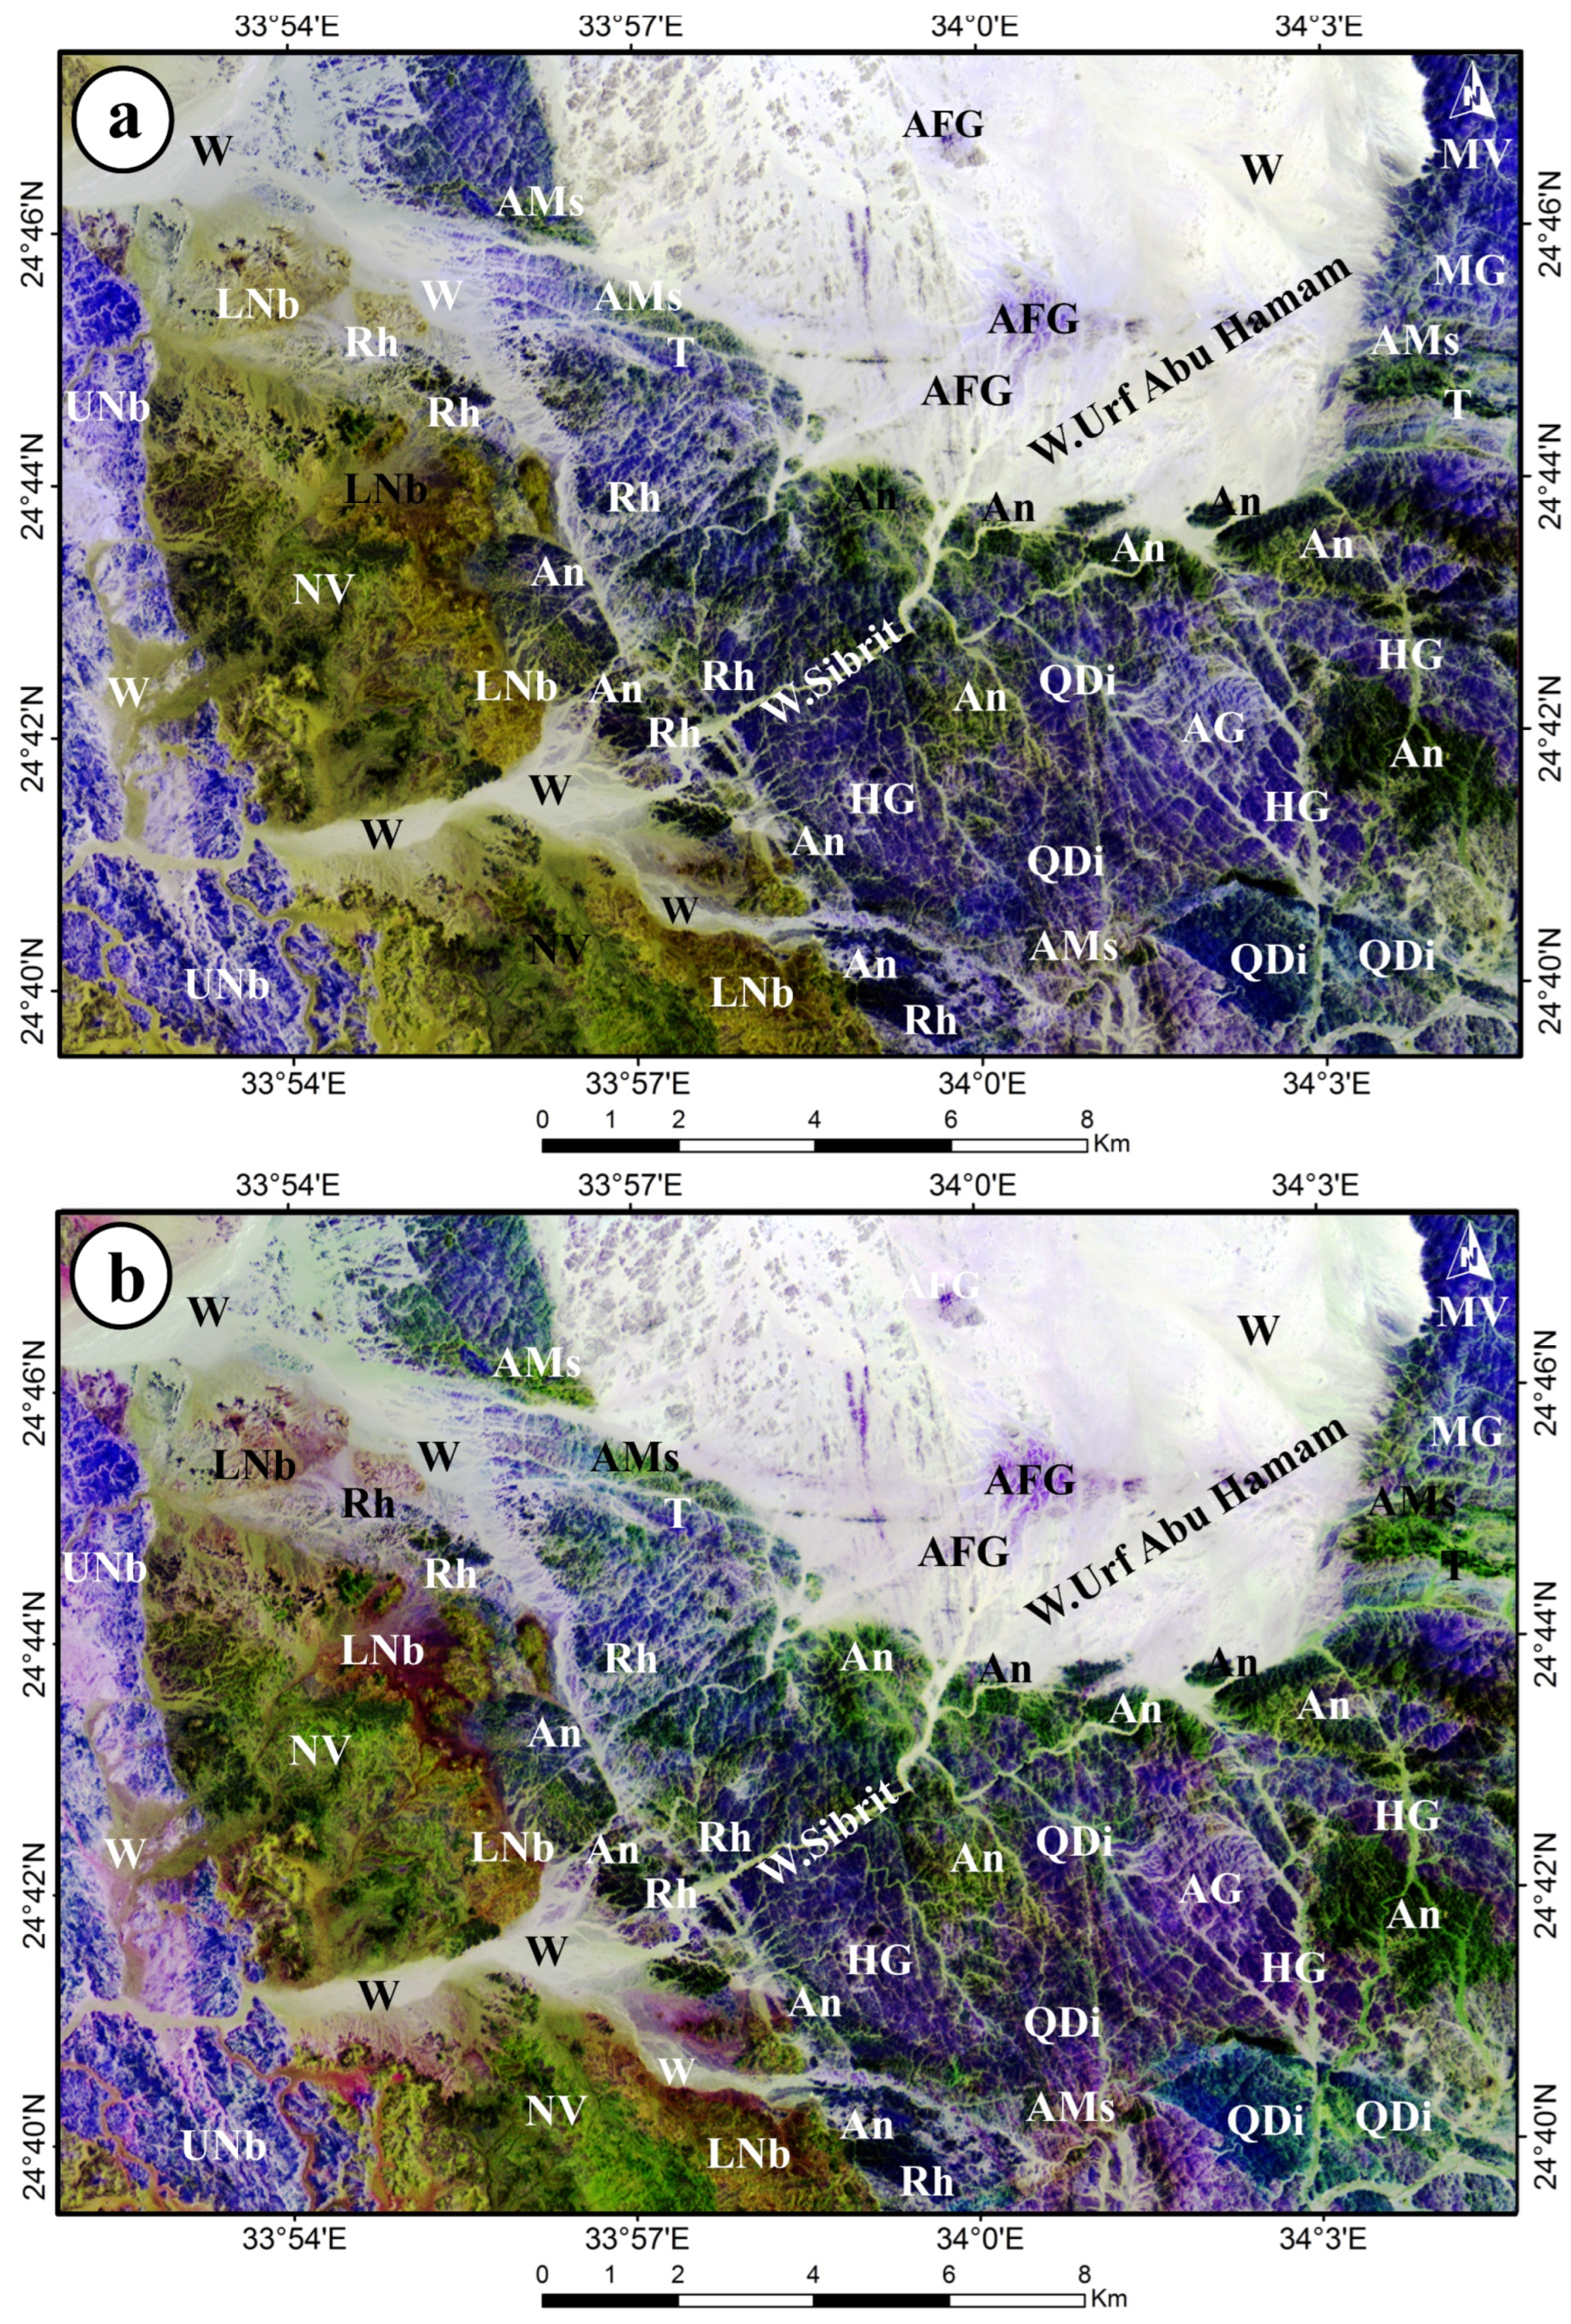
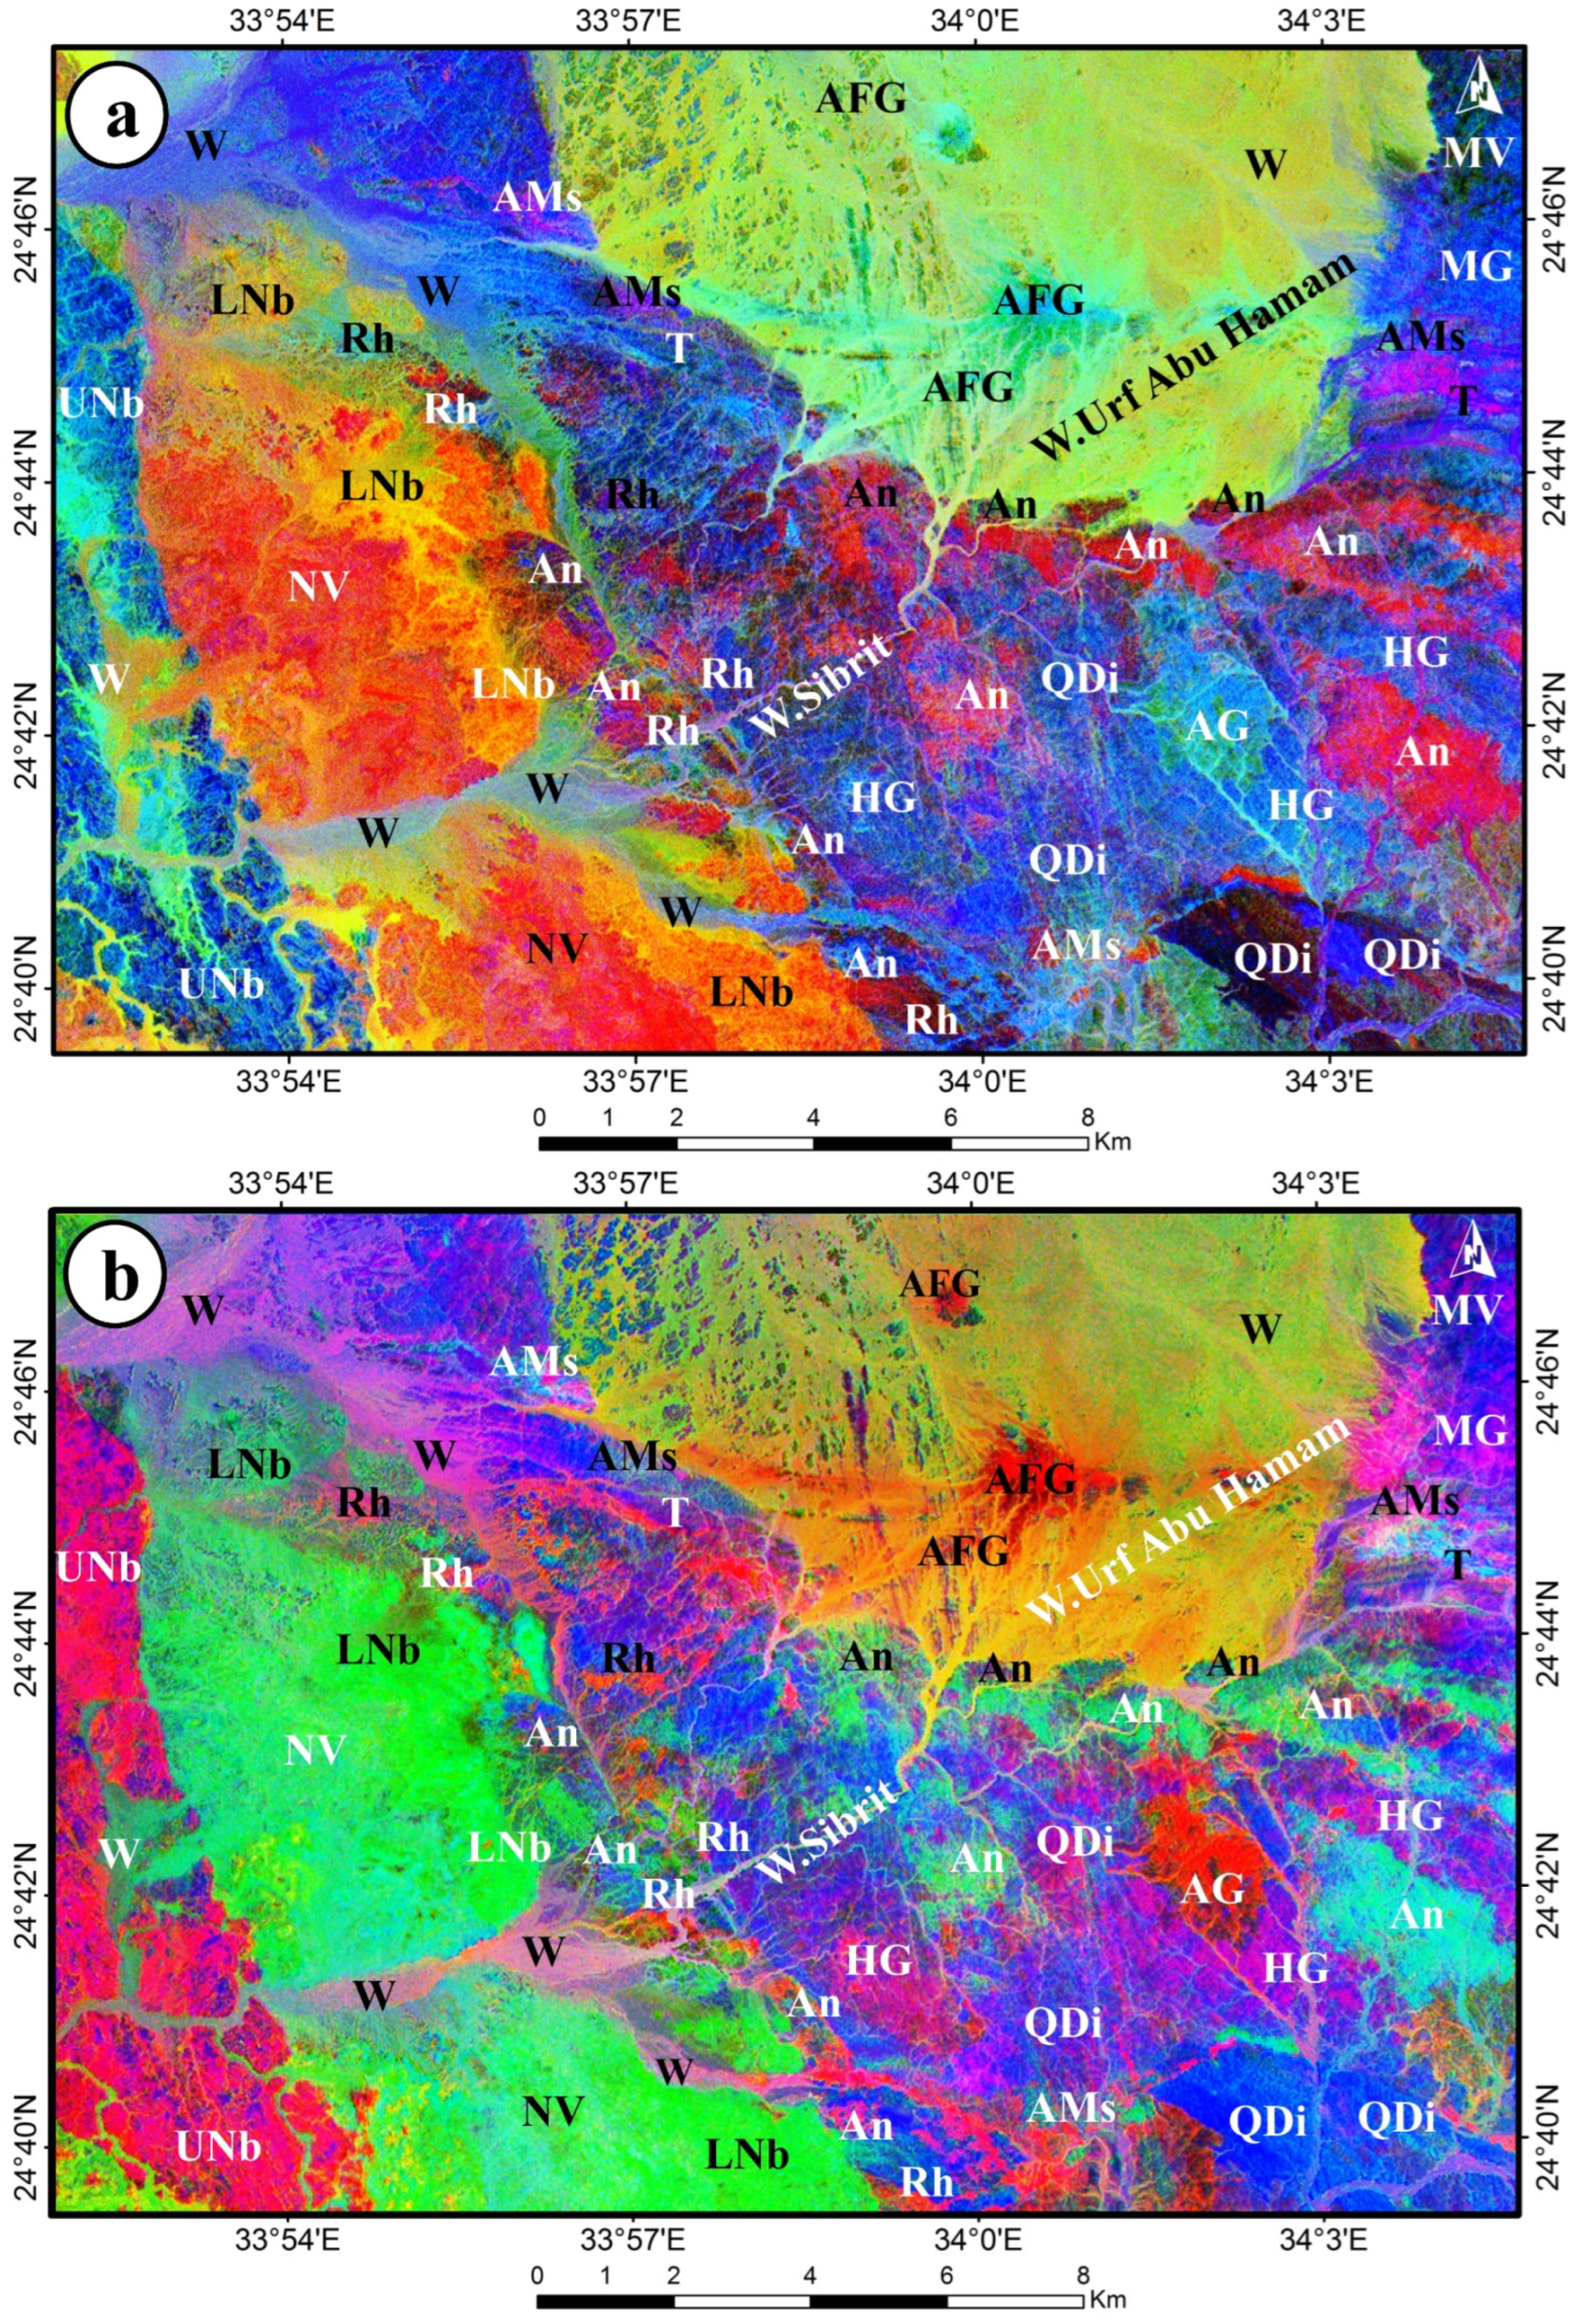
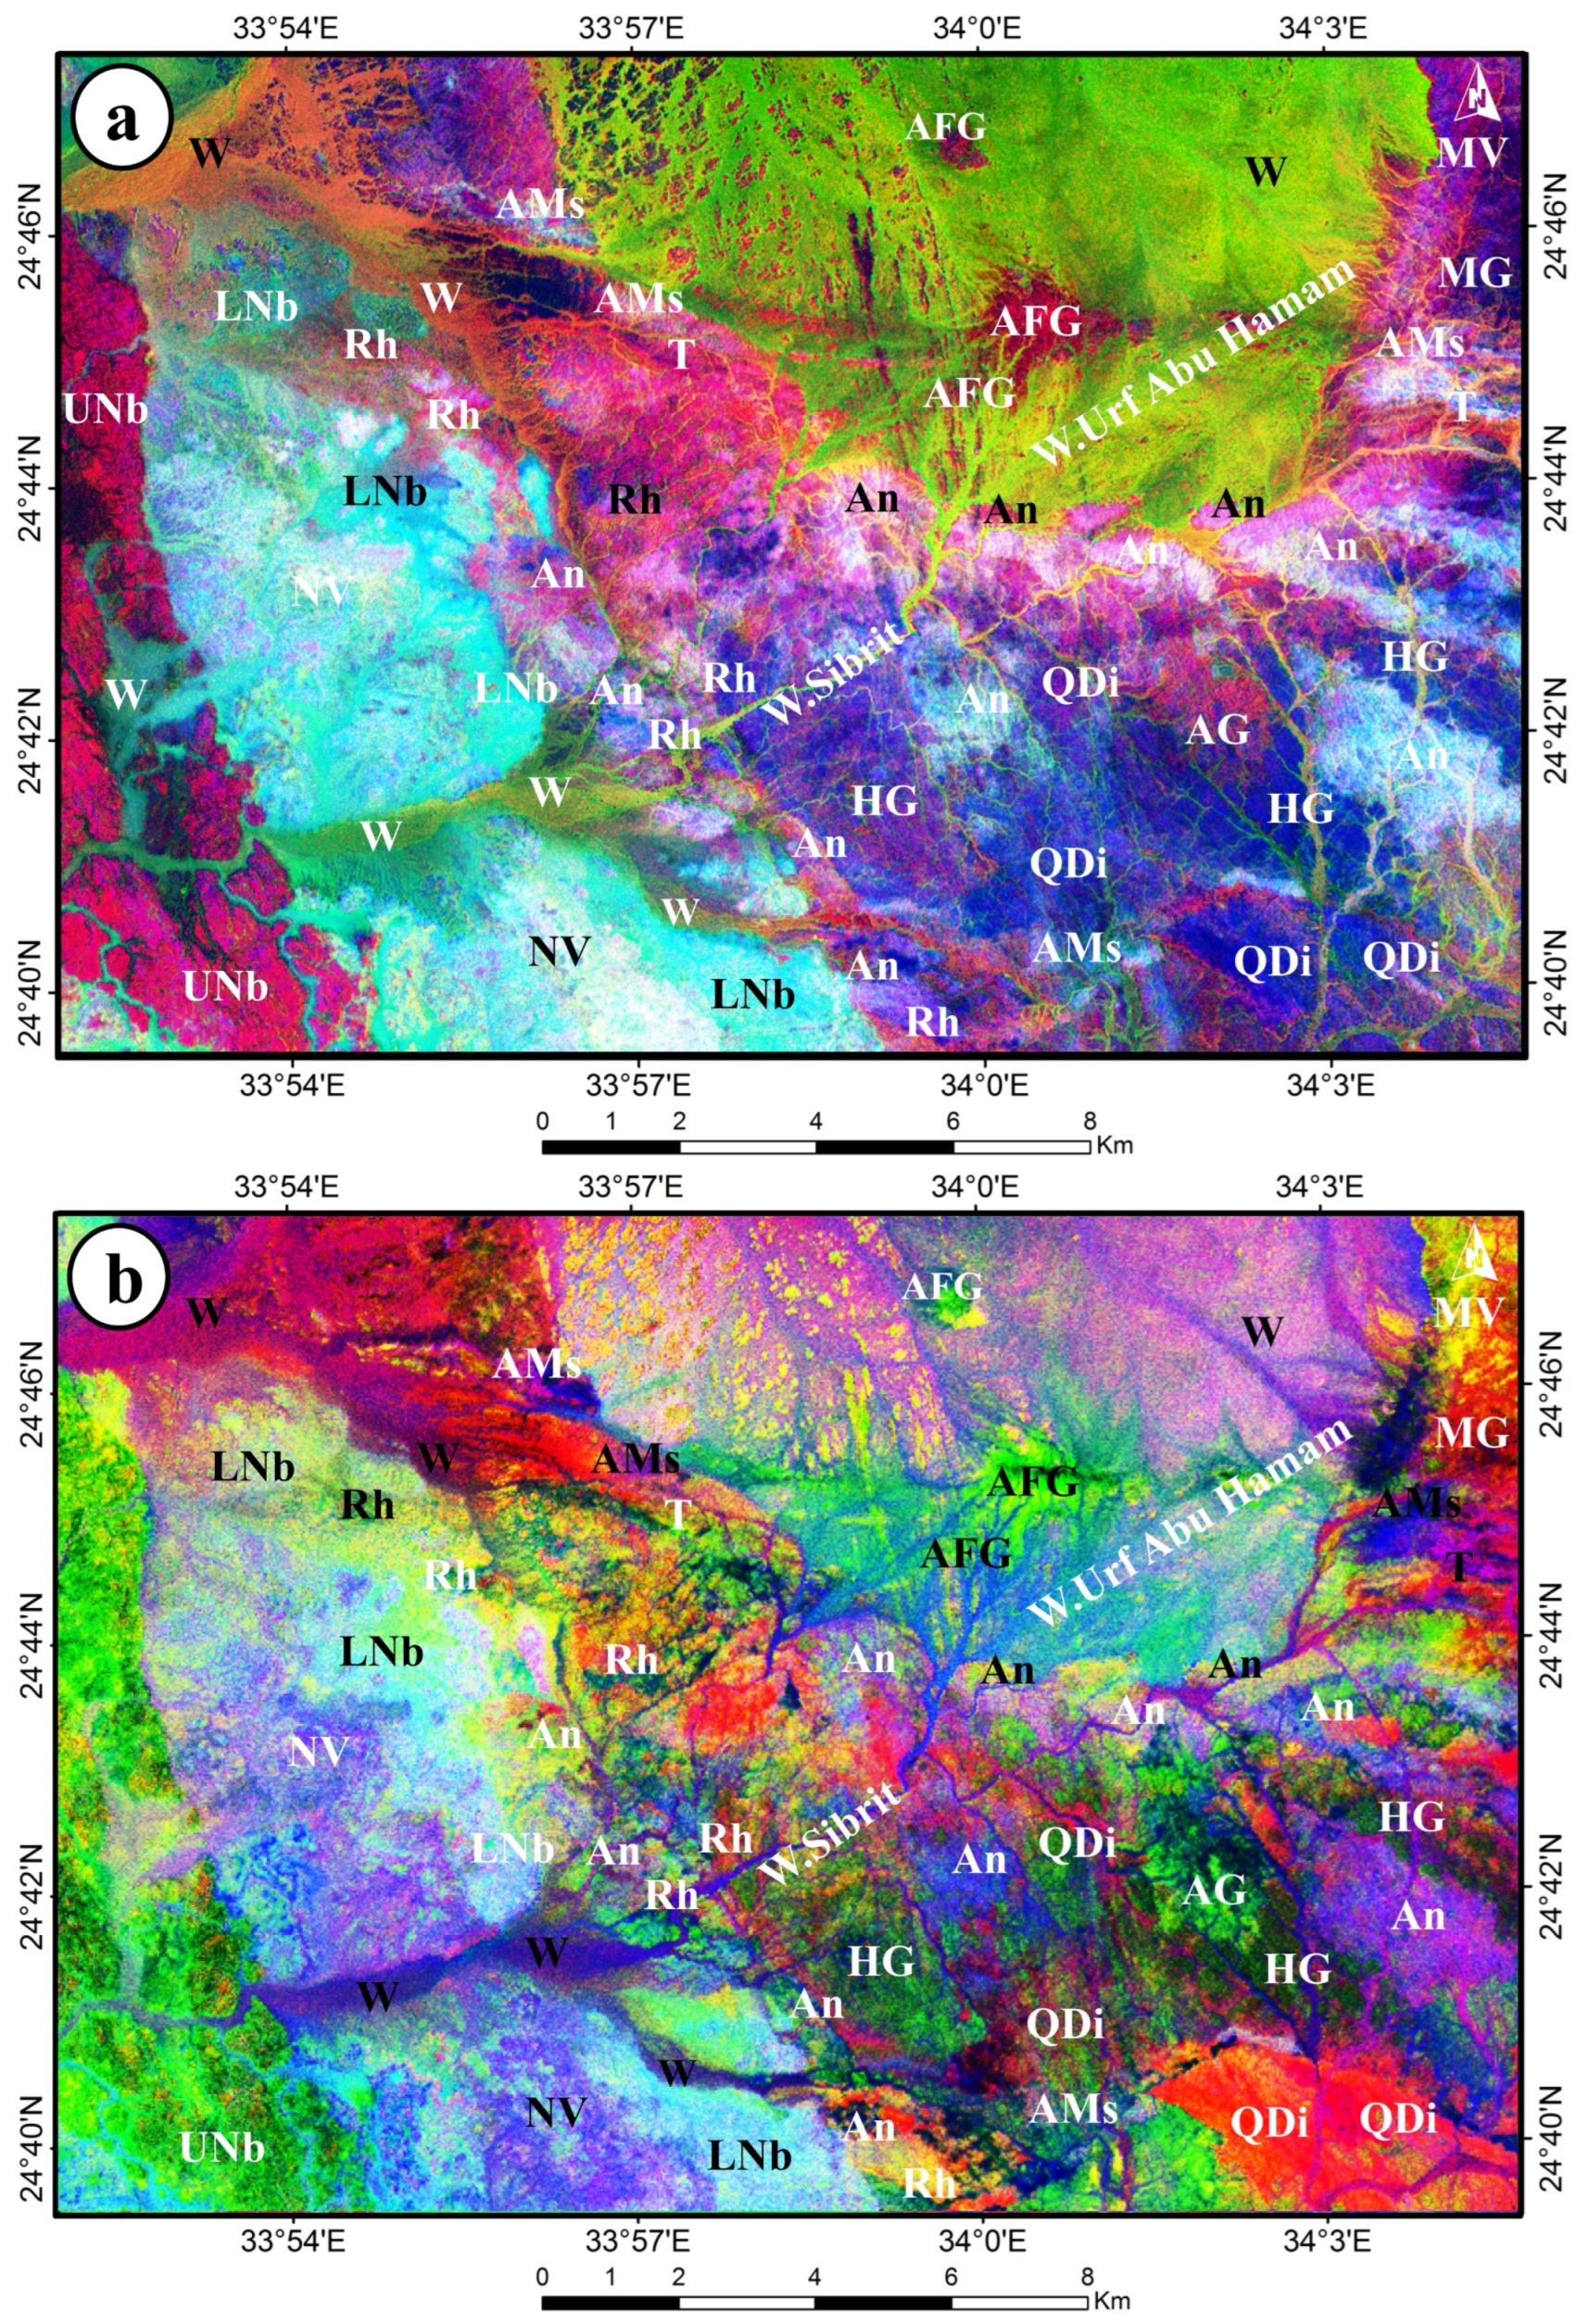
4.2. Remote Sensing Results

Remote sensing investigations, utilizing Landsat 9, ASTER, and PRISMA hyperspectral data, were conducted to differentiate the main lithologies and delineate major structural elements within the study district. Figure 7a distinguishes exposed rock units (brown) from wadi deposits (cyan and yellow). These wadi deposits, primarily derived from the weathering of surrounding rock units, exhibit varying intensities of blue in Figure 7b. For example, the wadi deposits surrounding the alkali feldspar granite (a northern, rounded portion of the study district) show a different blue hue compared to those associated with the Phanerozoic rocks in the western part. Furthermore, Figure 7b (Landsat 9 MNF1) highlights the NW-trending unconformity between the basement rocks and Phanerozoic rocks, represented by the distinct contact between brown and yellow areas. This figure also effectively differentiates the Upper Nubian sandstone (dark brown in the west) from both the Natash volcanics and the Lower Nubian sandstone.
To further differentiate the basement rocks, primarily exposed in the eastern portion of the study district, additional image processing techniques were employed. Figure 8a (MNF2) highlights the widespread andesites in red, exhibiting a dominant NW-SE-to-WNW-ESE trend. This spectral signature also corresponds with the Natash volcanics, which is consistent with their known andesitic composition. Within the same Figure 8a, hornblende granite is represented by a pale-yellow color, often intercalated with the red andesitic units. This pattern aligns with field observations and the established geological relationships between the Dokhan volcanics (andesitic) and the hornblende granite. More felsic compositions, such as alkali granites, alkali feldspar granites, and even quartz diorites and tonalites, tend towards a bluish tint. Therefore, Figure 8a effectively discriminates between intermediate (primarily andesitic, in red) and felsic (in blue) compositions, with the hornblende granite exhibiting a distinct yellow hue due to its higher mafic mineral content (hornblende) compared to other granitic rocks. Figure 8b further distinguishes quartz diorite and tonalite, displaying them in a brownish-red color.
Beyond lithological discrimination, remote sensing investigations revealed that the area is highly dissected, as evidenced by the structurally controlled wadis shown in Figure 9a,b. Figure 9a depicts a connected, trellis-parallel drainage pattern, trending primarily N-S and E-W in the eastern part of the study district. These trends are particularly prominent within the alkali feldspar granite area. A NE-trending, structurally controlled wadi is depicted in Figure 9b, with several perpendicular tributaries, further highlighting the influence of structural elements on the drainage pattern.
PRISMA hyperspectral data, specifically MNF 18 (Figure 10a), clearly delineate several lithological units trending NW-SE and E-W, such as those associated with the alkali feldspar granite (brown), as shown in Figure 10b (IC5). The heterogeneous boundary between the circular alkali feldspar granite body and the surrounding lithologies is depicted by the pseudocolor ramp in Figure 11a,b, which also highlights the various structural elements along that border. For example, foliations within the arc-related metasediments east of the alkali feldspar granitic pluton are easily observed as an intercalation of blue and brown colors in SMACC endmember 3. This endmember, primarily displayed to mark acidic rocks, is shown in a yellow-brown color. The compositional heterogeneity is well represented by the diverse colors in endmember 8, where alkali granites are displayed in reddish-blue, and their weathered products or associated lithologies appear in yellow.
Textural analysis of the Landsat data was performed to delineate the primary structural features of the study district. The correlation texture (Figure 12) proved to be the most effective component, clearly highlighting the dominant structural trends (NW-SE, NE-SW, N-S, and E-W). These trends are consistent with the structural trends identified in the aeromagnetic data.
ASTER false color band combinations of (b4, b3, b2) and (b7, b3, b1) in RGB were chosen (Figure 13a,b). It is striking in these images to see the clear separation of the volcanic rocks, which are distinguished by their bright green or pale green color, from all the other rocks in the district. Also, we used two main band ratio composites, which were tested and found to be the best composites for discriminating the lithological units. The first one is the ASTER composite ratio (4/7, 3/4, and 2/1) in RGB, which was used by [48] and was regarded as the best band ratio that distinguished between the various rock types, particularly Natash volcanic (pink color), Upper Nubian sandstone (blue color), Lower Nubian sandstone (pale orange), and andesites (purple color) (Figure 14a). The second type is an ASTER ratio compound (6/8, 4/5, and 2/4) in RGB, which, according to the bands mentioned in [49], turned out to be one of the best images because it separated the rocks. Through this image, it appears that a thick zone of Natash volcanic rocks (pale green) has penetrated the surrounding rocks (Figure 14b). In this study, the use of the principal component analysis technique resulted in the best two PC combinations of ASTER (PC5, PC2, and PC1) and (PC4, PC3, and PC2). These PCs enabled the separation of the different rock units in the study district (Figure 15a,b). For lithologic edge enhancements for visual interpretation and field mapping, both images were effective. The arc-metasediments can be distinguished by their blue tint, whereas the metavolcanics are seen on the northeastern side as a yellow color. The northeast and central sides of the metagabbro–diorite complex are colored blue and orange. Rhyolites are yellowish green in color, while alkali feldspar granites exhibit a pale green color, and andesite appears blue. Lower Nubian sandstones surround a thick violet zone that distinguishes the Natash volcanics. Upper Nubian sandstone is green on the area’s western side (Figure 15a,b).

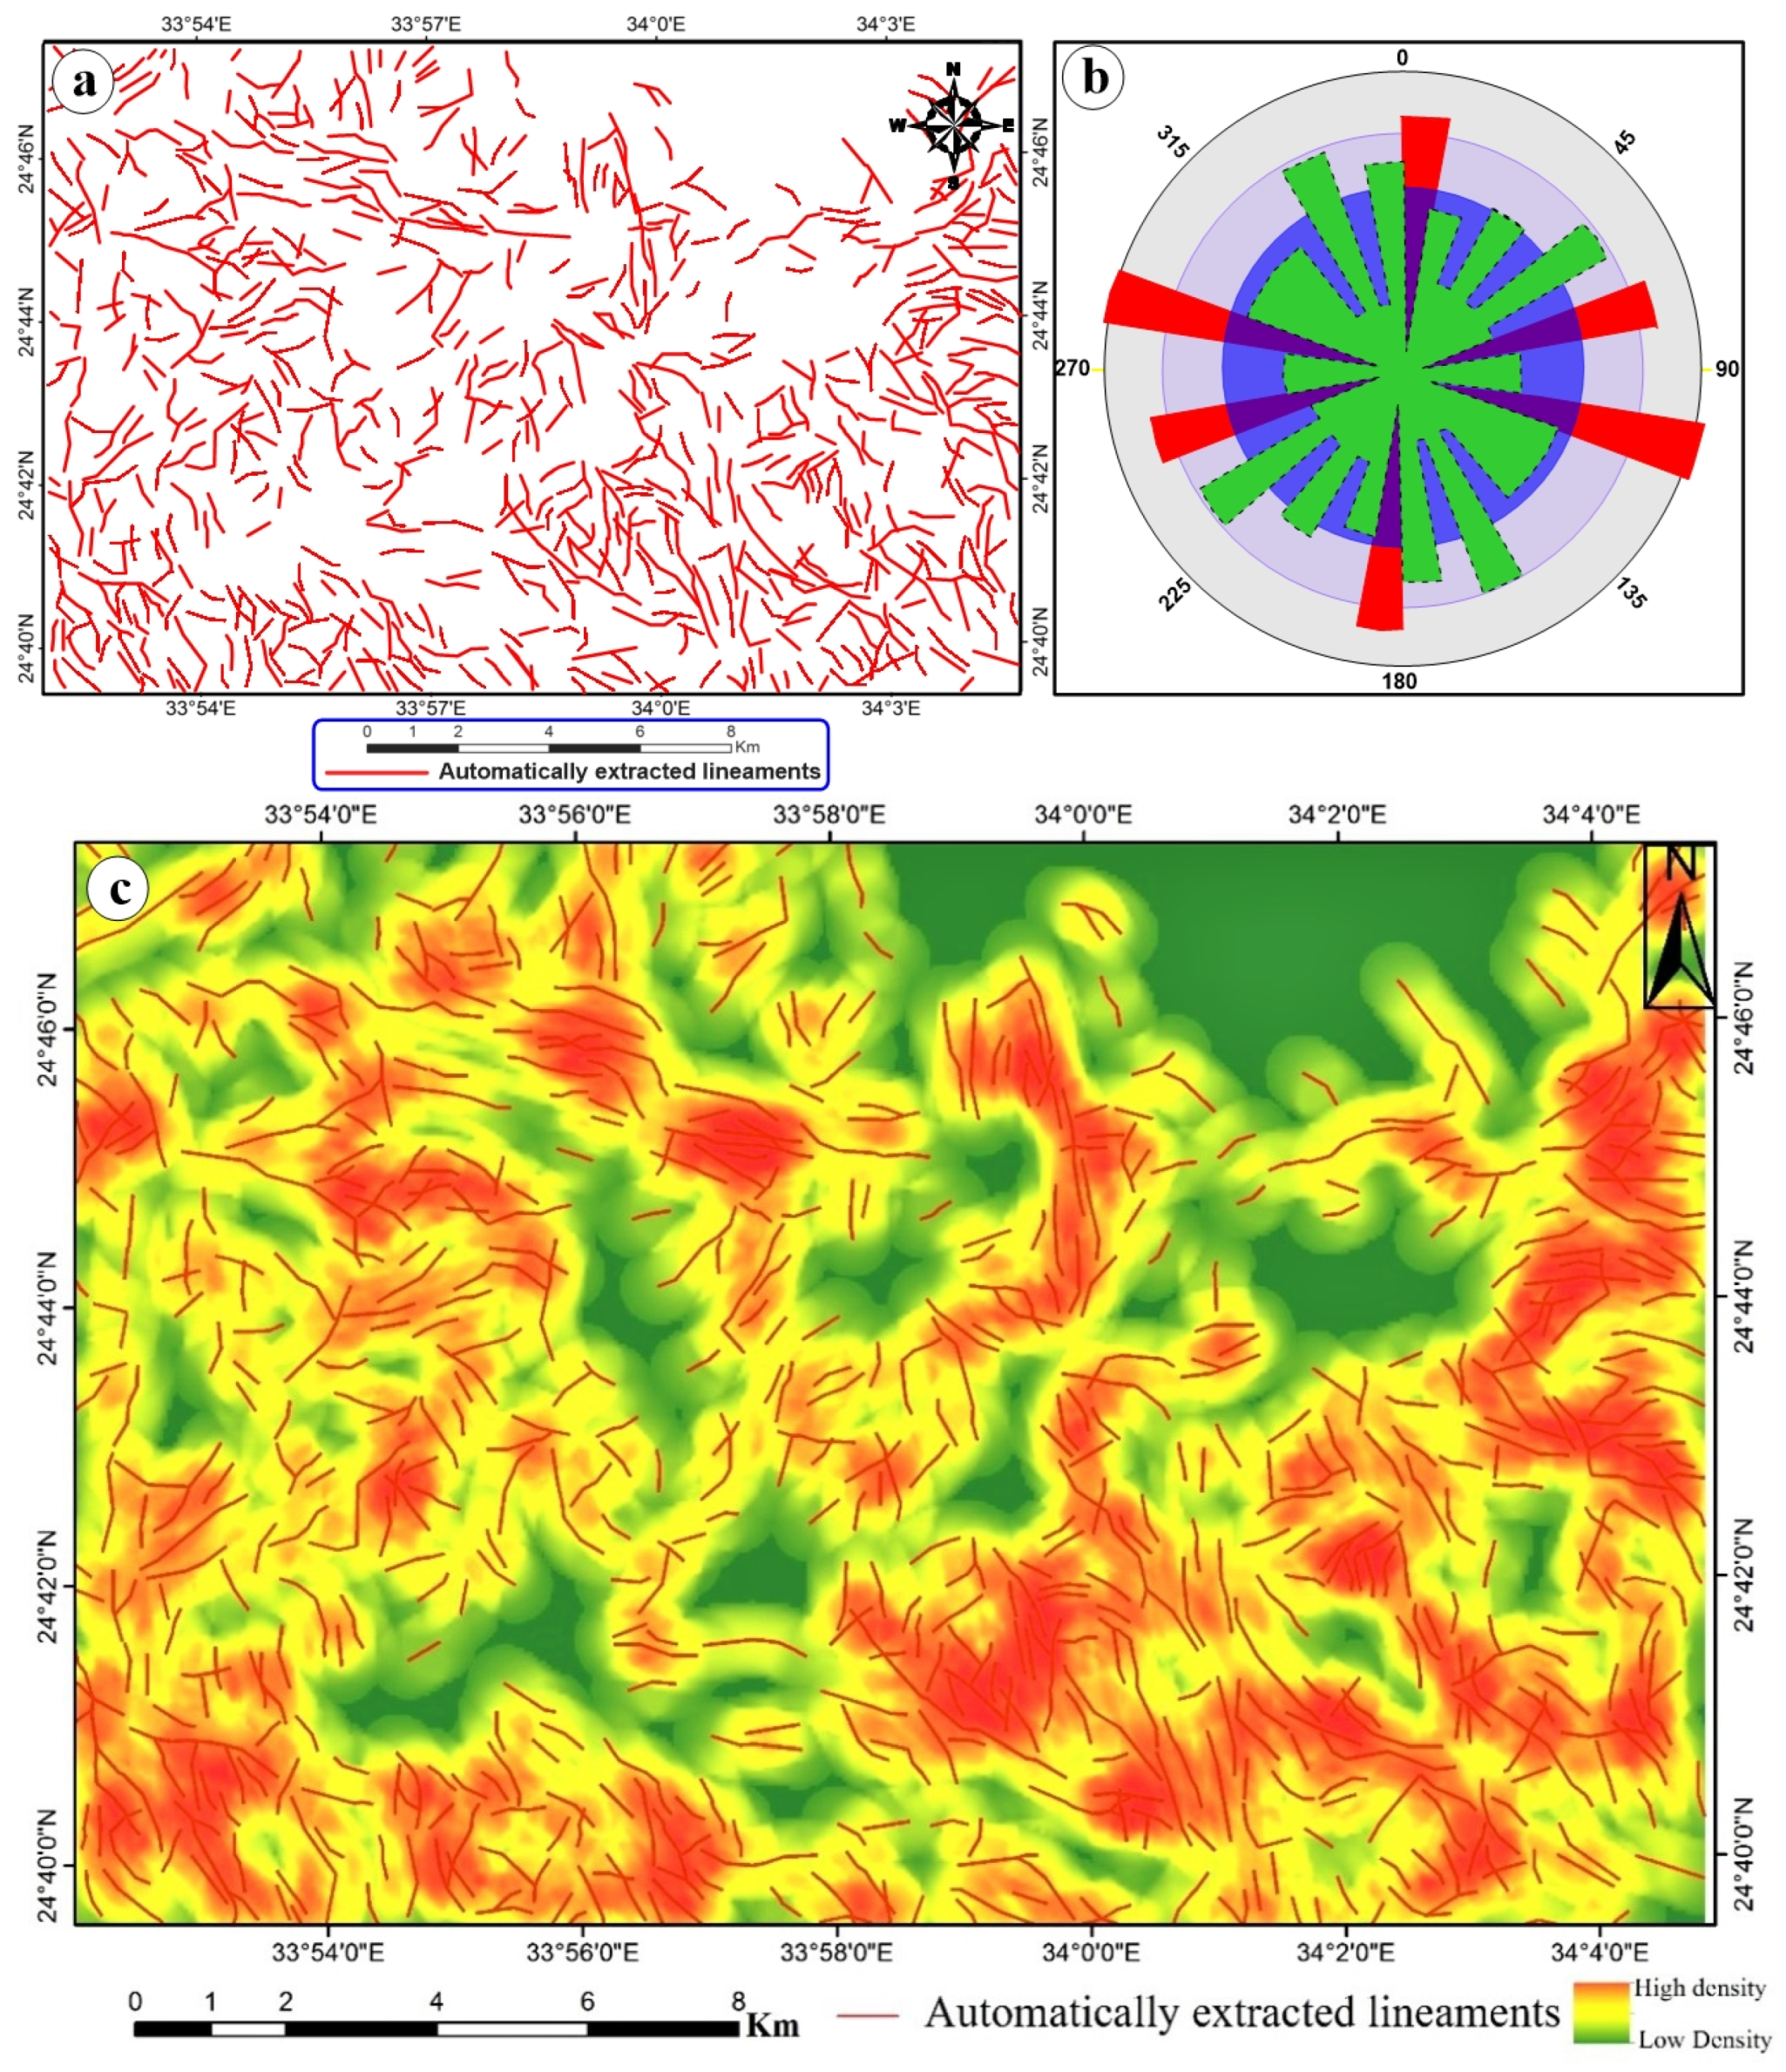
4.3. Relationship of Mineralization to Lineament Extraction

A lineament is a surface feature that can be mapped that is either simple or composite and has linear components that are aligned in a rectilinear or slightly curvilinear relationship. This feature’s alignment differs from that of adjacent features and is likely reflective of a subsurface phenomenon [56]. Geologists frequently utilize satellite data as a source of knowledge to map lineaments. Under this study, the most common software for this purpose was employed to carry out automatic lineament extraction (the LINE module of the PCI Geomatica package using the default parameters with adjustment of the Edge gradient threshold to 40 pixels). Edge detection, thresholding, and linear extraction phases make up the extraction algorithm. To choose the ideal band for lineament extraction, ASTER VNIR-SWIR spectral bands and principal component bands were put to the test. According to the results, the first principal component band is the most effective band for automated lineament extraction (PC1).
The spatial resolution of the images has a significant impact on the accuracy of the lineaments that are retrieved. A higher-quality lineament map is produced by using images with higher resolution [57]. On this basis, the PC1 is fused to achieve a higher spatial resolution (15m). Because automatically extracted lineaments may have an expression of error or other linear weakness [57], visual inspections of the extracted lineaments have been carried out for editing and eliminating false (incorrect) lineaments such as roads, routes, buildings, and any other manmade features. Figure 16a depicts the automatically derived lineaments following editing to remove artificial characteristics. The directional analysis of the automatically extracted lineament maps and rose diagram shows (Figure 16b) that there are main faulting trends that have been recognized, which are NW-SE, NNE-SSW, and N-S (in a descending manner). Density depends on the number of lines per unit area (number/km), the total length of the lines in each unit area (number/km2), or a combination of them.
In this study, we used Arc GIS (version 10.3) to automatically determine the lineament density (Figure 16c) according to the number of lines per square kilometer. Higher densities are shown in red and are thought to correspond to higher levels of mineralization-related fracturization in the underlying rocks. The higher densities are represented in red and are assumed to represent a higher level of fracturization in the rocks that are related to mineralization.

4.4. Field Observations and Petrographic Investigations

The study district is covered by the Neoproterozoic basement rocks of the Pan-African Terrane and the Phanerozoic rocks exposed in the Southern Eastern Desert (SED). Figure 17 shows the field verification of the basement rocks of the complex regions of Wadi Sibrit and Urf Abu Hamam. As a result of accretion plateaus during the consolidation of Gondwana, the studied area is a component of the Neoproterozoic history of the North Arabian–Nubian Shield in NE Africa [58,59,60].
The basic rocks centered in this region are metavolcanics (metabasalts), metagabbro-diorite complex, Dokhan volcanics (rhyolite, andesite, and dacite), and granitic rocks. Meanwhile, the Phanerozoic rocks are represented by Lower Nubian sandstones, Natash volcanics, and Upper Nubian sandstones, in addition to various dykes of different compositions represented by bostonite, trachyte, dacite, and quartz veins (Figure 1). The western part of Wadi Sibrit is covered by sedimentary rocks (Nubian sandstone facies) with extrusion of Wadi Natash volcanic flows and volcaniclastic sediments with their weathered products, while the eastern part is covered by Neoproterozoic basement complexes. The island arc assemblages exposed in the study district are represented by metavolcanics (metabasalts) and metagabbro–diorite complex. The metavolcanics covered a relatively narrow area in the northeastern part of the study district. They are represented by metabasalts, which occur as small outcrops in the studied district (Figure 18a). These metabasalts are fine-grained, non-porphyritic rocks composed mainly of plagioclase and pyroxene crystals. Carbonate minerals, chlorite, and epidote represent the secondary minerals, while opaque minerals and quartz are accessory minerals (Figure 18b).
The metagabbro–diorite complex occupies different exposures along Wadi Sibrit and Wadi Urf Abu Hamam. The metagabbro–diorite masses are usually massive, heterogeneous, medium- to coarse-grained, and dark-to-pale green (Figure 18c). Petrographically, metagabbros are medium- to coarse-grained and show hypidioblasts and ophitic-to-subophitic and corona textures. It consists principally of plagioclase, pyroxene, and hornblende. The main accessory minerals are olivine, opaques, and minor biotite. Meanwhile, chlorite, epidote, asbestos, and tremolite–actinolite are found as secondary minerals (Figure 18d). Quartz diorites occupy the central and southeastern parts of the map. Generally, it is of light gray to greenish gray color, high relief, highly fractured, and occasionally foliated (Figure 18e). The quartz diorites are medium- to coarse-grained and composed essentially of plagioclase, quartz, potash feldspar, hornblende, and biotite (Figure 18f).
The studied Dokhan volcanics were exposed between Wadi Mueilha and Wadi Sibrit in the middle part of the studied district and its elongated NW-SE direction, which is traversed by Wadi Mueilha and Wadi Sibrit. These volcanics constitute a thick sequence of stratified lava flows of rhyolite and andesite. These lavas are interbedded with their pyroclastics. Rhyolites are usually found as large outcrops in the western part of Wadi Sibrit and they are characterized by being fine-grained, massive, and whitish to reddish pink, buff, pale red, or red in color (Figure 18g). Petrographically, these rhyolites are composed essentially of potash feldspars, quartz, and plagioclase phenocrysts set in a fine-grained groundmass of the same composition. Carbonates, chlorite, muscovite, and epidote are the main secondary minerals, whereas kaolinite, sericite, and opaques are the accessory minerals. It exhibits porphyritic, glomeroporphyritic, and granophyric textures (Figure 18h). Andesites are characterized by green to dark green colors, are medium-grained, and are exposed at the central and western parts of the study district (Figure 18i). Andesites are almost holocrystalline and occasionally hyalopilitic, and they vary from fine- to medium-grained. They are generally porphyritic with phenocrysts of plagioclase and hornblende embedded in a fine-grained groundmass of plagioclase, hornblende, chlorite, epidote, quartz, and opaques (Figure 18j).
According to field studies, Wadi Sibrit-Urf Abu Hamam granites are classified into hornblende granites, alkali feldspar granites, and alkali granites. Hornblende granites are exposed in the center and southeastern parts of the mapped area, covering a relatively vast area. Generally, they have a pink to red color, are coarse- to medium-grained, high-relief, and highly fractured (Figure 18k). These rocks are generally equigranular, medium- to coarse-grained, and have a hypidiomorphic texture. They are composed mainly of plagioclase, alkali feldspar (orthoclase), quartz, biotite, and hornblende. Titanite, zircon, and opaques are common as accessory minerals, while sericite, chlorite, clay minerals, and epidote are secondary minerals (Figure 18l). The alkali granites cover a relatively small area in the central part of the mapped area. It directly intrudes on the hornblende granites, quartz diorites, and tonalites at Wadi Sibrit (Figure 18m). Alkali granites are composed essentially of plagioclase, quartz, and potash feldspar and exhibit hypidiomorphic and graphic textures (Figure 18n). Opaque minerals are the main accessory minerals, while sericite, chlorite, and epidote are the secondary minerals. The alkali feldspar granites are widely distributed in the study district and represented by Urf Abu Hamam granitic masses, which occupy the northern part of the study district, and Wadi Sibrit granites which are exposed at the central part of the study district (Figure 18o). These rock types are medium- to very-coarse-grained and composed essentially of quartz, potash feldspar, and plagioclase with a small amount of biotite. Titanite and opaque minerals are the main accessory minerals. Sericite, zoisite, chlorite, and epidote are secondary minerals (Figure 18p).
The sedimentary succession is exposed at the western side of Wadi Sibrit and is represented by Nubian Sandstones. They are subdivided into three major types as follows: (1) Lower Nubian sandstones, (2) Natash volcanics with volcaniclastic sediments, and (3) Upper Nubian sandstones (Figure 19). The Lower Nubian sandstone is exposed on the western side of the studied district at the entrance of Wadi Sibrit (Figure 19a). This unit, distributed along the contact area between the basement and sedimentary rocks, extends toward the north of Wadi Sibrit and reaches up to Wadi Mueilha, which unconformably resets on Dokhan volcanics.
The Lower Nubian sandstones are composed of quartz arenite, graywacke, and calcareous sandstones at the base, followed by conglomerates at the top. These rocks are affected by the volcanic eruption of Wadi Natash (Figure 19b). Natash volcanics are mainly exposed as a dissected plateau with a stratified appearance (Figure 19c), which trends approximately NNW-SSE. Petrographically, these rocks are divided into altered dolerites and trachybasalts (Figure 19d,e). Upper Nubia sandstones are exposed at the entrance of Wadi Sibrit and they are also exposed along the extension NW-SE boundary along the contact with the Neoproterozoic basement complex (Figure 19f). Upper Nubia sandstones (quartz arenite) are composed of more than 95% quartz cemented by iron oxides. The quartz grains are fine to coarse grains, angular to subangular, and occasionally rounded to subrounded and well-sorted grains. Most of the quartz grains are disoriented and show undulate extinction.

5. Discussion

The integration of aeromagnetic and remote sensing data in the Wadi Sibrit-Urf Abu Hamam district reveals a complex interplay of lithological, structural, and tectonic processes that have shaped the Neoproterozoic basement and Phanerozoic cover of the Arabian–Nubian Shield (ANS). The pronounced magnetic anomaly contrast (+91 nT to −744 nT) delineates a central granitic core flanked by sedimentary basins, corroborating the region’s polyphase tectonic evolution. The high-amplitude positive anomaly (+91 nT) in the central zone corresponds to magnetite-rich granitic intrusions, likely emplaced during the Pan-African orogeny (870–540 Ma). These granites, validated by petrographic analysis (Figure 18), align with juvenile crustal growth models involving arc magmatism and post-collisional extension. Conversely, the peripheral negative anomalies (−744 nT) reflect weakly magnetic sedimentary sequences (Lower/Upper Nubian Sandstones) and meta-sedimentary units, consistent with basin development during post-orogenic collapse or extensional regimes. The dominant NW-SE, N-S, and NNE-SSW structural trends (Figure 6 and Figure 16) mirror the orientations of major faults and lineaments, suggesting reactivationeof Proterozoic crustal weaknesses during Phanerozoic tectonic events. These trends control the distribution of mineralization, with elevated lineament densities (Figure 16c) correlating with fracture zones hosting quartz veins and alteration halos. The alignment of magnetic contacts (Euler solutions: 0.081–1.5 km depth) with surface lineaments underscores the role of inherited structures in localizing hydrothermal fluids, particularly at intersections of NW-SE and NE-SW trends. Depth-resolved magnetic analysis (RAPS: 0.4 km shallow, 1.6 km deep sources) highlights a two-tiered crustal architecture. The shallow sources (0.4 km) correlate with near-surface lithological contrasts (e.g., metavolcanic-sedimentary contacts). Deep sources (1.6 km) delineate the root of the central granitic batholith, suggesting prolonged magmatic underplating during ANS consolidation.
Remote sensing techniques (ASTER band ratios, PRISMA SMACC) enhanced lithological discrimination, distinguishing Dokhan volcanics (andesites, rhyolites) from granitic suites and sedimentary units (Figure 13, Figure 14 and Figure 15). Field validation confirmed the accuracy of these mappings, with alkali feldspar granites (Figure 18) and Natash volcanics (Figure 19c) exhibiting spectral and magnetic signatures consistent with their petrogenesis.
The combined analysis of magnetic and remote sensing data reveals a consistent structural framework dominated by NW-SE, N-S, and NNE-SSW trends. Euler deconvolution contacts (Figure 6a) align closely with lineaments extracted from Landsat and PRISMA data (Figure 10a and Figure 16a), particularly along zones of contrasting magnetic anomalies (e.g., positive anomalies correlating with uplifted basement blocks in Figure 3b). For instance, the NW-trending unconformity between basement and Phanerozoic rocks (Figure 7b) coincides with a cluster of step faults identified in the RTP lineament map (Figure 6b). Similarly, the NE-SW-trending wadis (Figure 9b) intersect magnetic contacts at depths of 0.081–1.5 km (Figure 6a), suggesting the reactivation of deeper structures. The rose diagrams (Figure 6c and Figure 16b) further confirm overlapping directional trends, with NW-SE lineaments corresponding to mineralized fracture zones (Figure 16c). This integration underscores the control of inherited tectonic features on both near-surface lithological distributions and deeper crustal architecture.

6. Conclusions

This research mapped the lithology and structures of the study district by integrating remote sensing data (ASTER, Landsat 9, and PRISMA hyperspectral) with aeromagnetic data. Leveraging a multidisciplinary approach, this research demonstrates the enhanced geological interpretations achievable through multi-source data integration. Applying various digital image processing techniques to the remote sensing data, including FCC, CRC, PCA, ICA, and SMACC, enabled the accurate delineation of major geological formations and high-contrast boundaries between rock units. This analysis revealed that the study district is covered by basement and sedimentary rocks. The basement rocks are represented by metagabbro–diorite complex, granitic rocks, and metasediments. Volcanic rocks are represented by metavolcanics (metabasalts) and Dokhan volcanics (rhyolites and andesites). Phanerozoic rocks are represented by the Lower Nubian sandstones, Natash volcanics, and Upper Nubian sandstones.
Furthermore, both qualitative and quantitative analysis of the magnetic data, combined with the remote sensing data, effectively identified major structural trends, the unconformity separating basement and Phanerozoic rocks, and the structural control of drainage patterns.
The calculated power spectrum was used to divide the magnetic anomaly into regional and residual magnetic sources. The average depth of shallow and deep magnetic sources is about 0.4 km and 1.6 km, respectively. The analysis of tilt derivatives and Euler deconvolution techniques shows that NNW-SSE-, N-S-, NNE-SSW-, and E-W-trending contacts and faults are considered the main trends affecting the distributions of minerals in the study district.
The automatic lineaments from the ASTER image, textural analysis applied to Landsat 9, and the magnetic results (tilt and Euler derivatives, deconvolution techniques) confirm that the trends of the faults in the study district are NW-SE, NNE-SSW, and N-S. The current study focuses on identifying intricate geological formations and notable mineralization through structural lineaments using the application of remote sensing and aeromagnetic techniques to determine the placement and accumulation of mineral resources. These detailed lithological and structural maps provide valuable insights into the geological framework of the area and have significant implications for future mineral exploration.

Author Contributions

Conceptualization, H.M.E.-D., A.M.A.-R., W.H.M. and W.F.; methodology, A.M.A.-R., A.M.E.-S. and W.F.; software, W.H.M., A.M.A.-R. and H.E.-A.; validation, A.M.A.-R. and A.S.; formal analysis, M.M.E.-R., H.I.M. and W.F.; investigation, F.A. and A.M.A.-R.; resources, H.M.E.-D., S.A., W.F. and H.E.-A.; data curation, A.M.A.-R. and W.H.M.; writing—original draft preparation, A.M.A.-R., H.E.-A. and W.H.M.; writing—review and editing, W.F., A.S. and H.I.M.; visualization, H.I.M. and A.M.A.-R.; supervision, M.M.E.-R., F.A., A.M.E.-S. and H.M.E.-D.; project administration, A.M.A.-R. and H.E.-A. All authors have read and agreed to the published version of the manuscript.

Funding

This research was funded by Abdullah Alrushaid Chair for Earth Science Remote Sensing Research at King Saud University, Riyadh, Saudi Arabia.

Data Availability Statement

The datasets used and analyzed during the current study are available from the corresponding author on reasonable request.

Acknowledgments

The authors extend their appreciation to Abdullah Alrushaid Chair for Earth Science Remote Sensing Research for funding.

Conflicts of Interest

The authors declare no conflicts of interest.

References

  1. Patchett, P.J.; Chase, C.G. Role of transform continental margins in major crustal growth episodes. Geology 2002, 30, 39–42. [Google Scholar] [CrossRef]
  2. Stern, R.J.; Johnson, P.R.; Kröner, A.; Yibas, B. Neoproterozoic ophiolites of the Arabian-Nubian Shield. In Precambrian Ophiolites and Related Rocks; Kusky, T.M., Ed.; Developments in Precambrian Geology; Elsevier: Amsterdam, The Netherlands, 2004; Volume 13, pp. 95–128. [Google Scholar]
  3. Nance, R.D.; Murphy, J.B.; Santosh, M. The supercontinent cycle: A retrospective essay. Gondwana Res. 2014, 25, 4–29. [Google Scholar] [CrossRef]
  4. Li, Z.X.; Bogdanova, S.V.; Collins, A.S.; Davidson, A.; De Waele, B.; Ernst, R.E.; Fitzsimons, I.C.W.; Fuck, R.A.; Gladkochub, D.P.; Jacobs, J. Assembly configuration and break-up history of Rodinia: A synthesis. Precambrian Res. 2008, 160, 179–210. [Google Scholar] [CrossRef]
  5. Collins, A.S.; Pisarevsky, S.A. Amalgamating eastern Gondwana: The evolution of the Circum-Indian Orogens. Earth-Sci. Rev. 2005, 71, 229–270. [Google Scholar]
  6. Bentor, Y.K. The crustal evolution of the Arabo-Nubian massif with special reference to the Sinai Peninsula. Precambrian Res. 1985, 28, 1–74. [Google Scholar] [CrossRef]
  7. Abdelsalam, M.G.; Liégeois, J.P.; Stern, R.J. The Saharan Metacraton. J. Afr. Earth Sci. 2002, 34, 119–136. [Google Scholar] [CrossRef]
  8. Johnson, P.R.; Woldhaimanot, B. Development of the Arabian-Nubian Shield: Perspectives on accretion and deformation in the northern East African Orogen and the assembly of Gondwana. In Proterozoic East Gondwana: Supercontinent Assembly and Breakup; Yoshida, M., Dasgupta, S., Windley, B., Eds.; Special Pub. 206; Geological Society of London: London, UK, 2003; pp. 289–325. [Google Scholar]
  9. Eldosouky, A.M.; Pham, L.T.; Duong, V.H.; Kemgang Ghomsi, F.E.; Henaish, A. Structural interpretation of potential field data using the enhancement techniques: A case study. Geocarto Int. 2022, 37, 16900–16925. [Google Scholar] [CrossRef]
  10. Kharbish, S.; Eldosouky, A.M.; Amer, O. Integrating mineralogy, geochemistry and aeromagnetic data for detecting Fe–Ti ore deposits bearing layered mafic intrusion, Akab El-Negum, Eastern Desert. Egypt. Sci. Rep. 2022, 12, 15474. [Google Scholar] [CrossRef]
  11. Mahdi, A.M.; Eldosouky, A.M.; El Khateeb, S.O.; Youssef, A.M.; Saad, A.A. Integration of remote sensing and geophysical data for the extraction of hydrothermal alteration zones and lineaments; Gabal Shilman basement area, Southeastern Desert, Egypt. J. Afr. Earth Sci. 2022, 194, 104640. [Google Scholar] [CrossRef]
  12. Stern, R.J. Crustal evolution in the East African Orogen: A neodymium isotopic perspective. J. Afr. Earth Sci. 2002, 34, 109–117. [Google Scholar] [CrossRef]
  13. de Wit, M.J.; Chewaka, S. Plate tectonic evolution of Ethiopia and the origin of its mineral deposits: An overview. In Plate Tectonics and Metallogenesis: Some Guidelines to Ethiopian Mineral Deposits; Ethiopian Institute of Geological Survey: Abbis Ababa, Ethiopia, 1981; pp. 115–129. [Google Scholar]
  14. Fowler, A.; Hassen, I.; Hassan, M. Tectonic evolution and setting of the Sa’al Complex, southern Sinai, Egypt: A Proterozoic continental back-arc rift model. J. Afr. Earth Sci. 2015, 104, 103–131. [Google Scholar] [CrossRef]
  15. Rice, A.N.; Greiling, R.O.; Dardir, A.A.; Rashwan, A.; Sadek, M.F. Pan-African extensional structures in the area south of the Hafafit Antiform, Eastern Desert of Egypt. In Proceedings of the Kolloquium/Afrikagruppe Deutscher Geowissenschaftler, Heidelberg, Germany, 29 June 1990; Volume 1991, pp. 2641–2651. Available online: https://pascal-francis.inist.fr/vibad/index.php?action=getRecordDetail&idt=6368926 (accessed on 22 April 2025).
  16. Soliman, N.; El-Desoky, H.; Mohamed El Rahmany, M.; Maira, H.; Fahmy, W. ASTER Data and mineral studies for mapping the alteration zones at Wadi Sibrit-Wadi Urf Abu Hamam area, South Eastern Desert, Egypt. Middle East J. Appl. Sci. 2021, 11, 481–521. [Google Scholar]
  17. Fritz, H.; Abdelsalam, M.; Ali, K.A.; Bingen, B.; Collins, A.S.; Fowler, A.R.; Ghebreab, W.; Hauzenberger, C.A.; Johnson, P.R.; Kusky, T.M.; et al. Orogen styles in the East African Orogen: A review of the Neoproterozoic to Cambrian tectonic evolution. J. Afr. Earth Sci. 2013, 86, 65–106. [Google Scholar] [CrossRef] [PubMed]
  18. Johnson, P.R.; Andresen, A.; Collins, A.S.; Fowler, A.R.; Fritz, H.; Ghebreab, W.; Kusky, T.; Stern, R.J. Late Cryogenian–Ediacaran history of the Arabian–Nubian Shield: A review of depositional, plutonic, structural, and tectonic events in the closing stages of the northern East African Orogen. J. Afr. Earth Sci. 2011, 61, 167–232. [Google Scholar] [CrossRef]
  19. Hamimi, Z.; Fowler, A.R.; Liégeois, J.P.; Collins, A.; Abdelsalam, M.G.; Abd El-Wahed, M. (Eds.) The Geology of the Egyptian Nubian Shield; Regional Geology Rviews; Springer Nature: Cham, Switzerland, 2021. [Google Scholar] [CrossRef]
  20. Stern, R.J.; Johnson, P. Continental lithosphere of the Arabian Plate: A geologic, petrologic, and geophysical synthesis. Earth-Sci. Rev. 2010, 101, 29–67. [Google Scholar] [CrossRef]
  21. Lasheen, E.S.R.; Mohamed, W.H.; Ene, A.; Awad, H.A.; Azer, M.K. Implementation of petrographical and aeromagnetic data to determine depth and structural trend of Homrit Waggat Area, Central Eastern Desert, Egypt. Appl. Sci. 2022, 12, 8782. [Google Scholar] [CrossRef]
  22. Hassaan, M.M.; El-Sawy, K.E. Tectonic environments and distribution of gold deposits in the Pan African Nubian Shield, Egypt. Aust. J. Basic Appl. Sci. 2009, 3, 797–809. [Google Scholar]
  23. Zoheir, B.A. Characteristics and genesis of shear zone-related gold mineralization in Egypt: A case study from the Um El Tuyor mine, south Eastern Desert. Ore Geol. Rev. 2008, 34, 445–470. [Google Scholar] [CrossRef]
  24. Zoheir, B.A. Transpressional zones in ophiolitic mélange terranes: Potential exploration targets for gold in the South Eastern Desert, Egypt. J. Geochem. Explor. 2011, 111, 23–38. [Google Scholar] [CrossRef]
  25. Zoheir, B.A.; Lehmann, B. Listvenite–lode association at the Barramiya gold mine, Eastern Desert, Egypt. Ore Geol. Rev. 2011, 39, 101–115. [Google Scholar] [CrossRef]
  26. Abd El-Wahed, M.A. Oppositely dipping thrusts and transpressional imbricate zone in the Central Eastern Desert of Egypt. J. Afr. Earth Sci. 2014, 100, 42–59. [Google Scholar] [CrossRef]
  27. Basta, F.F.; Maurice, A.E.; Bakhit, B.R.; Ali, K.A.; Manton, W.I. Neoproterozoic contaminated MORB of Wadi Ghadir ophiolite, NE Africa: Geochemical and Nd and Sr isotopic constraints. J. Afr. Earth Sci. 2011, 59, 227–242. [Google Scholar] [CrossRef]
  28. Volesky, J.C.; Leybourne, M.I.; Stern, R.J.; Peter, J.M.; Layton-Matthews, D.; Rice, S.; Johnson, P.R. Metavolcanic host rocks, mineralization, and gossans of the Shaib al Tair and Rabathan volcanogenic massive sulphide deposits of the Wadi Bidah Mineral District, Saudi Arabi. Int. Geol. Rev. 2017, 59, 1975–2002. [Google Scholar] [CrossRef]
  29. Ahmed, A.H.; Gharib, M. Porphyry Cu mineralization in the eastern desert of Egypt: Inference from geochemistry, alteration zones, and ore mineralogy. Arab. J. Geosci. 2016, 9, 179. [Google Scholar] [CrossRef]
  30. Affleck, J. Magnetic anomaly trend and spacing patterns. Geophysics 1963, 28, 379–395. [Google Scholar] [CrossRef]
  31. Conoco. Egyptian General Petroleum Corporation—Conoco Coral Geological Map of Egypt, Scale 1:500,000; Conoco: Cairo, Egypt, 1987. [Google Scholar]
  32. Sabet, A.H. Geological Map of Bur Umm Qubur Sheet Eastern Desert; Internal Report; Geological Survey of Egypt: Cairo, Egypt, 1973; Volume 89. [Google Scholar]
  33. Aero-Service. Final Operational Report of Airborne Magnetic/Radiation Survey in the Eastern Desert, Egypt, Conducted for the Egyptian General Petroleum Corporation, Aero-Service Division; Western Geophysical Co.: Houston, TX, USA, 1984. [Google Scholar]
  34. Montaj, O. Geosoft Mapping and Prcessing System; Geosoft Inc.: Toronto, ON, Canada, 2007. [Google Scholar]
  35. Sharma, P.V. Geophysical Methods in Geology; Elsevier: Amsterdam, The Netherlands, 1985. [Google Scholar]
  36. Spector, A. Application of Aeromagnetic Data for Porphyry Copper Exploration in Area of Volcanic Cove. In Proceedings of the 45th Annual International Meeting of the SEG, Denver, CO, USA, 12–16 October 1975. [Google Scholar]
  37. Spector, A.; Grant, F.S. Statistical models for interpreting aeromagnetic Data. Geophysics 1970, 35, 293–302. [Google Scholar] [CrossRef]
  38. Reford, M.S.; Sumner, J.S. Aeromagnetics. Geophysics 1964, 29, 482–516. [Google Scholar] [CrossRef]
  39. Miller, H.G.; Singh, V. Potential field tilt—A new concept for location of potential field sources. J. Appl. Geophys. 1994, 32, 213–217. [Google Scholar] [CrossRef]
  40. Oruç, B.; Keskinsezer, A. Structural setting of the northeastern Biga Peninsula (Turkey) from tilt derivatives of gravity gradient tensors and magnitude of horizontal gravity components. Pure Appl. Geophys. 2008, 165, 1913–1927. [Google Scholar] [CrossRef]
  41. Jeng, Y.; Lee, Y.L.; Chen, C.Y.; Lin, M.J. Integrated signal enhancements in magnetic investigation in archaeology. J. Appl. Geophys. 2003, 53, 31–48. [Google Scholar] [CrossRef]
  42. Reid, A.B.; Allsop, J.M.; Granser, H.; Millett, A.T.; Somerton, I.W. Magnetic interpretation in three dimensions using Euler deconvolution. Geophysics 1990, 55, 80–91. [Google Scholar] [CrossRef]
  43. Abrams, M.J.; Brown, D.; Lepley, L.; Sadowski, R. Remote sensing for porphyry copper deposits in southern Arizona. Econ. Geol. 1983, 78, 591–604. [Google Scholar] [CrossRef]
  44. Sultan, M.; Arvidson, R.E.; Sturchio, N.C. Mapping of serpentinites in the Eastern Desert of Egypt by using Landsat thematic mapper data. Geology 1986, 14, 995–999. [Google Scholar] [CrossRef]
  45. Sabins, F.F. Remote sensing for mineral exploration. Ore Geol. Rev. 1999, 14, 157–183. [Google Scholar] [CrossRef]
  46. Gad, S.; Kusky, T. Lithological mapping in the Eastern Desert of Egypt, the Barramiya area, using Landsat thematic mapper (TM). J. Afr. Earth Sci. 2006, 44, 196–202. [Google Scholar] [CrossRef]
  47. El-Desoky, H.M.; Tende, A.W.; Abdel-Rahman, A.M.; Ene, A.; Awad, H.A.; Fahmy, W.; El-Awny, H.; Zakaly, H.M.H. Hydrothermal Alteration Mapping Using Landsat 8 and ASTER Data and Geochemical Characteristics of Precambrian Rocks in the Egyptian Shield: A Case Study from Abu Ghalaga, Southeastern Desert, Egypt. Remote Sens. 2022, 14, 3456. [Google Scholar] [CrossRef]
  48. Gad, S.; Kusky, T. ASTER spectral ratioing for lithological mapping in the Arabian–Nubian shield, the Neoproterozoic Wadi Kid area, Sinai, Egypt. Gondwana Res. 2007, 11, 326–335. [Google Scholar] [CrossRef]
  49. Amer, R.; Kusky, T.; Ghulam, A. Lithological mapping in the Central Eastern Desert of Egypt using ASTER data. J. Afr. Earth Sci. 2010, 56, 75–82. [Google Scholar] [CrossRef]
  50. Abdeen, M.M.; Allison, T.K.; Abdelsalam, M.G.; Stern, R.J. Application of ASTER band-ratio images for geological mapping in arid regions; the Neoproterozoic Allaqi Suture, Egypt. Abstr. Program Geol. Soc. Am. 2001, 3, 289. [Google Scholar]
  51. Gabr, S.S.; Hassan, S.M.; Sadek, M.F. Prospecting for new gold-bearing alteration zones at El-Hoteib area, South Eastern Desert, Egypt, using remote sensing data analysis. Ore Geol. Rev. 2015, 71, 1–13. [Google Scholar] [CrossRef]
  52. Abrams, M.; Hook, S. ASTER Users Handbook (Version 2); Jet Propulsion Laboratory: Pasadena, CA, USA, 1983. Available online: https://lpdaac.usgs.gov/documents/262/ASTER_User_Handbook_v2.pdf (accessed on 22 April 2025).
  53. Aggarwal, A.; Garg, R.D. Systematic approach towards extracting endmember spectra from hyperspectral image using PPI and SMACC and its evaluation using spectral library. Appl. Geomat. 2015, 7, 37–48. [Google Scholar] [CrossRef]
  54. Devi, M.V.; Kalaivani, S. Endmember estimation using fuzzy grade of membership and spectral matching. IEEE Access 2023, 11, 95315–95333. [Google Scholar] [CrossRef]
  55. Shebl, A.; Abdellatif, M.; Abriha, D.; Dawoud, M.; Ali, M.A.H.; Mahmoud, A.S.; Kristály, F.; Csámer, Á. EnMap hyperspectral data in geological investigations: Evaluation for lithological and hydrothermal alteration mapping in Neoproterozoic rocks. Gondwana Res. 2025, 143, 91–124. [Google Scholar] [CrossRef]
  56. O’leary, D.W.; Friedman, J.D.; Pohn, H.A. Lineament, linear, lineation: Some proposed new standards for old terms. Geol. Soc. Am. Bull. 1976, 87, 1463–1469. [Google Scholar] [CrossRef]
  57. Hung, L.Q.; Batelaan, O.; Smedt, F. Lineament extraction and analysis, comparison of LANDSAT ETM and ASTER imagery. Case study: Suoimuoi tropical karst catchment, Vietnam. In Remote Sensing for Environmental Monitoring, GIS Applications, and Geology V; SPIE: Bellingham, WA, USA, 2005; Volume 5983. [Google Scholar] [CrossRef]
  58. Gass, I.G. Upper Proterozoic (Pan-African) Calc-Alkaline Magmatism in North-Eastern Africa and Arabia; Thorpe, R.S., Ed.; John Wiley and Sons: New York, NY, USA, 1982. [Google Scholar]
  59. Kroner, A.; Krüger, J.; Rashwan, A.E.A.A. Age and tectonic setting of granitoid gneisses in the Eastern Desert of Egypt and south-west Sinai. Int. J. Earth Sci. 1994, 83, 502–513. [Google Scholar] [CrossRef]
  60. Abdelsalamand, M.G.; Stern, R.J. Sutures and shear zones in the Arabian-Nubian Shield. J. Afr. Earth Sci. 1996, 23, 289–310. [Google Scholar] [CrossRef]
Figure 1. (a) Geological map of the southern part of the Southern Eastern Desert of Egypt showing the Neoproterozoic basement rocks (modified after [31]). (b) Geological map of the study district (modified after [32]).
Minerals 15 00657 g001
Figure 2. Digital elevation model (DEM) points of Wadi Sibrit–Wadi Urf Abu Hamam district.
Minerals 15 00657 g002
Figure 3. (a) Total intensity magnetic map of the study district. (b) The reduced-to-the-Northern magnetic pole (RTP) map of the study district. The Helmert 1906/Egypt Red Belt refers to a geodetic datum and coordinate system used in Egypt, based on the Helmert 1906 ellipsoid. Specifically, the “Red Belt” designation refers to a particular zone or area within Egypt, originally surveyed using second and third-order triangulations for cadastral applications.
Minerals 15 00657 g003
Figure 4. (a) Radially averaged power spectrum and depth estimate of the RTP magnetic map of study district. (b) Low-pass (regional) filtered (frequency = 0.2–2.3 cycles/grid unit) of residual magnetic map of the study district.
Minerals 15 00657 g004
Figure 5. (a) High-pass (residual) filtered (frequency = 0.2–2.3 cycles/grid unit) of residual magnetic map of the study district. (b) Tilt derivative map of RTP magnetic data displaying the zero contour line of the study district.
Minerals 15 00657 g005
Figure 6. (a) Contacts with depths ranging from 0.081 km to 1.5 km were identified using the Euler deconvolution. (b) Automatically extracted lineaments. (c) Directional analysis (rose diagram) of the lineament frequencies and lineament lengths of Wadi Sibrit and Urf Abu Hamam district, South Eastern Desert, Egypt.
Minerals 15 00657 g006
Figure 7. Pseudocolor ramps of Landsat 9: (a) PC1 effectively differentiating rock units (pale brown) from wadi deposits (blue), and (b) MNF1 highlighting the NW-trending Natash volcanics and the unconformity surface between the basement (brown) and Phanerozoic rocks (blue).
Minerals 15 00657 g007
Figure 8. Pseudocolor maps of (a) MNF2, primarily highlighting andesitic rocks in red, and (b) distinguishing quartz diorite and tonalites with sharp contact from other lithologies.
Minerals 15 00657 g008
Figure 9. Pseudocolor ramps of (a) MNF3 and (b) PC4, highlighting the main structural discontinuities within the studied terrain, manifested through a highly controlled drainage network.
Minerals 15 00657 g009
Figure 10. Pseudocolor map of PRISMA data: (a) MNF18 highlighting rock bodies trending NW-SE and NE-SW, particularly in the northern part, where they exhibit a cross-cutting relationship; (b) IC5 revealing an E-W trend in the northern region and accurately delineating alkali granite in gray.
Minerals 15 00657 g010
Figure 11. SMACC results: (a) endmember 3 and (b) endmember 8, highlighting granitic rocks and their surroundings with distinct colors, primarily representing their weathered products.
Minerals 15 00657 g011
Figure 12. Pseudocolor map of the correlation component, clearly highlighting the structural elements within the study district.
Minerals 15 00657 g012
Figure 13. (a) ASTER FCC image 432 in (RGB). Abbreviations: (NV) Natash volcanic, (UNb) Upper Nubian sandstone, (LNb) Lower Nubian sandstone, (An) andesites, (HG) hornblende granite, (AFG) alkali feldspar granite, (AG) alkali granite, (W) wadi deposits, (Rh) rhyolite, (QDi) quartz diorites, (MG) metagabbros, (MV) metavolcanics. (AMs). (b) ASTER FCC image 731 in RGB.
Minerals 15 00657 g013
Figure 14. (a) ASTER band ratio (4/7, 3/4, and 2/1 in RGB) (modified after [46]). (b) ASTER band ratio (6/8, 4/5, and 2/4 in RGB) (modified after [47]).
Minerals 15 00657 g014
Figure 15. (a) ASTER principal component analysis (PC-521 in RGB). (b) ASTER principal component analysis (PC-431 in RGB) in RGB.
Minerals 15 00657 g015
Figure 16. (a) Automatically extracted lineaments. (b) Directional analysis (rose diagram) of lineament frequencies and lineament lengths of Wadi Sibrit and Urf Abu Hamam district, South Eastern Desert, Egypt. (c) Lineament density of the studied area.
Minerals 15 00657 g016
Figure 17. Validation of the hand specimens of the proposed approach at the present study using Aster PCA band ratio image (5-7, 5-1, 4): (a) Metavolcanics represented by metabasalts (MV); (b) metagabbro (MG); (c) hornblende granite (HG); (d) quartz diorite (QDi); (e) Dokhan volcanics represented by andesite (An); (f) Laterite Upper Nubian sandstone (LNb); (g) Natash volcanics (NV); (h,i) Lower Nubian sandstone (LNb); (j) alkali feldspar granite (AFG); (k) alkali granite.
Minerals 15 00657 g017
Figure 18. (a) Photographs showing altered and sheared metabasalts at Wadi Sibrit–Urf Abu Hamam district, looking SW. (b) Plagioclase (Pl) laths associated with quartz (Qtz), (C.N.). (c) Intensely jointed and fractured metagabbros at Wadi Sibrit–Urf Abu Hamam district, looking NE. (d) Plagioclase (Pl) and pyroxene (Pyx) crystals showing subophitic texture (C.N.). (e) Fractured quartz diorite in Urf Abu Hamam district. (f) Zoned plagioclase (Qtz) partially altered in the core (C.N.). (g) Highly fractured Dokhan volcanics (rhyolite) at the studied district, looking NW. (h) Orthoclase crystal partially altered to sericite and clay minerals (C.N.). (i) Acidic dyke extruded within Dokhan (An) volcanics at the studied district, looking W. (j) Phenocryst of plagioclase (Pl) altered to sericite set in fine-grained groundmass of quartz (Qtz) and epidote with secondary quartz (C.N.). (k) Highly jointed hornblende granites at Wadi Sibrit district. (l) Corrosion of plagioclase (Pl) in hornblende crystal (Hbl), (C.N.) (m) Highly sheared alkali granite at Wadi Sibrit district, looking S. (n) Euhedral crystal of altered plagioclase with graphic texture (C.N.). (o) Highly weathered low masses of alkali feldspar granites, Wadi Urf Abu Hamam district, looking NW. (p) Plagioclase (Pl) and quartz (Qtz) showing graphic texture (C.N.).
Minerals 15 00657 g018
Figure 19. Photographs showing (a) Lower Nubian sandstones covered by Natash volcanics, Wadi Sibrit district, looking W. (b) Lithic fragments embedded in a ferruginated matrix (C.N.). (c) Stratified of Natash volcanics at Wadi Sibrit district, looking W. (d) Quartz (Qtz) crystals filling interspatial spaces between plagioclase crystals (C.N.). (e) Plagioclase phenocrysts and fine laths showing oriented direction (C.N.). (f) Conglomerates between Upper Nubia and Natash volcanics at Wadi Sibrit district, looking W.
Minerals 15 00657 g019
Disclaimer/Publisher’s Note: The statements, opinions and data contained in all publications are solely those of the individual author(s) and contributor(s) and not of MDPI and/or the editor(s). MDPI and/or the editor(s) disclaim responsibility for any injury to people or property resulting from any ideas, methods, instructions or products referred to in the content.

