1. Introduction
In view of the increasing importance of new techniques in geoscientific research, remote sensing has become one of the most important elements of modern research. The variety and scope of satellite sensors, with their different spectral and spatial capabilities, play an unparalleled role in the advancement of geological studies. In mineral exploration, this technology has recently attracted much attention for tectonic structures and hydrothermal alteration zones as primary targets for exploration. Significant progress has been made in the field of spectral analysis of minerals and altered rocks.
Studies show that mafic rocks, especially basalts, exhibit a weak spectral pattern with ambiguous absorption characteristics. These spectral features are often associated with the presence of dark-colored ferromagnesian minerals such as pyroxene and olivine, which exhibit absorption features typically around 1000 and 2000 nm, but with relatively low intensity due to their compositional nature and texture [
1]. Meanwhile, acidic rocks show different and specific absorption patterns depending on the type of alteration products. Acidic rocks such as granite and rhyolite display stronger and more distinct absorption patterns, particularly near 1400, 1900, and 2200 nm, related to the presence of hydroxyl-bearing alteration minerals such as muscovite, kaolinite, and chlorite. According to Kumar et al. [
2], these differences are critical for discriminating lithologies using remote sensing data, as the spectral contrast between mafic and acidic rocks enhances lithological mapping accuracy.. Furthermore, Zhou and Wang [
3] demonstrated that fresh and weathered acidic rock surfaces exhibit spectral variation in the 2200–2500 nm region, useful for detecting hydrothermal alteration zones [
3]. These spectral differences enable the identification and separation of types of alteration in remote sensing studies [
4,
5,
6,
7,
8,
9].
However, despite the capabilities of remote sensing, accurate mapping of alteration zones in complex geologic environments is challenging due to spectral overlap, lithologic diversity, and the heterogeneity of surface cover. This creates a need for improved, anomaly-sensitive approaches. Copper and molybdenum are usually considered critical minerals and indispensable components of various high technologies and green energy production. Porphyry copper–molybdenum systems are an important source of copper and molybdenum. The porphyry systems typically consist of large volumes of hydrothermally altered rocks associated with porphyry copper intrusions. Recently, the mapping of hydrothermal alteration zones associated with porphyry copper systems using modern satellite remote sensing technology has become one of the most important tools for copper exploration [
10,
11,
12,
13].
Chen, et al. [
14] used ASTER and GF-5 satellite data, along with SPCA and MTMF techniques, to map hydrothermal alteration minerals in the Longtoushan Pb-Zn deposit, achieving high mapping accuracy. Shebl, et al. [
15] integrated ASTER, ALI, Landsat 8, and Sentinel-2 data with airborne geophysics to enhance alteration zone delineation in arid terrains. Osinowo, et al. [
16] processed Landsat 8 data using band ratios and PCA for hydrothermal alteration mapping in Chad. Hajaj, et al. [
17] employed HyMap airborne hyperspectral data and absorption depth methods to identify alteration minerals like Fe
2+/Fe
3+ and Al-OH. A study by Amraoui [
18] using ASTER (provided by NASA/METI, Washington, DC, USA/Tokyo, Japan) and Landsat 8 OLI (provided by the United States Geological Survey (USGS), Reston, VA, USA) satellite data aimed to identify hydrothermal alterations and mineralization-controlling structures in the Mogur area of Morocco, which showed the effective role of NE to E–W faults in the distribution of these alterations. Nouri, et al. [
19] applied image enhancement and classification methods on multispectral imagery for mapping alteration in Chahr Gonbad, Iran. Contreras Acosta [
20] extended their work by using high-resolution hyperspectral imaging to refine hydrothermal mapping techniques. Zamyad, et al. [
21] relied on ASTER data to identify hydrothermal alteration in Tirka, NE Iran, aiding mineral exploration. In order to identify hydrothermal alteration zones in Iran, several studies have been conducted using satellite data. In the Turoud–Chahshirin magmatic belt, ASTER data along with methods such as SPCA and MTMF have been used to identify alterations related to polymetallic mineralization [
22]. Finally, in the Neyshabur region, a combination of the FCC, BR, and SAM methods has been used to detect alteration zones related to turquoise mineralization [
23]. Additionally, in the Soltanieh region, using methods such as MNF and SAM, areas with high potential for Cu, Zn, and Pb mineralization have been identified and analyzed [
24].
Considering the strategic importance of porphyry copper systems and the need to conduct further studies, this study deals with the analysis and processing of ASTER sensor data with the aim of identifying hydrothermal alteration zones in the Zafarghand region. For this purpose, the statistical median absolute deviation (MAD) method and advanced discrete wavelet techniques are used to process ASTER satellite images. These methods are recognized as effective and efficient tools to identify hydrothermal alteration of porphyry copper systems with structural character. Several studies have been carried out in this field, and especially in combining remote sensing and wavelet methods, including the identification of alteration and evaluation of wavelet performance in the Darreh Zar and Sarcheshmeh exploration areas [
25]. In this paper, a new hybrid method for the detection and classification of hydrothermal alteration zones using ASTER images was introduced by combining the MAD anomaly detection technique with the discrete wavelet transform (DWT). This method attempts to increase the classification accuracy for phyllic and propylitic alterations by combining the strengths of both approaches. It is also expected to provide a repeatable workflow that is transferable to other porphyry systems.
Therefore, the main objective of this study is to develop and validate a robust and generalizable hybrid approach for mapping hydrothermal alteration zones in porphyry copper systems. By integrating the MAD algorithm with the DWT technique, this study introduces a new multiscale statistical framework that overcomes the key shortcomings of conventional remote sensing methods—namely, high false positives and poor anomaly discrimination in spectrally complex terrain. This is the first time that the MAD-DWT combination has been applied to ASTER SWIR data for hydrothermal mapping in a complex geological region such as Zafarghand. The results show that the classification accuracy is significantly improved and the method is suitable for application in similar mineral exploration environments worldwide.
2. Geological Setting of the Study Area
The presence of copper–molybdenum porphyry deposits in the Neotethys subduction zone and the extension of the Urmia–Dokhtar volcano-plutonic belt demonstrate the need to investigate and explore this type of deposit in Iran. The structural location of the region at the junction of the Central Iran Zone with the Urmia–Dokhtar magmatic belt has brought significant mineral potential in terms of the concentration of copper and other metal elements [
26]. The stratigraphy of the exploration area consists of dacitic sequences with porphyritic texture and andesitic and basaltic units, as well as local diorite outcrops and alluvial deposits. It is worth mentioning that the Zafarghand copper index, located in the middle section of the Urmia–Dokhtar belt in Isfahan province, was identified in 2006 by analyzing remote sensing data [
27]. The Zafarghand exploration area in the northeast of Isfahan is located in the central part of this magmatic arc (
Figure 1). This area has attracted the attention of numerous researchers in recent years. The results of these studies are briefly presented below [
28].
The initial exploration work in the study area included the creation of a geological map at a scale of 1:5000, the systematic extraction of rock samples, and the performance of geophysical investigations [
30]. Following the initial explorations, the Zafarghand exploration area was subjected to comprehensive scientific studies. Detailed geochemical and petrological studies [
30] were carried out on the volcanic rocks, volcanosedimentary rocks, nearby granitoid masses, and andesite-basalt intrusive dykes in the Eocene volcanic rocks. The petrological studies of Sadeghian and Ghaffary [
31] led to a deeper understanding of the petrogenesis of the granitoid masses of the region. The studies of Aminoroayaei Yamini, et al. [
32], which focused on mineralogical and geochemical evolution, led to a more detailed understanding of the hydrothermal alteration systems. The integration of geochemical and geophysical studies and the analysis of the fluids involved by Alaminia, et al. [
28] opened new horizons for the understanding of the mineralization system. Further studies by Aminoroayaei Yamini, et al. [
33], using plagioclase as an indicator, explained the evolutionary stages of the magmatic system. Mohammadi, et al. [
34] used remote sensing techniques to analyze the correlation of mineralization, alteration zones, and tectonic structures. In 2016, isotopic and mineral chemistry studies on the biotite chloritization process led to the reconstruction of the physicochemical parameters of the mineralization–alteration system [
32]. Petrographic, geochemical, and thermometric studies of alteration in synorogenic copper mineralization were carried out by Aminoroayaei Yamini, et al. [
35]. Isotopic and geochemical evidence for the role of mixing of young crust and magma in the Urmia–Dokhtar arc were evaluated, with particular emphasis on mafic microgranular enclaves and genetic granitoids in the magmatic complex of the region [
36]. In 2017, the application of the new method of abundance coefficients in the analysis of geochemical data was tested to identify deep and hidden deposits in this mineral area [
29]. While these studies have greatly improved our knowledge of the geology and alteration systems in the area, these studies have mostly used traditional classification techniques or remote sensing workflows. This highlights the need for better image processing techniques that can identify such spectral anomalies.
The Urmia–Dokhtar magmatic arc, which is also known as the Central Iran Volcanic-Plutonic Belt, hosts some of Iran’s most important porphyry copper deposits, including the famous Sarcheshmeh, Miduk, Dalli, Kahang, Zafarghand, and Zefreh deposits [
28]. The formation of intrusive masses and copper deposits in this belt occurred following the subduction process of the Neo-Tethys to the sub-central part of Iran in the middle of the Miocene period. From a lithological point of view, the rocks of this area are divided into two main categories: intrusive masses, which are mainly composed of diorite, granodiorite, and granitoid, and volcanic rocks, which include andesite, dacite, and pyroclastics [
28] (
Figure 1c).
The Zafarghand porphyry copper deposit, which is located in the western areas of Zafarghand village and within the 1:100,000 geological map of Ardestan, is a part of this magmatic belt. This deposit is located in the geographical range of longitudes 52°30′26″ to 52°52′23″ East and latitudes 30°10′33″ to 33°52′11″ North (
Figure 1b) [
28]. The Zafarghand copper exploration area is located in the southeast of Ardestan city, in the central part of Iran, and about 110 km northeast of Isfahan (
Figure 1b).
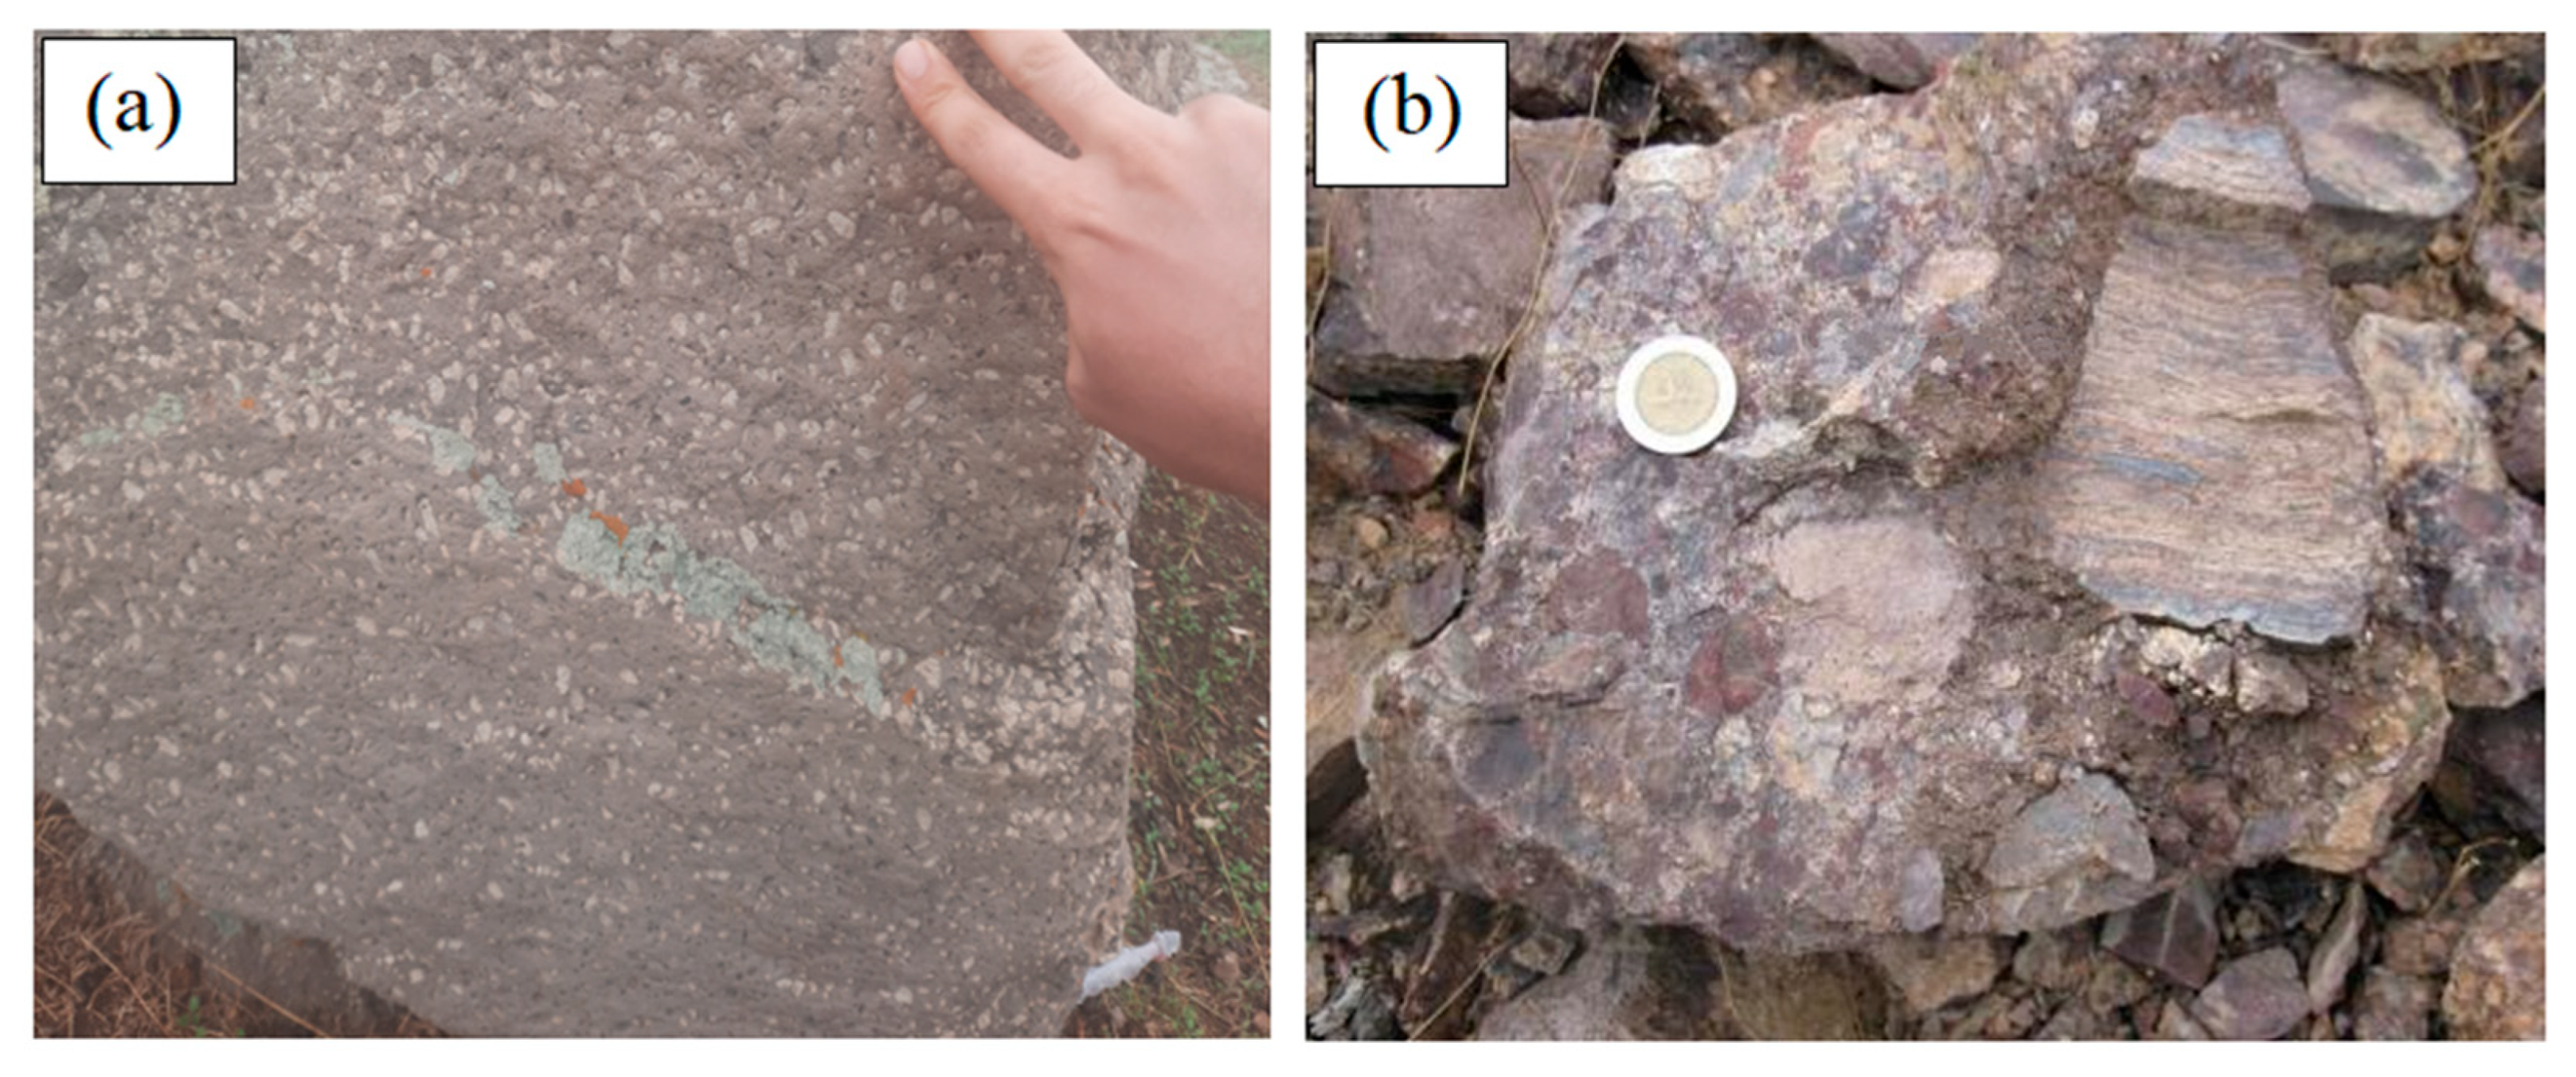
The rock framework covering the Zafarghand region consists of Eocene volcanic sequences, including basalt, andesite, latite, dacite, rhyolite, tuff, and ignimbrite (
Figure 2a,b) [
37]. The boundary between the intrusive masses and the volcanic rocks is generally distinct and unconformable. The volcanic rock outcrops are mainly pyroclastic materials. These materials include different types of tuff, tuff berecia, and ignimbrite rocks, after which andesitic and rhyodacite lavas have flowed (
Figure 2a,b) [
37]. Strong alteration is seen in dacite, rhyodacite units, and their accompanying dykes. These rocks have a microcrystalline background in which numerous quartz, feldspar, and amphibole crystals are scattered and display a porphyritic to fine-grained texture. In the examination of thin sections, it was found that quartz mineral is present as the main phase of the stone builder [
32].
Field studies and petrographic studies in the region indicate the existence of a series of acidic to intermediate igneous rocks that were formed from the late Eocene and include volcanic and intrusive facies [
28]. These rocks include pinkish-gray rhyolites with porphyry texture and flowing glass paste in the northwest of the region, dacites and rhyodacites with a gray to green color and porphyry texture in most parts of the region, which are the most important host rocks for copper mineralization, and dark gray andesites in the southwest regions and Bactrian with pitted features, including intrusive formations of diorite, quartz diorite, and microdiorite in the north-west and south-east parts which are dark gray in color, and a semi-permeable porphyry mass of quartz and diorite in the south-east of the region. These rock units indicate complex volcanic and intrusive activities in the region, which have significantly influenced copper mineralization processes (
Figure 1c) [
28]. Important new information on the volcanic and intrusive lithologies that support the porphyry copper system is revealed by field observations conducted in the Zafarghand region. The area is host to a varied suite of igneous rocks that were created over several intrusive events, according to thorough petrographic and structural investigations.
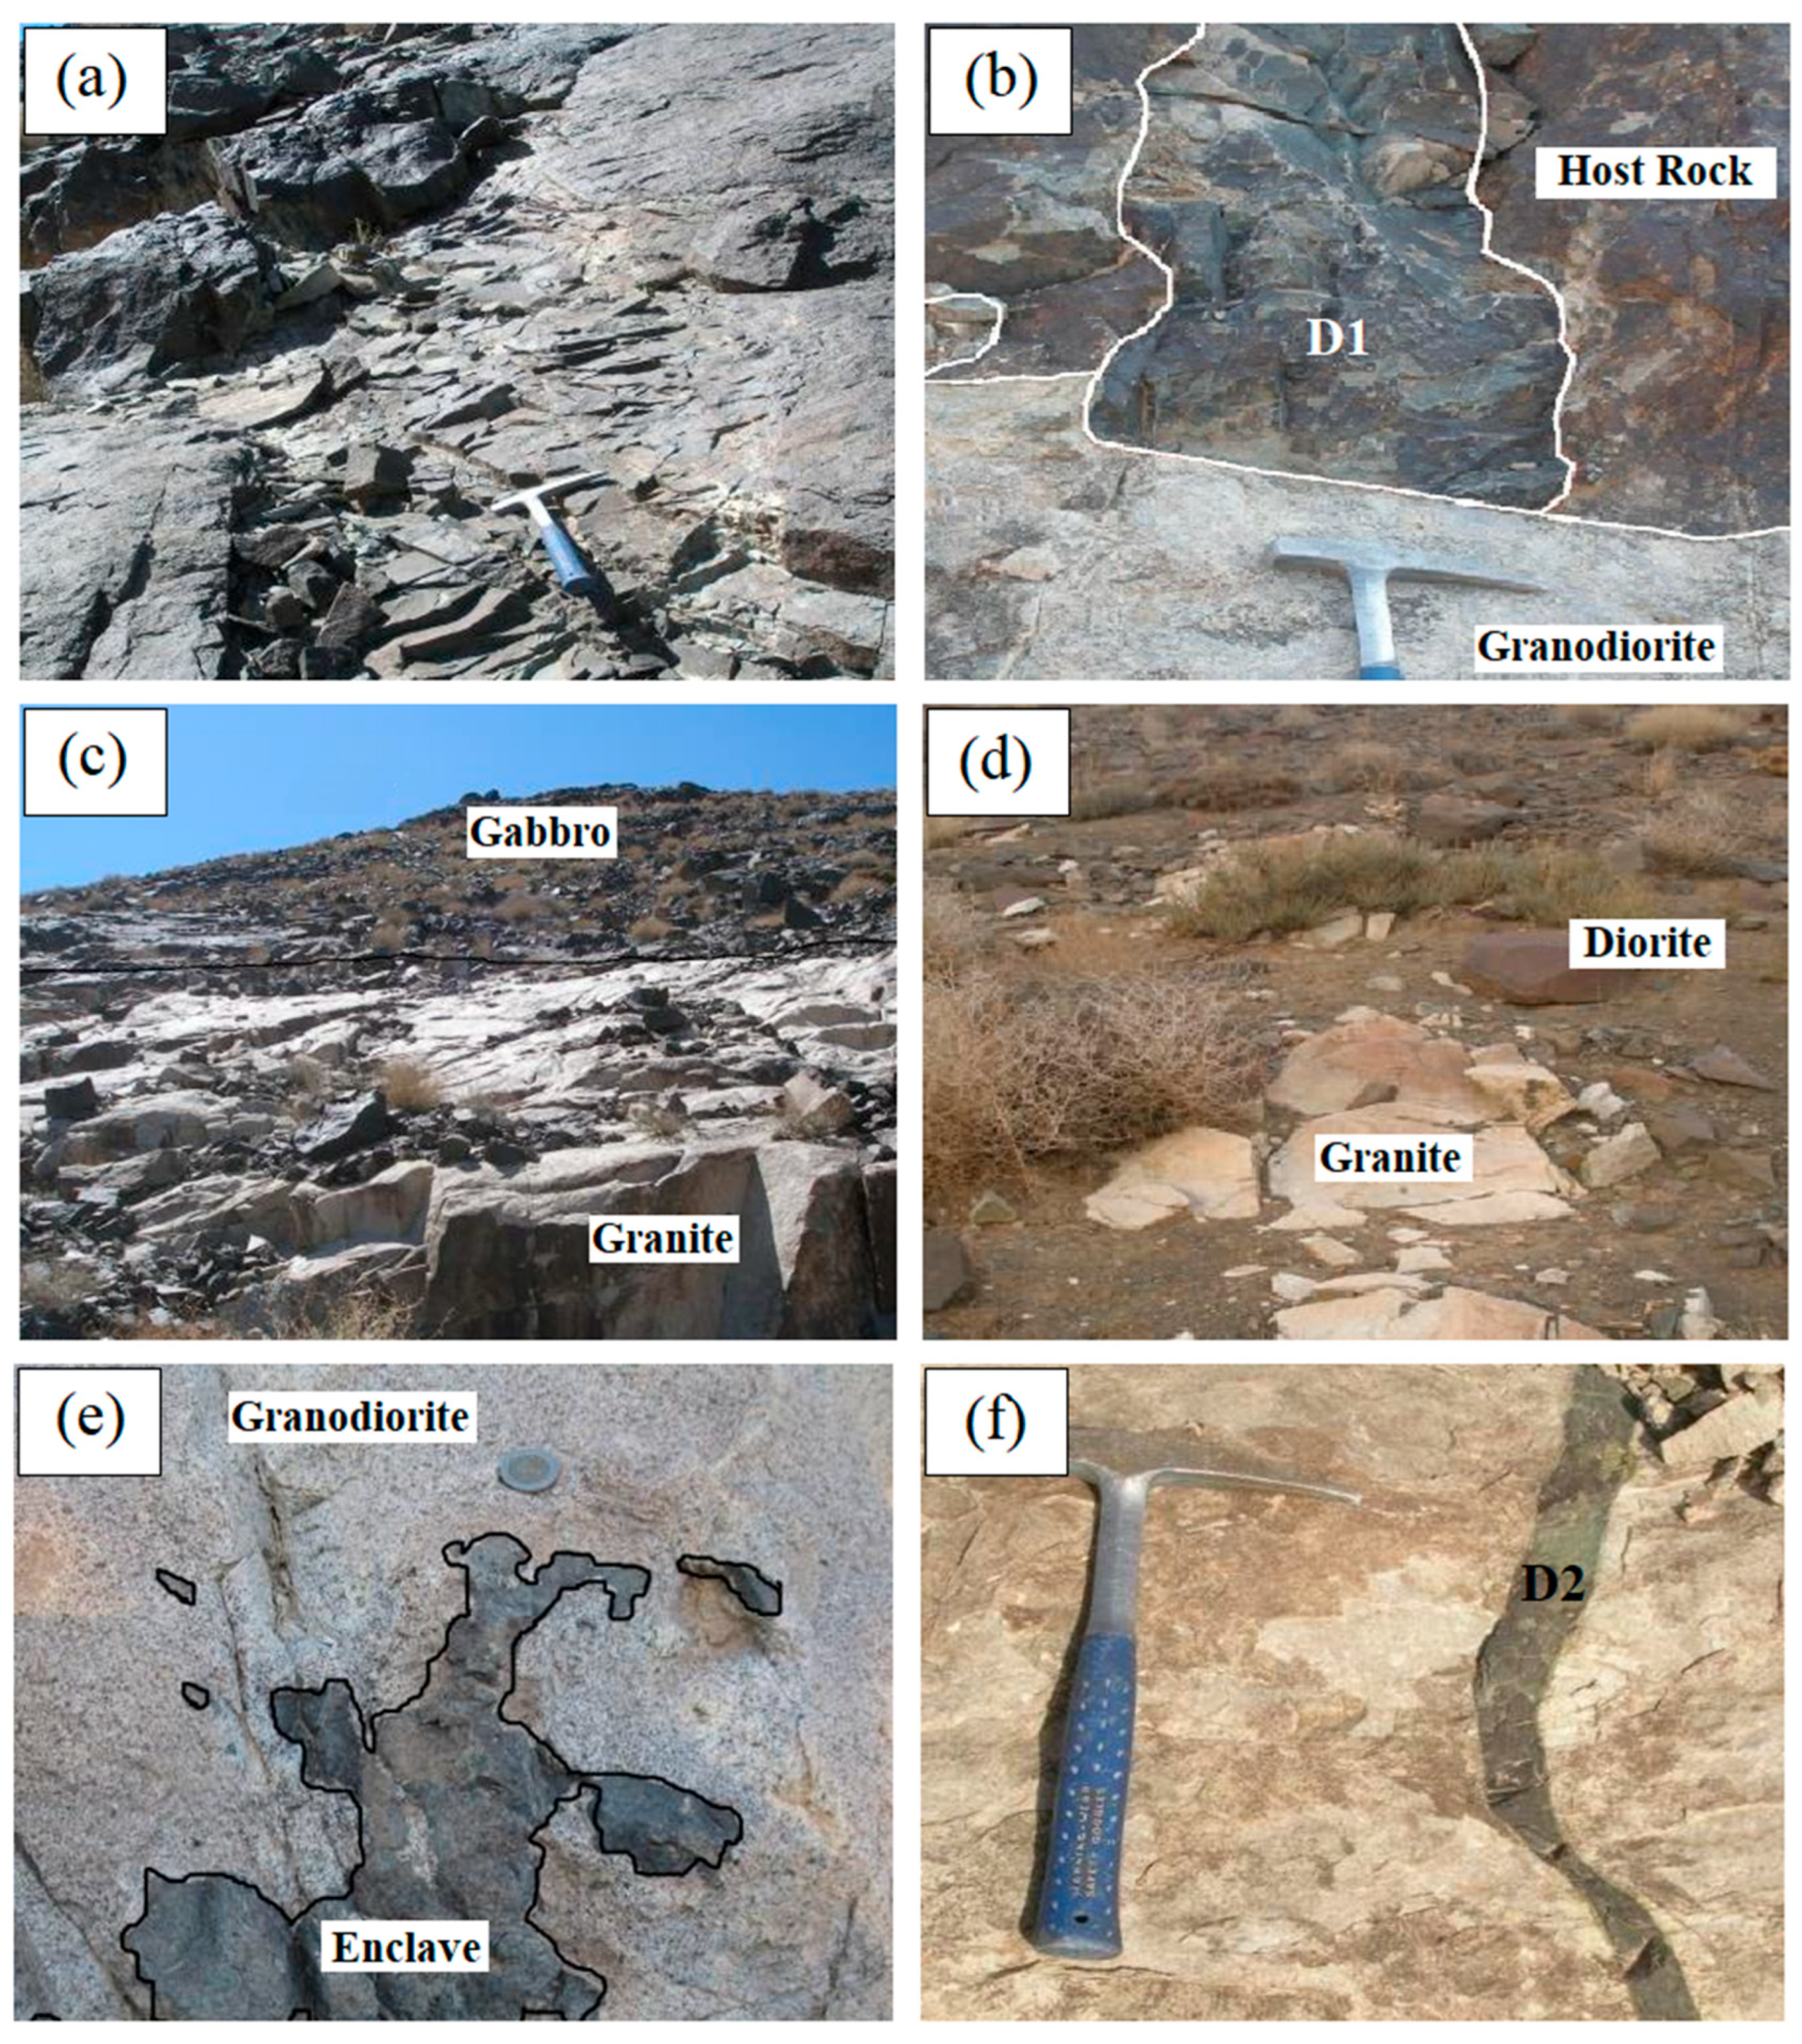
First-generation andesitic dykes, which sever volcanic-sedimentary host rocks, are the oldest units ever seen. Following these are gabbro and diorite–gabbro unit occurrences, which show early mafic intrusions. Diorite and quartz-diorite rocks, which are frequently found in fine-grained mafic microgranular enclaves (MMEs) that are suggestive of magmatic mingling and mixing processes, make up the following intrusive phase. More felsic compositions, such as granodiorite and granite bodies, indicate later stages of intrusion. The last stage of intrusion is represented by second-generation andesitic dykes, which crosscut these. All things considered, the petrographic data points to a dynamic magmatic system with changing composition and frequent intrusion episodes that were crucial to the formation of mineralization [
31,
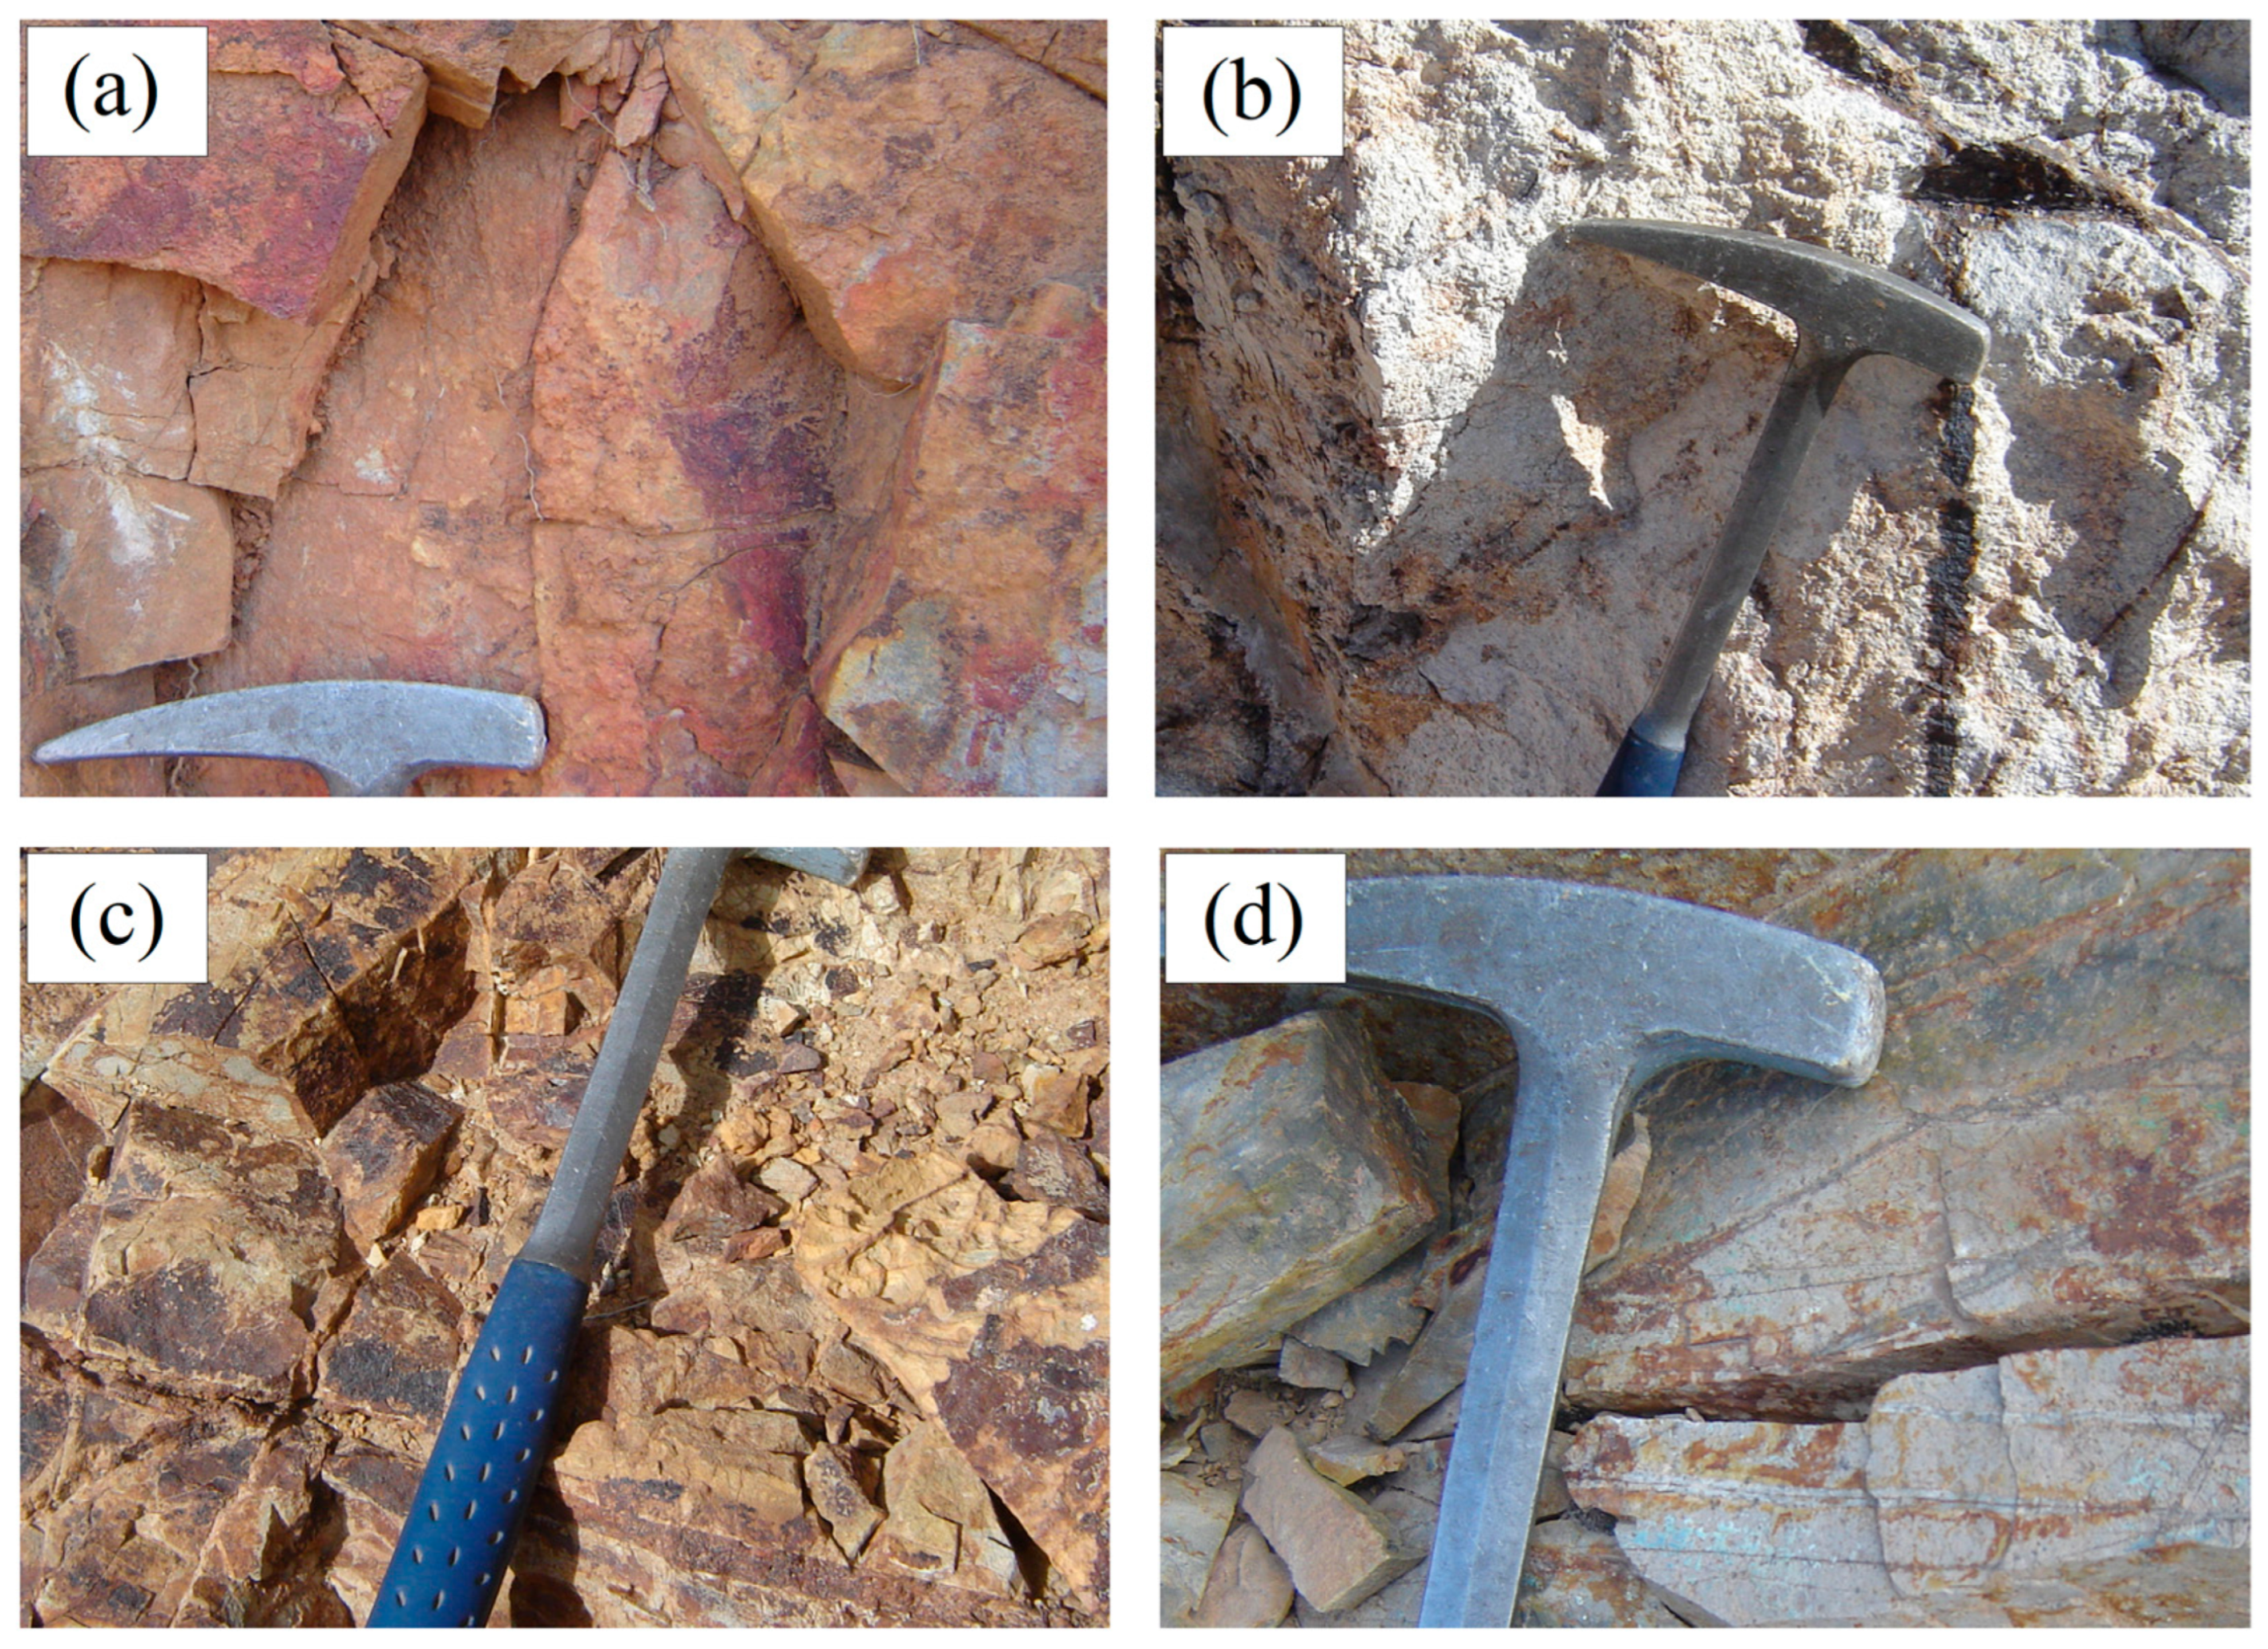
32]. A summary of the most important field images of these rock units may be found in
Figure 3 [
37].
Alteration Zones
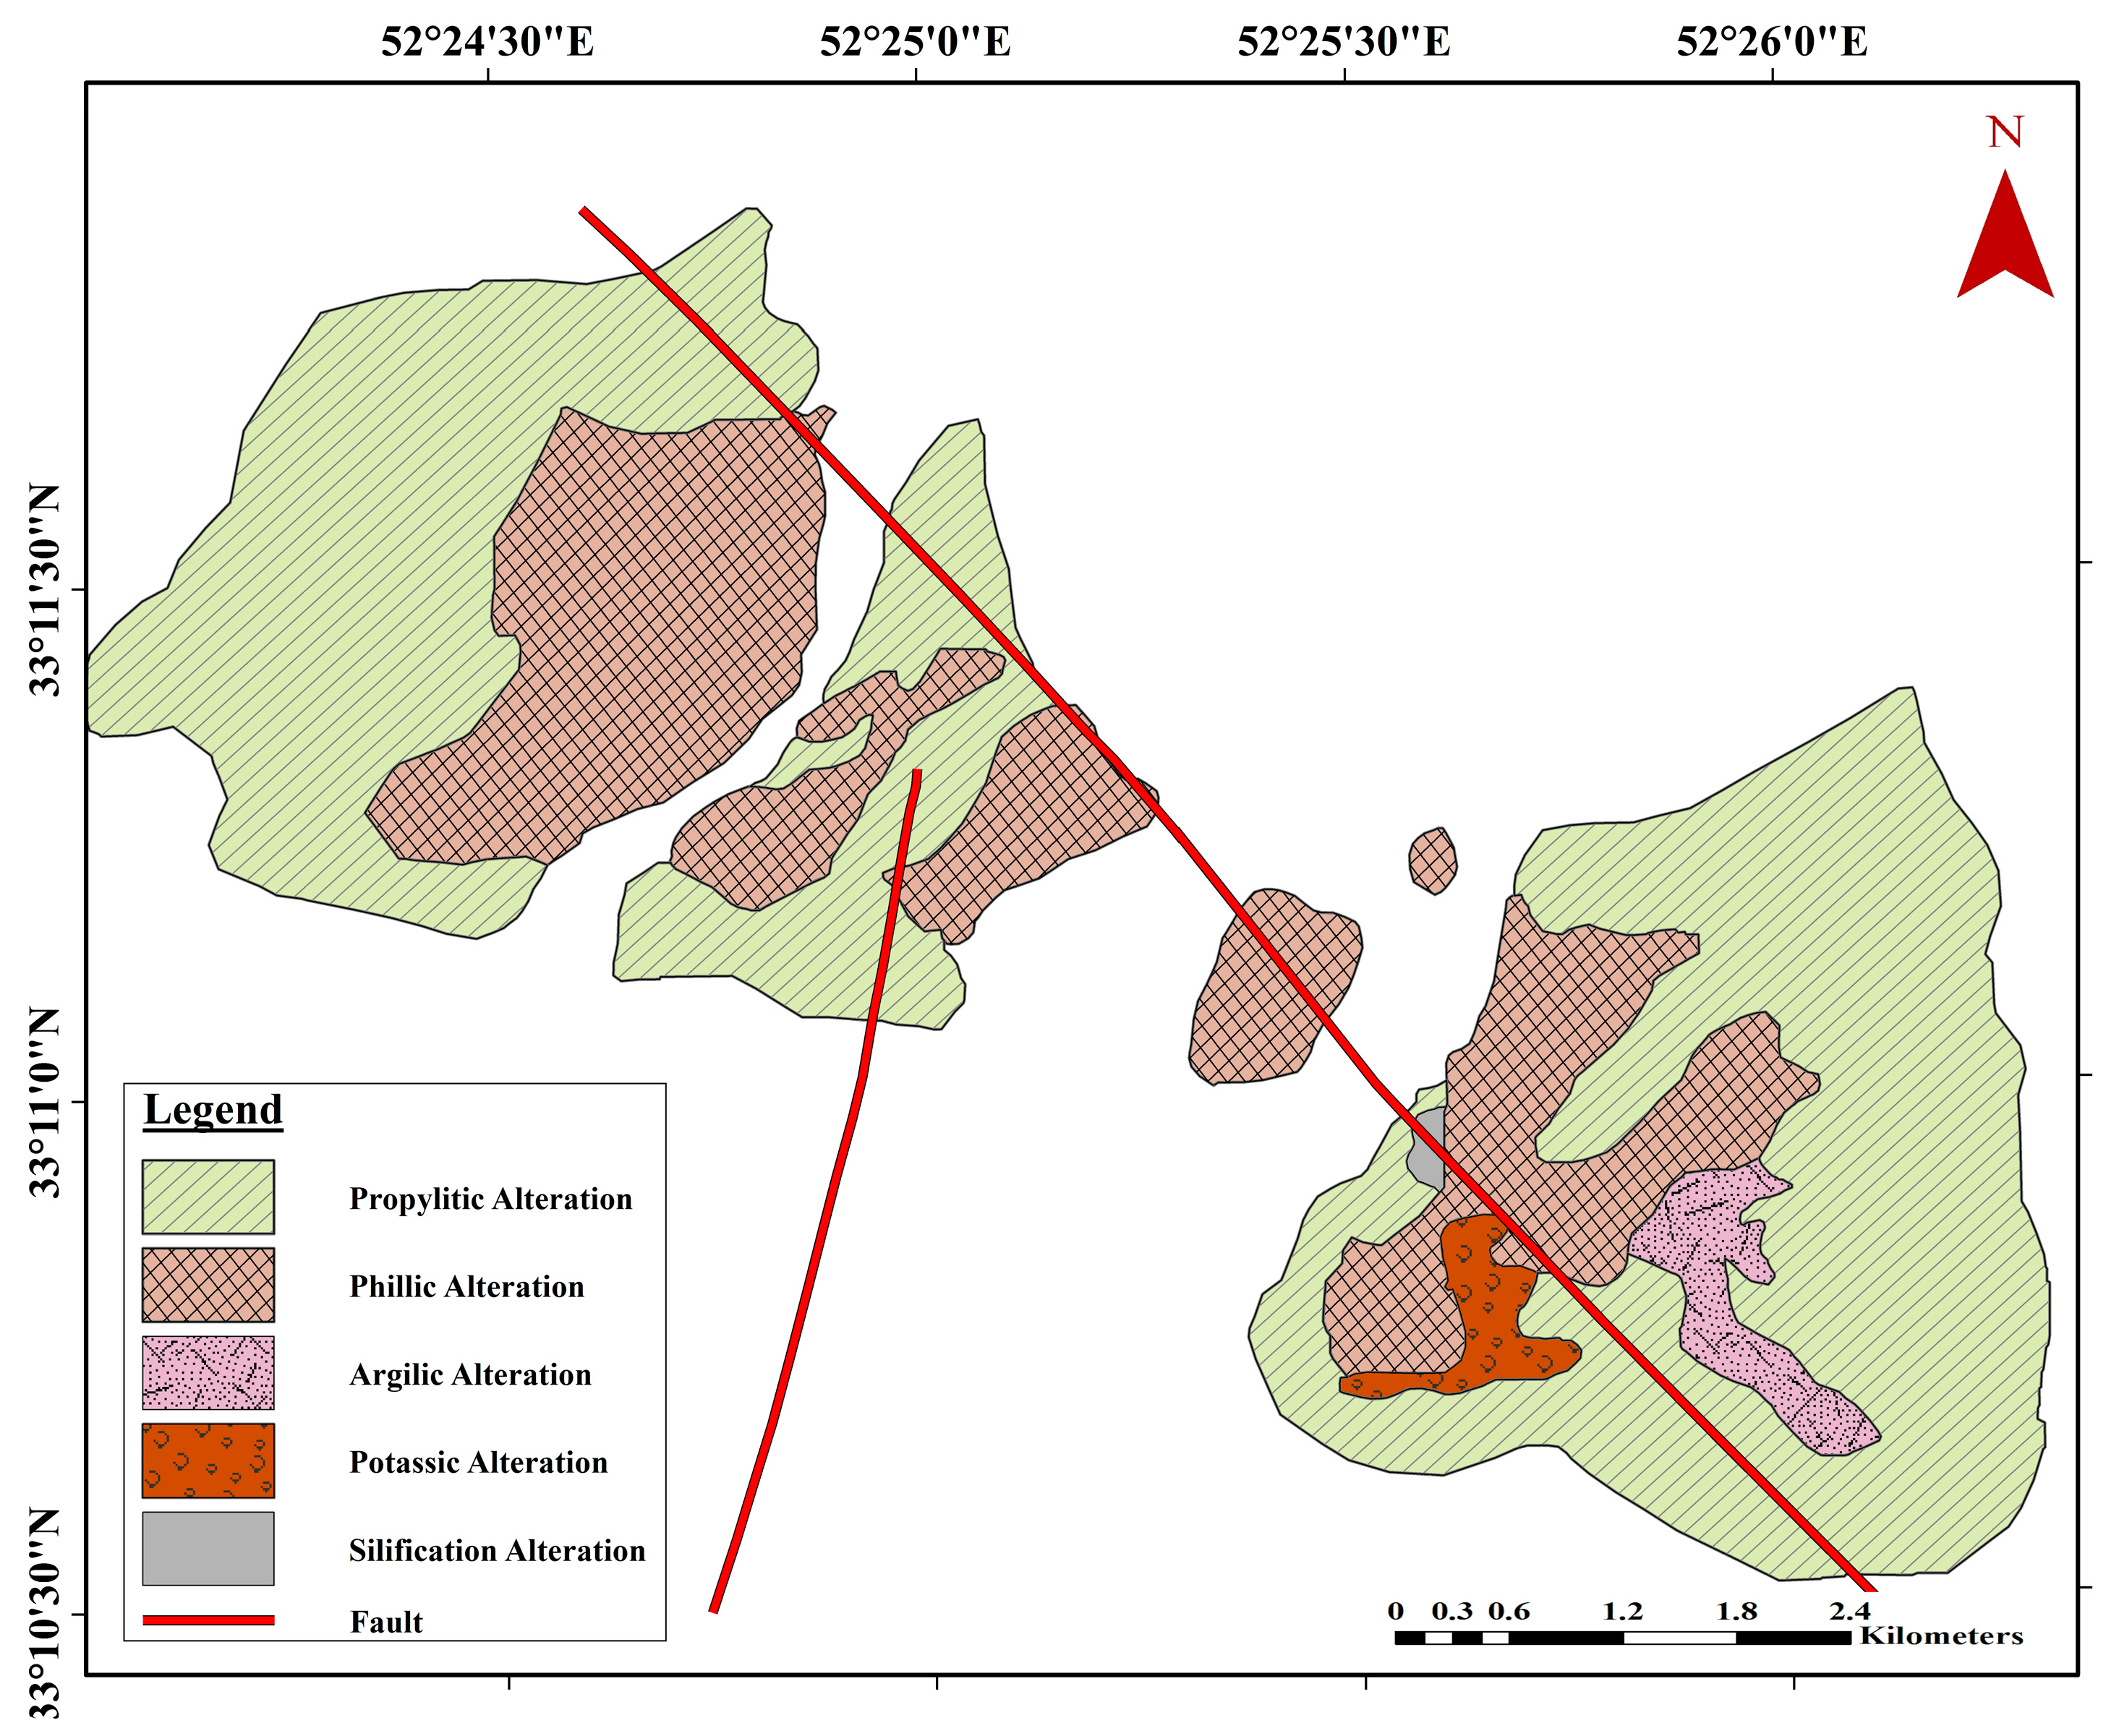
Hydrothermal solutions have had a significant impact on the rocks of the Zafarghand region, such that most of the rock units have undergone extensive alteration. Alteration studies in this system reveal five main types of porphyry-type hydrothermal alteration, including potassic, phyllic, argillic, propylitic, and local silicification, along with the widespread presence of iron oxides (mainly scattered, veined, and patchy). The primary lithology of the porphyry system consists of altered porphyry dacite, rhyolite-dacite porphyry, and quartz diorite, surrounded by weakly altered porphyry andesite, andesitic pyroclastics, and lava [
29]. Investigations indicate that the alteration zones (shown in
Figure 4) are primarily concentrated near the intrusive igneous masses and their host rocks, with the complex extending along the South Ardestan fault [
28].
The distribution pattern of alteration zones in the Zafarghand porphyry system exhibits a distinct zoning from the center to the periphery, with phyllic, argillic, and propylitic alterations progressively extending outward. In addition to this main sequence, evidence of potassic alteration has also been recorded in parts of the region. The concentration of this alteration complex is most apparent in the vicinity of intrusive masses and host rocks around the South Ardestan fault [
28].
In the southern part of the Zafarghand range, potassic alteration is observable. This alteration zone is characterized by the presence of quartz stockworks, siliceous veins containing copper mineralization, and veins with minor amounts of malachite. The phyllic alteration zone, which is developed in dacite porphyry and quartz diorite units, is distinguished by the quartz–sericite complex, an extensive network of quartz stockworks, and a significant presence of iron oxides (predominantly hematite). In some cases, the quartz content is so high that it imparts a silicified appearance to the rocks. Silicification in these areas is often accompanied by brecciation (see a Field Verification section).as described in the Field Verification section. Moving away from the phyllic zone, the intensity of this alteration becomes weaker, so that clay minerals appear and sericite is present in smaller amounts compared to the previous section. Siliceous and argillic alterations have replaced them to a limited extent In other areas, although clay minerals may be present locally, the intensity of this alteration decreases over a short distance and turns into propylitic alteration. Propylitic alteration is widespread in the rocks at the outer boundary of the deposit. Its effects are also observed in pyroclastic fragments within the andesite complex surrounding the rocks in the porphyry system (see a Field Verification section )
Mineralization resulting from supergene processes in the Zafarghand region includes the following: iron oxides in the form of goethite and jarosite, iron mineralization as hematite, iron oxide veins resulting from sulfides, and the presence of iron oxides within silica veins related to central alterations [
38] (refer to the Field Verification section for more details).
Copper mineralization in the study area is widely distributed across all rock units and occurs in three main forms: scattered grains, stockworks, and vein–vein systems. This mineralization, which has a history of 21 million years, formed during the same period as the Alpine-Himalayan orogeny. Mineralogical investigations reveal the presence of a series of sulfide minerals, including bornite, chalcopyrite, covellite, and molybdenite, found in the spaces between silicate macrocrystals (especially biotite and amphibole). These features clearly point to hydrothermal processes and metamorphism associated with that orogenic event, which led to the formation of mineral deposits in this area [
33]. The geological and lithological characteristics of the region have a significant impact on the spectral behavior of the alteration zones. In particular, the high percentage of clay minerals in the phyllic zone and the spread of chloritization in the propylitic zone increase the spectral contrast in the SWIR bands of ASTER images and facilitate the identification of these zones through remote sensing.
3. Materials and Methods
In this paper, the mineral potential and alteration identification in ASTER sensor satellite images of the study area were presented through the research. These specific images, with their own special abilities, are a very effective tool for the detection of the alterations. The Terra satellite, in orbit since 1999, carries the advanced ASTER sensor. Equipped with 14 spectral bands [
39], this sensor provides a wide range of geological data. ASTER’s spectral bands are categorized into three groups: visible and near-infrared bands with a resolution of 15 m, short-wave infrared (SWIR) bands with a resolution of 30 m, and thermal infrared (TIR) bands with a resolution of 90 m (
Figure 5). Each image captured by this sensor covers an area of 3600 km
2. ASTER as a geological tool is unique in the sense of the SWIR and TIR spectral specialization region provided. The reflective infrared part of the sensor (SWIR), with six bands in the range of 1.5 to 3 micrometers, provides valuable information about the lithology and mineralogical characteristics of the area. Additionally, the five thermal bands of this sensor allow for precise thermal mapping of the Earth’s surface and measurement of thermal radiation from various phenomena.
The ASTER sensor is one such sensor that also has considerable utility for geological studies, and its output data form the basis of many alteration/mineral/rock unit identifications. The data can be used standalone, or along with other remote sensing satellite data and information from the ground, to map geological features [
40]. One of the advantages of the ASTER sensor is its ability to be combined with data from other satellites, which enables the production of maps with higher accuracy. In recent years, many researchers have emphasized the importance of the integrated use of ASTER and other remote sensing data.
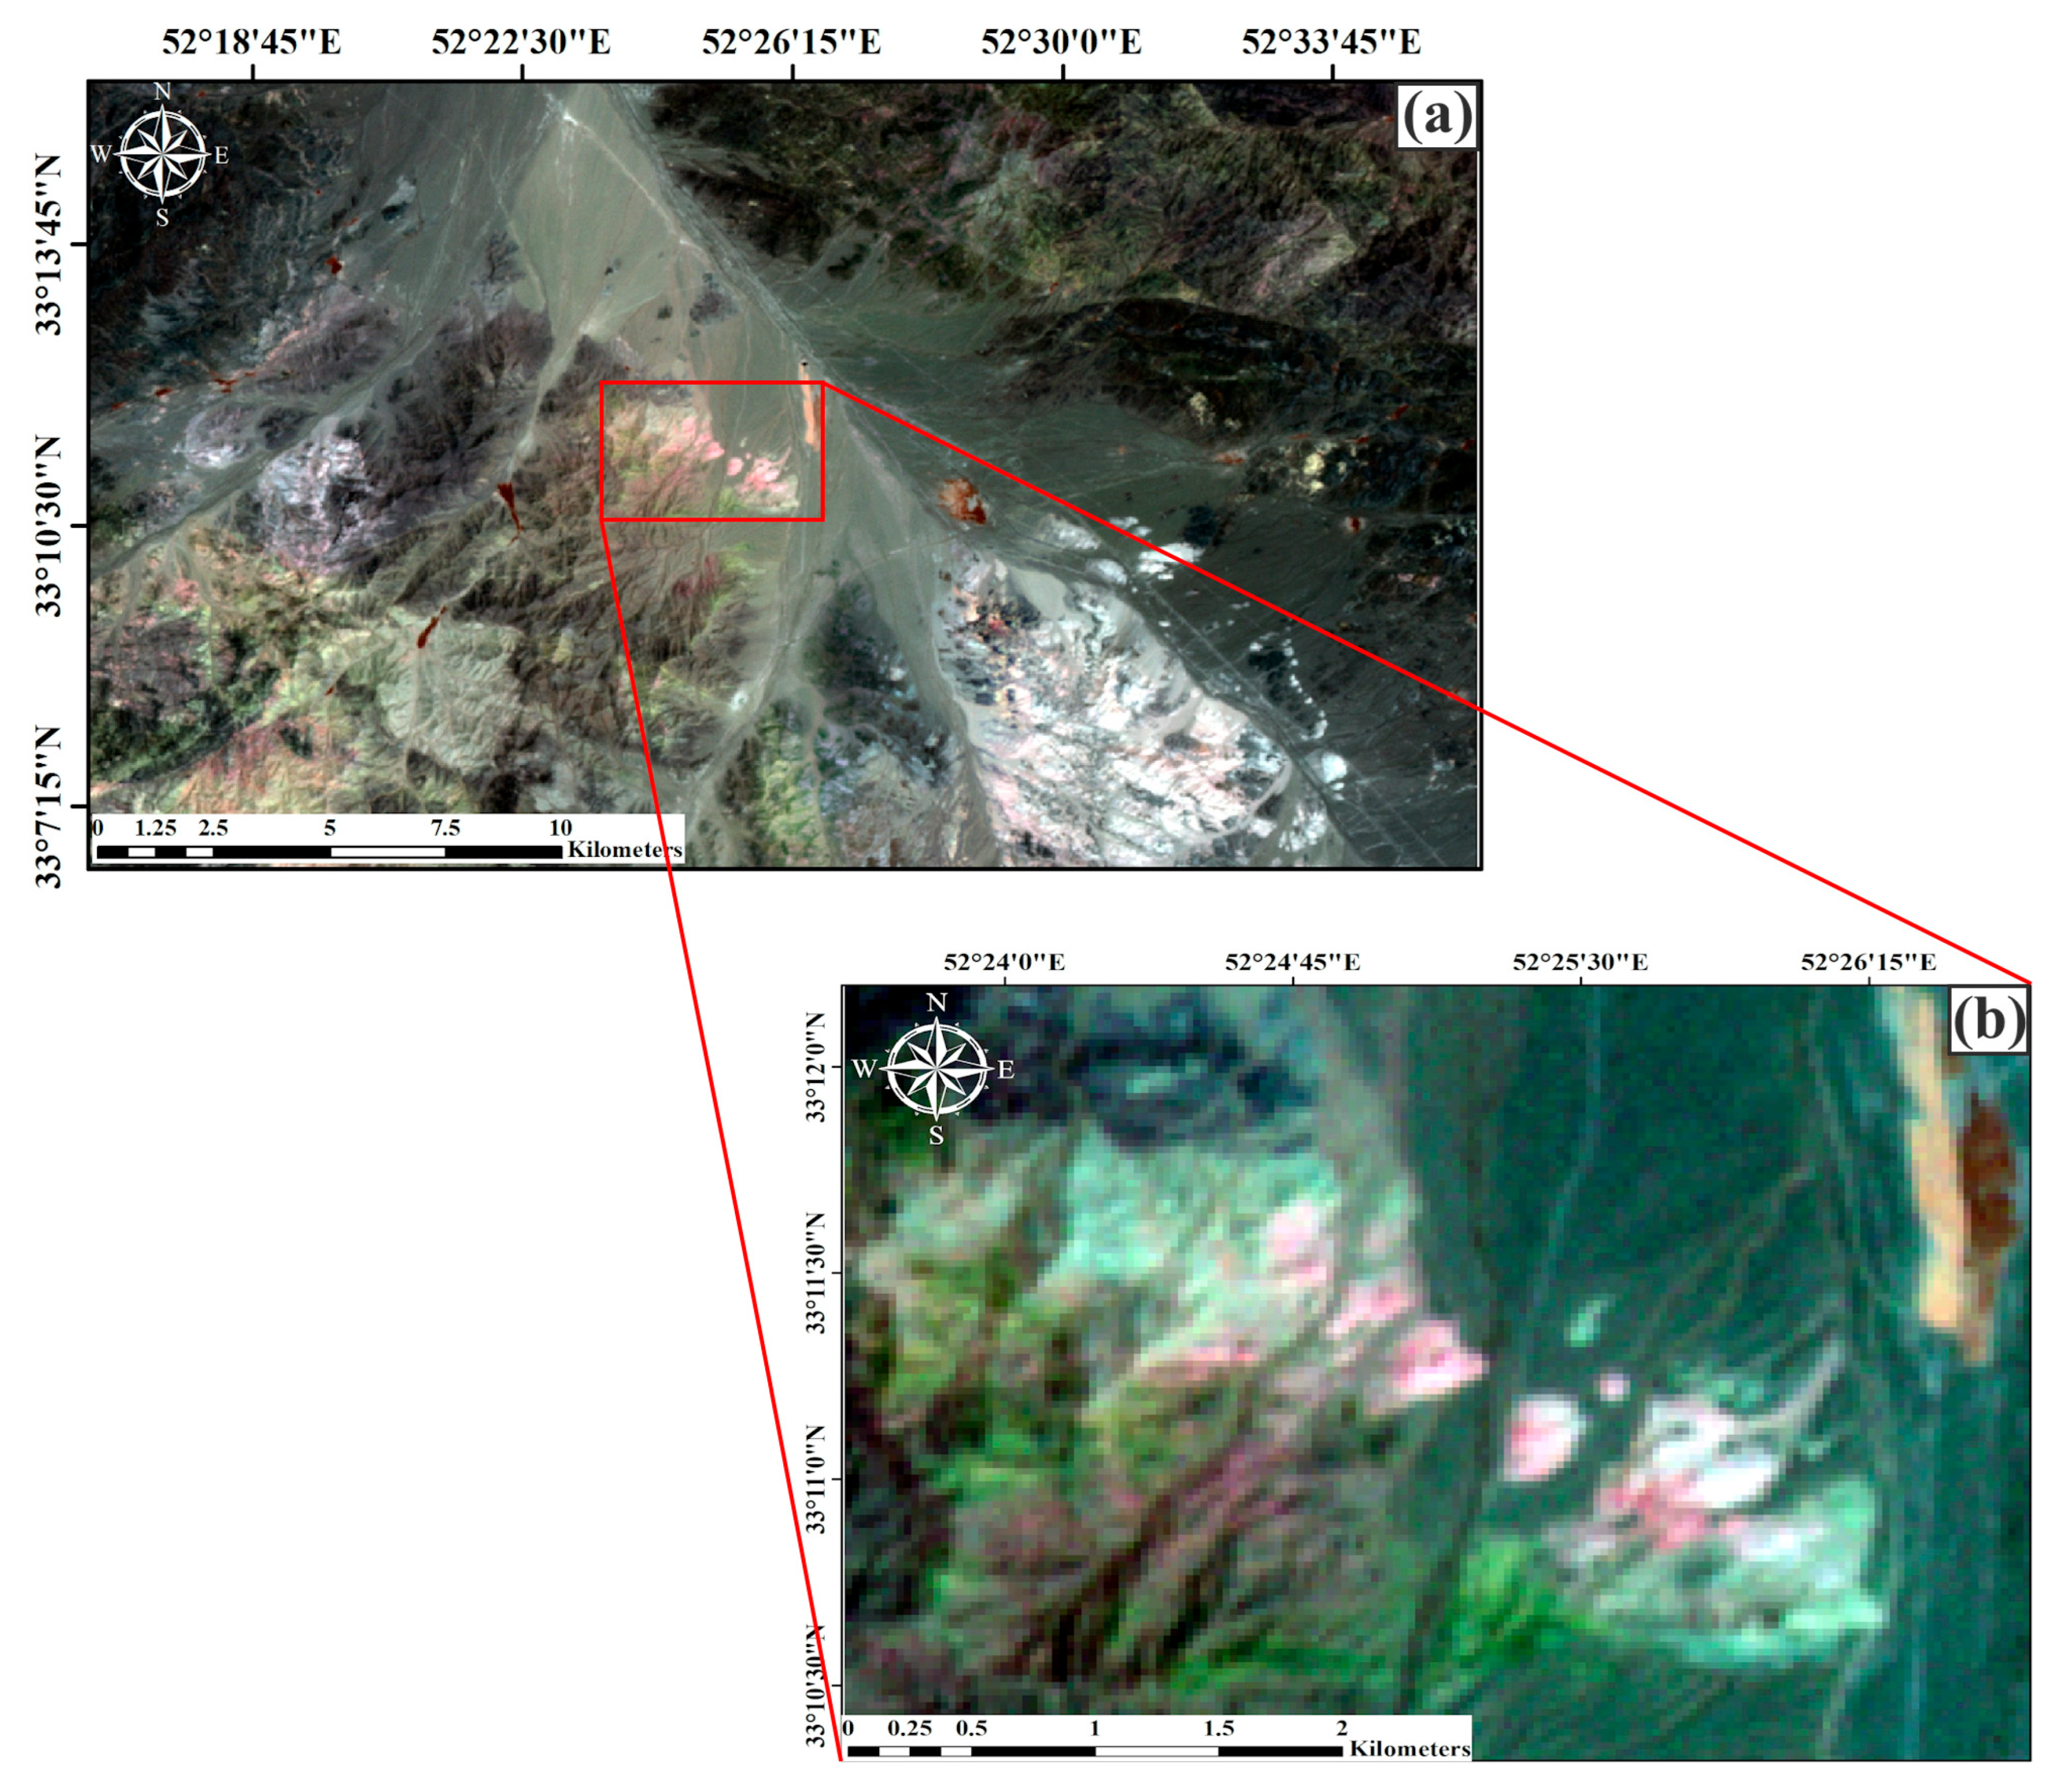
In this study, a Level 1T image from the ASTER sensor (AST_L1T_00308182002072145_20150424120125_9911), taken on 21 July 2002, was used (see
Figure 5). The preprocessing stages of the ASTER images include radiometric correction, atmospheric correction, and geometric correction. To improve data quality and remove atmospheric effects, the atmospheric correction methods IARR (Internal Average Relative Reflectance), LOG (Log Residual), and QUAC (Quick Atmospheric Correction) were applied. In the IARR method, which is one of the most important corrections, the average radiation spectrum of the entire scene is used. This method calculates the ratio of the average spectrum to the spectrum of each pixel (for all pixel spectra). The basic assumption is that the average spectrum represents the solar spectrum [
41,
42,
43].
3.1. Data Used and Preparation
The SWIR bands (4 to 9) of the ASTER sensor were selected to extract the numerical values (Digital Number, DN) of each pixel. The selection of these bands is consistent with previous studies [
39] on porphyry copper deposits, as these spectral bands have a high ability to detect associated alteration zones due to their absorption and reflection characteristics [
41,
42,
44,
45].
Figure 6a shows the entire ASTER scene as an RGB color composite, and
Figure 6b shows a selected subset covering the Zafarghand porphyry copper deposit. The reduction in image resolution in some areas is mainly due to the fact that the area of the study area is much smaller than the full field of view of the ASTER sensor. This means that in a wide image covering the entire scene, only a limited number of pixels are allocated to the target area. As a result, when zooming in on this small area compared to the entire image, its visual representation may appear less clear or detailed.
However, it is important to emphasize that each pixel in the image still contains precise spectral information and specific spatial coordinates, which allows for reliable identification of hydrothermal alteration zones. Therefore, despite the limited pixel coverage of the target area on the scale of the entire image, the data are scientifically valid, accurate, and suitable for exploratory analyses [
41,
42].
Extensive studies on porphyry copper deposits have shown that the SWIR bands (bands 4 to 9) of the ASTER sensor play a key role in identifying and distinguishing alteration zones. The importance of these bands lies in their unique ability to capture the spectral characteristics of absorption and reflection in alteration zones, particularly phyllic and propylitic alterations [
43,
46,
47,
48,
49,
50,
51,
52,
53,
54,
55,
56,
57].
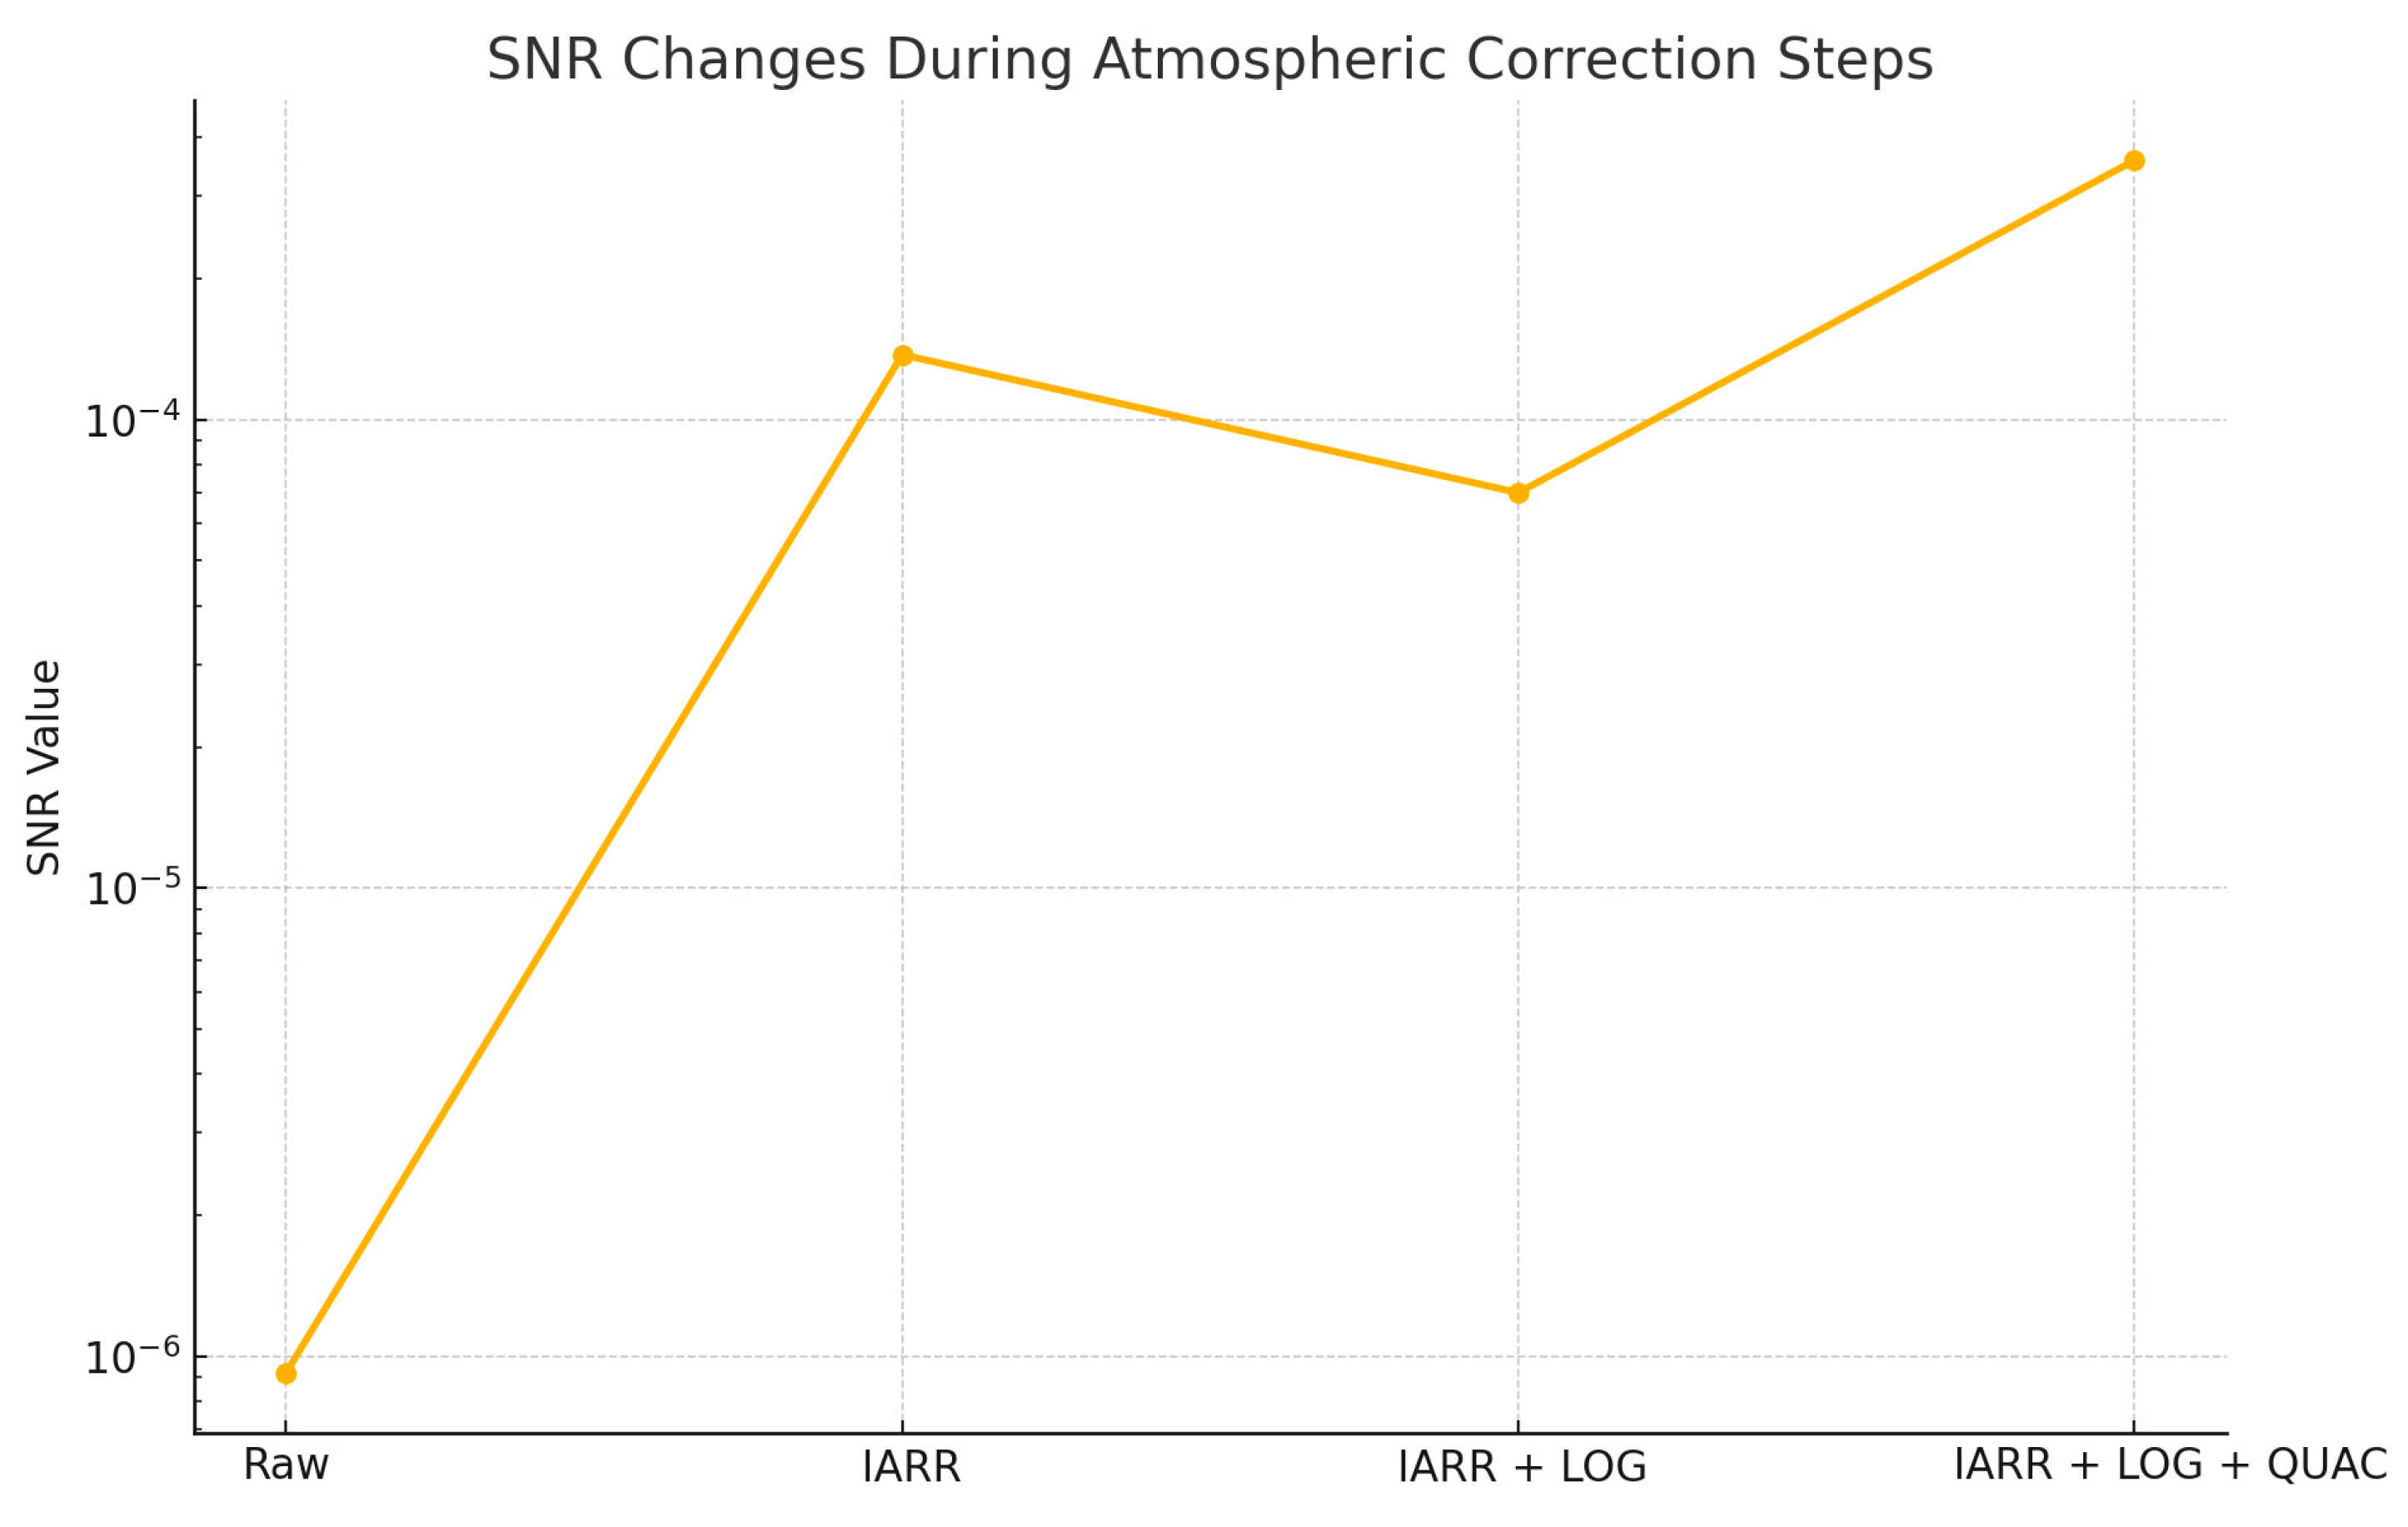
In the data processing steps, first, using the ENVI 5.6 software, the ASTER images were resized to 147 × 87 pixels to improve the quality and accuracy of the results. Then, IARR, LOG, and QUAC corrections were applied to the data to remove atmospheric effects. To evaluate the impact of different atmospheric correction methods on data quality, the signal-to-noise ratio (SNR) was calculated at each stage. The results show that the combination of these three methods resulted in a significant reduction in noise and improvement in data quality. Initially, the raw image had a low SNR. Applying the IARR method significantly increased the SNR. Adding the LOG method slightly reduced the SNR despite enhancing spectral details. Finally, applying the QUAC method resulted in a significant increase in SNR, and the image was ready for more detailed analysis. The changes in SNR at each stage are shown in
Figure 7.
Since the normalization of DN values has a direct impact on the accuracy and precision of the results, the image data were normalized using the Max–Min method after the atmospheric corrections. After applying the Max–Min normalization, the pixel values were converted to a normalized range (usually between 0 and 1) representing the relative reflectance in each band. From this point on, these values are referred to in this paper as “normalized reflectance values” instead of DN values to correctly reflect their physical meaning after atmospheric correction.
The results of this normalization are shown in the histograms of the bands used in
Figure 8, which demonstrate the successful conversion of the data distribution to a normal distribution.
After data preparation, advanced processing was performed using the MATLAB R2021b software. At this stage, the MAD method was used to detect alteration patterns in the region, and the discrete wavelet transform (DWT) method was applied to identify alterations zones more precisely. Details of these methods will be explained in the relevant section.
3.2. Image Processing Techniques
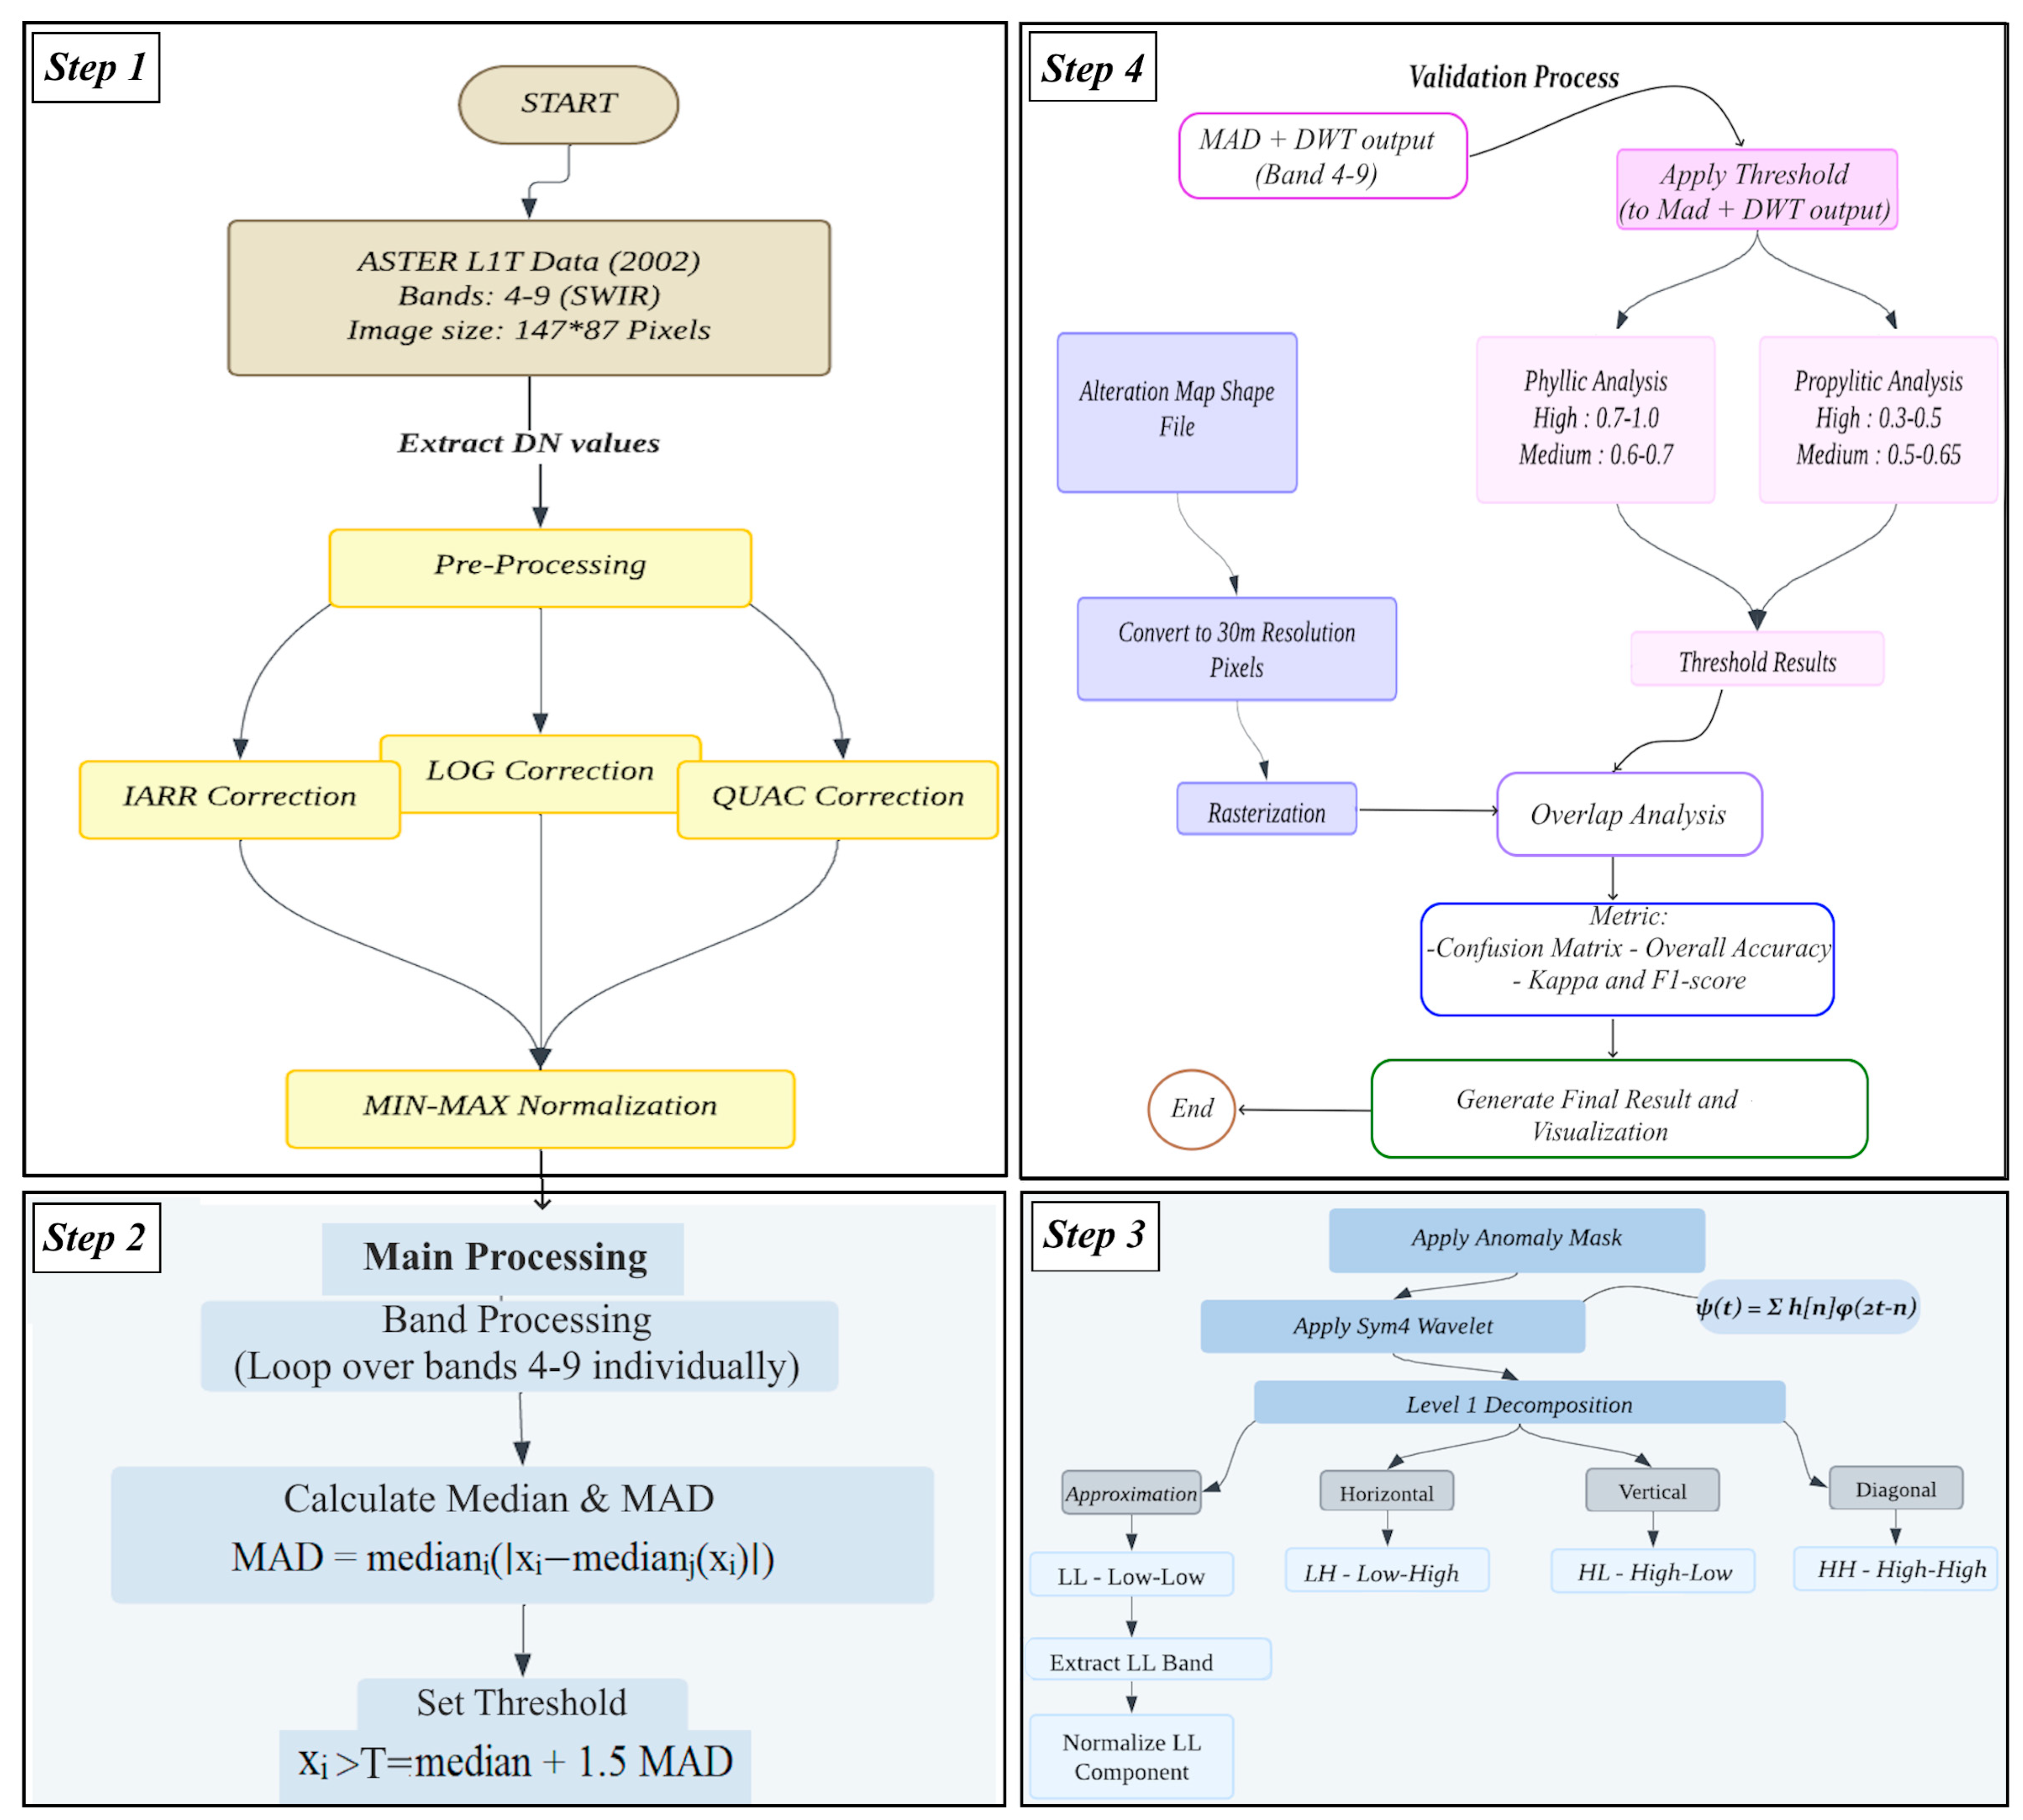
After extracting the DN values from the images, applying atmospheric corrections, and normalizing the data, the MAD method was applied to the data. This statistical method, commonly used to identify anomalies, was employed in the study area to detect alteration zones. In the next step, the data identified as variable regions were used for advanced DWT analysis. The complete process and data processing steps are illustrated in
Figure 9.
3.2.1. Absolute Standard Deviation Method (MAD)
The Mean Absolute Deviation (MAD) is a robust statistical measure that quantifies dispersion by averaging the absolute deviations of univariate quantitative observations from a selected measure of central tendency. It is calculated using the following formula:
The MAD method is recognized as a robust and efficient approach for satellite data analysis and change area detection. In this method, each data point x
i (representing the DN or reflectance value of a pixel in the satellite image) is evaluated relative to a newly computed median, median
i, while median
j denotes the median of the original dataset. The corrected data are obtained by computing the absolute deviation of each data point from the new median. This technique enhances data distribution and is less sensitive to outliers, demonstrating more stable performance in detecting change areas compared to threshold-based methods using the median and standard deviation. Unlike the standard deviation, which is highly influenced by outliers, the use of the criterion median + (n) × MAD for separating pixels associated with change regions yields greater robustness and accuracy in the presence of outliers [
58].
In this study, a threshold factor of n = 1.5 was selected for the MAD index to distinguish anomalies from the background. This value is particularly suitable in cases where the data deviate from a perfectly normal distribution and may contain noise or natural fluctuations. Employing a factor of 1.5 provides a balanced trade-off between sensitivity to actual changes and the ability to minimize false detections caused by natural variability. Compared to higher threshold coefficients (e.g., 2 or greater), the selection of n = 1.5 enables the detection of more subtle and less intense mineral anomalies, particularly those occurring along natural environmental boundaries but still of geological or geochemical significance. This threshold was determined based on detailed statistical analysis and practical experience with the dataset, and has proven to be a reliable criterion for the extraction of hydrothermal alteration zones.
The statistical threshold employed in this study was defined as T = median + 1.5 MAD. Data values exceeding this threshold (i.e., x
i > T) were classified as hydrothermal anomalies (
Figure 10). These initially detected anomalies served as target inputs for the advanced processing stage. To achieve more accurate delineation and structural interpretation of mineral alteration zones, the DWT technique was applied. This method enables multiscale analysis and facilitates the extraction of spatial-frequency features relevant to alteration patterns.
3.2.2. Discrete Wavelet Transform (DWT)
Wavelet transform is an analytical signal processing technique used for signal and image analysis across multiple scales. Unlike the Fourier transform, which decomposes signals only in the frequency domain and discards time information, wavelet analysis provides both time and frequency information simultaneously. That is to say, in this method, an image will be decomposed into multiple scales and locations to extract its features, with layer-wise resolution information based on [
59,
60]. In wavelet analysis, a set of basis functions known as “wavelets” with different scales and positions are used. These functions are generally derived from a fundamental wavelet known as the “mother wavelet,” which is transformed into various forms by scaling and shifting. Wavelet analysis consists of two main types: Continuous Wavelet Transform analysis (CWT), where wavelets are scaled and shifted continuously, and DWT, where scales and positions are selected discretely [
61,
62].
After introducing wavelets and their types, the DWT is recognized as one of the most widely used methods in satellite image processing. This transformation enables multi-scale data analysis by decomposing the signal into various frequency components. In its basic form, the discrete wavelet transform is based on the wavelet described in Equation (2):
In this expression, a represents the scale parameter that determines the amount of expansion or compression of the wavelet, and b is the transfer parameter that controls the position of the wavelet in time or space [
63,
64].
Given that this study utilizes satellite imagery, the wavelet transform must be extended to two dimensions to effectively capture spatial variations. The two-dimensional discrete wavelet transform (2D-DWT), which facilitates this extension, is defined as follows:
In this Equation (3), a is the scale parameter that controls the amount of stretch of the wavelet function in both spatial dimensions, while b and c are the displacement parameters along the x and y axes, respectively, that determine the location of the wavelet analysis in the image [
63,
64].
Finally, to process satellite imagery, the two-dimensional discrete wavelet transform (2D-DWT) is applied, and it is defined by the following equation:
In Equation (4), g denotes the set of filter coefficients derived from the impulse response of the selected wavelet (e.g., sym4), which are used to convolve the input image and decompose it into frequency sub-bands. The parameter j represents the level of wavelet decomposition, indicating the depth of multi-resolution analysis applied to the image. Each level captures image features at a different spatial scale, enabling hierarchical representation of both coarse and fine structures.
The parameters in these relations are as follows: the two-dimensional mother wavelet function (ψ(x, y)), scale parameter (a), transfer parameters along the x and y axes (b and c), pixel coordinates in the satellite image (x and y), satellite image pixel values (x[m, n]), two-dimensional wavelet filter coefficients (g), decomposition level (j), and transfer parameters in two dimensions (k and l) [
65].
To identify porphyry copper alterations in a region, selecting an appropriate base wavelet for extracting spectral features is crucial. Different wavelets can yield varying results in feature extraction and data analysis due to their distinct characteristics. Symlet wavelets are a class of orthogonal wavelets developed as an improved version of the original Daubechies family. The goal of designing these wavelets was to optimize time-frequency localization while preserving relative symmetry and a high number of vanishing moments [
25].
These features make Symlet wavelets a very suitable choice for processing remote sensing data, where spectral continuity and spatial accuracy are both important. The sym4 wavelet used in this study demonstrates high performance in modeling smooth and continuous spectral changes while preserving spatial image structures—factors that are crucial for identifying alteration zones in porphyry copper systems using satellite imagery [
25].
In the DWT conversion, the image is analyzed using low-pass and high-pass filters. The low-pass filter retains the low-frequency information, which gives an overall idea about the image, and the high-pass filter is for high-frequency components, i.e., edges, smaller features, and more complex structures. This operation is performed iteratively: first, the filter is applied to the rows (in 2D images), and then to the columns. At each step of the transformation, the results of both the low-pass and high-pass filters are sampled (i.e., every second sample is discarded). Four frequency bands are created in this process: LL (low–low) for low-frequency content and LH, HL, and HH representing high-frequency content in the image, which correspond to the horizontal and vertical as well as their diagonal components [
61,
62]. These bands can be exploited for secondary tasks, e.g., further analysis, compression, or even image description. Since this analysis is local in nature, different scales of features in the image can be captured very well by DWT, with which the information can be worked with at a lot of different resolutions without losing the spatial footprint. Investigations of the outputs from all spectral bands reveal that the distribution and dispersion patterns of the results across different bands are remarkably similar. Therefore, to avoid redundancy and to present the research findings more effectively and efficiently, only the output corresponding to band 9, which serves as a good representative of the overall results, is presented in this form.
4. Results and Analysis
In order to accurately evaluate and comprehensively validate the proposed method, an innovative pixel-based analysis approach was designed and implemented. In this regard, a satellite image with a spatial resolution of 30 m was used as the base data (
Figure 11a). To create a valid and reliable basis for comparison, a high-accuracy map of the main alteration zones of the region, focusing on two key zones—phyllic and propylitic—was prepared in shapefile format. In the next step, to enable quantitative, pixel-by-pixel comparison of the results, an advanced data conversion process was designed, during which the prepared shapefiles were converted into 30 m pixels (matching the resolution of the original image) (
Figure 11b). This process resulted in the production of a detailed raster image of the distribution of alterations, which was used as reference data in the validation process. In the process of validating the results, precise threshold limits were determined for each type of alteration. For phyllic alteration, the reflectance values obtained from the LL sub-band of the wavelet transform were classified into two levels: medium confidence values (0.6 to 0.7) and high confidence values (0.7 to 1). Similarly, two threshold levels were defined for propylitic alteration: medium confidence values (0.3 to 0.5) and high confidence values (0.5 to 0.65).
In this study, out of a total of 12,789 (147 × 87) pixels in the image (for example, in band 6), 128 pixels were identified as anomalies. This detection and thresholding process was applied independently to each SWIR band (bands 4 to 9) to ensure the identification of band-specific anomalies and to capture the spectral variability of hydrothermal alterations. This significant reduction in the number of pixels is the result of using the exact criterion of T in the detection of anomalies, which guarantees high confidence in the accuracy of the detected areas. This conservative approach in the selection of anomalies, while removing noise and false anomalies, identifies only the areas that indicate alteration with high confidence. It should be noted that the high accuracy achieved in this study is mainly due to the precise and limited definition of thresholds in pixel space. The use of discrete threshold levels has allowed the identification of pixels with high confidence in the alteration areas. This conservative approach, although it may lead to a reduction in the total number of identified pixels, produces outputs with high reliability and low error. In effect, thresholding acts as a smart filter that extracts only pixels with clear and reliable signs of alteration.
To quantitatively evaluate the performance of the anomaly detection method, a set of standard classification metrics, including overall accuracy, F1 score, Cohen’s kappa coefficient, and confusion matrices, were employed (
Table 1 and
Table 2). These metrics were calculated for both phyllic and propylitic alteration zones using anomaly maps generated by the MAD algorithm.
The evaluation was performed in all nine SWIR bands, but band 9 showed slightly superior performance in terms of statistical measures and visual consistency in the spatial distribution of anomalies. For example, in the phyllic zone, band 9 achieved a kappa value of 0.9732, indicating an almost perfect match with the ground reality map. Similarly, F1 scores above 0.95 were recorded for high-confidence classifications in several bands, with band 9 providing the most stable and interpretable results.
The confusion matrix results also confirmed the robustness of the method with very low errors (false positives) and moderate omission errors. These findings reinforce the selection of band 9 as the most appropriate spectral input for final interpretation and map generation.
Overall, the combination of statistical validation and spatial consistency justifies the focus on band 9 in the main analysis while demonstrating that the proposed approach performs reliably across the entire SWIR band range.
Based on the statistical and visual analyses performed on phyllic and propylitic alterations, significant results have been obtained. For phyllic alteration, band 9 at a medium confidence level shows outstanding performance, with 93.9% accuracy and a 9.68% detection rate, where out of 328 identified pixels, 308 pixels had correct overlap. For propylitic alteration, although band 7 at a high confidence level showed the highest performance, with a 17.60% detection rate and 95.22% accuracy, band 9 at a medium confidence level provided the most stable results, with 98.66% accuracy. These results are also clearly visible in the output images (
Figure 12 and
Figure 13). Comparison of normalized LL images with maps generated from different confidence levels shows that the algorithm has effectively distinguished altered regions from the background. The comparative graphs also confirm that despite differences in detection rates, the method’s accuracy has been maintained at a high level.
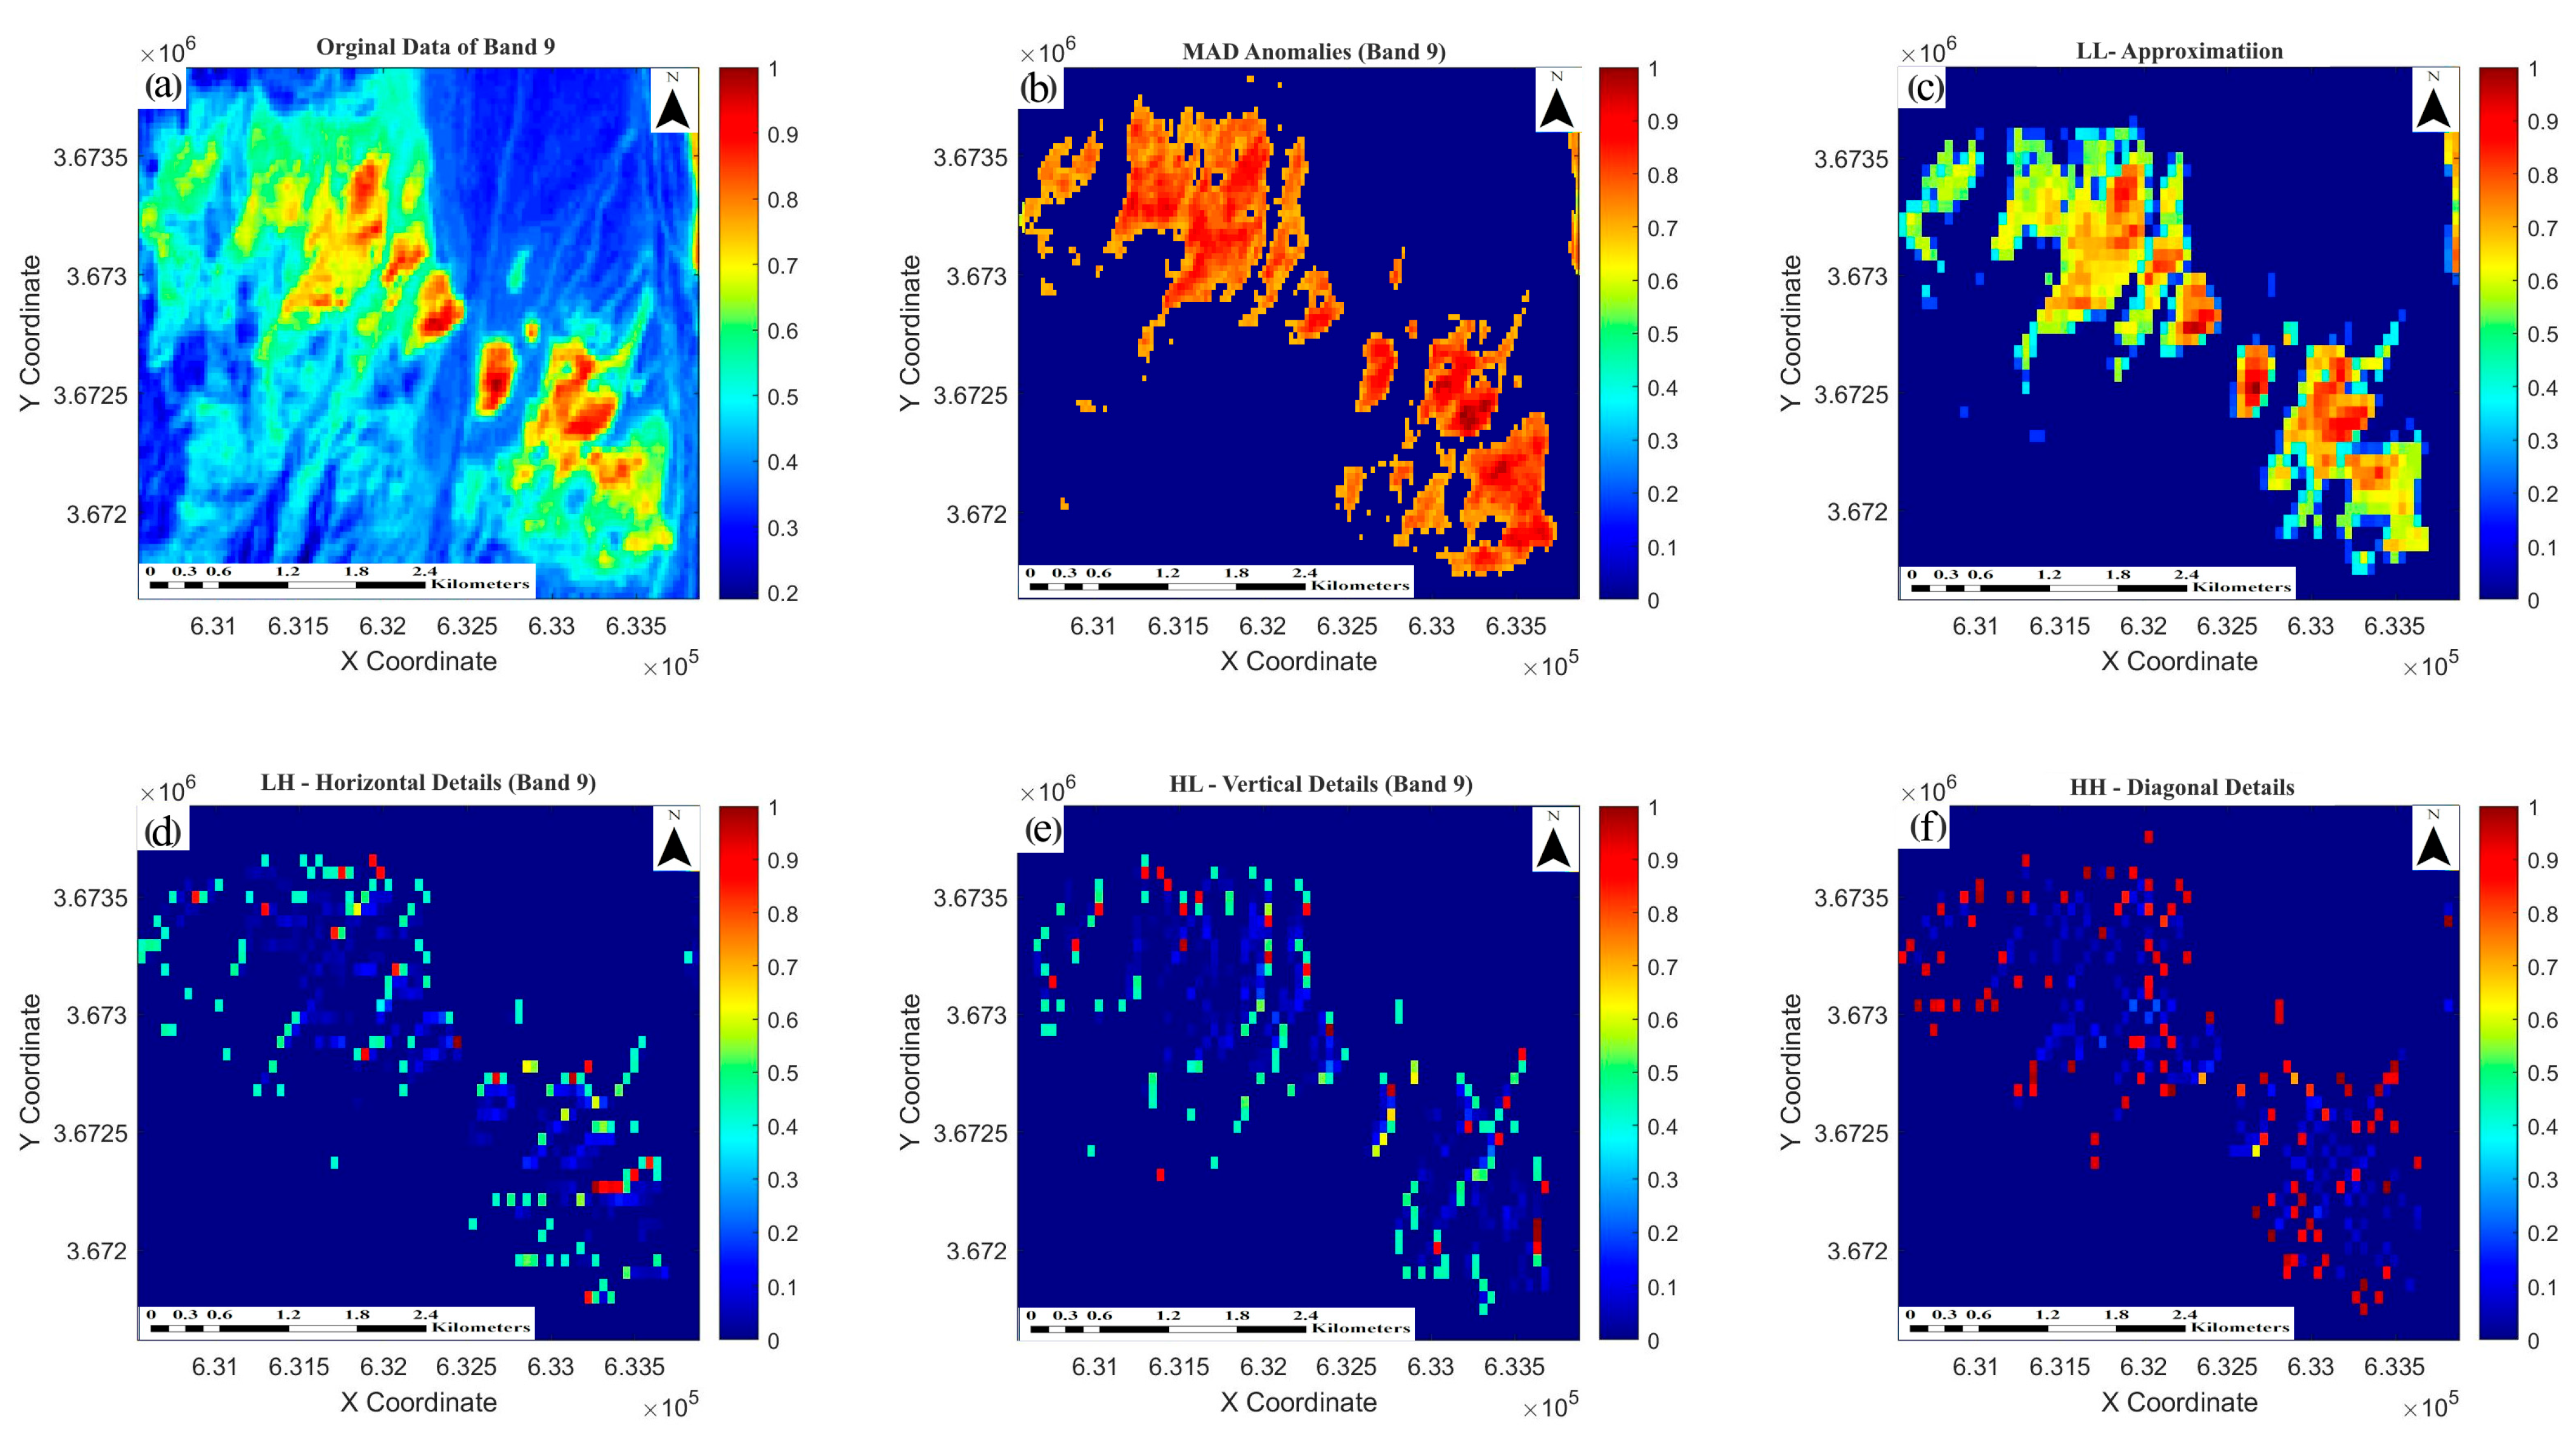
In addition to pixel-based and statistical assessments, complementary interpretation of hydrothermal alteration zones was performed using DWT sub-band outputs. These visual analyses provide a deeper understanding of the spatial behavior and geological control of alteration patterns across the study area (
Figure 14).
The approximation image (LL) (
Figure 14c) obtained from wavelet analysis provides a comprehensive view of the alteration system in the region. In this image, areas with high intensity (red-orange) represent the main center of hydrothermal activity, characterized by intense phyllic alteration. These areas gradually transition toward the periphery, with a gradual decrease in intensity (yellow to blue), indicating a shift to propylitic alteration. This gradual pattern reflects a decrease in temperature and alterations in the chemical composition of hydrothermal fluids as they move from the center to the margins of the system. The spatial distribution of these alteration zones in the LL image may also indicate different stages of hydrothermal system evolution and the controlling role of geological structures in fluid migration.
The vertical detail analysis (HL) (
Figure 14e) resulting from the wavelet transform reveals a unique pattern of alteration distribution along a north–south direction. The image shows (light blue) the sparse points indicating pathways of hydrothermal flow at different vertical pathways. In this way, the pattern may show the dominant fluid pathways along vertical fissures and faults. The location of these points also outlines the contact (vertical) boundaries between alteration zones that are probably defined along linear geological structures. Of note, the high-intensity (orangish-red) dots are visible in a few places, suggesting concentrations of fluid flow and therefore a higher degree of alteration along these vertical elements.
Horizontal detail analysis (LH) (
Figure 14d) shows a substantial pattern of alteration decreasing gradually. The light blue points in the LH image (light blue) point to the areas where hydrothermal activity has decreased steadily at places with moderate intensity. This pattern might imply evolved variations in the temperature, pH, and chemical properties of the hydrothermal fluids, resulting in the weakening of alteration. The spatial distribution of these points also shows the path and evolution of hydrothermal fluids, moving from zones of intense alteration (phyllic) toward areas with weaker alteration (propylitic). This decreasing trend in alteration intensity may indicate the final stages of hydrothermal activity in these areas.
To further investigate the possible existence of a decreasing trend in the intensity of the alteration in the vertical direction, a cross-section profile was extracted from the LH image. As can be seen in
Figure 15, the graph starts with a strong peak near the top of the image and then gradually decreases. This trend could reflect the gradual weakening of the alteration along the vertical fluid flow paths, which is probably related to the pressure or temperature drop of the fluid at a greater distance from the main source. This result suggests that the intensity of the alteration in the vertical direction is also not uniform and is controlled by linear structures.
The diagonal detail analysis (HH) (
Figure 14f) reveals a notable pattern of well-defined boundaries between altered and unaltered rocks. Scattered points with high intensity (red) in the image represent a sharp boundary between rocks affected by hydrothermal fluids and unaltered rocks. The high intensity of these points may be due to the significant spectral contrast between altered and unaltered rocks. This pattern clearly identifies the final extent of hydrothermal fluid infiltration and the outer boundary of the alteration system. The spatial distribution of these points can also assist in determining the lateral and vertical extent of the alteration system and guide further exploration activities. These boundaries, marked by scattered points of high intensity (red), effectively delineate the infiltration zone of the hydrothermal system. This pattern not only defines the outer boundary of propylitic alteration but can also serve as a guide for determining the overall extent of the hydrothermal system and planning further exploration. The spatial distribution of these boundaries also indicates the pattern of lower temperature fluid infiltration at the periphery of the hydrothermal system.
The patterns observed in the wavelet-derived LH and HL components show good consistency with the field-based alteration zonation (
Figure 4). The lateral weakening of alteration intensity seen in LH correlates with the transition from phyllic to propylitic zones. Similarly, the orientation of vertical features in HL matches the mapped fault directions, supporting the interpretation of structurally controlled fluid migration.
The 93.9% accuracy for phyllic alteration and 98.66% for propylitic alteration give better stability of performance in all cases. These results mean that alteration mapping based on the method using band 9 is a strong framework. When both types of comparisons are made with the method, it shows higher detection rates for propylitic alteration, and band 9 has stable behavior with similar success in both alteration types. The more propylitic the alteration, the higher number of overlapping pixels at high confidence, showing that method works better for this type of alteration.
Field Verification
The hydrothermal alteration zone in the Zafarghand copper porphyry system, with an area of about 7 km
2 (1.5 × 4.5 km), is partially covered by alluvial deposits. The two porphyry centers of this system are characterized by intense phyllic hydrothermal alteration, quartz-magnetite stockwork, and extensive mineralization of iron oxides (hematite, goethite, and jarosite) and locally, malachite/chalcopyrite. These centers are surrounded by rhyodacite and andesite porphyry units with strong argillic and propylitic alterations. Field evidence, hand samples, and microscopic studies of alteration zones in this range are shown in
Figure 16,
Figure 17 and
Figure 18.
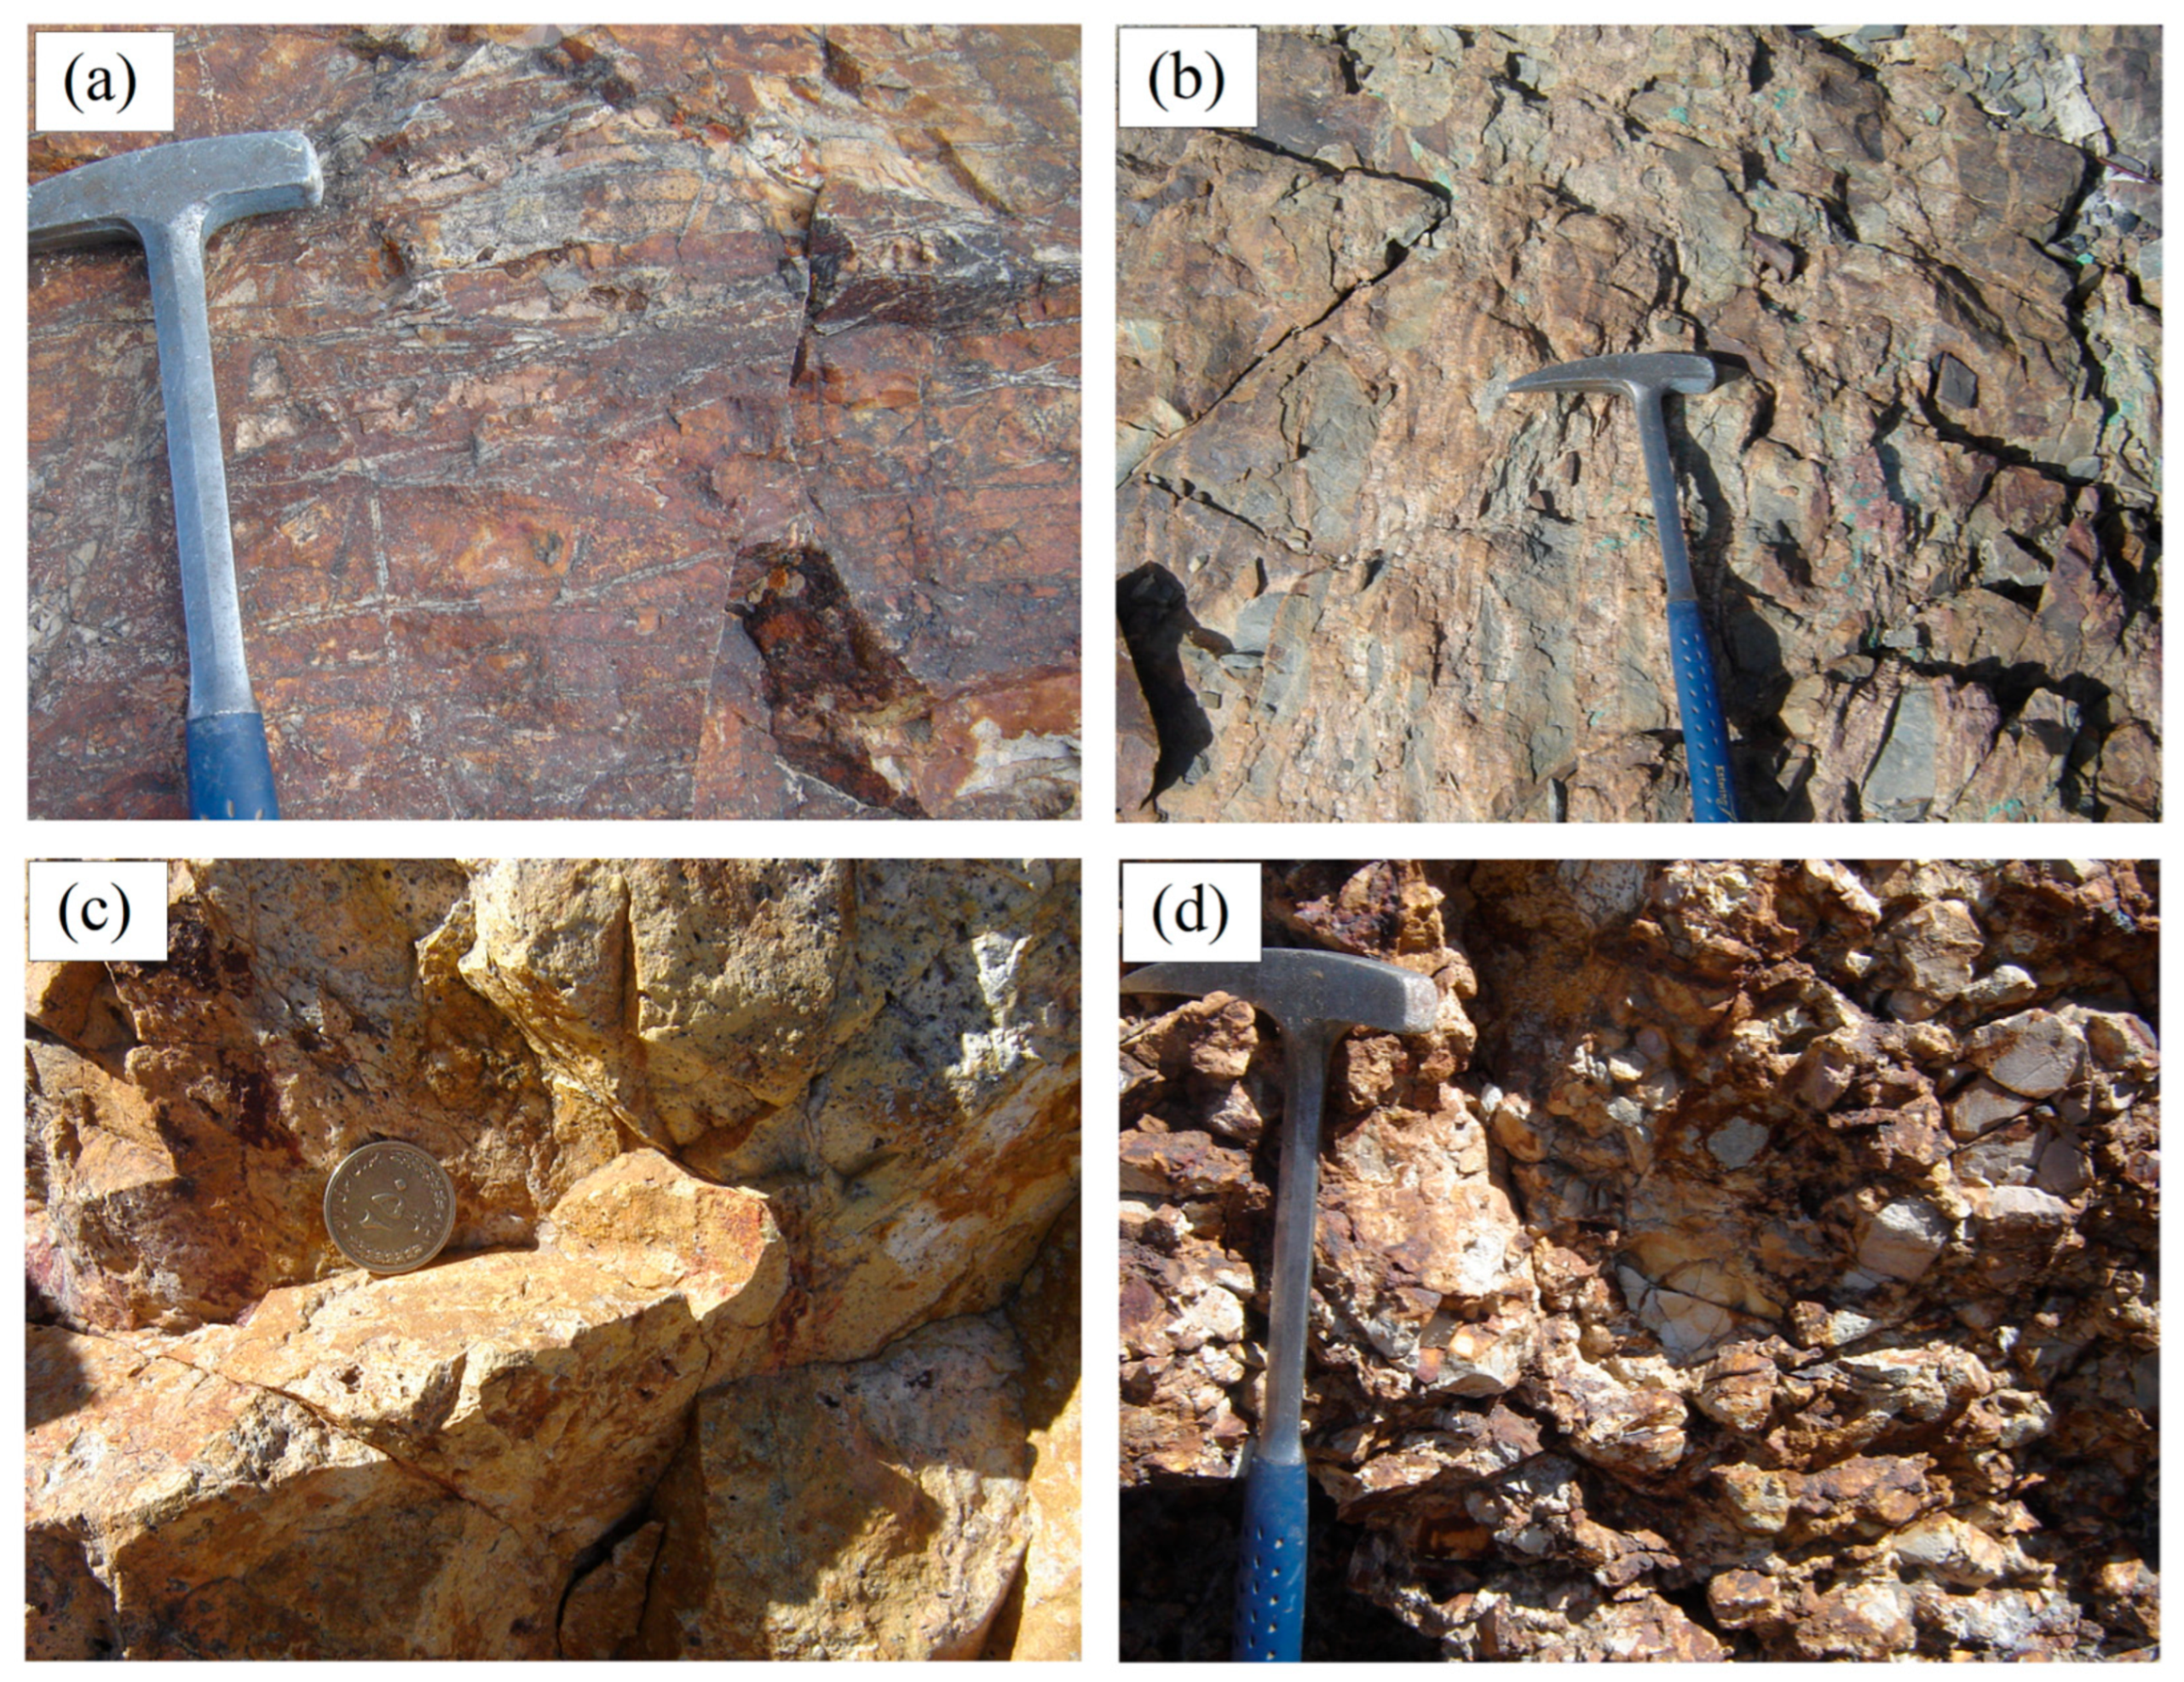
In
Figure 16, quartz stockworks and silicic veins containing copper mineralization are observed in potassic alteration. This image also displays rocks with phyllic alteration, which have a silicified appearance due to the high intensity of quartz stockworks. Brecciation along with silicification is clearly visible in the rocks shown in this image.
Outcrops of argillic and propylitic alteration are shown in
Figure 17. In the same figure, evidence of propylitic alteration is also visible in pyroclastic fragments within the andesite complex, which surrounds the porphyry system.
Figure 18 is devoted to the representation of zones rich in iron oxides within copper mineralization ranges. In this image, hematite is depicted as iron mineralization, and goethite and jarosite are shown as iron oxides. Additionally, veins of iron oxide and their presence within silica veins are illustrated.
5. Discussion
The results of this study show that the combination of MAD methods and DWT is highly efficient in identifying and differentiating hydrothermal alteration zones. The use of the MAD method in the first stage with a threshold of T allowed effective separation of spectral anomalies from the background. While this conservative approach to threshold selection resulted in the identification of fewer pixels, it ensured high confidence in the accuracy of the identified areas. The innovative aspect of this study is the simultaneous use of statistical thresholding (T = mean + 1.5 MAD) and multiscale wavelet analysis, a combination rarely used in previous studies. This integrated framework helped to increase detection accuracy and reduce the number of false positives. In this study, a MAD coefficient of 1.5 was selected, despite the more common use of higher thresholds (e.g., 2 or 3) in geochemical anomaly detection. This choice was based on the nature of satellite DN data, which—unlike geochemical measurements—are more prone to environmental, atmospheric, and sensor-related noise. Although atmospheric and radiometric corrections were applied, the precision of satellite data remains inherently lower than that of geochemical datasets. As a result, using a lower MAD threshold enables better sensitivity to the subtle spectral variations that are important for detecting porphyry copper alteration. Furthermore, this selection aligns with robust statistical practices widely used in disciplines that deal with noisy, non-normally distributed data, making it both methodologically sound and broadly applicable. The application of DWT using the sym4 wavelet in the second stage allowed adequate differentiation between alteration zones based on their thermal properties. The higher accuracy in identifying phyllic alteration (94.96%) compared to propylitic alteration (89.65%) can be attributed to two main factors: firstly, the greater spectral contrast of phyllic alteration with the background rock due to the higher alteration intensity, and secondly, the higher sensitivity of the ASTER SWIR bands to the index minerals of this type of alteration.
The selection of the sym4 wavelet in this study was made after evaluating the performance of different wavelets. Although wavelets such as db1 (Haar wavelet) and db2 are widely used in signal and image processing, the sym4 wavelet showed better performance in extracting spectral features related to porphyry copper alteration in this study. The Haar wavelet, despite its simplicity, was not suitable for detecting gradual changes in alteration patterns, while db2, despite its greater complexity, did not perform as well as sym4 in distinguishing alteration patterns. This suggests that higher wavelet complexity does not necessarily lead to better performance in detecting hydrothermal alterations, but rather that the match between the wavelet structure and the target spectral patterns plays a more important role. Compared to conventional pixel-based classification or spectral clustering methods, the proposed combination of MAD anomaly detection and multiscale wavelet analysis provides better discrimination of overlapping alteration zones while minimizing false positives, especially in spectrally complex terrain. A comparison of the results of this study with previous investigations shows that the proposed combined method offers several significant advantages. First, it leads to a significant reduction in false positive errors, which are a major challenge with single image processing methods. Second, it enables the discrimination of alteration zones based on alteration intensity, which is particularly important in exploration studies. Third, it performs better in areas where alteration zones overlap. Given the arid to semi-arid conditions of the study area and the absence of significant vegetation cover, the influence of environmental noise on the spectral data was minimal. These favorable environmental characteristics contributed to clearer differentiation of alteration-related anomalies and reduced the need for extensive preprocessing (e.g., vegetation masking). The lack of seasonal vegetation variability also ensured more consistent spectral responses across scenes. However, in more humid or vegetated regions, similar approaches would require additional preprocessing steps such as NDVI-based masking, improved atmospheric correction, and possibly multi-temporal analysis to ensure comparable reliability. However, this method also has some limitations. The 30 m spatial resolution of ASTER images can limit the identification of small-scale alteration zones. In addition, the quality of the atmospheric corrections has a direct impact on the accuracy of the results. Although the proposed validation method allows a quantitative assessment of the results, it can sometimes be conservative due to the complex nature of the alteration distribution in the field. Operationally (in terms of mining), the approach could be used in the initial exploration of porphyry copper deposits. Due to its low cost, fast processing, and reasonable accuracy, this method proves to be a simple and fast exploration tool. The biggest advantage is the generalization of this method to other formations in similar geological areas.
Due to the spatial resolution limitations of the SWIR bands of the ASTER sensor (30 m), it is recommended that future studies utilize higher-resolution datasets such as WorldView-3, PRISMA, or airborne hyperspectral imaging systems. Furthermore, integrating ASTER data with Sentinel-2 imagery may offer an effective approach to enhance spatial detail while preserving spectral capability.

