Article

Dehydroxylation of Kaolinite: Evaluation of Activation Energy by Thermogravimetric Analysis and Density Functional Theory Insights

by
Iván Aitor Polcowñuk Iriarte
1,
Anabella Mocciaro
1,2,
Nicolás Maximiliano Rendtorff
1,3 and
Diego Richard
1,3,*
1
Centro de Tecnología de Recursos Minerales y Cerámica (CIC-CONICET La Plata-UNLP), Cno. Centenario y 506, Manuel Bernardo Gonnet 1897, Argentina
2
Facultad de Ingeniería, Universidad Nacional de La Plata, Av. 1 y Calle 47, La Plata 1900, Argentina
3
Facultad de Ciencias Exactas, Universidad Nacional de La Plata, Calle 47 y 115, La Plata 1900, Argentina
*
Author to whom correspondence should be addressed.
Minerals 2025, 15(6), 607; https://doi.org/10.3390/min15060607
Submission received: 23 April 2025 / Revised: 24 May 2025 / Accepted: 3 June 2025 / Published: 4 June 2025
(This article belongs to the Special Issue From Clay Minerals to Ceramics: Progress and Challenges)

Abstract

During the thermal treatment of kaolinite, the main mineral phase in kaolin rock, dehydroxylation occurs, forming metakaolin through a process that has significant industrial applications. This study experimentally analyzed dehydroxylation in two kaolinite samples: a well-crystallized reference sample from the Clay Mineral Society and a locally sourced, industrial kaolin sample. The mechanism and kinetic parameters were evaluated from a series of thermogravimetric measurements. Non-isothermal kinetic analysis revealed that dehydroxylation followed a third-order (F3) reaction mechanism, with activation energies ( E a ) ranging from 35 to 60 kcal/mol. Additionally, theoretical calculations based on Density Functional Theory were performed on four systems in which a water molecule was removed by combining OH group and H atom vacancies in the kaolinite unit cell. These models represented the onset of dehydroxylation and provided values for the reaction energy Q from first-principles calculations, which served as reference values for E a . The results confirm that water molecule formation involving both OH at the kaolinite outer surface and inner surface are energetically competitive and highlight the crucial role of structural relaxations following water removal to determine Q values in the range of 30–50 kcal/mol, in very good agreement with the experiments.

Graphical Abstract

1. Introduction

Clay minerals have played a major role in human history, driving the development of ceramic materials and more [1]. Kaolinite (Al2Si2O5(OH)4), the main crystalline mineral in kaolin rock, is a hydrated aluminosilicate that is widely used across various industries, including ceramics, paper, aluminium production, paint, rubber, plastic, and cosmetics [2,3]. Due to its remarkable versatility, abundant availability, and cost-effectiveness, the global demand for kaolinite is expected to continue growing in the coming years [4,5,6].
The internal structure of kaolinite consists of a 1:1 layer arrangement formed by the repetition of Si tetrahedral and Al octahedral sheets stacked along a c-axis [7]. In this structure, Si atoms are tetrahedrally coordinated by O atoms and Al atoms are octahedrally coordinated by O atoms and OH groups (see Figure 1). Many of the technological and industrial applications of kaolinite require thermal treatments, [8,9,10,11,12,13,14,15,16,17], during which it undergoes dehydroxylation, transforming into metakaolin through the following process [18,19]:
Al 2 Si 2 O 5 ( OH ) 4 450 650   ° C Al 2 Si 2 O 7 + 2 H 2 O ( g )
During this dehydroxylation process, the OH groups split into H+ and O2− ions. The protons migrate to neighboring OH groups to form water molecules, while the remaining O2− ions remain bonded to the lattice. As a result, structural water is lost, and the three-dimensional regularity of kaolinite is broken down. However, the resulting metakaolin retains a two-dimensional order in the a-b plane [18]. The mechanism and kinetics of this process, which are essential for optimizing industrial applications, have been extensively studied.
Over the decades, it has been shown that dehydroxylation depends on different variables, such as the degree of structural disorder in the kaolinite [20,21], heating rate [19], and partial water vapor pressure [22,23]. In addition, kaolinite dehydroxylation is accompanied by both structural delamination, during which, the sheet structure is destroyed, and metakaolin formation via a recombination of the remaining elements to achieve the metakaolin structure, making it a complex phenomenon [19]. Therefore, different approaches to the study of dehydroxylation kinetics have been reported [18]. A common one is through thermogravimetric analysis, as the weight of heated kaolinite decreases with the release of water. Non-isothermal kinetic analyses of thermal decomposition allow for the determination of the overall activation energy of the process [24,25]. However, one of the most challenging tasks is identifying the reaction mechanism that controls the reaction rate constant, for which no general agreement exists [26]. Furthermore, when raw kaolin is studied, the presence of impurities may affect results. Thus, the activation energy values vary among studies depending on the kaolinite sample, experimental procedure, and proposed model for the reaction mechanism. Under standard experimental conditions, typical values for the activation energy range between 40 and 60 kcal/mol [19,24,25,27,28].
On the other hand, computational methods such as those based on Density Functional Theory (DFT) [29,30] have contributed to the understanding of elemental structural properties of kaolinite [31,32,33,34,35,36,37]. Although these methods have proven to be powerful tools for analyzing materials, careful comparison with experimental data is necessary to ensure consistency of the proposed DFT models and their predicted properties. To date, few studies have applied computational methods such as DFT and molecular dynamics to the case of dehydroxylated kaolinite [38,39,40,41], and, to the authors’ knowledge, none has focused specifically on the energy aspects of the dehydroxylation process.
Considering all the above, the aim of this work was to analyze the transformation of kaolinite into metakaolin using a methodology that combined experiments and theoretical calculations based on DFT. Experimentally, thermogravimetric techniques were used in order to assess the activation energy for two kaolinite samples: a well-crystallized reference sample and a locally sourced industrial kaolin sample. This selection aimed to underscore the contrast between a well-characterized standard kaolinite and an industrial-grade material, whose composition, including secondary minerals, realistically reflected the heterogeneous nature of kaolins encountered in practical applications. Due to the complexity of the dehydroxylation process, special attention was paid to its early stages, as these are crucial for accurately describing the phenomenon. DFT was used to assess the reaction energy involved when a water molecule was extracted from the kaolinite structure. Four distinct cases were considered for the formation of a single water molecule by combining species within the kaolinite lattice. The resulting energies provided first-principles benchmarks for idealized structures, advancing beyond previous studies by enabling a direct comparison with experimental activation energies. The DFT predictions deepened our mechanistic understanding of kaolinite dehydroxylation and complemented the experimental kinetic analyses.

2. Materials and Methods

2.1. Studied Samples

There were two kaolin samples used in this work: one well-crystallized reference sample from the Source Clays Repository of The Clay Mineral Society (KGa-1) and a locally used industrial sample labeled Sur del Rio Blanco (SRB), provided by the company Piedra Grande (Avellaneda, Argentina). Table 1 summarizes the chemical and mineralogical compositions of both samples. KGa-1 contained more than 90 wt.% kaolinite, while SRB showed a significant amount of quartz (22 wt.%), which resulted in a higher SiO2 content compared to KGa-1. This compositional contrast between the selected materials served as a basis for comparative analysis and may contribute to strategic decisions in industrial upgrading pathways.
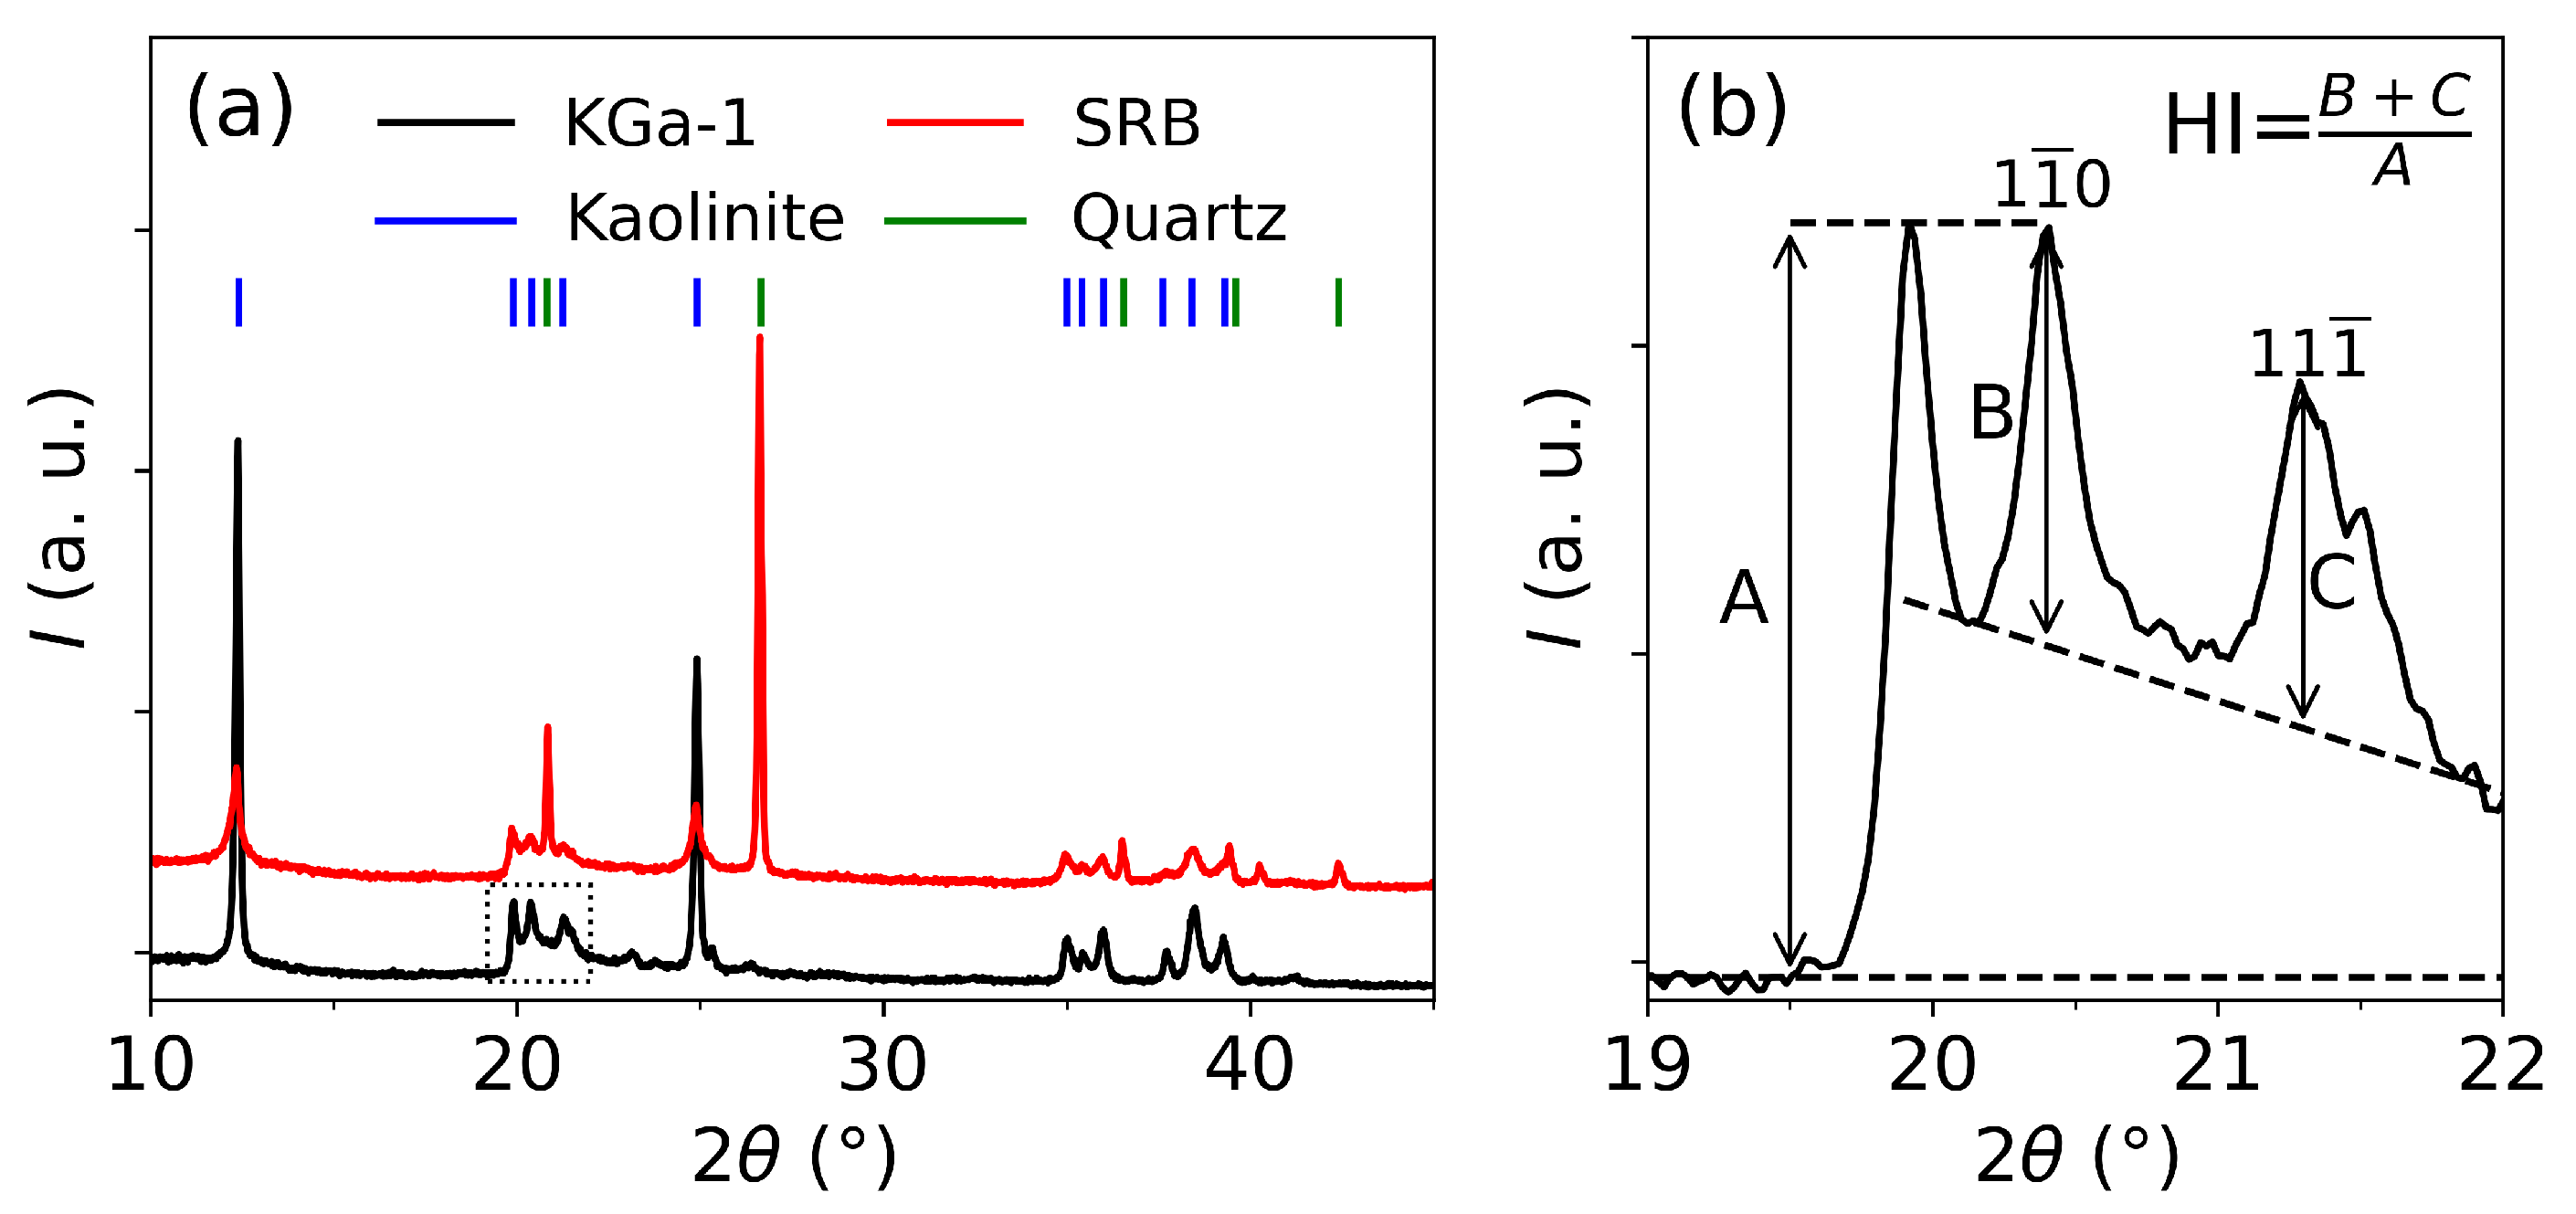
The degree of crystallization of both kaolins was analyzed by X-ray diffraction (XRD; CuKα, 40 kV, 30 mA; Bruker D8 Advance A25, Madison, WI, USA). Figure 2a presents the XRD patterns and reflects the significant presence of quartz in the SRB sample. Crystallinity was assessed using the empirical Hinckley index (HI), based on the heights of the (1 1 ¯ 0) and (11 1 ¯ ) peaks, as indicated in Figure 2b. This index typically ranges between 0.2 and 1.5, and the higher the HI value, the greater the crystallinity and the structural order of the kaolinite [45,46,47]. For the samples studied in this work, HI values of 0.999(9) for KGa-1 and 0.71(1) for SRB were obtained. The particle size distribution was measured using laser diffraction (Malvern Hydro 2000G, Worcestershire, UK). Both samples showed similar particle size distributions, with median diameters (d50) of 6 μm for KGa-1 and 5 μm for SRB and size ranges between 1 and 30 μm in both cases. Therefore, no additional treatment was necessary for the proposed comparative study [24,28].
The kinetics of dehydroxylation were investigated using thermogravimetric analysis (TG) performed with a simultaneous thermogravimetric-differential thermal analyzer (Rigaku Evo plus II, Tokyo, Japan). In each measurement, approximately 20 mg of sample was placed in a platinum crucible and heated up to 800 °C, using heating rates ranging from 3 to 20 °C/min in air. A small sample mass was chosen to minimize mass and heat transfer effects during kaolinite dehydroxylation [26].

2.2. Kinetic Analyses

The TG signal was used to determine the conversion fraction α of dehydroxylated kaolinite:
α ( m ) = m i m m i m f ,
where m, m i , and m f correspond to the instantaneous, initial, and final sample masses, respectively. The initial and final temperatures were assigned to 400 and 700 °C, based on Equation (1). The kinetics of the non-isothermal process could be described by the modified Arrhenius equations:
d α d t = k ( T ) × f ( α ) ,
k ( T ) = A × exp E a R T ,
where T is the absolute temperature, d α / d t is the reaction rate, f ( α ) defines the reaction mechanism, and k ( T ) the temperature-dependent rate constant. A is the pre-exponential frequency factor, E a is the activation energy, and R is the universal gas constant. Under constant heating rate conditions ( β = d T / d t ), Equations (3) and (4) could be rewritten as
β × d α d T = A × exp E a R T × f ( α )
Thus, α ( T ) could be used to determine E a and A from the slope and intercept with the y-axis of the plot of ln [ β × ( d α / d T ) / f ( α ) ] versus 1 / T . To apply this method, an appropriate reaction model f ( α ) needed to be assumed that successfully linearized the plot [50]. Table 2 lists reaction models previously proposed for describing the kaolinite dehydroxylation process.
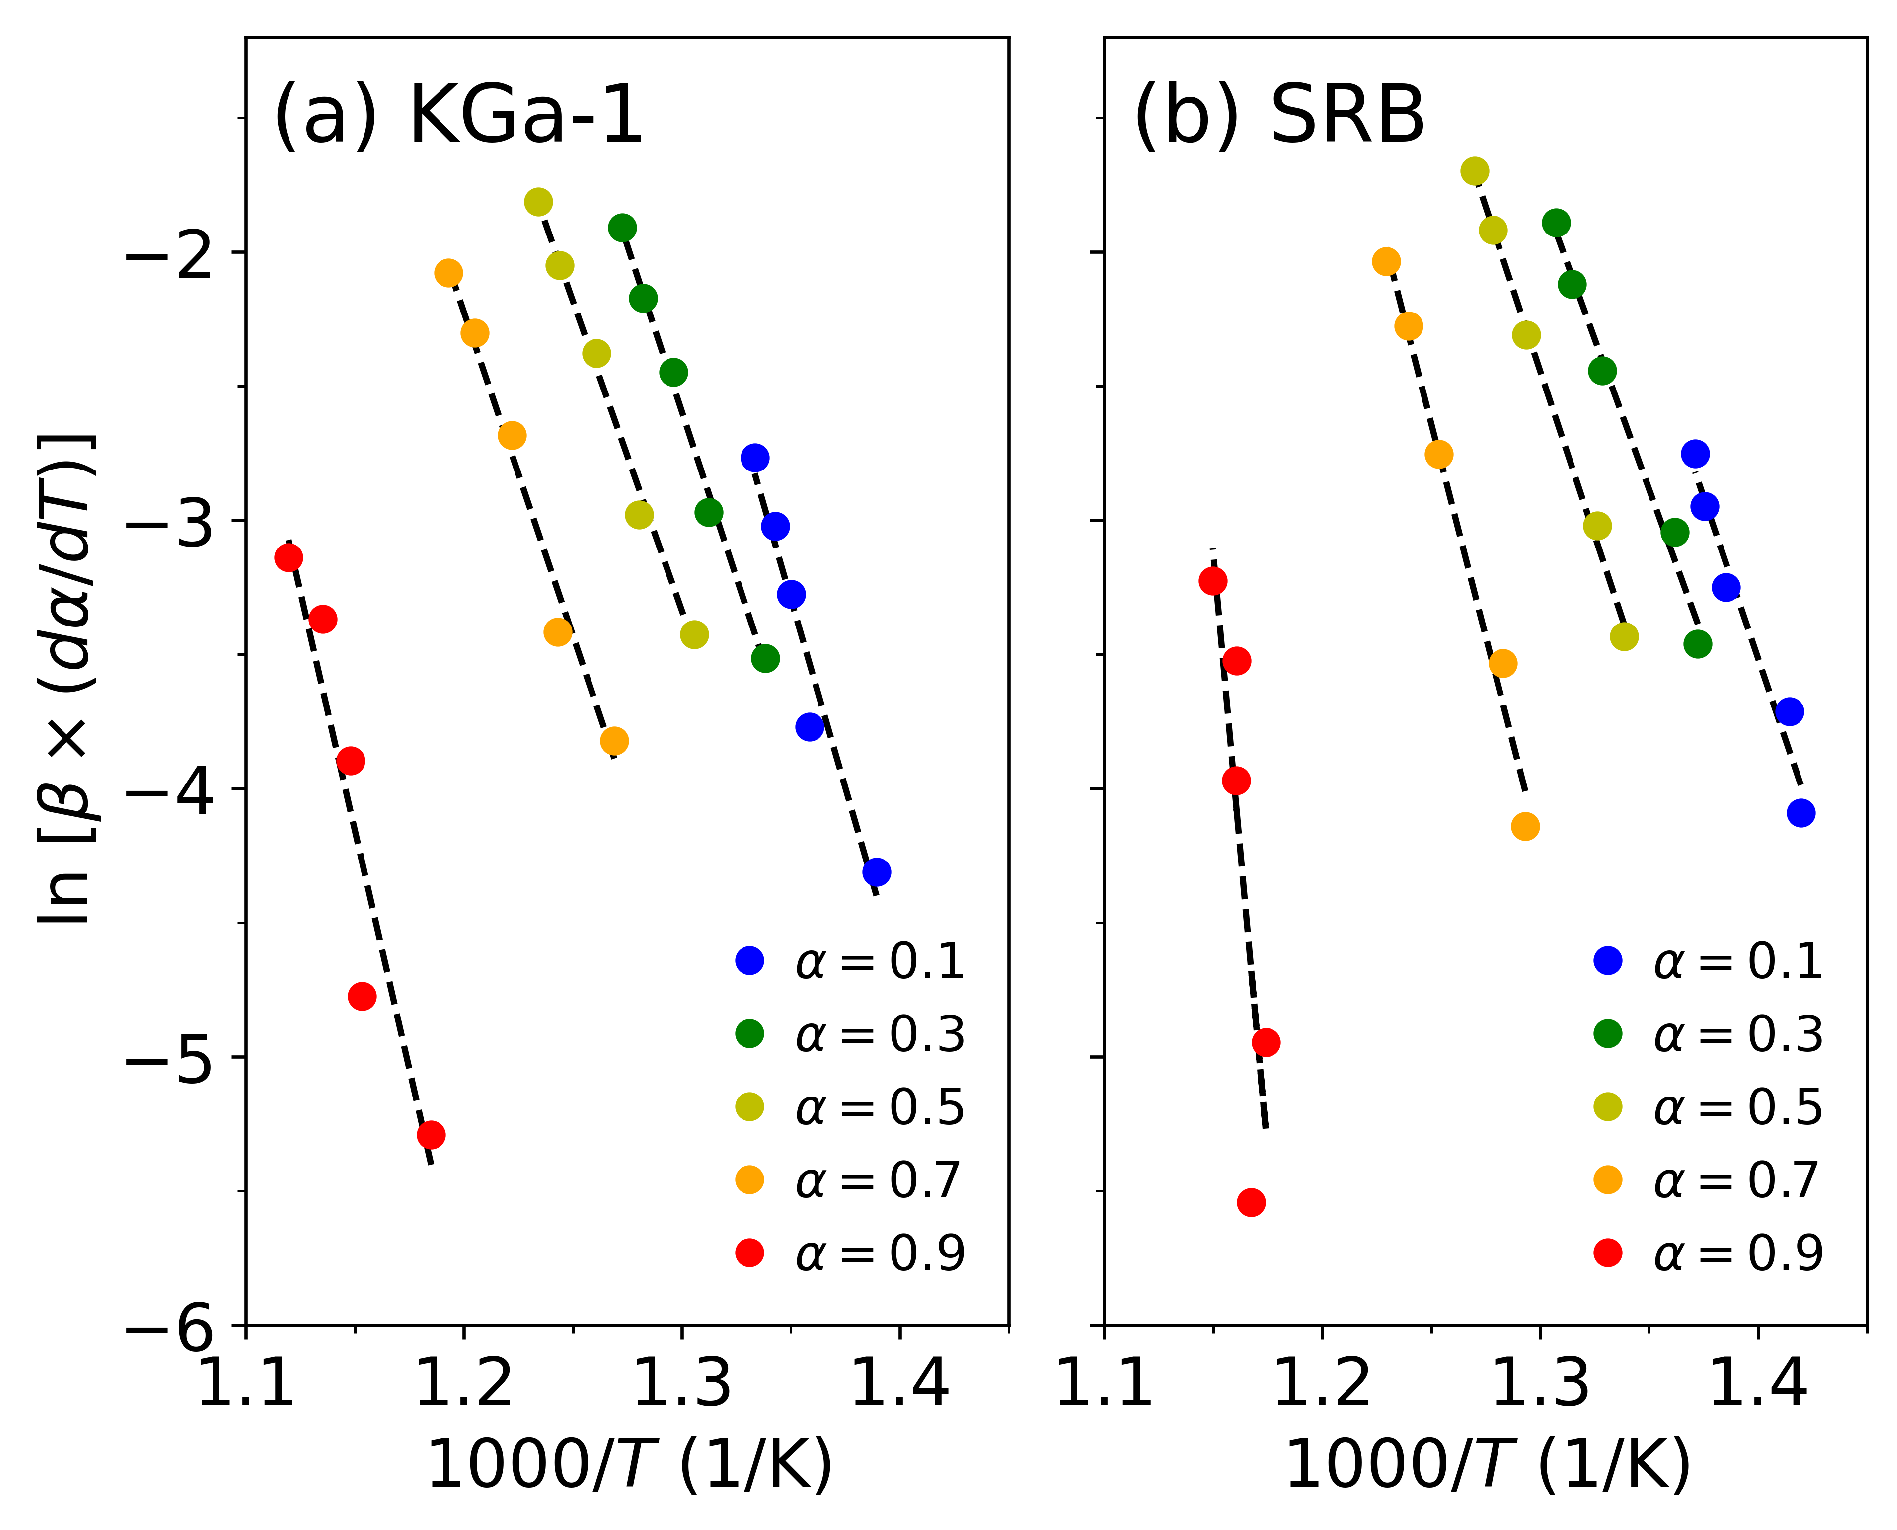
On the other hand, an alternative approach to determine E a from Equation (5), without the need to assume a specific form of f ( α ) , is the iso-conversional method proposed by Friedman [52]. This method requires measuring α ( T ) at different heating rates β and allows for the determination of E a from the slope of the plot of ln [ β × ( d α / d T ) ] versus 1 / T at fixed values of α .

2.3. DFT Calculations

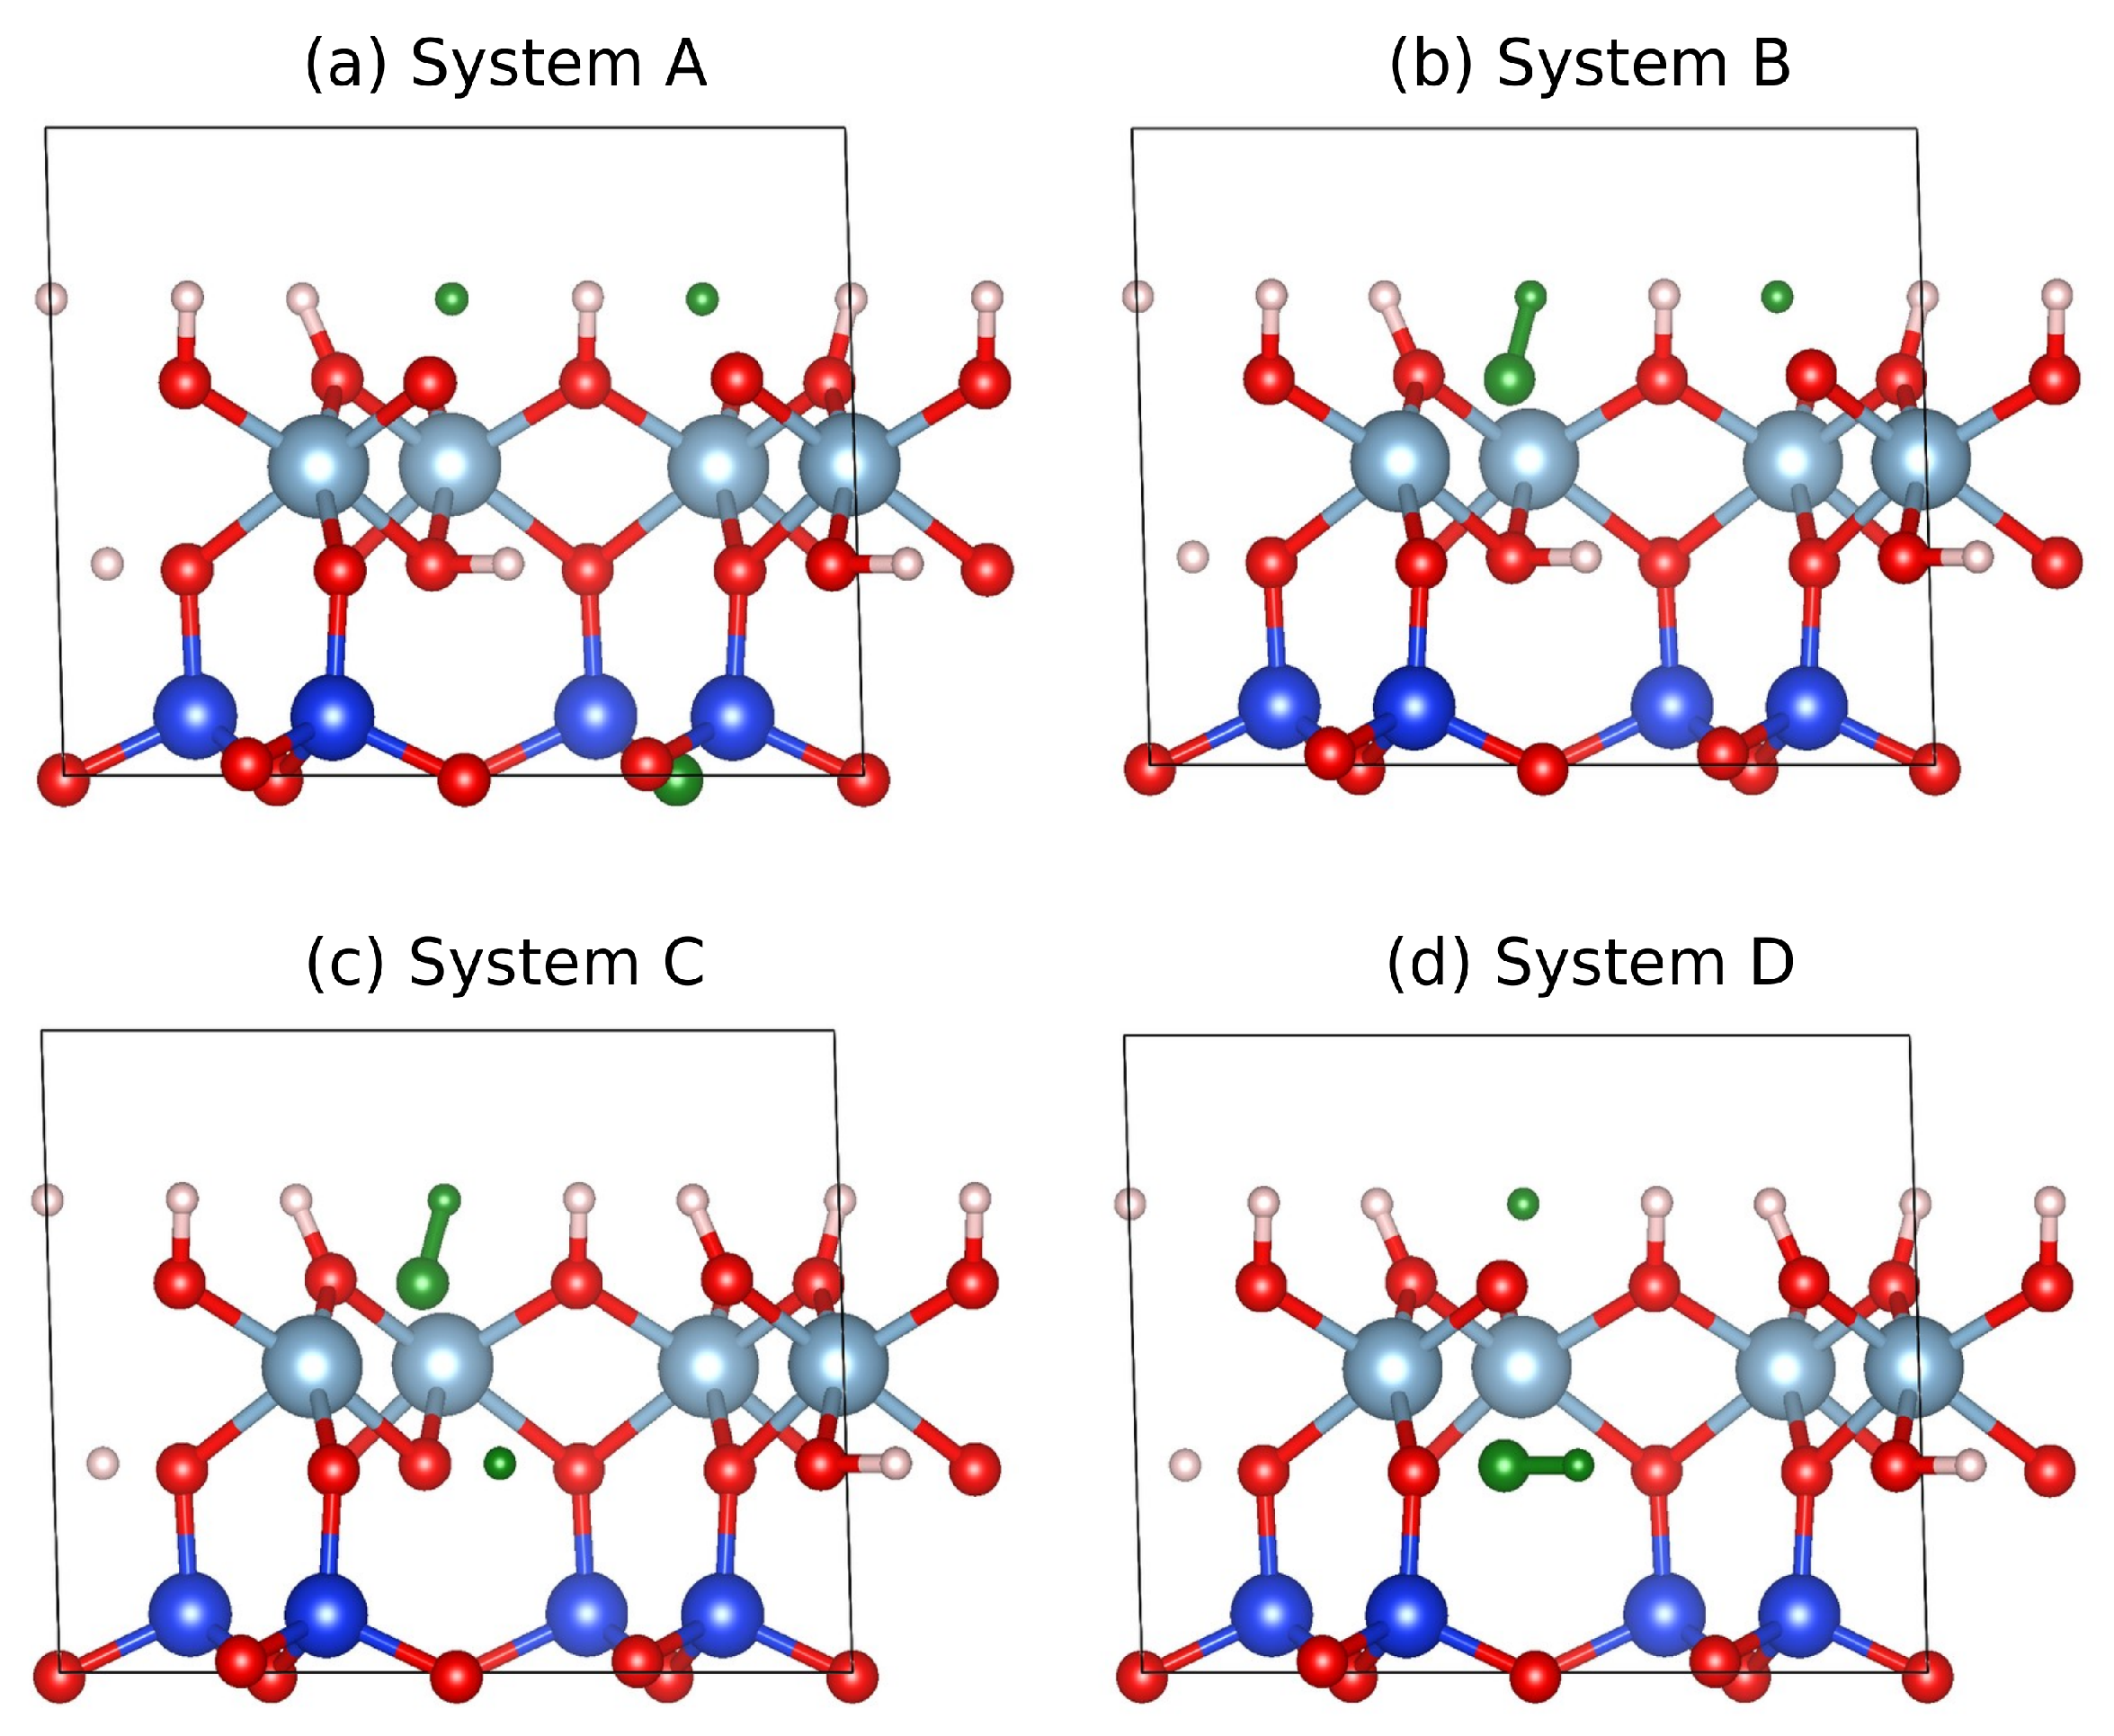
The initial kaolinite unit cell structure from which water molecules were removed was adopted from a previous DFT study [34]. This structure has the following lattice parameters: a = 5.1738 Å, b = 8.9850 Å, c = 7.3522 Å, α = 91.684°, β = 105.128°, and γ = 89.755°. Its internal atomic positions correspond to atomic environments that are in good agreement with available experimental data [34]. Different mono-dehydrated variants were modeled to simulate the removal of a single water molecule. Considering that the kaolinite structure has two types of hydroxyl groups (at the outer and inner surface, see Figure 1) and two types of oxygen atoms (bonded to Al or Si atoms), four combinations were proposed for the removal of the H2O molecule from the structure. These were labeled as Systems A, B, C, and D and are illustrated in Figure 3. In System A, the O and H vacancies corresponded to the Si environment and outer surface, respectively (Figure 3a). In System B, a OH group and H atom from the outer surface were removed (Figure 3b). System C involved the removal of an outer OH group and inner H atom (Figure 3c). Finally, System D corresponded to vacancies at an inner OH group and outer H atom (Figure 3d). These selected idealized mono-dehydrated scenarios were intentionally diverse to assess theoretically the differences in the first step of the dehydroxylation process. Conversely, real dehydroxylation experiments involved the removal of multiple water molecules in a material with impurities and defects.
DFT calculations were performed using the open-source code Quantum ESPRESSO v.7.1, which is based on pseudopotentials and plane-waves [53] and has, in previous studies, shown good results in predicting kaolinite properties [34,35,36]. Generalized gradient approximation pseudopotentials were used [54], considering the valence states Si(3s, 3p), Al(3s, 3p), O(2s, 2p), and H(1s). Converged calculations were obtained using a k-point sampling with Monkhorst-Pack grid of 4 × 4 × 4 and a kinetic energy cutoff of 150 Ry. Systems A-D were structurally optimized via variable cell relaxations, considering convergence when total energy differences were below 1 meV, and all atomic forces were below 0.025 eV/Å. The reaction energy Q was calculated as
Q = E s y s + E w a t E k a o ,
where E k a o is the total energy of the starting kaolinite unit cell, E s y s is the energy of each mono-dehydrated system (A–D), and E w a t is the energy of an isolated water molecule, modeled as a periodic system with 13 Å intermolecular separation [55]. The selected mono-dehydrated kaolinite variants covered a wide range of plausible dehydration scenarios and provided reference Q values against which the experimental results could be compared.

3. Results

3.1. Dehydroxylation in KGa-1 and SRB

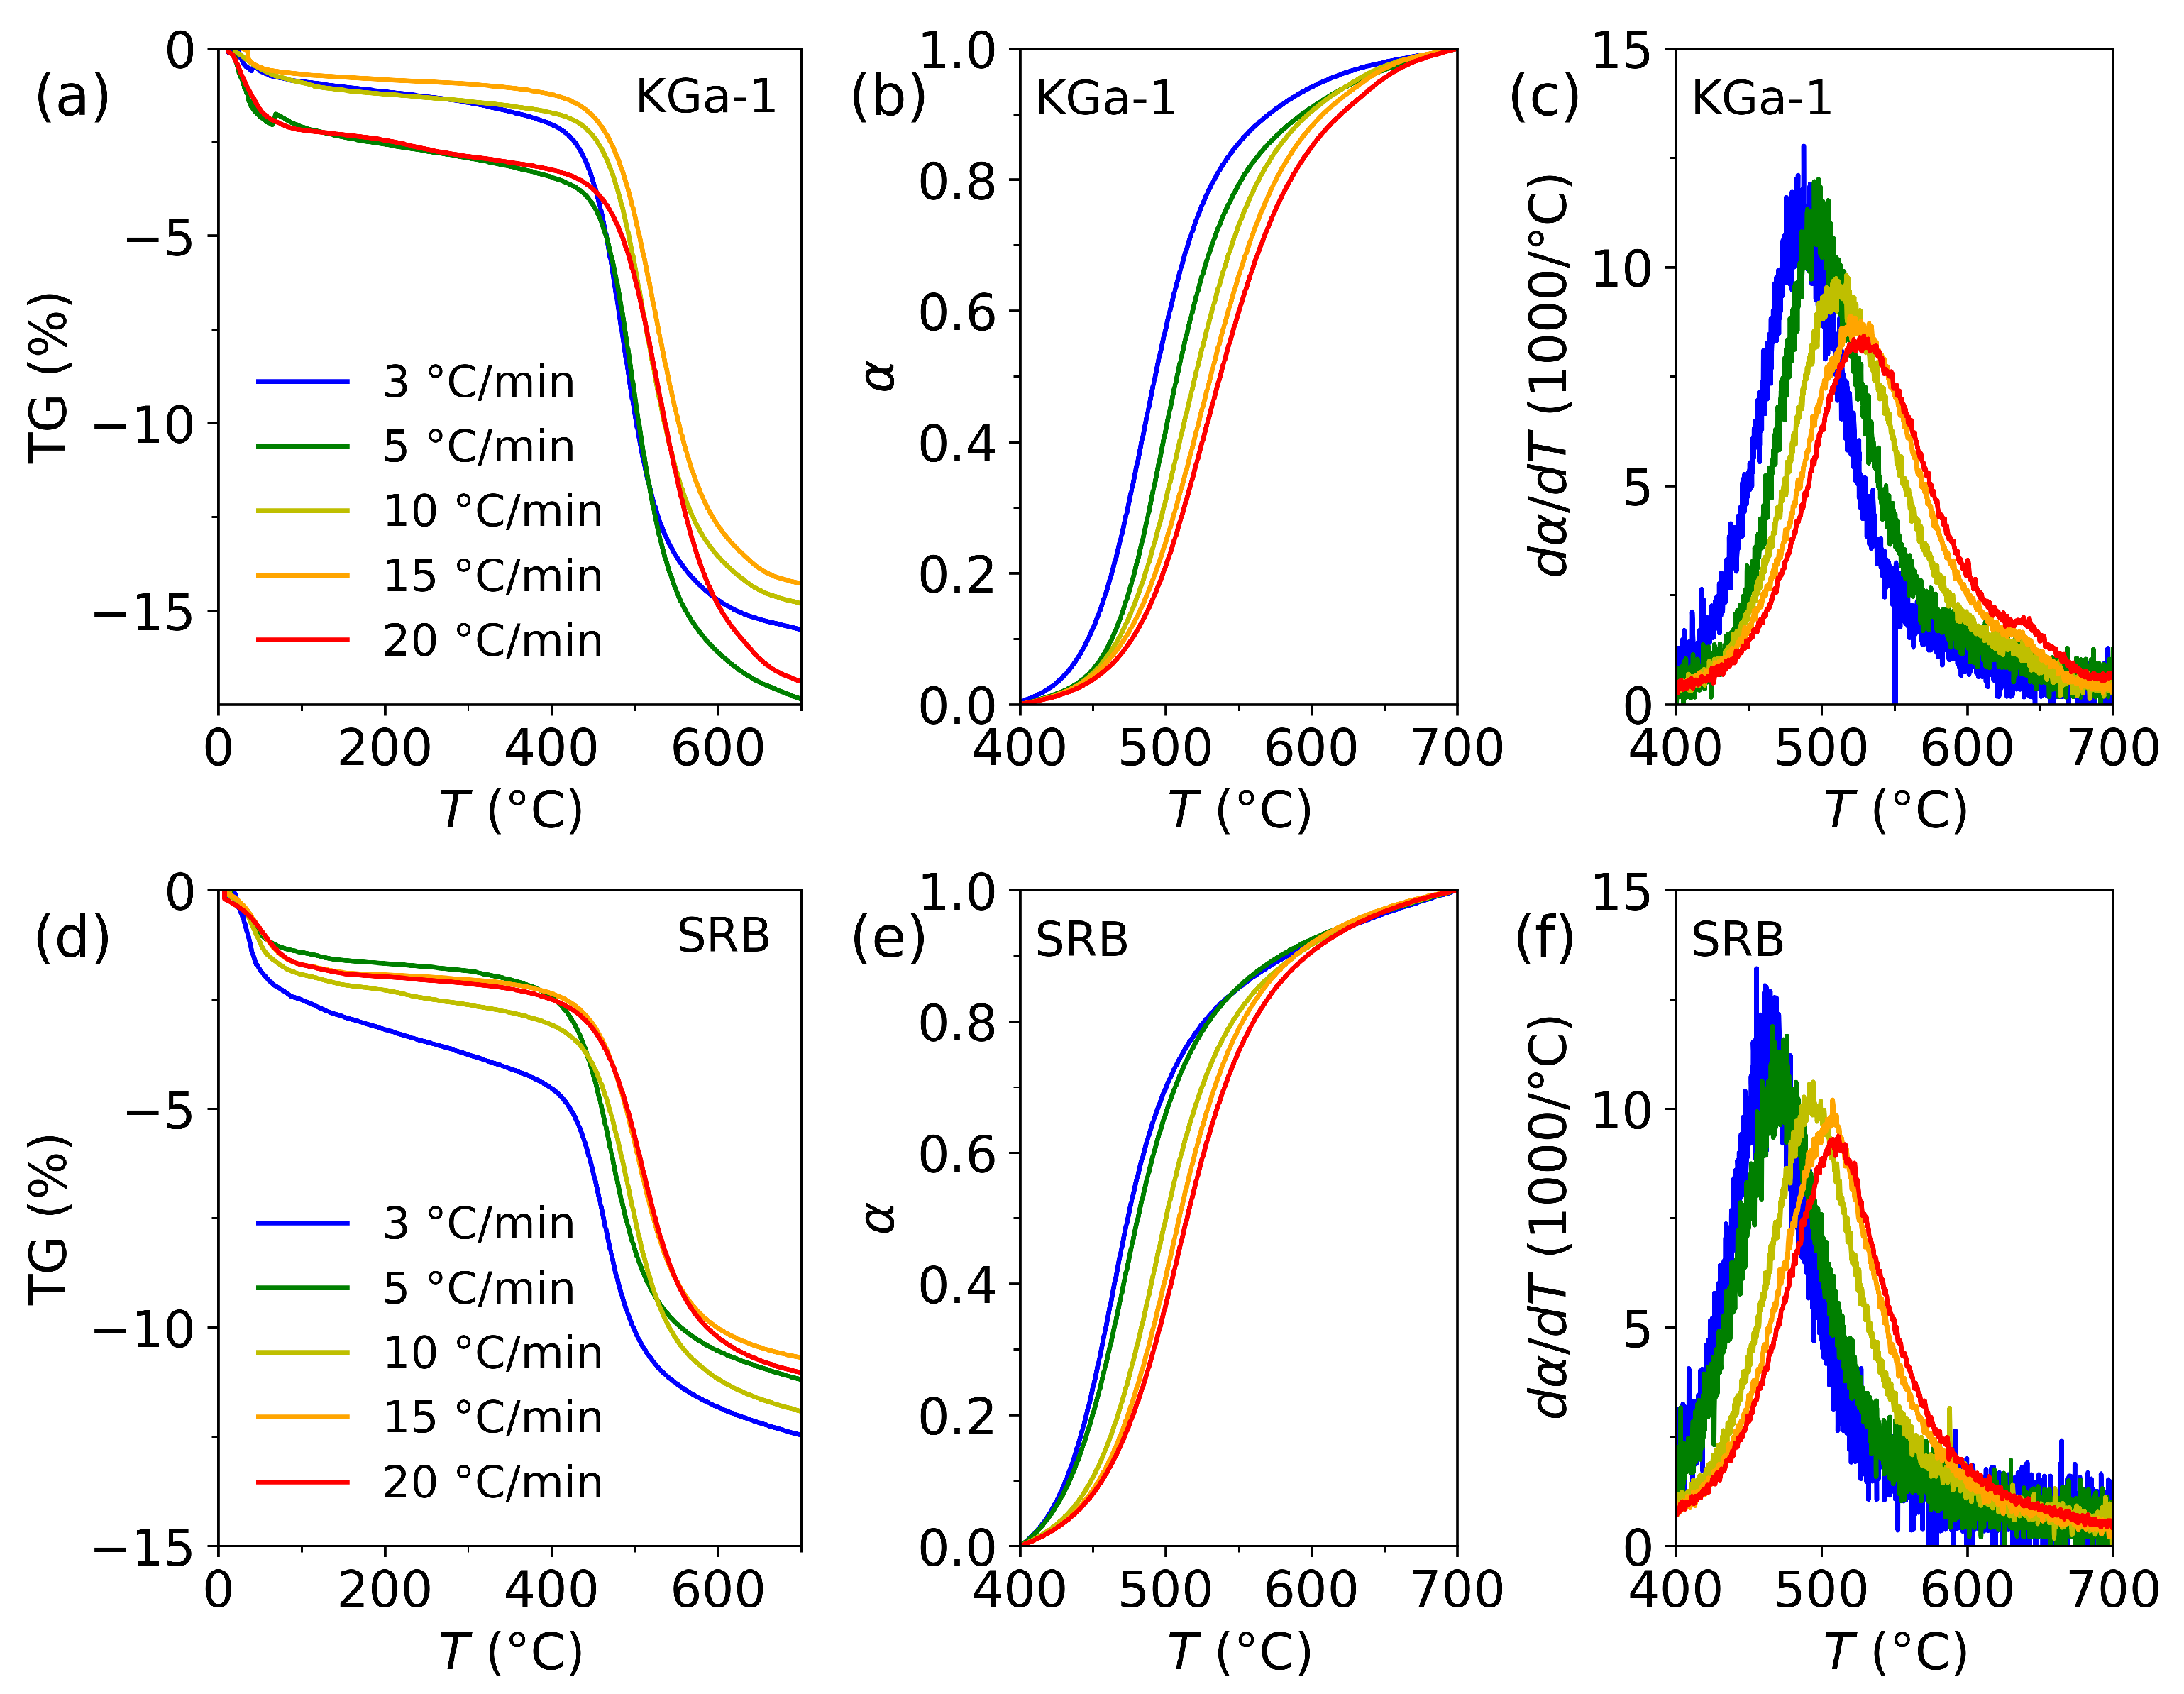
In Figure 4a, TG curves for KGa-1 at different heating rates β are presented, measured in the temperature range from room temperature to 700 °C. Up to 150 °C, a drying process took place in which the water adsorbed on the sample was released, with a mass loss of about 1–2 wt.%. After that, in the temperature range of 400–700 °C, kaolinite dehydroxylation was observed, with a mass loss of about 13 wt.%. This value was consistent with the theoretical value of 13.96 wt.% for the dehydroxylation reaction of Equation (1). As expected, the mass loss step in the TG curves of Figure 4a shifted towards higher temperatures as the heating rate β increased. This shift was better observed through the dehydroxylation fraction α , calculated using Equation (2) and shown in Figure 4b for the different β values. When β = 3 °C/min, the temperature corresponding to α = 0.5 was 493 °C, which shifted to 537 °C for β = 20 °C/min, giving a temperature span of 44 °C, a result comparable to those reported in previous studies [24,28]. Figure 4c shows the reaction rate d α / d T for KGa-1, revealing that the maximum rate (near α = 0.5) slightly decreased with increasing β . Moreover, the d α / d T curves were asymmetric, a feature also visible in the sigmoid-like behavior of α ( T ) , represented in Figure 4b. Figure 4d–f present analogous results for the SRB kaolin. The TG signal showed a mass loss of about 9 wt.% in the dehydroxylation range, reflecting the presence of quartz and other impurities in the clay, which reduced the observed mass loss compared to that of pure kaolinite. This measured mass loss was often used to estimate the kaolinite content by comparison to the theoretical value of 13.96 wt.%. From all TG curves, shown in Figure 4d, a mean value of 63 wt.% of kaolinite in SRB was obtained, which aligned reasonably well with the XRD data, shown in Table 1. The α ( T ) and d α / d T curves for SRB indicated that dehydroxylation occurred at lower temperatures than in KGa-1, suggesting lower activation energies. For instance, for β = 3 °C/min, the temperature corresponding to α = 0.5 was 474 °C, while, for β = 20 °C/min was 514 °C, both about 20 °C lower than those of KGa-1. This supported the observation of higher reactivity in SRB, possibly linked to structural features such as crystallinity. Finally, for high heating rates, the reaction rate curve for KGa-1 (Figure 4c) showed a small shoulder peak between 600 and 700 °C, which was absent in SRB (Figure 4f). This feature was likely related to the higher crystallinity and purity of KGa-1, where delamination processes at elevated heating rates could locally overlap with dehydroxylation [19], slightly modifying the reaction profile. Given their subtle nature, these shoulders were considered a secondary feature in the overall kinetic analysis, but they suggested the use of low heating rates to more accurately track kaolinite dehydroxylation.

3.2. Search for the Kinetic Reaction Mechanism f ( α )

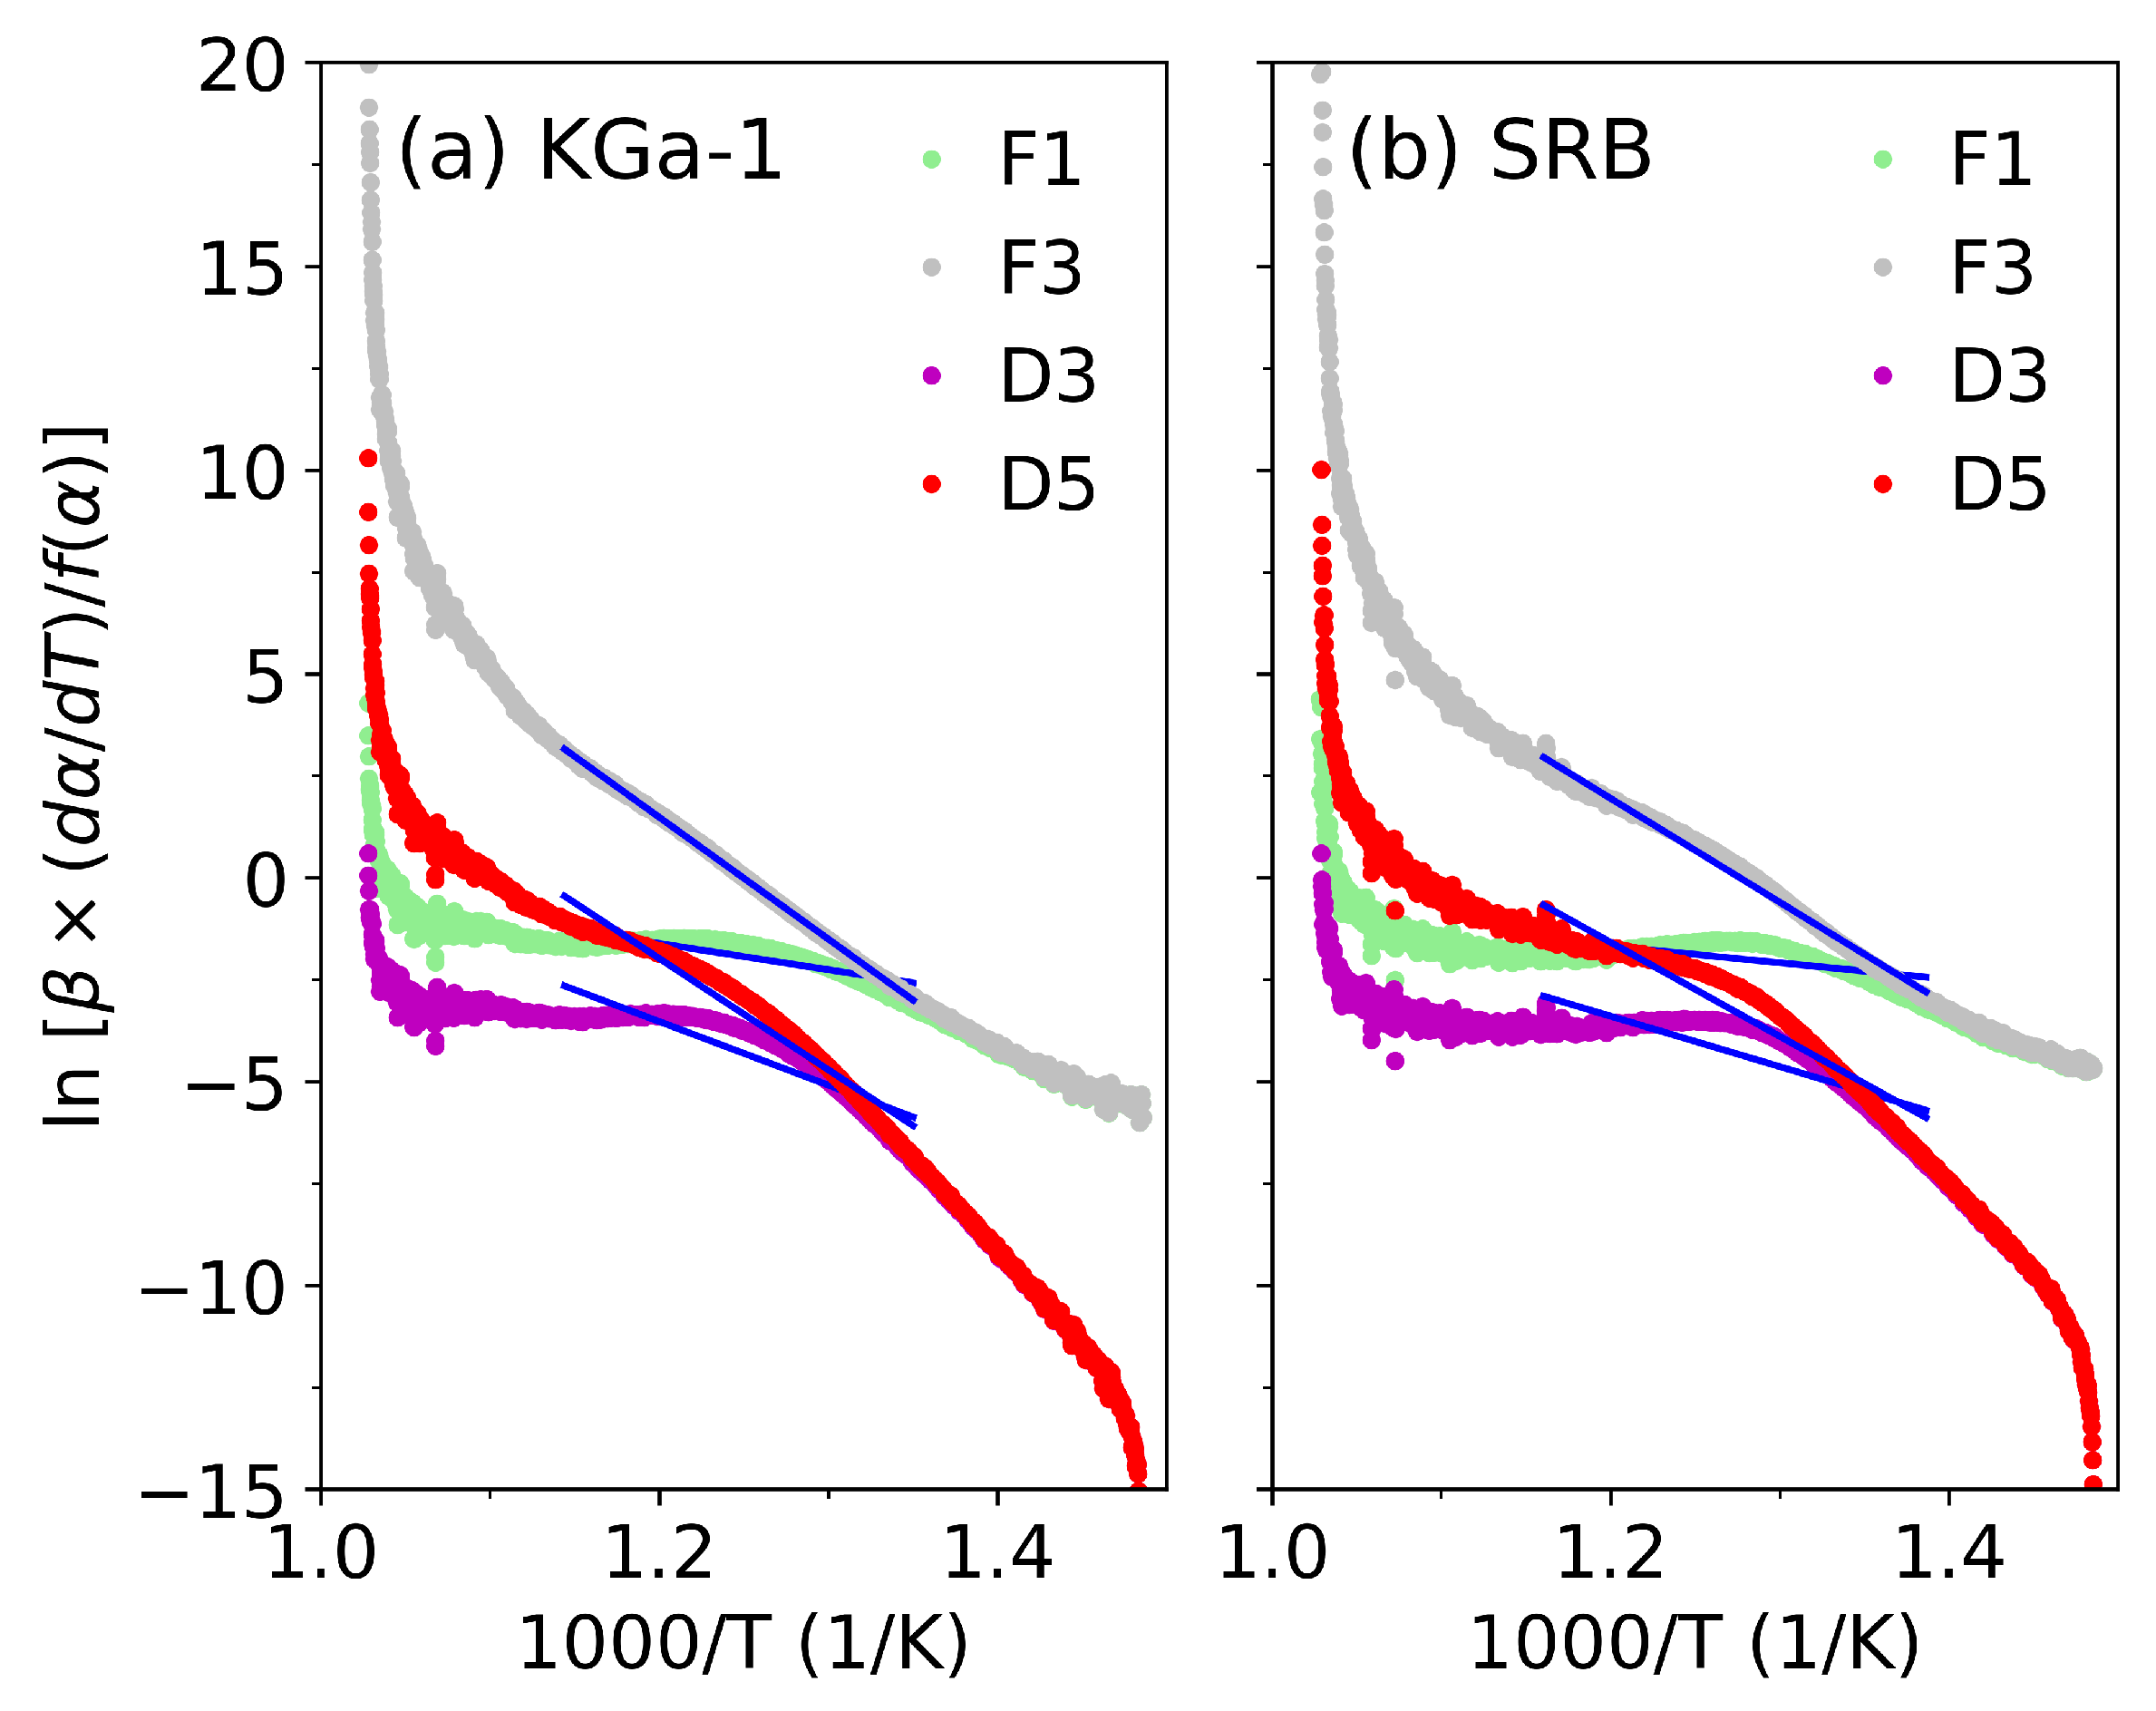
The obtained α ( T ) curves were used to obtain the activation energy E a and the exponential pre-exponential factor A using Equation (4). To do so, the reaction models f ( α ) listed in Table 2 were used to linearize the data via Equation (3) by plotting ln [ β × ( d α / d T ) / f ( α ) ] versus 1 / T . Representative results are shown in Figure 5 for both samples at β = 10 °C/min, covering the entire conversion range (400–700 °C). As seen, none of the proposed models linearized the entire temperature interval. Nevertheless, the central region—where dehydroxylation predominantly occurred—was the most relevant. Models F1 and D3 displayed noticeable curvature in this region, while, for D5, the curvature was less pronounced, and F3 appeared nearly linear, especially in KGa-1. To quantify this, linear fits were applied to the temperature interval corresponding to α = 0.1–0.9. These fits are represented by straight blue lines in Figure 5, and their determination coefficient R 2 values are listed in Table 3, along with those for other heating rates β . In all cases, the third-order reaction model (F3) provided the best linearization, in general with R 2 > 0.98. This supports the use of a single kinetic triplet ( E a , A, and f ( α ) ) with the F3 model to describe dehydroxylation in the α = 0.1–0.9 interval. Such agreement suggests that a unified reaction mechanism dominates throughout this stage of the process, where E a expresses its overall activation energy. This F3 kinetic behavior implies a homogeneous volumetric reaction in which the structural water is uniformly removed, following a bulk-controlled mechanism that is not limited by surface phenomena or diffusion effects.
Figure 6a shows the activation energy E a values obtained at different heating rates β , which were in the range of 52–60 kcal/mol for KGa-1 and 35–56 kcal/mol for SRB. In general, E a values were consistently higher for KGa-1 than for SRB, with differences of up to about 20 kcal/mol observed at lower β values. This behavior was consistent with the shifts to lower temperatures observed in the α ( T ) curves of Figure 4 and could be related to the lower crystallinity index HI of SRB compared to KGa-1. Lower crystallinity suggests a greater degree of structural distortion [47], which increases the reactivity of kaolin and reduces the energy barrier required for dehydroxylation. In addition, Figure 6a reveals that E a in SRB was more sensitive to β , showing a stronger dependence than in KGa-1. This may indicate the influence of secondary processes occurring at higher heating rates, likely related to the presence of quartz and other impurities. For instance, at about 600 °C, α - β -phase quartz transition occurred [19,56], which produced a dilatometric expansion that could modify the thermal diffusivity in the sample [57]. This could lead to heat and mass transfer effects in the kaolin sample that distorted the primary kinetic mechanism at elevated reaction rates. Such behavior highlights the complex interplay between microstructural features and thermal response in natural kaolins. Since industrial kaolins often contain accessory minerals or are mixed with other raw materials, these results highlight the value of assessing E a in detail and point to the possibility of tuning the thermal response through material formulation. In particular, the two studied kaolins of this work presented notable differences in kaolinite content (see Table 1), which lead to differences in E a , as observed in Figure 6a. These activation energies values were in very good agreement with those reported in the literature for other kaolins under similar experimental conditions, typically ranging from 40 to 60 kcal/mol [19,24,27,28].
The pre-exponential factor A is shown in Figure 6b on a semi-logarithmic scale. It displayed similar trends to those of E a , a result of the kinetic compensation effect: E a was derived from the negative slope of the linear fit to the data (see Figure 5), while ln A came from the y-intercept. Therefore, higher E a values naturally corresponded to higher A values [58,59]. As observed in Figure 6b, for KGa-1, the A values ranged between 1014 and 1016 1/min, while, for SRB, the values spanned a broader range of 1010–1016 1/min, showing a more pronounced increase with β . These values were in good agreement with those of previous studies that also employed the F3 model, in which A values were reported in the range of 109–1017 1/min [24,28]. This consistency further supports the suitability of the F3 reaction model to describe kaolinite dehydroxylation in both types of sample.

3.3. Isoconversional Method Results

The model-free isoconversional method was employed to determine the variation of the activation energy with conversion, i.e., E a ( α ) . Figure 7 shows plots of ln [ β × ( d α / d T ) ] versus 1 / T for both samples at fixed α values between 0.1 and 0.9. The data followed linear trends, particularly for α close to 0.5, which corresponded to the most well-defined region of the α ( T ) curve for d α / d T estimation (see Figure 4c,f). The nearly constant slopes in Figure 7a imply a uniform E a throughout much of the conversion range, suggesting a stable mechanism. Figure 7b shows a similar trend for SRB, but with a slight slope increase as α increased, suggesting a more pronounced increase in E a .
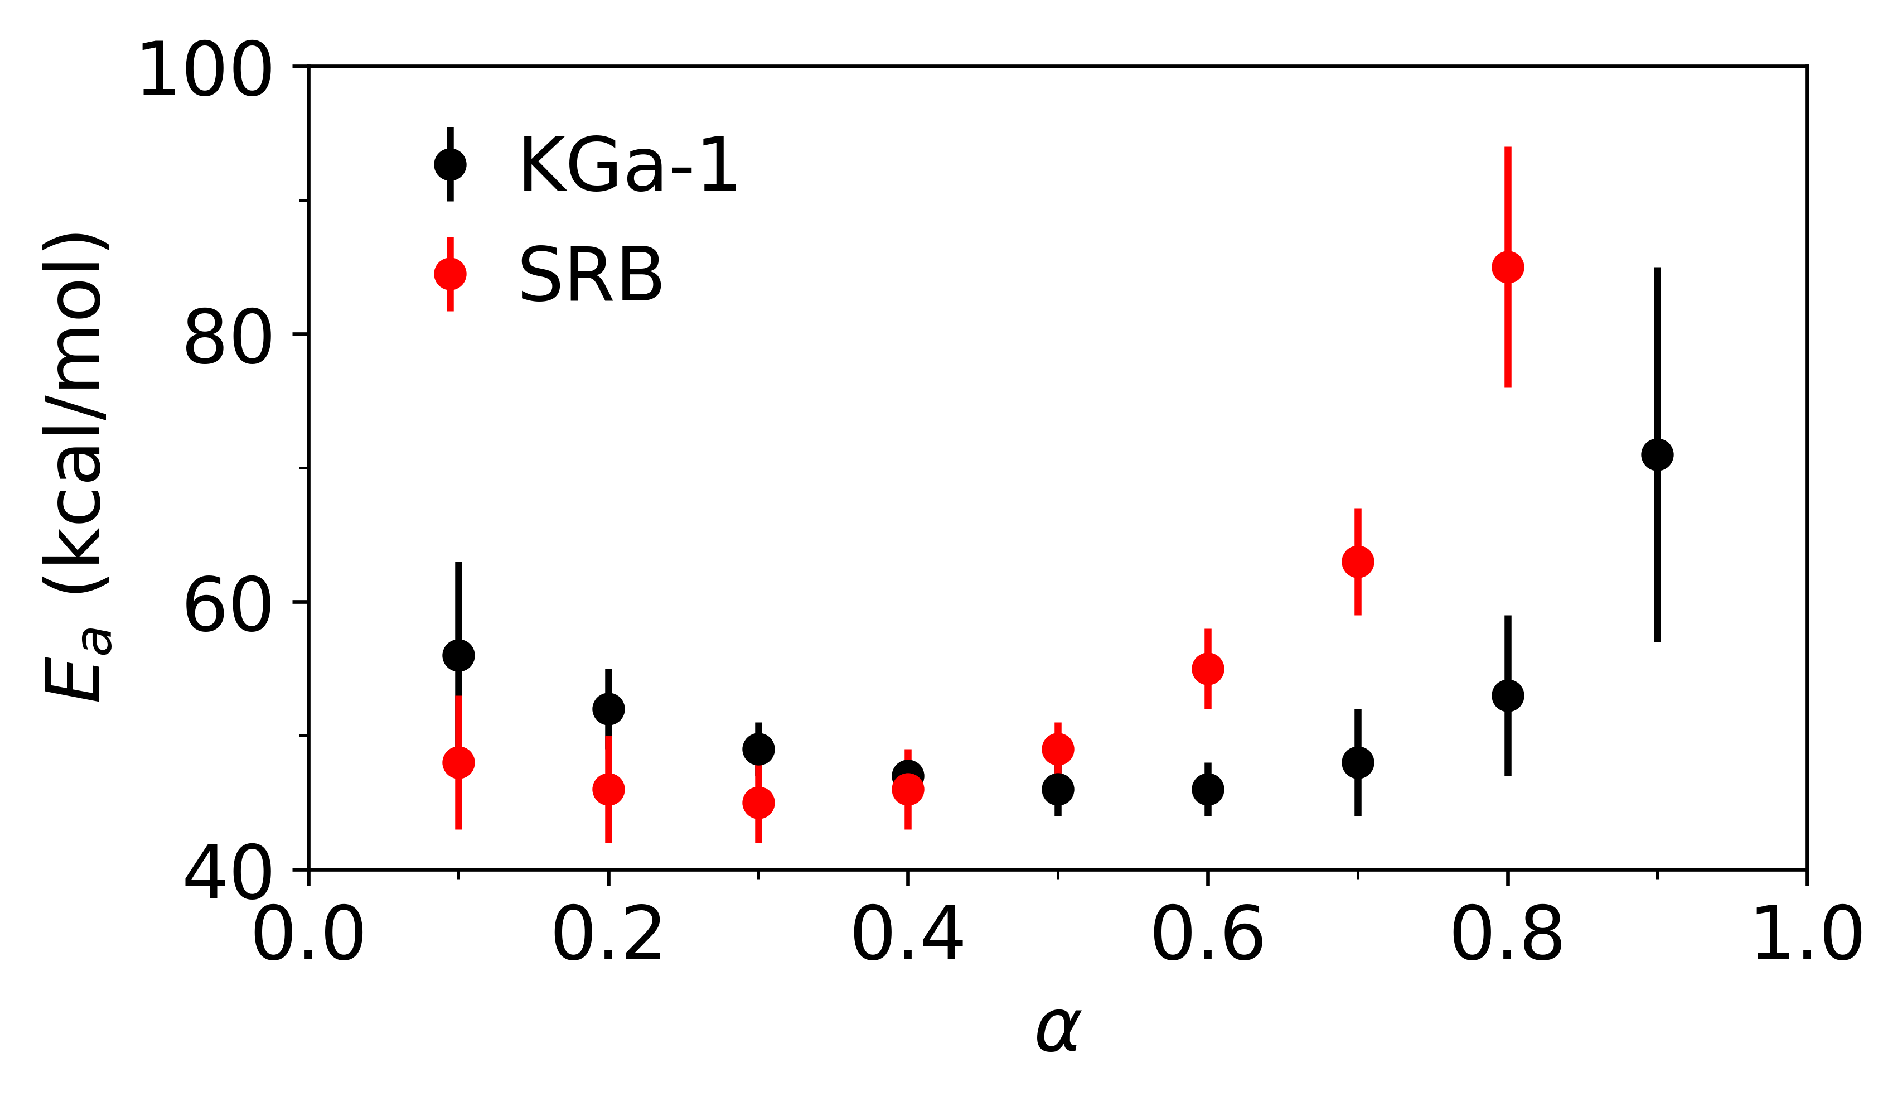
Figure 8 summarizes the E a versus α values. In the range α = 0.1–0.7, both samples exhibited E a values of 45–60 kcal/mol, with SRB generally showing slightly lower E a in the early stages ( α < 0.4). However, from α = 0.5 onward, this reversed, and E a for SRB increased more sharply, particularly beyond α = 0.7, where error bars also increased. This change may have been due to the already mentioned onset of additional mechanisms beyond kaolinite dehydroxylation. The nearly constant E a for a wide range of conversion α aligned with the proposal of a single reaction mechanism, as previously deduced using the non-isothermal F3 model. The results in Figure 8 are consistent with the non-isothermal findings shown in Figure 6a, where SRB showed lower E a at low β (within the range of 35–55 kcal/mol), converging with KGa-1 values at higher β . This was likely due to the increased conversion attained at high β . Since high α values corresponded to higher E a (Figure 8), the average E a captured by the non-isothermal method increased with β , especially in SRB. This highlights the importance of using low heating rates (5 °C/min or below) to characterize kaolinite dehydroxylation reliably, an observation that has also been reported by other authors [23,24]. On the contrary, higher rates may introduce artifacts from competing processes, such as kaolinite delamination [19], an issue that was not further explored in this work since this stage corresponds to an advance stage of the dehydroxylation process, which was outside of the scope of the present study. A more thorough investigation using other experimental techniques may provide additional insights to fully understand the thermal response at these higher heating rates.
Finally, the experimental E a values revealed a nuanced balance between compositional complexity and the structural order of the kaolinite phase: despite SRB presenting a higher quartz content, its lower crystallinity led to enhanced reactivity (a potential strength). However, the presence of accessory minerals may still pose challenges for achieving consistent product properties during thermal processing (a potential weakness).

3.4. DFT Results

Table 4 presents the unit cell parameters for kaolinite and mono-dehydrated Systems A–D, along with the corresponding total energies before and after structural relaxation ( E b e f o r e and E a f t e r , respectively). The obtained internal atomic coordinates are provided as Supplementary Materials (see Tables S1–S5).
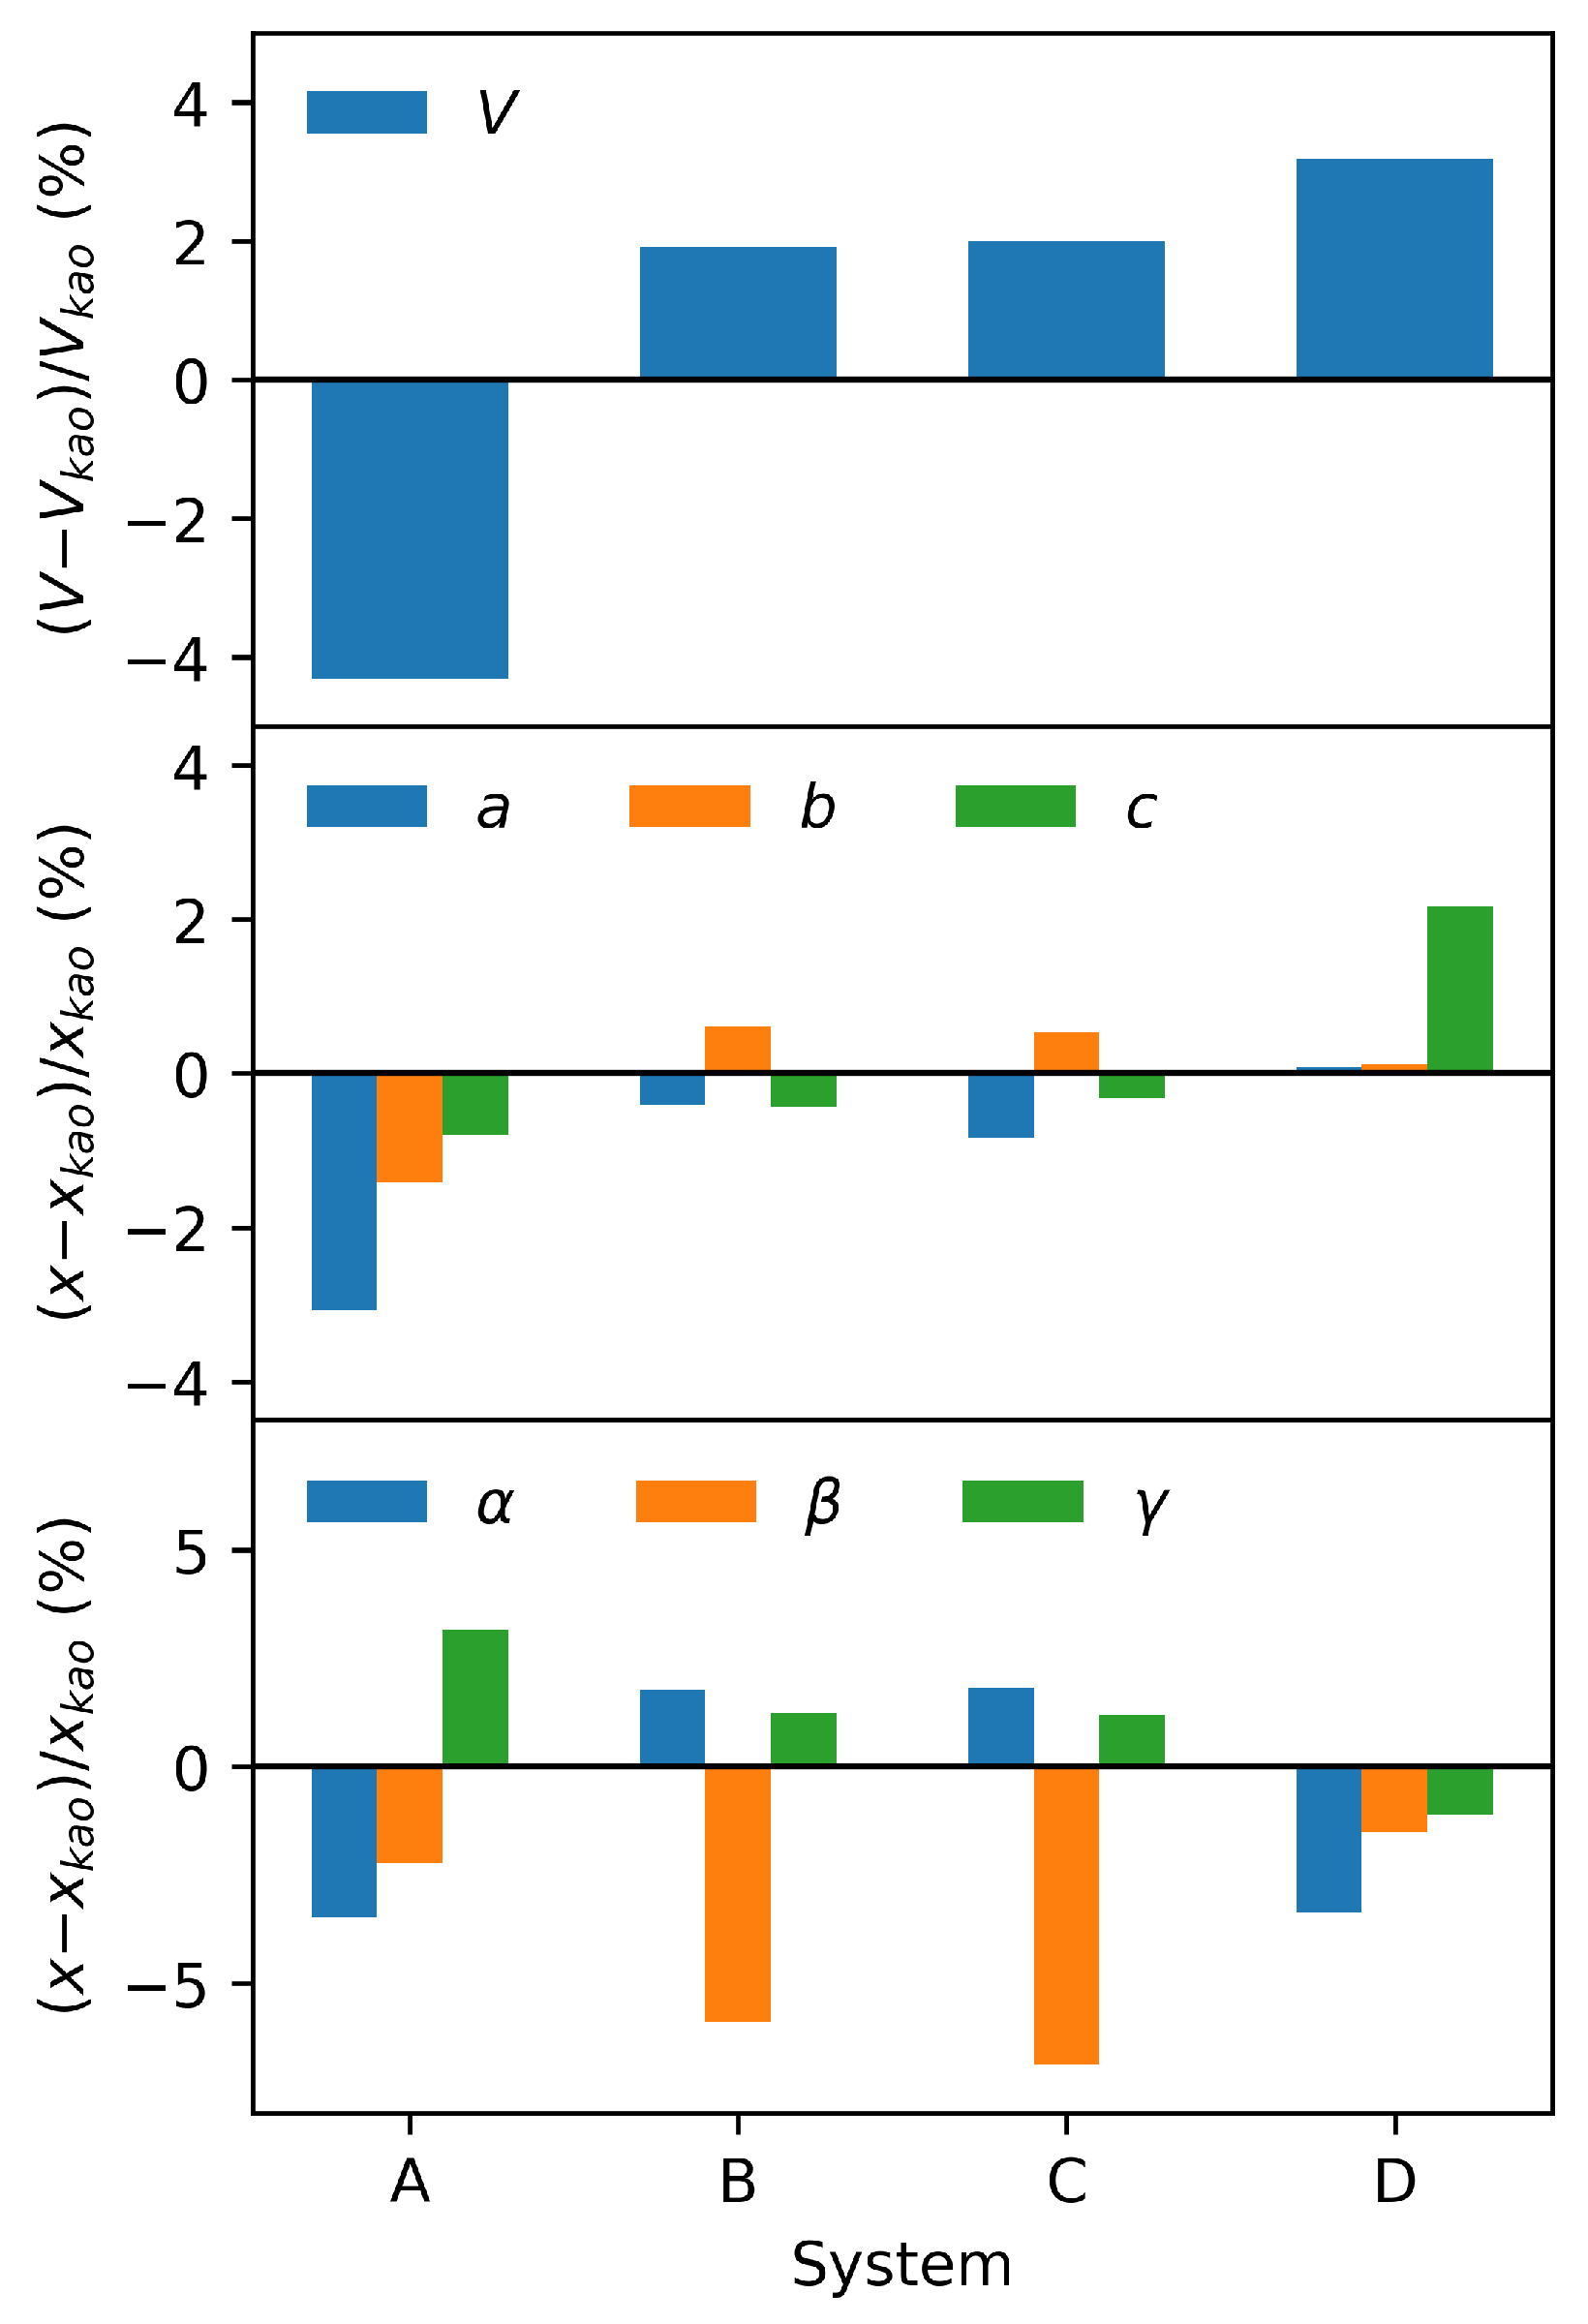
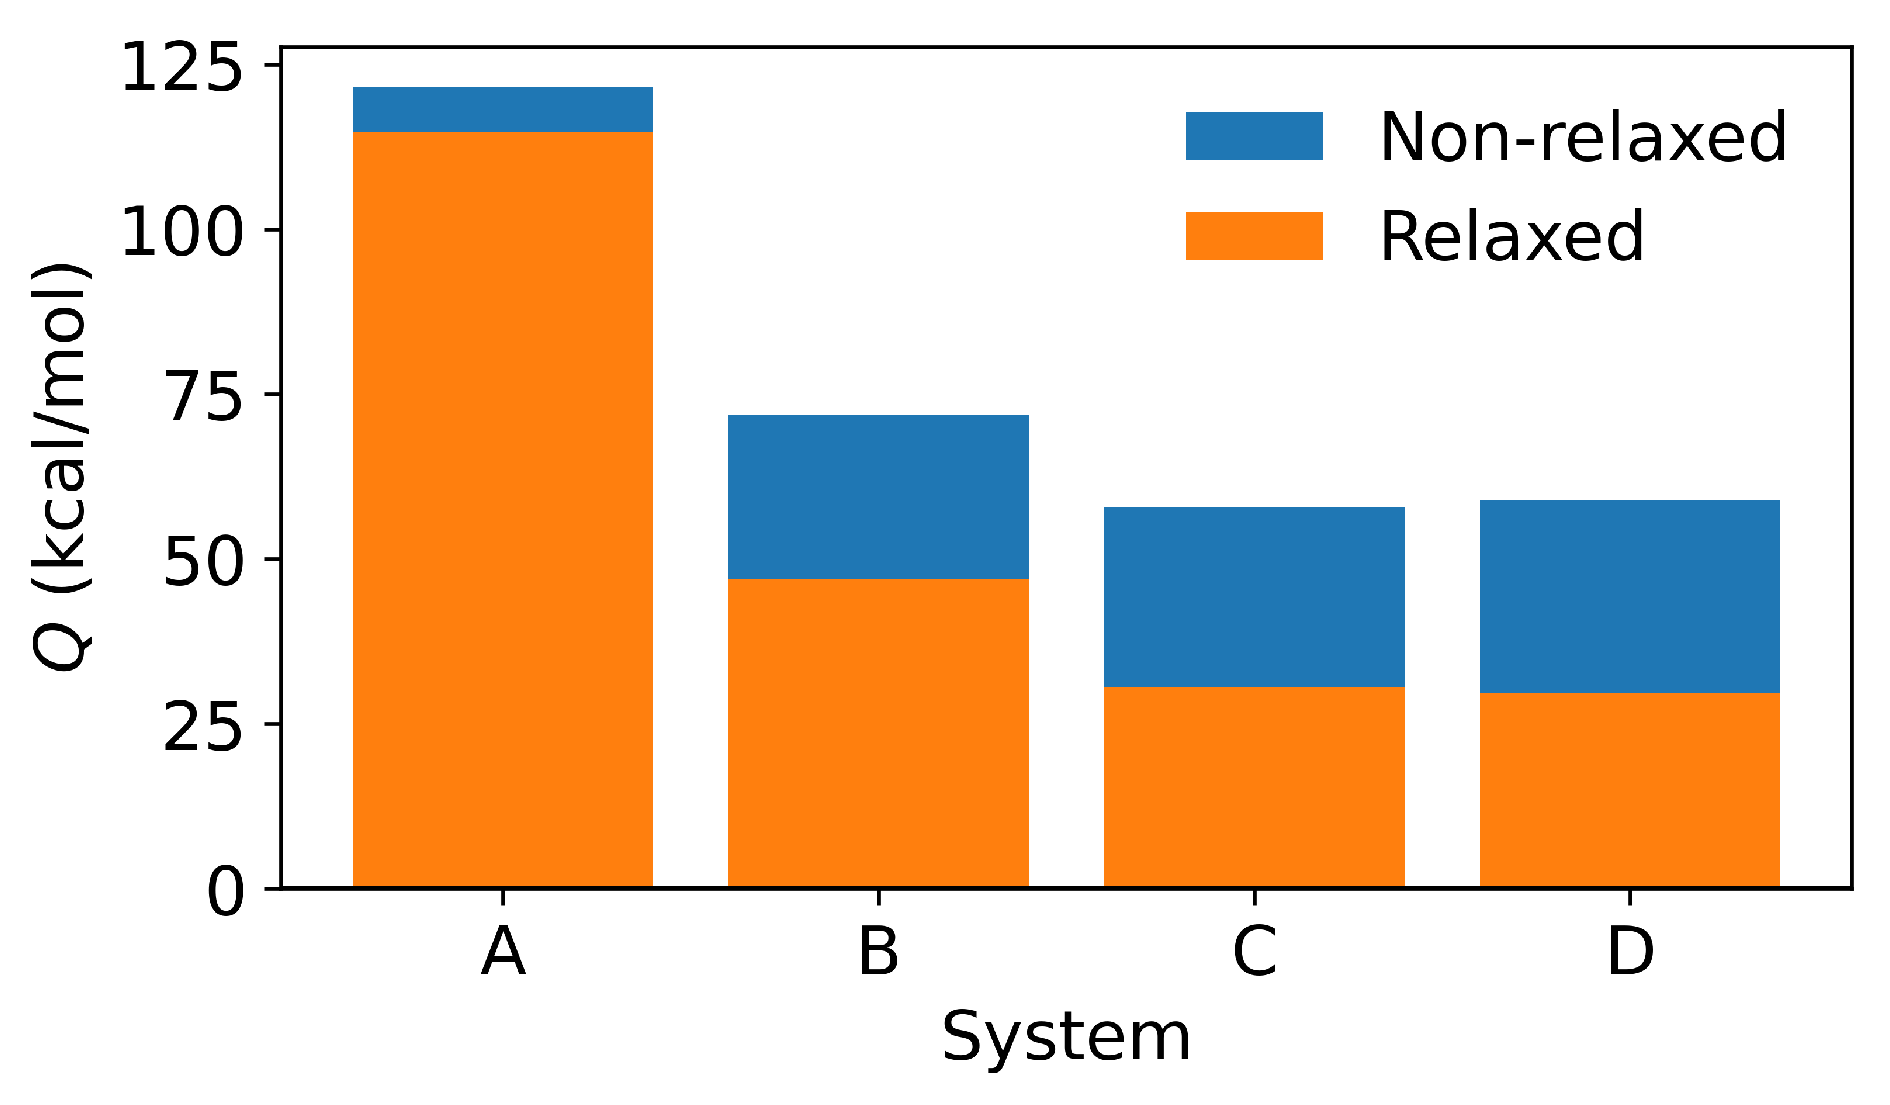
Figure 9 graphically summarizes the relative changes in unit cell parameters with respect to the initial pristine kaolinite structure, using the formula Δ x (%) = 100 × ( x s y s x k a o ) / x k a o , with x being the unit cell volume V or a lattice parameter. Water extraction led to a 4% decrease in volume for System A, while Systems B–D showed increases of up to 3%. These differences in V were a consequence of the changes produced in the different lattice parameters during the structural relaxation. In System A, the contraction was due to reductions in all three lattice parameters a, b, and c. Conversely, Systems B and C expanded slightly due to an increase in b, their largest parameter, while a and c shrank. The increase in V for System D resulted mainly from c expansion. Although α , β , and γ also changed (up to 7%), they contributed less to the volume variation. These structural results show that Systems B and C—where the outer surface OH group was removed (Figure 3)—underwent the least volumetric distortion, suggesting that they represented more favorable dehydroxylation pathways. The energy data in Table 4 show that System A was the least stable. Before relaxation ( E b e f o r e ), the stability order was A < B < D < C. However, after relaxation ( E a f t e r ), the order became A < B < C < D. The small energy difference between C and D accounted for this shift. Thus, the removal of the OH group played a more critical role in stability than the relaxation itself. The energy values in Table 4 were used to calculate the reaction energy Q using Equation (6). The energy of the isolated water molecule was obtained as E w a t = −43.74 Ry and corresponded to a molecule with a bond length of 0.972 Å and H-O-H angle of 104.677 ° , which was in good agreement with other computational and experimental estimates [60]. Figure 10 presents reaction energies Q in kcal/mol (1 kcal/mol = 313 Ry), both before and after structural relaxation (choosing in Equation (6) the values of E b e f o r e and E a f t e r for E s y s , respectively). Relaxation consistently reduced Q, particularly for Systems C and D, by nearly 50%, allowing for an assessment of a range for Q to take into account the structural relaxations that occurred as dehydroxylation took place. Final Q values fell in the range of 30–120 kcal/mol. After relaxation, the order became A > B > C > D. In particular, Systems B–D presented more similar Q values, in the range of 30–50 kcal/mol after relaxation.
The calculated Q values offered a lower bound for the thermal activation energy E a , as the reverse process (rehydration) was non-spontaneous under ambient conditions [18]. As commented above, to the authors’ knowledge, there are no predictions of Q or E a for kaolinite in the literature. Nevertheless, quantum mechanical methods have been applied to the study of the dehydroxylation of pyrophyllite, which is a 2:1 phyllosilicate. Using cluster models, activation energies in the range of 22–55 kcal/mol have been predicted [61,62], in close agreement with the Q values obtained in this work for mono-dehydrated kaolinite. On the other hand, comparing the obtained Q and experimental E a (35–60 kcal/mol) suggests that System A was unlikely, as its Q greatly exceeded E a . This is in agreement with the fact that A involved breaking a Si-O bond (∼190 kcal/mol), whereas B, C, and D involved Al-O bonds (∼120 kcal/mol), requiring less energy [63]. In contrast, the Q values in Systems B, C, and D were consistent with the E a experimental determinations. Among these, System B stood out because it involved only outer surface atoms, avoiding transitions through the Al sheet that would have been needed in Systems C and D. Hence, System B provided the most plausible DFT-based representation of the dehydroxylation process, with a Q value in very good agreement with experimental E a . Although Systems C and D were also energetically feasible, further work is needed to assess the kinetic feasibility of the associated atomic diffusion steps, where barriers related to atomic diffusion through the Al sheet to the interlayer may be expected. These studies are currently underway and will be presented in a future publication.

4. Conclusions

In this work, kaolinite dehydroxylation was successfully investigated by combining TG measurements and DFT calculations. The experiments were performed on two samples: a well-crystallized reference kaolinite sample KGa-1 and an industrial kaolin sample SRB that contained a significant amount of impurities. The optimal conditions for monitoring kaolinite dehydroxylation require an adequate balance between a small sample mass and a strong TG signal, enabling accurate analyses using non-isothermal and isoconversional kinetic methods.
The non-isothermal analysis showed that the most probable model describing the reaction rate for dehydroxylation was the third-order reaction F3. The activation energy ( E a ) ranged from 35 to 60 kcal/mol depending on the heating rate β , with the values for SRB being lower than those for KGa-1. This finding was attributed to the lower structural order in SRB, which likely resulted in higher reactivity. The range of obtained E a values was consistent with that reported in the literature for kaolins under similar experimental conditions. The model-free isoconversional analysis confirmed these results and showed that as dehydroxylation progressed, E a increased, which is a trend that suggests the involvement of additional processes, possibly due to evolving structural changes or secondary reactions. The insights into the relationship between structural order and reactivity are particularly valuable for tailoring kaolin-based materials to specific industrial applications. In such contexts, controlling phase transformation kinetics and reducing activation energies can be crucial to improving thermal performance, including aspects such as energy efficiency and reaction times. A deeper understanding of the associated energies and mechanisms enables the optimization of industrial practices, ranging from scaling and heating protocols to operating strategies and device design, ultimately contributing to lower installation and operating costs.
On the other hand, DFT calculations were used to determine reference values for the dehydroxylation reaction energy Q at the beginning of the process, through the proposal of four models in which a single water molecule was removed from the kaolinite unit cell. Although kaolinite dehydroxylation is a complex process involving many individual steps that can occur simultaneously, these models based on idealized structures provided valuable theoretical insight and a meaningful framework for comparison with experimental findings. DFT results showed that dehydroxylation involving OH groups from both the outer and inner kaolinite surfaces yielded similar Q values, which were in line with experimental E a measurements.
In summary, the convergence between experimental and theoretical findings underscores the strength of a dual TG-DFT approach in capturing both the macroscopic behavior and atomistic energetics of the kaolinite dehydroxylation process, linking the ideal pristine structure to the more complex, impurity-containing materials commonly employed in industrial applications.

Supplementary Materials

The following supporting information can be downloaded at https://www.mdpi.com/article/10.3390/min1010000/s1: Table S1: Coordinates of the calculated structures. Table S2: Lattice parameters and atomic coordinates for mono-dehydrated System A determined by DFT. Table S3: Lattice parameters and atomic coordinates for mono-dehydrated System B determined by DFT. Table S4: Lattice parameters and atomic coordinates for mono-dehydrated System C determined by DFT. Table S5: Lattice parameters and atomic coordinates for mono-dehydrated System D determined by DFT.

Author Contributions

Conceptualization, N.M.R. and D.R.; Methodology, I.A.P.I. and D.R.; Validation, I.A.P.I., A.M. and D.R.; Formal Analysis, I.A.P.I., A.M. and D.R.; Investigation, I.A.P.I. and A.M.; Data Curation, I.A.P.I., A.M. and D.R.; Writing—Original Draft Preparation, I.A.P.I., A.M., N.M.R. and D.R.; Writing—Review and Editing, D.R.; Supervision, N.M.R.; Project Administration, D.R.; Funding Acquisition, N.M.R. and D.R. All authors have read and agreed to the published version of the manuscript.

Funding

This research was funded by Consejo Nacional de Investigaciones Científicas y Técnicas (CONICET, Argentina), Agencia Nacional de Promoción Científica y Tecnológica (ANPCyT, Argentina, grant numbers PICT-2019-03570 and 2021-00392), and Facultad de Ciencias Exactas, Universidad Nacional de La Plata (UNLP, Argentina, X-904).

Data Availability Statement

All relevant data is included in the article and Supplementary Materials; further inquiries can be directed to the corresponding author.

Acknowledgments

Part of the results presented in this work have been obtained by using the facilities of the CCT-Rosario Computational Center, member of the High Performance Computing National System (SNCAD, MinCyT-Argentina).

Conflicts of Interest

The authors declare no conflicts of interest.

Abbreviations

The following abbreviations are used in this manuscript.
DFTDensity Functional Theory
HIHinckley index
TGthermogravimetric analysis
XRDX-ray diffraction

References

  1. Gillespie, S.D. Clay: The entanglement of Earth in the Age of Clay. In Impact of Materials on Society; Krzys Acord, S., Jones, K.S., Bryant, M., Dauphin-Jones, D., Hupp, P.S., Gillespie, S.D., Sassaman, K.E., Eaverly, M.A., Curta, F., Adams, S., et al., Eds.; Pressbooks: Gainesville, FL, USA, 2001; pp. 15–43. [Google Scholar]
  2. Murray, H.H. Kaolin Applications. In Developments in Clay Science; Murray, H.H., Ed.; Elsevier Science: Amsterdam, The Netherlands, 2006; Volume 2, pp. 85–109. [Google Scholar] [CrossRef]
  3. Schroeder, P.A.; Erickson, G. Kaolin: From ancient porcelains to nanocomposites. Elements 2014, 10, 177–182. [Google Scholar] [CrossRef]
  4. Cao, Y.; Wang, Y.; Zhang, Z.; Ma, Y.; Wang, H. Recent progress of utilization of activated kaolinitic clay in cementitious construction materials. Compos. B Eng. 2021, 211, 108636. [Google Scholar] [CrossRef]
  5. Ece, Ö.I.; Ercan, H.Ü. Global occurrence, geology and characteristics of hydrothermal-origin kaolin deposits. Minerals 2024, 14, 353. [Google Scholar] [CrossRef]
  6. Al-Ameri, O.B.; Alzuhairi, M.; Bailón-Gercía, O.; Carrasco-Marín, F.; Amaro-Gahete, J. Transforming petrochemical processes: Cutting-edge advances in kaolin catalyst fabrication. Appl. Sci. 2024, 14, 9080. [Google Scholar] [CrossRef]
  7. Brigatti, M.F.; Galán, E.; Theng, B.K.G. Structure and mineralogy of clay minerals. Dev. Clay Sci. 2013, 5, 21–81. [Google Scholar] [CrossRef]
  8. Carty, W.M.; Senapati, U. Porcelain–Raw Materials, Processing, Phase Evolution, and Mechanical Behavior. J. Am. Ceram. Soc. 2005, 81, 3–20. [Google Scholar] [CrossRef]
  9. Arikan, M.; Sobolev, K.; Ertün, T.; Yeğinobali, A.; Turker, P. Properties of blended cements with thermally activated kaolin. Constr. Build. Mater. 2009, 23, 62–70. [Google Scholar] [CrossRef]
  10. Shafiq, N.; Nuruddin, M.F.; Ullah Khan, S.; Ayub, T. Calcined kaolin as cement replacing material and its use in high strength concrete. Constr. Build. Mater. 2015, 81, 313–323. [Google Scholar] [CrossRef]
  11. Liew, Y.M.; Kamarudin, H.; Al Bakri, A.M.; Luqman, M.; Nizar, I.K.; Ruzaidi, C.M.; Heah, C.Y. Processing and characterization of calcined kaolin cement powder. Constr. Build. Mater. 2012, 30, 794–802. [Google Scholar] [CrossRef]
  12. Mocciaro, A.; Conconi, M.S.; Rendtorff, N.M.; Scian, A.N. Ceramic properties of kaolinitic clay with monoaluminum phosphate (Al(H2PO4)3) addition. J. Therm. Anal. Calorim. 2021, 144, 1083–1093. [Google Scholar] [CrossRef]
  13. Cordoba, G.; Sposito, R.; Köberl, M.; Zito, S.; Beuntner, N.; Tironi, A.; Thienel, K.C.; Irassar, E.F. Chloride migration and long-term natural carbonation on concretes with calcined clays: A study of calcined clays in Argentina. Case Stud. Constr. Mater. 2022, 17, e01190. [Google Scholar] [CrossRef]
  14. Hernández, M.F.; López, P.V.; Conconi, M.S.; Rendtorff, N.M. Effect of boron sources in the thermal behavior of a clay-based ceramics. Open Ceram. 2022, 9, 100227. [Google Scholar] [CrossRef]
  15. Anaya, R.; Hernández, M.F.; Mocciaro, A.; Richard, D.; Rendtorff, N.M. Reused green glass for the production of low-density ceramic proppants. Open Ceram. 2024, 19, 100659. [Google Scholar] [CrossRef]
  16. Anaya, R.; Carranza, M.B.; Booth, F.; Hernández, M.F.; Mocciaro, A.; Richard, D.; Rendtorff, N.M. Low-density kaolinitic ceramic proppants based on rice husk ash. Ceram. Int. 2025. [Google Scholar] [CrossRef]
  17. Torres, C.I.; Miquelarena, C.P.; Bianchi, G.L. Optimization of ceramic proppant properties through an innovative coating approach. Bol. Soc. Esp. Ceram. Vidr. 2025, 64, 2–11. [Google Scholar] [CrossRef]
  18. Chakraborty, A.K. Phase Transformation of Kaolinite Clay; Springer: New Delhi, India, 2014. [Google Scholar] [CrossRef]
  19. Ptáček, P.; Frajkorová, F.; Šoukal, F.; Opravil, T. Kinetics and mechanism of three stages of thermal transformation of kaolinite to metakaolinite. Powder Technol. 2014, 264, 439–445. [Google Scholar] [CrossRef]
  20. Drits, V.A.; Derkowski, A. Kinetic behavior of partially dehydroxylated kaolinite. Am. Mineral. 2015, 100, 883–896. [Google Scholar] [CrossRef]
  21. Pérez-Rodríguez, J.L.; Pascual, J.; Franco, F.; de Haro, M.C.J.; Duran, A.; del Valle, V.R.; Pérez-Maqueda, L.A. The influence of ultrasound on the thermal behaviour of clay minerals. J. Eur. Ceram. Soc. 2006, 26, 747–753. [Google Scholar] [CrossRef]
  22. Temuujin, J.; Okada, K.; MacKenzie, K.J.D.; Jadambaa, T. The effect of water vapour atmospheres on the thermal transformation of kaolinite investigated by XRD, FTIR and solid state MAS NMR. J. Eur. Ceram. Soc. 1998, 19, 105–112. [Google Scholar] [CrossRef]
  23. Nahdi, K.; Llewellyn, P.; Rouquérol, F.; Rouquérol, J.; Ariguib, N.K.; Ayedi, M.T. Controlled rate thermal analysis of kaolinite dehydroxylation: Effect of water vapour pressure on the mechanism. Thermochim. Acta 2002, 390, 123–132. [Google Scholar] [CrossRef]
  24. Ptáček, P.; Kubátová, D.; Havlica, J.; Brandštetr, J.; Šoukal, F.; Opravil, T. The non-isothermal kinetic analysis of the thermal decomposition of kaolinite by thermogravimetric analysis. Powder Technol. 2010, 204, 222–227. [Google Scholar] [CrossRef]
  25. Adesina, O.C.; Volaity, S.S.; Aylas-Paredes, B.K.; Qi, C.; Kumar, A.; Neithalath, N. Dehydroxylation kinetics of kaolinite and montmorillonite examined using isoconversional methods. Appl. Clay Sci. 2025, 270, 107776. [Google Scholar] [CrossRef]
  26. Ortega, A.; Macías, M.; Gotor, F.J. The multistep nature of the kaolinite dehydroxylation: Kinetics and mechanism. J. Am. Ceram. Soc. 2010, 93, 197–203. [Google Scholar] [CrossRef]
  27. De Aza, A.H.; Turrillas, X.; Rodriguez, M.A.; Duran, T.; Peña, P. Time-resolved powder neutron diffraction study of the phase transformation sequence of kaolinite to mullite. J. Eur. Ceram. Soc. 2014, 34, 1409–1421. [Google Scholar] [CrossRef]
  28. Ondro, T.; Húlan, T.; Vitázek, I. Non-isothermal kinetic analysis of the dehydroxilation of kaolinite in dynamic air atmosphere. Acta Technol. Agric. 2017, 2, 52–56. [Google Scholar] [CrossRef]
  29. Jones, R.O. Density functional theory: Its origins, rise to prominence, and future. Rev. Mod. Phys. 2015, 87, 897. [Google Scholar] [CrossRef]
  30. Marzari, N.; Ferretti, A.; Wolverton, C. Electronic-structure methods for materials design. Nat. Mater. 2021, 20, 736–749. [Google Scholar] [CrossRef]
  31. White, C.E.; Provis, J.L.; Riley, D.P.; Kearley, G.J.; van Deventer, J.S.J. What is the structure of kaolinite? Reconciling theory and experiment. J. Phys. Chem. B 2009, 113, 6756–6765. [Google Scholar] [CrossRef]
  32. Nisar, J.; Århammar, C.; Jämstorp, E.; Ahuja, R. Optical gap and native point defects in kaolinite studied by the GGA-PBE, HSE functional, and GW approaches. Phys. Rev. B 2011, 84, 075120. [Google Scholar] [CrossRef]
  33. Tunega, D.; Bučko, T.; Zaoui, A. Assessment of ten DFT methods in predicting structures of sheet silicates: Importance of dispersion corrections. J. Chem. Phys. 2012, 137, 114105. [Google Scholar] [CrossRef]
  34. Richard, D.; Rendtorff, N.M. First principles study of structural properties and electric field gradients in kaolinite. Appl. Clay Sci. 2019, 169, 67–73. [Google Scholar] [CrossRef]
  35. Richard, D.; Rendtorff, N.M. Local Environments in Iron-Bearing Clay Minerals by DFT Approaches: The Case of Structural Fe in Kaolinite. Appl. Clay Sci. 2021, 213, 106251. [Google Scholar] [CrossRef]
  36. Richard, D.; Rendtorff, N.M. Kaolin group minerals under pressure: The study of their structural and electronic properties by DFT methods. Appl. Clay Sci. 2022, 219, 106444. [Google Scholar] [CrossRef]
  37. Shafei, L.; Adhikari, P.; Ching, W.Y. DFT study of electronic structure and optical properties of kaolinite, muscovite, and montmorillonite. Crystals 2021, 11, 618. [Google Scholar] [CrossRef]
  38. White, C.E.; Provis, J.L.; Proffen, T.; Riley, D.P.; van Deventer, J.S.J. Density functional modeling of the local structure of kaolinite subjected to thermal dehydroxylation. J. Phys. Chem. A 2010, 114, 4988–4996. [Google Scholar] [CrossRef]
  39. Sperinck, S.; Raiteri, P.; Marks, N.; Wright, K. Dehydroxylation of kaolinite to metakaolin—A molecular dynamics study. J. Mater. Chem. 2011, 21, 2118–2125. [Google Scholar] [CrossRef]
  40. Izadifar, M.; Thissen, P.; Steudel, A.; Kleeberg, R.; Kaufhold, S.; Kaltenbach, J.; Schuhmann, R.; Dehn, F.; Emmerich, K. Comprehensive examination of dehydroxylation of kaolinite, disordered kaolinite, and dickite: Experimental studies and density functional theory. Clays Clay Miner. 2020, 68, 319–333. [Google Scholar] [CrossRef]
  41. Zeng, Q.; Xie, J.; Zhou, W.; Zhu, J.; Liu, L.; Yin, J.; Zhu, W. Study of the crystallographic distortion mechanism during the annealing of kaolinite. Minerals 2022, 12, 994. [Google Scholar] [CrossRef]
  42. Mermut, A.R.; Faz Cano, A. Baseline studies of the Clay Minerals Society source clays: Chemical analyses of major elements. Clays Clay Miner. 2001, 49, 381–386. [Google Scholar] [CrossRef]
  43. López, P.V.; Mocciaro, A.; Hernández, M.F.; Richard, D.; Rendtorff, N.M. Microstructure and mechanical properties of a porous ceramic composite with needle-like mullite and zirconia. Int. J. Appl. Ceram. Technol. 2024, 21, 4081–4090. [Google Scholar] [CrossRef]
  44. Chipera, S.J.; Bish, D.L. Baseline studies of the Clay Minerals Society source clays: Powder X-ray diffraction analyses. Clays Clay Miner. 2001, 49, 398–409. [Google Scholar] [CrossRef]
  45. Hinckley, D. Variability in ‘crystallinity’ values among the kaolin deposits of the Coastal Plain of Georgia and South Carolina. In Clays and Clay Minerals (National Conference on Clays and Clay Minerals); Cambridge University Press & Assessment: Cambridge, UK, 1962; Volume 11, pp. 229–235. [Google Scholar]
  46. Bastida, J.; Pardo-Ibañez, P. Applications of X-ray powder diffraction microstructural analysis in applied clay mineralogy. Minerals 2024, 14, 584. [Google Scholar] [CrossRef]
  47. Richard, D.; Martínez, J.M.; Mizrahi, M.; Andrini, L.; Rendtorff, N.M. Assessment of structural order indices in kaolinites: A multi-technique study including EXAFS. J. Electron Spectrosc. Relat. Phenom. 2022, 254, 147128. [Google Scholar] [CrossRef]
  48. Bish, L. Rietveld refinement of the kaolinite structure at 1.5 K. Clays Clay Miner. 1993, 41, 738–744. [Google Scholar] [CrossRef]
  49. Kroll, P.; Milko, M. Theoretical investigation of the solid state reaction of silicon nitride and silicon dioxide forming silicon oxynitride (Si2N2O) under pressure. Z. Anorg. Allg. Chem. 2003, 629, 1737–1750. [Google Scholar] [CrossRef]
  50. Wendlandt, W. Thermal Analysis, 3rd ed.; Wiley: Hoboken, NJ, USA, 1986. [Google Scholar]
  51. Belloto, M.; Gualtieri, A.; Artioli, G.; Clark, S.M. Kinetic study of the kaolinite-mullite reaction sequence. Part I: Kaolinite dehydroxylation. Phys. Chem. Minerals 1995, 22, 207–214. [Google Scholar] [CrossRef]
  52. Friedman, H.L. Kinetics of thermal degradation of char-forming plastics from thermogravimetry: Application to a phenolic plastic. J. Polym. Sci. C Polym. Symp. 1964, 6, 183–195. [Google Scholar] [CrossRef]
  53. Giannozzi, P.; Andreussi, O.; Brumme, T.; Bunau, O.; Buongiorno Nardelli, M.; Calandra, M.; Car, R.; Cavazzoni, C.; Ceresoli, D.; Cococcioni, M.; et al. Advanced capabilities for materials modelling with Quantum ESPRESSO. J. Phys. Condens. Matter 2017, 29, 465901. [Google Scholar] [CrossRef]
  54. Wu, Z.; Cohen, R.E. More accurate generalized gradient approximation for solids. Phys. Rev. B 2006, 73, 235116. [Google Scholar] [CrossRef]
  55. Hirsch, T.K.; Ojamäe, L. Quantum-chemical and force-field investigations of ice Ih: Computation of proton-ordered structures and prediction of their lattice energies. J. Phys. Chem. B 2004, 108, 15856–15864. [Google Scholar] [CrossRef]
  56. Zamiatina, D.A.; Zamyatin, D.A.; Mikhalevskii, G.B.; Chebikin, N.S. Silica polymorphs formation in the Jänisjärvi impact structure: Tridymite, Cristobalite, Quartz, Trace Stishovite and Coesite. Minerals 2023, 13, 686. [Google Scholar] [CrossRef]
  57. Baldo, J.B.; dos Santos, W.N. Phase transitions and their effects on the thermal diffusivity behaviour of some SiO2 polymorphs. Cerâmica 2002, 48, 172–177. [Google Scholar] [CrossRef]
  58. Suárez, M.P.; Palermo, A.; Aldao, C.M. The compensation effect revisited. J. Therm. Anal. 1994, 41, 807–816. [Google Scholar] [CrossRef]
  59. Barrie, P.J. The mathematical origins of the kinetic compensation effect: 1. The effect of random experimental errors. Phys. Chem. Chem. Phys. 2012, 14, 318–326. [Google Scholar] [CrossRef]
  60. Xu, X.; Goddard, W.A. Bonding properties of the water dimer: A comparative study of density functional theories. J. Phys. Chem. A 2004, 108, 2305–2313. [Google Scholar] [CrossRef]
  61. Molina-Montes, E.; Timón, V.; Hernández-laguna, A.; Sainz-díaz, C.I. Dehydroxylation mechanisms in Al3+/Fe3+ dioctahedral phyllosilicates by quantum mechanical methods with cluster models. Geochim. Cosmochim. Acta 2008, 72, 3929–3938. [Google Scholar] [CrossRef]
  62. Molina-Montes, E.; Donadio, D.; Hernández-laguna, A.; Parrinello, M.; Sainz-díaz, C.I. Water release from pyrophyllite during the dehydroxylation process explored by quantum mechanical simulations. J. Phys. Chem. C 2013, 117, 7526–7532. [Google Scholar] [CrossRef]
  63. Dean, J.A. Lange’s Handbook of Chemistry; McGraw-Hill: New York, NY, USA, 1999. [Google Scholar]
Figure 1. Kaolinite unit cell. Blue, light blue, red, and white balls stand for Si, Al, O, and H atoms, respectively.
Minerals 15 00607 g001
Figure 2. (a) XRD patterns for KGa-1 and SRB kaolins and (b) magnification of the 2 θ = 19–22 ° region (indicated by the dotted square in (a)) and method for the determination of the Hinckley index HI. In (a), the most prominent peaks of kaolinite and quartz phases are indicated at the top by vertical bars (COD cards 9009234 [48] and 1532512 [49], respectively).
Minerals 15 00607 g002
Figure 3. Mono-dehydrated kaolinite models. The green balls represent the extracted atoms in each system.
Minerals 15 00607 g003
Figure 4. Non-isothermal TG analysis of the studied kaolins. TG curves for KGa-1 and SRB at different heating rates ((a) and (d), respectively), their corresponding fraction α of dehydroxylated kaolinite (b,e), and reaction rate d α / d T (c,f).
Minerals 15 00607 g004
Figure 5. Plots of ln [ β × ( d α / d T ) / f ( α ) ] vs. 1000/T, considering data taken for β = 10 °C/min and different reaction mechanisms f ( α ) . The straight blue lines are linear fits in the interval α = 0.1–0.9.
Minerals 15 00607 g005
Figure 6. Activation energy E a (a) and exponential pre-exponential factor A (b) as a function of heating rate β obtained with the non-isothermal F3 model. Error bars are inside the dots.
Minerals 15 00607 g006
Figure 7. Isoconversional plots for the studied samples.
Minerals 15 00607 g007
Figure 8. Isoconversional E a results. For SRB, the E a value at α = 0.9 was 170(30) kcal/mol (outside the plotted range).
Minerals 15 00607 g008
Figure 9. Relative differences of unit cell volume V and lattice parameters with respect to kaolinite starting data.
Minerals 15 00607 g009
Figure 10. Reaction energy Q results for Systems A–D before and after structural relaxation.
Minerals 15 00607 g010
Table 1. Chemical and mineralogical composition of the studied kaolins (in wt.%). * Loss in ignition.
Chemical composition
SiO2Al2O3Fe2O3CaOMgONa2OK2OTiO2LOI *Ref.
KGa-143.3638.580.350.040.040.050.001.6713.6[42]
SRB60.0026.401.030.160.180.120.640.3711.1[43]
Mineralogical composition
KaoliniteQuartzPotassum felsparAnataseRef.
KGa-196Traces-Traces[44]
SRB76.622.01.4Traces[43]
Table 2. Kinetic models used to describe kaolinite dehydroxylation.
SymbolName f ( α ) Rate-Controlling ProcessRef.
F1First-order 1 α Interface-controlled reaction[23,51]
F3Third-order ( 1 α ) 3 Nucleation-growth chemical reaction[24,28]
D3Jander equation 3 2 ( 1 α ) 2 / 3 1 ( 1 α ) 1 / 3 3D diffusion, spherical symmetry[27,28,51]
D5Zhuravlev equation 2 3 ( 1 α ) 5 / 3 1 ( 1 α ) 1 / 3 Diffusion process with additional transport effects[24,28]
Table 3. Determination of the most probable model of kaolinite dehydroxylation based on calculation of determination coefficient R 2 . In each case, bold text indicates the most probable model.
Sample β (°C/min)F1F3D3D5
KGa-130.40340.98980.68180.9134
50.27320.98820.62700.8968
100.69600.99920.79450.9534
150.81000.99890.85150.9721
200.80300.99940.85010.9700
SRB30.02170.94750.34390.7945
50.11150.97940.55180.8722
100.41640.98900.68240.9107
150.68540.99760.79760.9511
200.72190.99830.81520.9568
Table 4. DFT structural and energetic results for the studied systems. E b e f o r e and E a f t e r stand for the unit cell energy before and after full structural relaxation.
KaoliniteSystem ASystem BSystem CSystem D
V3)329.79315.57336.11336.39340.31
a (Å)5.17395.01515.15255.13105.1781
b (Å)8.98518.85799.03989.03348.9952
c (Å)7.35187.29287.31947.32887.5110
α ( ° )91.68688.50993.30593.36188.602
β ( ° )105.126102.78998.94197.901103.530
γ ( ° )89.75792.59090.87090.84288.758
E b e f o r e (Ry) −1053.5443−1053.8612−1053.9503−1053.9438
E a f t e r (Ry)−1098.0593−1053.5872−1054.0197−1054.1245−1054.1305
Disclaimer/Publisher’s Note: The statements, opinions and data contained in all publications are solely those of the individual author(s) and contributor(s) and not of MDPI and/or the editor(s). MDPI and/or the editor(s) disclaim responsibility for any injury to people or property resulting from any ideas, methods, instructions or products referred to in the content.