Hornblende and Plagioclase Micro-Texture and Compositions: Evidence for Magma Mixing in High-Mg Adakitic Pluton, North China Craton

Abstract
1. Introduction
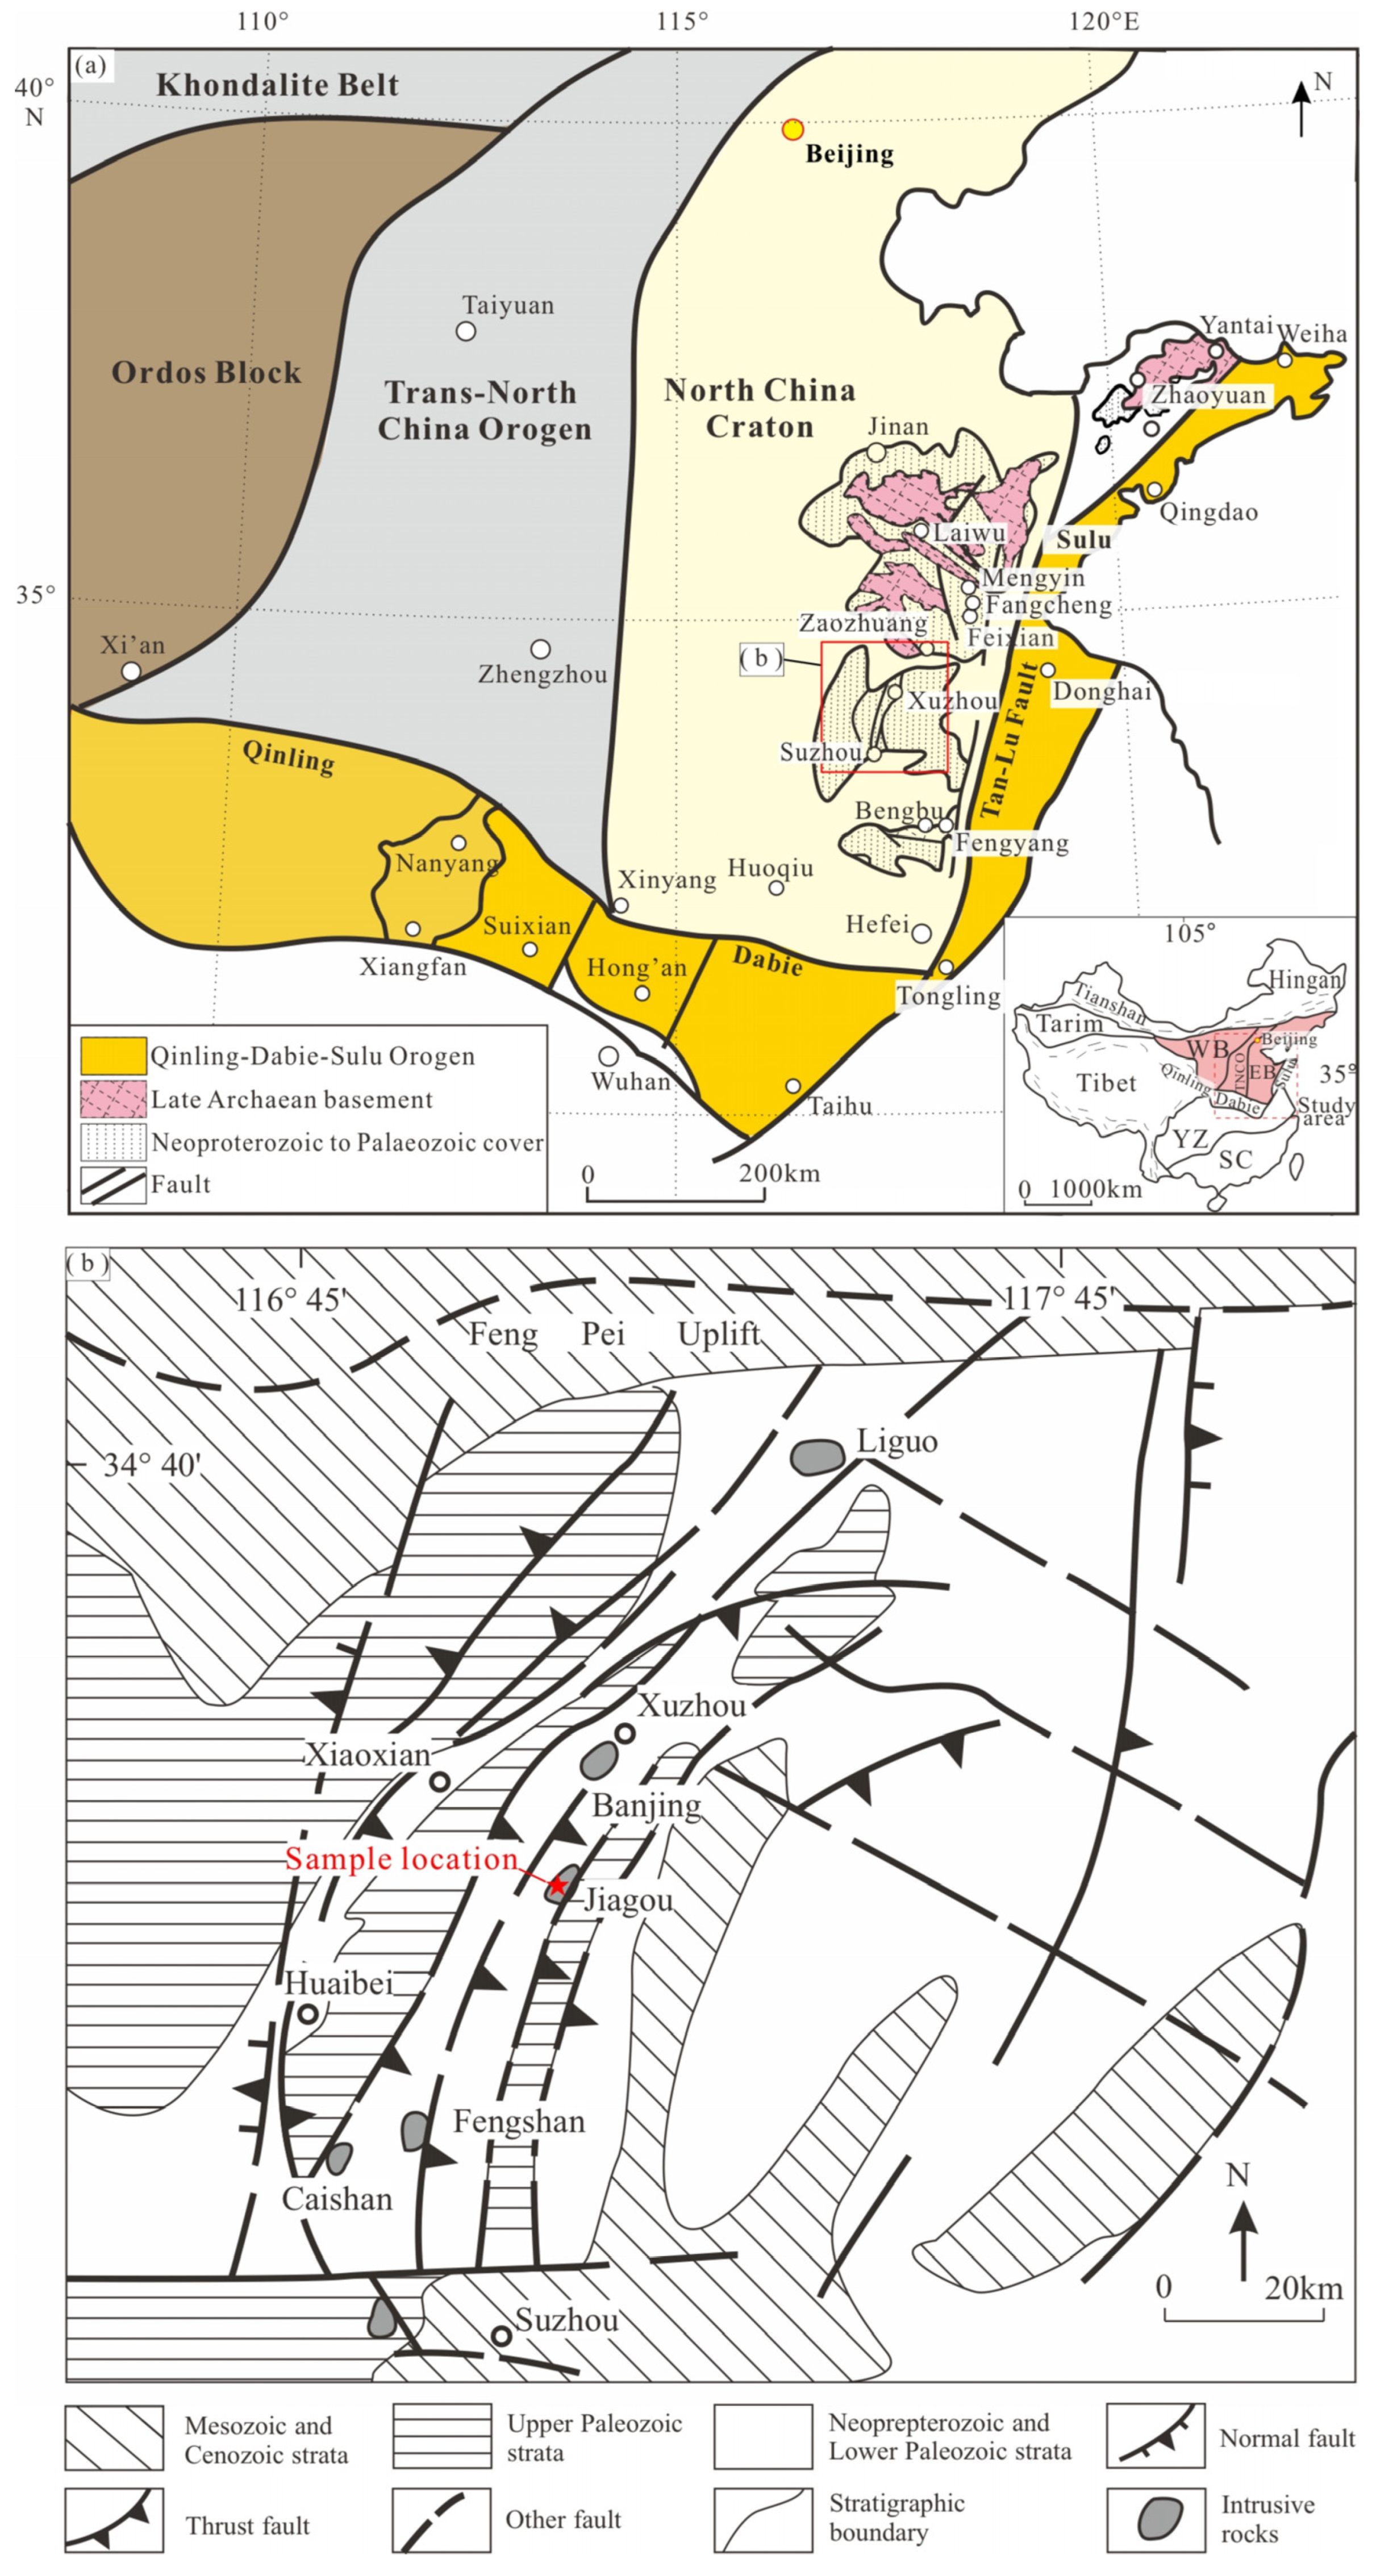
2. Regional and Local Geology
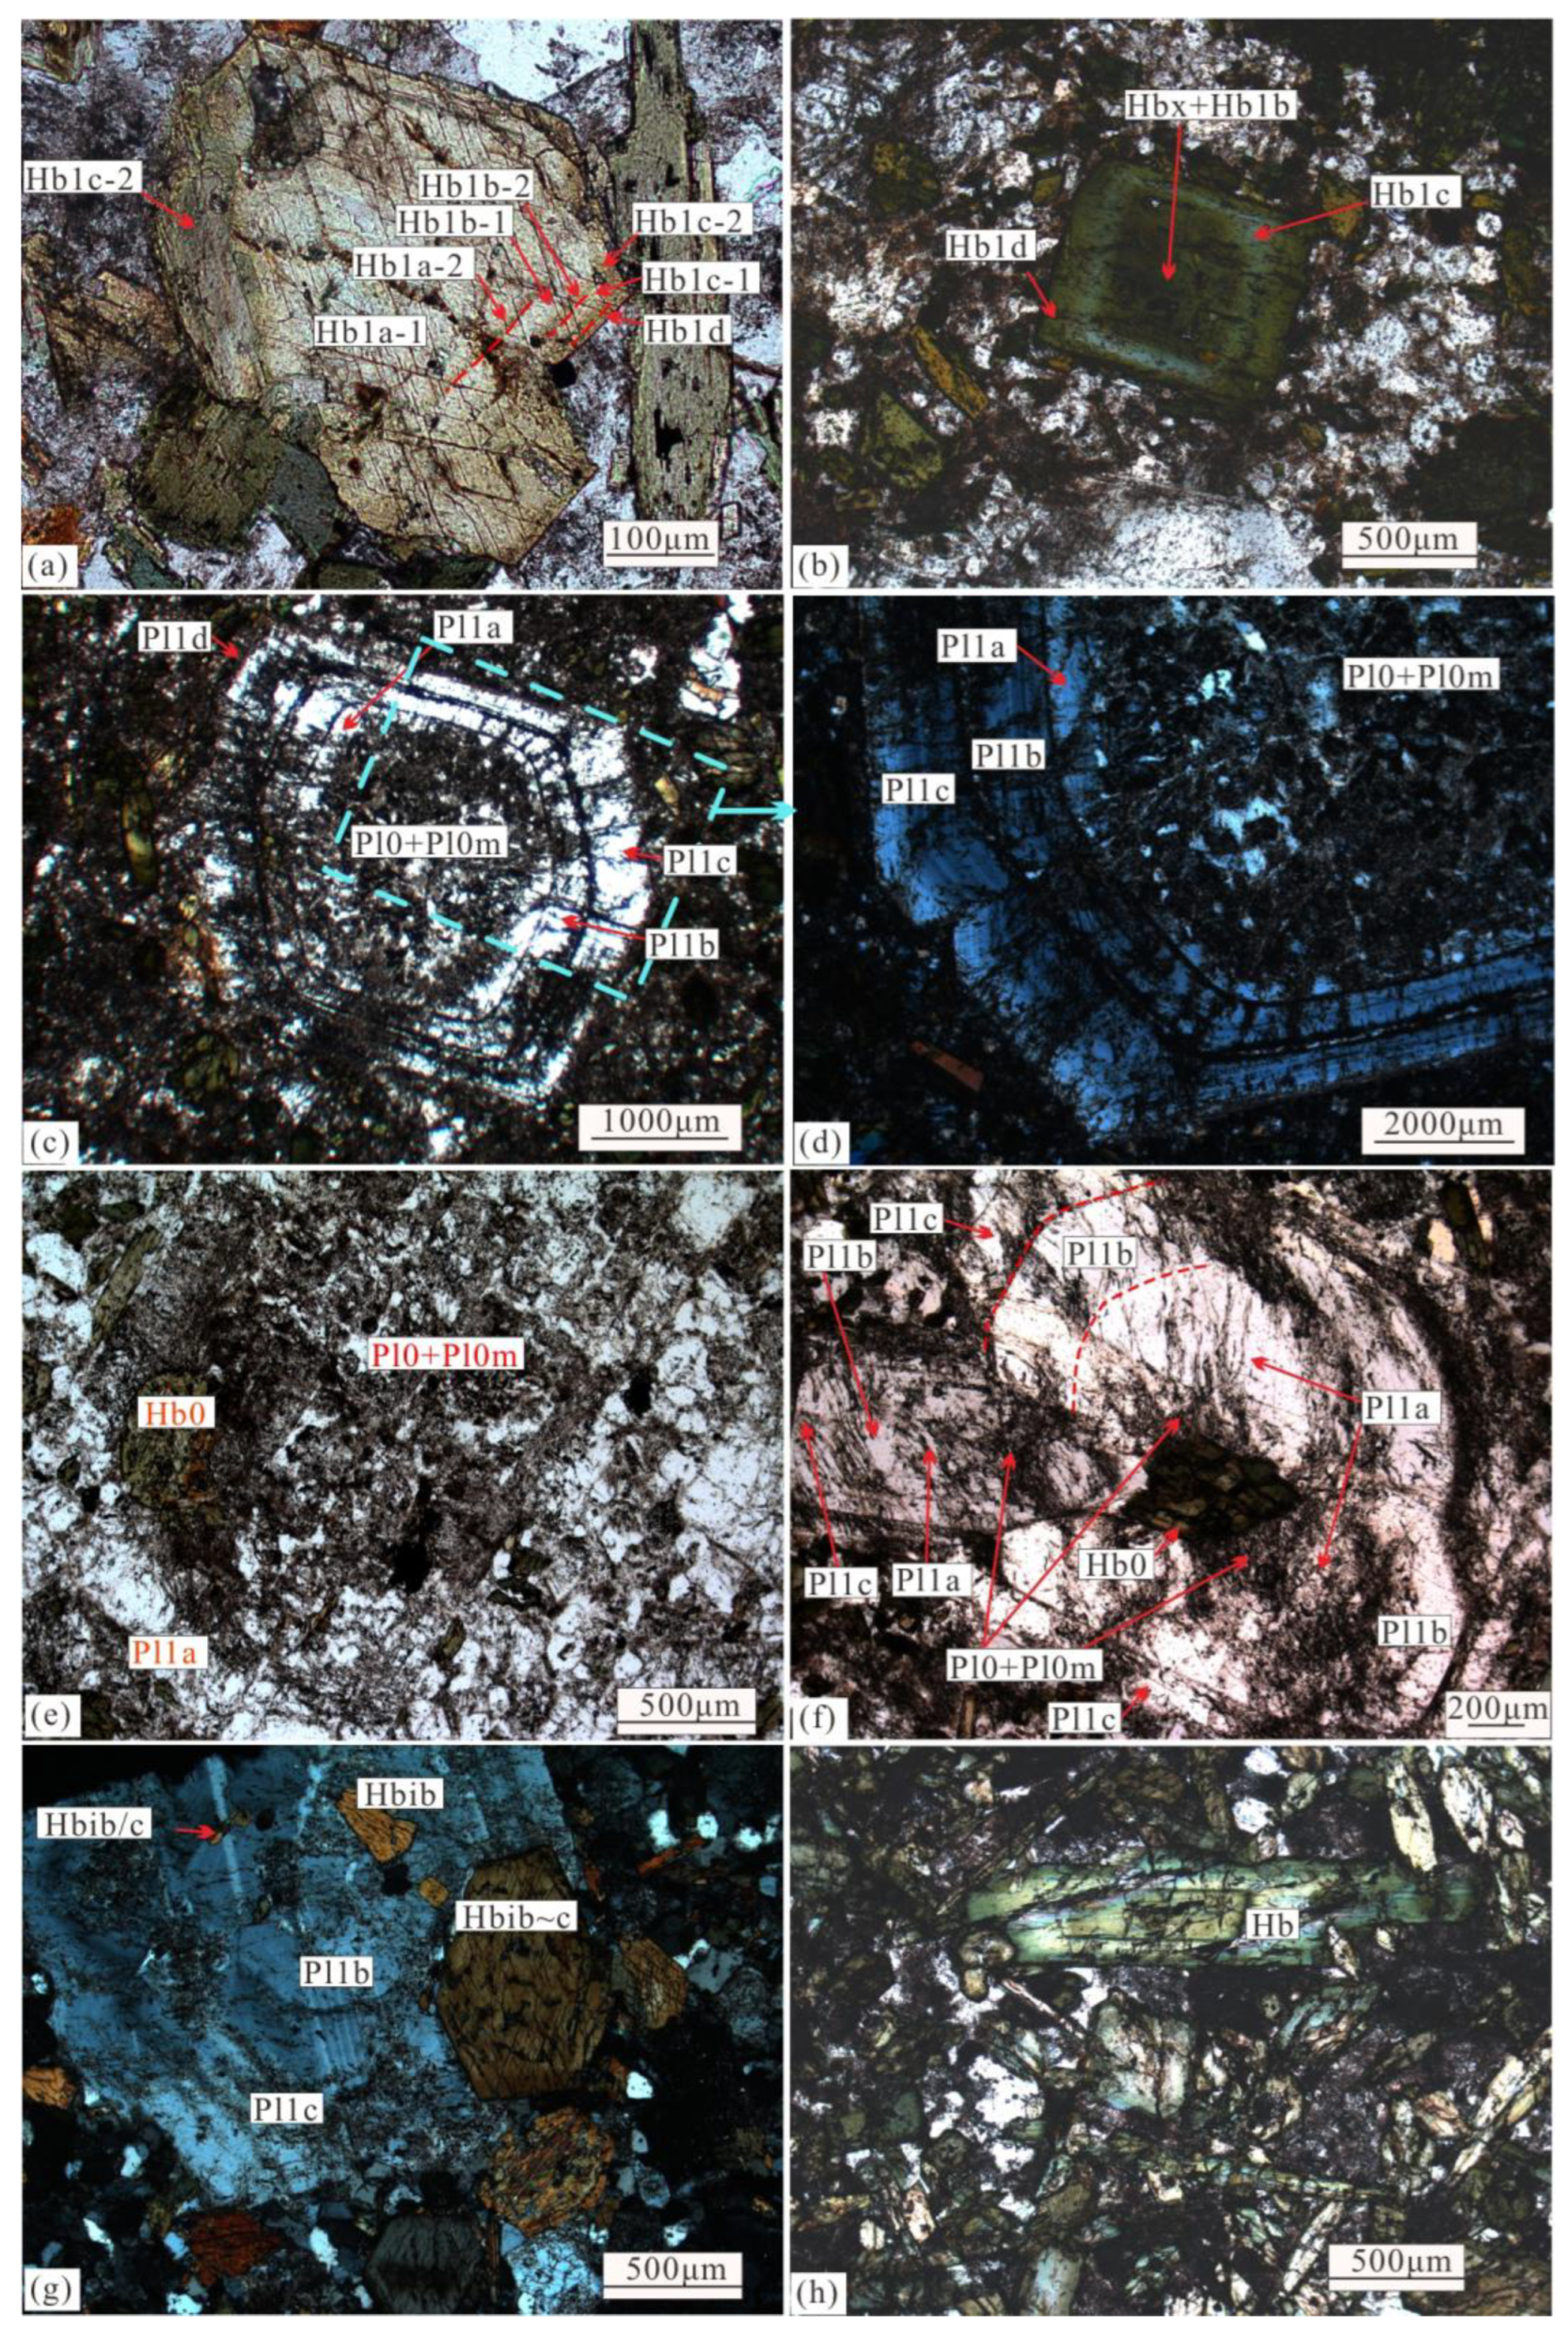
3. Petrography and Mineralogy
4. Analytical Methods
5. Results
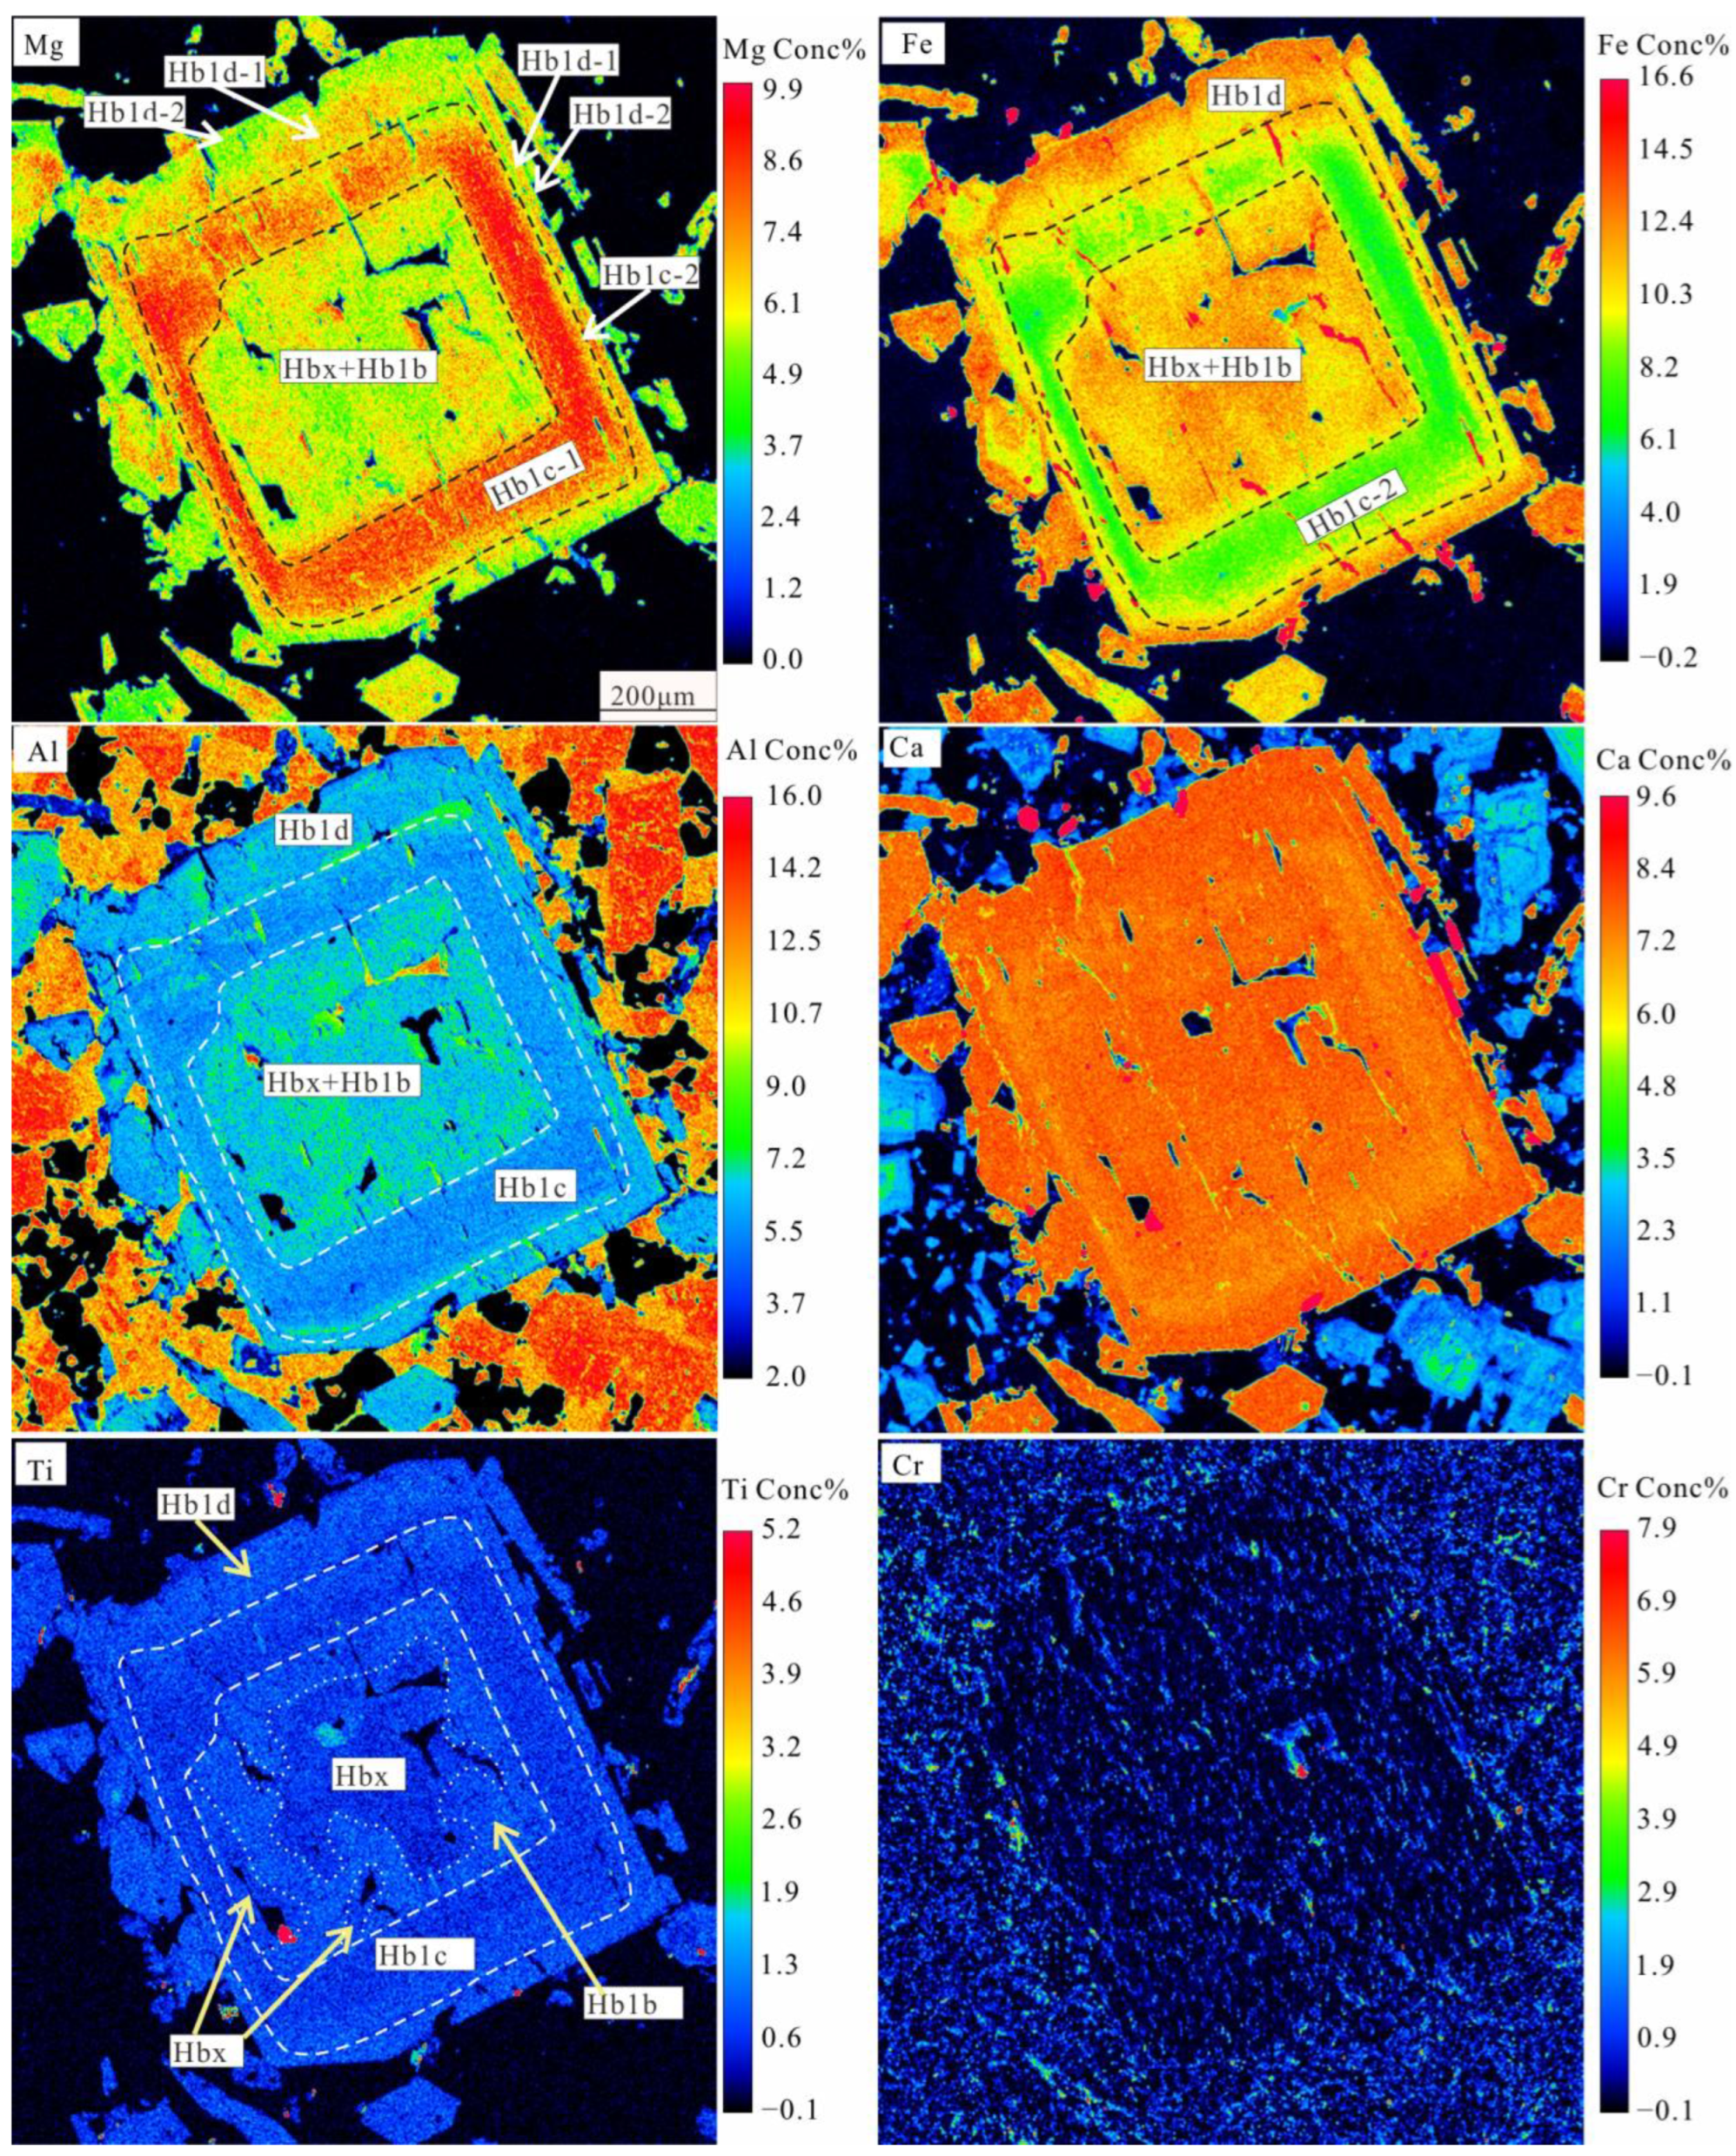
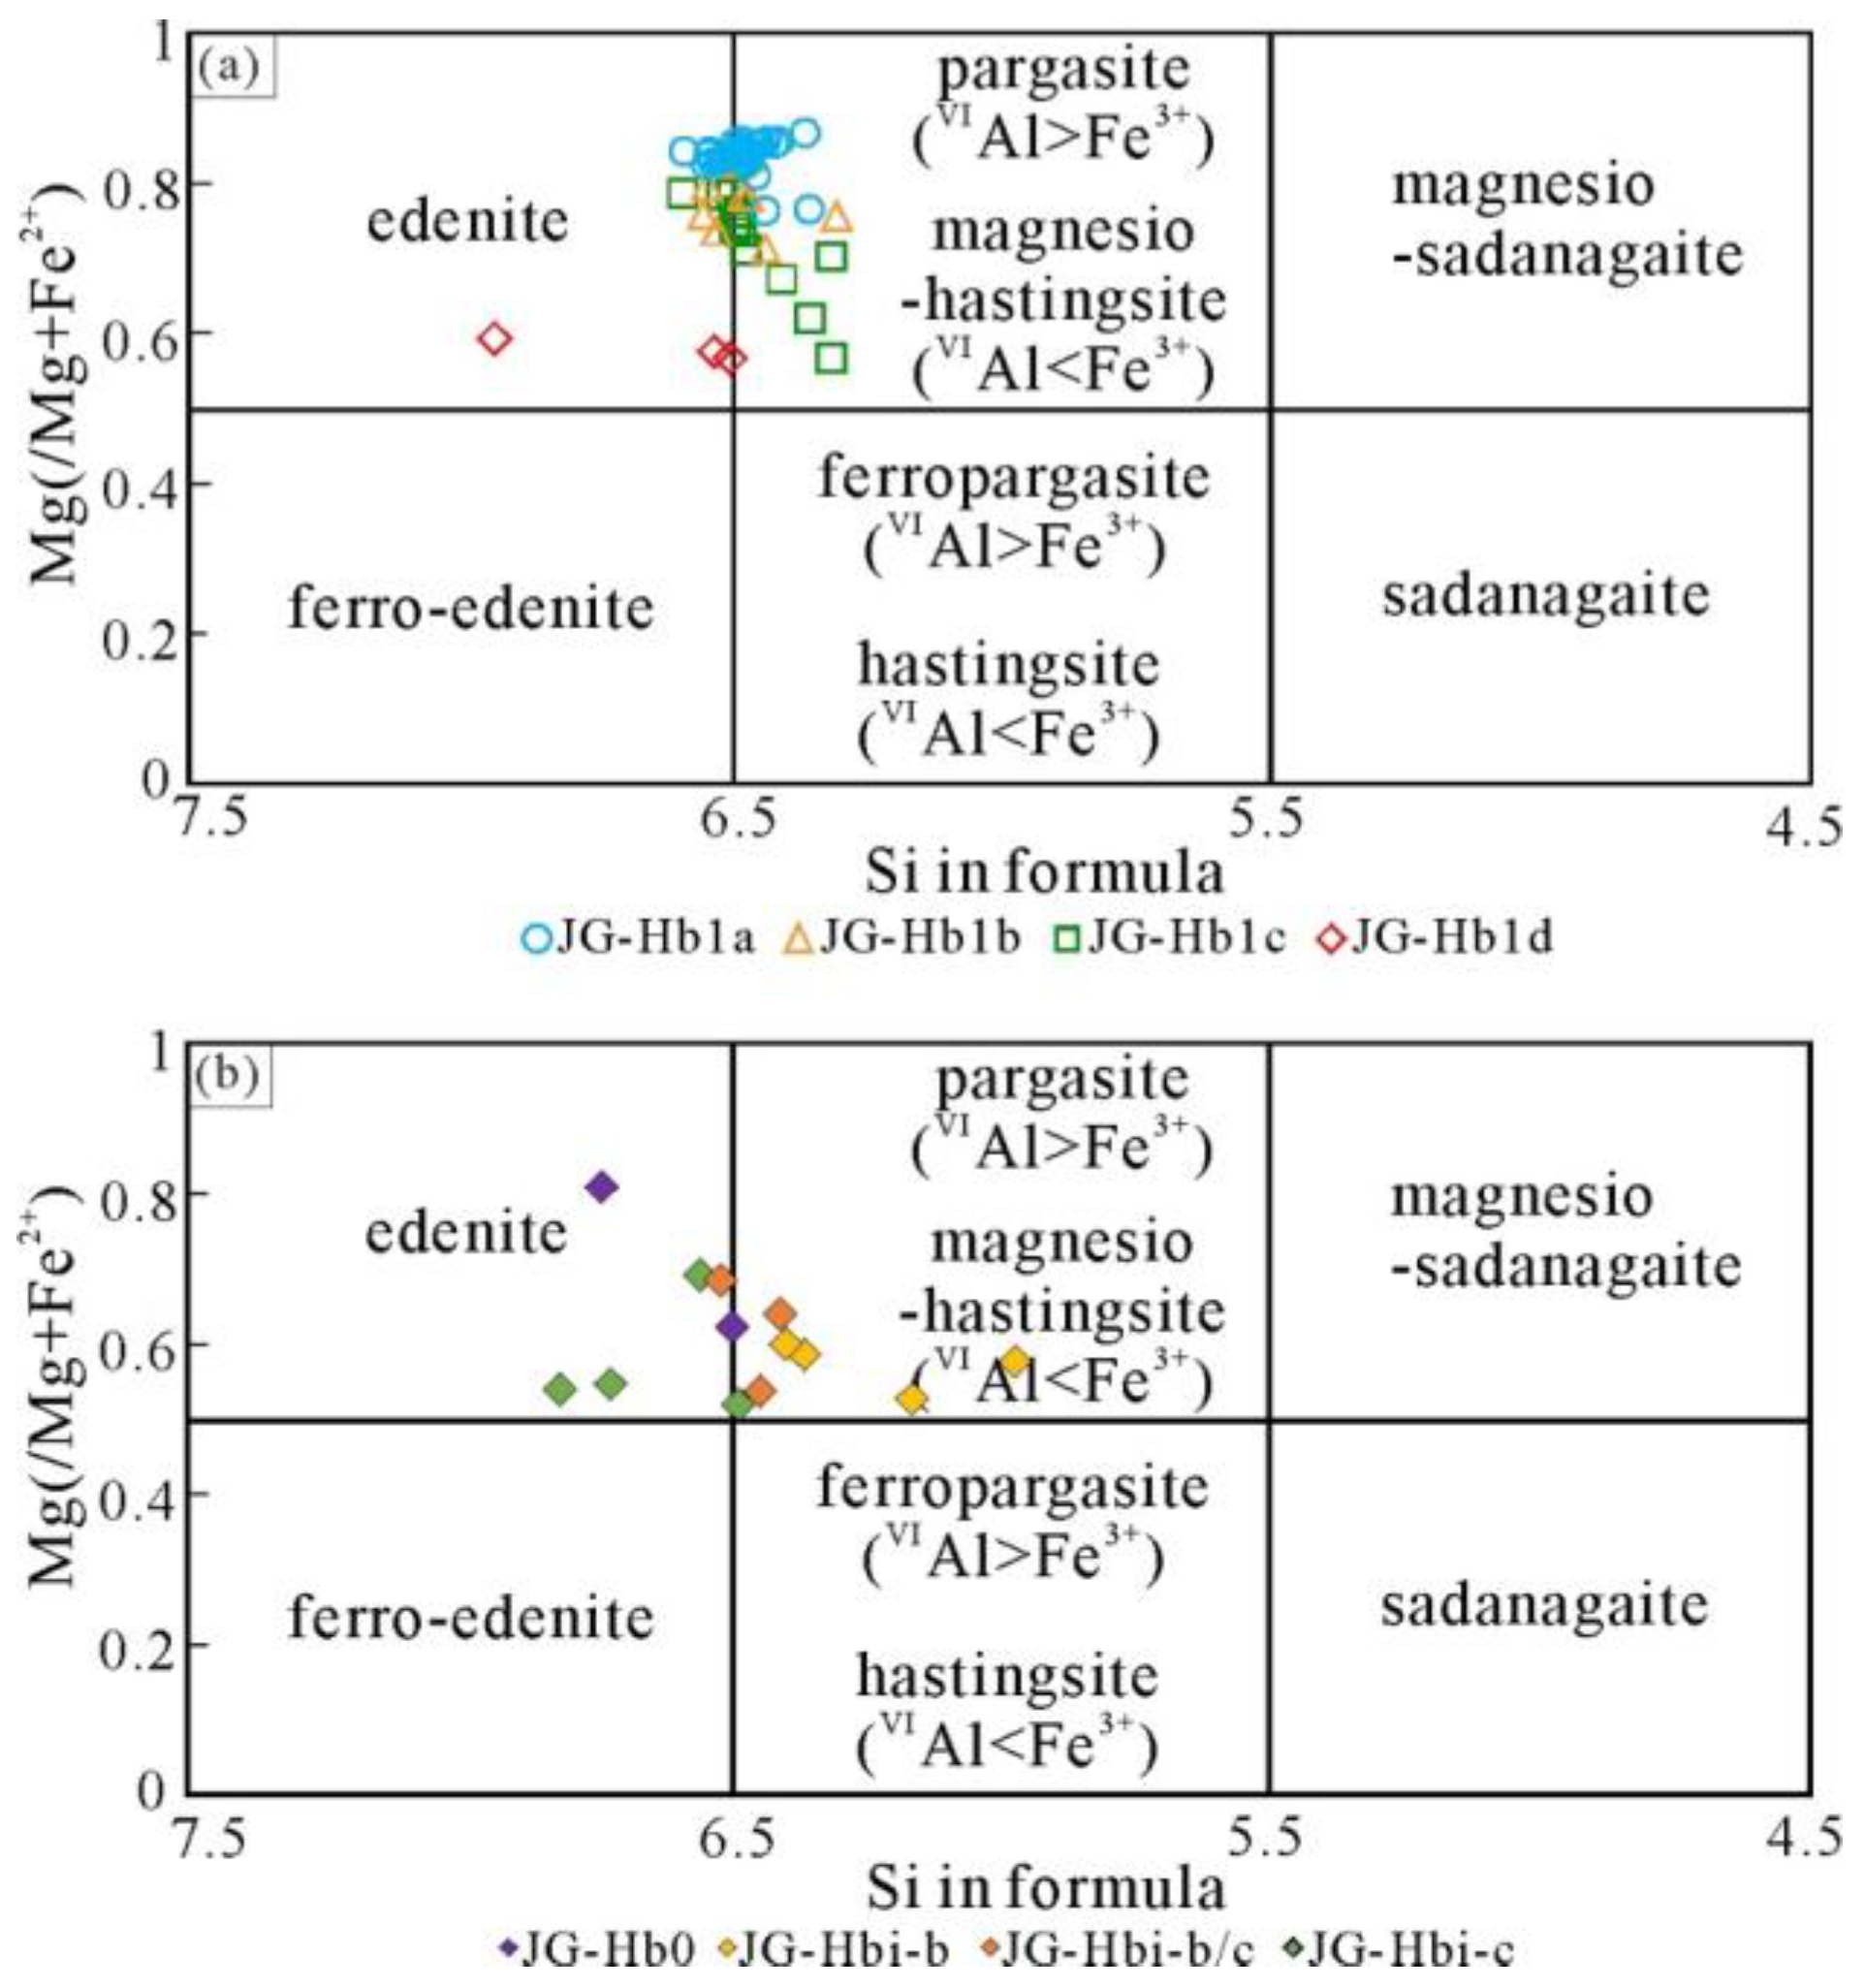
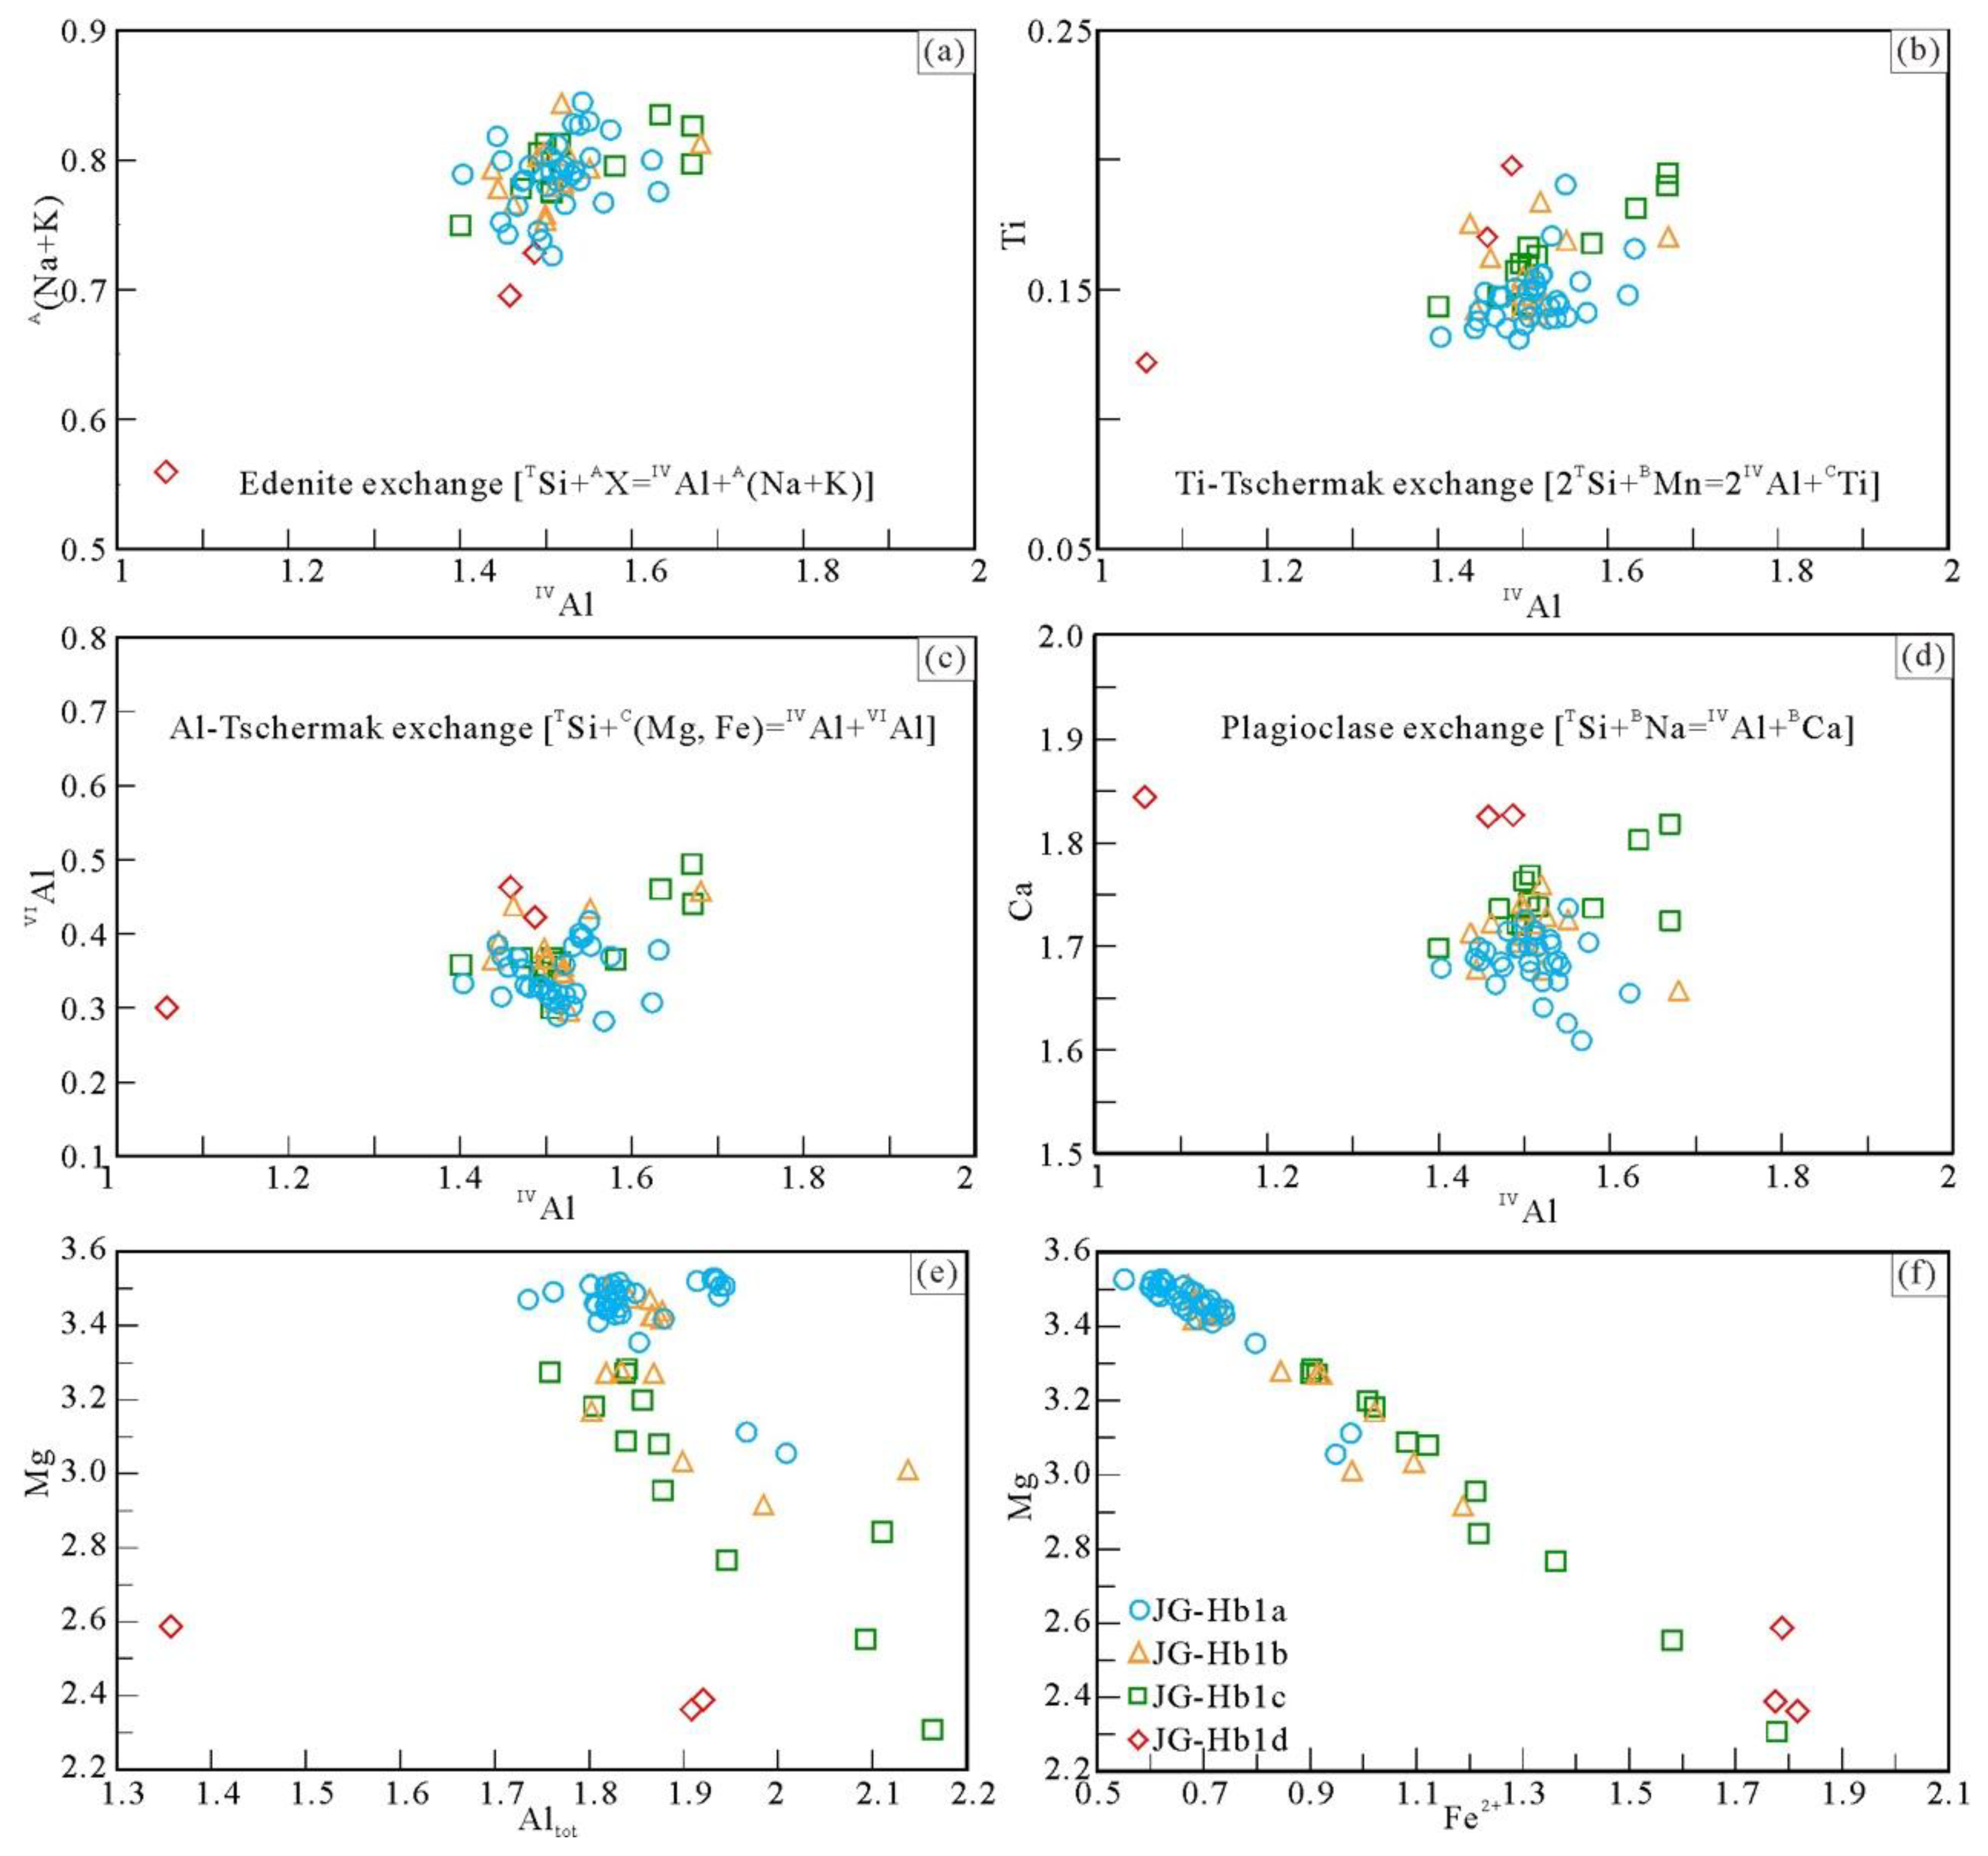
5.1. Hornblende
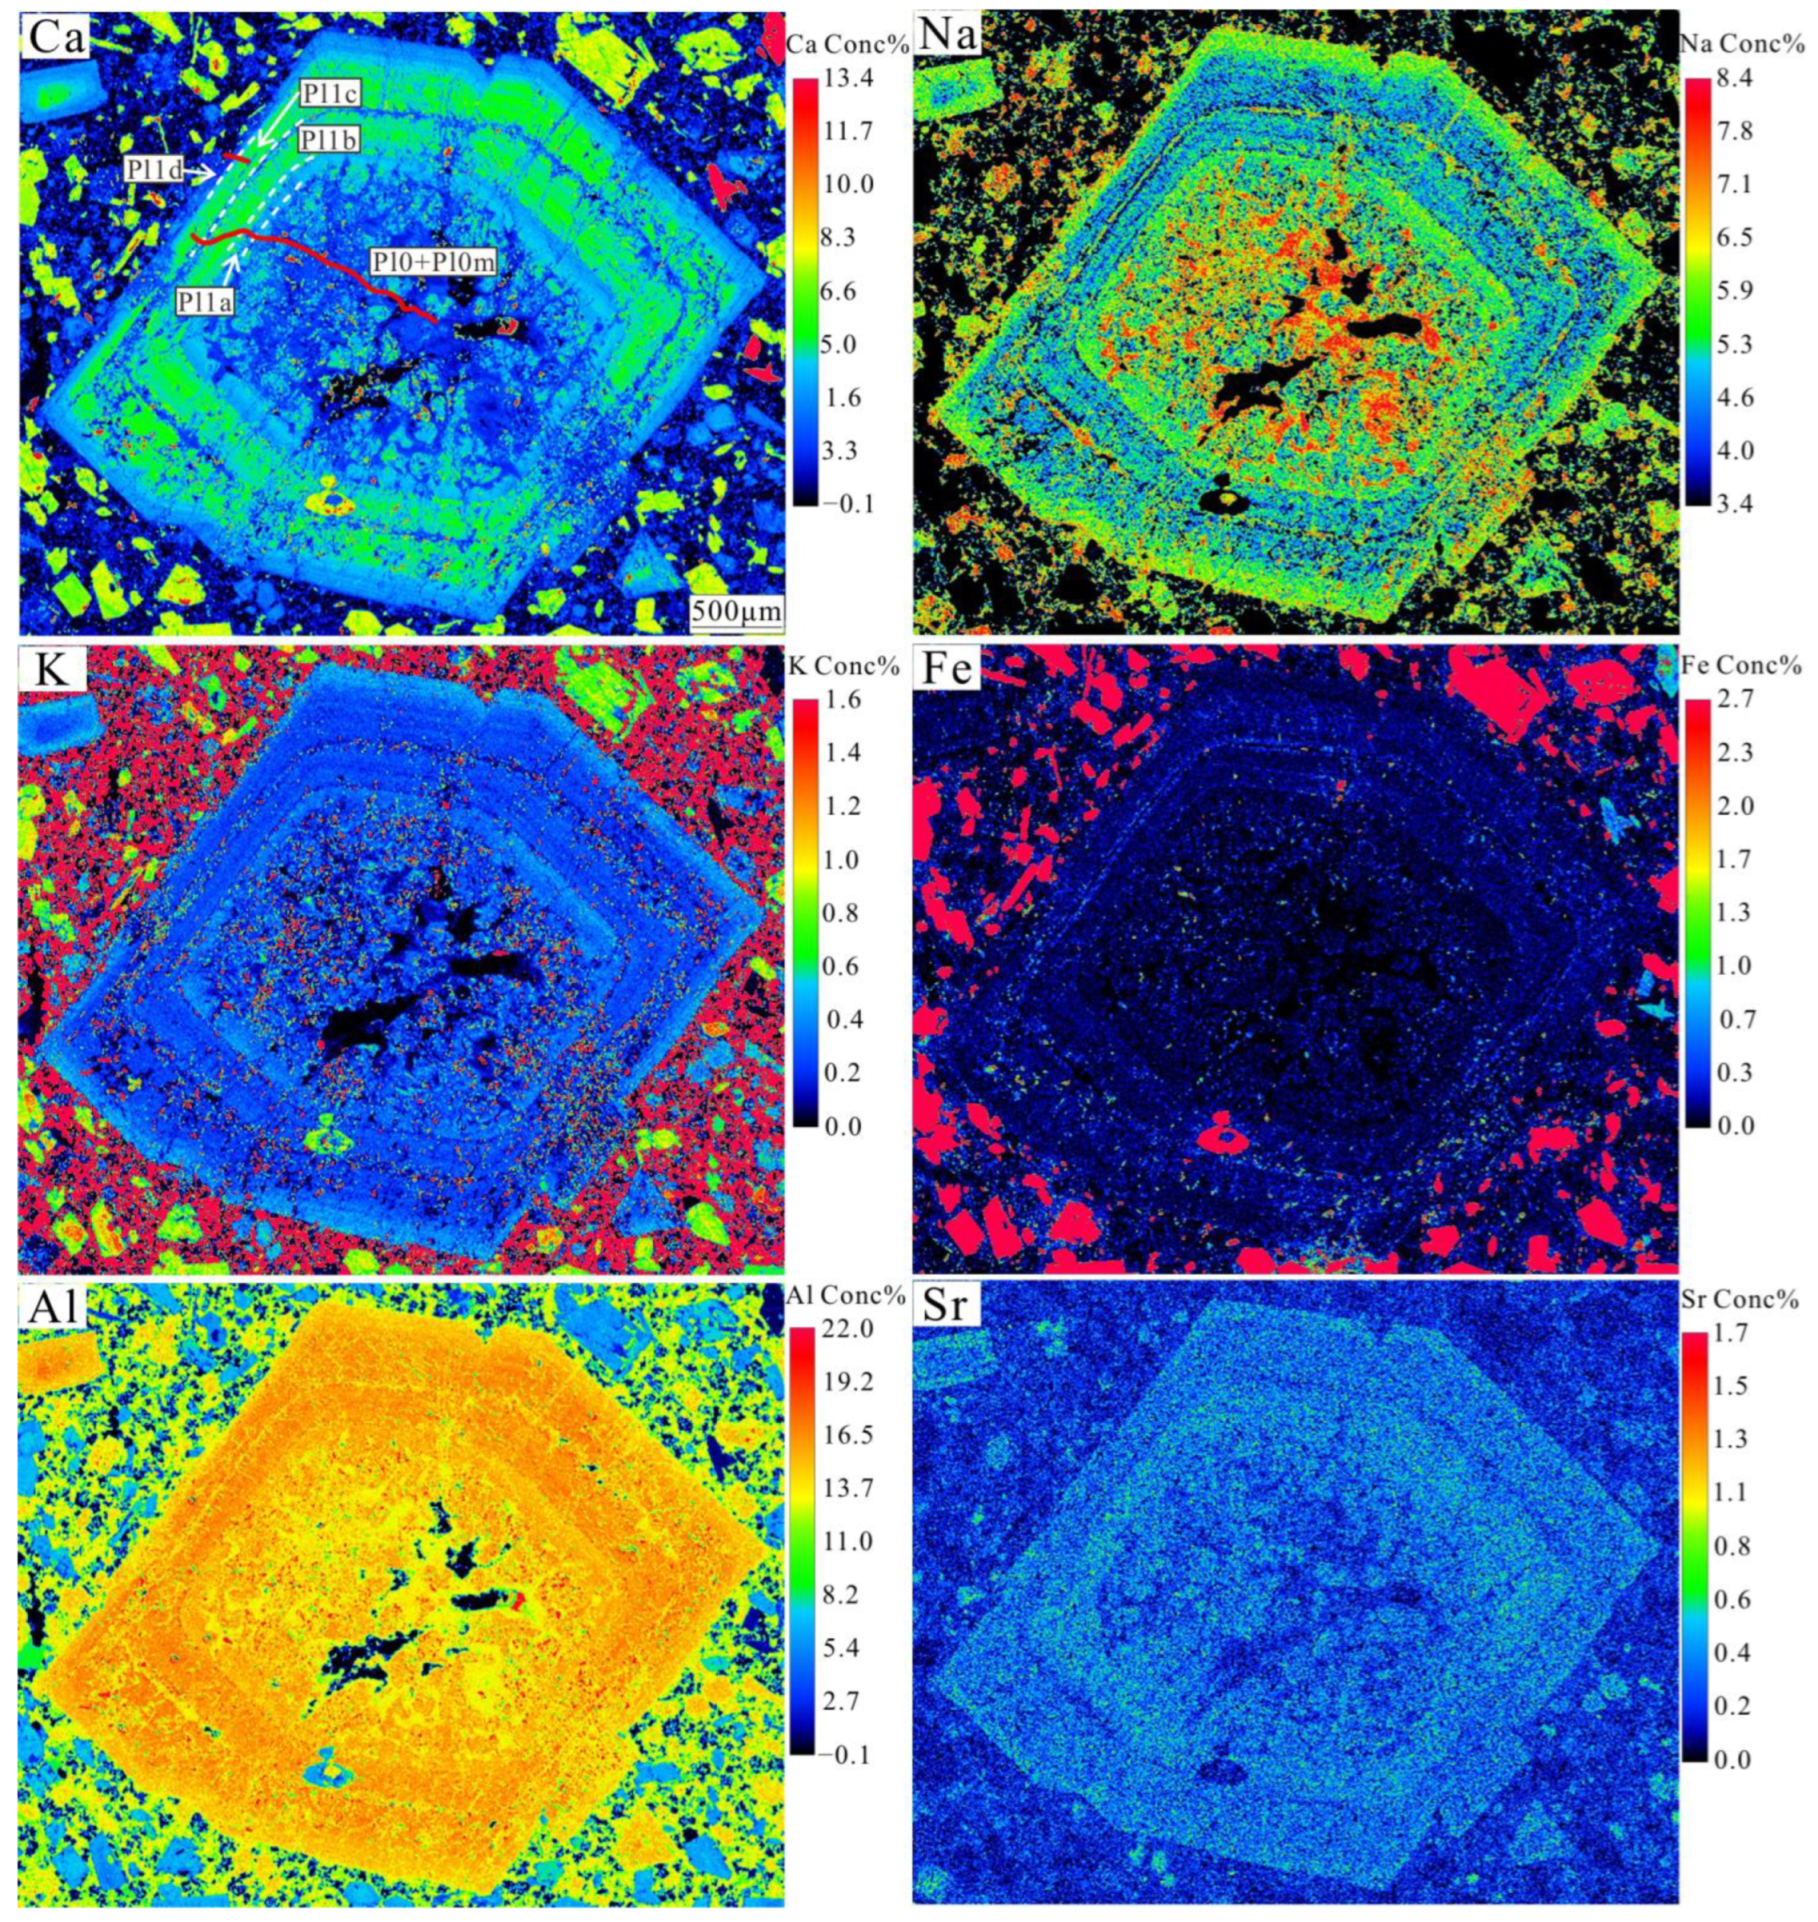
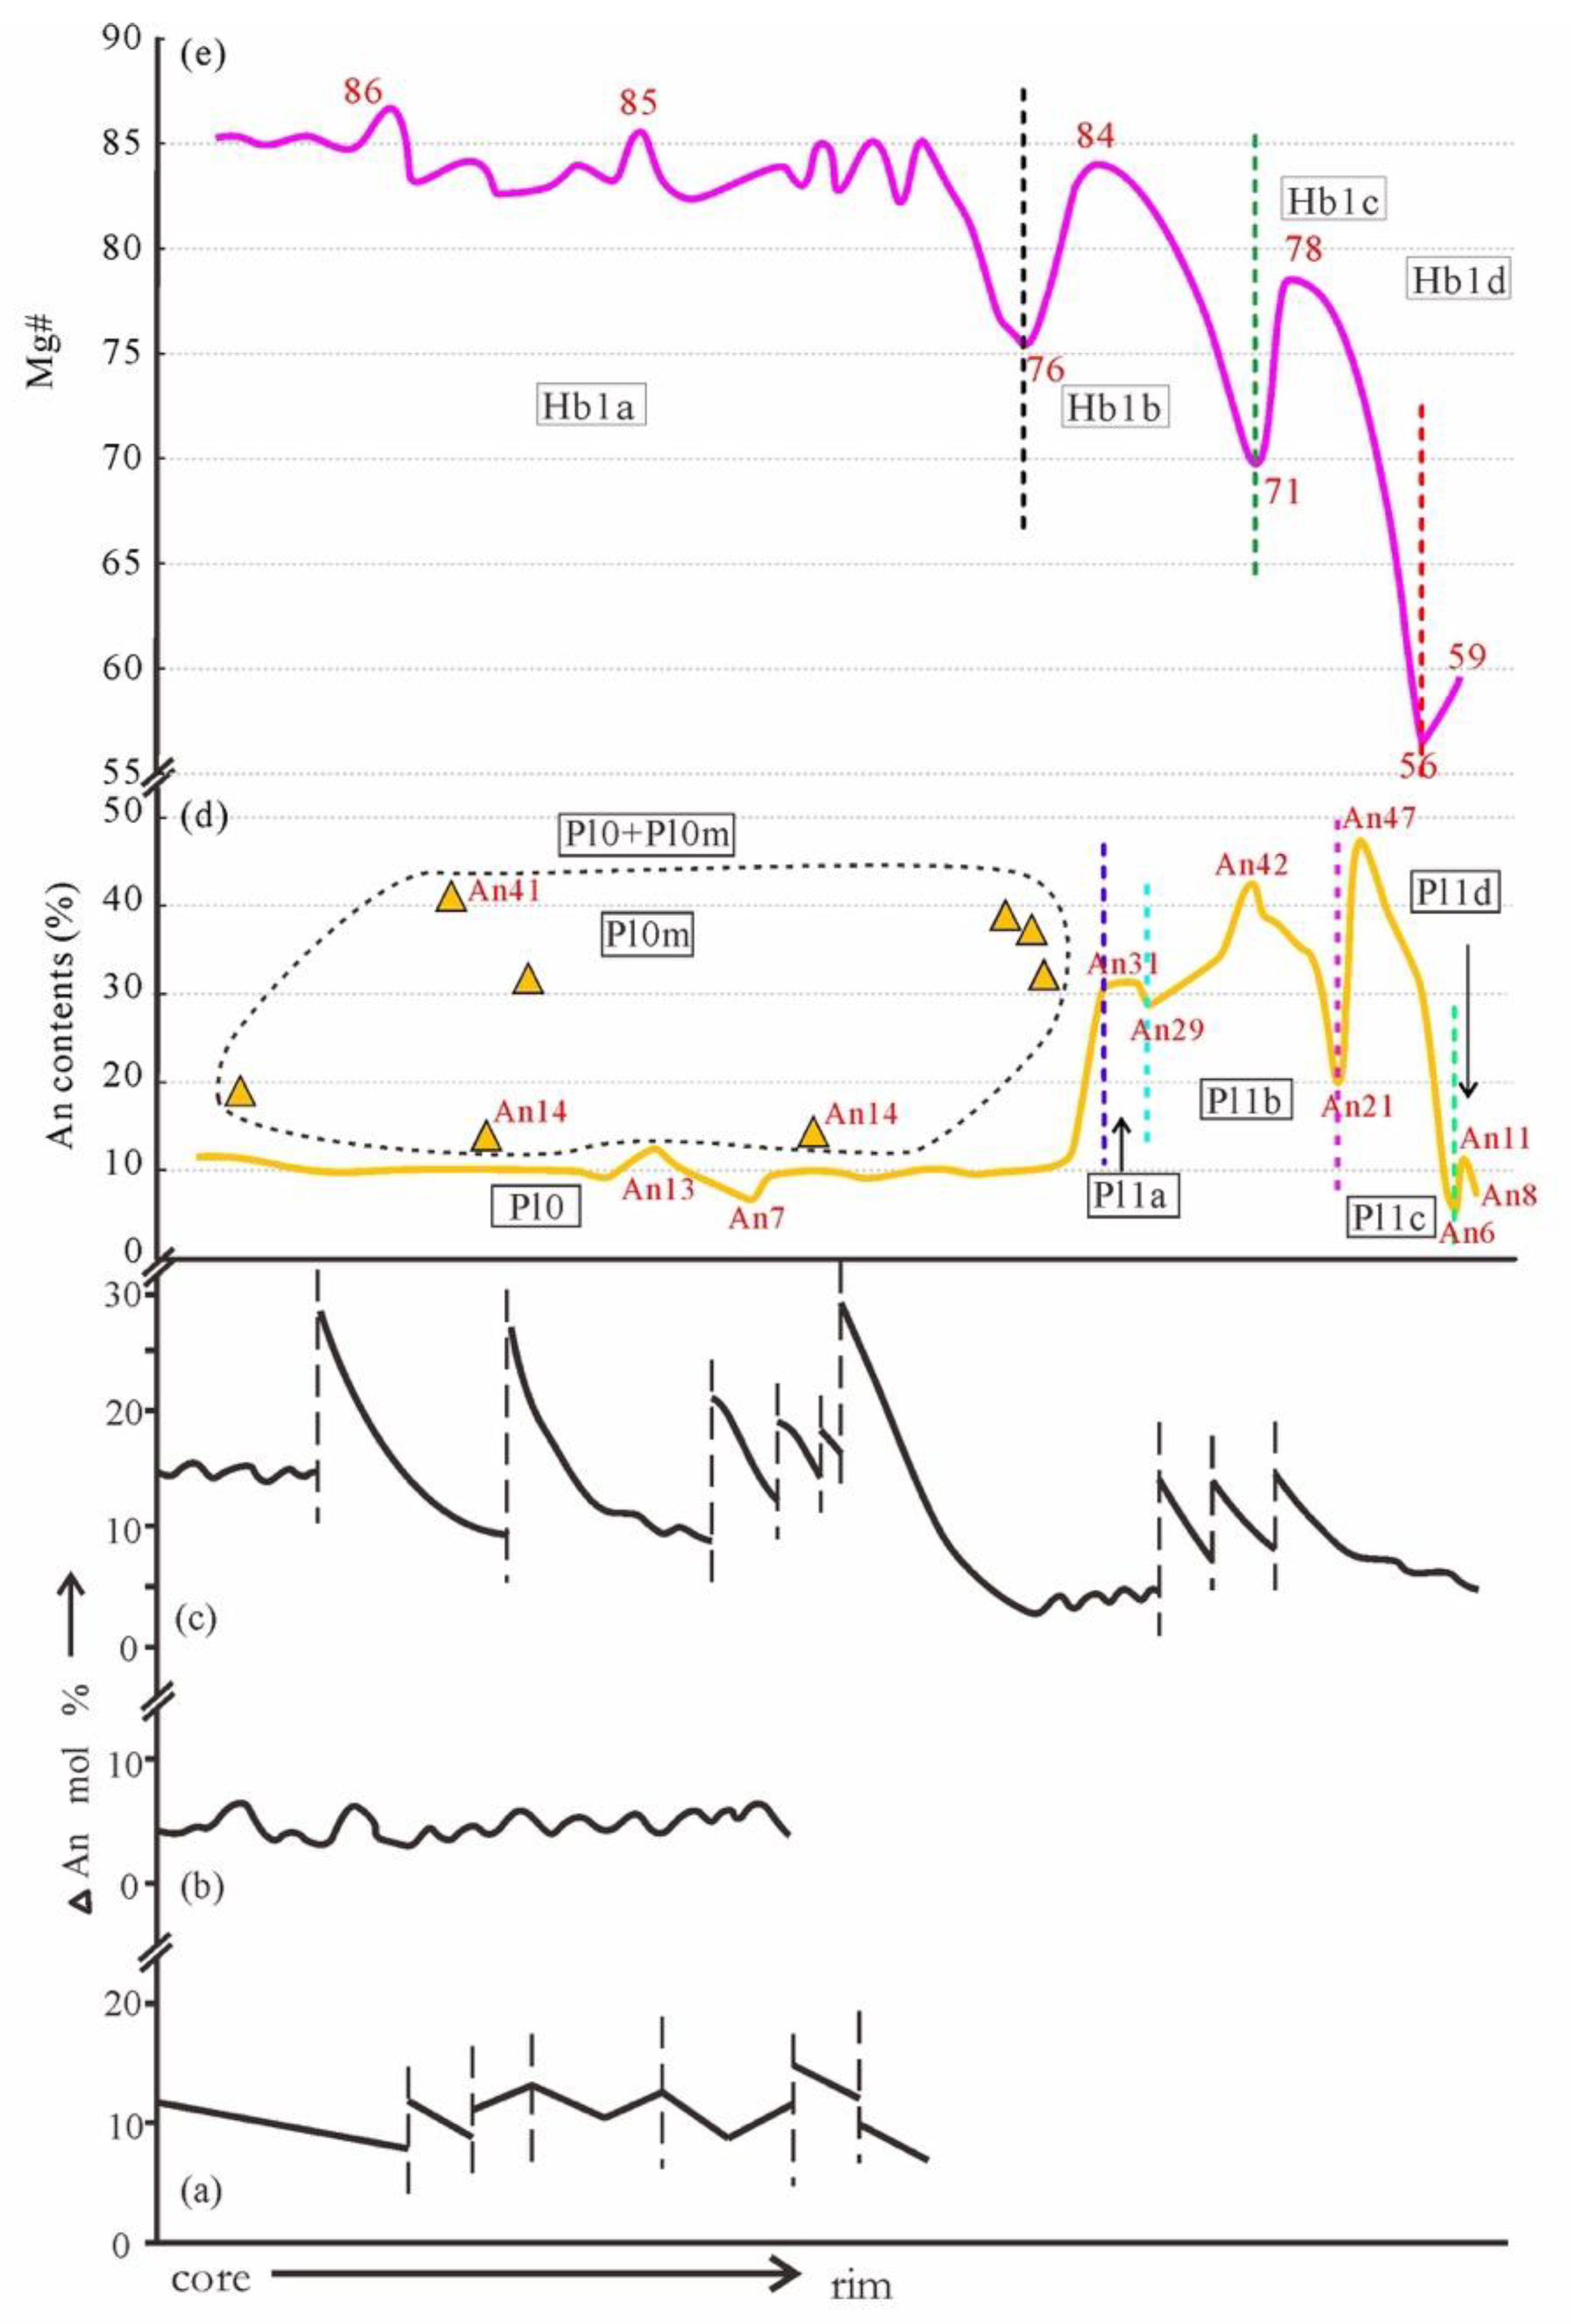
5.2. Plagioclase
5.3. Sr Isotopic Compositions of Plagioclase Phenocrysts
6. Discussion
6.1. Genesis of Plagioclase Sieve-Textured Core and Magma Mixing
6.2. Oscillatory Zoning and Multiple Magma Mixing
6.3. Petrogenesis of the Felsic and Mafic Magma End-Member
6.4. Implication of Multiple Magma Mixing for High-Mg# Adakite Petrogenesis
7. Conclusions
- Three distinct magma mixing events may have occurred during the formation of the Early Cretaceous Jiagou pluton, in the southeastern NCC margin.
- The initial felsic magma end-member is adakitic with low Ti and Cr contents and high Mg#. This initial magma was generated from the partial melting of eclogite-bearing subducted slab that was foundered into the asthenospheric mantle, where it reacted with a mixed enriched EMI and EMII mantle component.
- The three replenished mafic magma batches may have been derived from a Cr-rich clinopyroxene peridotite mantle source and a Cr-poor clinopyroxene (formed from olivine) peridotite mantle source. We suggest that repeated mafic magma injection and mixing, especially high-Mg ones, is a key mechanism for generating high-Mg adakitic magma from initial low-Mg adakitic melts.
Supplementary Materials
Author Contributions
Funding
Data Availability Statement
Acknowledgments
Conflicts of Interest
Abbreviations
| Pl | Plagioclase |
| Hb | Hornblende |
| NCC | North China Craton |
| YC | Yangtze Craton |
| MMEs | Mafic Microgranular Enclaves |
References
- Best, M.G. Igneous and Metamorphic Petrology, 2nd ed.; Wiley-Blackwell: Malden, MA, USA, 2003. [Google Scholar]
- Fernandez, A.N.; Barbarin, B. Relative rheology of coeval mafic and felsic magmas: Nature and resulting interaction processes and shape and mineral fabrics of mafic microgranular enclaves. In Enclaves and Granite Petrology; Elsevier: Amsterdam, The Netherlands, 1991; pp. 263–275. [Google Scholar]
- Sklyarov, E.; Fedorovsky, V. Magma mingling: Tectonic and geodynamic implications. Geotectonics 2006, 40, 120–134. [Google Scholar] [CrossRef]
- Poli, G.; Tommasini, S. A geochemical approach to the evolution of granitic plutons: A case study, the acid intrusions of Punta Falcone (northern Sardinia, Italy). Chem. Geol. 1991, 92, 87–105. [Google Scholar] [CrossRef]
- Drummond, M.S.; Defant, M.J. A model for Trondhjemite-Tonalite-Dacite Genesis and crustal growth via slab melting: Archean to modern comparisons. J. Geophys. Res. 1990, 95, 21503. [Google Scholar] [CrossRef]
- Martin, H.; Smithies, R.H.; Rapp, R.; Moyen, J.F.; Champion, D. An overview of adakite, tonalite–trondhjemite–granodiorite (TTG), and sanukitoid: Relationships and some implications for crustal evolution. Lithos 2005, 79, 1–24. [Google Scholar] [CrossRef]
- Zhang, L.; Li, S.; Zhao, Q. A review of research on adakites. Int. Geol. Rev. 2021, 63, 47–64. [Google Scholar] [CrossRef]
- Evans, O.C.; Hanson, G.N. Late- to post-kinematic Archean granitoids of the S.W. Superior Province: Derivation through direct mantle melting. In Greenstone Belts; De Wit, M.J., Ashwal, L.D., Eds.; Oxford University Press: Oxford, UK, 1997; pp. 280–295. [Google Scholar]
- Smithies, R.H.; Champion, D.C. The Archaean High-Mg Diorite Suite: Links to Tonalite-Trondhjemite-Granodiorite Magmatism and Implications for Early Archaean Crustal Growth. J. Petrol. 2000, 41, 1653–1671. [Google Scholar] [CrossRef]
- Gao, S.; Rudnick, R.L.; Yuan, H.L.; Liu, X.M.; Liu, Y.S.; Xu, W.L.; Ling, W.L.; Ayers, J.; Wang, X.C.; Wang, Q.H. Recycling lower continental crust in the North China craton. Nature 2004, 432, 892–897. [Google Scholar] [CrossRef]
- Zhao, Z.F.; Zheng, Y.F. Remelting of subducted continental lithosphere: Petrogenesis of Mesozoic magmatic rocks in the Dabie-Sulu orogenic belt. Sci. China Ser. D Earth Sci. 2009, 52, 1295–1318. [Google Scholar] [CrossRef]
- Defant, M.J.; Richerson, P.M.; De Boer, J.Z.; Stewart, R.H.; Maury, R.C.; Bellon, H.; Drummond, M.S.; Feigenson, M.D.; Jackson, T.E. Dacite genesis via both slab melting and differentiation: Petrogenesis of La Yeguada volcanic complex, Panama. J. Petrol. 1991, 32, 1101–1142. [Google Scholar] [CrossRef]
- Kay, R.W.; Kay, S.M. Andean adakites: Three ways to make them. Acta Petrol. Sin. 2002, 18, 303–311. [Google Scholar] [CrossRef]
- Huang, F.; Li, S.; Dong, F.; He, Y.; Chen, F. High-Mg adakitic rocks in the Dabie orogen, central China: Implications for foundering mechanism of lower continental crust. Chem. Geol. 2008, 255, 1–13. [Google Scholar] [CrossRef]
- Liu, S.A.; Li, S.; He, Y.; Huang, F. Geochemical contrasts between early Cretaceous ore-bearing and ore-barren high-Mg adakites in central-eastern China: Implications for petrogenesis and Cu-Au mineralization. Geochim. Cosmochim. Acta 2010, 74, 7160–7178. [Google Scholar] [CrossRef]
- Xu, W.L.; Wang, D.Y.; Liu, X.C.; Wang, Q.H.; Lin, J.Q. Discovery of eclogite inclusions and its geological significance in early Jurassic intrusive complex in Xuzhou northern Anhui, eastern China. Chin. Sci. Bull. 2002, 47, 1212–1216. [Google Scholar] [CrossRef]
- Grove, T.; Parman, S.; Bowring, S.; Price, R.; Baker, M. The role of an H2O-rich fluid component in the generation of primitive basaltic andesites and andesites from the Mt. Shasta region, N California. Contrib. Mineral. Petrol. 2002, 142, 375–396. [Google Scholar] [CrossRef]
- Chen, B.; Jahn, B.M.; Suzuki, K. Petrological and Nd-Sr-Os isotopic constraints on the origin of high-Mg adakitic rocks from the North China Craton: Tectonic implications. Geology 2013, 41, 91–94. [Google Scholar] [CrossRef]
- Xu, H.J.; Ma, C.Q.; Zhang, J.F.; Ye, K. Early Cretaceous low-Mg adakitic granites from the Dabie orogen, eastern China: Petrogenesis and implications for destruction of the over-thickened lower continental crust. Gondwana Res. 2013, 23, 190–207. [Google Scholar] [CrossRef]
- Chen, C.J.; Chen, B.; Li, Z.; Tian, W. Important role of magma mixing in generating the Mesozoic monzodioritic–granodioritic intrusions related to Cu mineralization, Tongling, East China: Evidence from petrological and in situ Sr-Hf isotopic data. Lithos 2016, 248, 80–93. [Google Scholar] [CrossRef]
- Gao, G.; Xu, Z.W.; Yang, X.N.; Wang, Y.J.; Zhang, J.; Jiang, S.Y.; Ling, H.F. Petrogenesis of the Baimangshan pyroxene diorite intrusion in Tongling Area, Anhui Province: Constraints from Sr-Nd-Pb-O isotopes. J. Nanjing Univ. (Nat. Sci.) 2006, 42, 269–279, (In Chinese with English Abstract). [Google Scholar] [CrossRef]
- Yan, G.H.; Cai, J.H.; Ren, K.X.; Mu, B.L.; Chu, Z.Y. Nd, Sr and Pb isotopic geochemistry of late-Mesozoic alkaline-rich intrusions from the Tanlu Fault zone: Evidence of the magma source. Acta Petrol. Sin. 2008, 24, 1223–1236, (In Chinese with English Abstract). [Google Scholar]
- Chiaradia, M.; Merino, D.; Spikings, R. Rapid transition to long-lived deep crustal magmatic maturation and the formation of giant porphyry-related mineralization (Yanacocha, Peru). Earth Planet. Sci. Lett. 2009, 288, 505–515. [Google Scholar] [CrossRef]
- Nixon, G.T.; Pearce, T.H. Laser-interferometry study of oscillatory zoning in plagioclase; the record of magma mixing and phenocryst recycling in calc-alkaline magma chambers, Iztaccihuatl Volcano, Mexico. Am. Mineral. 1987, 72, 1144–1162. [Google Scholar]
- Hibbard, M.J. Textural anatomy of twelve magma-mixed granitoid systems. In Enclaves and Granite Petrology; Elsevier: Amsterdam, The Netherlands, 1991; pp. 431–444. [Google Scholar]
- Ustunisik, G.; Kilinc, A.; Nielsen, R.L. New insights into the processes controlling compositional zoning in plagioclase. Lithos 2014, 200–201, 80–93. [Google Scholar] [CrossRef]
- Chen, B.; Liu, C.Q.; Tian, W. Magma mixing between mantle and crustal-derived melts in the process pf Mesozoic magmatism, Taihangshan: Constraints from petrology and geochemistry. Earth Sci. Front. 2006, 13, 140–147, (In Chinese with English Abstract). [Google Scholar]
- Chen, B.; He, J.; Ma, X. Petrogenesis of mafic enclaves from the north Taihang Yanshanian intermediate to felsic plutons: Evidence from petrological, geochemical, and zircon Hf-O isotopic data. Sci. China Ser. D Earth Sci. 2009, 52, 1331–1344. [Google Scholar] [CrossRef]
- Chen, Q.; Yu, S.Y.; Chen, L.M.; Zhou, S.H.; Kang, J. Textural and compositional zoning in plagioclase phenocrysts: Implications for magma chamber processes in the Emeishan large Igneous Province, SW China. Acta Geochim. 2023, 42, 453–470. [Google Scholar] [CrossRef]
- Shane, P.; Cronin, S. Pre-eruptive magmatic processes at Taranaki volcano from an amphibole perspective. J. Volcanol. Geotherm. Res. 2024, 452, 108144. [Google Scholar] [CrossRef]
- Zhao, G.C.; Sun, M.; Wilde, S.A.; Li, S.Z. Late Archean to Paleoproterozoic evolution of the North China Craton: Key issues revisited. Precambrian Res. 2005, 136, 177–202. [Google Scholar] [CrossRef]
- Zhao, G.C.; Zhai, M.G. Lithotectonic elements of Precambrian basement in the North China Craton: Review and tectonic implications. Gondwana Res. 2013, 23, 1207–1240. [Google Scholar] [CrossRef]
- Zhao, G.C.; Cawood, P.A. Precambrian geology of China. Precambrian Res. 2012, 222–223, 13–54. [Google Scholar] [CrossRef]
- Zhao, G.C.; Wilde, S.A.; Cawood, P.A.; Sun, M. Archean blocks and their boundaries in the North China Craton: Lithological, geochemical, structural and P–T path constraints and tectonic evolution. Precambrian Res. 2001, 107, 45–73. [Google Scholar] [CrossRef]
- Kusky, T.M. Geophysical and geological tests of tectonic models of the North China Craton. Gondwana Res. 2011, 20, 26–35. [Google Scholar] [CrossRef]
- Eizenhöfer, P.R.; Zhao, G.C. Solonker Suture in East Asia and its bearing on the final closure of the eastern segment of the Paleo-Asian Ocean. Earth-Sci. Rev. 2018, 186, 153–172. [Google Scholar] [CrossRef]
- Li, S.Z.; Zhao, G.C.; Dai, L.M.; Liu, X.; Zhou, L.H.; Santosh, M.; Suo, Y.H. Mesozoic basins in eastern China and their bearing on the deconstruction of the North China Craton. J. Asian Earth Sci. 2012, 47, 64–79. [Google Scholar] [CrossRef]
- Ernst, W.G.; Tsujimori, T.; Zhang, R.Y.; Liou, J.G. Permo-Triassic Collision, Subduction-Zone Metamorphism, and Tectonic Exhumation Along the East Asian Continental Margin. Annu. Rev. Earth Planet. Sci. 2007, 35, 73–110. [Google Scholar] [CrossRef]
- Wu, F.Y.; Lin, J.Q.; Wilde, S.A.; Zhang, X.; Yang, J.H. Nature and significance of the Early Cretaceous giant igneous event in eastern China. Earth Planet. Sci. Lett. 2005, 233, 103–119. [Google Scholar] [CrossRef]
- Liu, Y.C.; Wang, A.D.; Rolfo, F.; Groppo, C.; Gu, X.F.; Song, B. Geochronological and petrological constraints on Paleoproterozoic granulite facies metamorphism in southeastern margin of the North China Craton. J. Metamorph. Geol. 2009, 27, 125–138. [Google Scholar] [CrossRef]
- Yang, W.; Li, S.G. Geochronology and geochemistry of the Mesozoic volcanic rocks in Western Liaoning: Implications for lithospheric thinning of the North China Craton. Lithos 2008, 102, 88–117. [Google Scholar] [CrossRef]
- Zhu, R.X.; Chen, L.; Wu, F.Y.; Liu, J.L. Timing, scale and mechanism of the destruction of the North China Craton. Sci. China Earth Sci. 2011, 54, 789–797. [Google Scholar] [CrossRef]
- Menzies, M.; Xu, Y.G.; Zhang, H.F.; Fan, W.M. Integration of geology, geophysics and geochemistry: A key to understanding the North China Craton. Lithos 2007, 96, 1–21. [Google Scholar] [CrossRef]
- Wu, F.Y.; Zhang, Y.B.; Yang, J.H.; Xie, L.W.; Yang, Y.H. Zircon U–Pb and Hf isotopic constraints on the Early Archean crustal evolution in Anshan of the North China Craton. Precambrian Res. 2008, 167, 339–362. [Google Scholar] [CrossRef]
- Zhu, R.X.; Yang, J.H.; Wu, F.Y. Timing of destruction of the North China Craton. Lithos 2012, 149, 51–60. [Google Scholar] [CrossRef]
- Gao, S.; Zhang, J.F.; Xu, W.L.; Liu, Y.S. Delamination and destruction of the North China Craton. Chin. Sci. Bull. 2009, 54, 3367–3378. [Google Scholar] [CrossRef]
- Gao, S.; Rudnick, R.L.; Xu, W.L.; Yuan, H.L.; Liu, Y.S.; Walker, R.J.; Puchtel, I.S.; Liu, X.; Huang, H.; Wang, X.R.; et al. Recycling deep cratonic lithosphere and generation of intraplate magmatism in the North China Craton. Earth Planet. Sci. Lett. 2008, 270, 41–53. [Google Scholar] [CrossRef]
- Yang, J.H.; Wu, F.Y.; Wilde, S.A.; Xie, L.W.; Yang, Y.H.; Liu, X.M. Tracing magma mixing in granite genesis: In situ U–Pb dating and Hf-isotope analysis of zircons. Contrib. Mineral. Petrol. 2007, 153, 177–190. [Google Scholar] [CrossRef]
- Li, S.; Wang, T.; Wilde, S.A.; Tong, Y. Evolution, source and tectonic significance of Early Mesozoic granitoid magmatism in the Central Asian Orogenic Belt (central segment). Earth-Sci. Rev. 2013, 126, 206–234. [Google Scholar] [CrossRef]
- Tuo, J.; Wu, C.; Wang, G.; Wu, J.; Zhou, Z.; Li, J.; Haproff, P.J. Neoproterozoic–Mesozoic Tectono-Magmatic evolution of the northern Dabie Orogen, eastern China. J. Asian Earth Sci. 2022, 228, 105138. [Google Scholar] [CrossRef]
- Xu, W.L.; Wang, Q.H.; Liu, X.C.; Wang, D.Y.; Guo, J.H. Chronology and Sources of Mesozoic Intrusive Complexes in the Xuzhou-Huainan Region, Central China: Constraints from SHRIMP Zircon U-Pb Dating. Acta Geol. Sin.—Engl. Ed. 2004, 78, 96–106. [Google Scholar] [CrossRef]
- Wang, B.; Zhou, J.B.; Ding, Z.J.; Wilde, S.A.; Song, M.C.; Zhao, T.Q.; Bao, Z.Y. Late Mesozoic magmatism and gold metallogeny of the Jiaodong Peninsula, China: A response to the destruction of the North China Craton. GSA Bull. 2023, 136, 1395–1412. [Google Scholar] [CrossRef]
- Liu, H.C.; Wang, Y.J.; Li, Z.H.; Zi, J.W.; Huangfu, P.P. Geodynamics of the Indosinian orogeny between the South China and Indochina blocks: Insights from latest Permian–Triassic granitoids and numerical modeling. GSA Bull. 2018, 130, 1289–1306. [Google Scholar] [CrossRef]
- Wu, F.Y.; Xu, Y.G.; Zhu, R.X.; Zhang, G.W. Thinning and destruction of the cratonic lithosphere: A global perspective. Sci. China Earth Sci. 2014, 57, 2878–2890. [Google Scholar] [CrossRef]
- Dong, Y.P.; Hui, B.; Sun, S.S.; He, D.F.; Sun, J.P.; Zhang, F.F.; Cheng, C.; Yang, Z.; Shi, X.H.; Zang, R.T.; et al. Neoproterozoic tectonic evolution and proto-basin of the Yangtze Block, China. Earth-Sci. Rev. 2024, 249, 104669. [Google Scholar] [CrossRef]
- Zhang, R.Y.; Liou, J.G.; Ernst, W.G. The Dabie–Sulu continental collision zone: A comprehensive review. Gondwana Res. 2009, 16, 1–26. [Google Scholar] [CrossRef]
- Liou, J.G.; Ernst, W.G.; Zhang, R.Y.; Tsujimori, T.; Jahn, B.M. Ultrahigh-pressure minerals and metamorphic terranes—The view from China. J. Asian Earth Sci. 2009, 35, 199–231. [Google Scholar] [CrossRef]
- Liu, S.A. Geochemical Studies on Petrogenesis of Mesozoic Adakitic Rocks in Central-Eastern China and High-Temperature Magnesium Isotope Fractionation. Ph.D. Thesis, University of Science and Technology of China, Hefei, China, 2011. [Google Scholar]
- Zhang, X.; Yang, X.; Pirajno, F. Recycling of paleo-Pacific subducted oceanic crust related to a Fe-Cu-Au mineralization in the Xu-Huai region of North Anhui-Jiangsu, East China: Geochronological and geochemical constraints. Int. Geol. Rev. 2018, 60, 1621–1643. [Google Scholar] [CrossRef]
- Liu, Y.C.; Wang, A.D.; Li, S.G.; Rolfo, F.; Li, Y.; Groppo, C.; Gu, X.F.; Hou, Z.H. Composition and geochronology of the deep-seated xenoliths from the southeastern margin of the North China Craton. Gondwana Res. 2013, 23, 1021–1039. [Google Scholar] [CrossRef]
- Shu, L.S.; Yin, H.W.; Faure, M.; Chen, Y. Mesozoic intracontinental underthrust in the SE margin of the North China Block: Insights from the Xu-Huai thrust-and-fold belt. J. Asian Earth Sci. 2017, 141, 161–173. [Google Scholar] [CrossRef]
- Droop, G.T.R. A General Equation for Estimating Fe3+ Concentrations in Ferromagnesian Silicates and Oxides from Microprobe Analyses, Using Stoichiometric Criteria. Mineral. Mag. 1987, 51, 431–435. [Google Scholar] [CrossRef]
- Deer, W.A.; Howie, R.A.; Zussman, J. An Introduction to the Rock-Forming Minerals, 3rd ed.; Berforts Information Press: Stevenage, UK, 2013; pp. 280–295. [Google Scholar]
- Hu, Z.C.; Zhang, W.; Liu, Y.S.; Gao, S.; Li, M.; Zong, K.Q.; Chen, H.H.; Hu, S.H. “Wave” Signal-Smoothing and Mercury-Removing Device for Laser Ablation Quadrupole and Multiple Collector ICPMS Analysis: Application to Lead Isotope Analysis. Anal. Chem. 2015, 87, 1152–1157. [Google Scholar] [CrossRef]
- Zhang, W.; Hu, Z.C.; Liu, Y.S. Iso-Compass: New freeware software for isotopic data reduction of LA-MC-ICP-MS. J. Anal. At. Spectrom. 2020, 35, 1087–1096. [Google Scholar] [CrossRef]
- Tong, X.R.; Liu, Y.S.; Hu, Z.C.; Chen, H.H.; Zhou, L.; Hu, Q.H.; Xu, R.; Deng, L.X.; Chen, C.F.; Yang, L.; et al. Accurate determination of Sr isotopic compositions in clinopyroxene and silicate glasses by LA-MC-ICP-MS. Geostand. Geoanal. Res. 2016, 40, 85–99. [Google Scholar] [CrossRef]
- Zhang, W.; Hu, Z.; Liu, Y.S.; Wu, T.; Deng, X.D.; Guo, J.L.; Zhao, H. Improved in situ Sr isotopic analysis by a 257 nm femtosecond laser in combination with the addition of nitrogen for geological minerals. Chem. Geol. 2018, 479, 10–21. [Google Scholar] [CrossRef]
- Leake, B.E.; Woolley, A.R.; Arps, C.E.S.; Birch, W.D.; Gilbert, M.C.; Grice, J.D.; Hawthorne, F.C.; Kato, A.; Kisch, H.J.; Krivovichev, V.G.; et al. Nomenclature of amphiboles: Report of the subcommittee on amphiboles of the international mineralogical association commission on new minerals and mineral names. Am. Mineral. 1997, 82, 1019–1037. [Google Scholar] [CrossRef]
- Xu, W.L.; Wang, Q.H.; Wang, D.Y.; Guo, J.H.; Pei, F.P. Mesozoic adakitic rocks from the Xuzhou-Suzhou area, eastern China: Evidence for partial melting of delaminated lower continental crust. J. Asian Earth Sci. 2006, 27, 454–464. [Google Scholar] [CrossRef]
- Tsuchiyama, A. Dissolution Kinetics of Plagioclase in the Melt of the System Diopside-Albite-Anorthite, and Origin of Dusty Plagioclase in Andesites. Contrib. Mineral. Petrol. 1985, 89, 1–16. [Google Scholar] [CrossRef]
- Nelson, S.T.; Montana, A. Sieved Textured Plagioclase in Volcanic Rocks Produced by Rapid Decompression. Am. Mineral. 1992, 77, 1242–1249. [Google Scholar]
- Sousa, C.S.; Conceição, H.; Soares, H.S.; Fernandes, D.M.; Rosa, M.D.L.D.S. Magmatic processes recorded in plagioclase crystals of the Rio Jacaré Batholith, Sergipano Orogenic System, Northeast Brazil. J. S. Am. Earth Sci. 2022, 118, 103942. [Google Scholar] [CrossRef]
- Vernon, R.H. Rapakivi granite problems: Plagioclase mantles and ovoid megacrysts. Aust. J. Earth Sci. 2016, 63, 675–700. [Google Scholar] [CrossRef]
- Lin, J.Q.; Tan, D.J.; Li, H.H.; Liu, Z.S. Early Jurassic Banjing intrusive complex of southern marginal zone of North China Block, Xuzhou. J. Chang. Univ. Sci. Technol. 2000, 30, 209–214, (In Chinese with English Abstract). [Google Scholar]
- Xu, W.L.; Gao, S.; Wang, Q.H.; Wang, D.Y.; Liu, Y.S. Mesozoic crustal thickening of the eastern North China craton: Evidence from eclogite xenoliths and petrologic implications. Geology 2006, 34, 721–724. [Google Scholar] [CrossRef]
- Wang, Q.H.; Xu, W.L.; Wang, D.Y.; Lin, J.Q.; Gao, S. Composition and thermal state of Mesozoic deep crust in Xu-Huai area: Evidence from deep-seated xenoliths. Geotecton. Metallog. 2003, 27, 362–371, (In Chinese with English Abstract). [Google Scholar]
- Wang, Q.H.; Xu, W.L.; Wang, D.Y.; Lin, J.Q. Determination of the Magma Depth of the Mesozoic Adakitic Rocks in the Xuzhou-Suzhou Area: Evidence from P-T Estimation of Deep-seated Xenoliths. Geol. Rev. 2004, 50, 351–359, (In Chinese with English Abstract). [Google Scholar]
- Zhang, Y. Characteristic of the Mesozoic Xenoliths and the Hosted Jiagou Intrusion in the Southeastern North China Craton and Its Implications. Master’s Thesis, China University of Geosciences, Wuhan, China, 2015. [Google Scholar]
- Zhou, Q.J.; Xu, W.L.; Wang, Q.H.; Yang, D.B.; Pei, F.P.; Yu, Y. Petrogenesis of olivine-bearing clinopyroxenite xenolith in Early Cretaceous adakitic rocks from Xuhuai area in Eastern China and its petrologic implication. Earth Sci.-J. China Univ. Geosci. 2014, 39, 141–154, (In Chinese with English Abstract). [Google Scholar]
- Chen, B.; Zhai, M.G.; Tian, W. Origin of the Mesozoic magmatism in the North China Craton: Constraints from petrological and geochemical data. Geol. Soc. Lond. Spec. Publ. 2007, 280, 131–151. [Google Scholar] [CrossRef]
- Loomis, T.P. Numerical simulations of crystallization processes of plagioclase in complex melts: The origin of major and oscillatory zoning in plagioclase. Contrib. Mineral. Petrol. 1982, 81, 219–229. [Google Scholar] [CrossRef]
- Stamatelopoulou-Seymour, K.; Vlassopoulos, D.; Pearce, T.H.; Rice, C. The record of magma chamber processes in plagioclase phenocrysts at Thera Volcano, Aegean Volcanic Arc, Greece. Contrib. Mineral. Petrol. 1990, 104, 73–84. [Google Scholar] [CrossRef]
- Rapp, N.; Shimizu, M.D.; Norman, G.S. Applegate Reaction between slab-derived melts and peridotite in the mantle wedge: Experimental constraints at 3.8 GPa. Chem. Geol. 1999, 160, 335–356. [Google Scholar] [CrossRef]
- Kay, R.W. Aleutian magnesian andesites: Melts from subducted Pacific ocean crust. J. Volcanol. Geotherm. Res. 1978, 4, 117–132. [Google Scholar] [CrossRef]
- Atherton, M.P.; Petford, N. Generation of sodium-rich magmas from newly underplated basaltic crust. Nature 1993, 362, 144–146. [Google Scholar] [CrossRef]
- Tatsumi, Y. Continental crust formation by crustal delamination in subduction zones and complementary accumulation of the enriched mantle I component in the mantle. Geochem. Geophys. Geosystems 2000, 1, 1053. [Google Scholar] [CrossRef]
- Xu, J.F.; Shinjo, R.; Defant, M.J.; Wang, Q.; Rapp, R.P. Origin of Mesozoic adakitic intrusive rocks in the Ningzhen area of east China: Partial melting of delaminated lower continental crust? Geology 2002, 30, 1111–1114. [Google Scholar] [CrossRef]
- Wang, Q.; Xu, J.F.; Jian, P.; Bao, Z.W.; Zhao, Z.H.; Li, C.F.; Xiong, X.L.; MA, J.L. Petrogenesis of Adakitic Porphyries in an Extensional Tectonic Setting, Dexing, South China: Implications for the Genesis of Porphyry Copper Mineralization. J. Petrol. 2006, 47, 119–144. [Google Scholar] [CrossRef]
- Wang, Q.; Wyman, D.A.; Xu, J.F.; Zhao, Z.H.; Jian, P.; Xiong, X.L.; Bao, Z.W.; Li, C.F.; Bai, Z.H. Petrogenesis of Cretaceous adakitic and shoshonitic igneous rocks in the Luzong area, Anhui Province (eastern China): Implications for geodynamics and Cu-Au mineralization. Lithos 2006, 89, 424–446. [Google Scholar] [CrossRef]
- Xu, W.L.; Hergt, J.M.; Gao, S.; Pei, F.P.; Wang, W.; Yang, D.B. Interaction of adakitic melt-peridotite: Implications for the high-Mg# signature of Mesozoic adakitic rocks in the eastern North China Craton. Earth Planet. Sci. Lett. 2008, 265, 123–137. [Google Scholar] [CrossRef]
- Chen, B.; Jahn, B.M.; Arakawa, Y.; Zhai, M.G. Petrogenesis of the Mesozoic intrusive complexes from the southern Taihang Orogen, North China Craton: Elemental and Sr–Nd–Pb isotopic constraints. Contrib. Mineral. Petrol. 2004, 148, 489–501. [Google Scholar] [CrossRef]
- Guo, F.; Nakamuru, E.; Fan, W.M.; Kobayashi, K.; Li, C.W. Generation of Paleocene adakitic andesites by magma mixing; Yanji Area, NE China. J. Petrol. 2007, 48, 661–692. [Google Scholar] [CrossRef]
- Kilian, R.; Stern, C.R. Constraints on the interaction between slab melts and the mantle wedge from adakitic glass in peridotite xenoliths. Eur. J. Mineral. 2002, 14, 25–36. [Google Scholar] [CrossRef]
- White, W.M. Isotopes, DUPAL, LLSVPs, and Anekantavada. Chem. Geol. 2015, 419, 10–28. [Google Scholar] [CrossRef]
- Zindler, A.; Hart, S. Chemical Geodynamics. Annu. Rev. Earth Planet. Sci. 1986, 14, 493–571. [Google Scholar] [CrossRef]
- Jahn, B.M.; Wu, F.Y.; Lo, C.H.; Tsai, C.H. Crust-mantle interaction induced by deep subduction of the continental crust: Geochemical and Sr–Nd isotopic evidence from post-collisional mafic-ultramafic intrusions of the northern Dabie complex, central China. Chem. Geol. 1999, 157, 119–146. [Google Scholar] [CrossRef]
- Chen, J.F.; Jahn, B.M. Crustal evolution of southeastern China: Nd and Sr isotopic evidence. Tectonophisics 1998, 284, 101–133. [Google Scholar] [CrossRef]
- Li, S.G.; Nie, Y.H.; Hart, S.R.; Zheng, S.G. Upper mantle-deep subducted continental crust interaction: (II) Sr and Nd isotopic constraints on the syn-collisional mafic to ultramafic intrusions in the northern Dabieshan, eastern China. Sci. China (Ser. D) 1998, 28, 18–22, (In Chinese with English Abstract). [Google Scholar]
- Jahn, B.M.; Auvray, B.; Shen, Q.H.; Liu, D.Y.; Zhang, Z.Q.; Dong, Y.J.; Ye, X.J.; Zhang, Q.Z.; Cornichet, J.; Mace, J. Archean crustal evolution in China: The Taishan complex, and evidence for Juvenile crustal addition from long-term depleted mantle. Precambrian Res. 1988, 38, 381–403. [Google Scholar] [CrossRef]
- Huo, T.F.; Yang, D.B.; Shi, J.P.; Yang, H.T.; Xu, W.L.; Wang, F.; Lu, Y. Early Cretaceous Fengshan and Caishan high-Mg# adakitic rocks from the Xuzhou-Huaibei area, central China: Interaction between mantle peridotite and melt derived from partial melting of delaminated lower continental crust. Acta Petrol. Sin. 2018, 34, 1669–1684, (In Chinese with English Abstract). [Google Scholar]
- Wang, Q.; Wyman, D.A.; Xu, J.F.; Jian, P.; Zhao, Z.H. Early Cretaceous adakitic granites in the Northern Dabie Complex, central China: Implications for partial melting and delamination of thickened lower crust. Geochim. Cosmochim. Acta 2007, 71, 2609–2636. [Google Scholar] [CrossRef]


| Spot No. | 1 | 3 | 13 | 15 | 24 | 29 | 35 | 53 | 61 |
|---|---|---|---|---|---|---|---|---|---|
| Zone | Hb1d | Hb1d/Hb1c | Hb1c | Hb1c/Hb1b | Hb1b | Hb1b/Hb1a | Hb1a | Hb1a | Hb1a |
| SiO2 | 46.70 | 43.32 | 45.53 | 43.00 | 45.24 | 42.97 | 44.72 | 45.18 | 44.98 |
| Al2O3 | 7.75 | 10.79 | 10.30 | 12.17 | 10.87 | 12.33 | 10.91 | 10.71 | 11.46 |
| TiO2 | 1.09 | 1.50 | 1.32 | 1.76 | 1.32 | 1.66 | 1.41 | 1.39 | 1.28 |
| Cr2O3 | 0.07 | 0.02 | 0.06 | 0.02 | 0.37 | 0.00 | 0.32 | 0.27 | 0.19 |
| FeO | 15.96 | 15.85 | 10.86 | 13.06 | 9.10 | 11.97 | 9.73 | 9.81 | 8.72 |
| MnO | 0.44 | 0.31 | 0.17 | 0.21 | 0.10 | 0.14 | 0.14 | 0.12 | 0.07 |
| MgO | 11.67 | 10.61 | 15.15 | 12.95 | 16.20 | 13.73 | 16.26 | 16.03 | 16.37 |
| CaO | 11.58 | 11.28 | 10.94 | 10.94 | 11.05 | 10.52 | 10.96 | 10.79 | 11.01 |
| Na2O | 1.30 | 1.66 | 2.01 | 2.21 | 2.13 | 2.21 | 2.02 | 2.02 | 2.17 |
| K2O | 0.71 | 0.82 | 0.73 | 0.77 | 0.86 | 0.71 | 0.83 | 0.71 | 0.94 |
| NiO | 0.00 | 0.00 | 0.00 | 0.00 | 0.03 | 0.01 | 0.06 | 0.03 | 0.00 |
| Cl | 0.01 | 0.01 | 0.00 | 0.00 | 0.00 | 0.00 | 0.01 | 0.01 | 0.01 |
| P2O5 | 0.00 | 0.02 | 0.00 | 0.00 | 0.00 | 0.01 | 0.01 | 0.00 | 0.00 |
| Total | 97.27 | 96.19 | 97.06 | 97.09 | 97.27 | 96.25 | 97.37 | 97.07 | 97.20 |
| Structural formulae based on 15 cations | |||||||||
| Si | 6.94 | 6.54 | 6.60 | 6.33 | 6.51 | 6.32 | 6.43 | 6.51 | 6.46 |
| AlIV | 1.06 | 1.46 | 1.40 | 1.67 | 1.49 | 1.68 | 1.57 | 1.49 | 1.54 |
| SumT = | 8.00 | 8.00 | 8.00 | 8.00 | 8.00 | 8.00 | 8.00 | 8.00 | 8.00 |
| AlVI | 0.30 | 0.46 | 0.36 | 0.44 | 0.35 | 0.46 | 0.28 | 0.33 | 0.40 |
| Fe3+ | 0.20 | 0.23 | 0.41 | 0.39 | 0.41 | 0.49 | 0.56 | 0.51 | 0.43 |
| Ti | 0.12 | 0.17 | 0.14 | 0.19 | 0.14 | 0.18 | 0.15 | 0.15 | 0.14 |
| Cr | 0.01 | 0.00 | 0.01 | 0.00 | 0.04 | 0.00 | 0.04 | 0.03 | 0.02 |
| Mg | 2.59 | 2.39 | 3.27 | 2.84 | 3.48 | 3.01 | 3.49 | 3.44 | 3.51 |
| Fe2+ | 1.79 | 1.75 | 0.80 | 1.13 | 0.57 | 0.85 | 0.48 | 0.54 | 0.50 |
| Mn | 0.00 | 0.00 | 0.00 | 0.00 | 0.00 | 0.00 | 0.00 | 0.00 | 0.00 |
| SumC = | 5.00 | 5.00 | 5.00 | 5.00 | 5.00 | 5.00 | 5.00 | 5.00 | 5.00 |
| Mg | 0.00 | 0.00 | 0.00 | 0.00 | 0.00 | 0.00 | 0.00 | 0.00 | 0.00 |
| Fe2+ | 0.00 | 0.03 | 0.10 | 0.09 | 0.11 | 0.12 | 0.13 | 0.13 | 0.11 |
| Mn | 0.05 | 0.04 | 0.02 | 0.03 | 0.01 | 0.02 | 0.02 | 0.02 | 0.01 |
| Ca | 1.84 | 1.83 | 1.70 | 1.72 | 1.70 | 1.66 | 1.69 | 1.67 | 1.69 |
| Na | 0.10 | 0.11 | 0.18 | 0.16 | 0.18 | 0.20 | 0.17 | 0.19 | 0.18 |
| SumB = | 2.00 | 2.00 | 2.00 | 2.00 | 2.00 | 2.00 | 2.00 | 2.00 | 2.00 |
| Na | 0.27 | 0.38 | 0.38 | 0.47 | 0.42 | 0.43 | 0.40 | 0.38 | 0.42 |
| K | 0.13 | 0.16 | 0.13 | 0.14 | 0.16 | 0.13 | 0.15 | 0.13 | 0.17 |
| SumA = | 0.41 | 0.54 | 0.52 | 0.61 | 0.57 | 0.56 | 0.55 | 0.51 | 0.59 |
| Mg# | 59 | 57 | 78 | 70 | 84 | 75 | 85 | 84 | 85 |
| Sample | 18JG-2 | 18JG-2 | 18JG-7 | 18JG-1 | 18JG-1 | 18JG-1 | 18JG-1 | 18JG-4 | 18JG-4 | 18JG-7 |
|---|---|---|---|---|---|---|---|---|---|---|
| Zone | Hb0c | Hb0r | Hbib | Hbib | Hbib/c | Hbib/c | Hbic | Hbic | Groundmass | Groundmass |
| SiO2 | 45.08 | 42.75 | 41.99 | 40.54 | 43.16 | 41.49 | 41.99 | 43.03 | 42.14 | 43.79 |
| Al2O3 | 10.76 | 11.75 | 13.42 | 13.84 | 11.75 | 12.06 | 12.38 | 11.35 | 10.86 | 10.99 |
| TiO2 | 1.176 | 1.283 | 1.195 | 1.550 | 1.481 | 1.682 | 1.274 | 1.258 | 1.381 | 1.249 |
| Cr2O3 | 0.10 | 0.06 | 0.51 | 0.03 | 0.10 | 0.01 | 0.16 | 0.02 | 0.18 | 0.03 |
| FeO | 10.95 | 15.78 | 15.49 | 18.17 | 13.70 | 17.42 | 18.26 | 13.67 | 18.74 | 17.03 |
| MnO | 0.175 | 0.304 | 0.292 | 0.262 | 0.168 | 0.316 | 0.269 | 0.199 | 0.417 | 0.260 |
| MgO | 15.35 | 11.66 | 10.46 | 9.349 | 12.90 | 9.680 | 9.260 | 13.05 | 9.760 | 10.66 |
| CaO | 10.45 | 11.37 | 10.74 | 11.22 | 11.41 | 11.28 | 10.86 | 11.38 | 10.77 | 11.22 |
| Na2O | 2.076 | 1.897 | 1.723 | 1.932 | 1.955 | 1.664 | 1.720 | 1.998 | 1.673 | 1.794 |
| K2O | 1.033 | 1.133 | 1.440 | 1.292 | 0.930 | 1.062 | 1.322 | 0.775 | 1.134 | 0.904 |
| NiO | 0.030 | 0.000 | 0.005 | 0.002 | 0.000 | 0.075 | 0.021 | 0.021 | 0.023 | 0.008 |
| P2O5 | 0.039 | 0.034 | 0.002 | 0.007 | 0.034 | 0.022 | 0.005 | 0.031 | 0.012 | 0.017 |
| Cl | 0.000 | 0.004 | 0.073 | 0.013 | 0.003 | 0.000 | 0.007 | 0.026 | 0.031 | 0.004 |
| Total | 97.22 | 98.02 | 97.32 | 98.20 | 97.58 | 96.76 | 97.52 | 96.81 | 97.11 | 97.95 |
| Structural formulae based on 15 cations | ||||||||||
| Si4+ | 6.52 | 6.34 | 6.26 | 6.08 | 6.35 | 6.30 | 6.33 | 6.38 | 6.39 | 6.51 |
| AlIV | 1.48 | 1.66 | 1.74 | 1.92 | 1.65 | 1.70 | 1.67 | 1.62 | 1.61 | 1.49 |
| SumT = | 8.00 | 8.00 | 8.00 | 8.00 | 8.00 | 8.00 | 8.00 | 8.00 | 8.00 | 8.00 |
| AlVI | 0.36 | 0.39 | 0.62 | 0.53 | 0.39 | 0.45 | 0.53 | 0.37 | 0.32 | 0.44 |
| Fe3+ | 0.53 | 0.39 | 0.37 | 0.39 | 0.37 | 0.32 | 0.37 | 0.40 | 0.47 | 0.32 |
| Ti4+ | 0.13 | 0.14 | 0.13 | 0.17 | 0.16 | 0.19 | 0.14 | 0.14 | 0.16 | 0.14 |
| Cr4+ | 0.01 | 0.01 | 0.06 | 0.00 | 0.01 | 0.00 | 0.02 | 0.00 | 0.02 | 0.00 |
| Mg2+ | 3.31 | 2.58 | 2.32 | 2.09 | 2.83 | 2.19 | 2.08 | 2.89 | 2.20 | 2.36 |
| Fe2+ | 0.66 | 1.50 | 1.49 | 1.81 | 1.23 | 1.85 | 1.86 | 1.20 | 1.82 | 1.73 |
| Mn2+ | 0 | 0 | 0 | 0 | 0 | 0 | 0 | 0 | 0 | 0 |
| SumC = | 5.00 | 5.00 | 5.00 | 5.00 | 5.00 | 5.00 | 5.00 | 5.00 | 5.00 | 5.00 |
| Mg2+ | 0.00 | 0.00 | 0.00 | 0.00 | 0.00 | 0.00 | 0.00 | 0.00 | 0.00 | 0.00 |
| Fe2+ | 0.13 | 0.07 | 0.07 | 0.08 | 0.09 | 0.05 | 0.07 | 0.09 | 0.08 | 0.06 |
| Mn2+ | 0.02 | 0.04 | 0.04 | 0.03 | 0.02 | 0.04 | 0.03 | 0.02 | 0.05 | 0.03 |
| Ca2+ | 1.62 | 1.81 | 1.72 | 1.80 | 1.80 | 1.84 | 1.75 | 1.81 | 1.75 | 1.79 |
| Na+ | 0.23 | 0.08 | 0.18 | 0.08 | 0.09 | 0.07 | 0.14 | 0.08 | 0.12 | 0.12 |
| SumB = | 2.00 | 2.00 | 2.00 | 2.00 | 2.00 | 2.00 | 2.00 | 2.00 | 2.00 | 2.00 |
| Na+ | 0.36 | 0.46 | 0.32 | 0.48 | 0.46 | 0.42 | 0.36 | 0.50 | 0.38 | 0.40 |
| K+ | 0.19 | 0.21 | 0.27 | 0.25 | 0.17 | 0.21 | 0.25 | 0.15 | 0.22 | 0.17 |
| SumA = | 0.55 | 0.68 | 0.59 | 0.73 | 0.64 | 0.62 | 0.61 | 0.64 | 0.60 | 0.57 |
| Mg# | 80.7 | 62.2 | 59.9 | 52.6 | 68.3 | 53.6 | 51.8 | 69.0 | 53.7 | 56.9 |
| Spot No. | 1 | 3 | 5 | 18 | 22 | 29 | 36 | 38 | 39 | 40 | 41 | 44 | 51 | 57 | 58 | 62 | 63 | 15 | 09 |
|---|---|---|---|---|---|---|---|---|---|---|---|---|---|---|---|---|---|---|---|
| Zone | pl1d | pl1d | pl1d/ Pl1c | Pl1c | Pl1c/ Pl1b | Pl1b | Pl1b/Pl1a | Pl1a | Pl0 | Pl0 | Pl0m | Pl0 | Pl0 | Pl0m | Pl0m | Pl0m | Pl10 | Groundmass | Groundmass |
| SiO2 | 65.84 | 65.47 | 66.58 | 54.94 | 62.64 | 57.06 | 60.01 | 59.77 | 65.19 | 65.43 | 59.83 | 65.22 | 66.00 | 64.46 | 57.09 | 62.43 | 64.76 | 60.22 | 63.30 |
| TiO2 | 0.02 | 0.00 | 0.05 | 0.02 | 0.00 | 0.00 | 0.00 | 0.01 | 0.00 | 0.00 | 0.00 | 0.00 | 0.01 | 0.00 | 0.00 | 0.00 | 0.00 | 0.000 | 0.000 |
| Al2O3 | 21.04 | 21.27 | 20.80 | 27.62 | 22.71 | 26.98 | 25.10 | 25.21 | 22.15 | 21.93 | 25.16 | 21.52 | 20.98 | 22.11 | 26.64 | 22.81 | 21.67 | 24.73 | 23.27 |
| FeO | 0.06 | 0.07 | 0.06 | 0.14 | 0.09 | 0.20 | 0.10 | 0.11 | 0.00 | 0.00 | 0.14 | 0.04 | 0.00 | 0.00 | 0.18 | 0.13 | 0.05 | 0.054 | 0.026 |
| MnO | 0.00 | 0.00 | 0.00 | 0.03 | 0.00 | 0.00 | 0.01 | 0.00 | 0.03 | 0.00 | 0.03 | 0.03 | 0.00 | 0.00 | 0.04 | 0.00 | 0.00 | 0.000 | 0.000 |
| MgO | 0.02 | 0.03 | 0.01 | 0.00 | 0.00 | 0.00 | 0.01 | 0.00 | 0.01 | 0.00 | 0.02 | 0.00 | 0.00 | 0.01 | 0.00 | 0.00 | 0.00 | 0.025 | 0.000 |
| CaO | 1.68 | 2.27 | 1.28 | 9.24 | 4.14 | 8.48 | 5.85 | 6.21 | 2.61 | 2.33 | 6.60 | 2.33 | 1.40 | 2.77 | 8.11 | 3.95 | 2.50 | 5.994 | 3.823 |
| Na2O | 9.84 | 9.84 | 10.71 | 5.61 | 8.53 | 6.23 | 7.52 | 7.52 | 9.92 | 9.94 | 7.51 | 9.77 | 10.53 | 9.66 | 6.31 | 9.07 | 10.01 | 7.561 | 8.429 |
| K2O | 0.92 | 0.11 | 0.09 | 0.23 | 0.41 | 0.25 | 0.43 | 0.39 | 0.19 | 0.17 | 0.39 | 0.20 | 0.03 | 0.07 | 0.24 | 0.54 | 0.17 | 0.570 | 0.628 |
| P2O5 | 0.00 | 0.03 | 0.01 | 0.04 | 0.00 | 0.05 | 0.04 | 0.00 | 0.02 | 0.00 | 0.00 | 0.00 | 0.01 | 0.03 | 0.00 | 0.00 | 0.00 | 0.000 | 0.028 |
| SrO | 0.17 | 0.20 | 0.16 | 0.20 | 0.00 | 0.30 | 0.22 | 0.16 | 0.00 | 0.04 | 0.19 | 0.00 | 0.20 | 0.07 | 0.16 | 0.06 | 0.00 | n.a. | n.a. |
| Total | 99.58 | 99.28 | 99.75 | 98.06 | 98.52 | 99.54 | 99.28 | 99.39 | 100.1 | 99.83 | 99.88 | 99.10 | 99.17 | 99.18 | 98.78 | 99.00 | 99.15 | 99.15 | 99.50 |
| Structural formulae based on 8 oxygen | |||||||||||||||||||
| Si | 2.92 | 2.92 | 2.93 | 2.53 | 2.82 | 2.58 | 2.70 | 2.69 | 2.87 | 2.89 | 2.68 | 2.90 | 2.93 | 2.87 | 2.60 | 2.79 | 2.88 | 2.71 | 2.83 |
| Ti | 0.00 | 0.00 | 0.00 | 0.00 | 0.00 | 0.00 | 0.00 | 0.00 | 0.00 | 0.00 | 0.00 | 0.00 | 0.00 | 0.00 | 0.00 | 0.00 | 0.00 | 0.00 | 0.00 |
| Al | 1.10 | 1.12 | 1.08 | 1.50 | 1.21 | 1.44 | 1.33 | 1.33 | 1.15 | 1.14 | 1.33 | 1.13 | 1.10 | 1.16 | 1.43 | 1.20 | 1.13 | 1.31 | 1.22 |
| Fe | 0.00 | 0.00 | 0.00 | 0.01 | 0.00 | 0.01 | 0.00 | 0.00 | 0.00 | 0.00 | 0.01 | 0.00 | 0.00 | 0.00 | 0.01 | 0.01 | 0.00 | 0.00 | 0.00 |
| Mn | 0.00 | 0.00 | 0.00 | 0.00 | 0.00 | 0.00 | 0.00 | 0.00 | 0.00 | 0.00 | 0.00 | 0.00 | 0.00 | 0.00 | 0.00 | 0.00 | 0.00 | 0.00 | 0.00 |
| Mg | 0.00 | 0.00 | 0.00 | 0.00 | 0.00 | 0.00 | 0.00 | 0.00 | 0.00 | 0.00 | 0.00 | 0.00 | 0.00 | 0.00 | 0.00 | 0.00 | 0.00 | 0.00 | 0.00 |
| Ca | 0.08 | 0.11 | 0.06 | 0.46 | 0.20 | 0.41 | 0.28 | 0.30 | 0.12 | 0.11 | 0.32 | 0.11 | 0.07 | 0.13 | 0.40 | 0.19 | 0.12 | 0.29 | 0.18 |
| Na | 0.85 | 0.85 | 0.92 | 0.50 | 0.75 | 0.55 | 0.66 | 0.66 | 0.85 | 0.85 | 0.65 | 0.84 | 0.91 | 0.83 | 0.56 | 0.79 | 0.86 | 0.66 | 0.73 |
| K | 0.05 | 0.01 | 0.01 | 0.01 | 0.02 | 0.02 | 0.03 | 0.02 | 0.01 | 0.01 | 0.02 | 0.01 | 0.00 | 0.00 | 0.01 | 0.03 | 0.01 | 0.03 | 0.04 |
| P | 0.00 | 0.00 | 0.00 | 0.00 | 0.00 | 0.00 | 0.00 | 0.00 | 0.00 | 0.00 | 0.00 | 0.00 | 0.00 | 0.00 | 0.00 | 0.00 | 0.00 | 0.00 | 0.00 |
| An% | 8 | 11 | 6 | 47 | 21 | 42 | 29 | 31 | 13 | 11 | 32 | 11 | 7 | 14 | 41 | 19 | 12 | 29 | 19 |
| Ab% | 87 | 88 | 93 | 52 | 77 | 56 | 68 | 67 | 86 | 88 | 66 | 87 | 93 | 86 | 58 | 78 | 87 | 67 | 77 |
| Or% | 5 | 1 | 1 | 1 | 2 | 2 | 3 | 2 | 1 | 1 | 2 | 2 | 0 | 0 | 1 | 3 | 1 | 4 | 4 |
| Sample | 18JG-7 Four-Zoned Plagioclase | 18JG-2 Four-Zoned Plagioclase | 18JG-4 Plagioclase A | 18JG-4 Plagioclase B | 18JG-4 Plagioclase C | 18JG-7 Plagioclase A | 18JG-7 Plagioclase B | 18JG-7 Plagioclase C | |
|---|---|---|---|---|---|---|---|---|---|
| Occurrence | |||||||||
| Pl0 | - | 0.707447 | - | - | - | - | - | - | |
| Pl0 + Pl0m | 0.707019–0.707302 | - | 0.707320–0.707409 | - | - | 0.707370–0.707510 | - | - | |
| Pl1a | 0.707059 | 0.707080–0.707198 | 0.707296 | - | - | 0.707255 | 0.706958–0.707005 | - | |
| Pl1b | 0.706821 | 0.706980–0.706891 | 0.707365 | 0.706824–0.706905 | 0.706824–0.706847 | 0.706828–0.707138 | 0.706894–0.706925 | 0.707279–0.707369 | |
| Pl1c | 0.707338 | 0.707741 | 0.707718 | 0.707091–0.707369 | 0.707361–0.707648 | 0.707322 | 0.707406 | 0.707313–0.707425 | |
| Pl1d | 0.707473 | 0.707892 | – | – | – | – | – | – | |
Disclaimer/Publisher’s Note: The statements, opinions and data contained in all publications are solely those of the individual author(s) and contributor(s) and not of MDPI and/or the editor(s). MDPI and/or the editor(s) disclaim responsibility for any injury to people or property resulting from any ideas, methods, instructions or products referred to in the content. |
© 2025 by the authors. Licensee MDPI, Basel, Switzerland. This article is an open access article distributed under the terms and conditions of the Creative Commons Attribution (CC BY) license (https://creativecommons.org/licenses/by/4.0/).
Share and Cite
Guo, X.; Chen, N. Hornblende and Plagioclase Micro-Texture and Compositions: Evidence for Magma Mixing in High-Mg Adakitic Pluton, North China Craton. Minerals 2025, 15, 604. https://doi.org/10.3390/min15060604
Guo X, Chen N. Hornblende and Plagioclase Micro-Texture and Compositions: Evidence for Magma Mixing in High-Mg Adakitic Pluton, North China Craton. Minerals. 2025; 15(6):604. https://doi.org/10.3390/min15060604
Chicago/Turabian StyleGuo, Xiaowei, and Nengsong Chen. 2025. "Hornblende and Plagioclase Micro-Texture and Compositions: Evidence for Magma Mixing in High-Mg Adakitic Pluton, North China Craton" Minerals 15, no. 6: 604. https://doi.org/10.3390/min15060604
APA StyleGuo, X., & Chen, N. (2025). Hornblende and Plagioclase Micro-Texture and Compositions: Evidence for Magma Mixing in High-Mg Adakitic Pluton, North China Craton. Minerals, 15(6), 604. https://doi.org/10.3390/min15060604