1. Introduction
Chromite ores typically contain 50%–70% Cr
2O
3 [
1]. The primary use of chromium is in ferrochrome production, accounting for 95.2% of total demand [
2]. Other uses constitute minor shares: foundry production—2.4%; chemical industry—1.6%; refractories—0.8% [
3]. The leading global ferrochrome producers are South Africa, Kazakhstan, and India.
In Kazakhstan, chromite ore from the Kempirsai deposit in the Aktobe region is processed at the Donskoy Mining and Processing Plant (DMPP), which holds the world’s second-largest confirmed chromite reserves [
4,
5]. These ores are mineralogically heterogeneous, both in terms of composition and grain size of the chromite spinel. Based on the cementing matrix, chromite ores are classified into five groups: spinel grains cemented by magnesium silicates; iron oxides/hydroxides; highly ferruginous serpentine; quartz; and magnesium carbonates [
6,
7]. Grain size classes include coarse-grained (less than 20% < 0.1 mm), medium-grained (20%–40% < 0.1 mm), and fine-grained (more than 40% < 0.1 mm) chromite ores [
8].
DMPP’s processing technology involves conventional gravity separation operations: crushing, heavy media separation, jigging, and spiral separation. While these methods effectively concentrate the coarser ore fractions, fine-grained tailings are poorly beneficiated due to difficulties in separating chromite from complex gangue minerals [
9]. Up to 900,000 tons of chromite beneficiation tailings—also known as fine chromite sludge—are generated annually. DMPP has accumulated 14.5 million tons of such waste containing 20%–30% Cr
2O
3 [
10]. These fine-grained tailings (CBTs—chromite beneficiation tailings) represent hazardous anthropogenic waste.
Due to the high toxicity of chromium compounds, such waste is typically subjected to treatment for hexavalent chromium detoxification before being landfilled [
11,
12,
13]. Some chromate species found in chromite residues are highly soluble and can migrate through surface and groundwater, posing risks to human health and ecosystems. In China, for instance, 1800 water wells were contaminated and decommissioned due to chromium waste pollution [
14,
15].
Toxic chromate salts are primarily associated with sodium dichromate production. When produced by roasting with calcium additives, carcinogenic calcium chromate may form [
14].
Stricter environmental regulations and the global push for sustainable resource management make the recycling of such waste not only desirable but economically advantageous. Several technologies have been developed for CBT recovery. One method involves preliminary activation in sodium bicarbonate, followed by leaching in ammonium bisulfate solution and centrifugal gravity concentration, yielding chromite concentrate with 59.2% Cr
2O
3 and 86.8% recovery [
9]. Another method utilizes mild sulfuric acid leaching coupled with ozonation, achieving 65%–70% Cr recovery [
16]. Yet another approach employs multi-stage thermal processing: initial thermal activation at 1000 °C, roasting with ammonium sulfate, water, and sulfuric acid at 300 °C, followed by water leaching at 90 °C, yielding a 49% Cr
2O
3 concentrate with 93.9% extraction efficiency [
5].
However, methods targeting chromite concentrate production [
5,
9,
15,
16,
17] do not achieve full utilization of the waste; the residual tailings still require landfilling. To mitigate environmental risks, a comprehensive recycling approach is needed. CBT has potential as polymetallic feedstock for extracting other valuable metals, such as magnesium, iron, aluminum, nickel, zinc, titanium, platinum group elements (PGEs), and rare earth elements (REEs). Processing technologies must be adapted to the unique chemical and mineralogical characteristics of CBT, aiming to recover the maximum amount of material. This would reduce hazardous waste accumulation, conserve land resources, and create new sources of critical raw materials.
This study investigates the use of alkali roasting as a first-stage processing step for CBT. The method of soda-based roasting is widely applied to chromite concentrates; however, CBT differs in composition, requiring dedicated study to validate the applicability of this method.
The goal of this research is to determine the optimal conditions for CBT roasting with sodium carbonate (Na2CO3) that enables maximum Cr2O3 recovery at reasonable energy and material costs. The roasting parameters (temperature, time, and reagent composition) significantly affect chromium extraction. To systematically study these effects, the Design of Experiments (DoE) methodology was employed, allowing the establishment of quantitative relationships between process variables and Cr2O3 recovery. This approach minimizes the number of experiments that need to be conducted while ensuring the statistical reliability of the results.
A crucial aspect of process optimization is understanding the phase transformations that occur during roasting and leaching. Despite the high chemical resistance of chromite, its interaction with alkaline agents at elevated temperatures leads to the formation of reactive phases, such as sodium chromates. X-ray diffraction (XRD) and scanning electron microscopy with microanalysis (SEM-EPMA) were employed to track the transformations of chromium and other elements at various stages. This is essential for confirming the reaction mechanism and tailoring process parameters to the specific composition of CBT.
The novelty of this study lies in its focus on the efficient processing of low-grade chromite beneficiation tailings, a material typically underutilized due to its complex mineralogy. Unlike conventional works addressing chromite concentrates, this research provides a comprehensive approach combining experimental optimization (via DoE), in-depth phase transformation analysis, and environmental considerations. The proposed method not only achieves high Cr2O3 recovery from hazardous tailings but also aligns with circular economy strategies by enabling integrated waste valorization and resource recovery.
3. Results and Discussion
Samples of chromite beneficiation tailings (CBTs) were collected from the Donskoy Mining and Processing Plant (DMPP). The chemical composition of the CBT, in wt.%, was as follows: Cr—19.34; Fe—9.45; Ni—0.44; Co—0.03; Zn—0.015; Mg—35.07; Si—31.86; Al—2.21; TiO2—0.21; total rare earth elements (ΣREEs)—0.025.
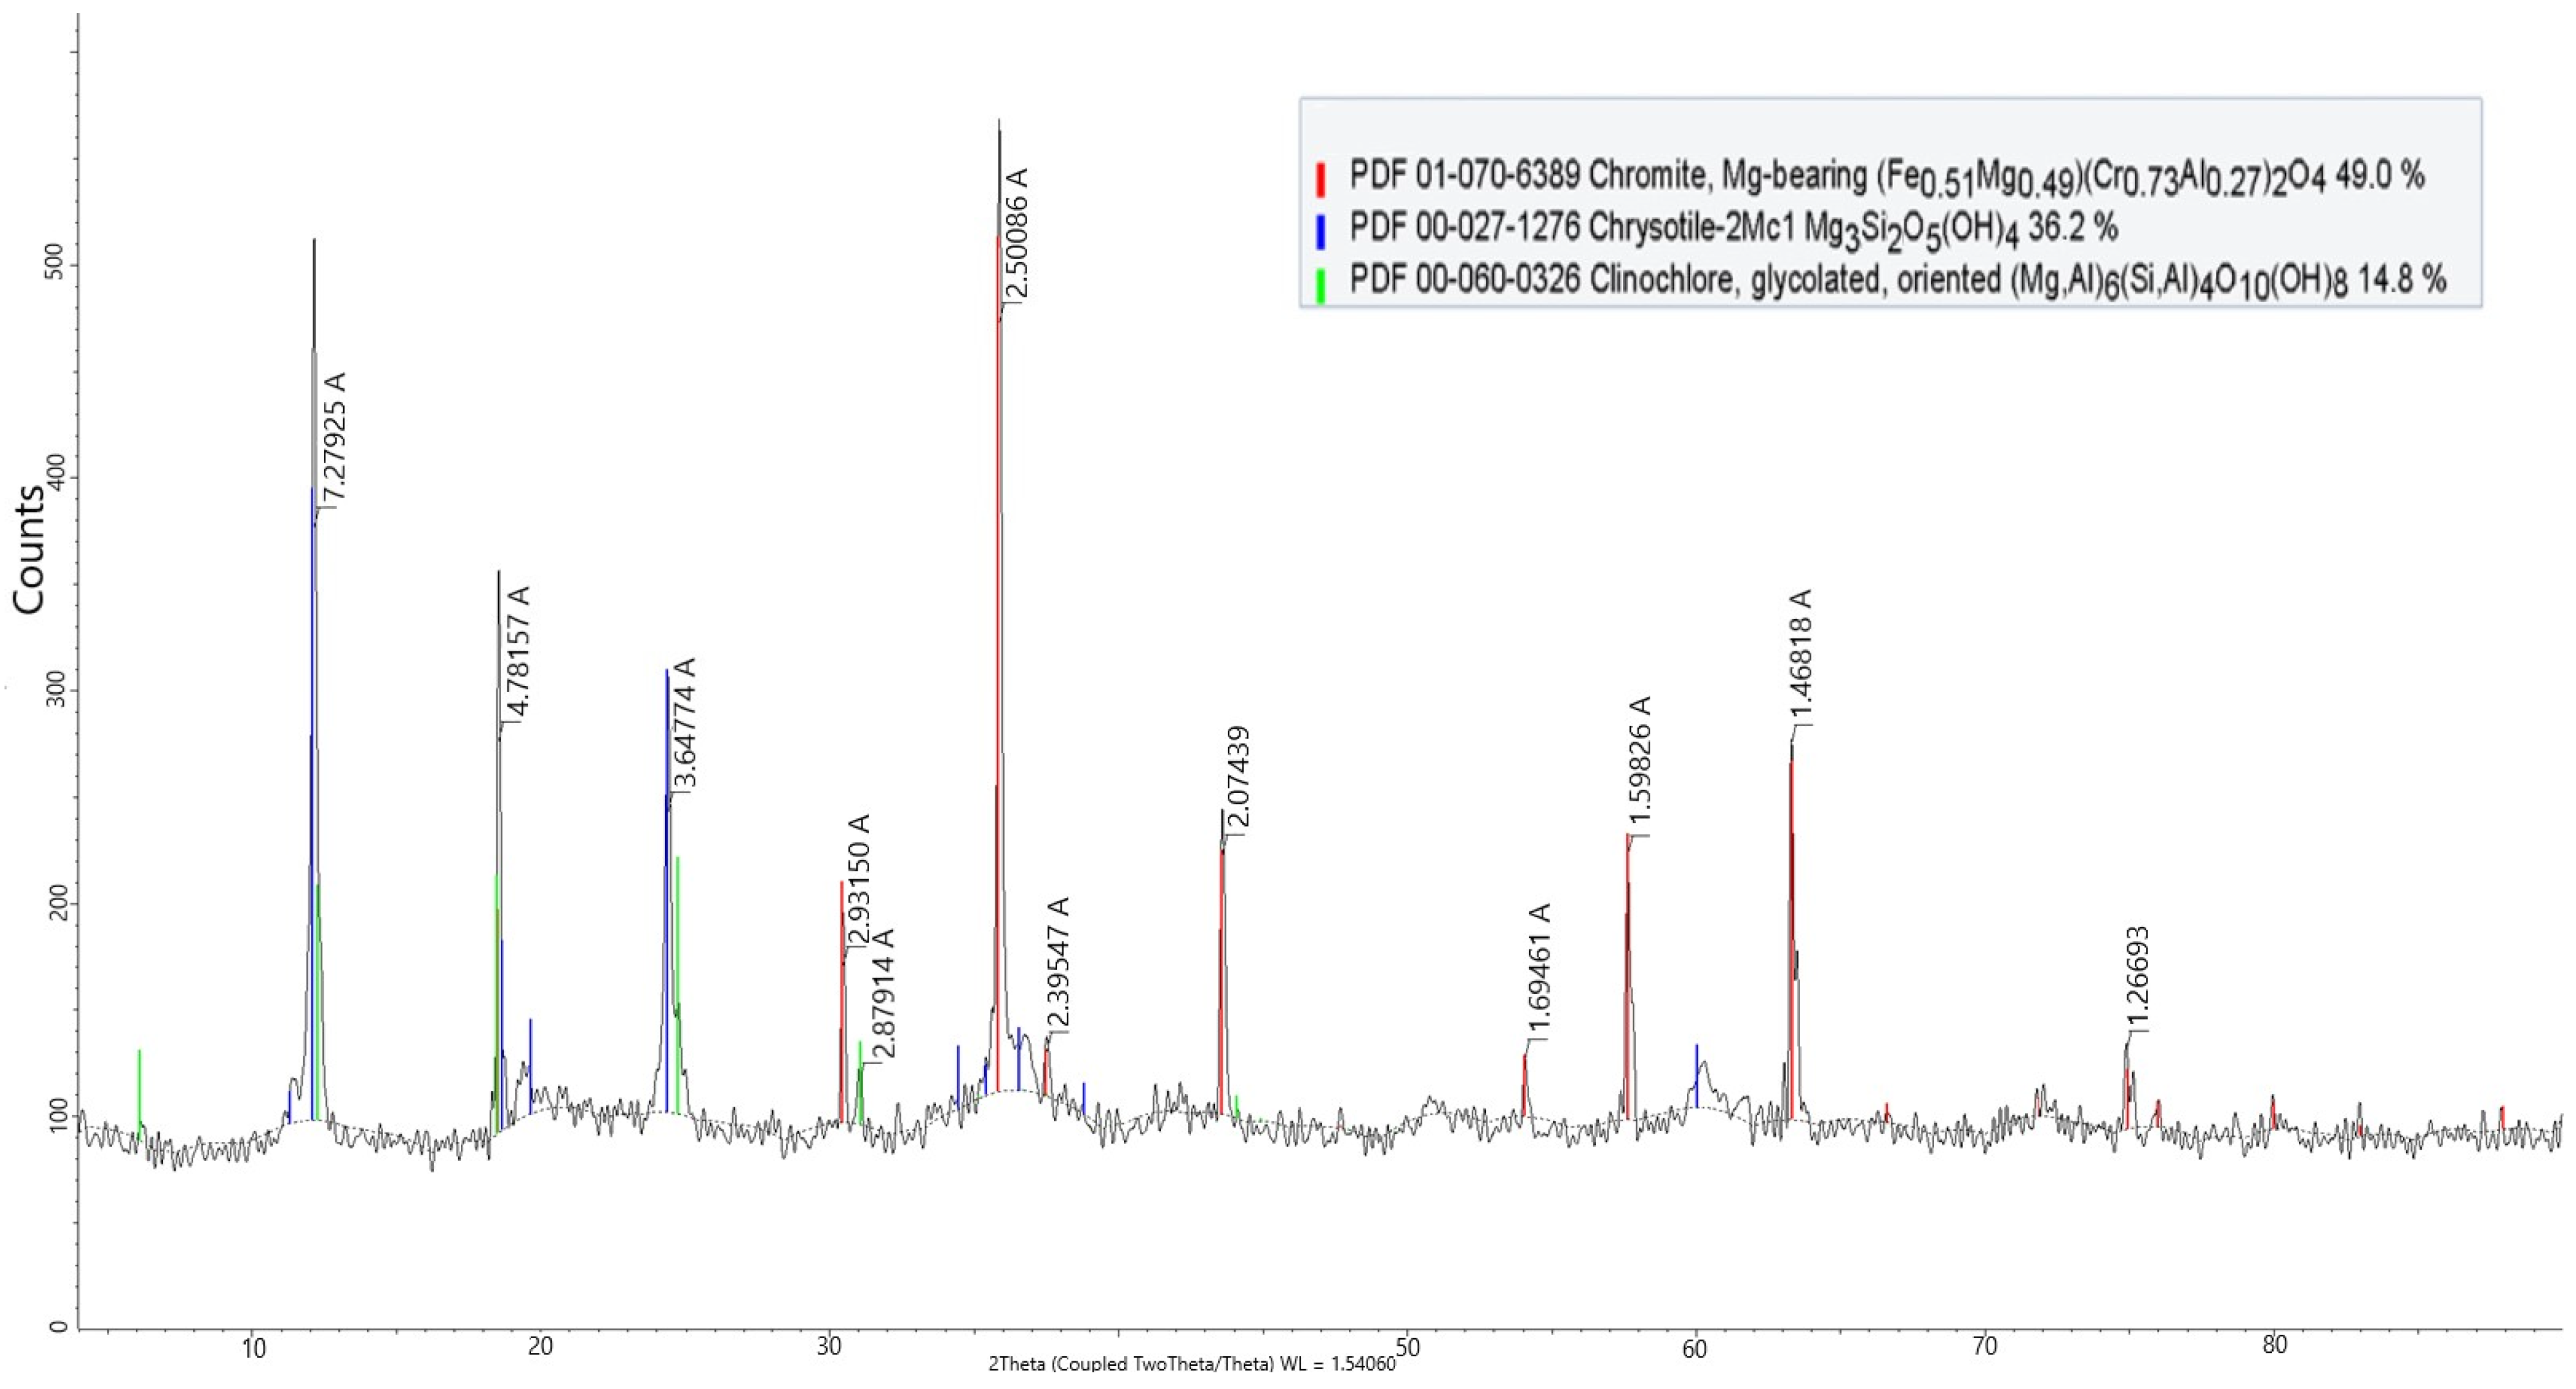
According to X-ray diffraction (XRD) analysis, the mineralogical composition of the CBTs is dominated by chemically stable phases, including chromite (49%), which is typical for processed chromite tailings, chrysotile (36%), and clinochlore (14.8%) (
Figure 1).
The experimental results for Cr
2O
3 extraction via aqueous leaching of the soda-roasted CBTs, designed using response surface methodology (RSM), are summarized in
Table 2.
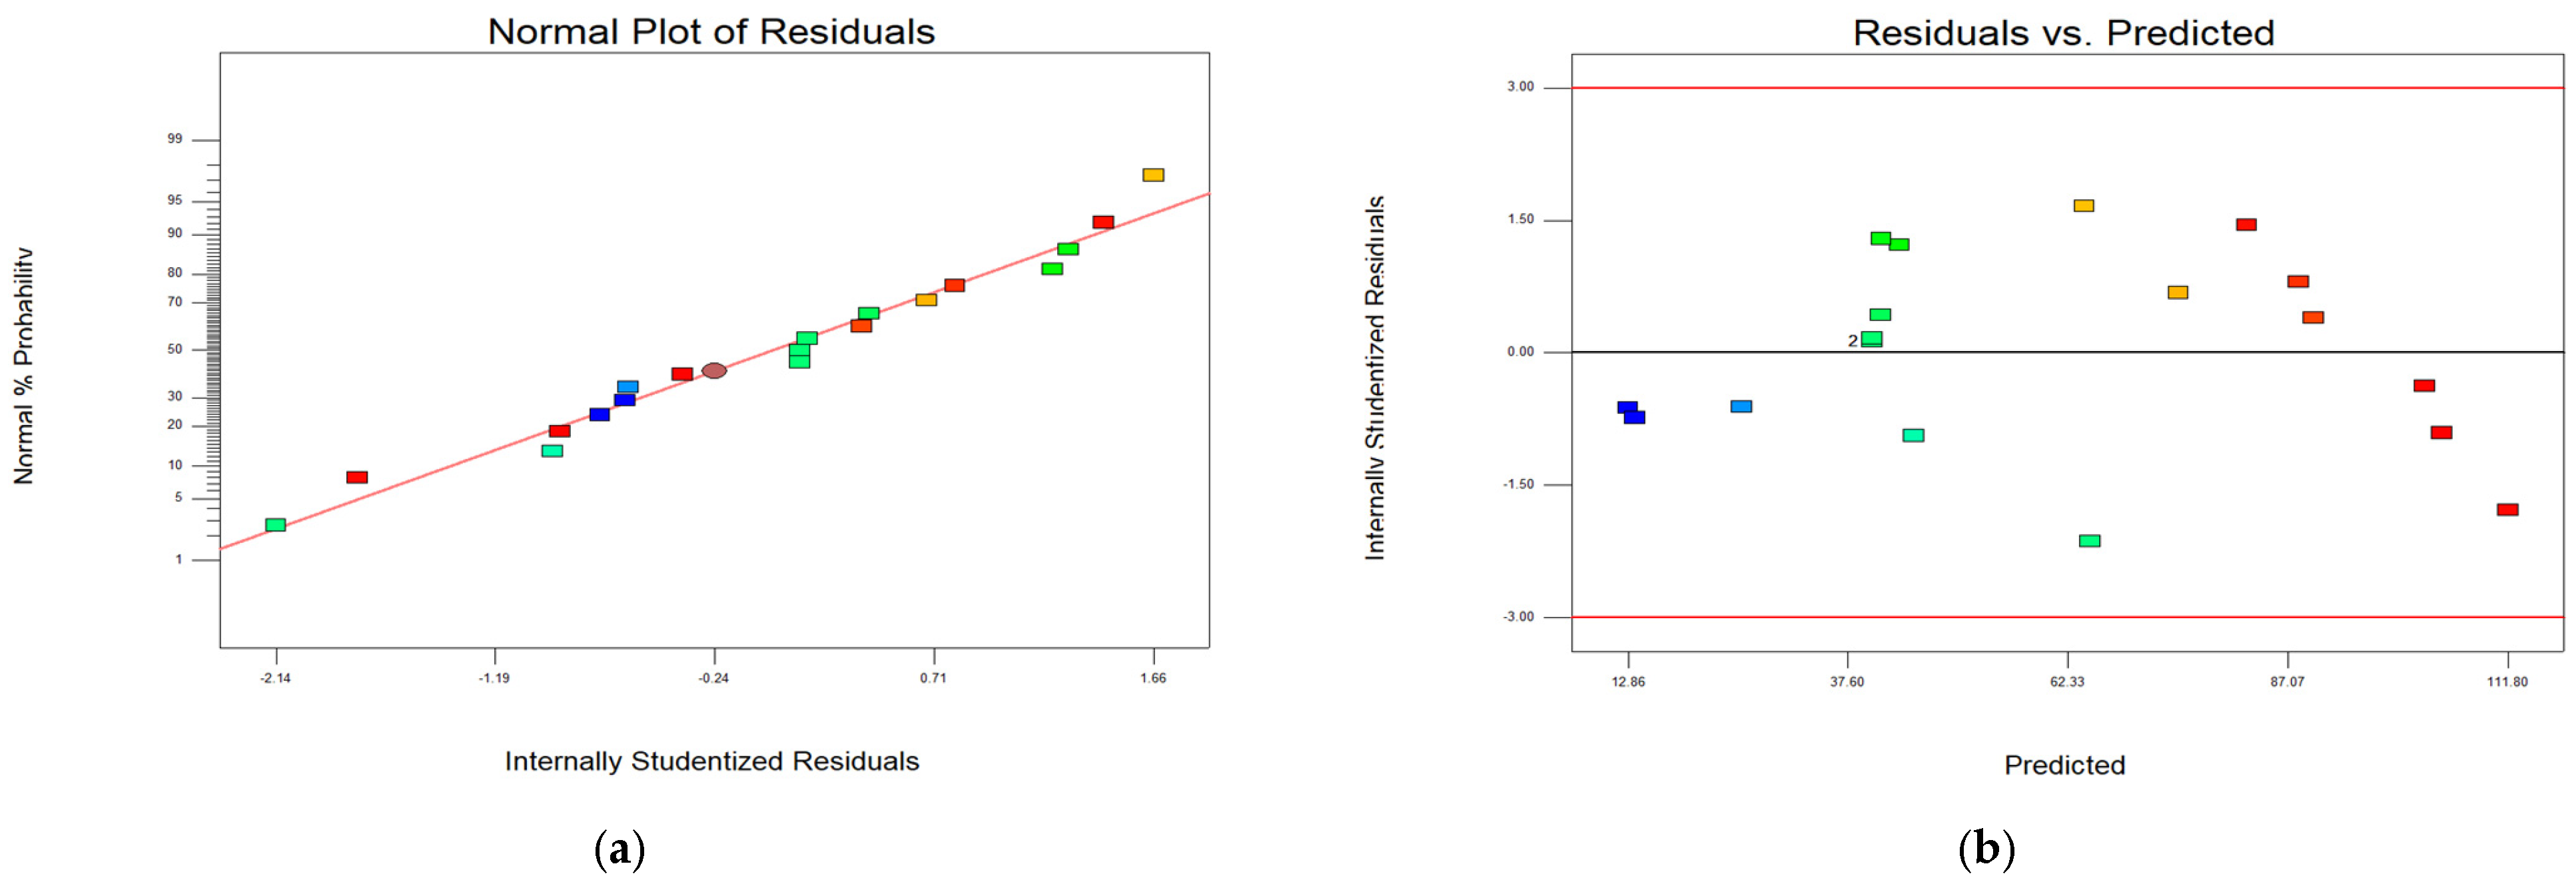
Figure 2 presents diagnostic plots that confirm the statistical adequacy of the model constructed to describe Cr
2O
3 extraction from soda-roasted chromite tailings. Residuals follow a normal distribution (plot a), with random dispersion across predicted values (plot b), run order (plot c), and a strong correlation between actual and predicted values (plot d). The model exhibits no systematic errors and is considered to be statistically sound.
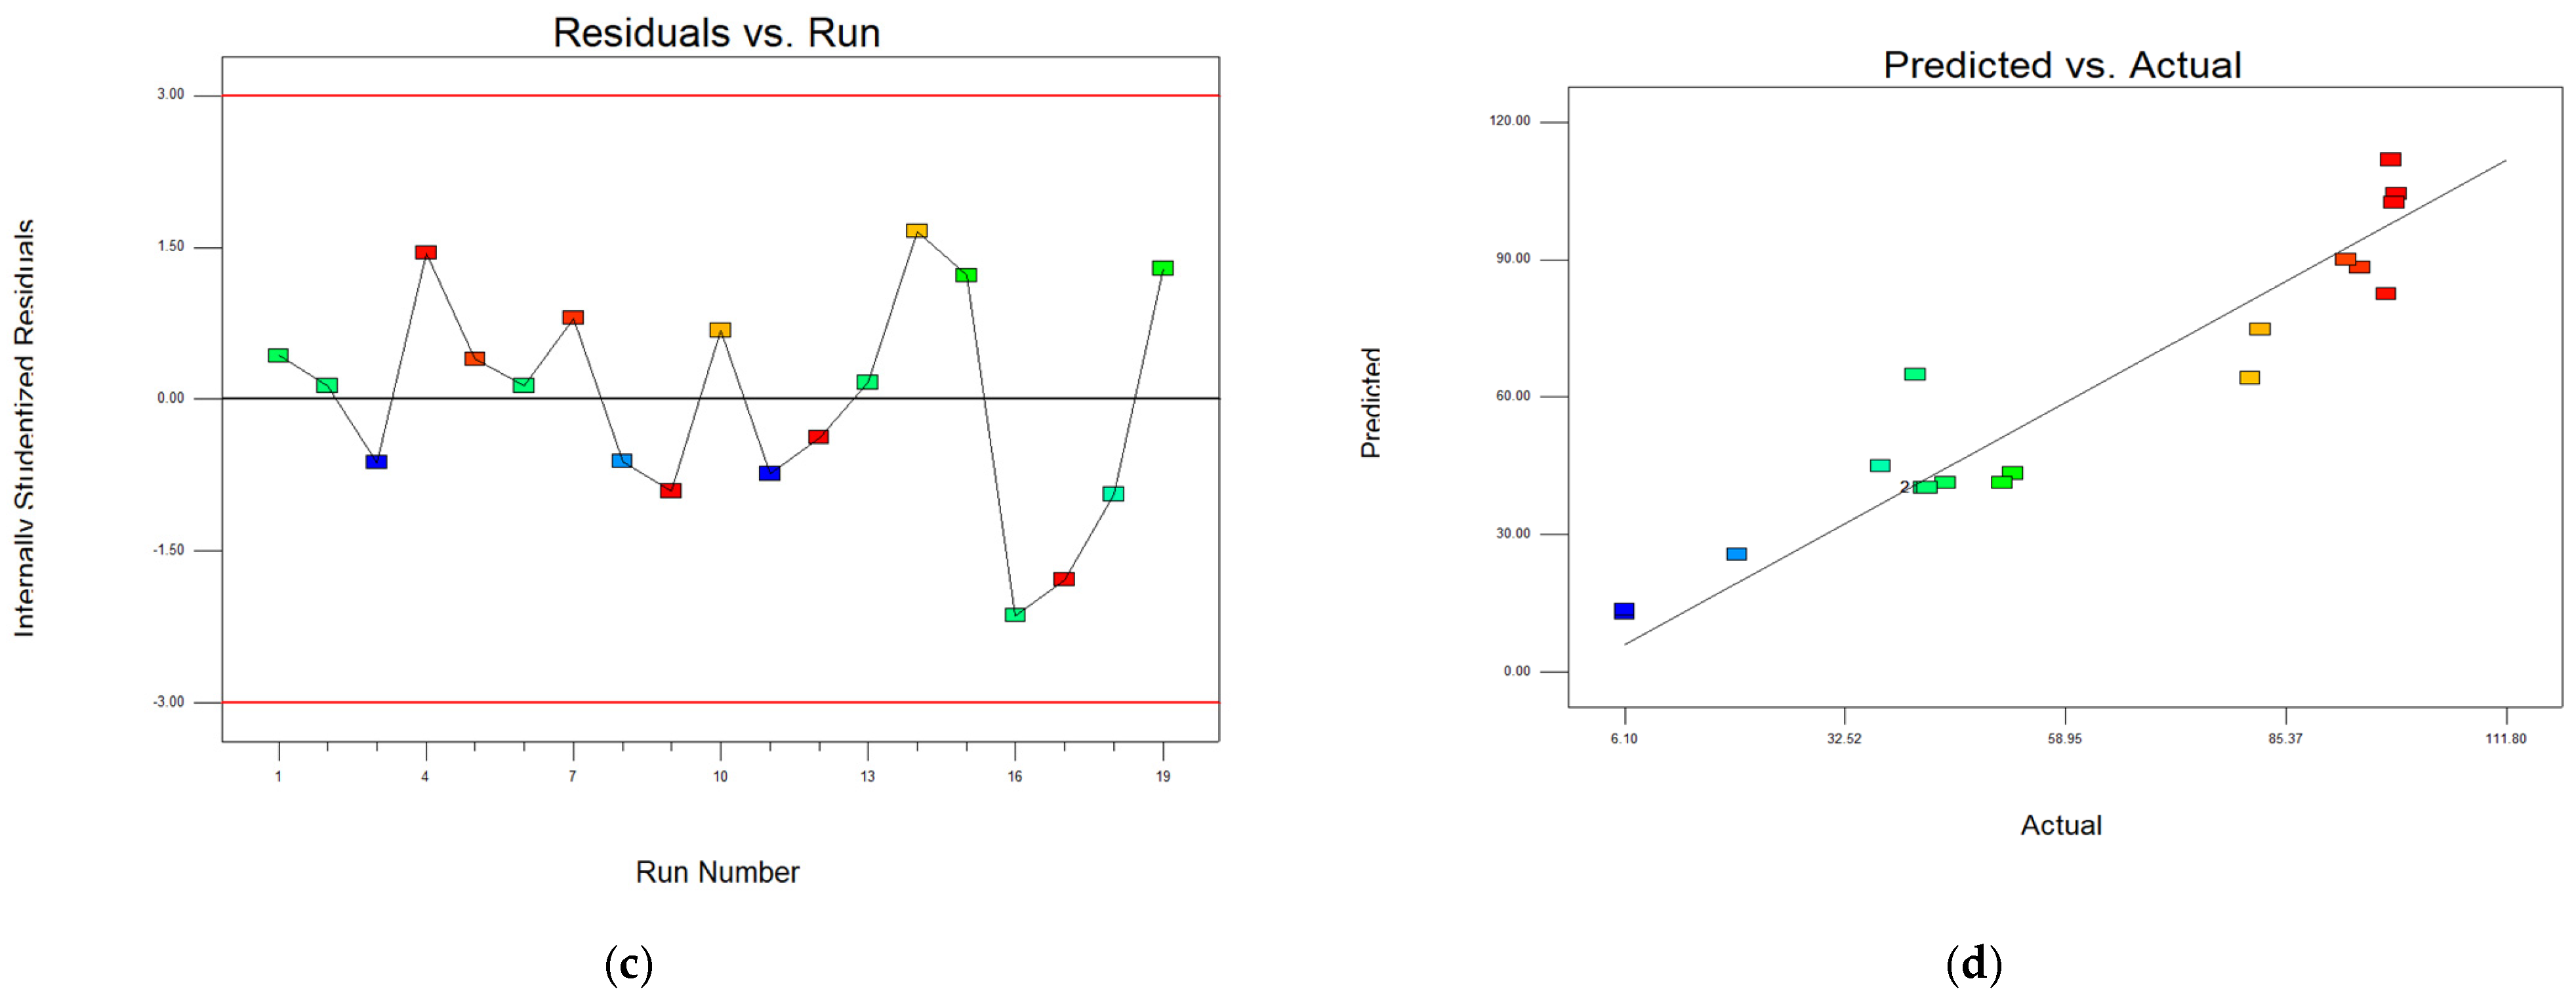
The residual plots presented in
Figure 2 provide statistical validation of the regression model used to predict Cr
2O
3 extraction. The data points in all diagnostic plots are color-coded based on extraction efficiency: red dots represent high Cr
2O
3 recovery (>90%), blue indicates low values (<40%), while green (40%–70%) and yellow (70%–90%) represent intermediate ranges.
The normal plot of the residuals (
Figure 2a) evaluates the normality assumption of the model errors. The residuals are closely aligned along the reference red line, indicating a normal distribution of errors and supporting the model’s adequacy. The internally studentized residuals range between approximately −2.14 and +1.66, which lies within the acceptable limits (±3). The close alignment and symmetric spread confirm that the model accurately describes the system, although minor deviations at the tails may suggest areas for refinement.
The residuals versus predicted values plot (
Figure 2b) assesses whether the model exhibits systematic bias across the range of predicted responses. The residuals are randomly distributed around zero without any discernible trend, indicating homoscedasticity and absence of model misspecification. There is no apparent pattern, and all residuals fall within critical bounds (±3). Red points (high recovery) and blue points (low recovery) fall well within the limits, supporting the model’s reliability. This plot confirms that the model remains stable across the experimental domain and effectively captures the interaction of variables.
The residuals versus run plot (
Figure 2c) checks for potential drifts or systemic errors over the sequence of experimental runs. The residuals are scattered randomly around the baseline with no trend, suggesting that the experimental process remained consistent over time. No outliers or anomalies were detected beyond the ± 3 threshold, indicating high experimental stability.
Finally, the predicted versus actual values plot (
Figure 2d) evaluates the model’s predictive accuracy. Most of the data points are positioned along the diagonal line (y = x), indicating good agreement between the predicted and actual Cr
2O
3 recovery values. Slight deviations from the diagonal are observed in the low–middle range (up to ~60%), which may indicate minor systematic errors in this range. In the high recovery zone (>85%), predictions are more accurate, with red points closely following the diagonal. This suggests that the model is particularly effective at capturing behavior in the optimal extraction range.
Figure 3 shows the interaction between temperature and Na
2CO
3 dosage.
Figure 3a illustrates the influence of temperature and Na
2CO
3 addition on Cr
2O
3 extraction. The following trends are observed:
Cr2O3 extraction increases with rising temperature and Na2CO3 dosage.
At low temperatures and low Na2CO3 amounts, the extraction rate remains minimal (~6%–30%).
The optimal extraction zone (close to 98%) is achieved at high temperatures (above 950 °C) combined with Na2CO3 additions exceeding 130 g.
The response surface exhibits a nonlinear trend, indicating complex interactions between the variables, although a general positive correlation with both factors is evident.
The corresponding contour plot shows a consistent increase in Cr2O3 extraction as the temperature rises from 850 °C to 1000 °C. This behavior is expected, as higher temperatures accelerate phase transformations, enhance chromite reactivity with soda, and promote the formation of soluble chromium compounds.
Similarly, increasing the Na2CO3 addition from approximately 80 g to 150 g leads to moderate improvements in Cr2O3 extraction. However, at lower temperatures (850–900 °C), the benefits of additional soda are limited by insufficient thermal activation, with extraction rates remaining below 40%. Only when the roasting temperature exceeds 950 °C does the addition of 120–130 g Na2CO3 enable optimal Cr2O3 extraction in the range of 70%–98%.
Figure 4 presents the influence of temperature and roasting duration on Cr
2O
3 extraction under a constant Na
2CO
3 addition level.
The following conclusions can be drawn from the results:
Temperature continues to have a positive effect on Cr2O3 extraction, whereas the influence of roasting duration appears less straightforward.
At short roasting times (60–75 min), Cr2O3 extraction remains low, even under high-temperature conditions.
The optimal extraction zone is achieved at elevated temperatures (950–1000 °C) combined with roasting durations longer than 90 min.
The response surface exhibits a parabolic shape, indicating the existence of an optimal roasting time to achieve maximum Cr2O3 extraction.
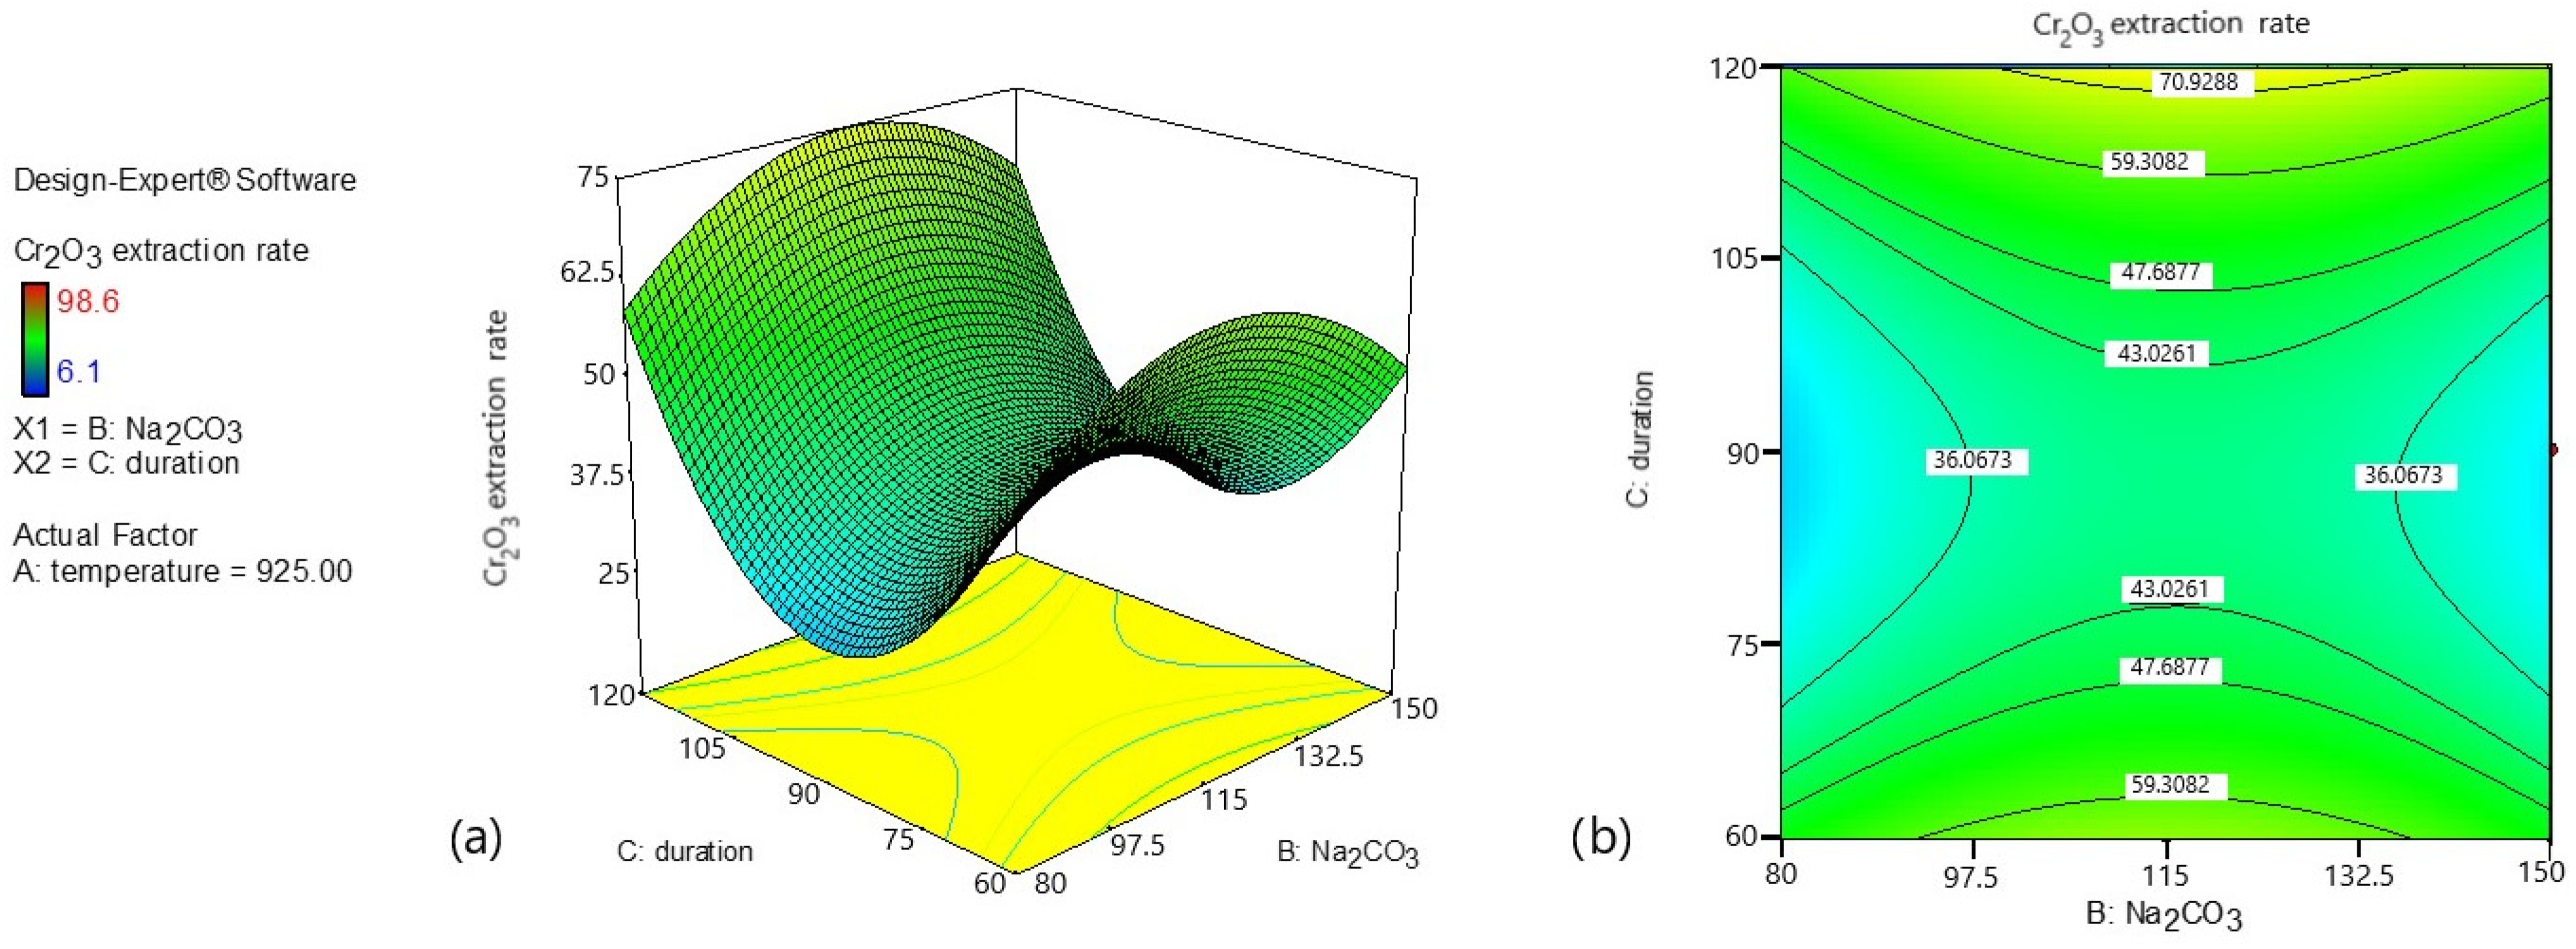
Figure 5 shows the influence of Na
2CO
3 addition and roasting duration on Cr
2O
3 extraction at a fixed temperature of 925 °C.
Figure 5 illustrates the effect of Na
2CO
3 dosage and roasting duration on Cr
2O
3 extraction at a constant temperature of 925 °C.
The following trends are observed:
At this temperature, increasing Na2CO3 addition initially enhances Cr2O3 extraction; however, excessive soda levels may lead to a slight decline in extraction efficiency.
Roasting duration plays a critical role; at short times (60–75 min), extraction efficiency remains low regardless of Na2CO3 dosage.
The highest Cr2O3 extraction is achieved through an optimal combination of Na2CO3 addition (approximately 120–130 g) and roasting durations exceeding 90 min.
Thus, the overall conclusions are:
Temperature is the primary factor influencing Cr2O3 extraction, with higher temperatures favoring improved recovery.
Na2CO3 addition significantly boosts extraction, but excessive additions are not always economically justified.
Roasting durations longer than 90 min are necessary to achieve maximum extraction efficiencies.
The optimal roasting parameters determined for maximizing Cr2O3 recovery during subsequent aqueous leaching are: 1000 °C, 120%–130% Na2CO3 (relative to tailings mass), and 120 min roasting time.
The findings allow refining industrial roasting regimes to enhance the efficiency of chromium recovery processes.
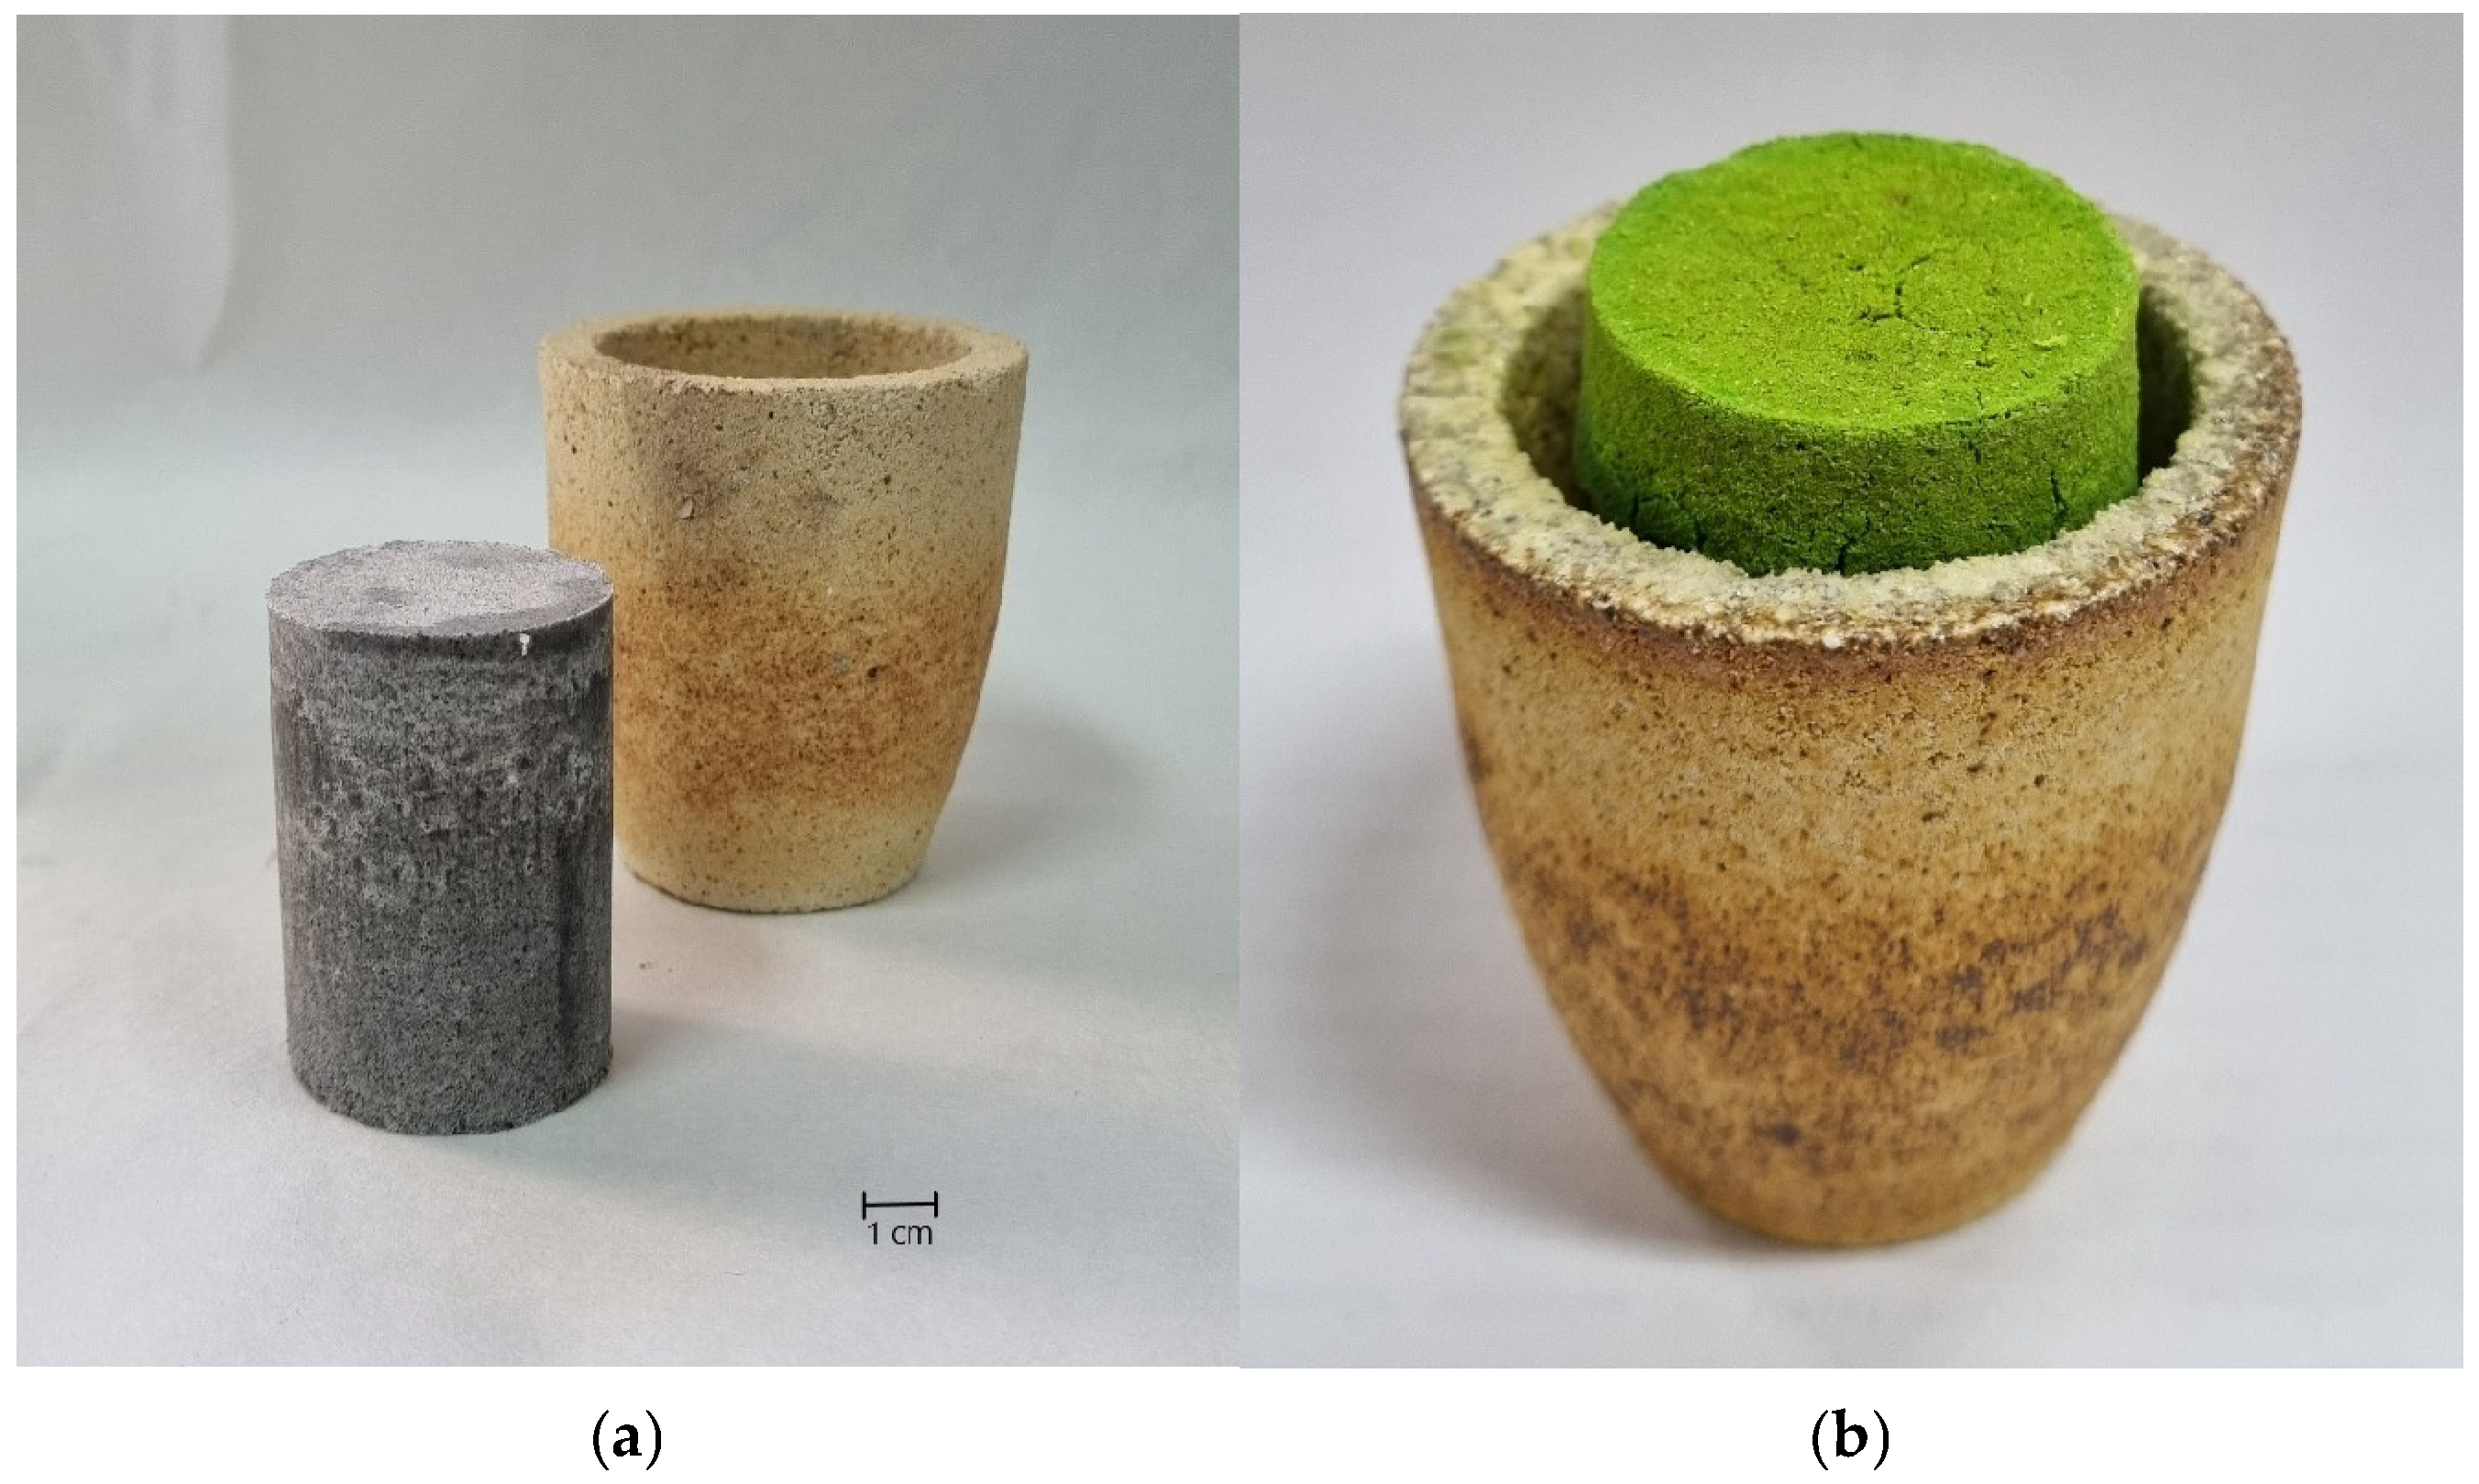
Following roasting under the optimized conditions, a sintered product was obtained (
Figure 6).
The chemical composition of the roasted sample (wt.%) is as follows:
Na2O—35.98%; Cr2O3—15.59%; Fe2O3—9.014%; NiO—0.423%; Co3O₄—0.042%; ZnO—0.018%; MgO—26.545%; SiO2—9.785%; Al2O3—1.426%; ΣREE—0.025%.
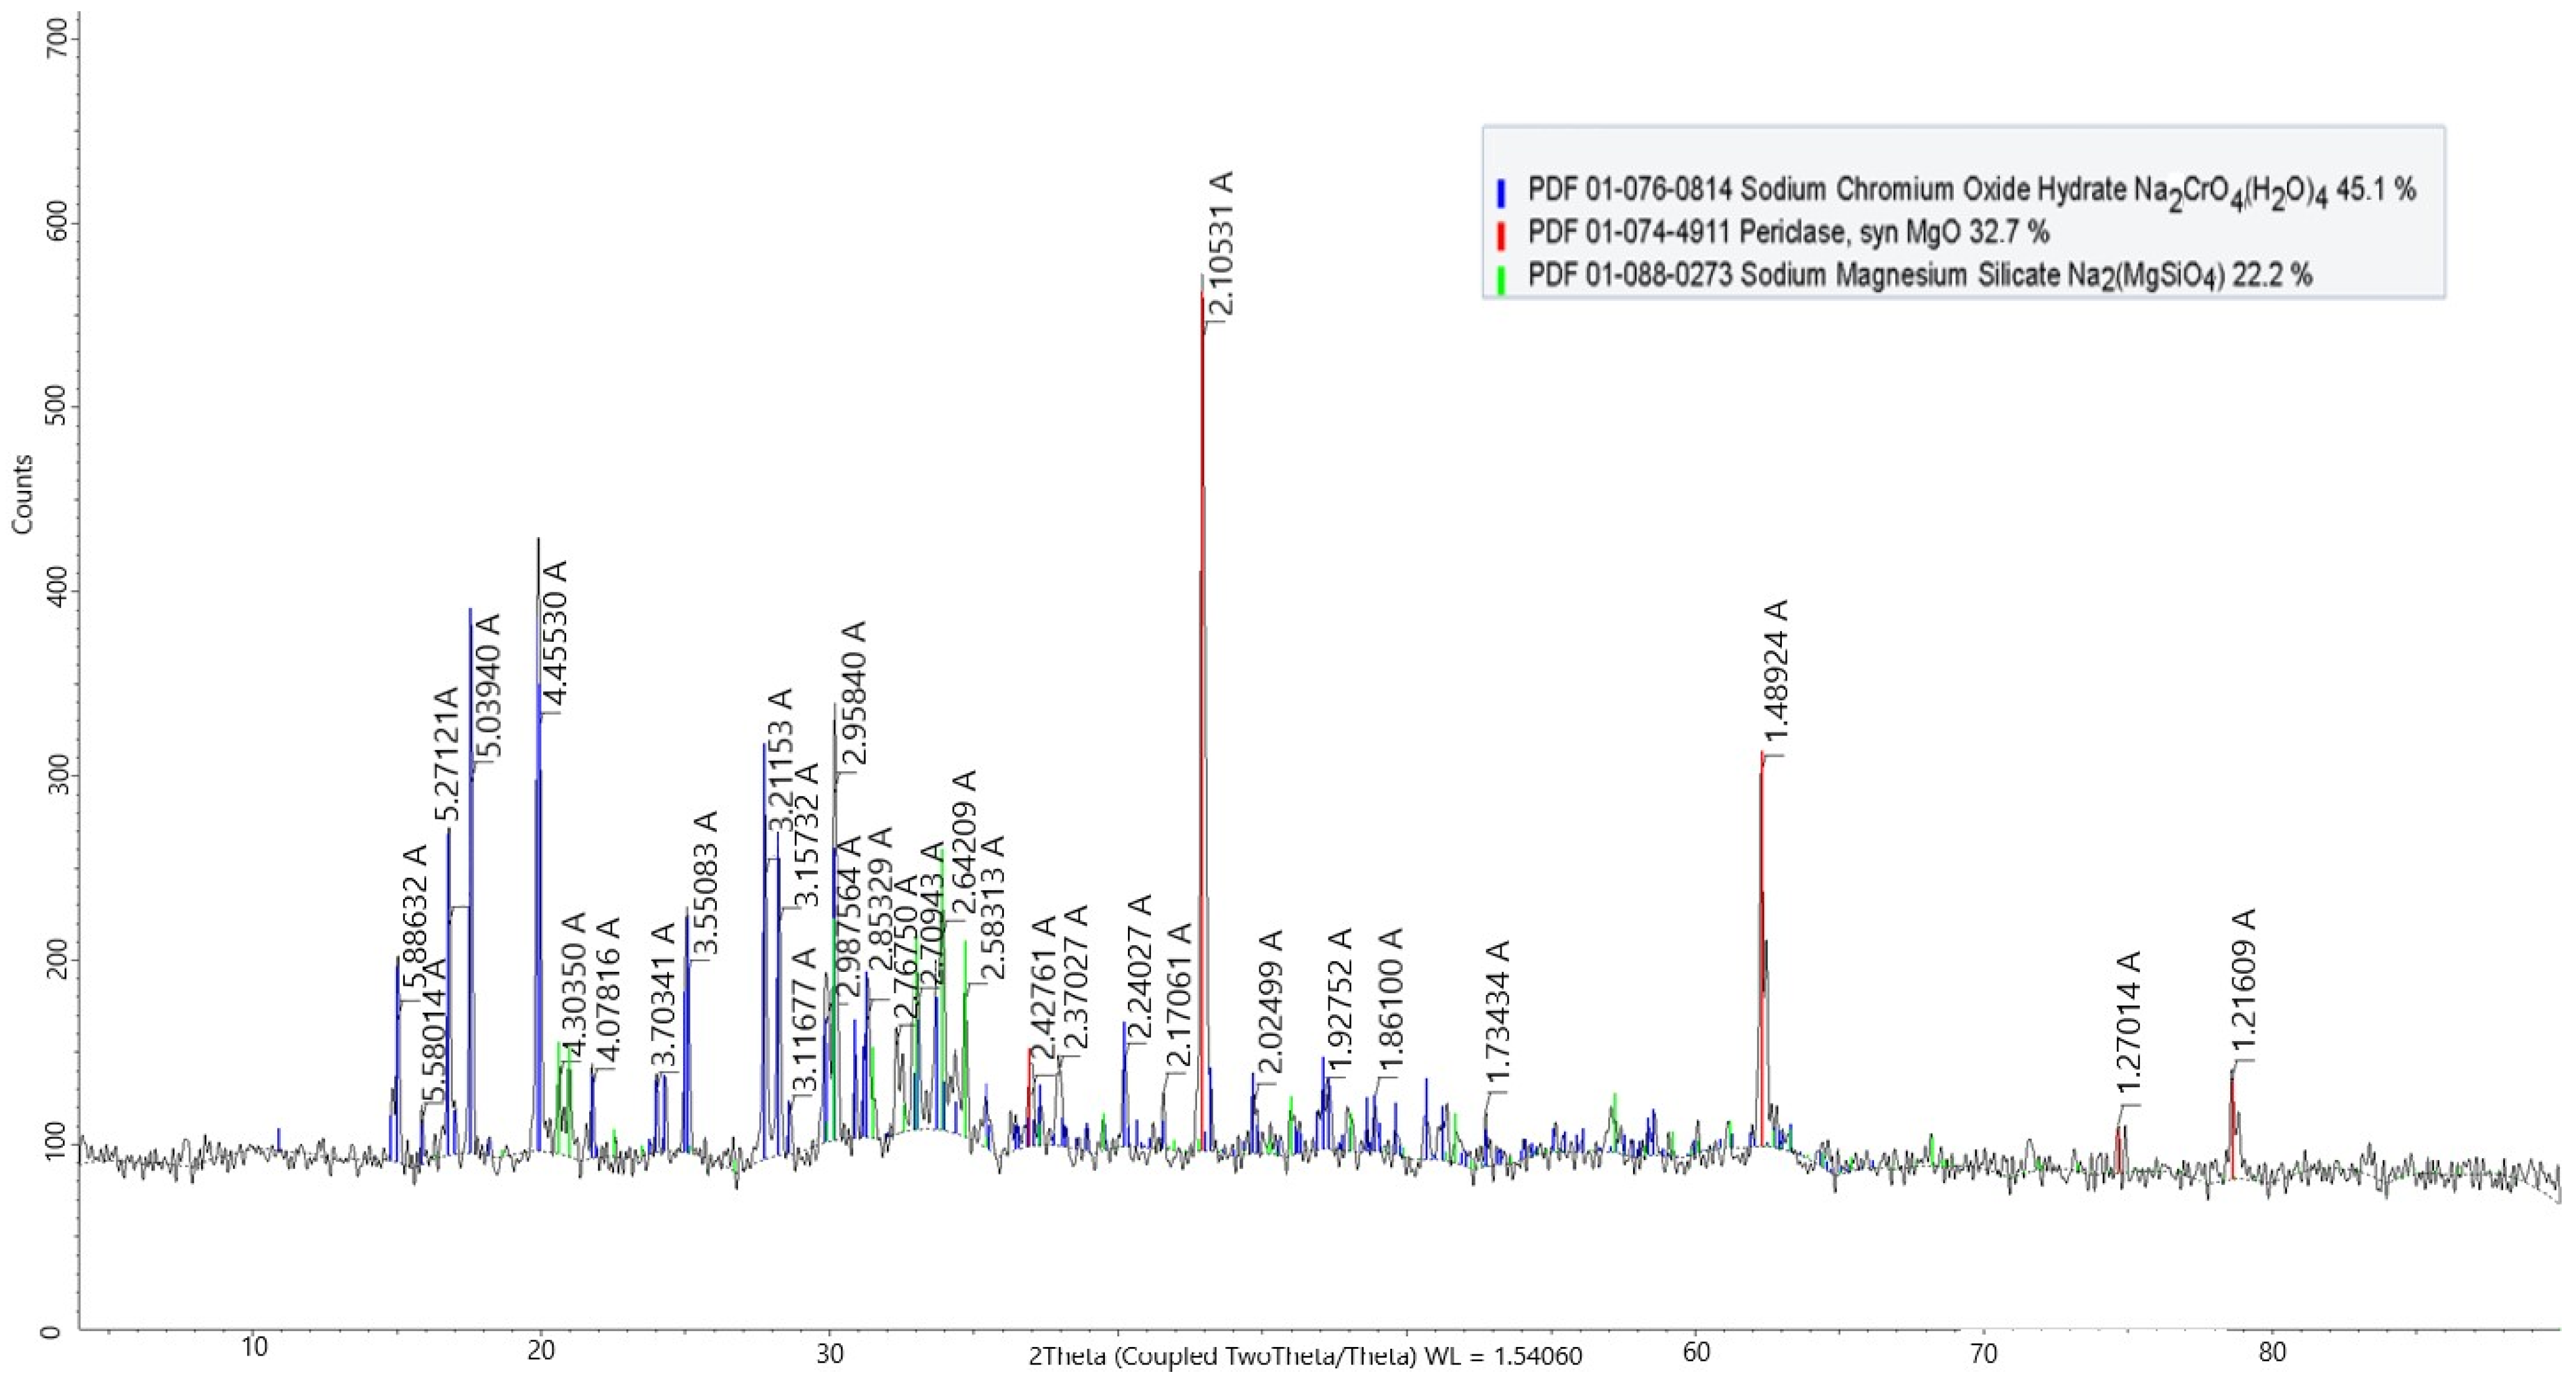
The phase composition of the roasted product, obtained by X-ray diffraction (XRD) analysis, is presented in
Figure 7.
Figure 7 shows that roasting under optimal conditions leads to the complete breakdown of the original spinel structure, as evidenced by the disappearance of chromite peaks and the formation of water-soluble Na
2CrO₄. Concurrently, the reaction of magnesium- and silicate-containing phases with sodium carbonate results in the formation of periclase (MgO) and mixed sodium–magnesium silicates. These transformations are typical for materials subjected to alkaline activation prior to leaching. The reaction for this process can be generalized as follows [
19,
20]:
These reactions confirm the alkaline decomposition of refractory spinel and silicate phases and the successful formation of soluble and reactive products for subsequent hydrometallurgical processing.
A microstructural composition analysis was also conducted on the roasted samples using backscattered electron imaging using scanning electron microscopy (SEM) and energy-dispersive spectroscopy (EDS), as shown in
Figure 8.
The microstructural and analytical features observed in
Figure 8 are as follows:
Particle structure and contrast: The cross-sectional surface appears heterogeneous, with various grains and inclusions. Some regions show bright contrast (likely indicative of phases rich in chromium, iron oxides, or other high-atomic-number components), while darker areas may correspond to more complex mixed-metal phases involving iron, magnesium, and other elements.
Particle size: The visible particle sizes range from several micrometers to tens of micrometers (estimated between 10–100 µm). This suggests that the sintering process caused the agglomeration of previously fine-grained mineral particles, such as chromium or iron oxides.
Mineral differentiation: Bright regions may represent concentrated phases, such as Cr- or Fe-rich oxides, formed during high-temperature treatment. On the other hand, less reactive or lower-temperature areas may contain incomplete or fewer crystalline structures.
Elemental distribution maps (
Figure 9) indicate the presence of oxygen, silicon, sodium, magnesium, aluminum, and chromium as the main components.
The observed microstructure is typical for sintered materials undergoing chemical transformations intended to liberate valuable metals such as chromium. The presence of diverse grain morphologies and densities confirms a complex material matrix, potentially suitable for further chemical and thermal processing.
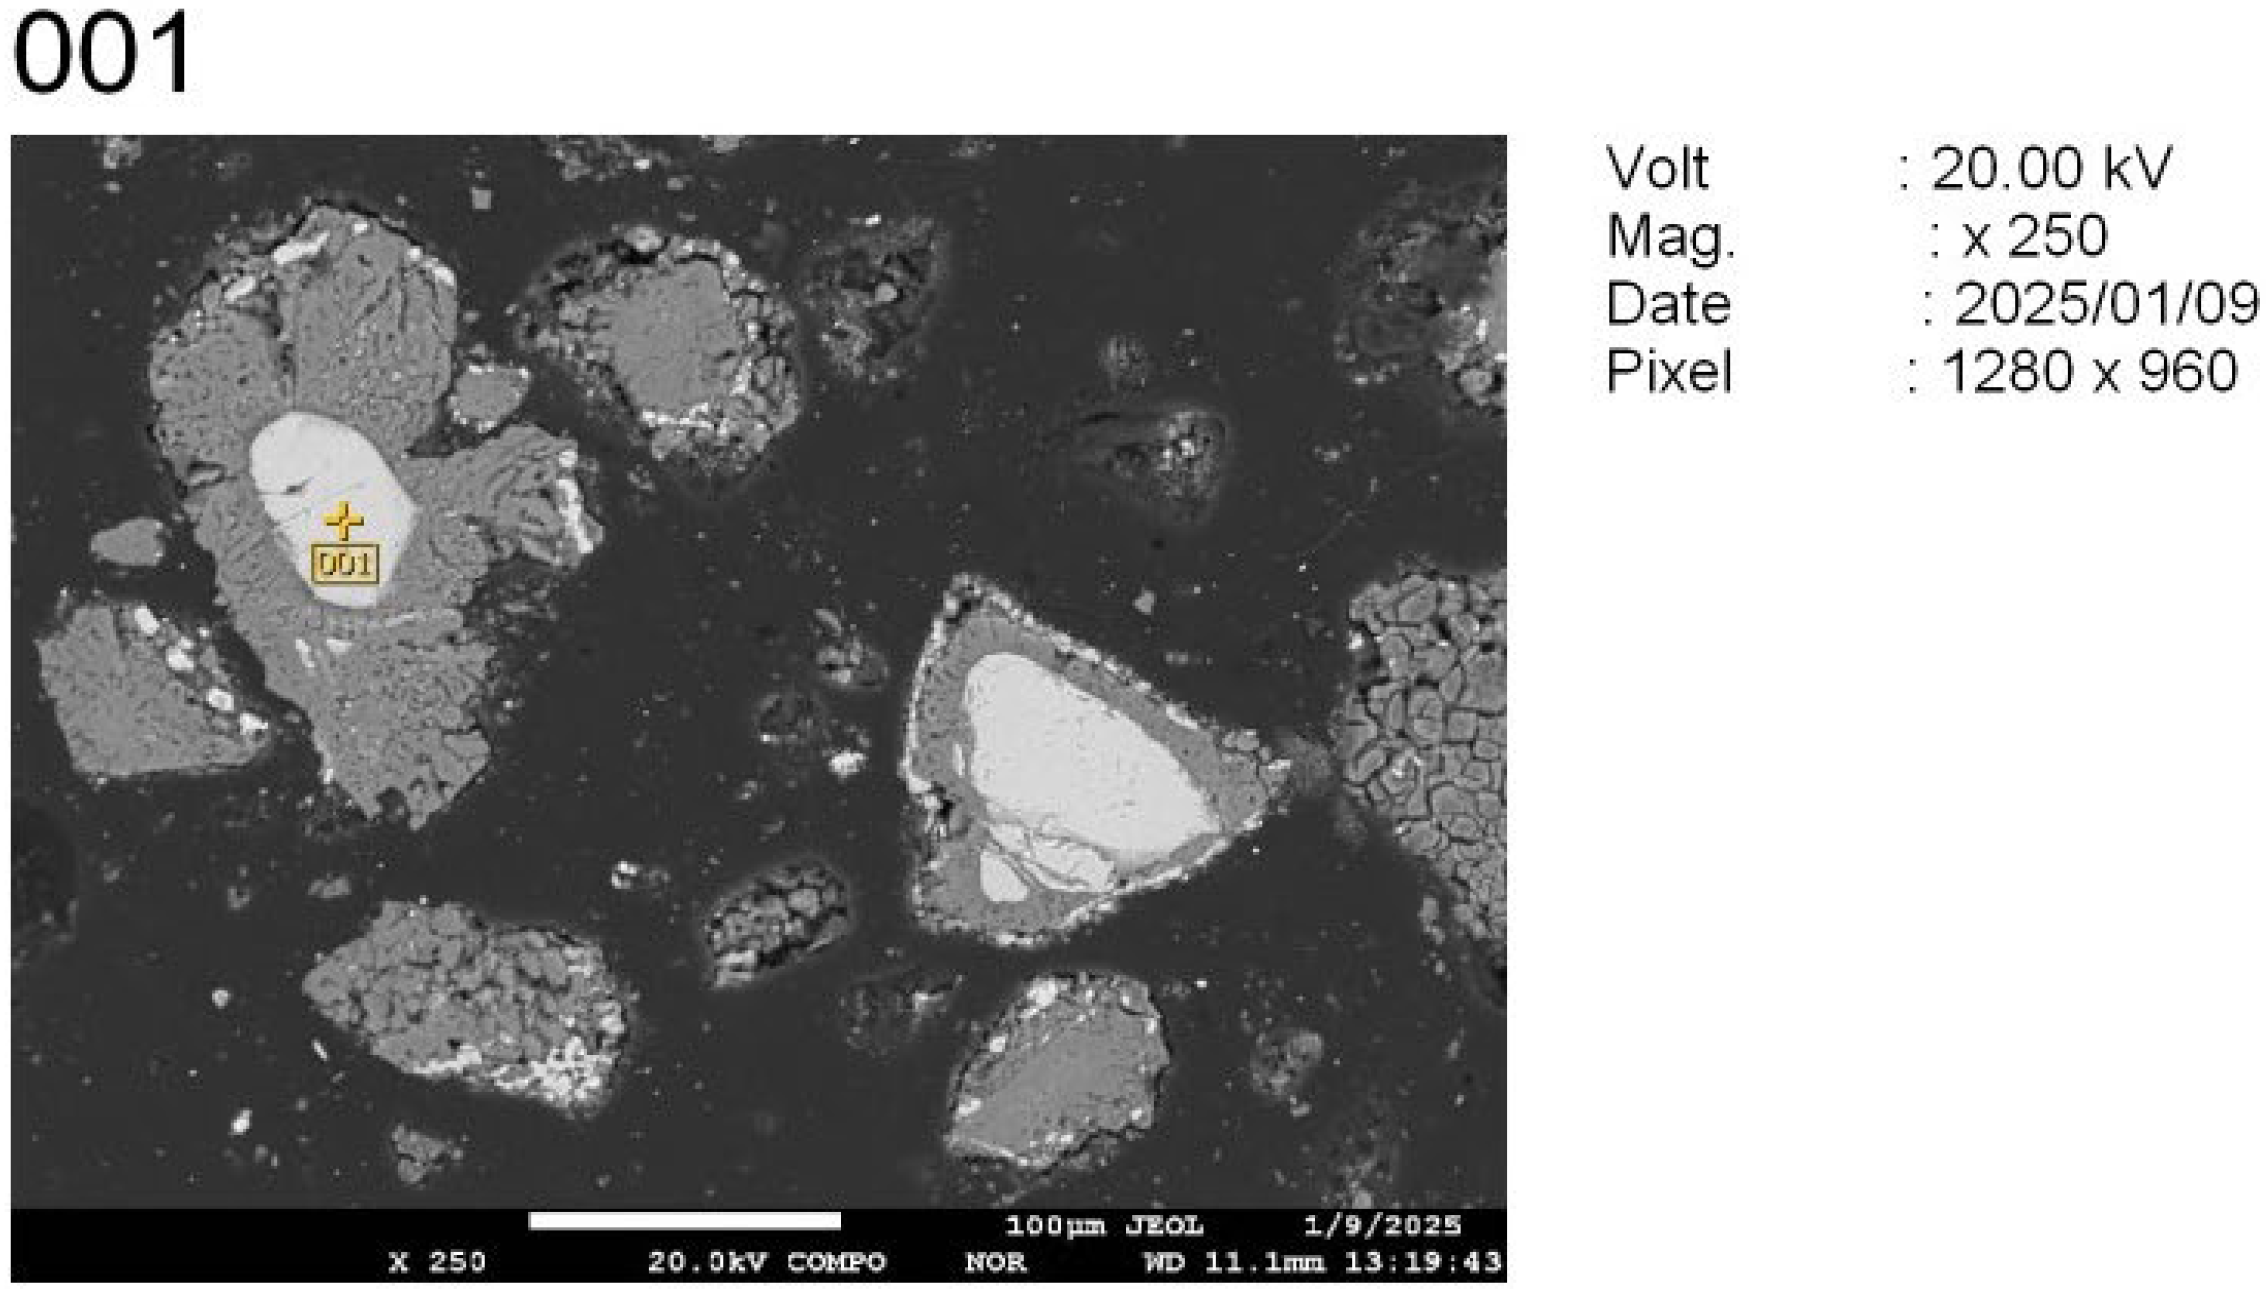
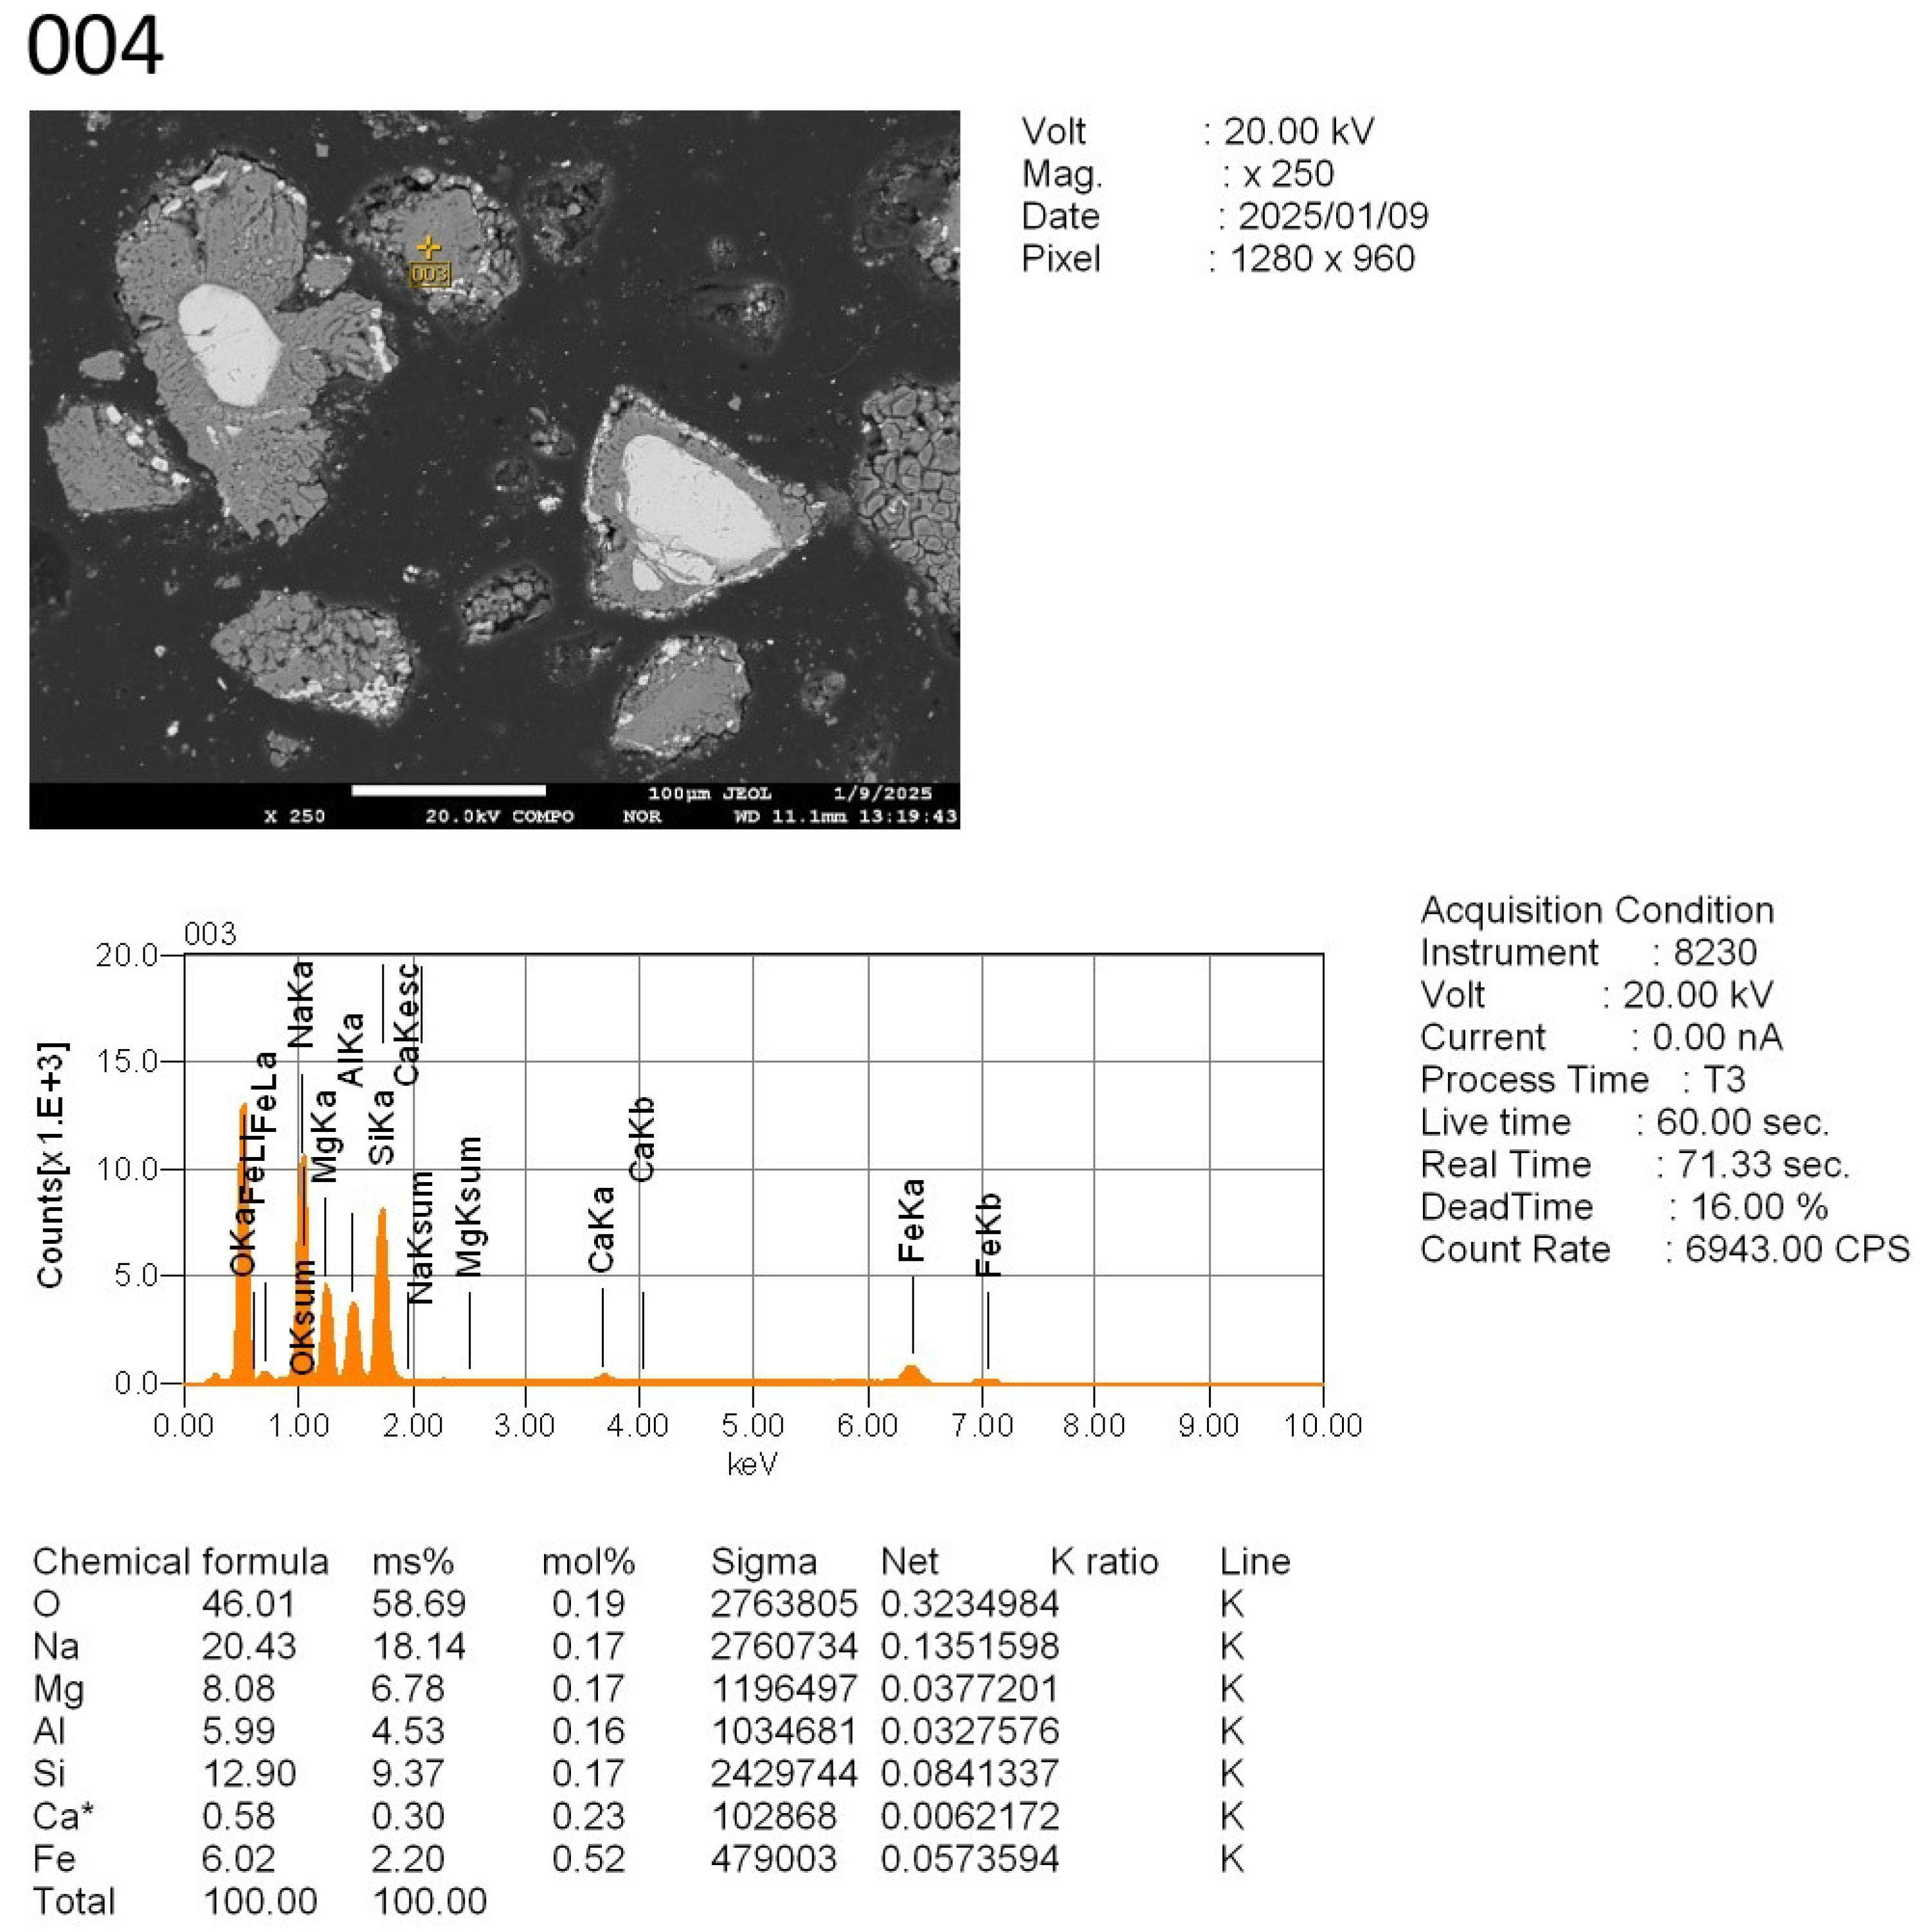
To study the reaction progression between the tailings and sodium additives—especially with respect to chromium behavior—four representative locations were selected from the polished cross-sections of the sintered samples (
Figure 10):
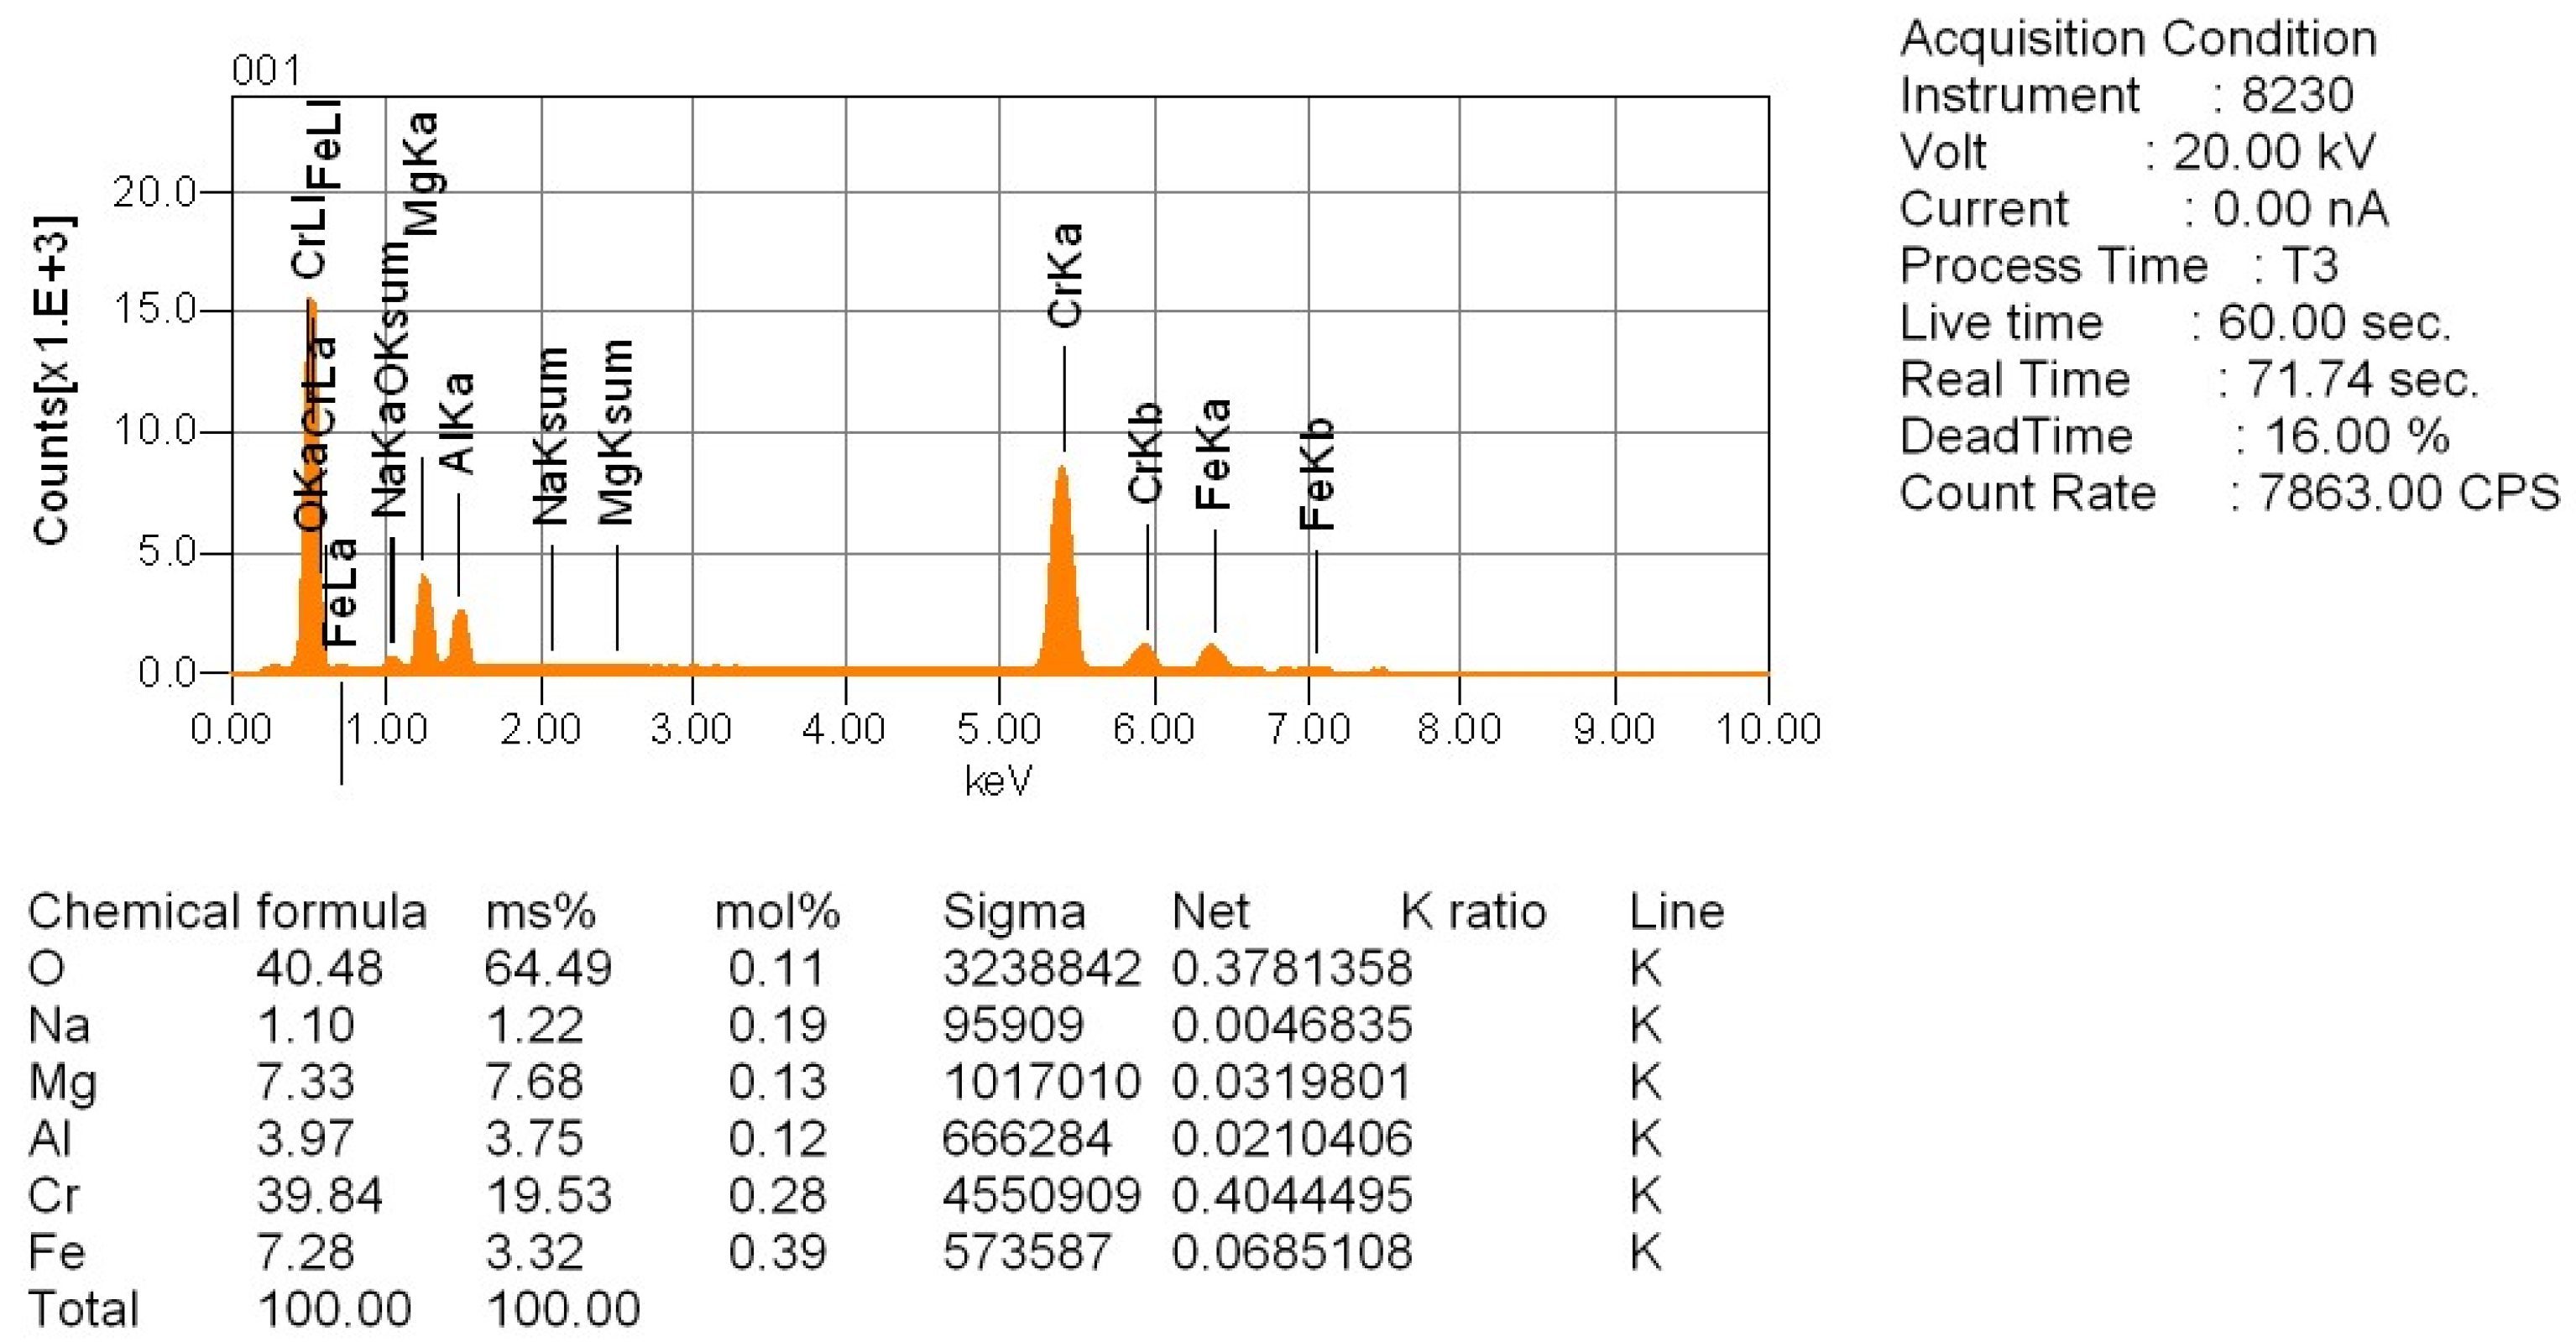
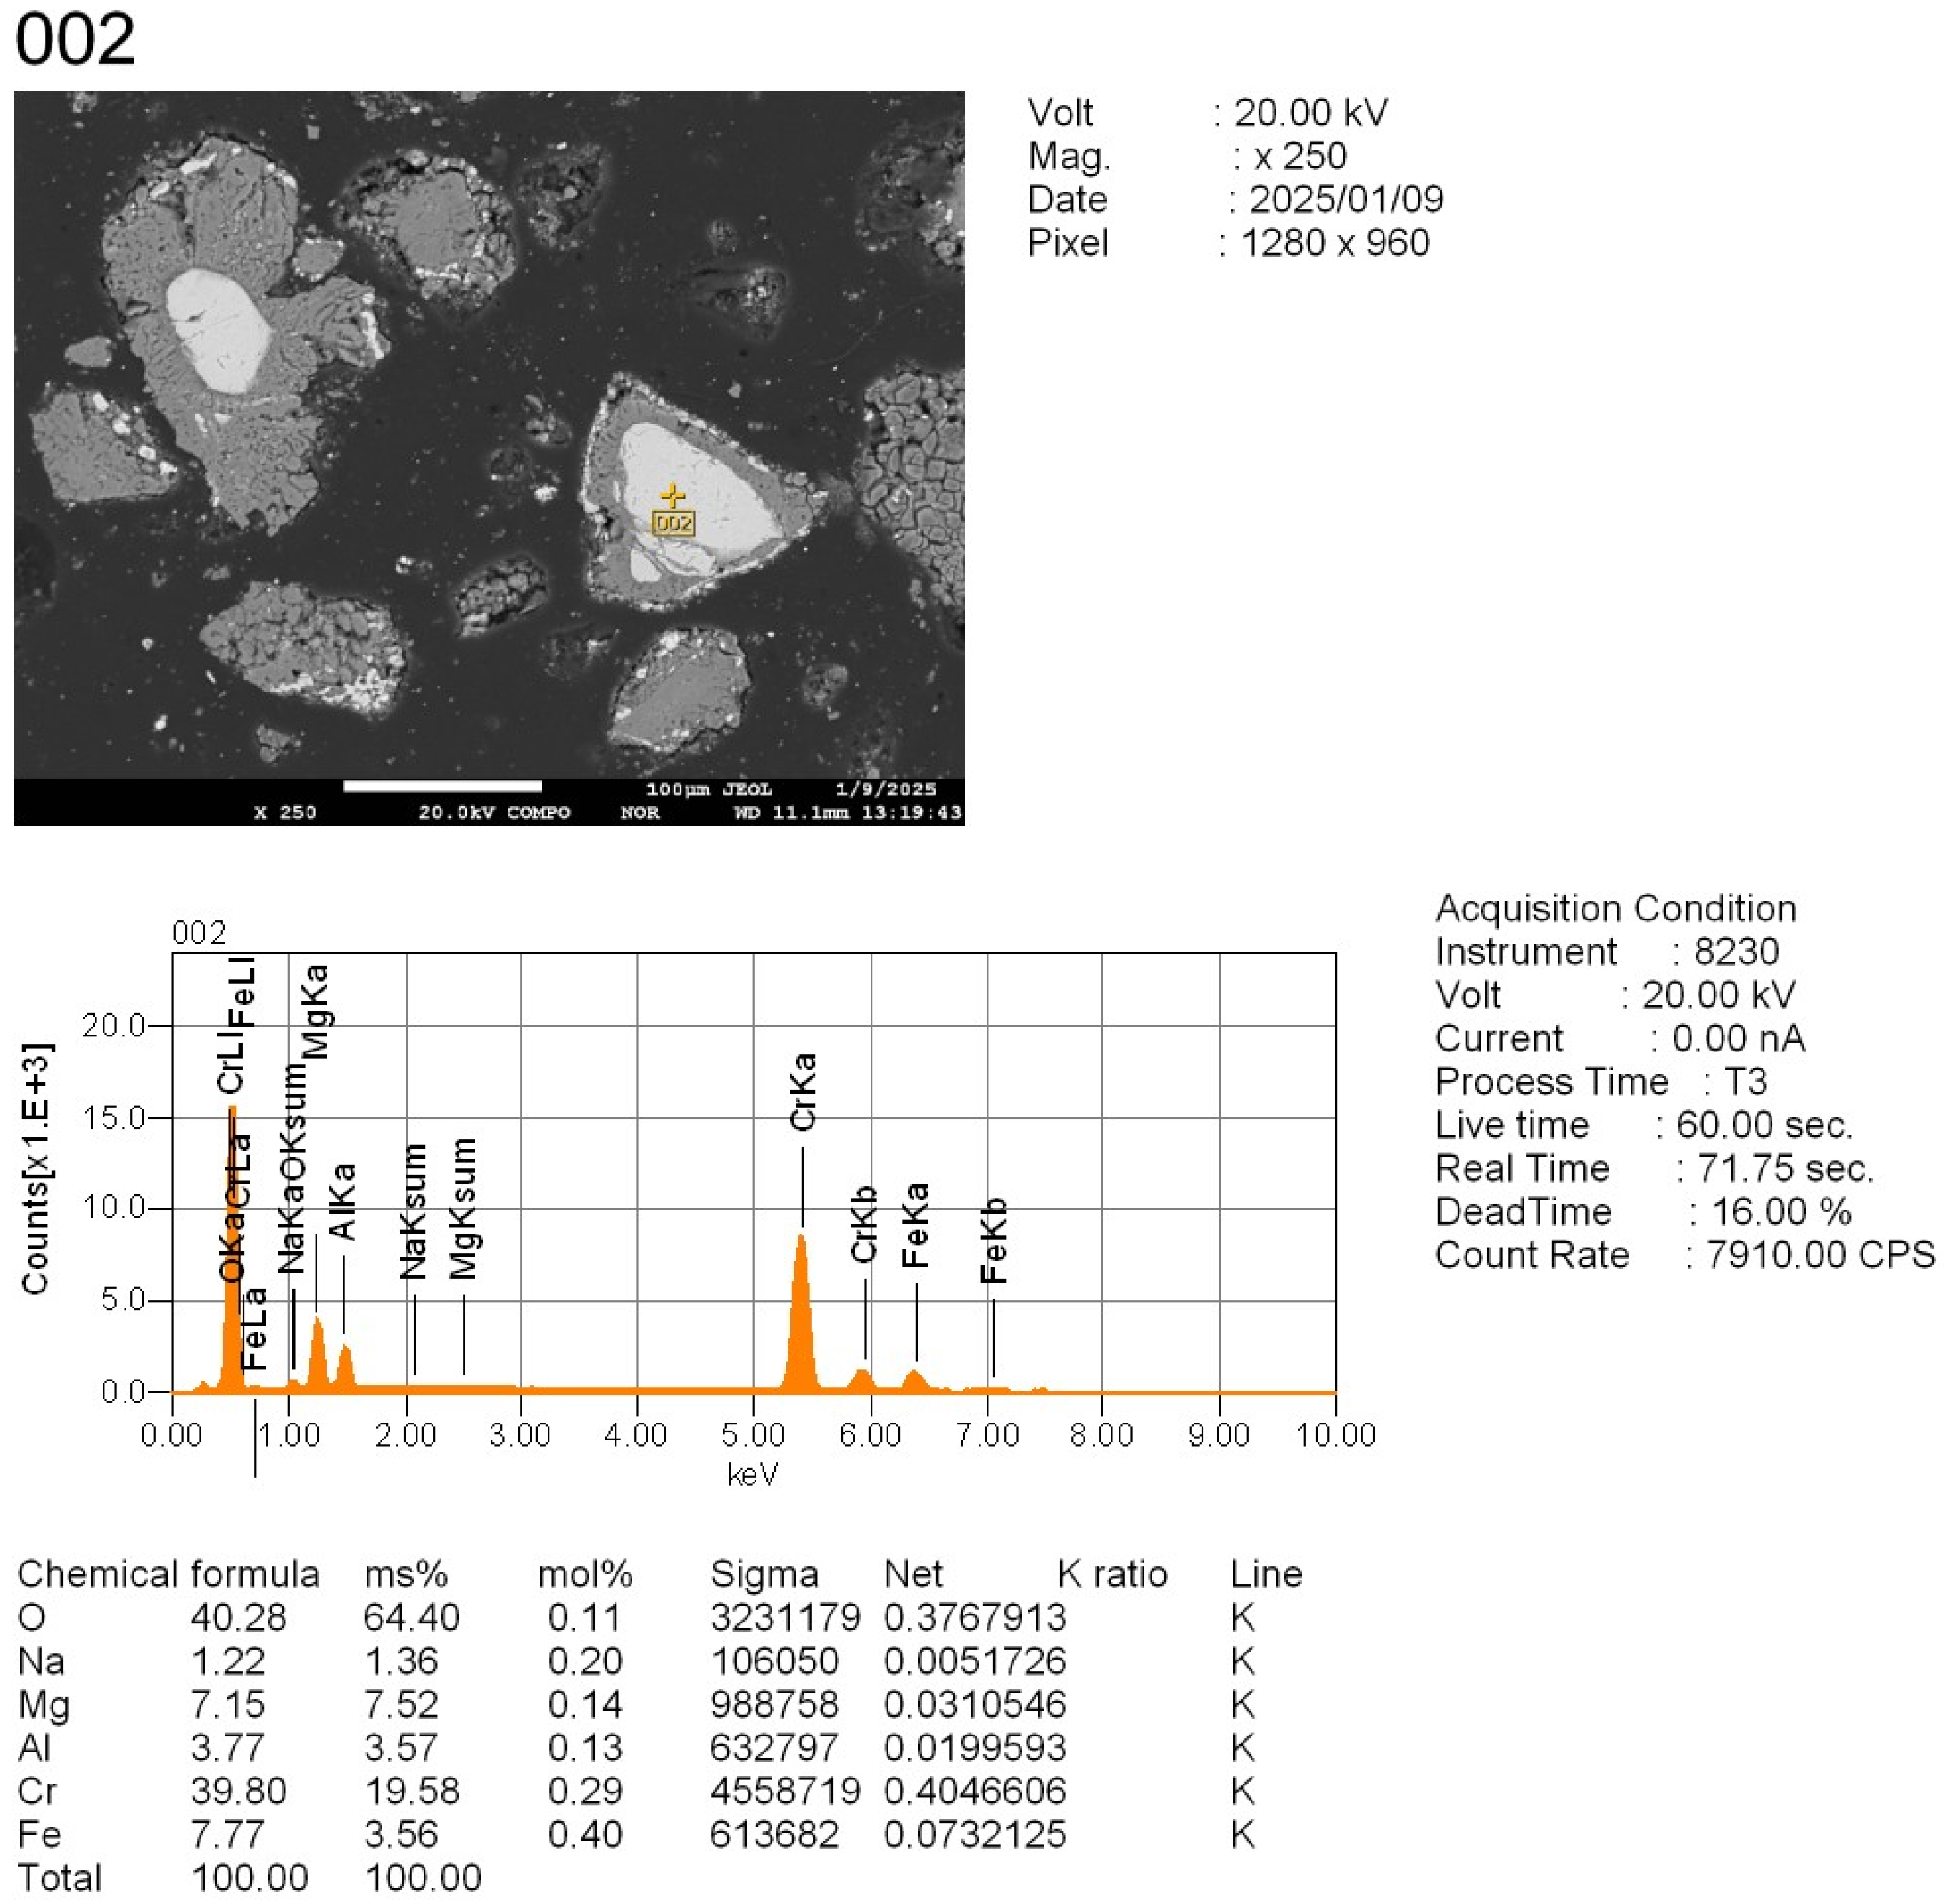
Points 001 and 002: unreacted chromite cores, retained for baseline comparison.
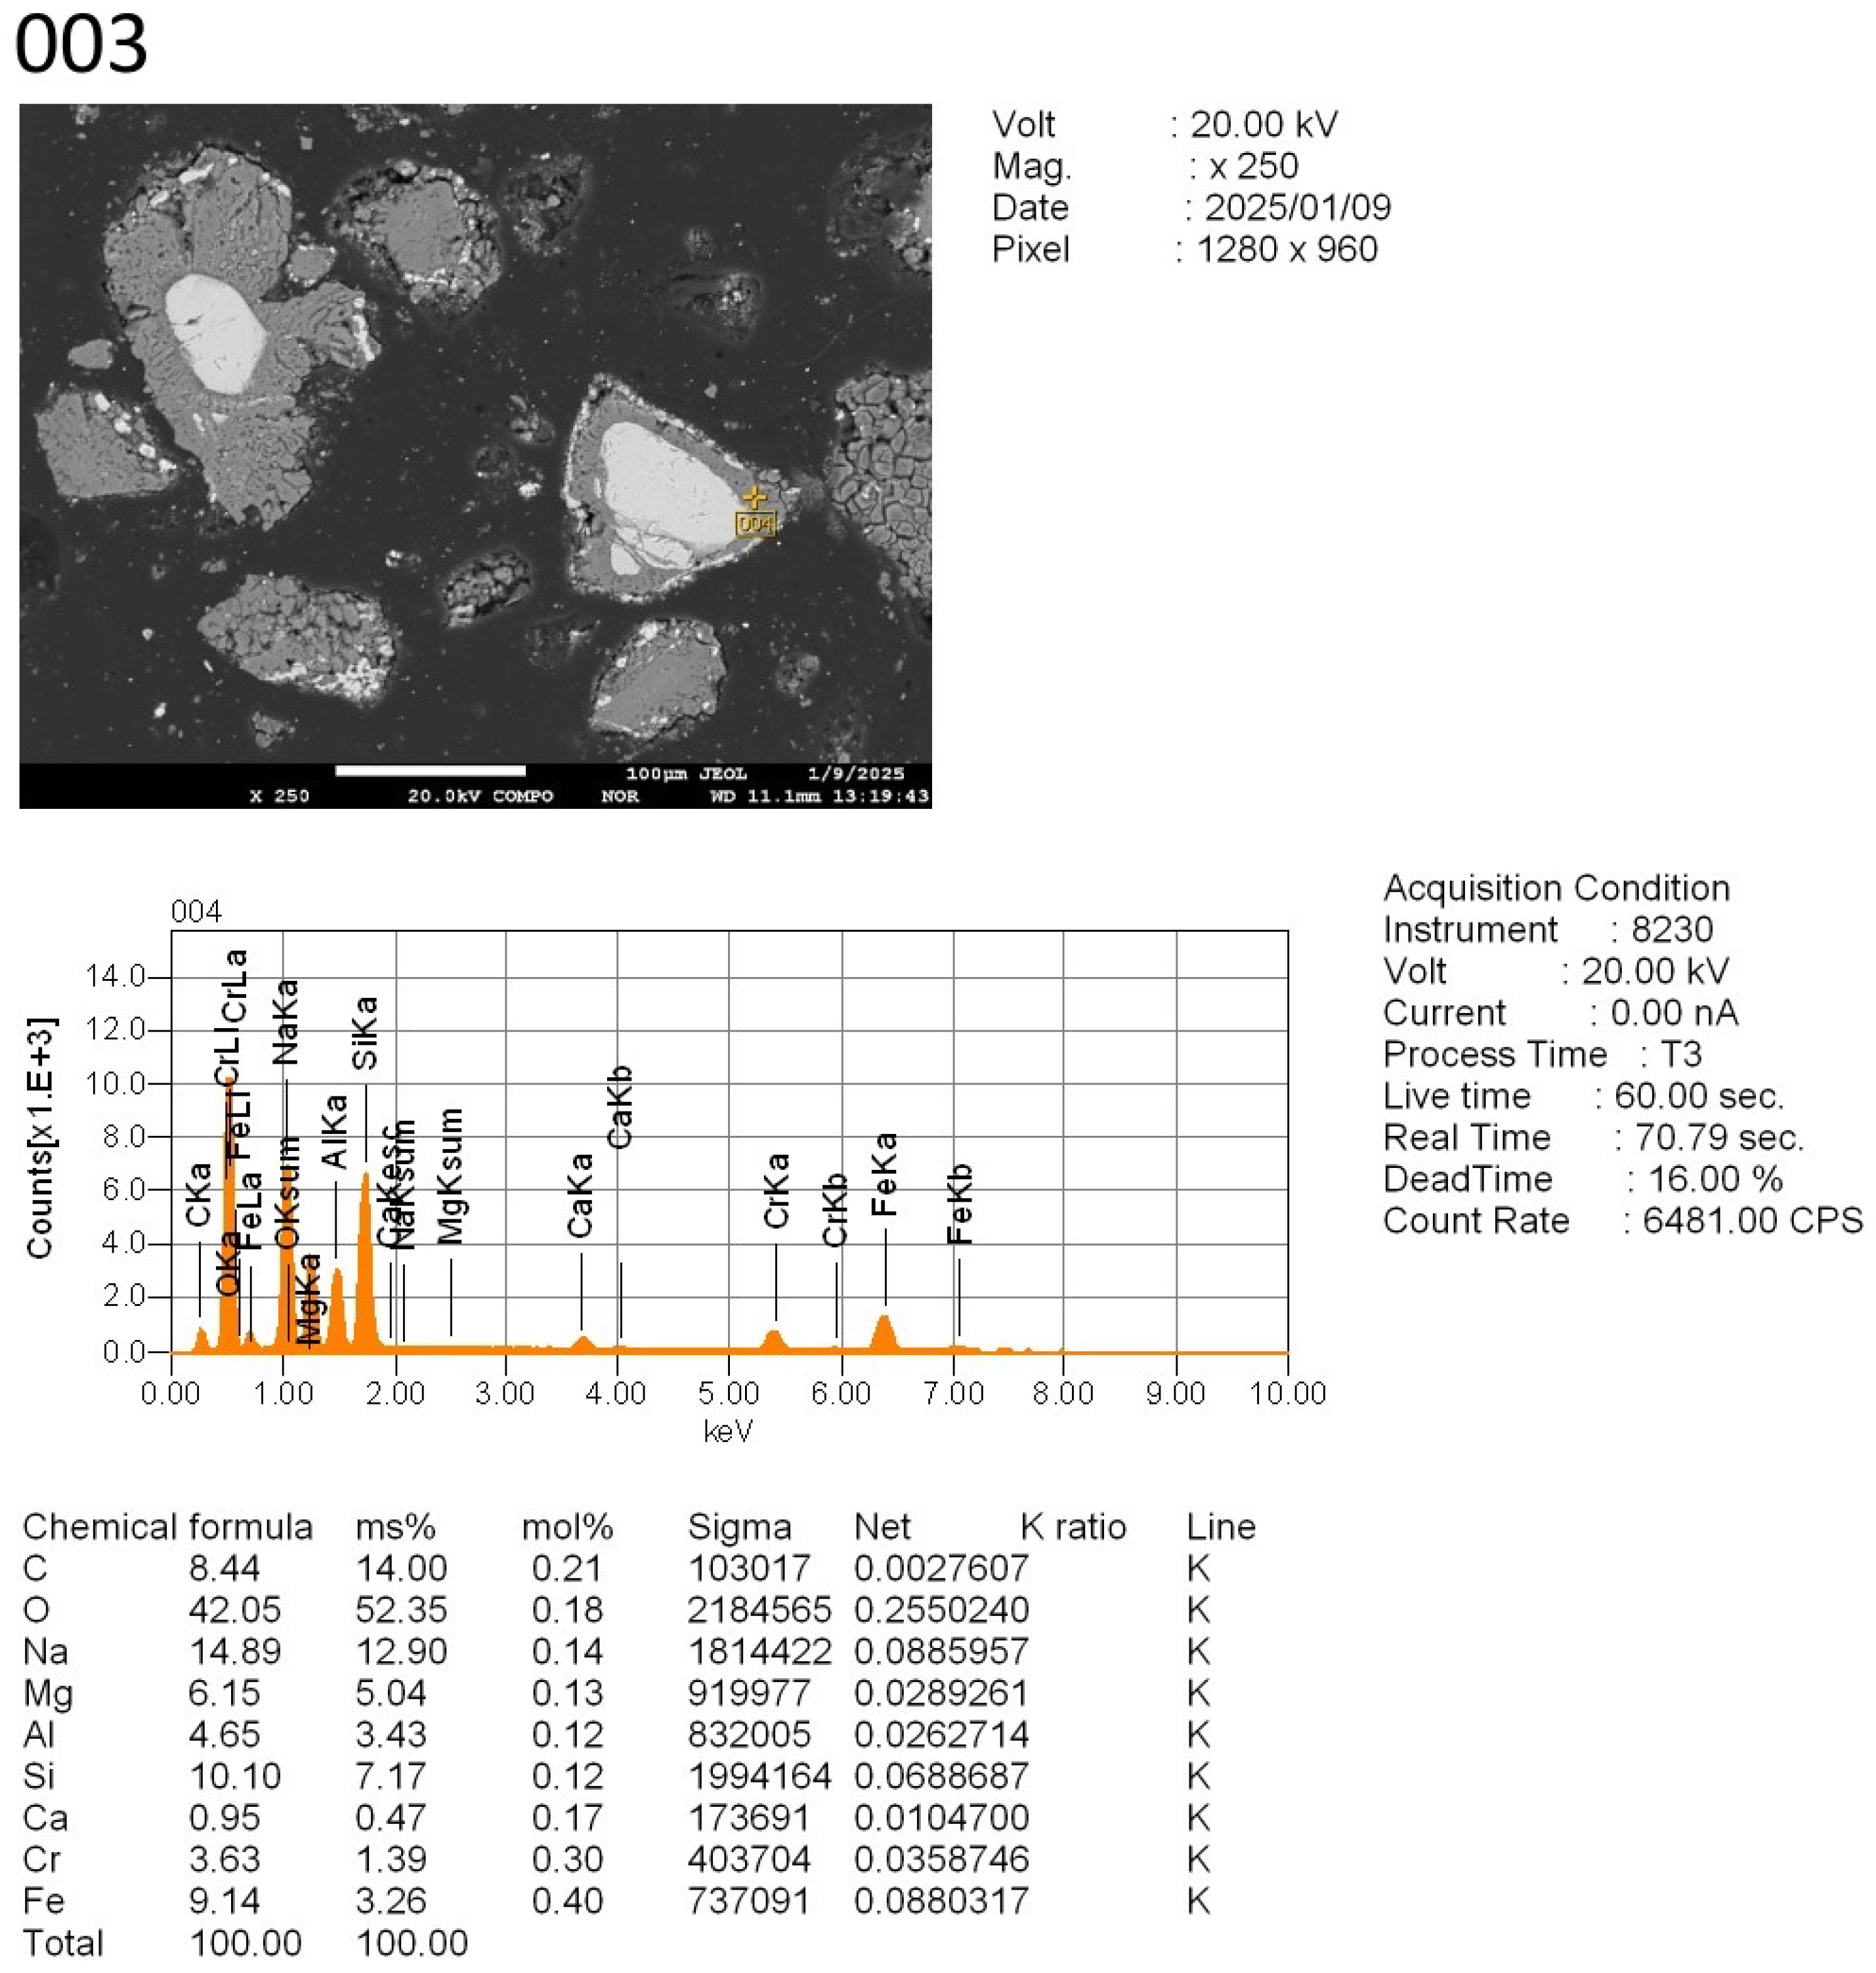
Point 003: a partially reacted grain zone.
Point 004: a fully reacted area.
The results of the pointwise elemental analysis are presented in
Appendix A,
Appendix B,
Appendix C and
Appendix D, which include EDS spectra, tables of elemental mass concentrations, and a comparative diagram illustrating the behavior of key components at different reaction stages.
The EDS analysis (
Figure 10,
Appendix A) clearly reveals that point 001 corresponds to an unreacted residual of the original chromite grain. The phase is dominated by chromium- and magnesium-rich spinels, with inclusions of iron and aluminum. The particles’ core size is approximately 66 µm.
The high oxygen content confirms the oxide nature of the compound. The lack of sodium signal, particularly in the form of slag phases, indicates that the roasting reaction did not fully penetrate the center of the grain. This is typical of insufficient reaction time or an overly coarse particle size, which hinders complete transformation during solid-state roasting.
Thus, point 001 provides evidence of an unreacted chromite core, likely surrounded by reaction products—a characteristic feature of heterogeneous roasting processes. To enhance Cr2O3 recovery under such conditions, it is advisable to increase the roasting duration, reduce the particle size of the input material, or enhance flux reactivity by increasing the Na2CO3 dosage.
The analysis of point 002 (
Figure 10,
Appendix B) confirms results similar to point 001. It represents another unreacted chromite grain, retaining its original mineral structure. The size of the unreacted core at this point is approximately 100 µm, suggesting limited diffusion of sodium and incomplete phase transformation. This further reinforces the observation that particle size and reaction time are critical parameters in achieving full conversion during roasting.
Point 003 (
Figure 10,
Appendix C) is located in a bright grain region, typical of a reaction-altered zone that underwent significant thermochemical transformation. This is the area where active interaction between the tailings and Na
2CO
3 occurred.
The high oxygen content confirms a dominant oxide phase. The presence of a significant sodium signal indicates successful reaction with sodium carbonate. Compared to unreacted areas, the chromium content is markedly reduced (3.63 wt.%, 1.39 at.%), suggesting either chromium displacement from this phase as a result of alkali interaction, or its redistribution into other less-reactive or insoluble regions (e.g., unreacted chromite cores).
This is consistent with partial reaction and the formation of Na-rich intermediate phases. This region is enriched in Na, Si, and O, typical for glassy or amorphous sodium–silicate-type reaction products; additionally, it contains Al, suggesting partial incorporation or leaching of aluminum into soluble or semi-soluble forms; finally, it shows minimal Cr content, indicating that the Cr-bearing phases have fully decomposed or migrated into extractable forms.
Comparison of points 001–003:
Unreacted cores (points 001 and 002) retain high levels of Cr and Fe, indicating preservation of chromite structure;
Negligible Na content implies no interaction with sodium carbonate;
Structure is chemically inert and resistant to roasting under current conditions.
Partially reacted zone (point 003) exhibits the following features: significant increases in Na and O, characteristic of newly formed reaction products; substantial depletion in Cr, confirming effective disruption of Cr-bearing spinels; elevated Si and Al, suggesting the formation of sodium aluminosilicate phases.
According to the EDS data in
Figure 10 (
Appendix D), point 004 represents a region that has undergone complete chemical transformation. The grain lacks distinct boundaries and appears fully homogenized with the surrounding matrix. No apparent chromium peaks are detected, indicating that the original chromite mineral has been completely decomposed.
The resulting phase is an amorphous or weakly crystalline matrix, likely composed of sodium–aluminosilicate structures. This type of structure is a hallmark of successful alkaline activation, where stable phases such as CrFe2O₄ are broken down and converted into soluble or glassy products.
The absence of chromium and the dominance of Na, Si, and Al, along with minor traces of Mg and Fe, confirm the full completion of the reaction in this zone. Such transformation is essential for maximizing Cr2O3 extraction.
From the data in
Table 3, the following conclusions can be drawn:
Point 004 is fully reacted, exhibiting high contents of Na, Si, and O; moreover, it has no detectable Cr, confirming complete chromium conversion into soluble compounds.
Point 003 is partially reacted; here, Cr is still present, but at a reduced level compared to the unreacted chromite, indicating partial extraction.
The unreacted cores (points 001 and 002) are characterized by high levels of Cr, Fe, Al, and Mg, signifying the preserved structure of the original chromite sludge.
The results demonstrate a clear elemental transformation pathway: a decrease in Cr and Al and an increase in Na and Si along the reaction front. These findings confirm the formation of sodium silicates and the effective leaching of chromium into the solution during roasting.
After roasting under optimal conditions and subsequent aqueous repulping at 80 °C, a solid residue (filter cake) was recovered. Its chemical composition (wt.%) is as follows: Na2O—15.1%; Cr2O3—0.245%; Fe2O3—9.624%; NiO—0.47%; Co3O₄—0.029%; ZnO—0.015%; MgO—45.9%; SiO2—22.9%; Al2O3—2.49%; TiO2—0.21%; ΣREE—0.026.
These values confirm that Cr2O3 was almost completely removed from the solid phase, while the residue remains enriched in magnesium and silicon, forming chemically stable, leach-resistant compounds.
The phase composition of the leaching residue was further confirmed by XRD and is presented in
Figure 11.
X-ray diffraction analysis confirms that sodium chromate was successfully leached from the roasted material. The residue primarily consists of Na2Mg2Si2O7 and MgO, both of which are resistant to alkaline leaching. These phases are chemically stable and persist in the solid phase after treatment.
This leach residue can serve as a potential feedstock for the further recovery of magnesium, for instance through conversion into magnesium sulfate in downstream processing.


 ,
, 


