Article

Research on Prediction Method of Ferrous Oxide Content in Sinter Based on Optimized Neural Network

1
Tianjin Research Institute for Water Transport Engineering, M.O.T, Tianjin 300456, China
2
School of Precision Instrument and Opto-Electronics Engineering, Tianjin University, Tianjin 300072, China
*
Author to whom correspondence should be addressed.
Minerals 2025, 15(6), 553; https://doi.org/10.3390/min15060553
Submission received: 14 April 2025 / Revised: 13 May 2025 / Accepted: 15 May 2025 / Published: 22 May 2025
(This article belongs to the Special Issue Mineralogy of Iron Ore Sinters, 3rd Edition)

Abstract

:
As a key parameter in the sintering process, the ferrous oxide content of sinter can reflect the working condition, energy consumption level, and quality level of the final sintered products in the sintering process. It has become a key problem to realize the prediction of ferrous oxide content in sinter and feedback control of sinter quality accordingly. The two commonly used methods for detecting ferrous oxide content in industrial production currently do not meet real-time requirements and cannot provide timely feedback for production regulation. Therefore, research on real-time prediction technology of ferrous oxide content in sinter was carried out, and an optimized back propagation neural network model was established to realize the mapping between characteristic parameters and the FeO content in sinter. The characteristic parameters include image parameters and process parameters. Through the research on the brightness change trend of the machine tail cross-section image, the best cross-section image acquisition method based on brightness difference is realized, and image parameters are obtained by image processing technology. The process parameters were selected using correlation analysis. Through data processing techniques such as data cleaning, normalization, and feature fusion, feature parameters were obtained as input vectors for the neural network. To improve prediction accuracy and system stability, an adaptive learning rate and genetic algorithm were used to optimize the traditional BP neural network. The average test error of the optimized prediction model was 0.32%. Taking actual data production as an example, test data on the FeO content of sinter were extracted from the laboratory. Compared with the FeO content predicted by the system, the prediction time of the system was about 2 h earlier than the test time. In terms of prediction accuracy, the average absolute error was 0.25%, and the absolute prediction error was not more than ±1%.

1. Introduction

The iron and steel industry needs a large number of rich iron ores. Natural rich iron ores alone cannot meet the demand of the iron and steel industry. The concentrate powder obtained from the processing of lean iron ores cannot be directly used for iron making. The concentrate powder needs to be burned to form massive artificial rich iron ores for blast furnace iron making. The sintering method is one of the main methods for producing artificial-rich iron ores at present. The ferrous oxide (FeO) content of sinter, as a key parameter in the sintering process, can reflect the working conditions, energy consumption level, and quality level of the final sintered products [1]. The timely and accurate prediction of the FeO content of sinter has important engineering application value. It can not only promote the intellectualization of the sinter production process but also help improve the sinter production process, production quality, and optimization of sintering process control.
In the past few decades, scientists have conducted some research on the detection of the FeO content of sinter. Wang [2] predicted the FeO content of sinter by combining C-means fuzzy clustering analysis and radial basis function network. Comparing the predicted results with the test results, the coincidence rate was more than 85%, and the absolute error was controlled within ±0.3. Ji [3] proposed an improved firefly algorithm combined with a neural network for predicting the FeO content in sintered ore. The weights and thresholds of the BP neural network were optimized using an improved firefly algorithm to improve the prediction speed and accuracy of the algorithm. Comparing the improved method with the traditional BP algorithm and GA-BP algorithm, the results show that the above method can more accurately and effectively predict the content of FeO in sinter. Fang et al. [4] proposed a FeO content prediction method for the sintering process based on the fusion of knowledge and variable weight echo state network. On-site industrial data experiments have shown that the proposed method can accurately predict the FeO content in the sintering process in real-time, providing real-time and effective FeO content feedback information for intelligent control of the sintering process. Jiang et al. [5] collected the infrared thermal image of the tail section of a sintering machine with the infrared thermal imager, extracted the keyframes and regions of interest to reduce data throughput and extracted the features to judge the FeO content level. Li et al. [6] combined a convolutional neural network and a recurrent neural network and used a series of flame images to detect the combustion state of sinter. Wu Jing [7] of Northeastern University refined the experience of workers into reasoning rules related to the quality of sinter, extracted image feature parameters, and judged the quality of sinter through simple mathematical calculation through on-site investigation. Liangxiuman et al. [8] used a mobilenetv3 deep neural network to divide the flame image of the sintering section into three states: normal sintering, under burning, and over burning, and the recognition accuracy reached 97.54%. Zhangfan et al. [9] analyzed many factors affecting FeO content in sintering production, selected eight process parameters and four kinds of mineral powder ratio as input variables, and, respectively, used back propagation neural network, radial basis function neural network, and support vector machine for modeling. The experimental results showed that the prediction accuracy of the radial basis function was the highest. Zhangxuefeng et al. [10] successfully realized the detection of FeO content of sinter based on process data collected by Panzhihua Iron and Steel Co.’s type 6 sintering machine in 2021 after using data processing operations such as filtering and optimization and using bidirectional long-term and short-term memory network for training.
Based on the above research, scholars have conducted a lot of research on the automatic detection of FeO content in sinter, but few schemes have achieved the real-time accuracy required in industrial production, which is often limited by industrial conditions or data quality. This paper will study the real-time prediction method of ferrous oxide content in sinter, study the method of obtaining the best tail section image, establish an optimized back-propagation neural network model, realize the mapping between characteristic parameters and FeO content in sinter, and optimize the neural network by using adaptive learning, genetic algorithm, and other methods to improve the prediction accuracy and system stability. Test data for the FeO content in sinter are extracted from the laboratory and compared with the FeO content predicted by the system to verify the prediction accuracy of the real-time prediction system of the FeO content in sinter.

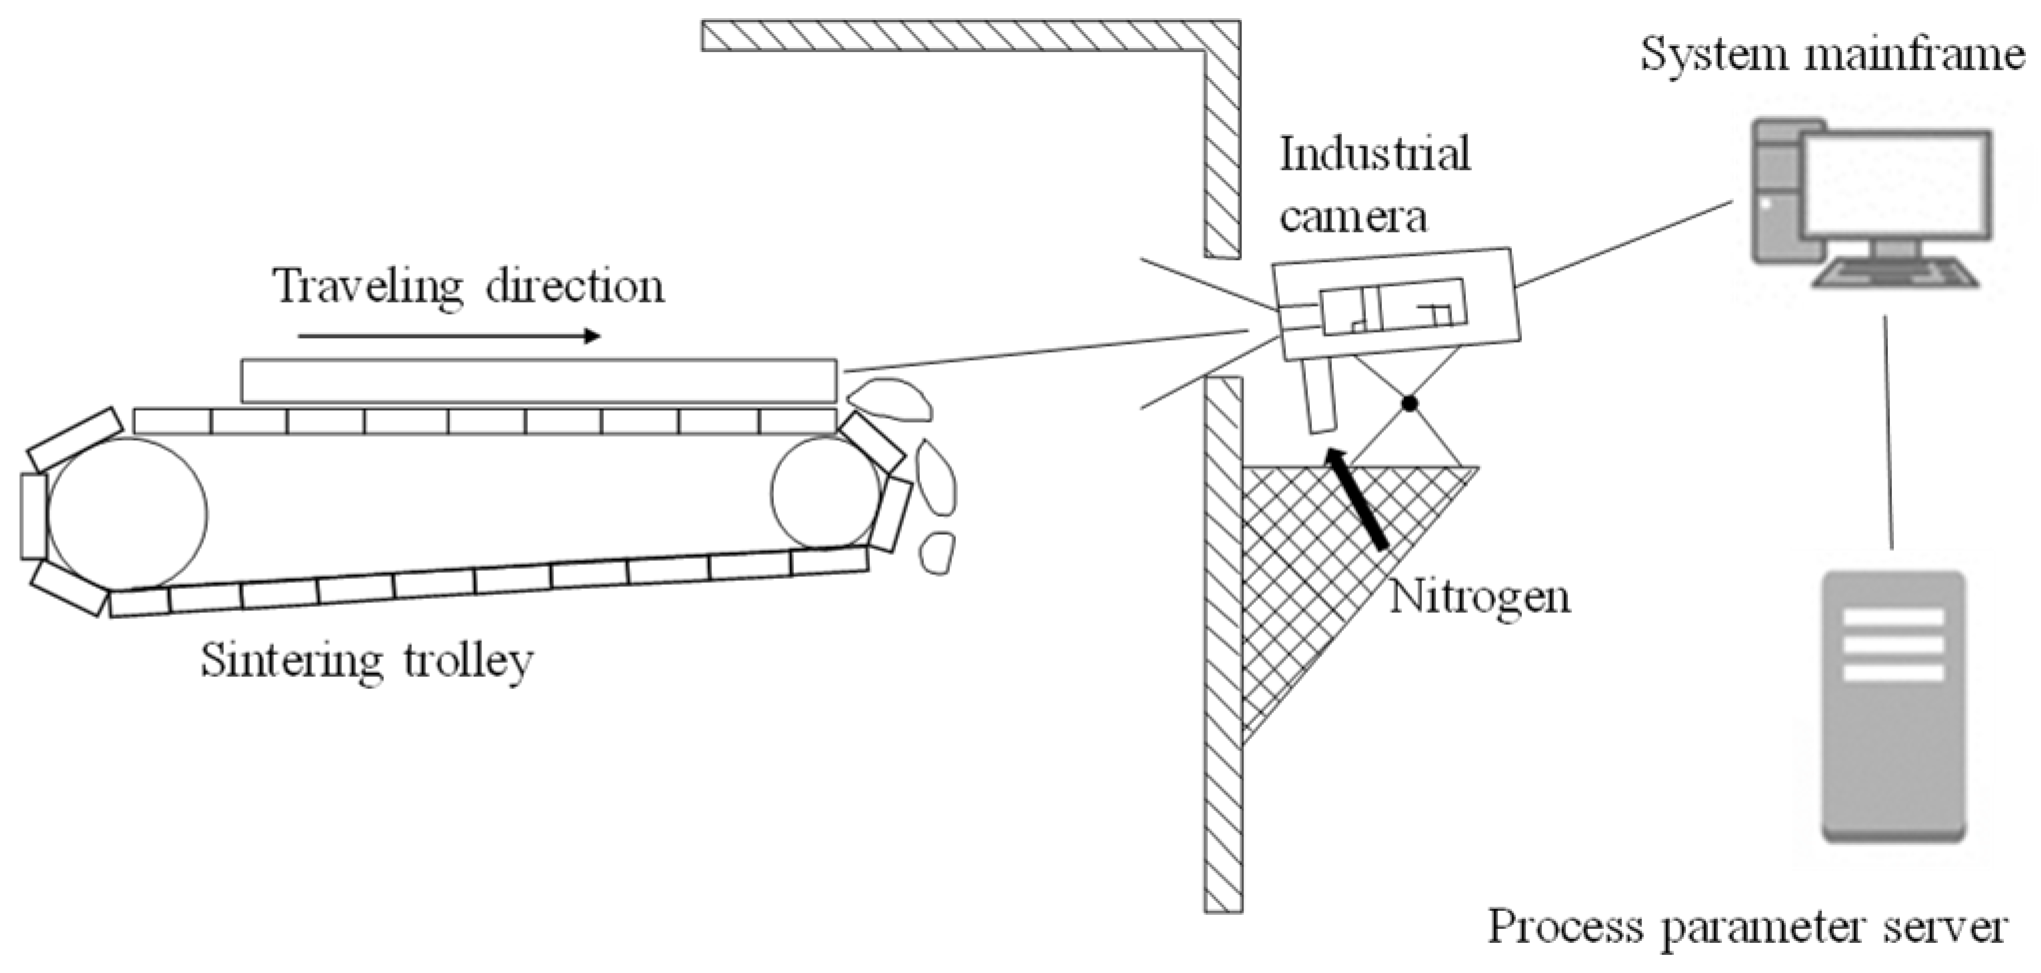
2. Measuring Principle

The iron ore sintering process is the second largest energy-consuming process in the iron-making industry. It uses concentrated powder, coke, and flux as raw materials to produce sinter with certain physical strength and chemical composition [11]. At present, the steel industry mainly uses belt-type suction sintering machines for production, and their structure is shown in Figure 1 [2,12].
The sintering machine constantly moves in the production process. The chain trolley moves from the sintering head to the machine tail under the drive of the power star wheel and then circulates clockwise from the machine tail to the head at the lower part. The trolley departs from the upper sintering head and is currently in an empty state. The trolley passes through the material feeder, which fills the trolley with concentrate powder, fuel, and other raw materials required for sintering. Then, the trolley passes through the igniter, and the surface of the material layer is ignited. When the trolley moves into the sintering machine tail, theoretically, the entire material layer is burned at this time, and the burned material layer falls from the trolley because of the tilt of the trolley. At this time, the overall condition of the material layer can be observed at the machine tail, and the observed material layer is called the cross-section of the machine tail.
The sintering process is accompanied by a large number of physicochemical reactions and thermal phenomena. The production of FeO in sinter is related to the oxidation-reduction reaction. The main components of concentrate powder used in sintering raw materials are Fe3O4 and Fe2O3. In the process of combustion, there is bound to be co-formed by incomplete combustion of carbon, which reacts with refined iron powder to produce FeO. As the combustion continues, the exhaust gas is pumped away by the exhaust fan, and oxygen O2 is brought in. CO reacts with O2 to produce CO2, and the reduction reaction decreases. The oxidation reaction between FeO and O2 begins to dominate, and the FeO content decreases. It can be seen that the FeO content is affected by many factors, such as the iron content of raw material, the operating power of the exhaust fan, the endpoint temperature, and other factors that can reflect the FeO content of sinter. The parameters related to the FeO content of sinter are divided into two categories: image parameters and process parameters. The image parameters are obtained through image processing of the obtained tail section image, and the process parameters are read through the existing database server of the factory. The FeO content of sinter is not only a key index for evaluating the stability of the sintering process but also an important parameter for inspecting the quality of the finished sinter.
The system combines the tail section image and process parameters as the sintering feature removes the excessive dependence on a single feature and obtains the prediction result by establishing the mapping relationship between the feature parameters and the FeO content of sinter. The overall structure of the system is shown in Figure 2, where the sintering machine trolley is 4 m wide, the material layer height is about 700 mm, and the machine tail cross-section is 4 m away from the camera.
On the one hand, it is necessary to set up an industrial camera to obtain the tail section of the sintering machine. On the other hand, it is necessary to obtain the process parameters from the server of the steel plant. After obtaining the parameters of these two parts, it is necessary to comprehensively analyze them on the system host to obtain the predicted FeO content of sinter. The prediction process of sinter FeO content is shown in Figure 3.

3. Prediction Method of Ferrous Oxide Content

3.1. Optimal Cross-Section Image Selection Method Based on Brightness Difference

Most of the images of the cross-section of the machine tail captured by the camera cannot obtain the required image parameters due to the obstruction of the front vehicle, dust interference and other reasons. In the process of image processing, the system needs to select the image of the cross-section of the machine tail with the complete exposure of the combustion layer and the details of the red flame layer that can be observed as the source of image parameters. This image is called the best cross-section image of the machine tail.

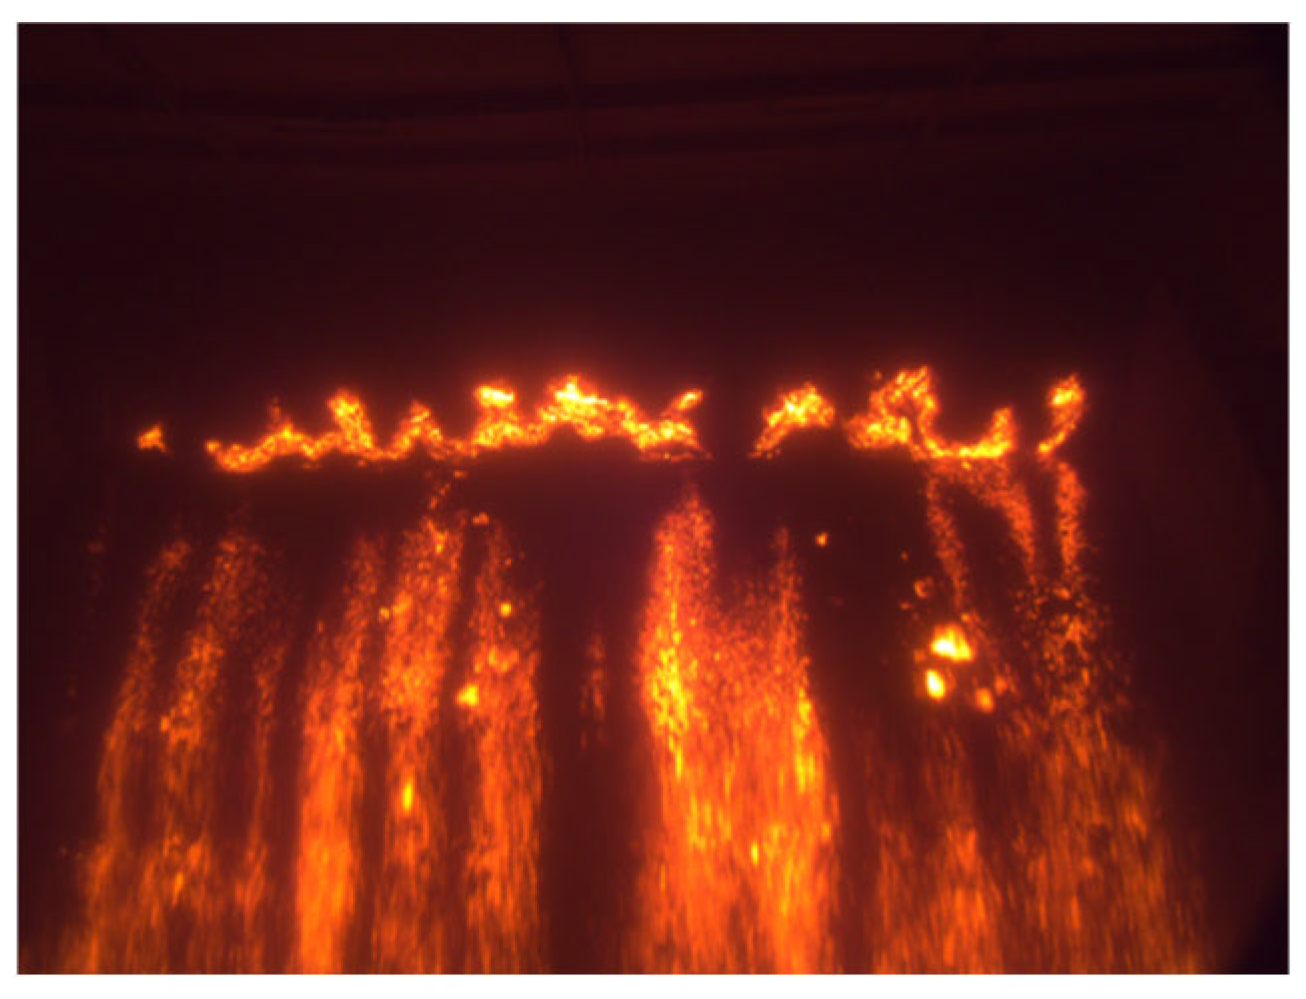
3.1.1. Image Region of Interest Extraction

Before extracting the best machine tail cross-section image, in order to eliminate interference and facilitate the extraction of image brightness features, it is necessary to carry out certain image preprocessing operations on the machine tail cross-section image to find the image region of interest (ROI) [13].
Because the camera is placed in a fixed position and the left and right positions of the trolley tail are fixed, there is a small swing in the upper and lower positions of the trolley tail when the best cross-section image appears, which shows that the position of ROI in the image is basically unchanged. According to the calculation of camera resolution and lens focal length, as well as the observation of multiple rear cross-section images taken by the camera, the trolley width almost occupies the entire width range of the image, and the width range of ROI can be defined as the entire width range of the image. According to the proportion of the cross-section of the machine tail, the height value of ROI can be calculated. There are high brightness images in the image sequence of the cross-section of the machine tail, in which the upper surface of the lighted sintered closed cover and the lower boundary of the trolley can be seen. Near the time when the best machine tail cross-section image appears, the position of the lower boundary of the trolley in the image will swing slightly with the rotation of the trolley, and the position of the upper surface of the closed cover in the image will remain constant due to the fixed position of the camera. Therefore, the lowest point of the upper surface of the closed cover is taken as the starting point of the ROI vertical coordinate range, and the starting point is added with the height value of the ROI to obtain the ending point of the ROI vertical coordinate range.

3.1.2. Method of Selecting the Best Cross-Section Image

The best cross-section image is not necessarily the image with the highest brightness in the cycle, but the brightness fluctuation near it has certain rules: before the arrival of the best machine tail cross-section, the brightness value of the image sequence will rise sharply, and then there will be large fluctuations due to the diffuse dust. Therefore, it is considered to use the difference value of image brightness to find the best cross-section image. The calculation formula for image brightness difference is as follows:
L = L t + t L t t
where t is the time interval between two frames. Since the camera frame rate remains unchanged, t remains unchanged. For the convenience of calculation, the image brightness difference of the k frame is the brightness value of the frame minus the brightness value of the previous frame, that is, the brightness difference between two frames. The calculation formula is as follows:
L ( k ) = L k L k 1
The brightness difference for the cross-section image of the machine tail is calculated within 100 s, and the result is shown in Figure 4. The blue curve in the figure is the brightness value change trend of the image sequence, and the red curve is the brightness difference value.
As can be seen from Figure 4, the brightness difference value shows a specific change rule in a complete cycle. Among them, the brightness difference corresponding to the best cross-section time shows a positive maximum value in the cycle, while the brightness fluctuation caused by dust is smaller than the brightness difference at the best cross-section. According to the rule that the difference value at the best cross-section is much higher than that of other images in the period, it can be considered that the best cross-section image is the image with the largest brightness difference value in the period, and the threshold method is still used to find the maximum brightness difference value in the image sequence. Set the selected differential threshold as L t h , and the algorithm flow is as follows:
Step 1: Wait for an image whose brightness difference exceeds L t h to appear in the image sequence;
Step 2: Determine whether the number of frames in the machine tail cross-section sequence above the threshold exceeds six. That is, if the brightness difference value image sequence above the threshold is less than six frames, it is considered as burr, and there is no optimal frame in the sequence;
Step 3: Find the image with the largest luminance difference in the sequence with luminance difference exceeding L t h . In order to select the image with the highest definition, the image with the highest brightness within five frames near the brightness difference value image is taken as the best cross-section image;
Step 4: Considering that there will be a period of time between the best cross-section images in two cycles, the best cross-section image in this cycle will not wait for L t h within 20 s after it is selected, which not only saves computing resources but also prevents repeated selection of the best cross-section image in one cycle.
Selecting an appropriate difference threshold is the key to the algorithm. If the set difference threshold is too large, there will be missed judgment; that is, the brightness difference value of the actual best cross-section image is less than the threshold, the image cannot be found in the cycle, and the FeO content of sinter at that time cannot be predicted. If the set difference threshold is too small, misjudgment will occur. The wrong best cross-section image is found in the cycle, which cannot correctly reflect the sintering situation at that time. For the prediction of FeO content, the effect of missing reports at a certain time is small, which can be replaced by the best cross-section image of the period near that time; however, misjudgment will lead to the deviation in the FeO content of sinter determined by the algorithm from the actual value, and the consequences are more serious. With an increase in the difference threshold, the probability of misjudgment decreases, while the probability of missed judgment increases. It is necessary to find an appropriate difference threshold L t h to minimize the risk. In order to balance the probability of missing judgment and misjudgment, when looking for the best cross-section image, it is more tolerant of missing judgment, requiring that the probability of missing judgment should not exceed 10% and the probability of misjudgment should not exceed 2%. Table 1 shows the statistics of brightness difference value at the best cross-section image of 100 consecutive cycles.
Search the 100 cycles. When the threshold value L t h = 5 × 10 7 is selected, the misjudgment rate is 0%, which meets the requirements. The probability of missed judgment is 3%, which is less than 10% of the acceptance space. Therefore, 5 × 10 7 is taken as the difference threshold value.

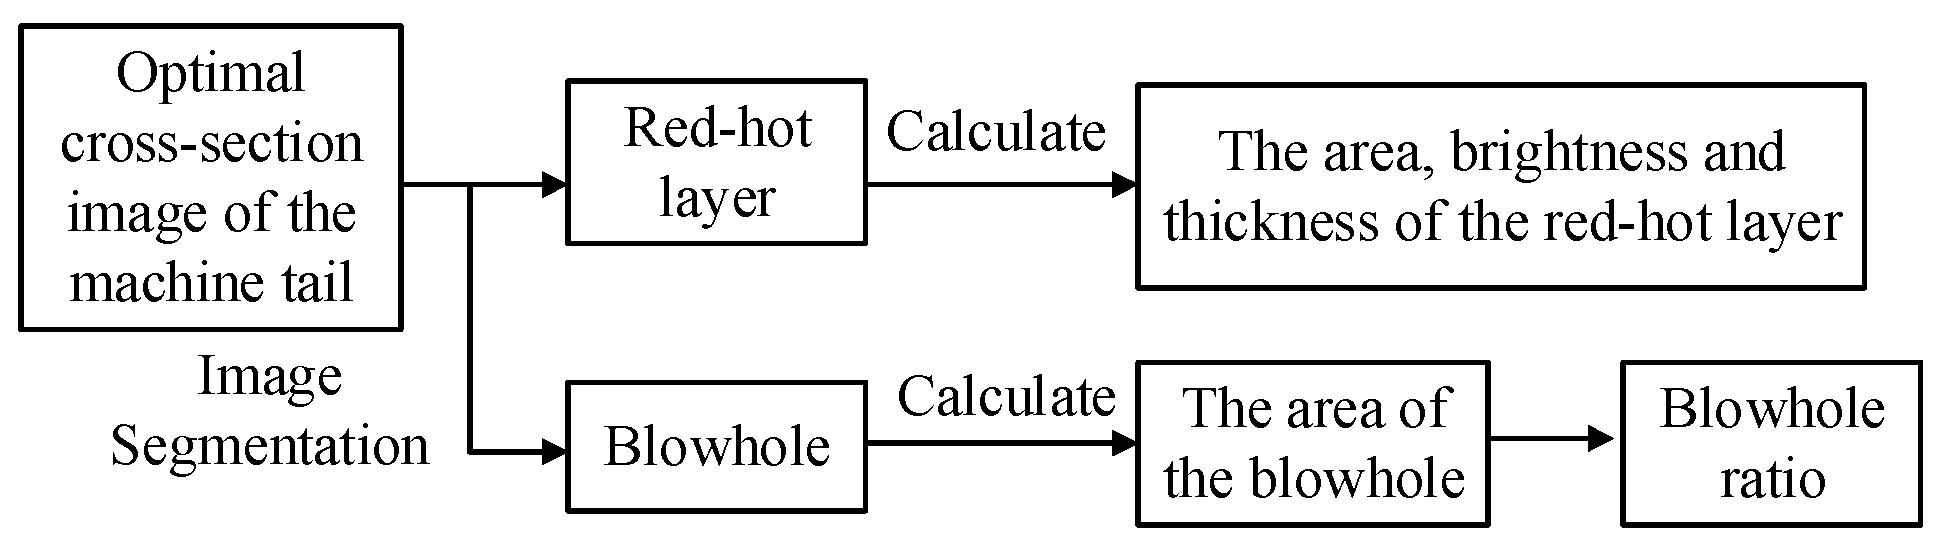
3.2. Feature Parameter Extraction and Processing

The characteristic parameters include image parameters and process parameters. The image parameters are from the cross-section image of the sintering machine tail, which can be selected using the above optimal cross-section image selection method. The process parameters come from data collected by various sensors during the production process and are stored on the factory’s server. The two types of parameters will jointly serve as inputs for the neural network.

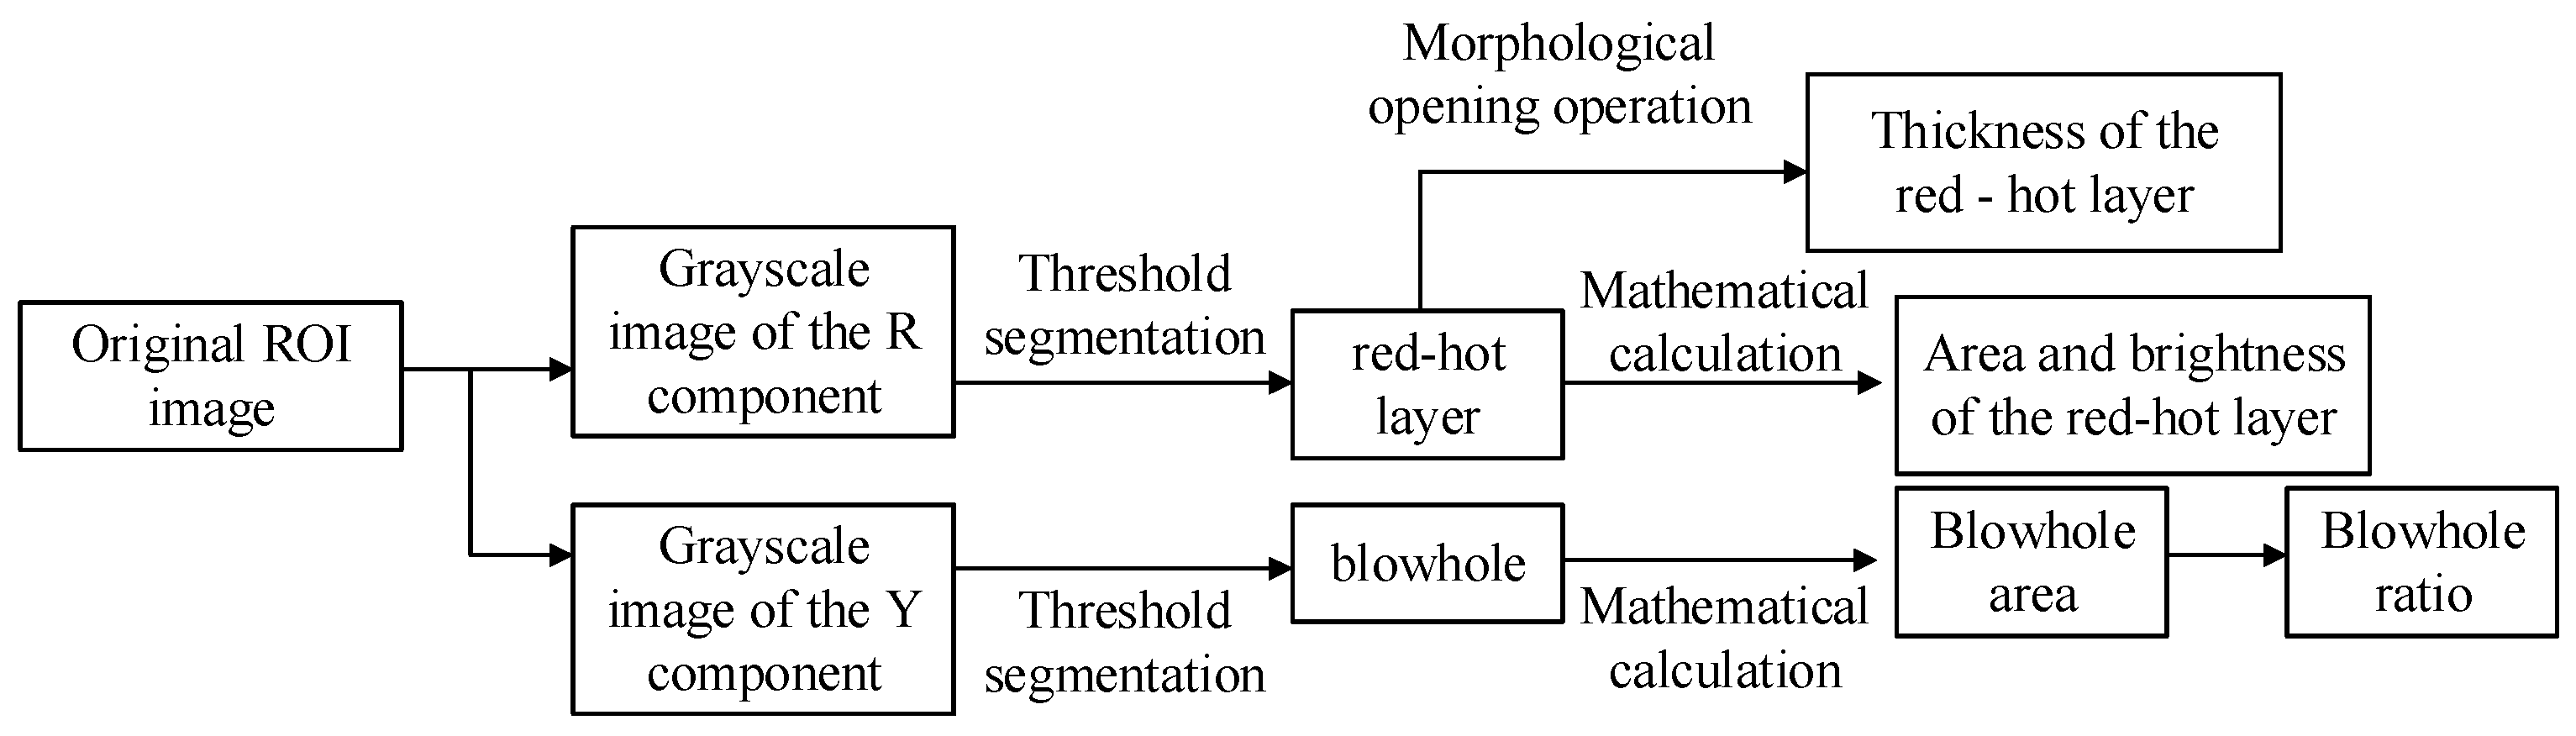
3.2.1. Image Parameter Extraction

The best cross-section image cannot be used directly, so it is necessary to extract image features as the input of the neural network. The selection of image features is based on the experience of workers watching the fire. According to the investigation of workers’ experience, the following four image features are summarized as the characteristic parameters of the cross-section of the sintering machine tail. Since image processing by computer is based on digitization, it is necessary to digitize the empirical features. The extraction process of image features is shown in Figure 5.
(1)
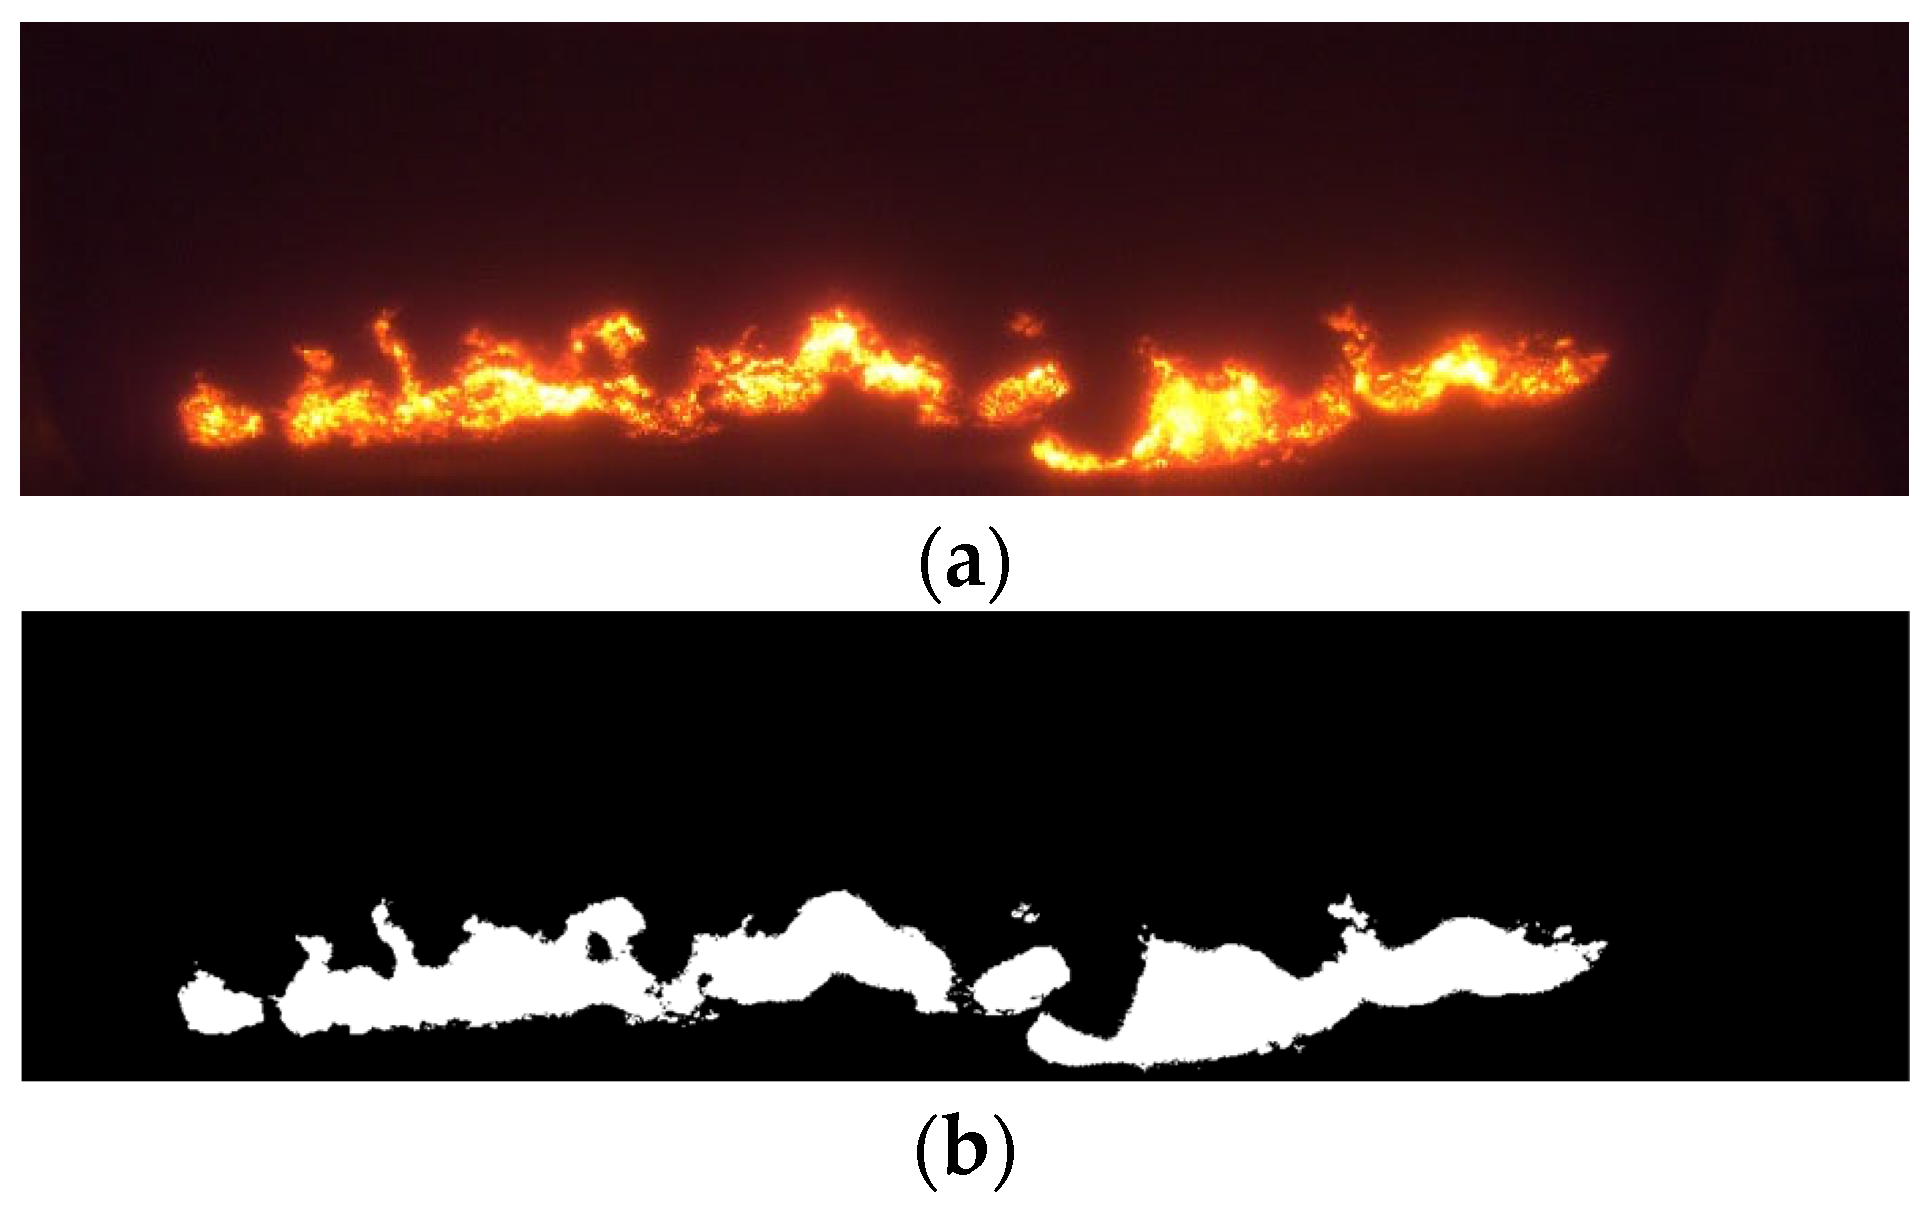
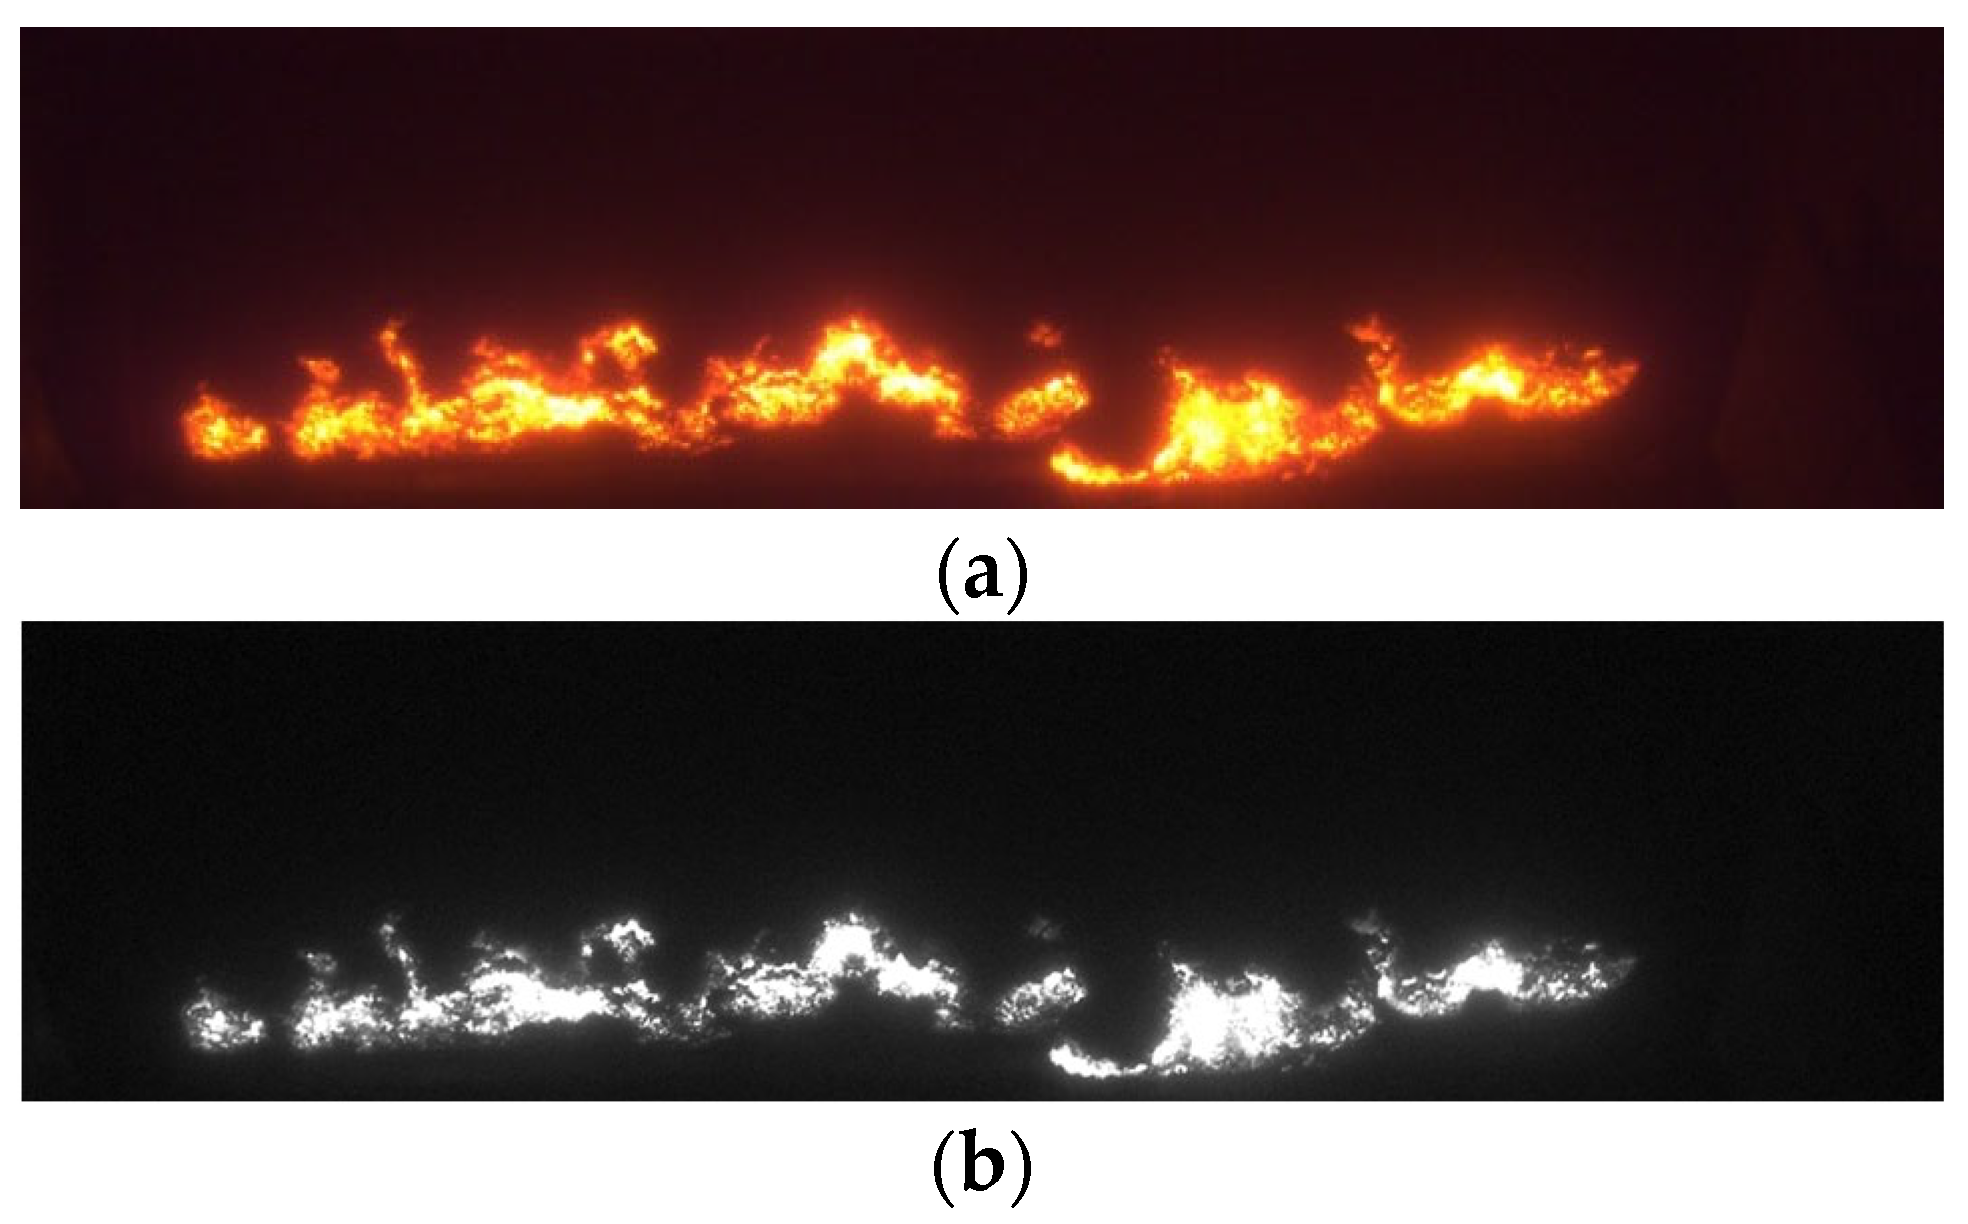
Area of red fire layer: S
The proper area of the red fire layer indicates the uniformity and consistency of transverse combustion and also indicates that the FeO content of sinter is moderate. After the best cross-section image obtains the red fire layer through image segmentation, the area of the red fire layer is the number of pixels of the red fire layer.
(2)
Thickness of red fire layer: d
When the endpoint position is properly controlled, the thickness of the red hot layer in the cross-section image of the machine tail is thick, and the content of FeO of sinter is high. In the image of the machine tail cross-section, the red fire layer is thin, and the thickness accounts for about 1/5 of the total thickness of the material layer, so the sinter FeO content is moderate. After obtaining the main part of the red fire layer, the difference in the vertical coordinates between the bottom and top pixels of the red fire layer is taken as the thickness of the red fire layer.
(3)
Average brightness of red fire layer: L ¯
When the endpoint position is properly controlled, the color of the red fire layer in the image is dazzling and shiny, and the content of FeO in sinter is high. The red fire layer is dark red, so the FeO content of sinter is moderate. After obtaining the main part of the red fire layer, divide the total brightness of the red fire layer by the area of the red fire layer to obtain the average brightness of the red fire layer. The calculation formula is as follows:
L ¯ = L S
(4)
Blowhole ratio: R
The smaller the blowhole, the higher the FeO content. The blowhole rate is defined as the ratio of the blowhole area of the machine tail cross-section image to the red fire area. After the blowhole area S y e l l o w is obtained, the calculation formula for blowhole R is as follows:
R = S y e l l o w S
In the feature extraction of the best cross-section image, it is necessary to segment the red fire layer and blowhole from the background. The biggest characteristic difference between the red fire layer, blowhole, and the background of the machine tail cross-section image is the gray value. The threshold segmentation algorithm is used to segment the image. According to the gray histogram of the image, it can be seen that the gray level of the cross-section has obvious bimodal characteristics. Therefore, the Nobuyuki Otsu method (OTSU) is used for threshold segmentation.
The core idea of the Otsu method is to select an optimal threshold to maximize the variance between classes. The selection process of the optimal threshold is as follows: suppose there is a threshold T h to divide the image into two categories C 1 and C 2 , the number of pixels divided in C 1 and C 2 is f 1 and f 2 , and the total number of pixels is represented by N, then:
N = f 1 + f 2
The average values of C 1 and C 1 pixels are m 1 , m 2 , the global mean of the image is m G , so there is the following formula:
f 1 N m 1 + f 2 N m 2 = m G
According to the concept of inter-class variance, the expression of variance is as follows:
σ 2 = f 1 N ( m 1 m G ) 2 + f 2 N ( m 2 m G ) 2
Taking Equation (6) into Equation (7) to simplify:
σ 2 = f 1 f 2 N 2 ( m 1 m 2 ) 2
Let the threshold T h traverse 0–255 gray levels, calculate the interclass variance in Equation (8), and the value that minimizes the interclass variance is the optimal threshold.
As shown in Figure 6, the optimal threshold of Figure 6a is calculated as 95. It can be seen that Figure 6b, segmented by the Otsu method, peels the red layer from the background.
The acquisition of the blowhole region needs to separate the blowhole from the red flame layer, and different grayscale methods are needed. The color of the blowhole is generally white or yellow, and the pixels in the blowhole region are nearly saturated in R and Y components in the image matrix. The red fire layer is mainly red, with saturated R component and low Y component. The Y component in the image is used as the gray basis to gray-size the image, and the OTSU method is also used to segment the blowhole from the red fire layer, as shown in Figure 7.
In the process of feature extraction, when calculating the red fire layer thickness d by extracting the distance difference between the upper and lower pixels of the red fire layer, the calculated thickness will be greater than the upper and lower range of the actual red fire layer. This is because the residual amount of the previous material layer sometimes appears in the cross-section of the sintering machine tail, which is shown as the interference of “burr” in the ROI area in the image, as shown in Figure 8. The burr has the most serious influence on the calculation of the red fire layer thickness, which will make the calculated red fire layer thickness d greater than the upper and lower range of the actual red fire layer.
The red combustion dust below the main body of the red fire layer in Figure 8 is the residue of the previous material layer and does not belong to the main area of the red fire layer. In order to remove the burr interference and obtain the main part of the red flame layer, the morphological opening operation is performed on the image. Morphological corrosion can remove the burr area, but it will reduce the area of the main area of the red flame layer. Morphological expansion can restore the main part of the red fire layer, but it will increase the area of noise. The morphological operation combines image corrosion and expansion properly, first corrosion and then expansion, which can not only eliminate the burr in the cross-section image but also make up the area of the red fire layer through expansion operation.
The opening operation needs to select the structural element as the operation basis. When the structural element is larger than the burr area, the burr will be removed, but the structural element selection should not be too large, which will affect the area of the red flame layer. In this paper, the circular structural elements with a radius of 30 are used to open the binary image of the cross-section, and the effect is shown in Figure 9.
After opening the cross-section image, the burr can be removed effectively, and the calculated thickness of the red flame layer is closer to the actual value. To sum up, the feature extraction process of the best cross-section image is shown in Figure 10. Four image feature parameters are obtained through digital image processing technology.

3.2.2. Process Parameter Extraction

After obtaining the image parameters from the cross-section image of the machine tail, it is also necessary to extract the process parameters from the parameter server of the steel plant and judge the FeO content by combining the two. The preliminary extraction of image features and process features depends on the experience of workers, but the extent of its impact on FeO content in sinter has not been confirmed. It is necessary to analyze the feature parameters from a numerical point of view and retain the feature parameters with high correlation.
Combined with the practical experience of the workers and the existing sensors in the steel plant, a total of eight parameters related to the FeO content of sinter were selected as the initial process parameters, including the total batching volume, the total return ore volume, the secondary water content, the end temperature of the bellows, the negative pressure of the flue, the temperature of the large flue, the CO content in the exhaust gas, and the O2 content in the exhaust gas. The main reasons for their selection are as follows: workers often use the endpoint temperature of the bellows in production control to judge the sintering state in combination with the cross-section of the machine tail. The content of CO and O2 in the exhaust gas is the raw material and product in the chemical process of producing FeO, which can reflect the amount of FeO in the chemical reaction. According to the experience of workers, these parameters can reflect the grade of FeO content.
Actual production data on partial sintering and the cross-section of the machine tail obtained by the camera were obtained from a steel plant. After data integration, 352 groups of data corresponding to FeO content and cross-section image and 264 groups of data corresponding to FeO content and initial process parameters were collected to verify whether the extracted feature parameters can correctly reflect FeO content.
First, linear correlation analysis is conducted. Pearson correlation coefficient is used to measure the linear correlation degree between two variables. The value is between −1 and 1. The greater the absolute value, the more significant the linear correlation between variables. The Pearson correlation coefficient between the two variables is calculated as follows [14]:
r = i = 1 n ( X i X ¯ ) ( Y i Y ¯ ) i = 1 n ( X i X ¯ ) 2 i = 1 n ( Y i Y ) 2
where r is the Pearson correlation coefficient, which is used to measure the correlation between X and Y; n is the number of samples; X is the acquired characteristic parameter; Y is the FeO content in this paper.
The Pearson correlation coefficient calculation results of image features are shown in Figure 11. It can be seen that the linear relationship between the thickness of the red fire layer and the FeO content of sinter is not obvious.
Although the linear correlation between some image parameters and the FeO content of sinter is not obvious, it cannot be ruled out that there is a nonlinear relationship between them. XGBoost method [15] is used to carry out feature importance analysis to determine the nonlinear relationship between variables. The importance of image parameters calculated by XGBoost is shown in Figure 12. It can be seen that the characteristic importance of red fire layer thickness and average brightness of the red fire layer is insufficient.
Generally, it is considered that the absolute value of a correlation greater than 0.75 is a strong correlation, and less than 0.09 is irrelevant. Therefore, after removing data with linear correlations and absolute values of feature importance less than 0.09, the image parameters finally extracted in this paper are the red fire layer area and blowhole ratio.
Pearson linear correlation analysis and XGBoost feature importance analysis were also carried out for process parameters, and the results are shown in Figure 13.
After removing data in the linear correlation and the importance of the absolute value of the characteristics that are less than 0.09, the final process parameters extracted in this paper are six process parameters, including the total batching amount, the secondary water content, the end temperature of the bellows, the temperature of the large flue, the CO content in the exhaust gas, and the O2 content in the exhaust gas.

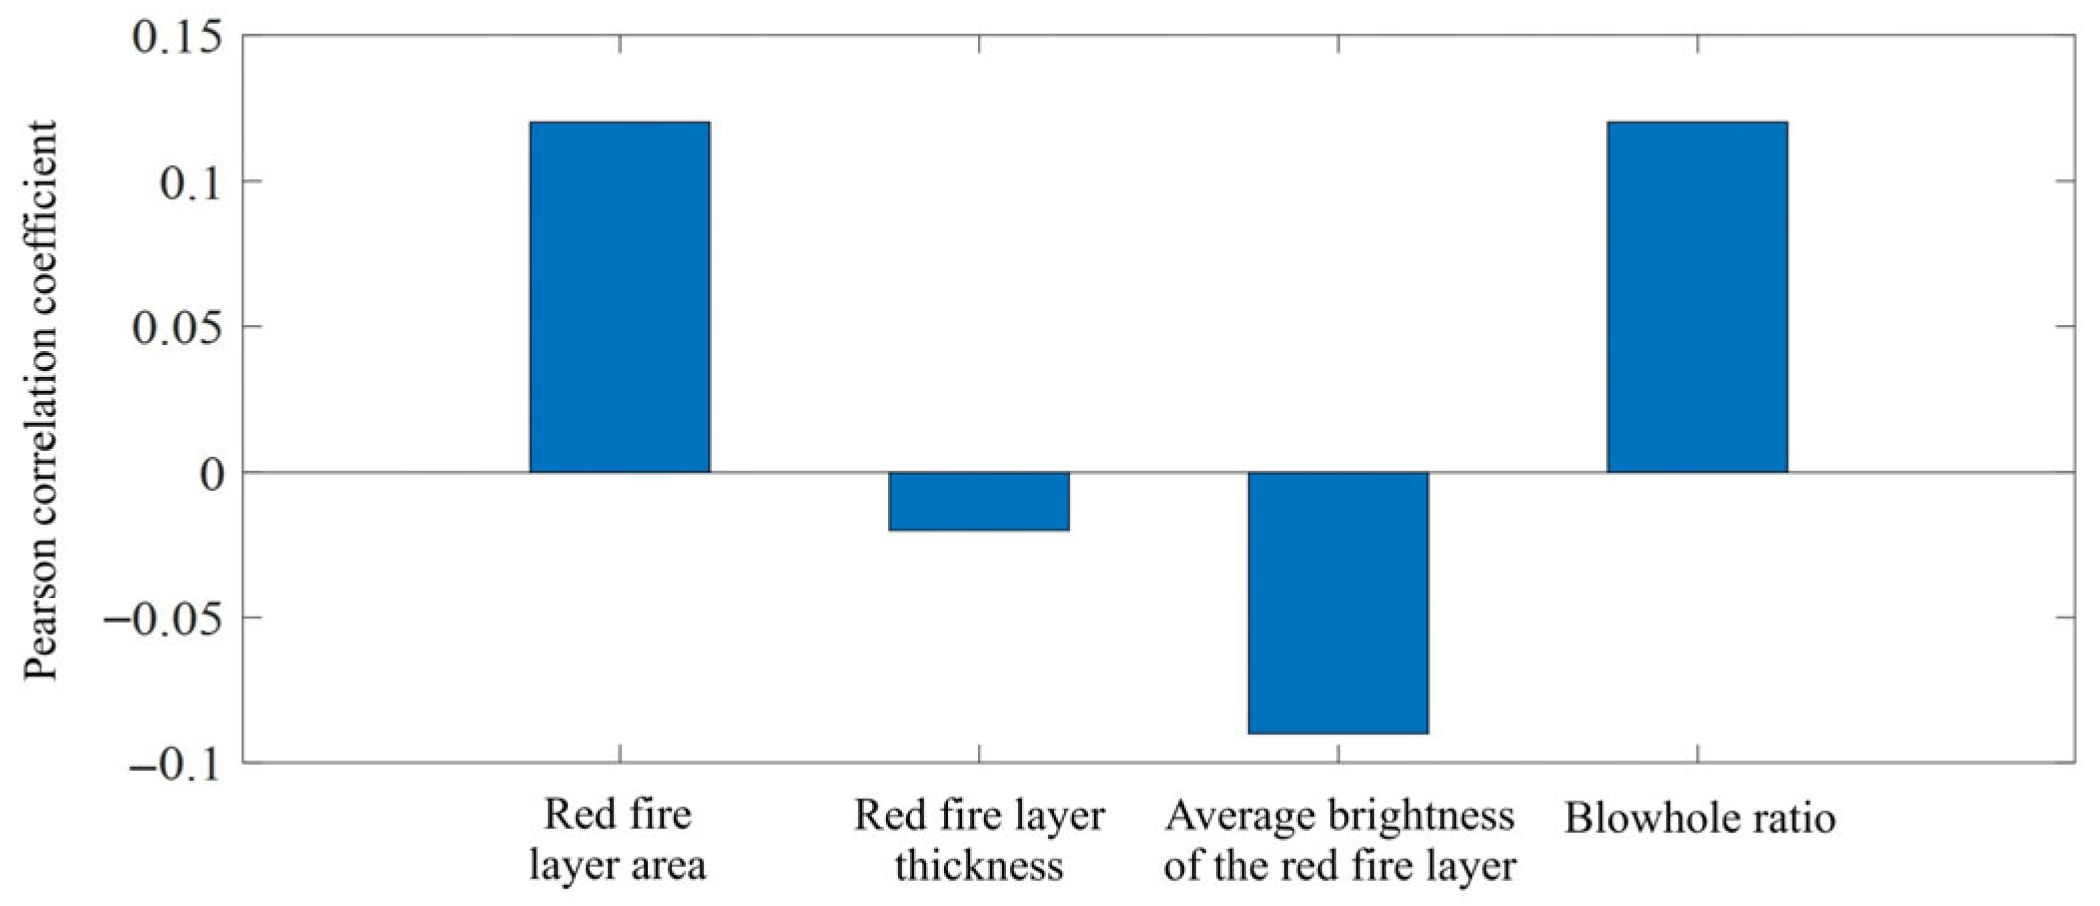
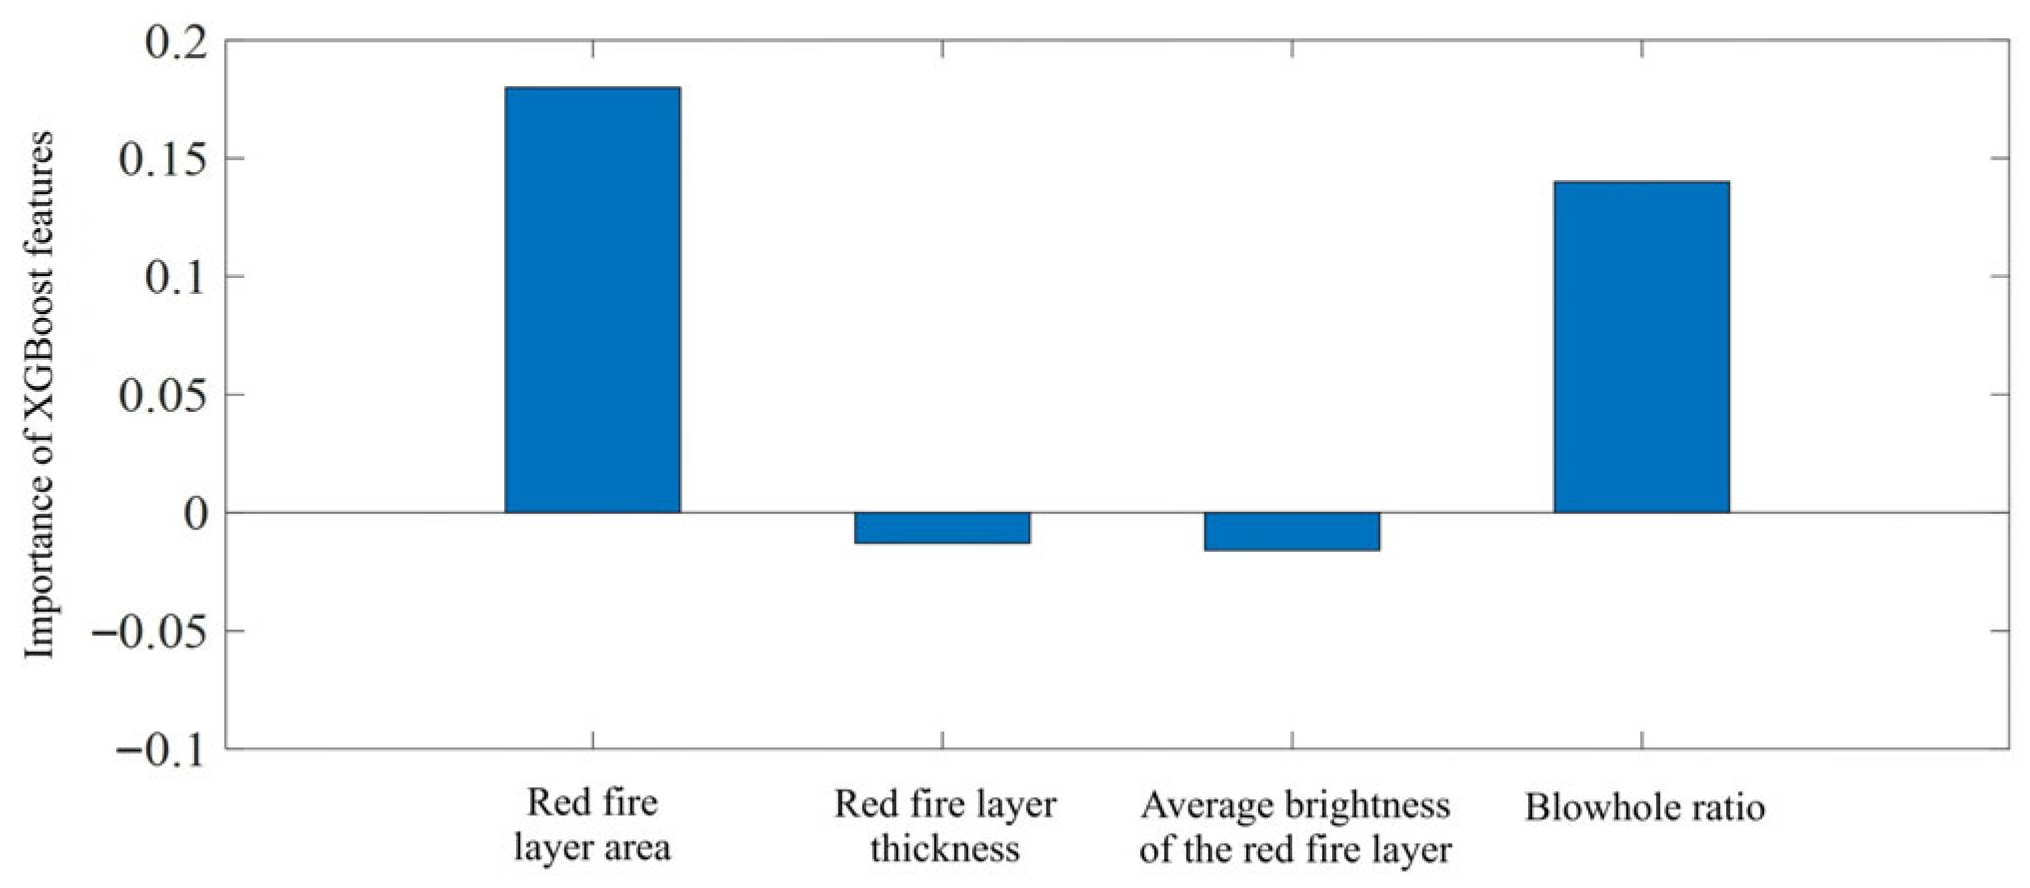
3.2.3. Processing of Characteristic Parameters

The input vector of the neural network cannot be directly obtained by only determining the set of characteristic parameters. It is necessary to preprocess original data to solve data problems such as data errors and non-uniform dimensions that will lead to non-convergence of the neural network, and the uncertain fusion mode of image parameters and process parameters.
In the massive data set accumulated by steel mills on actual production, there are data anomalies caused by production problems, such as decreased CO and O2 contents in exhaust gas due to sintering machine ventilation, sensor data failures, and operator input errors. The generalization ability of neural networks is related to the typicality of samples. Training regression prediction models with abnormal data can contaminate the model to varying degrees and affect its prediction performance. Due to the main problem in the sintering plant data being gross errors during the measurement process, the 3 σ criterion [16] is used to eliminate them. In actual production, sensor failure, data transmission failure, and other situations may occur, resulting in missing process parameters obtained. In neural network computation, simply replacing historical data can affect prediction accuracy. Considering that the missing process parameters are random, the hot card interpolation method is used to fill in the missing values. The basic idea of hot card filling is to find complete data that are most similar to the sample containing missing data among historical sample data and replace these missing data with the most similar values. The similarity between two sets of samples is determined using Euclidean distance, and the calculation formula is as follows:
d ( x , y ) = i = 1 n ( x i y i ) 2
where d(x, y) represents the Euclidean distance between two samples, and n is the sample dimension minus the number of missing values. This method can be used to find the most similar historical data to the current working condition and fill in the missing value.
Different indicators in these data samples are distributed in different data ranges. Generally, the larger the distribution range, the greater the impact of the value on the prediction results. The importance of different indicators will be affected by their data ranges. In this paper, due to the large differences in the distribution of original data, the parameters with a large distribution range play a decisive role in the results. In the process of neural network training, the overall error neither declines nor converges at all. To solve this problem, we need to make their distribution ranges similar. When using the gradient descent method to solve the problem, the speed of gradient decline can be accelerated after data normalization; that is, the speed of model convergence can be accelerated. The data normalization method used in this paper is dispersion standardization [17], which does not change the distribution property of these data. The transformation formula is as follows:
x new = x x min x max x min
where x new are new normalized data; x are original data; x max and x min are the maximum and minimum values of these sample data.
After the normalization of a linear transformation, all data samples are mapped to the range of [0, 1], realizing the comparability between data. After normalizing the input sample data, it is necessary to de-normalize these output data so as to obtain the actual predictive value of the model.

3.3. Realization and Optimization of BP Neural Network

An artificial neural network is a mathematical model for information processing by imitating the structure and function of human brain neurons [18]. Its modeling process is non-algorithmic, and the adjustable parameters of the model are reflected in the connection weight inside the network. Therefore, it is not necessary to predict the mechanism principle in advance, and it can theoretically handle any complex nonlinear relationship. BP neural network is a form of artificial neural network which is simple and widely used. In practice, the correlation between sintering characteristic parameters and the FeO content of sinter is low, and the influence mechanism is complex and prone to error due to external factors, which requires strong generalization ability and fault tolerance of the BP neural network.

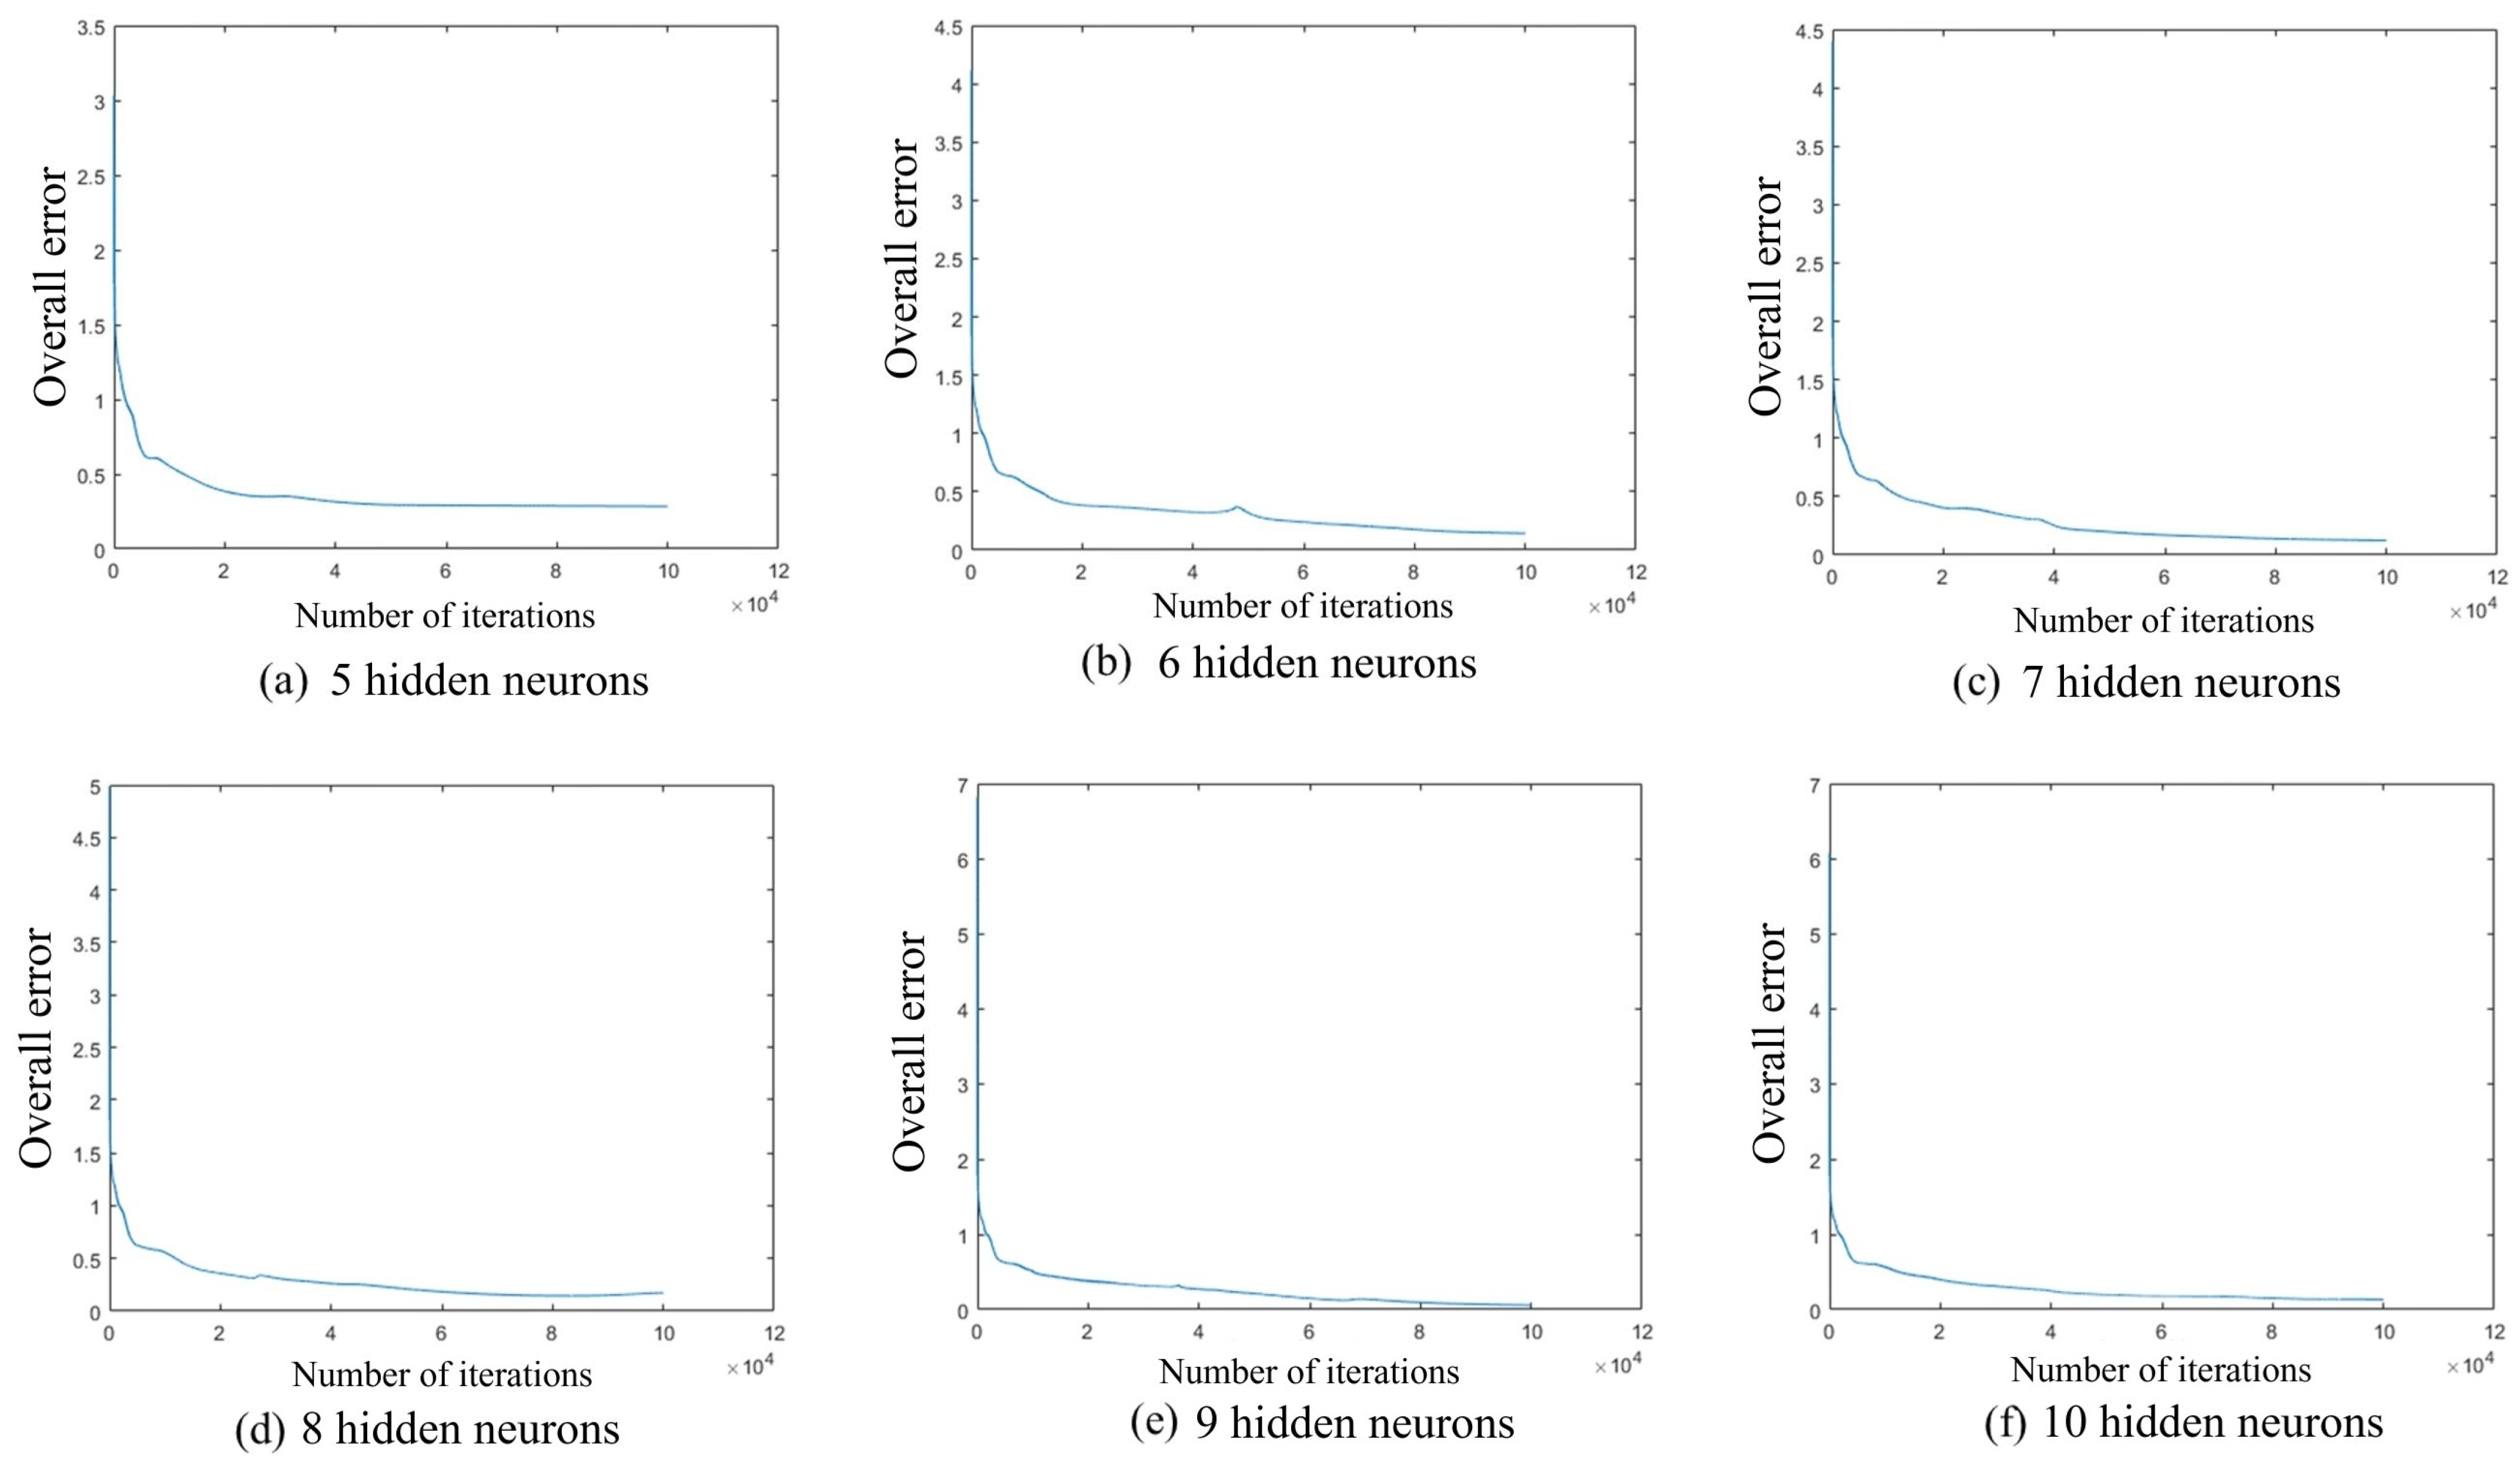
3.3.1. Design of BP Neural Network Structure

The BP neural network in this paper is based on the prediction of the FeO content. According to the feature selection results, the dimension of the feature vector is eight, so the number of nodes in the input layer is eight, the output is the FeO content of sinter, and the number of nodes in the output layer is one. The sigmoid function is the most commonly used activation function in neural networks. The curve is smooth and can be derived everywhere. It can effectively introduce nonlinear factors into the neural network to fit complex curves. This paper also uses this form. The function expression of the sigmoid function is as follows:
f ( x ) = 1 1 + e x
The network learning rate is set to 0.9, the overall error requirement is 0.01, and the maximum number of iterations is 100,000.
Kolmogorov theorem has proved that the three-layer neural network can simulate any complex nonlinear model [19]. When training data for the model are limited, too many hidden layers will not improve the prediction accuracy but will increase the network training time and affect the normal operation of the network. Because the dimensions of input parameters and output data are limited, this paper uses a three-layer BP neural network.
At present, there is no accurate method to determine the optimal number of neuron nodes in the hidden layer. The formula method and trial and error method are usually used to determine. The empirical formula is as follows [20]:
m = n + u + a
where m is the number of neurons in the hidden layer; n is the number of neurons in the input layer, which is eight in this paper; u is the number of neurons in the output layer; a is a constant from one to ten. Therefore, the calculation result of m is 4~13.
In the process of trial and error, the network is trained with 5, 6, 7, 8, 9, and 10 hidden layer neurons. In order to achieve comparability, the normalized training set of the BP neural network is used for training data. The weights and thresholds in the BP neural network are initialized to 0, the network learning rate is set to 0.9, the overall error requirement is 0.01, and the maximum number of iterations is 100,000. The training results are shown in Figure 14, where the ordinate represents the overall error of the neural network, and the abscissa represents the number of iterations of the BP neural network.
As can be seen from Figure 14, when the number of neurons in the hidden layer is nine and the number of iterations is the same, the error is the smallest, so the number of neurons in the hidden layer is nine. To sum up, the BP neural network model with the structure of 8-9-1 is determined, namely, 8 input layer nodes, 9 hidden layer nodes, and 1 output layer node.

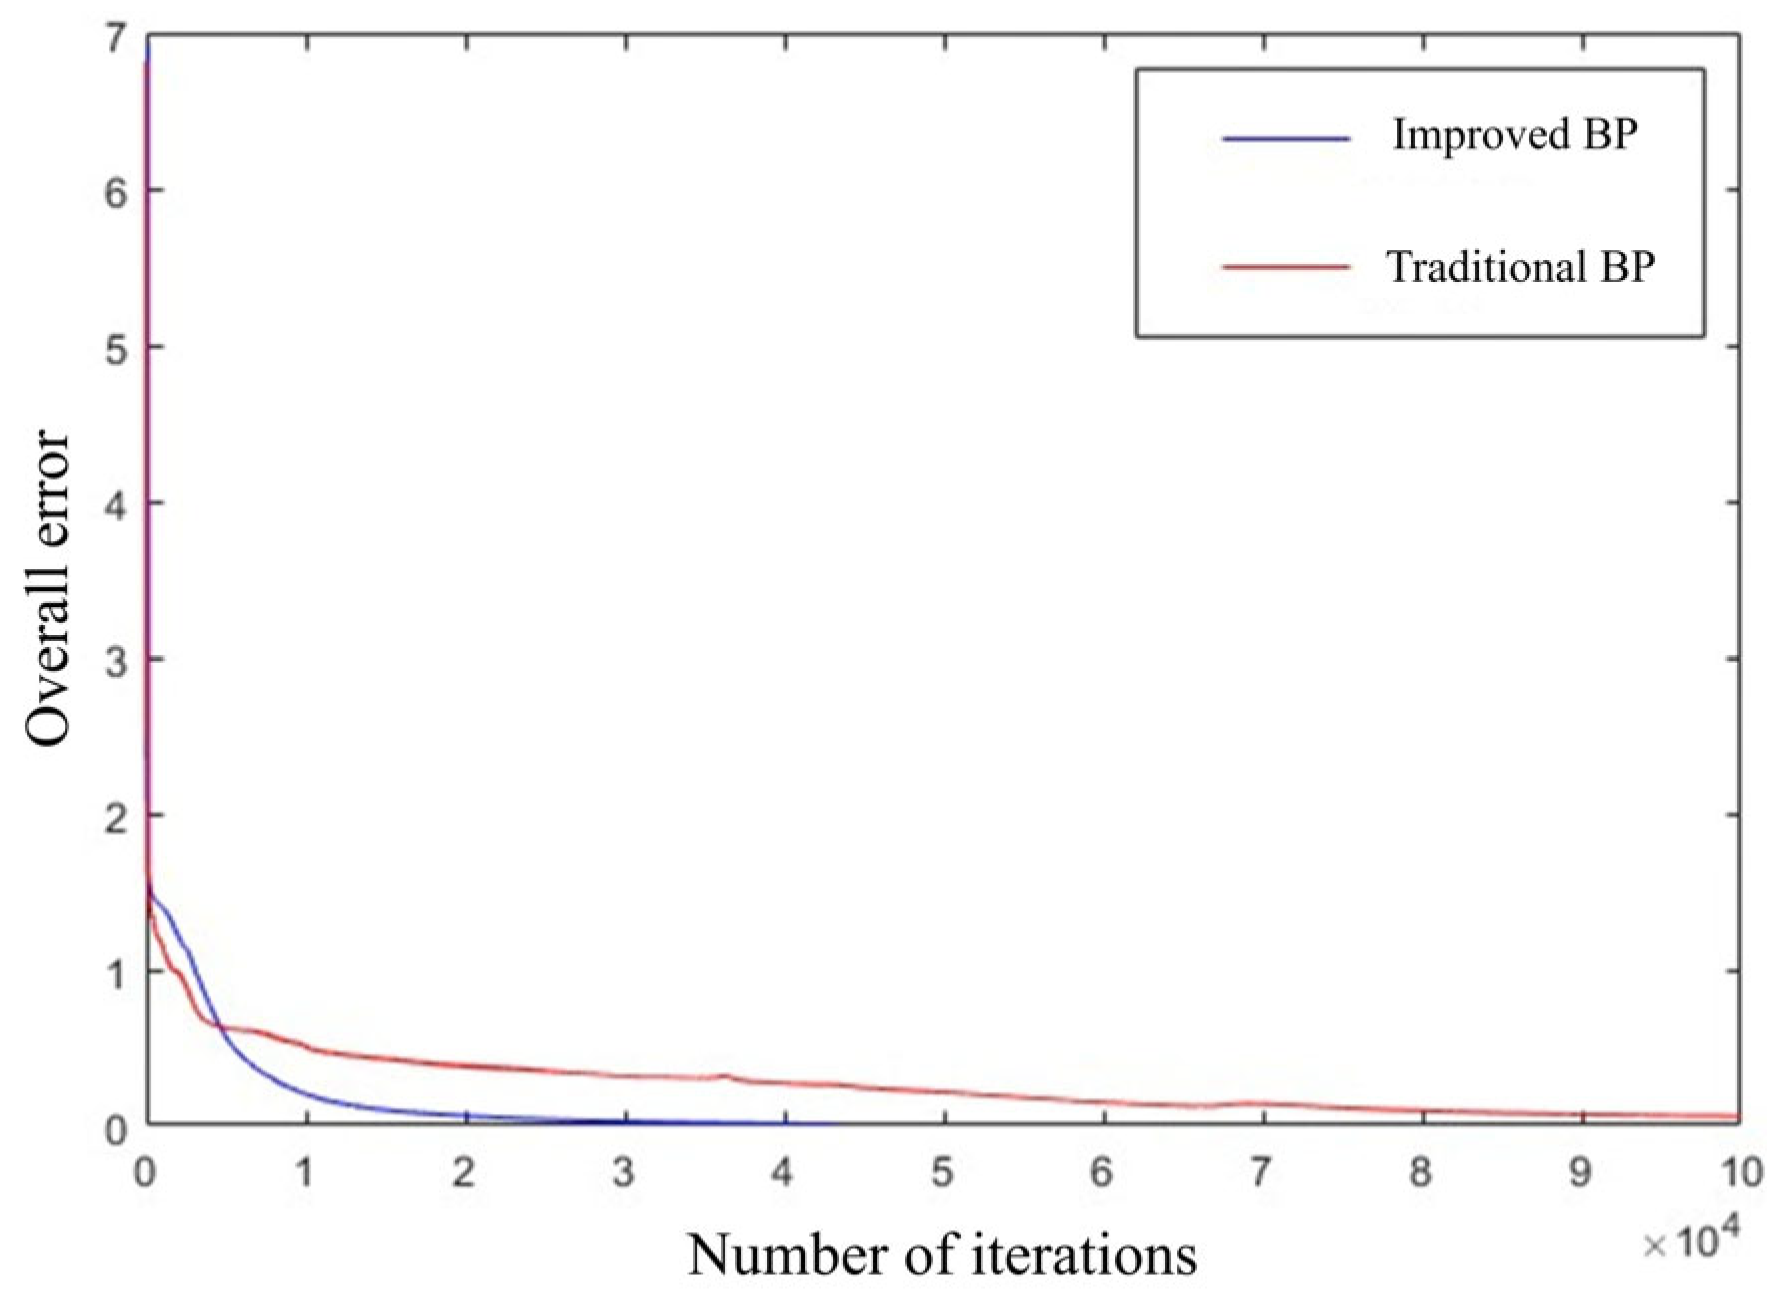
3.3.2. Improvement and Optimization of BP Neural Network

In view of the shortcomings of the BP neural network, such as slow convergence speed and affecting calculation accuracy, the following improvements are made to the BP neural network:
(1)
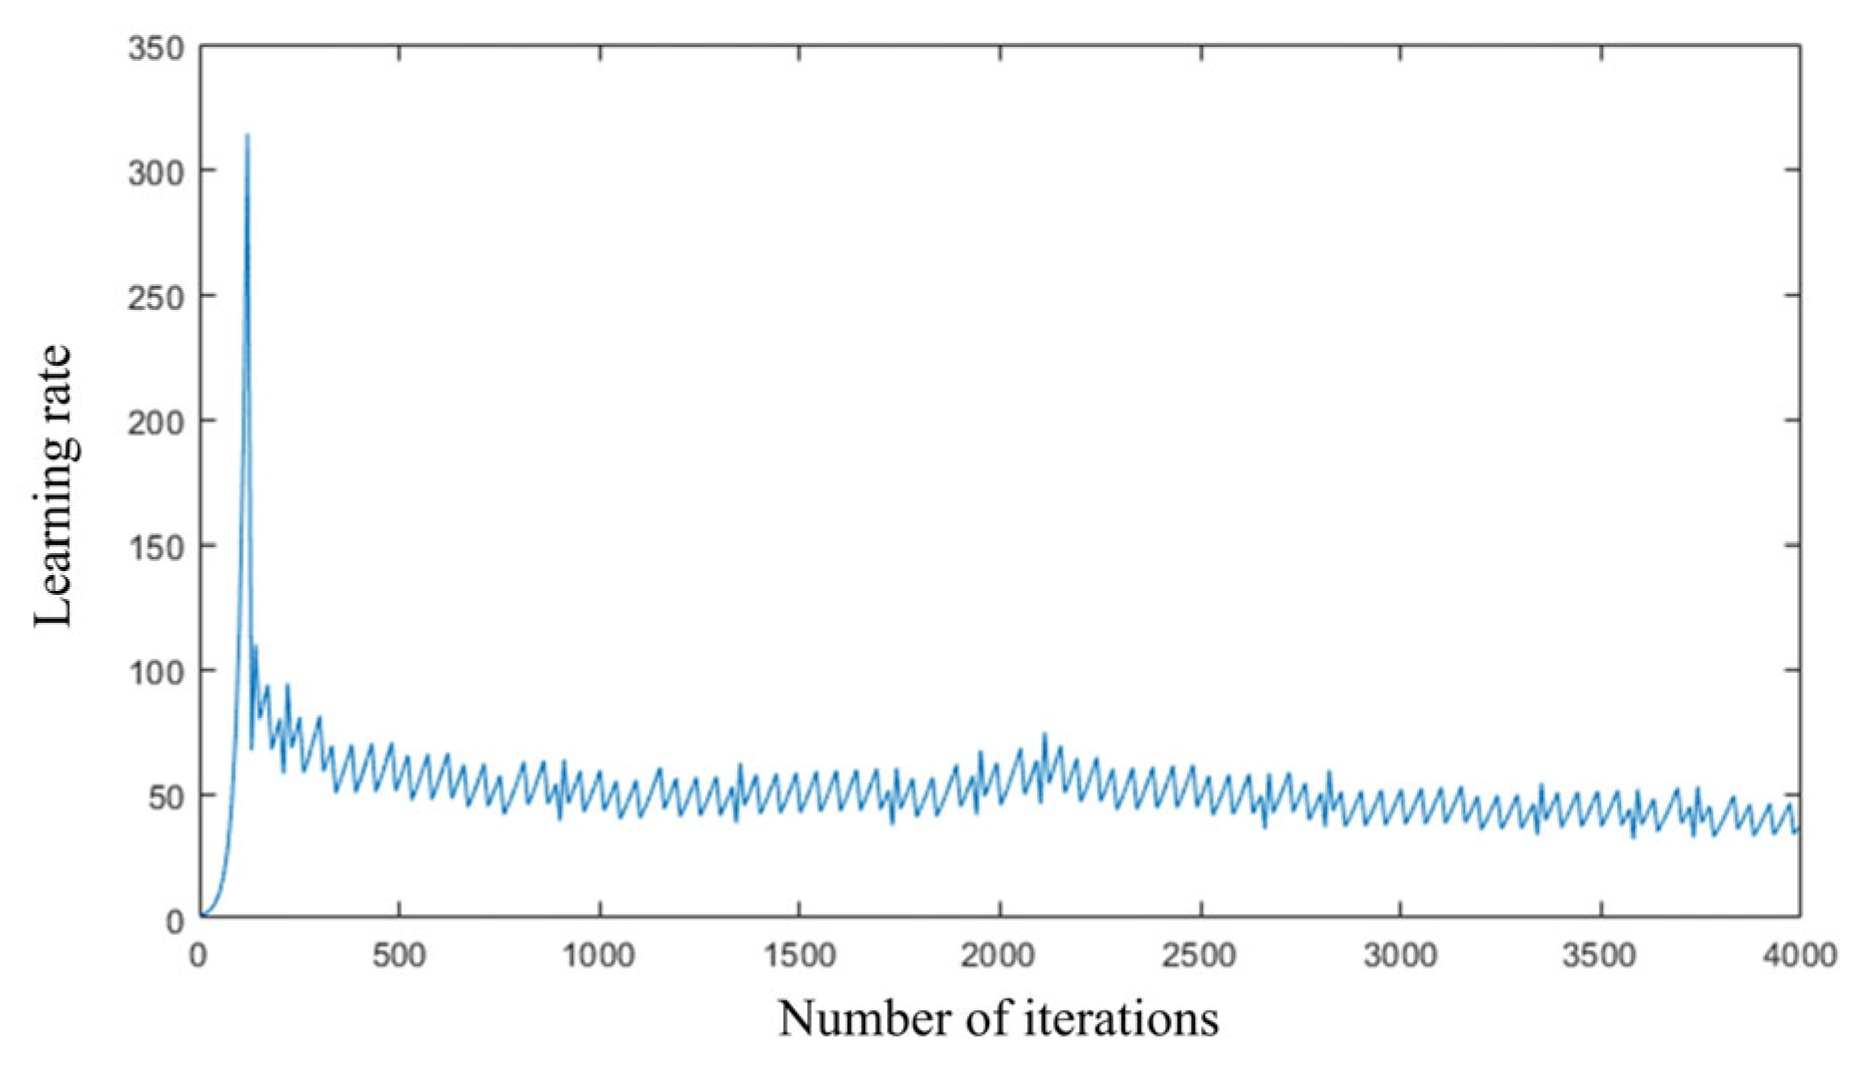
Adaptive learning rate
An important reason for the slow convergence speed and long training time of traditional BP neural networks is that the learning rate needs to be constant at a small value. In fact, when the parameter is far from the minimum, the learning rate does not need to be maintained in a small range but should increase the step size and make a large correction in one iteration. When the learning rate is too large near the minimum, it will cause network oscillation, affect the convergence of the network, and need to reduce the step size. To solve this problem, the adaptive learning rate method can be used to make the network automatically adjust the learning rate according to the error changes in the iterative process.
The basic idea of the adaptive learning rate method is that if the network error decreases after the parameter correction, the current weight and threshold adjustment direction are correct, and the step size can be increased to increase the learning rate. In contrast, if it is necessary to reduce the learning rate [21], the adjustment formula is as follows:
η ( t + 1 ) = K i n c η ( t ) , E ( t + 1 ) < E ( t ) K d e c η ( t ) , E ( t + 1 ) > = E ( t )
where η indicates the learning rate of the network; K i n c is the incremental factor of learning rate, which is taken as 1.05 in this paper; K d e c is the learning rate reduction factor, which is taken as 0.7 in this paper; E ( t ) represents the network error after the t th parameter modification.
When the BP neural network adopts the adaptive learning rate, it can accelerate the convergence speed far away from the extreme point, slow down the convergence speed around the extreme point, and train the network quickly and stably.
(2)
Additional momentum term
One idea of the improved algorithm is to introduce momentum, which makes use of the historical gradient information and can more robustly resist noise and local traps [22]. Compared with the traditional BP neural network, the additional momentum term considers the overall change trend on the error surface and can ignore the small changes on the error surface to avoid falling into some shallow local extreme points.
The specific method of adding momentum term is to add part of the last parameter adjustment amount to the parameter adjustment of this calculation based on the reverse transmission of error so as to make new changes in parameters. The adjustment formula is as follows:
w ( t + 1 ) = α w ( t ) + η ( 1 α ) E ( t ) + α E ( t 1 )
where w ( t + 1 ) represents the adjustment amount of weight and threshold in iteration t + 1 and α is the momentum factor, which is taken as 0.9 in this paper.
Since the adaptive learning rate method can reduce the number of iterations during network training, and the additional momentum method can ignore the shallow local extreme points, the two methods can be combined to improve the prediction accuracy and the convergence speed of the BP neural network model. The improved BP neural network training process is shown in Figure 15.
In order to compare the traditional BP neural network with the adaptive learning rate method and the improved BP neural network with additional momentum terms, the weights and thresholds in the BP neural network are initialized to 0, the maximum number of iterations is 100,000, the overall error requirement is 0.01, the initial learning rate is 0.9, and the activation function is the sigmoid function.
The training set in the sample set is used to train the traditional BP neural network with the structure of 8-9-1 and the improved BP neural network, respectively. The change in the learning rate of the improved BP neural network in the training process is shown in Figure 16.
It can be seen from Figure 16 that in the first 4000 iterations of the training process of the improved BP neural network, the step size has been increased from the first iteration to the 329th iteration, and the learning rate has finally reached 329.77, and then the learning rate has been continuously adjusted, but the overall learning rate is greater than the initial value of 0.9, and the convergence speed has been greatly improved. Figure 17 shows the training process comparison of the traditional BP neural network and the improved neural network.
The overall error of the improved BP neural network in the training process decreased to 0.01 after 43,000 iterations. Compared with the traditional BP neural network, the overall error decreased to 0.05 after 100,000 iterations, and the convergence speed and training accuracy have been significantly improved, which proves the effectiveness of using the adaptive learning rate method and additional momentum method to improve the convergence speed and training accuracy of BP neural network in this paper.
In the process of using the traditional BP neural network to predict the FeO content of sinter, there will be a large error in the predicted FeO content after the system is updated according to these more recent data. The reason is that in the process of using new data training, the network fell into a local minimum and did not meet the accuracy requirements. Therefore, it is necessary to adjust the traditional BP neural network to reduce the probability of falling into a local minimum and improve the prediction accuracy. Genetic algorithm optimization can effectively avoid this problem.
The genetic algorithm is an algorithm model that simulates natural selection and obtains the global optimal solution of the optimization problem by simulating the evolution process of a biological population. The basic steps of constructing a genetic algorithm include [23] chromosome coding the possible solution of the problem, confirming the fitness function according to the actual problem, and determining the genetic operator.
The genetic algorithm first needs to encode all possible solutions into the form of chromosomes to participate in the subsequent genetic operation. In this paper, floating-point coding is used to represent individual chromosomes with floating-point numbers, which avoids the loss of accuracy in encoding and decoding operations.
The solution required by the genetic algorithm is the weight and threshold of the BP neural network. Therefore, the chromosome of a solution is expressed in the form of a set of floating-point vectors. The chromosome length is the sum of the weight and threshold in the BP neural network. The calculation formula is as follows:
N = n m + m u + m + u
where n, m, and u are the number of neurons in the network input layer, hidden layer, and output layer, respectively; m + n represents the total number of initial weights; nm + mu represents the total number of initial thresholds. According to the determined BP neural network structure, the chromosome length of the genetic algorithm, that is, the dimension of the floating-point vector is N = 8 × 9 + 9 × 1 + 9 + 1 = 91 .
The fitness function is the standard to evaluate the quality of individuals in a genetic algorithm. As the only basis for selecting operation, fitness value has a direct impact on the calculation process and convergence speed of the genetic algorithm. In the genetic algorithm, the better the fitness of an individual, the higher the fitness value. Therefore, when the goal is to find the maximum value of the formula g ( x ) , the fitness function f i t ( x ) is as follows:
f i t ( x ) = g ( x )
On the contrary, when the goal is to find the minimum value of g ( x ) the fitness function takes its reciprocal as follows:
f i t ( x ) = 1 g ( x )
The genetic algorithm stipulates that the fitness function is always non-negative [24], while the objective function may be positive or negative. When this happens, the fitness function needs to be scaled. The genetic algorithm should be combined with the BP neural network. The goal of the neural network is to minimize the output error, so the fitness function should be:
f i t ( P ) = 1 1 2 i = 1 n ( y i o i ) 2
where P is the individual in the population; y i is the predictive value of the BP neural network set by this individual; o i represents the corresponding actual value. Since the output error of the BP neural network is always non-negative, the fitness function does not need to be scaled again.
The optimized BP neural network training flowchart is shown in Figure 18.
The performance of neural network prediction requires certain evaluation criteria to measure, but currently, there is no conventional unified method to measure it. Most methods verify the performance of the prediction model through several different indicators. Therefore, this article introduces Mean Absolute Error (MAE), Mean Relative Error (MRE), and Root Mean Square Error (RMSE) to comprehensively evaluate the accuracy of the model and compares these three indicators to demonstrate the superiority and inferiority of the model performance [25].
(1)
Mean absolute error
MAE = 1 N i = 1 N y i y ^ i
(2)
Mean relative error
MRE = 1 N i = 1 N y i y ^ i y i
(3)
Root Mean Square Error
RMSE = 1 N i = 1 N y i y ^ i 2
In the above formula N represents the number of samples, y i represents the actual value, and y ^ i represents the predicted value of the model. When the values of these indicators are small, it indicates that the accuracy of the prediction results is higher, reflecting the accuracy and effectiveness of the prediction model.
First, the stability of the genetic algorithm optimization is verified. The population size of the genetic algorithm is set to 30, the number of evolutionary generations is set to 50, the crossover probability is set to 0.8, and the mutation probability is set to 0.06. The parameter settings of the BP neural network continue from the previous parameter settings.
The initial weights and thresholds optimized by the genetic algorithm were used to train the BP neural network with the initial weights and thresholds generated by random numbers using the training set five times. The calculation results of the model on the same sample in the prediction set after each training were compared, as shown in Figure 19.
According to Figure 19, it can be seen that due to the optimization using the genetic algorithm, the neural network avoids becoming stuck in local minima. In multiple experiments, the repeatability calculation results of the optimized BP neural network are stable, with an error of ±0.5% compared with the true value. However, if traditional BP neural networks use random numbers for weight and threshold initialization, the repetitive calculation results will fluctuate greatly, which does not meet the accuracy requirements. This repetitive experiment verified the stability improvement of the BP neural network by genetic algorithm.
Second, in order to verify the computational accuracy of the optimized BP neural network, three performance indicators were calculated separately on the training set and prediction set and compared with the traditional BP neural network. Figure 20 shows the calculation results of FeO content in sintered ore corresponding to the training set, which verifies the training ability of the model.
The yellow line in Figure 20 represents FeO content data for sintered ore predicted by the BP neural network algorithm optimized using the genetic algorithm. The red line represents FeO content data for sintered ore predicted by the traditional BP neural network. The blue line represents the chemical detection value of sinter FeO content in actual production. From the training results of the training set, it can be seen that the training ability of traditional BP neural networks is already very superior, and the training ability of optimized BP neural networks is similar to traditional ones.
Table 2 shows the comparison of several performance indicators between the optimized BP neural network and the traditional BP neural network on the training set. According to data in the table, it can be seen that the optimized BP neural network has reduced MAE by 0.055, MRE by 0.006, and RMSE by 0.036 on the training set. The training ability of the optimized BP neural network is superior to traditional neural networks in MAE, MRE, and RMSE.
Figure 21 compares the computational results of the traditional BP neural network and the optimized neural network on the prediction set, verifying the predictive ability of the model.
From the calculation results of the prediction set, it can be seen that the optimized BP neural network has a stronger fitting ability for actual values, while the traditional BP neural network’s prediction ability is inferior to the optimized BP neural network, and it can no longer meet the requirements of prediction accuracy.
Table 3 shows the comparison of several performance indicators between the optimized BP neural network and the traditional BP neural network on the prediction set. According to data in the table, it can be seen that the optimized BP neural network has reduced MAE by 0.394, MRE by 0.039, and RMSE by 0.426 on the prediction set. The predictive ability of the optimized BP neural network is better than that of the traditional BP neural network in the three performance indicators of MAE, MRE, and RMSE, indicating that this model has better predictive performance.
In terms of prediction accuracy, for the predicted value of FeO content of sinter of the network model optimized by genetic algorithm, there are 25 groups whose deviation from the actual value is within ±0.5%, and the hit rate reaches 83.33%. The deviation between the predicted value and the actual value of sinter FeO content in 30 groups of predicted data is within ±1%, and the average absolute error is 0.32%, which indicates that the model has good prediction accuracy and meets the requirements of actual prediction in industrial production.

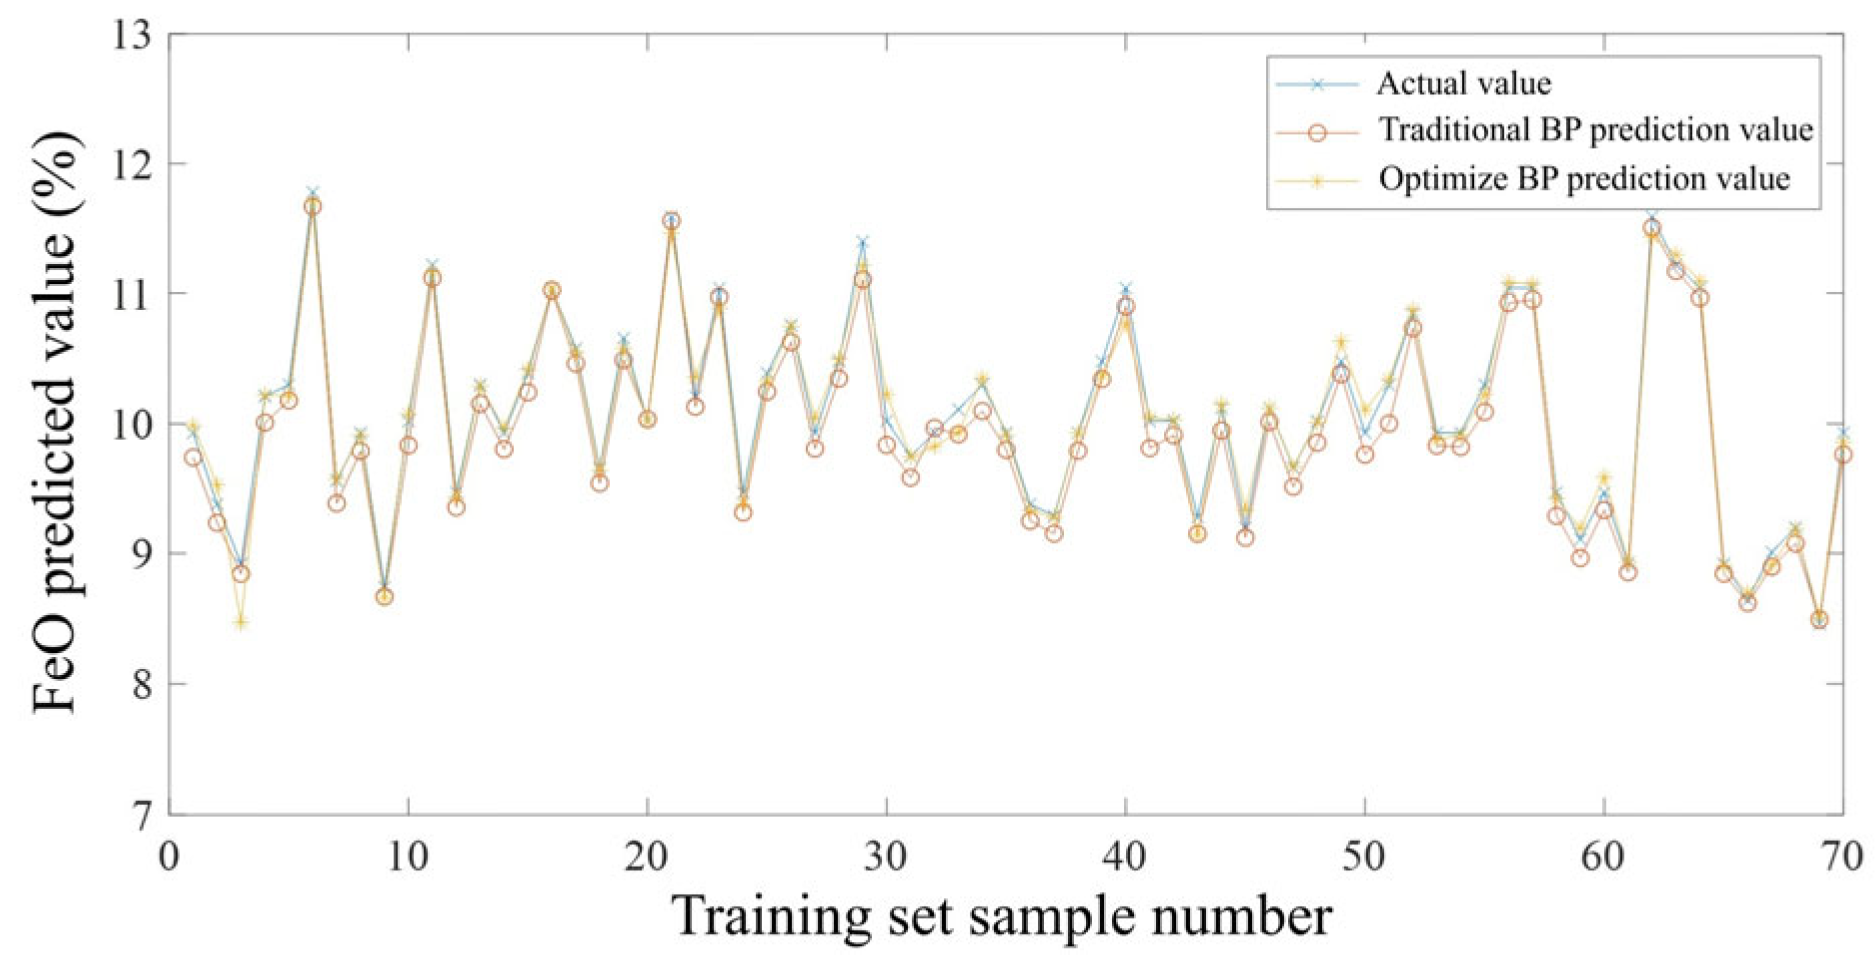
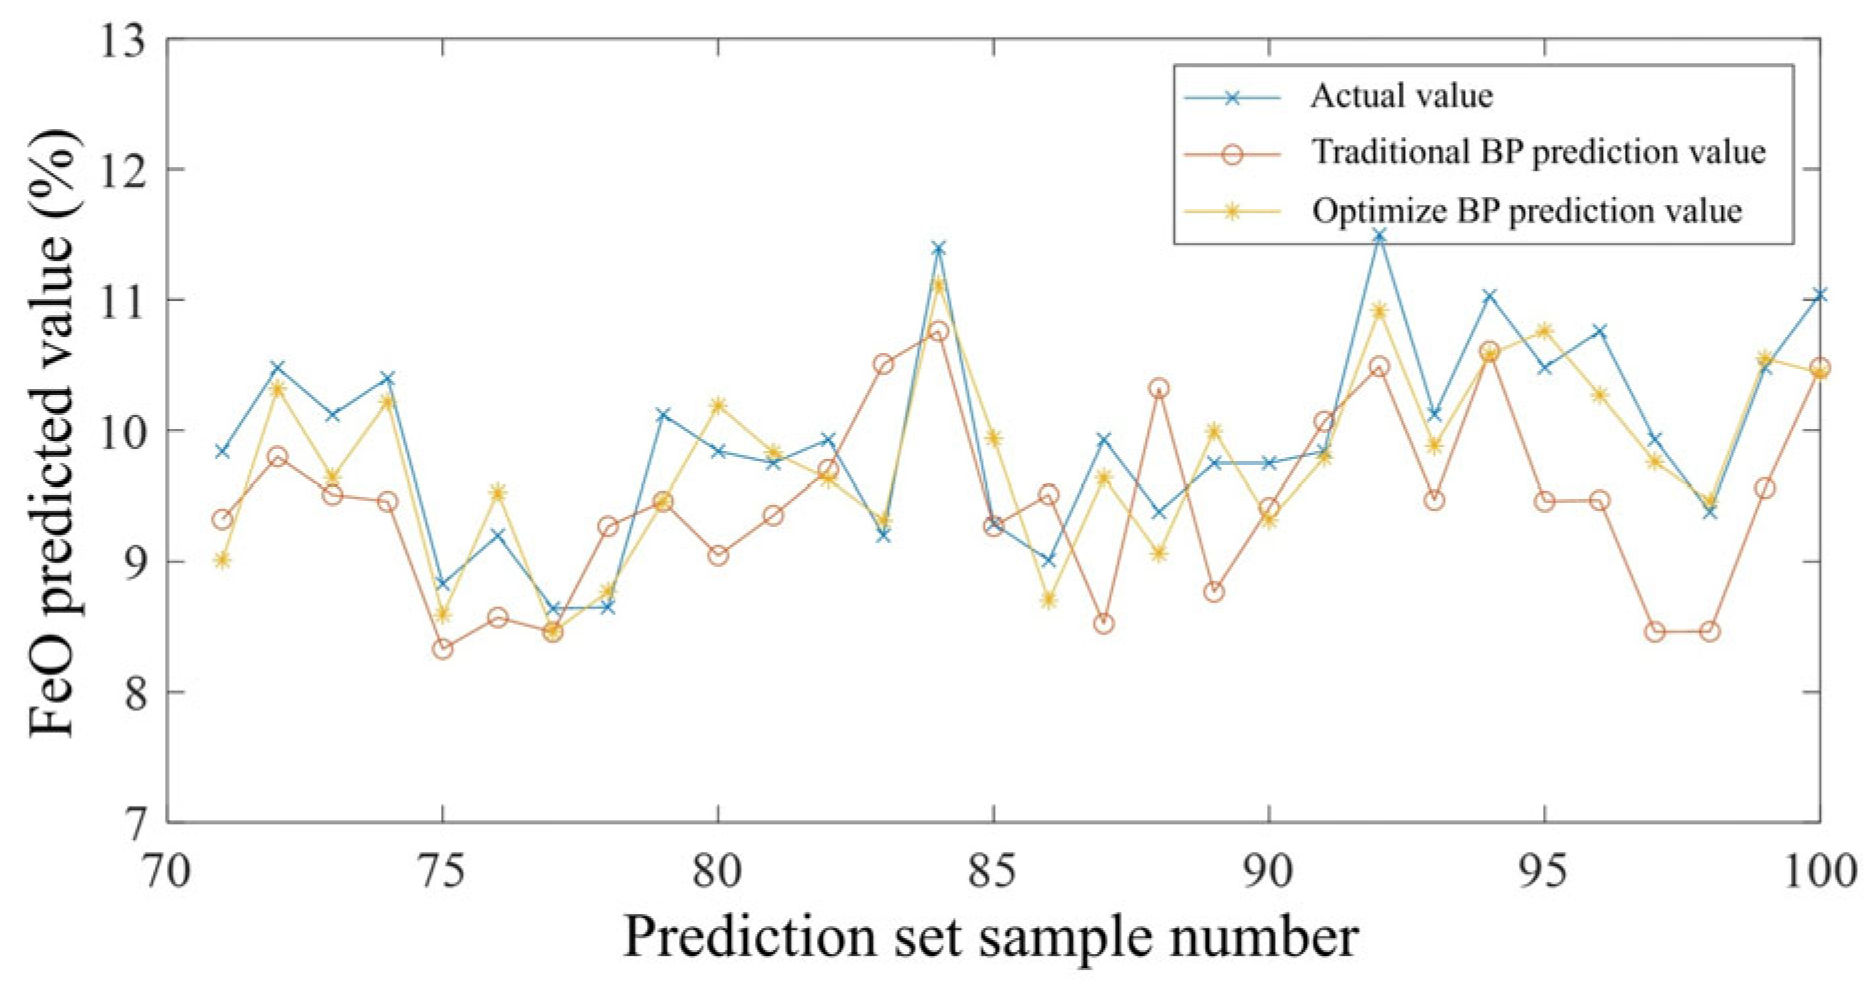
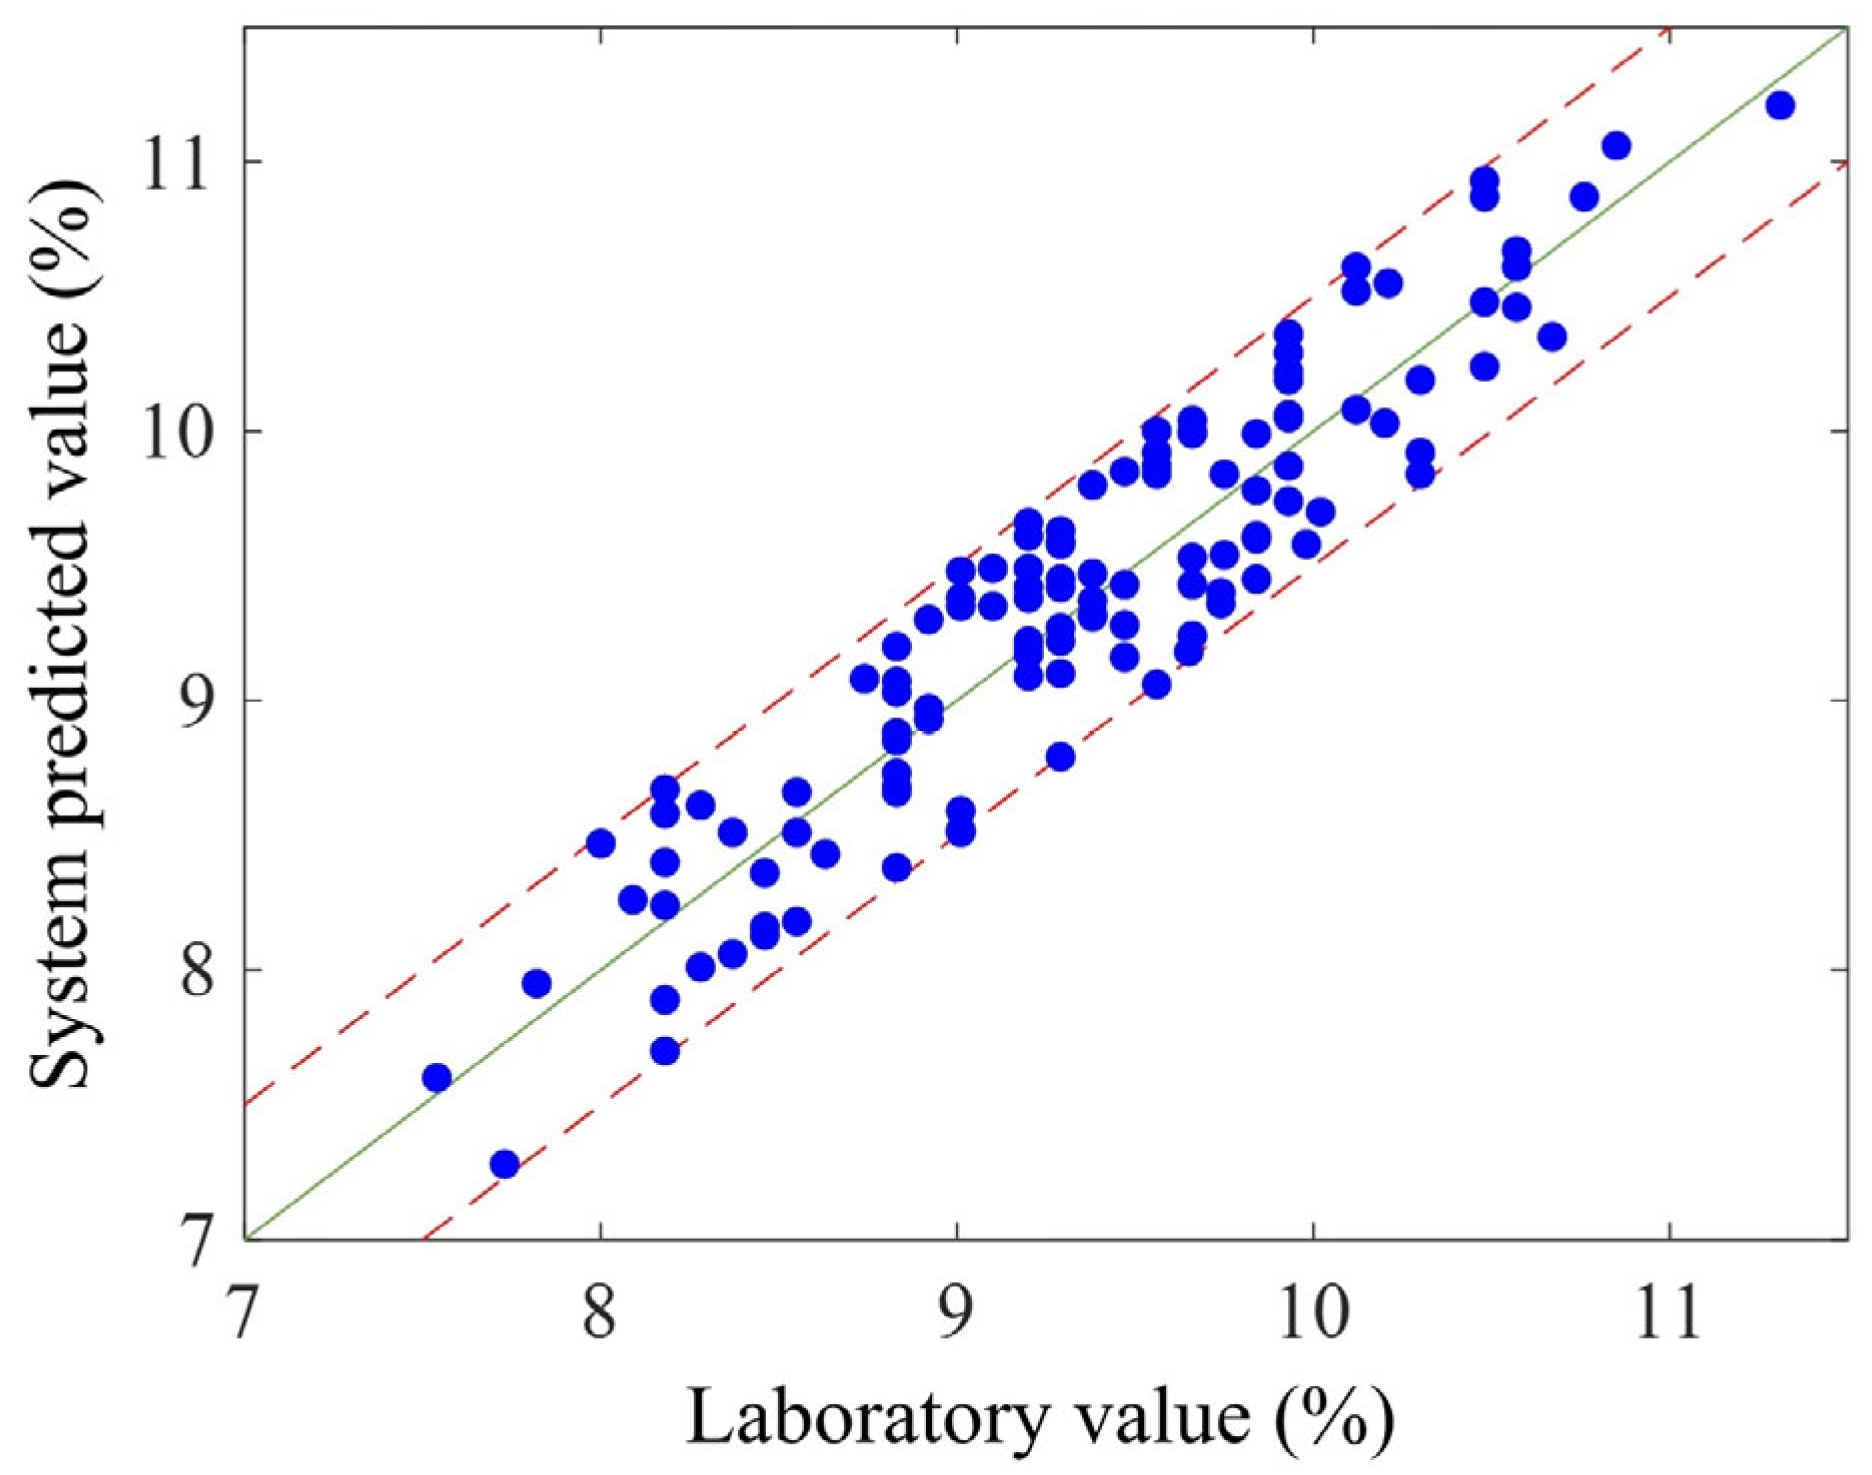
4. Experimental Analysis

In order to verify the prediction accuracy of the real-time prediction system of sinter FeO content, from 00:00 on 1 December 2023 to 24:00 on 10 December 2023, laboratory test data on sinter FeO content were extracted from the laboratory and compared with the FeO content predicted by the system. Due to the shutdown of the sintering machine and other reasons, data were missing during some time periods. A total of 120 sets of control data were collected, and some of the control results are shown in Table 4.
It can be seen from Table 4 that the prediction time of the system is about 2 h earlier than the test time, which can predict the FeO content of sinter in a relatively timely manner. An error analysis was conducted on all 120 sets of data, and the results are shown in Figure 22. A scatter plot was plotted with chemical detection values on the horizontal axis and the system-predicted values on the vertical axis. The solid line in the figure represents the situation where the predicted value is consistent with the actual value. The closer the sample point is to the solid line, the smaller the error. The dashed line in the figure represents the allowable error range of the system.
From Figure 22, it can be seen that in terms of prediction accuracy, the system’s predicted values have a high degree of agreement with the measured values, with an average absolute error of 0.25%. Using an error within 0.5% as the criterion for judging whether the model hits, the hit rate of the model reaches 97.5%, and the absolute prediction error of the system does not exceed ±1%, meeting the system’s prediction accuracy requirements.

5. Conclusions

This paper studies the real-time prediction method of sinter FeO content. This article investigates a real-time prediction method for sinter FeO content based on neural networks. According to the interval rule and brightness trend of the best cross-section image, the automatic extraction method of the best cross-section image based on brightness difference is summarized. Image processing is carried out on the best cross-section of the sintering machine tail, and image parameters are obtained. The Pearson correlation coefficient and XGBoost feature importance analysis are used to carry out numerical analysis on the preliminary parameters. Combining workers’ experience with the results of correlation analysis, eight feature parameters that have a greater impact on sinter FeO content are finally screened out. Propose a solution to the data problem in the process of converting feature parameters into neural network input vectors, including using data cleaning to remove abnormal data, using data normalization methods to solve the problem of neural network non-convergence, and verifying the fusion method of image parameters and process parameters. A BP neural network model with a structure of 8-9-1 was established based on theory and experiments, and its design parameters were determined. To address the drawbacks of slow convergence speed and low prediction accuracy in the network, an adaptive learning rate method and an additional momentum term are adopted to improve the traditional BP neural network. In response to the shortcomings of the network being prone to becoming stuck in local minima and unstable system update effects, a genetic algorithm is used to calculate the initial weights and thresholds of the BP neural network to optimize it. The average test error of the optimized prediction model is 0.32%. In order to verify the prediction accuracy of the real-time prediction system of sinter FeO content, taking actual production data as an example, laboratory data on sinter FeO content were extracted from the laboratory. Compared with the predicted FeO content by the system, the prediction time of the system was about 2 h earlier than the test time, and the FeO content of sinter could be predicted relatively timely. In terms of prediction accuracy, the predicted value of the system was highly consistent with the measured value, the average absolute error was 0.25%, and the absolute prediction error was not more than ±1%.

Author Contributions

Conceptualization, S.L. and Y.Z.; methodology, S.L.; software, Y.Z.; validation, Z.Z. and X.L.; formal analysis, Y.Z.; investigation, Z.Z.; resources, S.L.; data curation, Y.C.; writing—original draft preparation, S.L.; writing—review and editing, Y.Z.; visualization, Y.Z.; supervision, S.L.; project administration, Y.C.; funding acquisition, S.L. All authors have read and agreed to the published version of the manuscript.

Funding

This research was funded by the National Key Research and Development Program of China, grant number 2022YFB3207400, and the Special Fund for Basic Scientific Research Business Expenses of Central Public Welfare Scientific Research Institutes, grant number TKS20230204.

Data Availability Statement

Data are available from the authors on request.

Conflicts of Interest

The authors declare no conflicts of interest.

References

  1. Liu, Y.Q.; Pan, D.; Jiang, Z.H.; Yu, H.Y.; Gui, W.H.; Yang, C.J. A review of detection methods of key parameters in sintering process of iron and steel manufacturing. Sinter. Pelletizing 2023, 48, 10–21. [Google Scholar]
  2. Wang, Y. Research on Key Technologies of Real Time Prediction System of Sinter FeO Content. Master’s Thesis, Chongqing University, Chongqing, China, 2007. [Google Scholar]
  3. Ji, X.S.; Jing, T.T.; Xiong, N.Y. Study on FeO content of sinter prediction. Comput. Simul. 2015, 32, 318–322. [Google Scholar]
  4. Fang, Y.J.; Jiang, Z.H.; Huang, L.; Gui, W.H.; Pan, D. FeO content prediction in sintering process based on fusion of data-knowledge and AW-ESN. Acta Autom. Sin. 2024, 50, 282–294. [Google Scholar]
  5. Jiang, Z.H.; Guo, Y.H.; Pan, D.; Gui, W.H.; Maldague, X. Polymorphic measurement method of FeO content of sinter based on heterogeneous features of infrared thermal images. IEEE Sens. J. 2021, 21, 12036–12047. [Google Scholar] [CrossRef]
  6. Li, T.; Zhang, Z.; Chen, H. Predicting the combustion state of rotary kilns using a convolutional recurrent neural network. J. Process Control 2019, 84, 207–214. [Google Scholar] [CrossRef]
  7. Wu, J. Research on Artificial Intelligence Method of Sintering Quality Based on Sectional Image of Sintering Machine Discharge End. Master’s Thesis, Northeastern University, Shenyang, China, 2013. [Google Scholar]
  8. Liang, X.M.; Jin, A.M.; Cao, X.H.; Zeng, K.; Wang, F.B. Flame image recognition of sintering section based on improved MobileNetV3. Electron. Meas. Technol. 2023, 46, 182–187. [Google Scholar]
  9. Zhang, F.; Wei, G.; Pang, W.; Gao, Q.J.; Chen, W.L.; Wen, Q.L.; Du, G. A study on mathematical model of prediction of FeO content in the sintering ore. J. Mater. Metall. 2013, 12, 159–162+168. [Google Scholar]
  10. Zhang, X.F.; Wen, Y.X.; Xiong, D.L.; Long, H.M. Prediction of FeO content in sinter based on BiLSTM model. Metall. Ind. Autom. 2023, 47, 85–92. [Google Scholar]
  11. Chen, X.X.; Lan, T.; Shi, X.H.; Tong, C.D. A semi-supervised linear–nonlinear least-square learning network for prediction of carbon efficiency in iron ore sintering process. Control Eng. Pract. 2020, 100, 104454. [Google Scholar] [CrossRef]
  12. Du, S.; Ma, X.; Li, X.; Cao, W.H.; Wu, M. Perception of working condition of sintering process based on information granulation and fuzzy rules. Sinter. Pelletizing 2023, 48, 124–131. [Google Scholar]
  13. Khagi, B.; Lee, K.H.; Choi, K.Y.; Lee, J.J.; Kwon, G.R.; Yang, H.D. VBM-based alzheimer’s disease detection from the region of interest of T1 MRI with supportive Gaussian smoothing and a bayesian regularized neural network. Appl. Sci. 2021, 11, 6175. [Google Scholar] [CrossRef]
  14. Wang, X.F.; Sun, X.D.; Sun, Q.K.; Zhang, J.L.; Liu, Z.J.; Wang, Y.Z. Prediction of compressive strength of pellet ore based on feature selection and PSO XGBoost. Shanxi Metall. 2024, 47, 110–113. [Google Scholar]
  15. Duan, X.Y. Research on Feature Selection to Improve the Accuracy of LIBS Steel Classification. Master’s Thesis, Changchun University of Technology, Changchun, China, 2024. [Google Scholar]
  16. Liu, Y.P.; Liu, Y.J.; Lv, F.C.; Xie, Q.; Gao, S.G.; Gao, F. Application prospect and key technology of digital twin in power transmission and transformation equipment. High Volt. Eng. 2022, 48, 1621–1633. [Google Scholar]
  17. Chen, Z.Y.; Liu, J.B.; Li, C.; Ji, X.H.; Li, D.P.; Huang, Y.H.; Di, F.C.; Gao, X.Y.; Xu, L.Z. Ultra Short-term Power Load Forecasting Based on Combined LSTM-XGBoost Model. Power Syst. Technol. 2020, 44, 614–620. [Google Scholar]
  18. Kang, J.; Mi, X.X.; Wang, H.L.; Wu, L.; Sun, K.; Tang, A.T. Research progress of artificial neural networks in material science. Mater. Rep. 2020, 34, 21172–21179. [Google Scholar]
  19. Zhang, D.; Chen, L. A BP neural network-assisted smart decision method for education quality. IEEE Access 2023, 11, 74569–74578. [Google Scholar] [CrossRef]
  20. Xia, J.M.; Ding, C.J.; Tan, L. Deep belief network intrusion detection method based on grey wolf algorithm. Comput. Eng. Des. 2020, 41, 1534–1539. [Google Scholar]
  21. Yan, X.D.; Xu, Y.; Xing, X.F.; Cui, B.J.; Guo, Z.H.; Guo, T.B. Trustworthy network anomaly detection based on an adaptive learning rate and momentum in IIoT. IEEE Trans. Ind. Inform. 2020, 16, 6182–6192. [Google Scholar] [CrossRef]
  22. Deng, Q.; Gao, J.J.; Ge, D.D.; He, S.M.; Jiang, B.; Li, X.C.; Wang, Z.Z.; Yang, C.L.; Ye, Y.Y. Modern optimization theory and applications. Sci. Sin. Math. 2020, 50, 899–968. [Google Scholar]
  23. Deng, L.K.; Lv, D.P. PID parameter tuning of remotely operated vehicle control attitude based on genetic algorithm. Manuf. Autom. 2023, 45, 177–179+206. [Google Scholar]
  24. Lin, Y.; Zhao, H.; Ding, H. Solution of inverse kinematics for general robot manipulators based on multiple population genetic algorithm. J. Mech. Eng. 2017, 53, 1–8. [Google Scholar] [CrossRef]
  25. Hyndman, R.J.; George, A. Forecasting: Principles and Practice, 3rd ed.; OTexts: Melbourne, Australia, 2019. [Google Scholar]
Figure 1. Schematic diagram of the sintering machine structure.
Minerals 15 00553 g001
Figure 2. Schematic diagram of prediction system structure.
Minerals 15 00553 g002
Figure 3. FeO content prediction system of sinter.
Minerals 15 00553 g003
Figure 4. Schematic diagram of periodic brightness difference.
Minerals 15 00553 g004
Figure 5. Flow chart of image feature extraction.
Minerals 15 00553 g005
Figure 6. Schematic diagram of red fire layer extraction; (a) Original RGB image; (b) Binary image processed by the OTSU method.
Minerals 15 00553 g006
Figure 7. Schematic diagram of blowhole extraction; (a) Original ROI; (b) Y-component grayscale image.
Minerals 15 00553 g007
Figure 8. Cross-section image with “burr”.
Minerals 15 00553 g008
Figure 9. Effect diagram of cross-section image opening operation; (a) Original binary image; (b) Effect drawing of opening operation of the structural element with a radius of 5; (c) Effect drawing of opening operation of structural elements with a radius of 30.
Minerals 15 00553 g009
Figure 10. Flow chart of image feature extraction algorithm.
Minerals 15 00553 g010
Figure 11. Figure linear correlation analysis of image features.
Minerals 15 00553 g011
Figure 12. Image feature importance results.
Minerals 15 00553 g012
Figure 13. Correlation analysis of process parameters.
Minerals 15 00553 g013
Figure 14. Trial method training process.
Minerals 15 00553 g014
Figure 15. Diagram of improved BP neural network training process.
Minerals 15 00553 g015
Figure 16. Change diagram of learning rate of improved BP neural network.
Minerals 15 00553 g016
Figure 17. Comparison of improved BP neural network training process.
Minerals 15 00553 g017
Figure 18. Diagram of optimized neural network training process.
Minerals 15 00553 g018
Figure 19. Repeatability calculation results of genetic algorithm.
Minerals 15 00553 g019
Figure 20. Comparison of training set calculation results.
Minerals 15 00553 g020
Figure 21. Comparison of prediction set calculation results.
Minerals 15 00553 g021
Figure 22. Error statistics of system prediction values.
Minerals 15 00553 g022
Table 1. Statistics of the brightness difference value.
Brightness Difference Value>1 × 1087 × 107∼1 × 1085 × 107∼7 × 10⁷<5 × 10⁷
Occurrence times1963153
Table 2. Comparison of Training Performance Indicators.
Computation ModelMAEMRERMSE
Traditional BP0.1270.0130.139
BP optimized by genetic algorithm0.0720.0070.103
Table 3. Performance index comparison of prediction set.
Prediction MethodMAEMRERMSE
Traditional BP0.7130.0710.800
BP optimized by genetic algorithm0.3190.0320.374
Table 4. Comparison between system-predicted values and chemical detection values.
Testing TimeChemical Detection Value (%)System Prediction TimeEstimate (%)Absolute Error (%)
2023/12/1 2:558.922023/12/1 1:029.00.08
2023/12/1 5:049.562023/12/1 3:029.90.34
2023/12/1 6:489.012023/12/1 5:029.40.39
2023/12/1 9:169.662023/12/1 7:0210.00.34
…………………………
2023/12/10 17:008.552023/12/10 15:028.50.05
2023/12/10 19:058.832023/12/10 17:028.40.43
2023/12/10 20:588.182023/12/10 19:028.40.22
2023/12/10 23:218.282023/12/10 21:028.60.32
2023/12/11 1:088.092023/12/10 23:028.30.21
Disclaimer/Publisher’s Note: The statements, opinions and data contained in all publications are solely those of the individual author(s) and contributor(s) and not of MDPI and/or the editor(s). MDPI and/or the editor(s) disclaim responsibility for any injury to people or property resulting from any ideas, methods, instructions or products referred to in the content.

