Article

Characteristics of Mineralization of Refractory Gold and Its Influence on Cyanide Gold Leaching Rates: A Case Study in Pituca II, Zamora Chinchipe, Ecuador

by
Santiago Jose Navas Jaramillo
* and
Renato Efren Gonzalez Zuñiga
Department of Geoscience, Universidad Tecnica Particular de Loja (UTPL), San Cayetano Alto, Paris and Praga, Loja 110107, Ecuador
*
Author to whom correspondence should be addressed.
Minerals 2025, 15(5), 523; https://doi.org/10.3390/min15050523
Submission received: 25 March 2025 / Revised: 5 May 2025 / Accepted: 7 May 2025 / Published: 15 May 2025
(This article belongs to the Section Mineral Processing and Extractive Metallurgy)

Abstract

The recovery of gold in metallurgical processes is significantly influenced by the presence of refractory minerals. This study investigates the mineralogical characteristics of refractory gold in the Pituca II ore deposit, with a focus on identifying the sulfide minerals that encapsulate gold particles and understanding their impact on gold recovery rates via cyanidation leaching. To establish a theoretical basis for optimizing gold recovery, a comprehensive suite of analytical techniques including electron microprobe analysis, petrographic analysis, laser ablation inductively coupled plasma mass spectrometry (LA-ICP-MS), and X-ray diffraction was employed to characterize the ore’s composition and mineralogical properties. The primary ore minerals identified were pyrite, galena, chalcopyrite, and sphalerite, with hessite occurring as an accessory phase. Gold was observed as fine-grained particles (<40 µm), predominantly enclosed within pyrite and galena, contributing to its refractory nature. Cyanidation tests revealed a strong correlation between particle size and leaching efficiency: material ground to D80 = 170 mesh (90 μm) achieved a recovery rate of 81.2%, compared to 72.2% for material at D80 = 100 mesh (150 μm). These findings elucidate the mineralogical constraints on gold recovery and underscore the necessity of appropriate particle size reduction to enhance leaching performance. The study provides practical insights and targeted recommendations for pretreatment strategies, thereby contributing to more efficient exploitation of refractory gold ores in similar geological settings.

1. Introduction

Refractory gold ores are characterized by the presence of gold that cannot be effectively recovered through conventional gravimetric concentration or simple leaching techniques. Such ores are typically defined by cyanidation recoveries of less than 75% [1,2]. Due to prolonged geological processes involving mineral migration and enrichment, gold often occurs as ultrafine particles encapsulated within other minerals, particularly in polymetallic sulfide ores. When gold particles are reduced to only a few microns in size, traditional grinding methods are insufficient to liberate them effectively, leading to significantly reduced leaching efficiencies [3,4].
In recent years, easily extractable gold resources have become increasingly scarce, elevating the strategic importance of refractory gold ores. As a result, the recovery of gold from sulfide-bearing refractory ores has become essential for ensuring the long-term sustainability of the gold industry [5,6]. However, the processing of these ores presents significant challenges, including low gold recovery rates and environmental concerns. Therefore, the clean and efficient development of refractory gold resources has become a pressing priority, both to enhance recovery efficiency and to minimize environmental impact [7].
A thorough understanding of gold mineralogy and its associations is critical for optimizing cyanidation processes, as variations in ore mineralogy significantly affect metal recovery. Traditional analytical techniques often fail to detect so-called “invisible” gold present as solid solutions or colloidal particles ranging from 0.1 μm to 0.01 μm and provide only limited insights into gold’s mineral associations and spatial distribution. These limitations can hinder the development of effective processing strategies. Accurate ore characterization is therefore essential to predict how a particular ore will respond in conventional recovery circuits and to determine whether it is free-milling or refractory. Comprehensive mineralogical analysis should identify the gold-hosting minerals, quantify the proportion of gold within each phase, and elucidate the mode of gold occurrence. This information is indispensable for assessing the ore’s amenability to various processing options and selecting the most appropriate metallurgical approach [8,9].
Gold cyanidation is a leading industrial gold leaching method due to its relatively low cost and high selectivity for gold and silver over other metals. However, sometimes direct cyanidation is not effective for gold extraction from refractory ores, even after the ore is ground to exceeding small particles [10]. In order to interpret the leaching rules, select suitable treatment methods, or optimize the treatment process of refectory gold ores, in-depth analysis of ore characteristics using ore mineralogy is required. In the recovery of refractory gold ores, complex technical processes are generally required. Therefore, precise optimization of the process is needed to supply higher economic benefits. Moreover, for a definite treatment process, the characterization of the ore has a great influence on the treatment effect. Mineral type, mineral crystal form, surface properties, harmful components, etc., can influence gold extraction rates [11,12].
The Pituca II deposit, located in southeastern Ecuador, is classified as a low-sulfidation epithermal vein-type system. Previous studies have reported significant losses of refractory gold in tailings when conventional recovery methods are applied [13]. In this context, the present study offers a detailed mineralogical characterization of gold particles and their associations with polymetallic sulfide minerals. This analysis aims to clarify how these mineralogical factors influence gold recovery rates during cyanide leaching laboratory tests. Furthermore, the findings provide practical guidance for optimizing the extraction of gold from this deposit and offer valuable references for the potential reprocessing of tailings containing refractory gold from other deposits with similar mineralogical profiles.

2. Materials and Methods
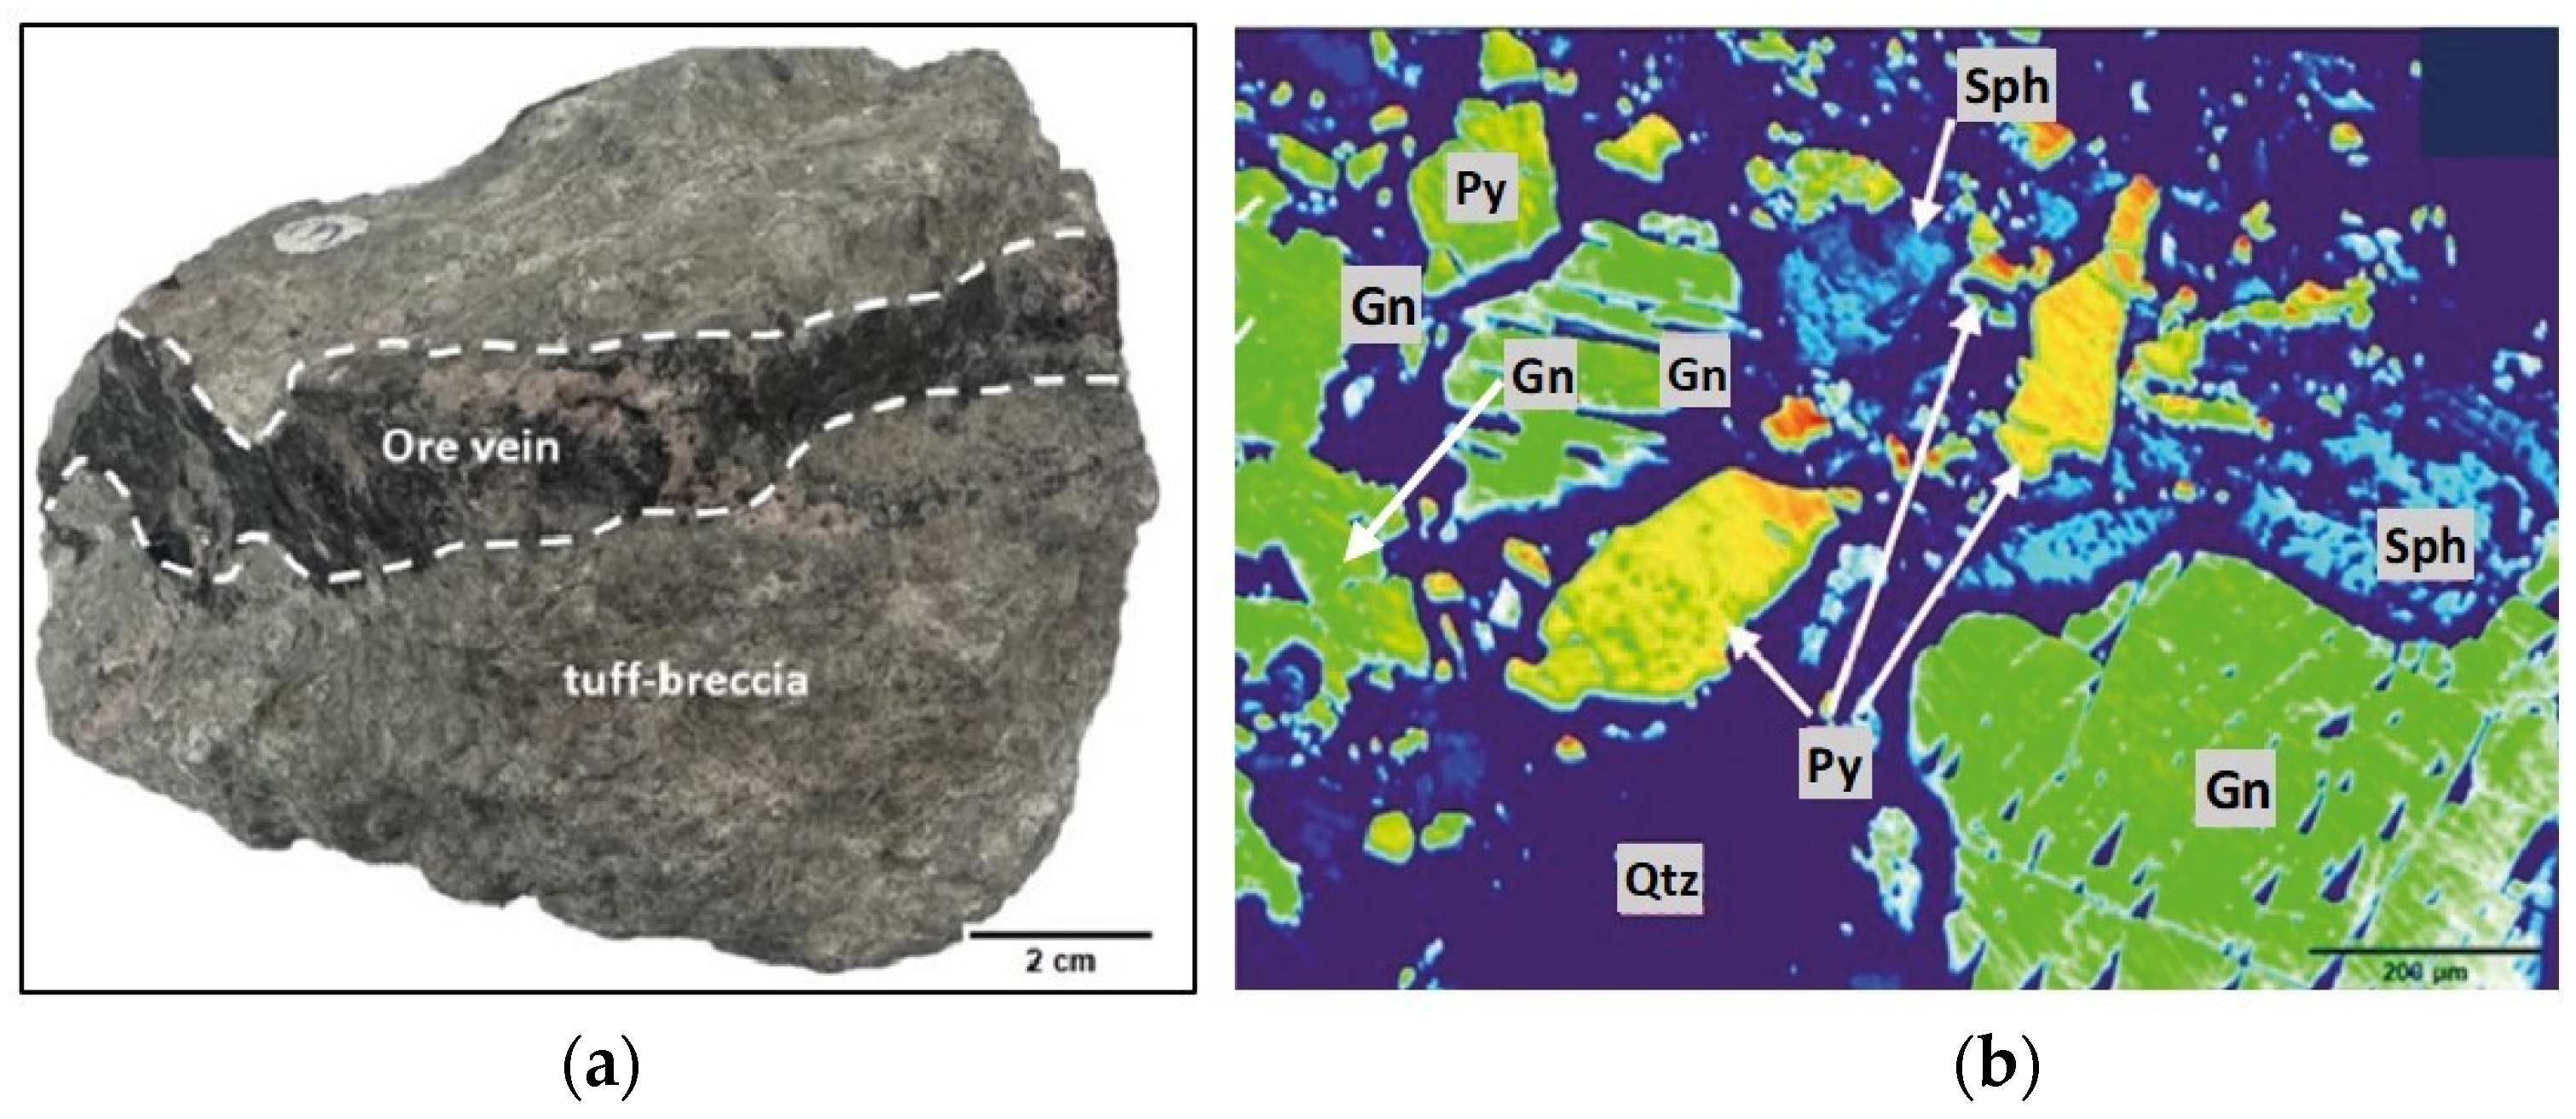
2.1. Ore Sample

Polymetallic sulfide ore samples were collected from the Pituca II mine, located in Zamora Chinchipe, Ecuador. The mineralization occurs in narrow veins, averaging 2 cm in thickness, hosted within a polymictic tuff-breccia. These veins are primarily composed of pyrite, chalcopyrite, sphalerite, galena, and quartz. TIMA (TESCAN Integrated Mineral Analyzer, TESCAN GROUP, Brno, Czech Republic) mapping indicates that the ore is predominantly composed of galena and pyrite, with minor contributions from sphalerite and chalcopyrite (Figure 1). Fire assay analysis determined average grades of 0.7 g/t for gold and 5.7 g/t for silver. According to X-ray diffraction (XRD) analysis carried out with Bruker D8 Advance equipment and interpreted with Highscore Plus software (v 5.3)., the host rock consists mainly of albite (45.4%), quartz (37.5%), phengite (8.1%), and chlorite (6.0%), with accessory phases including calcite, illite, and alkali feldspar (Figure 2).

2.2. Analysis Methods

2.2.1. Electron Microprobe Analysis

Ore composition and textural relationships were investigated with a Tescan Vega II LMU scanning electron microscope (TESCAN GROUP, Brno, Czech Republic) operated in back-scattered electron (BSE) mode and fitted with an INCA Energy 350 energy-dispersive X-ray spectrometer featuring a standard Si (Li) detector. Plane-parallel polished sections (3–4 mm thick) were prepared from representative vein samples, and a conductive carbon coating (~25–30 nm) was applied prior to analysis. This configuration enabled both high-resolution imaging of mineral associations and semi-quantitative X-ray spectral microanalysis of individual phases.

2.2.2. TESCAN Integrated Mineral Analysis

The implementation of high-speed, automated mineral analysis techniques using multiple energy-dispersive X-ray spectroscopy (EDS) detectors enables rapid and detailed characterization of mineralogical samples. Operating at high count rates, these systems provide precise quantitative data for mineral identification and facilitate a deeper understanding of intricate mineral associations and textures [14]. In this study, compositional maps were obtained using a TESCAN Mira-3 field emission scanning electron microscope (FE-SEM), (TESCAN, Brno, Czech Republic,) equipped with high brightness Schottky emitter (electron gun) (JEOL Ltd., Tokyo, Japan). A probe current of 1 pA to 200 nA and an acceleration voltage of 30 eV were used. Additionally, the Beam Deceleration Technology (BDT) enhances resolution at low beam voltage, making it ideal for imaging charge-sensitive materials.

2.2.3. Petrographic Analysis

Polished ore sections were examined with a ZEISS Primotech petrographic microscope (Carl Zeiss AG, Oberkochen, Germany) capable of both transmitted- and reflected-light illumination. The instrument’s robust, user-friendly design provided high-quality optical imaging of mineral textures and phase relationships essential for the petrographic characterization of the samples.

2.2.4. LA-ICP-MS

Elemental concentrations were quantified by laser ablation inductively coupled plasma mass spectrometry (LA-ICP-MS), a technique that provides highly sensitive, spatially resolved analysis of solid samples [15,16,17]. Measurements were carried out with a Resonetics M-050 193 nm ArF excimer laser ablation system (Resonetics LLC, Nashua, NH, USA) coupled to a quadrupole ICP-MS. Operating parameters were as follows: laser fluence = 6 J cm−2, spot diameter = 44 µm, repetition rate = 5 Hz, and ablation duration = 30 s. At a material-removal rate of ~0.15 µm pulse−1, the total ablation depth was ~22 µm, ensuring representative sampling of the analyzed phases.

2.3. Experimental Methods

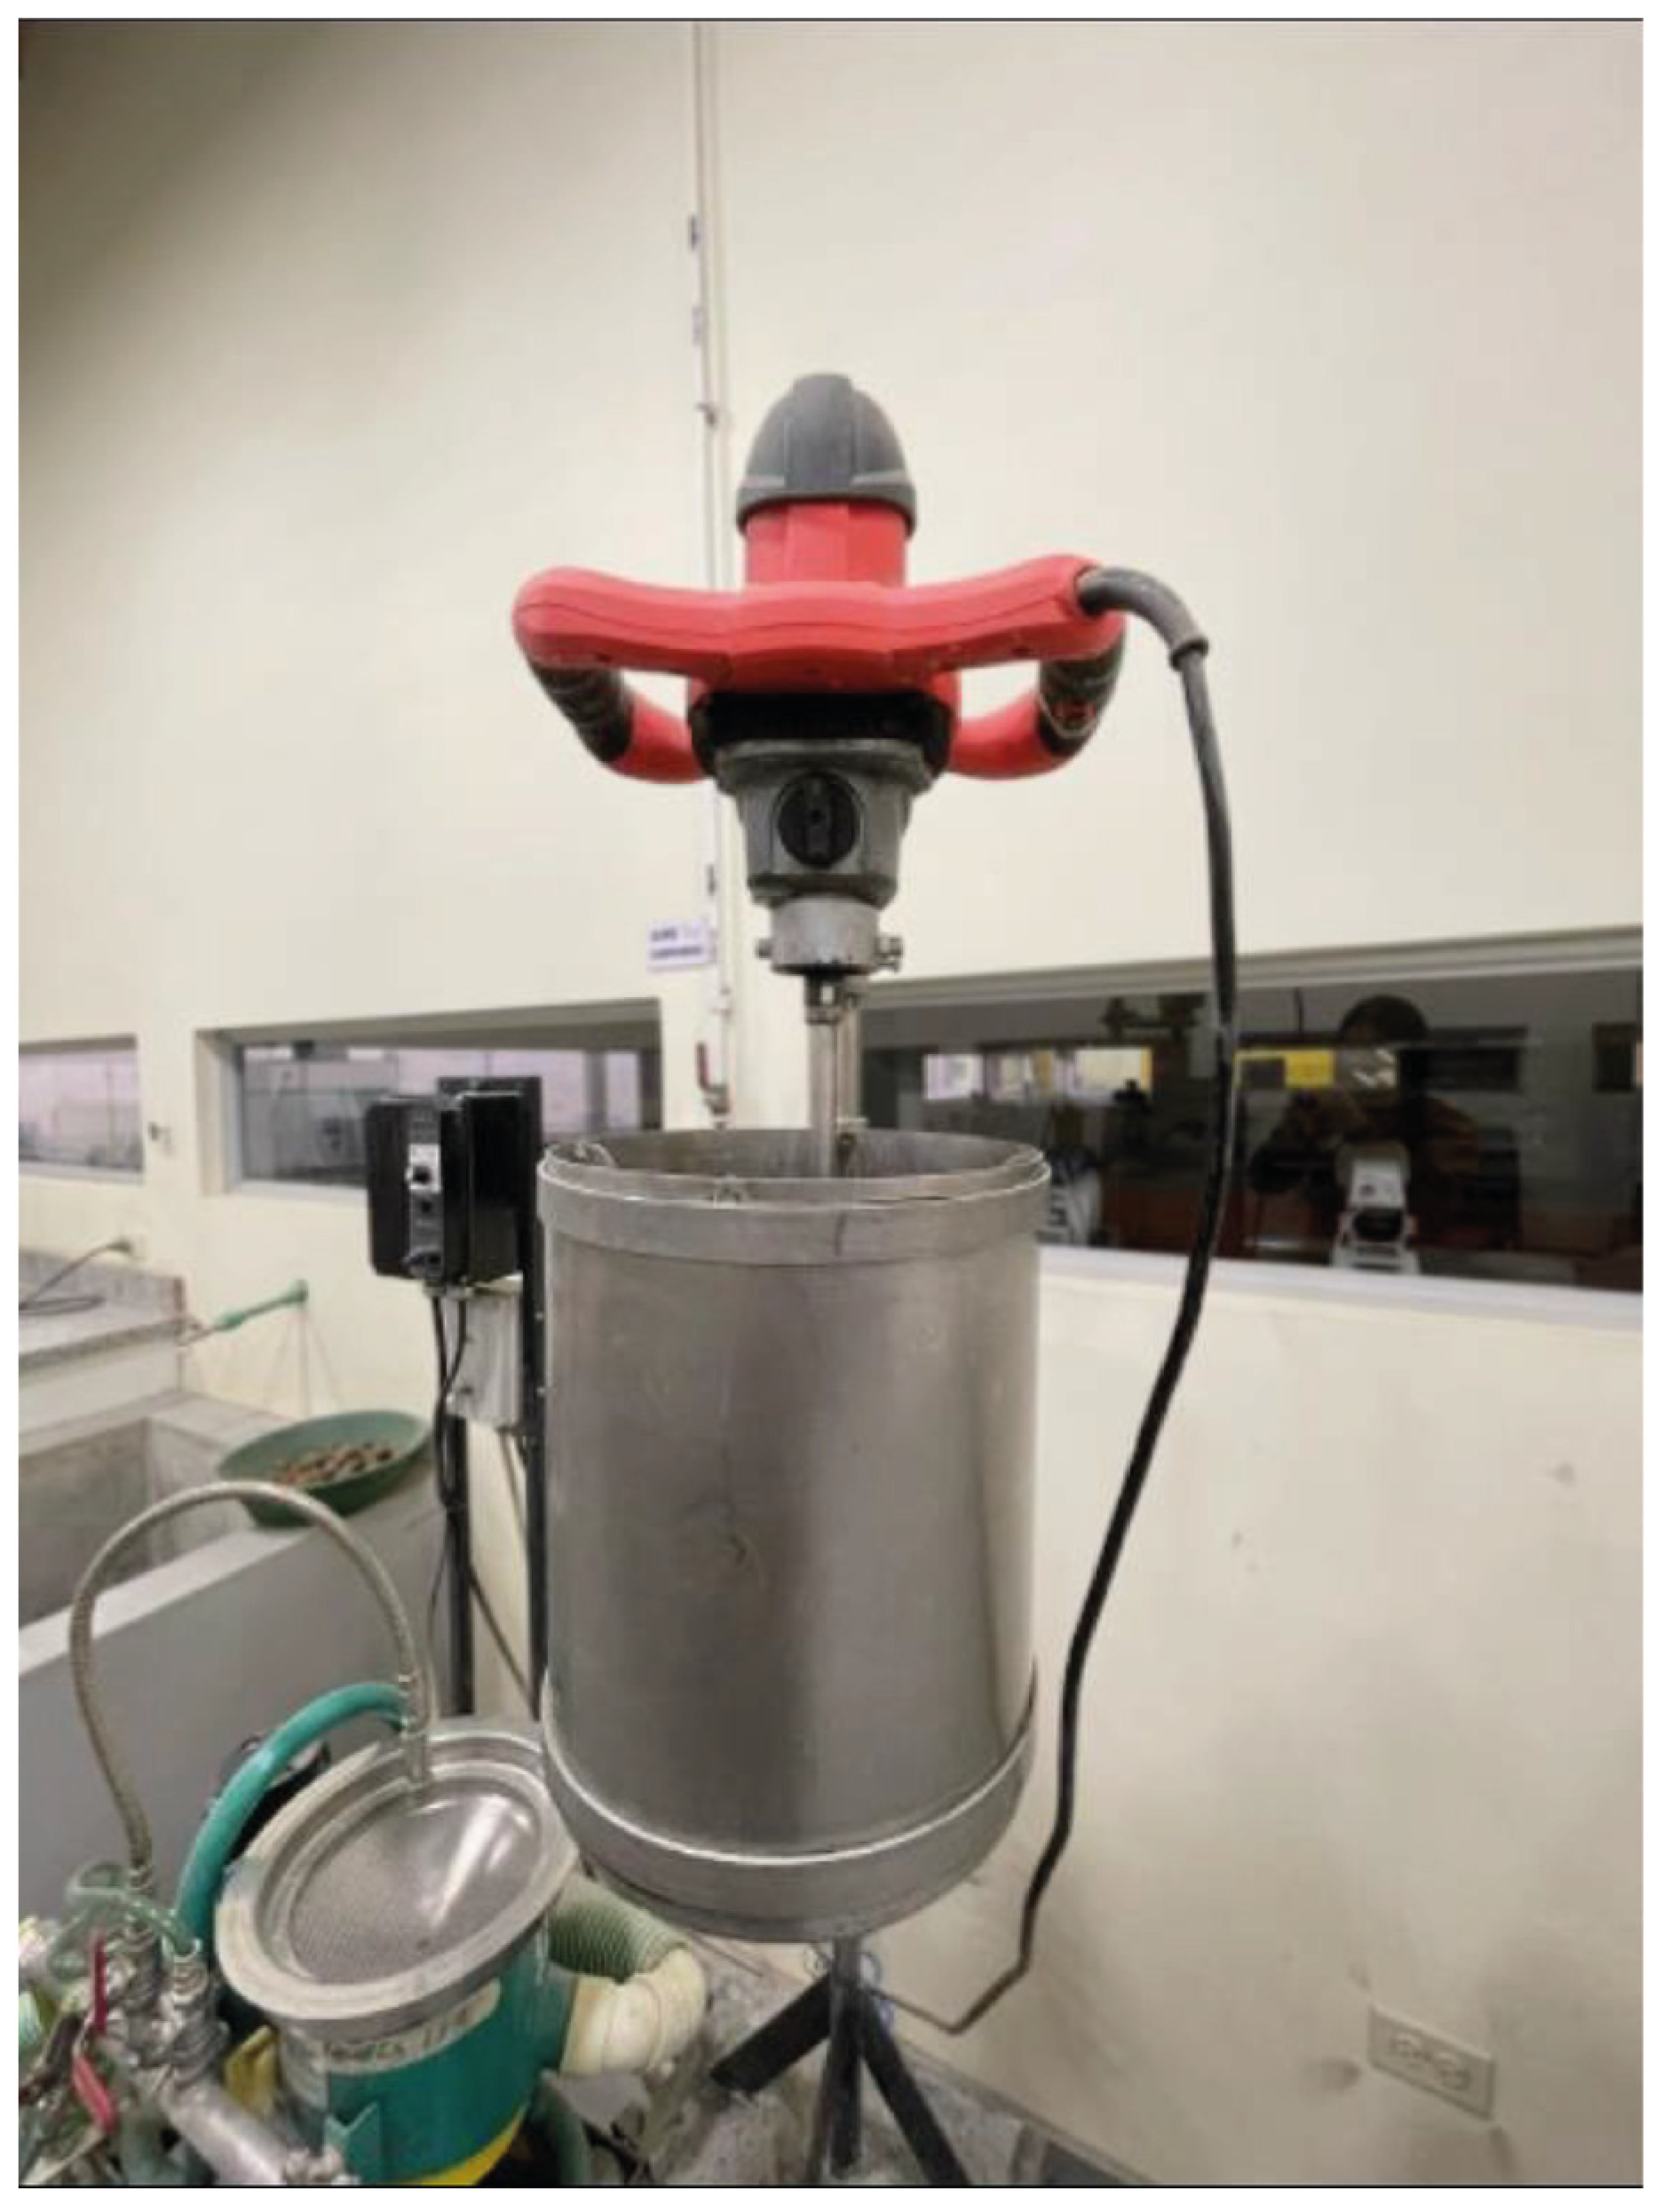
2.3.1. Grinding Tests

The ore, assaying 0.7 g t−1 Au, was subjected to laboratory grinding trials to enhance the liberation of gold encapsulated within sulfide minerals before cyanidation. Batch milling tests of 10 min and 15 min were performed in a laboratory ball mill (9.87 in × 7.2 in) driven by a ½ HP motor. The mill operated at 68 rpm (68% of critical speed) with a total grinding charge of 10.44 kg. Particle size distributions from each milling interval were subsequently analyzed to assess the extent of sulfide break-up and the corresponding liberation of fine-grained gold ahead of leaching experiments.

2.3.2. Metallurgical Tests

Gold dissolution efficiency was evaluated through mechanical agitation cyanidation leaching over a 24 h period, using sodium cyanide (NaCN) as the leaching agent. Two nominal particle sizes were tested, D80 at 100 mesh (150 µm) and 170 mesh (90 µm), with a solid-to-liquid ratio of 1:2 and a pH maintained at 10 (Figure 3). The leaching procedure involved forming a slurry by adding 1500 g of mineralized material to 3000 mL of water. The slurry was agitated using a mechanical stirrer at a speed exceeding 400 rpm, with NaCN concentrations of 1000 ppm (1 g/L). pH adjustments were made using calcium oxide (CaO) to maintain the target value throughout the test.
During the leaching process, residual cyanide concentrations were monitored as the interaction with the pulp progressed. Cyanide levels were determined by titration with silver nitrate (AgNO3), using potassium iodide (KI) as an indicator. At the conclusion of the leaching process, the final cyanide-containing solution was treated with hydrogen peroxide (H2O2) under agitation to facilitate cyanide degradation before disposal. A dosage of 2.6 mL of hydrogen peroxide per liter of cyanide solution was applied to ensure complete removal of cyanide from the solution.

3. Results

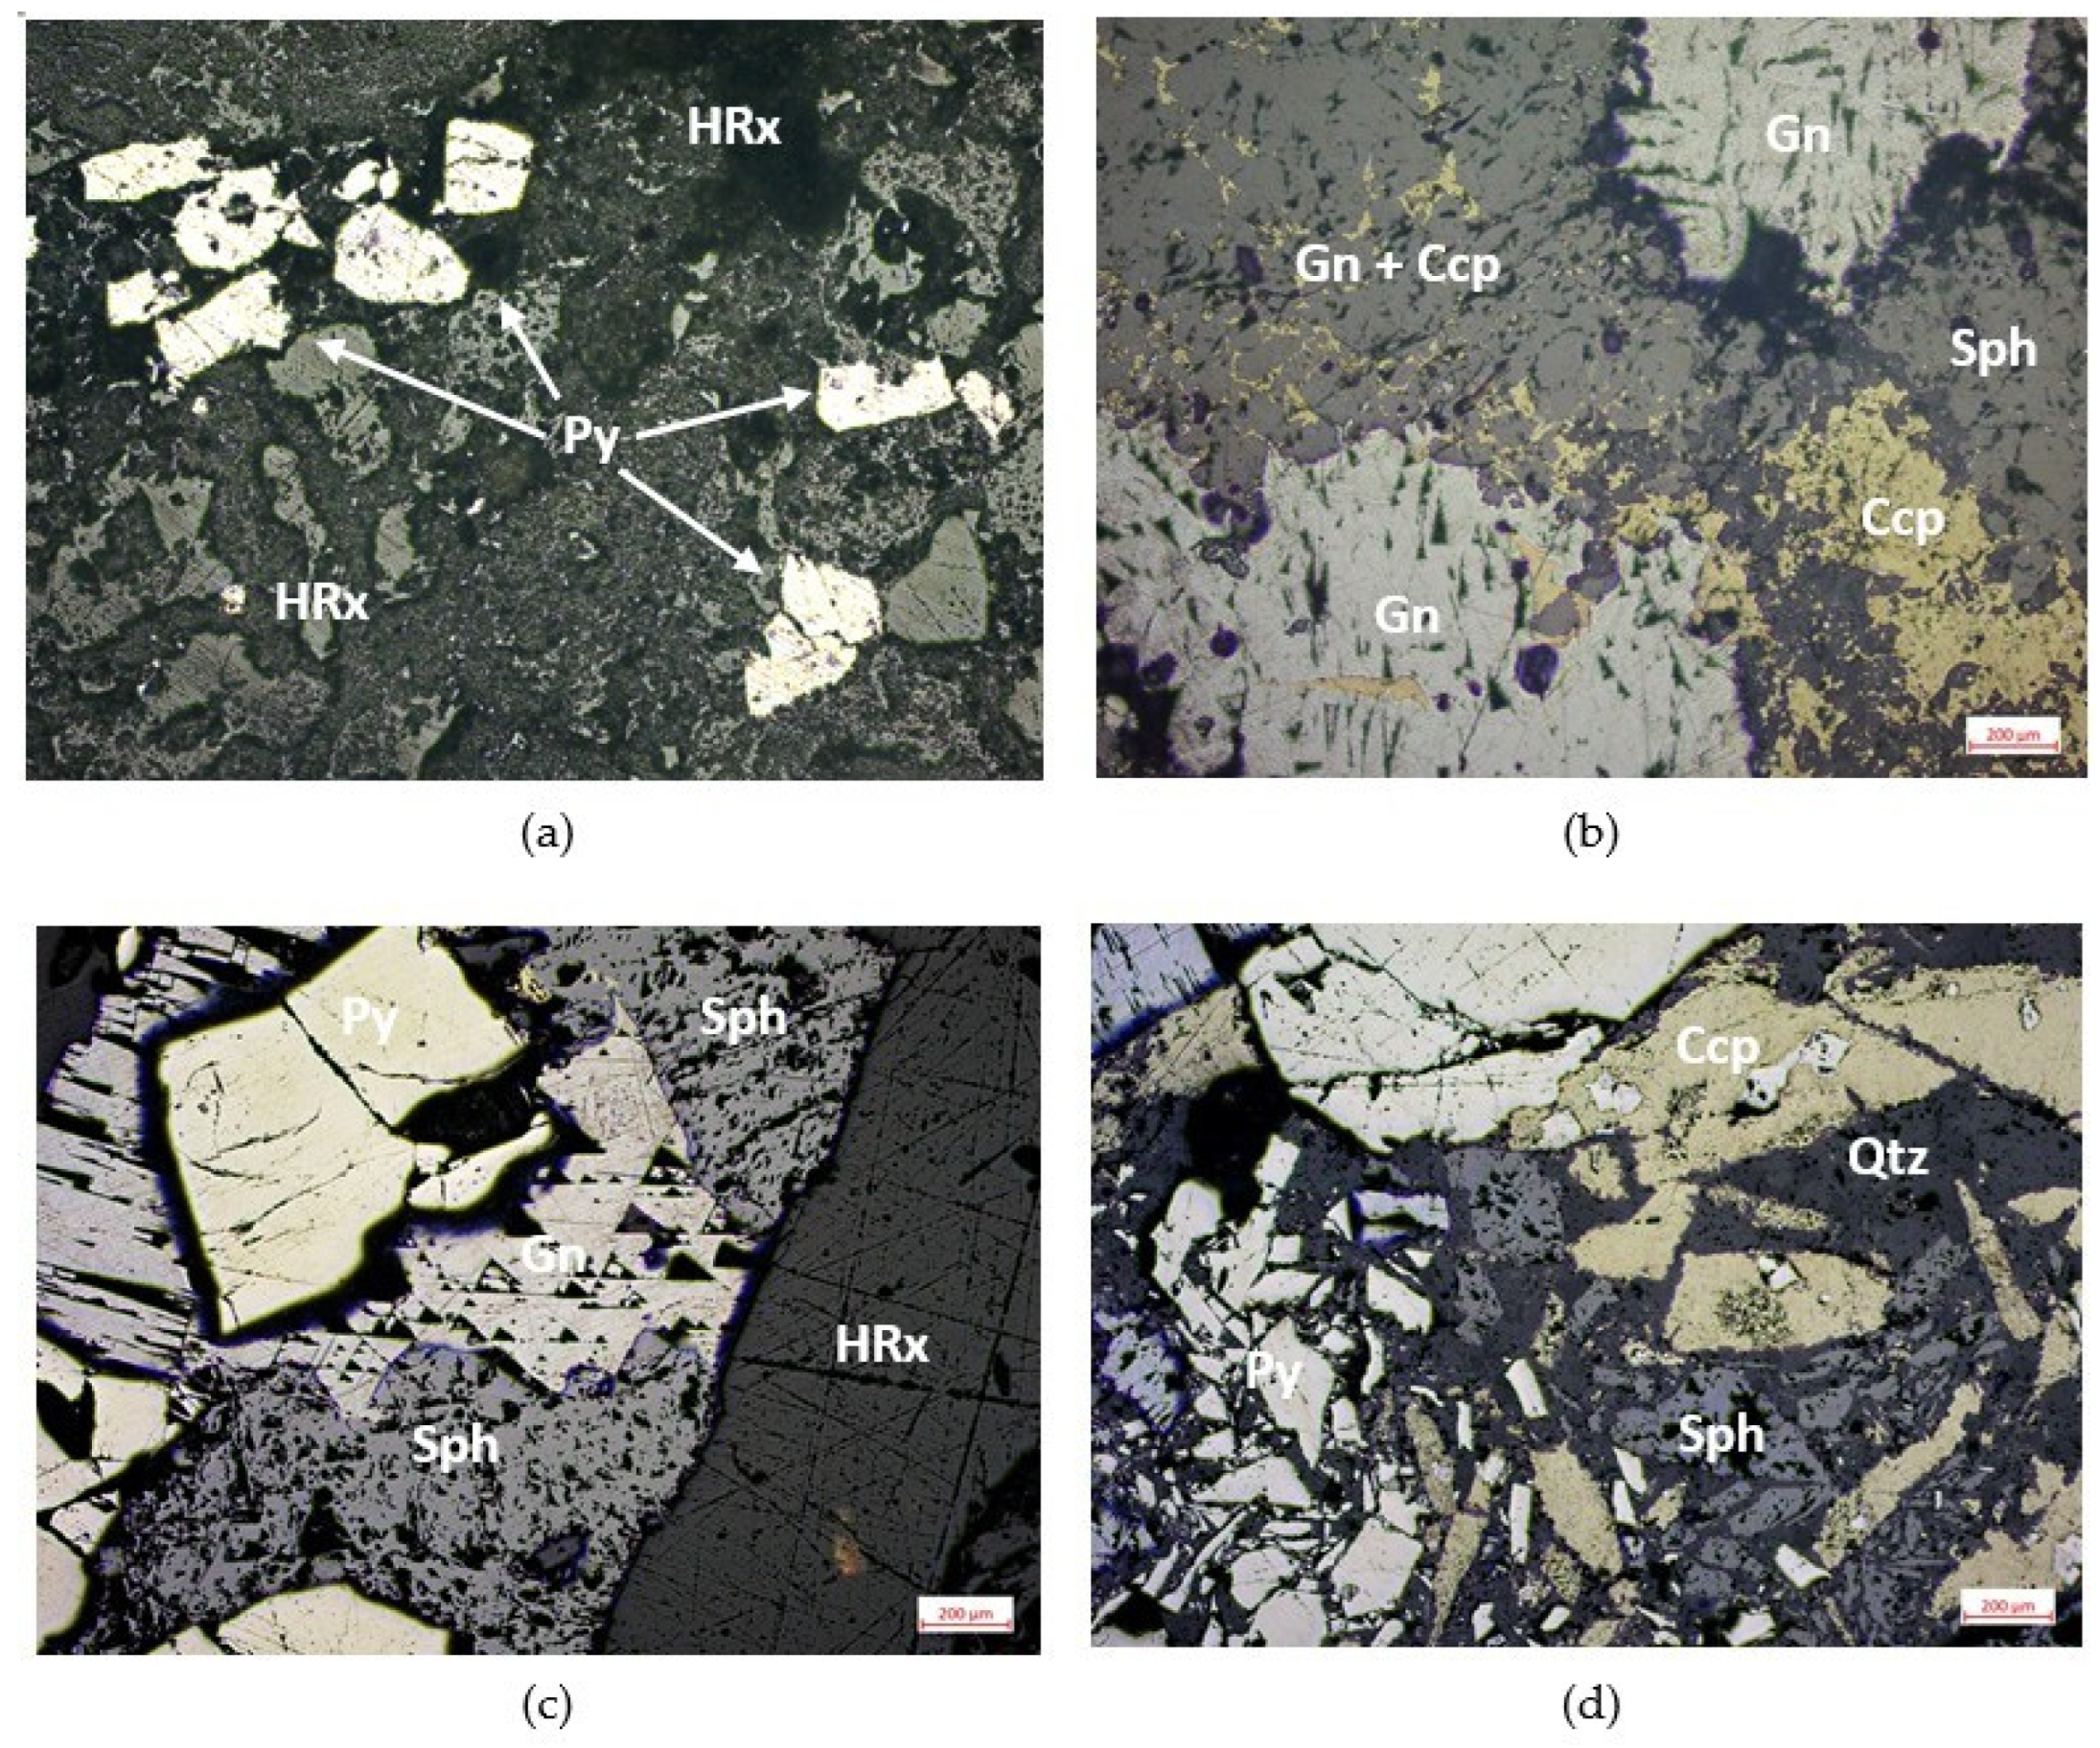
3.1. Mineralogical and Textural Characteristics of Ore
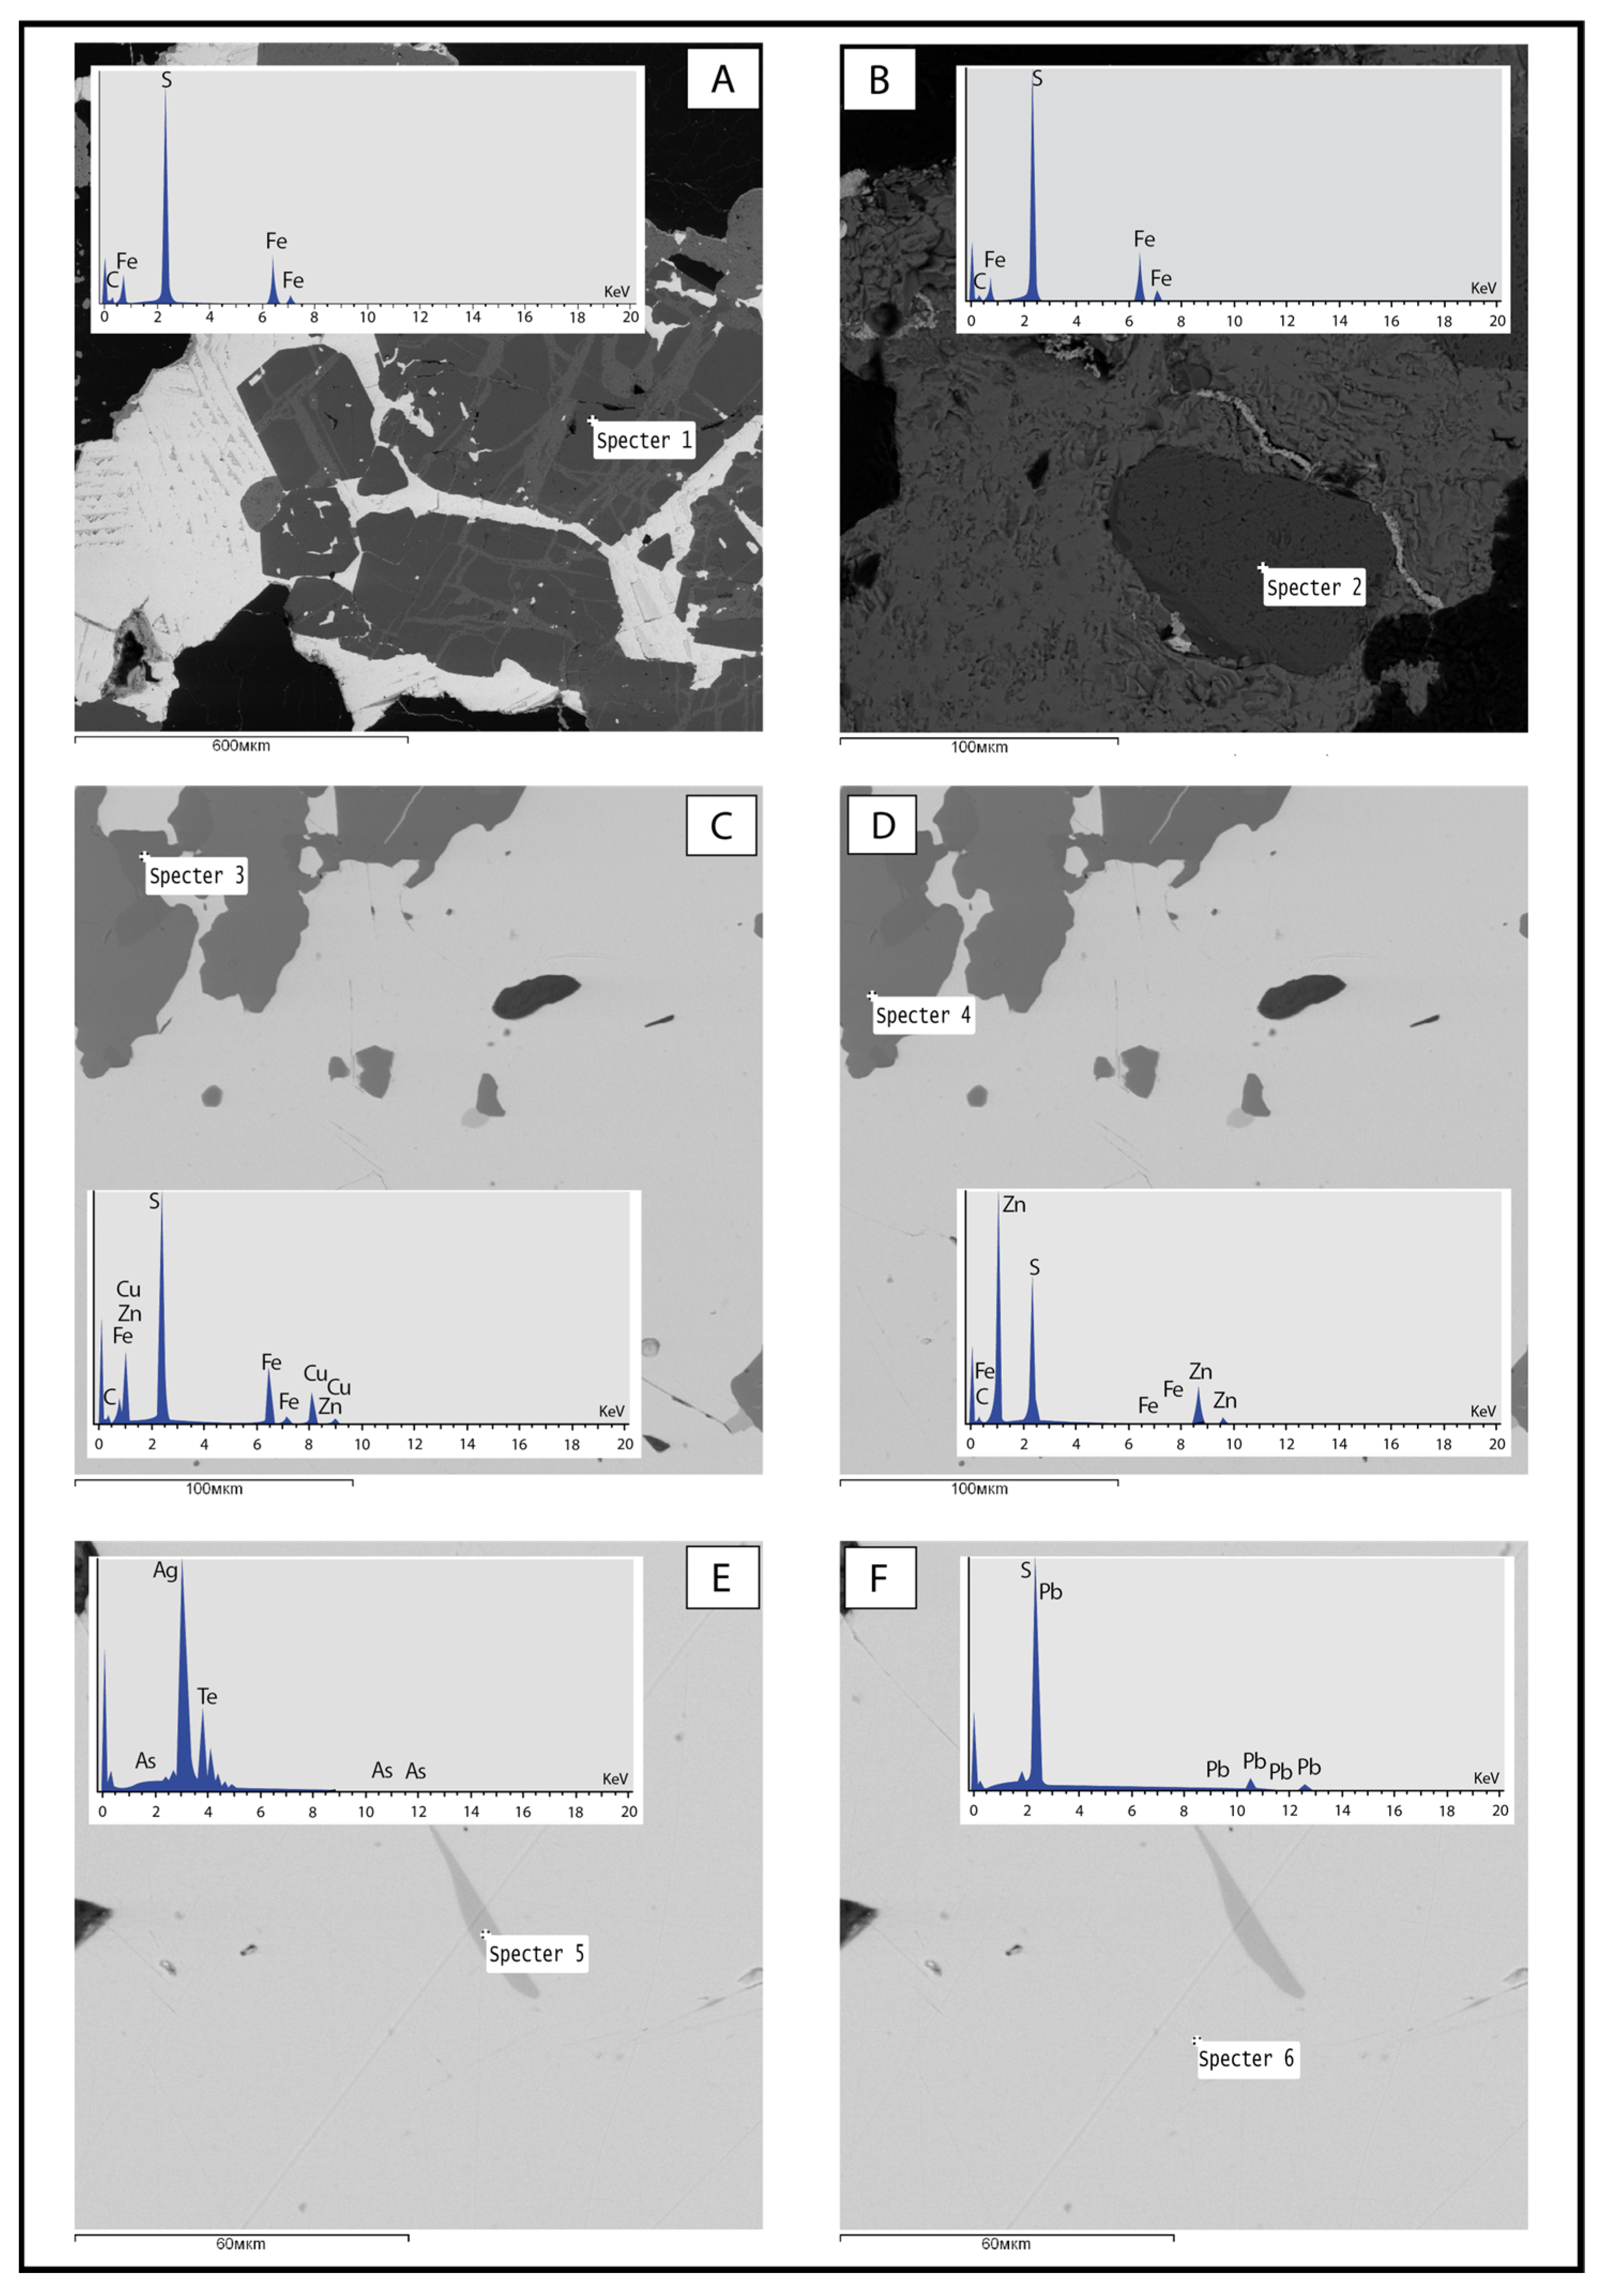
3.1.1. Pyrite

Pyrite (Py) is characterized by its high reflectivity, yellowish-white color, and tendency to form idiomorphic crystals with well-defined edges under the microscope. In the ore, most pyrite grains are either coated by other sulfides or granularly disseminated throughout the host rock (Figure 4). A portion of the pyrite forms close associations with other metallic minerals, either as symbiotic aggregates or encapsulating them. The disseminated pyrite grains in this polymetallic gold ore typically range in size from 20 to 400 µm. The Fe/S ratio of the pyrite is 0.87, which is nearly identical to the ideal ratio of 0.88. Although pyrite is not the predominant metallic mineral in the ore, it plays a critical role in gold encapsulation, with most gold particles being enclosed within pyrite grains.

3.1.2. Chalcopyrite and Sphalerite

Copper (Cu) was identified in the ore as chalcopyrite (Ccp), while zinc (Zn) was found as sphalerite. Chalcopyrite is distinguished by its intense yellow color and high characteristic reflectivity. It commonly occurs in close association with sphalerite, often forming exsolution textures, where chalcopyrite (the minority phase) is observed growing within sphalerite (the majority phase). Microscopically, the most prevalent textures of chalcopyrite and sphalerite are disseminated, massive, and breccia-like, with chalcopyrite occasionally penetrating along sulfide fissures to form vein-like structures (Figure 3). Both minerals occur as allotriomorphic grains with irregular shapes, ranging in size from 5 to 300 µm (Figure 4). As summarized in Table 1, the mass ratio of Fe/Cu/S is 1:0.88:1, and Zn/S is 2.04, closely matching the ideal ratios for chalcopyrite and sphalerite (1:0.87:1; 2.04). However, sphalerite contains trace amounts of iron (Fe2⁺) that partially replace zinc (Zn2⁺), while chalcopyrite is zinc-bearing, with an approximate content of 0.71 wt% Zn.

3.1.3. Galena

Galena (Gn) is represented by anhedral crystals, with particle sizes ranging from 50 to 400 µm. Under the microscope, it exhibits a whitish-gray color, low relative hardness, isotropy, and high reflectance. Distinct dark triangular shapes, often referred to as triangular pits, are observed, which are a result of the polishing process (Figure 4). Galena typically displays a disseminated microtexture, transitioning gradually to a more massive texture. The mass ratio of Pb/S is 6.45, which closely matches the ideal ratio for galena (6.46) (Table 1). The presence of galena is economically significant, as scanning electron microscope (SEM) analysis reveals that it contains silver-bearing nanoparticles and is associated with tellurium (Te) in the form of hessite (Figure 5). Additionally, some gold particles are observed to be encapsulated by galena, further influencing the gold recovery process.

3.2. Analysis of Refractory Particles Gold Ore

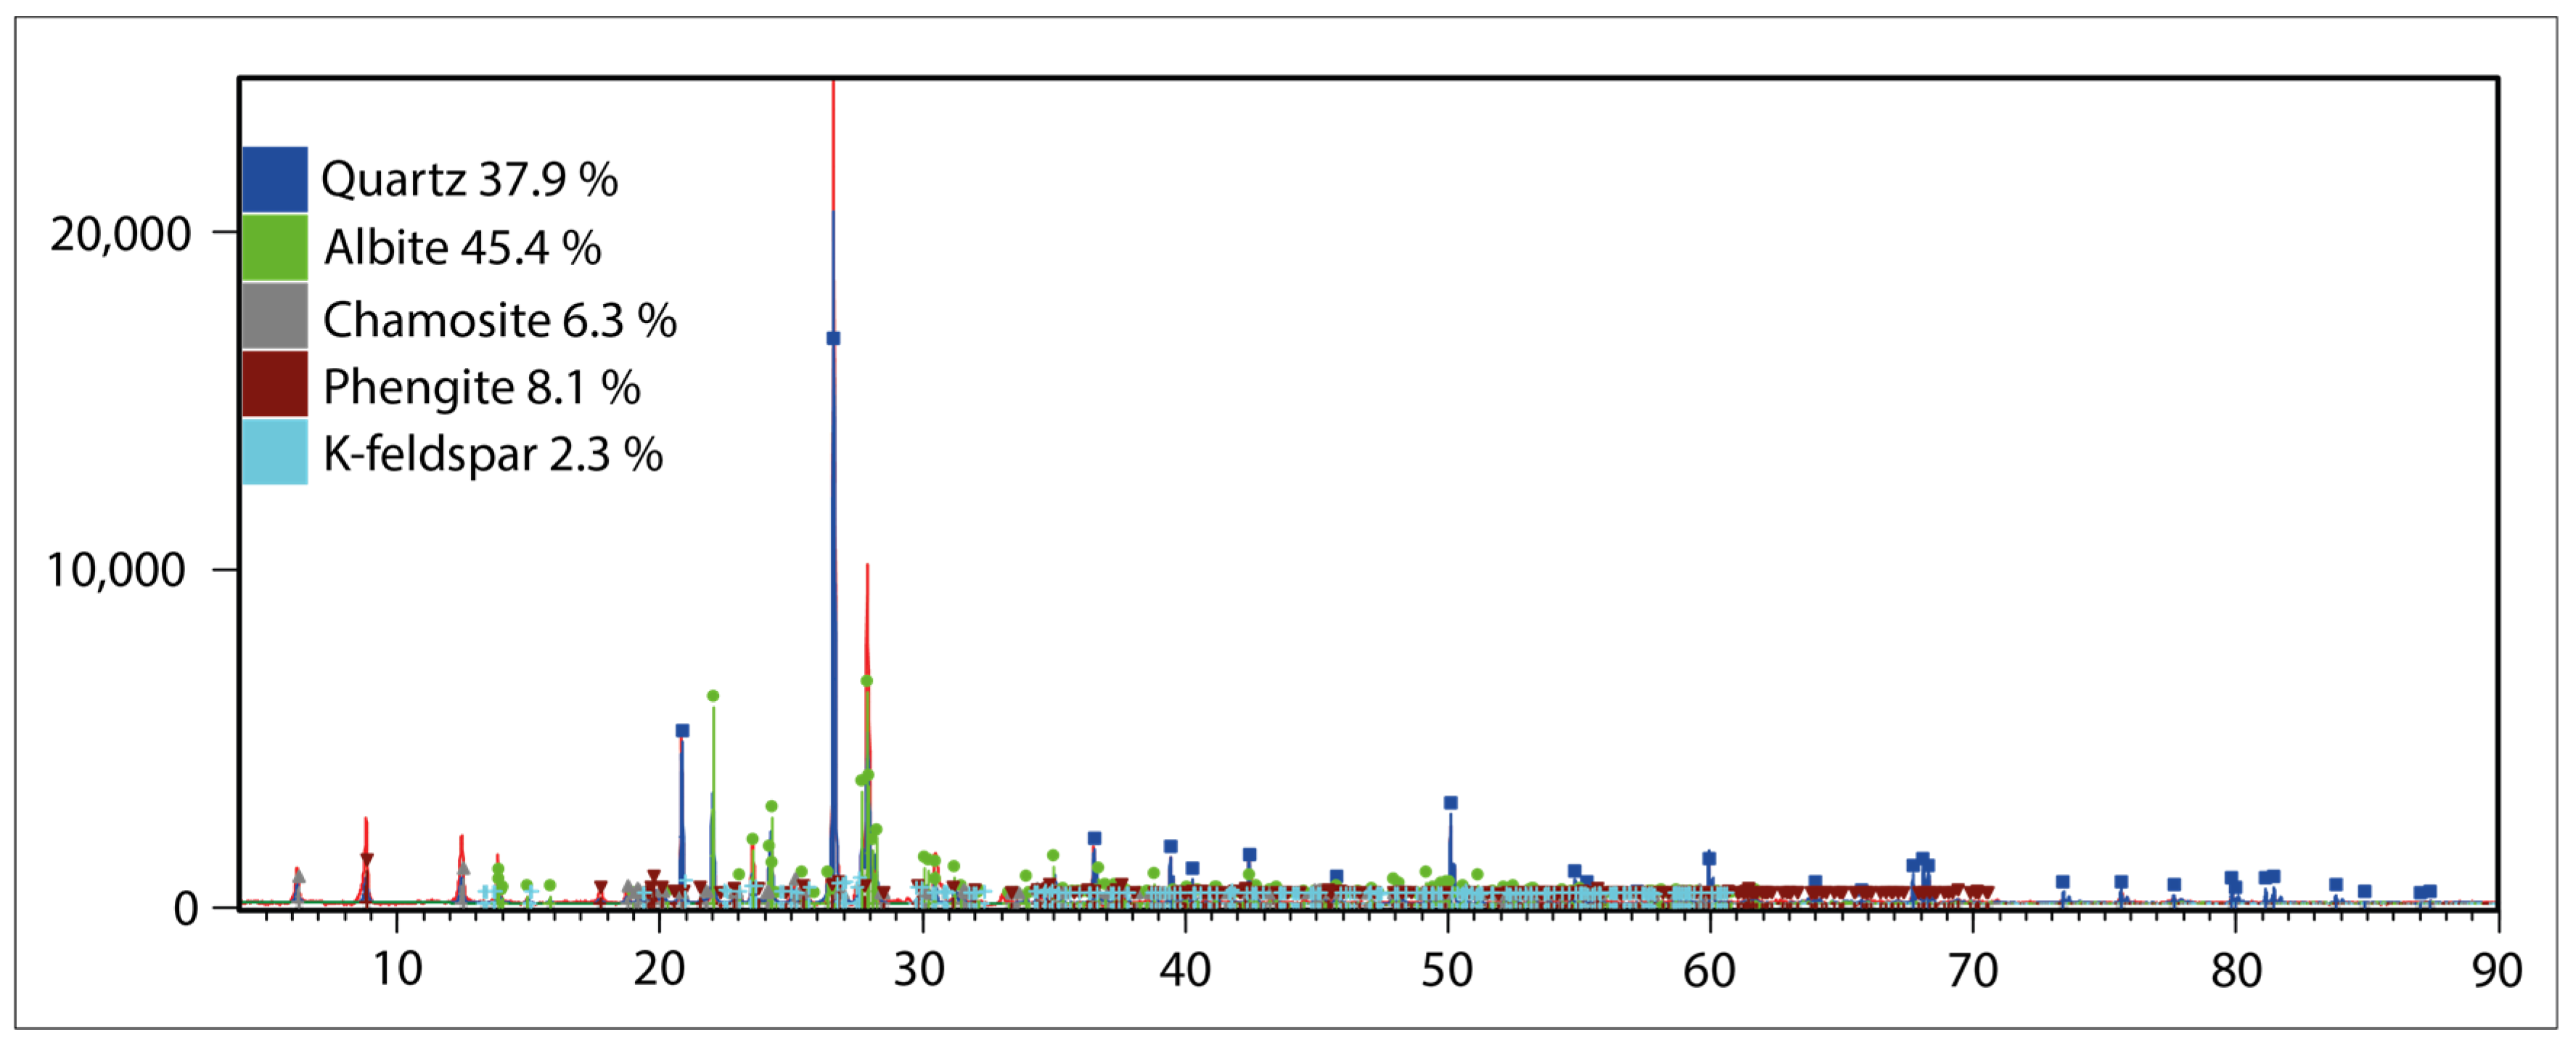
3.2.1. Characterization Before Grinding

Gold (Au) microparticles, observed under the reflected light microscope, are shown in Figure 5. These particles exhibit high reflectance, a metallic luster, a golden yellow color, and striations that result from the polishing process due to the low hardness of gold. The gold grains range in size from several micrometers to approximately 40 µm, with irregular shapes and sharp edges. Notably, 70%–80% of the gold particles are intimately intergrown with pyrite, while the remainder occurs as fracture fillings within the sulfide mineral (Figure 6). A minor proportion of gold particles was also found in association with galena (Figure 6). Statistical analysis of gold occurrences suggests that approximately 25% of the gold is completely wrapped by sulfides, while 75% is semi-wrapped. Elemental mapping via LA-ICP-MS (laser ablation inductively coupled plasma mass spectrometry) further reveals the dispersion of gold microparticles within the sulfide matrix, showing a progressive enrichment of gold toward the core of each microparticle (Figure 6).

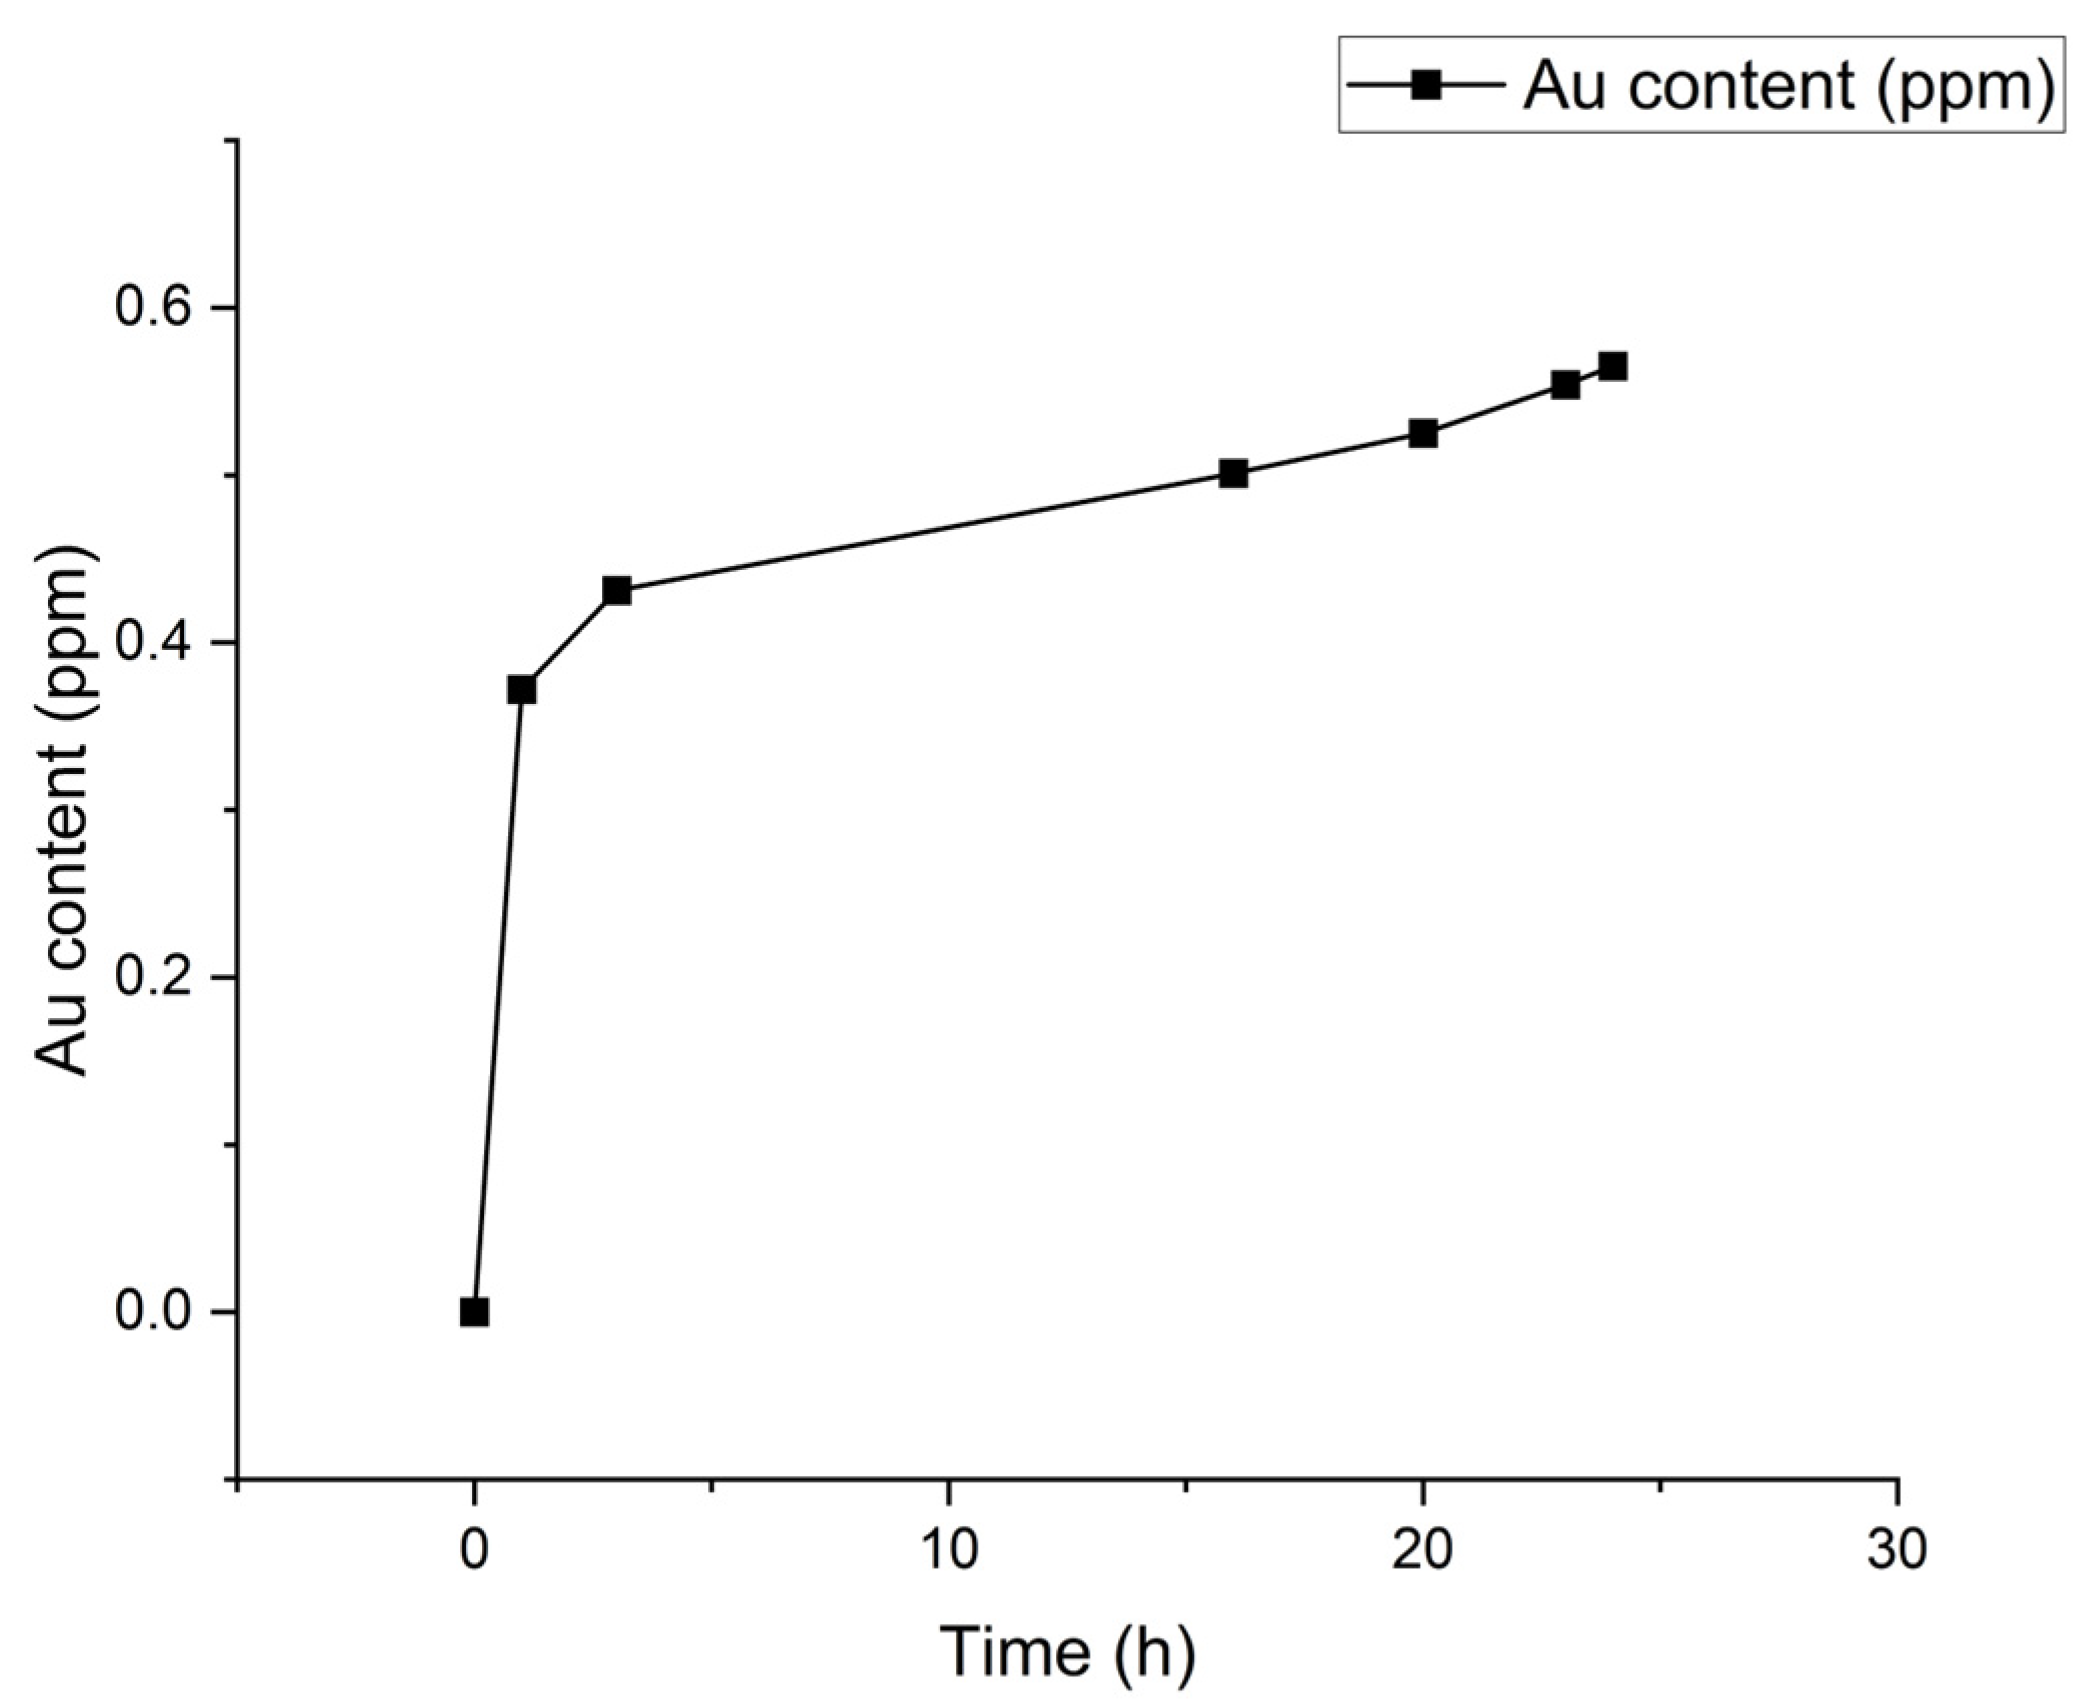
3.2.2. Cyanidation Leaching Test

Upon completion of the milling tests, the following particle size distributions were observed: after 10 min of milling, the material reached a D80 (particle size at which 80% of the material passes) corresponding to 100 mesh. In contrast, with 15 min of milling, the D80 was achieved at 170 mesh (Figure 7).
As mentioned earlier, two nominal particle sizes were evaluated as operating parameters (Table 2 and Table 3). After a 10 min grinding time, the material achieved a D80 corresponding to 100 mesh, approximately 150 µm. Similarly, leaching performance with sodium cyanide (NaCN) was assessed for the material with a D80 of 170 mesh (90 µm).
Figure 8 illustrates the gold leaching kinetics for an ore with particle size distribution characterized by D80 = 90 μm. The experimental data reveal kinetic behavior that conforms to an ascending exponential function, corresponding to a first-order model. Kinetic analysis yielded a specific rate constant k = 0.21 h−1, indicating progressive and efficient gold dissolution under the established operational conditions.
In order to ensure consistent leaching conditions, the concentration of free cyanide in solution was determined by titration using silver nitrate (AgNO3) with potassium iodide (KI) as the indicator. This procedure was conducted with two main objectives: (i) to verify that the initial cyanide concentration remained close to the nominal value of 1 g/L throughout the process (Table 4), and (ii) to quantify the residual cyanide at the end of the leaching stage as a basis for assessing detoxification strategies.

4. Discussion

In the Pituca II deposit, most gold is encapsulated within pyrite and galena. The observed textures record remobilization of primary chemical zoning and the subsequent formation of secondary inclusions, such as gold–telluride microparticles coating or permeating galena. Recent studies indicate that this enrichment is driven by polymetallic melts rich in low-melting-point chalcophile elements (LCMEs) that segregate in the presence of hydrothermal fluids [16,17,18]. Gold displays a strong affinity for pyrite, where it is trapped as sub-micron particles within lattice defects and growth zones. Silver, by contrast, is predominantly hosted as sub-micron inclusions of argentiferous tellurides in galena. These findings agree with Zhang et al. [19], who showed that “barren” sphalerite domains are essentially free of Au and Ag, reinforcing the view that sphalerite is not a significant host for structurally bound silver in hydrothermal systems.
Metallurgical testing showed that the finer grind delivered markedly better performance: at D80 = 170 mesh (90 µm) the gold recovery reached 81.2%, whereas at D80 = 100 mesh (150 µm) it was limited to 72.2%. These results parallel those reported by Guerrero [20], who investigated a geologically distinct but mineralogically comparable refractory ore and obtained a maximum recovery of 71.9% at D80 = 200 mesh (75 µm). Likewise, Crundwell [21] observed progressively higher cyanide-leach recoveries for ores of varying refractoriness including pyrite and chalcopyrite-rich samples as particle size decreased. Collectively, these data reinforce the critical role of fine grinding in liberating gold encapsulated within sulfide matrices and enhancing cyanidation efficiency. In order to ensure consistent leaching conditions, the concentration of free cyanide in solution was determined by titration using silver nitrate (AgNO3) with potassium iodide (KI) as the indicator. This procedure was conducted with two main objectives: to verify that the initial cyanide concentration remained close to the nominal value of 1 g/L throughout the process (Table 4), and to quantify the residual cyanide at the end of the leaching stage as a basis for assessing detoxification strategies.
The data obtained in this investigation demonstrate that reducing particle size from D80 = 150 µm to D80 = 90 µm significantly enhances gold dissolution kinetics. This enhancement can be attributed to the increase in specific surface area, which facilitates the diffusion of cyanide and oxygen to the metallic gold interface. The adherence to a first-order kinetic model substantiates this mechanistic behavior. Although comparative kinetic curves for other particle size distributions were not presented, the marked improvement in both dissolution kinetics and recovery efficiency following comminution (81.2% Au recovery) strongly corroborates the inverse relationship between particle size and the requisite time to achieve maximum gold concentration in solution. For subsequent investigations, it is recommended to conduct differentiated kinetic tests by screen fraction to quantitatively characterize this correlation with greater precision and statistical significance.
Mineralogical analysis, based on microscopic observations of polished sections, reveals that pyrite represents approximately 5%–10% of the material, with the remainder consisting of gangue minerals. No free gold particles were identified, confirming its presence in a refractory state. This is attributed to the fact that gold is associated with sulfide phases—mainly pyrite—and encapsulated in them, limiting its exposure to the leachant. The particle size distribution further indicates a significant proportion of gold in fine fractions, with a notable accumulation at the #200 mesh after 15 min of grinding (D80 = 90 µm). Although this particle size improves surface exposure, it is still insufficient to completely liberate finely disseminated or submicroscopic gold locked in sulfides. Consequently, cyanidation efficiency is directly influenced by the mineralogical association of the gold, where partial encapsulation in sulfides constitutes a diffusional barrier. Despite adequate milling, part of the gold remains inaccessible, which explains the disparity between actual recovery and theoretical extraction.
Given that gold recovery through cyanidation was moderate (72.22%–81.2%) and mineralogical characterization confirmed its occurrence in a refractory state, primarily associated with pyrite, it is inferred that partial encapsulation of gold limits its dissolution in the leaching solution. In this context, the technical literature supports the application of oxidative pretreatment strategies to break down the sulfide matrix and enhance gold exposure. Oxidative roasting has shown effective results in ores with similar characteristics, although its implementation requires appropriate environmental controls due to the release of gases such as SO2 [3]. Alternatively, bio-oxidation emerges as a particularly viable option for smaller-scale operations like Pituca II, due to its lower technological demands and minimal environmental impact [22]. Although pressure oxidation (POX) is highly effective, its technical complexity and high capital costs make it less suitable for tailings with limited infrastructure [23]. These considerations underscore the importance of future studies assessing appropriate pretreatment methods aimed at maximizing gold recovery from refractory materials such as those found at Pituca II.

5. Conclusions

The Pituca II ore averages 0.7 g t−1 Au and 5.7 g t−1 Ag. Its principal sulfide minerals are pyrite, galena, chalcopyrite, and sphalerite, with hessite occurring as an accessory phase. Gold is present as sub-microscopic particles (<40 µm); textural statistics show that 75% of these particles are semi-encapsulated, while the remaining 25% are completely enclosed within sulfides. Pyrite and galena constitute the primary gold hosts. Although ultra-fine grinding would further enhance liberation, even moderate size reduction significantly improves cyanidation performance. Twenty-four-hour mechanical-agitation leaching tests demonstrate that reducing the grind from D80 = 150 µm (100 mesh) to D80 = 90 µm (170 mesh) raises gold recovery from 72.2% to 81.2%. These results underscore particle size control as a key lever for maximizing leach efficiency and overall metal extraction.

Author Contributions

Conceptualization, S.J.N.J.; Methodology, S.J.N.J.; Validation, S.J.N.J.; Data curation, R.E.G.Z.; Writing—original draft, S.J.N.J.; Writing—review & editing, R.E.G.Z.; Visualization, R.E.G.Z. All authors have read and agreed to the published version of the manuscript.

Funding

This research was funded by Universidad Técnica Particular de Loja (UTPL).

Data Availability Statement

The original contributions presented in this study are included in the article. Further inquiries can be directed to the corresponding author. The raw data supporting the conclusions of this article will be made available by the authors on request.

Conflicts of Interest

The authors declare no conflict of interest.

References

  1. Bazan, V.; Lara, R.; Brandalez, E. Characterization of gold refractory minerals. XIV Argen. Min. Treat. Conf. 2018, 210, 123–133. [Google Scholar]
  2. Yang, W.; Wang, Q.; Wang, Y.; Long, T.; Deng, S. Effects of Pyrite, Quartz and Sodium Sulfite on Roasting of a Refractory Sulfide Concentrate and Gold, Silver, Copper Leaching during Cyanidation. Hydrometallurgy 2024, 226, 106306. [Google Scholar] [CrossRef]
  3. Qin, H.; Guo, X.; Tian, Q.; Yu, D.; Zhang, L. Recovery of Gold from Sulfide Refractory Gold Ore: Oxidation Roasting Pretreatment and Gold Extraction. Miner. Eng. 2021, 164, 106822. [Google Scholar] [CrossRef]
  4. Zhang, S.-H.; Zheng, Y.-J.; Cao, P.; Li, C.-H.; Lai, S.-Z.; Wang, X. Process Mineralogy Characteristics of Acid Leaching Residue Produced in Low-Temperature Roasting-Acid Leaching Pretreatment Process of Refractory Gold Concentrates. Int. J. Miner. Metall. Mater. 2018, 25, 1132–1139. [Google Scholar] [CrossRef]
  5. Barbouchi, A.; Louarrat, M.; Mikali, M.; Barfoud, L.; El Alaoui-Chrifi, M.A.; Faqir, H.; Benzakour, I.; Idouhli, R.; Khadiri, M.-E.; Benzakour, J. Advancements in Improving Gold Recovery from Refractory Gold Ores/Concentrates: A Review. Can. Metall. Q. 2024, 63, 1–18. [Google Scholar] [CrossRef]
  6. Kargar, A.; Mohammadnejad, S. The Cyanidation of Sub Microscopic Gold: An Experimental and Molecular Modeling Study. Hydrometallurgy 2023, 222, 106177. [Google Scholar] [CrossRef]
  7. Cao, P.; Zhang, S.; Zheng, Y.; Lai, S.; Liang, G.; Wang, X.; Tan, B. Identification of Elements Hindering Gold Leaching from Gold-Bearing Dust and Selection of Gold Extraction Process. Hydrometallurgy 2021, 202, 105612. [Google Scholar] [CrossRef]
  8. Agorhom, E.A.; Skinner, W.; Zanin, M. Influence of Gold Mineralogy on Its Flotation Recovery in a Porphyry Copper-Gold Ore. Chem. Eng. Sci. 2013, 99, 127–138. [Google Scholar] [CrossRef]
  9. Goodall, W.R.; Scales, P.J.; Butcher, A.R. The Use of QEMSCAN and Diagnostic Leaching in the Characterisation of Visible Gold in Complex Ores. Miner. Eng. 2005, 18, 877–886. [Google Scholar] [CrossRef]
  10. Nazari, A.; Ghahreman, A.; Bell, S. A Comparative Study of Gold Refractoriness by the Application of QEMSCAN and Diagnostic Leach Process. Int. J. Miner. Process. 2017, 169, 35–46. [Google Scholar] [CrossRef]
  11. Li, J.; Yang, H.; Zhao, R.; Tong, L.; Chen, Q. Mineralogical Characteristics and Recovery Process Optimization Analysis of a Refractory Gold Ore with Gold Particles Mainly Encapsulated in Pyrite and Arsenopyrite. Geochemistry 2023, 83, 125945. [Google Scholar] [CrossRef]
  12. Li, J.; Yang, H.; Tong, L.; Sand, W. Some Aspects of Industrial Heap Bioleaching Technology: From Basics to Practice. Miner. Process. Extr. Metall. Rev. 2022, 43, 510–528. [Google Scholar] [CrossRef]
  13. González, D. Evaluation of the Processes in the “PITUCA II” Gold Ore Recovery Plant in the Zamora Sector. Bachelor’s Thesis, Universidad Técnica Particular de Loja, Loja, Ecuador, 2016. [Google Scholar]
  14. Hrstka, T.; Gottlieb, P.; Skála, R.; Breiter, K.; Motl, D. Automated Mineralogy and Petrology–Applications of TESCAN Integrated Mineral Analyzer (TIMA). J. Geosci. 2018, 63, 47–63. [Google Scholar] [CrossRef]
  15. Hastie, E.C.G.; Kontak, D.J.; Lafrance, B. Gold Remobilization: Insights from Gold Deposits in the Archean Swayze Greenstone Belt, Abitibi Subprovince, Canada. Econ. Geol. 2020, 115, 241–277. [Google Scholar] [CrossRef]
  16. Hastie, E.C.G.; Schindler, M.; Kontak, D.J.; Lafrance, B. Transport and Coarsening of Gold Nanoparticles in an Orogenic Deposit by Dissolution–Reprecipitation and Ostwald Ripening. Commun. Earth Environ. 2021, 2, 57. [Google Scholar] [CrossRef]
  17. Lin, J.; Liu, Y.; Yang, Y.; Hu, Z. Calibration and Correction of LA-ICP-MS and LA-MC-ICP-MS Analyses for Element Contents and Isotopic Ratios. Geosci. Front. 2016, 7, 789–796. [Google Scholar] [CrossRef]
  18. Zhang, Y.; Zhen, S.; Wang, D.; Liu, J.; Wang, J.; Zha, Z.; Bai, H. In Situ Trace Elements and Sulfur Isotopes of Sulfides in the Dabaiyang Te-Au Deposit, Hebei Province, China: Implications for Au Remobilization from Pyrite. Ore Geol. Rev. 2022, 140, 104626. [Google Scholar] [CrossRef]
  19. Zhang, H.; Qian, G.; Zhou, F.; Cai, Y.; Pring, A. Enrichment of Precious Metals Associated with Chalcopyrite Inclusions in Sphalerite and Pyrite. Am. Mineral. 2024, 109, 150–156. [Google Scholar] [CrossRef]
  20. Guerrero, J. Characterization and Intensive Cyanidation Tests of Mineral Samples with Gold Content from the Ponce Enríquez Mining District—Ecuador. Undergraduate Thesis, Escuela Superior Politécnica del Litoral (ESPOL), Guayaquil, Ecuador, 2006. [Google Scholar]
  21. Crundwell, F. The Dissolution and Leaching of Minerals: Mechanisms, Myths and Misunderstandings. Hydrometallurgy 2013, 139, 132–148. [Google Scholar] [CrossRef]
  22. Huang, Z.-S.; Yang, T.-Z. Comparative Study on Refractory Gold Concentrate Kinetics and Mechanisms by Pilot Scale Batch and Continuous Bio-Oxidation. Minerals 2021, 11, 1343. [Google Scholar] [CrossRef]
  23. Marsden, J.O.; House, C.I. The Chemistry of Gold Extraction, 2nd ed.; Society for Mining, Metallurgy, and Exploration: Englewood, CO, USA, 2006. [Google Scholar]
Figure 1. (a) Polymetallic mineralized vein contained in polymictic tuffs-breccias; (b) TIMA image showing polymetallic sulfide ore composition and textures. Abbreviations: Gn: galena; Py: pyrite; Qtz: quartz; Sph: sphalerite.
Minerals 15 00523 g001
Figure 2. X-ray diffraction spectra of Pituca II host rock.
Minerals 15 00523 g002
Figure 3. Mechanical agitation of mineral slurry at 400 RPM, with pH control.
Minerals 15 00523 g003
Figure 4. Reflected light photomicrographs of polymetallic sulfide ore. (a) Cubic-shape pyrite disseminated in host rock; (b) sphalerite crystals speckled with chalcopyrite blebs/lamellae; (c) contact zone between mineralized vein and host rock; (d) breccia texture in sulfides resulting from dynamic processes. Abbreviations: Gn: galena; Py: pyrite; Qtz: quartz; Sph: sphalerite; HRx: host rock; Ccp: chalcopyrite.
Minerals 15 00523 g004
Figure 5. SEM photomicrographs of polymetallic sulfide ore. (A) Crushed and filled pyrite; (B) monomer pyrite; (C,D) sphalerite–chalcopyrite intergrowth with anhedral forms; (E,F) hessite microparticles in galena.
Minerals 15 00523 g005
Figure 6. Element maps generate with LA-ICP-MS of gold microparticles with progressive enrichment of Au towards the core: (a) reflected light photomicrographs of gold microparticles in galena; (b,c) reflected light photomicrographs of gold microparticles in pyrite.
Minerals 15 00523 g006
Figure 7. Particle size distribution after different milling times.
Minerals 15 00523 g007
Figure 8. Gold leaching kinetics curve for material at D80 = 90 µm.
Minerals 15 00523 g008
Table 1. Chemical composition, mass ratios, and particle size of main ore minerals in Pituca II.
Mineral
Element (W%)PyriteSphaleriteGalenaChalcopyriteHessiteGold
S53.4332.8713.4234.87
Fe46.620.48 30.47
Zn 66.96 0.71
Pb 86.65
Ag 60.09
Te 40.292.01
Cu 34.53
Au 98.05
Total100.05100.31100.07100.58100.13100.01
Particle size (μm)20–4005–30050–4005–30020–505–40
Mass ratioFe/S
0.87
Zn/S
2.04
Pb/S
6.45
Cu/Fe/S
1:0.88:1
Ag/Te
1.49
-
Table 2. Metallurgical balance: gold recovery with 10 min of milling.
FractionWeight (kg)Grade (mg/kg)Au Content (mg)
Feed1.50.751.125
Concentrate0.5651.4380.81247
Tailings1.50.20.3
Recovery72.22
Table 3. Metallurgical balance: gold recovery with 15 min of milling.
FractionWeight (kg)Grade (mg/kg)Au Content (mg)
Feed1.50.751.125
Concentrate0.6921.320.91344
Tailings1.50.130.195
Recovery81.19
Table 4. Temporal evolution of free cyanide and pH in a 24 h gold leaching test.
Elapsed Time (h)pHNaCN (g)CaO (g)
0.0011.273.001.67
1.0011.05
5.0010.381.26
8.0010.160.63
22.009.151.741.41
24.0010.16
Disclaimer/Publisher’s Note: The statements, opinions and data contained in all publications are solely those of the individual author(s) and contributor(s) and not of MDPI and/or the editor(s). MDPI and/or the editor(s) disclaim responsibility for any injury to people or property resulting from any ideas, methods, instructions or products referred to in the content.

