Article

Continental Shale Oil Reservoir Lithofacies Identification and Classification with Logging Data—A Case Study from the Bohai Bay Basin, China

1
School of Earth Sciences, Northeast Petroleum University, Daqing 163318, China
2
Nanpu Operation Area, Jidong Oilfield Company, PetroChina, Tangshan 063200, China
3
Exploration and Development Research Institute, Jidong Oilfield Company, PetroChina, Tangshan 063004, China
*
Author to whom correspondence should be addressed.
Minerals 2025, 15(5), 484; https://doi.org/10.3390/min15050484
Submission received: 12 March 2025 / Revised: 24 April 2025 / Accepted: 3 May 2025 / Published: 5 May 2025
(This article belongs to the Section Mineral Exploration Methods and Applications)

Abstract

:
The development of laminations and mineral composition significantly determine the quality of shale oil reservoirs. The quantitative characterization of lamination development indicators and accurate calculation of mineral composition are key issues in logging evaluation. The Shahejie Formation continental shale oil reservoir in the Nanpu Sag, Bohai Bay Basin, was taken as a case study. Based on electrical imaging logging data, a high-pass filter was designed using the Chebyshev optimal approximation method to extract high-frequency information from the microelectrode curves of the electrical images. A high-resolution quantitative characterization method for millimeter-scale laminated structures of laminae was established, which improved the resolution by 2 to 3 times compared to the static and dynamic image resolutions of electrical imaging. By constructing lamination indices to characterize the sedimentary structural features of reservoirs, we effectively enhanced the fine recognition capability of electrical imaging logging data for sedimentary structures. Utilizing stratigraphic elemental well-log data, we employed an elemental–mineral component conversion model and optimized iterative techniques for accurate mineral composition calculation. We constructed a lithofacies classification scheme based on well-log data using the “rock types + sedimentary structures “approach, combined with research findings on lithofacies identification from well logs, and we identified 12 lithofacies types in the continental shale oil reservoirs of the Nanpu Sag, achieving fine-grained lithofacies logging identification across the entire area. The detailed lithofacies logging classification results were consistent with fine core descriptions.

1. Introduction

The fine division and identification of lithofacies types in continental shale oil reservoirs are important foundations for the evaluation of shale oil exploration and development potential [1,2,3]. Lithofacies refer to the types of rocks formed in certain sedi-mentary environments and their compositional relationships, which determine the quality of shale reservoir properties and strongly control the enrichment and accumulation of shale oil and gas [4,5,6,7,8]. In the study of mud shale lithofacies, many scholars generally use mineral composition and sedimentary structures as the basis for classifying shale lithofacies and have achieved ideal classification results.
Liu Bo et al., according to the criteria of “organic matter abundance + mineral composition + rock sedimentary structures”, divided the shale oil of the Cretaceous Qingshankou Formation in the Paleolong Depression into 7 lithofacies [9,10]; Sumit Kumar et al. utilized experimental techniques such as scanning electron microscopy (SEM) and atomic force microscopy (AFM) to analyze the influence of different lithofacies on brittleness and the main controlling factors of lamina development, based on a detailed classification of shale lithofacies [11,12,13]; Liu Huimin et al., focusing on the Sha−4 mud shale reservoir in the Dongying Depression, established a division method based on “rock composition, sedimentary structures, matrix structure, and organic matter abundance”, categorizing mud shale into 3 types and 20 lithofacies [14,15]; Bhattacharya, S et al. utilized the Support Vector Machine (SVM) machine learning algorithm to identify patterns of different shale lithofacies and established a 3D data-driven lithofacies model for the upper and lower shale members of the Bakken Formation in the Williston Basin, North Dakota, USA [16,17,18]. Li Zhaofeng et al. established a lithofacies division scheme based on “mineral composition + sedimentary structures” for the Wind City Formation shale in the Mahu Depression, categorizing it into four typical lithofacies [19]. Li Zhongbao et al. developed a three-step lithofacies classification scheme based on whole-rock mineral zoning, TOC grading, and mineral structure–sedimentary structure correction, dividing the Middle–Lower Jurassic strata in the Sichuan Basin into 6 types and 20 lithofacies [20]. Zhu Xiangyu et al. classified calcite and dolomite minerals in the mineral composition as carbonate minerals; orthoclase, plagioclase, and quartz minerals as felsic minerals; and illite, kaolinite, etc., as clay minerals, taking these three categories as three end-members. Based on the statistical criterion of a single end-member mineral component content exceeding 50%, the rocks are classified into three major categories: carbonate rocks, felsic fine-grained rocks, and clay rocks. Combined with sedimentary structures, the shale in the second member of the Funing Formation (Fu−2) in the Gaoyou Sag is further subdivided into 7 subcategories and 14 lithofacies [21]. Alessandro Avanzini et al. conducted a study on lithology and geomechanical facies classification for the selection of layers and intervals in shale oil reservoir stimulation, they used logging data to divide the Barnett shale oil reservoir into four lithofacies and five geomechanical facies [22]. Muhsan Ehsan et al. used neural network methods based on logging data to classify lithofacies and clay types in the Talhar Shale of the southern Indus Basin, Pakistan [23,24].
Among the shale lithofacies classification schemes established by the aforementioned scholars, the former is based on petrophysical experimental data and has not established an effective coupling relationship with logging data, making its generalization and application to a large number of non-cored wells difficult; the latter achieves lithofacies classification solely by utilizing conventional logging data processing methods. Moreover, a shale oil reservoir consists of deep-water fine-grained sediments with complex rock mineral compositions and well-developed laminae and bedding structures, which impose high requirements on logging resolution [25]. It is difficult to achieve precise identification and division solely relying on one type of logging data. Additionally, the complexity of rock mineral compositions and high clay content pose challenges in identifying the dominant lithofacies.
This article focuses on the continental shale oil reservoirs of the Shahejie Formation in the Nanpu Sag of the Bohai Bay Basin. Utilizing the Chebyshev optimal approximation method to design a high-pass filter for extracting high-frequency information from the microresistivity curves of electrical imaging, a quantitative characterization technique for lamina structure was established, achieving millimeter-scale fine identification of shale laminations. Formation elemental logging data were used to construct an elemental–mineral component conversion mode for accurately calculating rock mineral components. Based on the differences in logging responses of different lithologies, an optimized lithology identification scheme using formation element logging was established.
Using core experimental analysis data for calibration, the study employs electrical imaging logging and formation element logging data to construct logging characterization methods for the lamina index and mineral composition of shale oil reservoirs. A lithofacies classification scheme based on “rock types + sedimentary structures” is established, resulting in a comprehensive set of logging-based fine identification and classification methods for the dominant lithofacies in continental shale oil reservoirs (Figure 1).

2. Continental Shale Oil Reservoir Lithofacies Characteristics

Nanpu Sag is a small faulted basin located in the Huanghua Depression, in the northern part of the Bohai Bay Basin (Figure 2). From bottom to top, it sequentially develops the Palaeogene including the Shahejie Formation and Dongying Formation, the Neogene Guantao Formation and Minghuazhen Formation, and the Quaternary strata [26,27]. The Shahejie Formation is the primary oil-generating and oil-bearing formation in the Nanpu Sag, as well as the main development layer for shale oil reservoirs. The shale oil reservoir of the Shahejie Formation is dominated by terrigenous clastic deposits and widely develops deep-lake to semi-deep-lake subfacies. It exhibits distinct thin interbedding features, strong vertical heterogeneity, diverse lithologies, and complex mineral compositions.

2.1. Mineral Component Characteristics

The XRD whole-rock mineral diffraction analysis results of the Shahejie Formation shale oil reservoir in the Nanpu Sag indicate that clay minerals have the highest content in the shale oil reservoir, ranging from 35.4% to 51.2%, with an average of 41.5%. This is followed by quartz minerals, with a content ranging from 18.7% to 26.9% and an average of 23.1%. The calcite content varies significantly, ranging from 8.9% to 30.2%, with an average of 16.5%. Plagioclase content ranges from 4.4% to 8.2%, averaging 7.6%. Dolomite and potassium feldspar are present in lower amounts, with average contents of 4.0% and 4.6%, respectively. The average content of other minerals is less than 1%. Within the clay minerals, the interstratified illite/montmorillonite accounts for approximately 57.6%, illite for about 29.2%, kaolinite for 8.4%, and chlorite for around 4.8% (Figure 3). Overall, the Shahejie Formation shale reservoir in the Nanpu Sag is predominantly composed of terrestrial clastic minerals (high content of clay minerals and felsic minerals), with fewer authigenic minerals (mainly carbonate minerals).

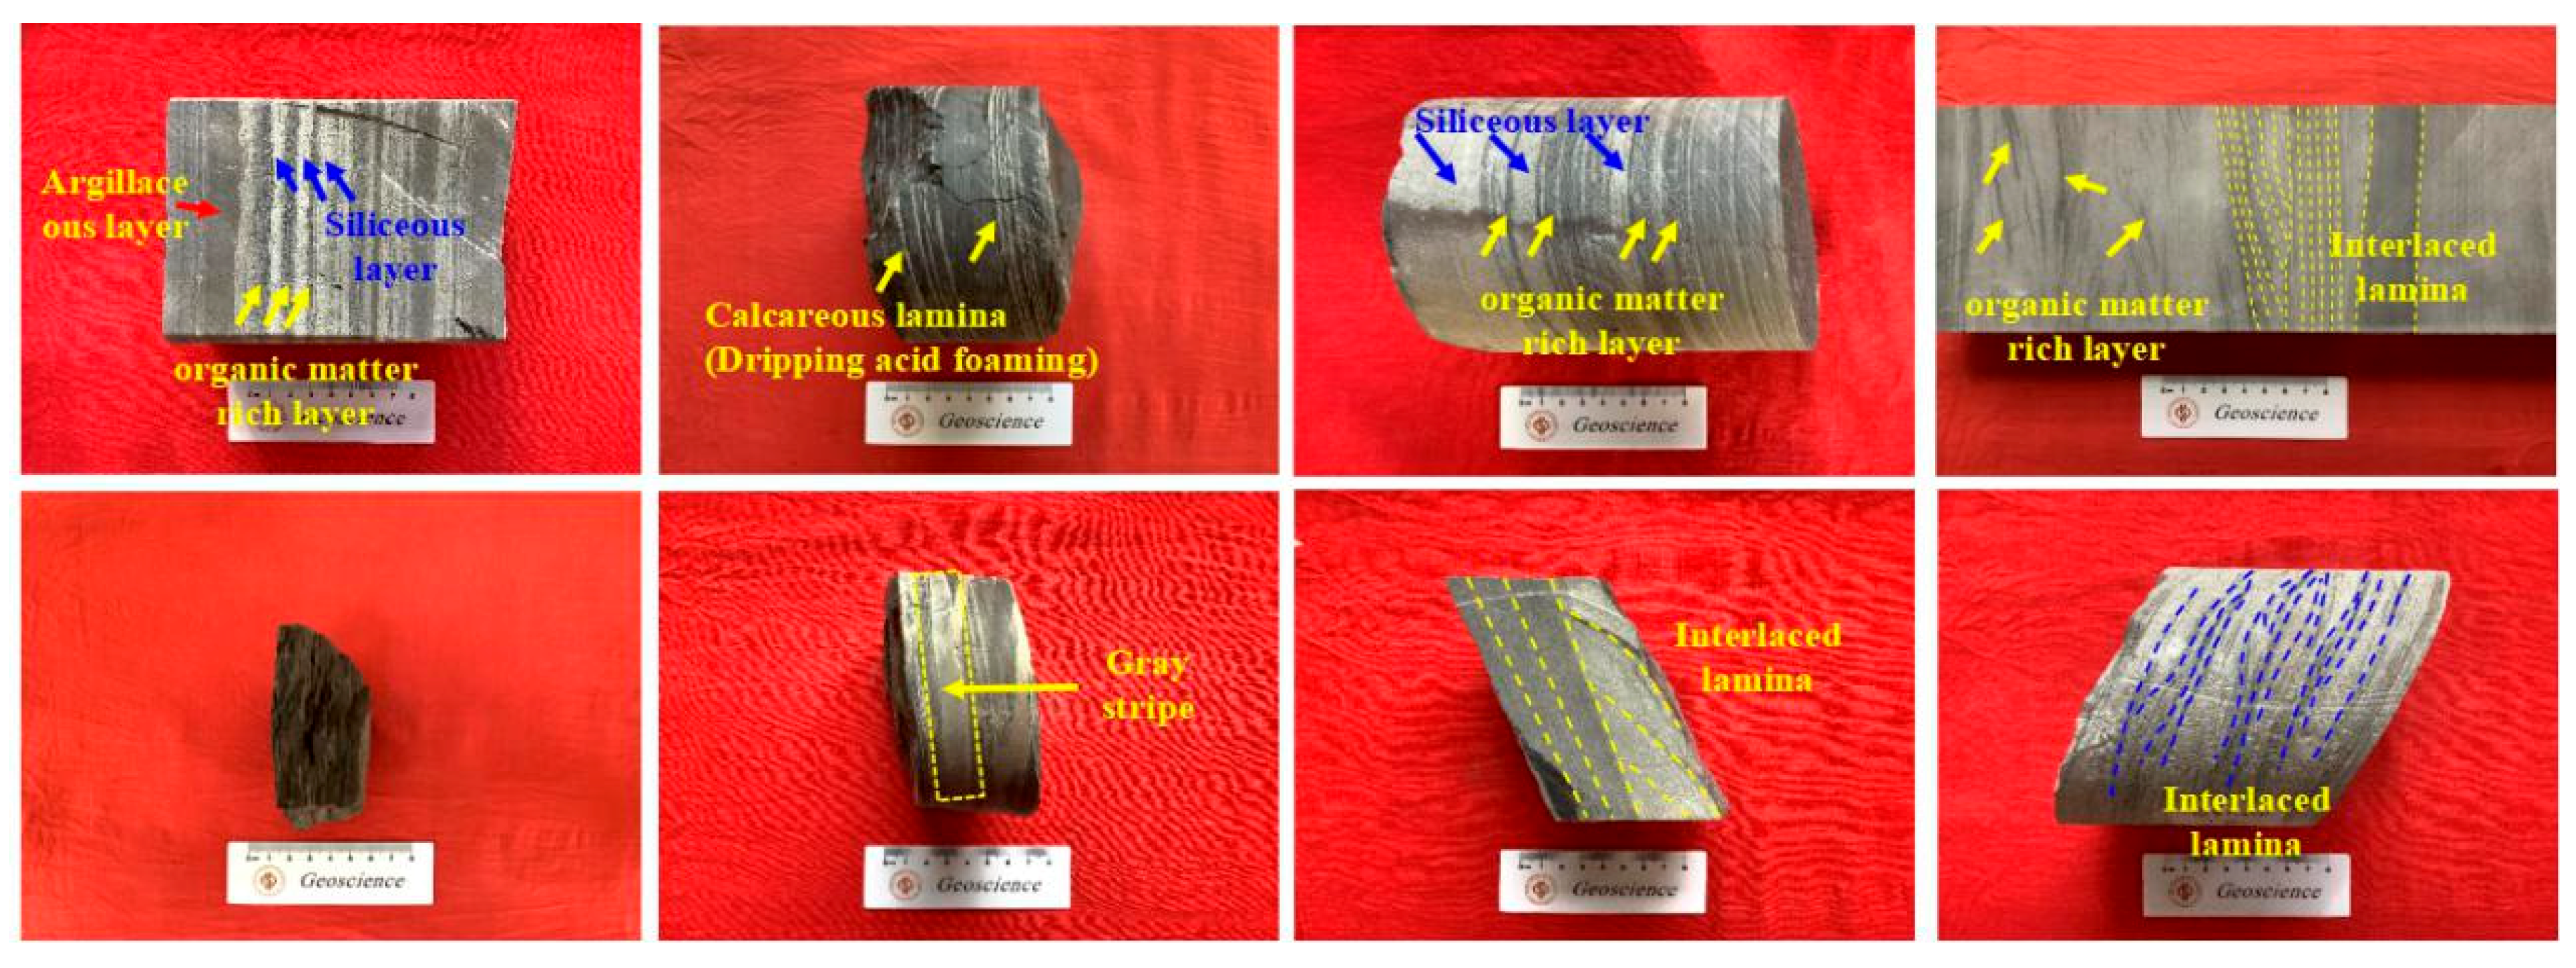
2.2. Sedimentary Structural Characteristics

Sedimentary structures can directly reflect the hydrodynamic characteristics during rock formation and to some extent indicate the sedimentary environment in which they formed [28,29]. Lamination, as a typical sedimentary structural feature of shale reservoirs, is one of the distinctive sedimentary structures that can be observed. It is widely developed in terrestrial shale formations and determines the quality of shale reservoir source rocks and the effectiveness of hydraulic fracturing [30,31]. Figure 4 and Figure 5 present the microscopic characteristics of sedimentary structures in the shale oil reservoirs of the study area, as observed through core examination and thin-section identification. They reveal the widespread development of felsic laminae and organic-rich laminae in the Shahejie Formation of the Nanpu Sag, with carbonate laminae occasionally found in the strata. The felsic laminae are light yellow, white, and grayish-white in color, subangular to subrounded in shape, and well sorted. The sedimentary structures are primarily horizontally continuous, with a small amount being discontinuous or wavy. Vertically, they mostly appear parallel or subparallel, with distinct lamina interfaces. The grain size is less than 0.1 mm, and the lamina thickness ranges from 0.05 to 8.00 mm. Locally, micro-fractures parallel to the bedding plane can be observed. The organic laminae are black with distinct boundaries, predominantly abrupt, and often associated with clay laminae. The sedimentary structures are mainly horizontally continuous or interbedded and interlaced with felsic laminae. Vertically, they mostly appear parallel or subparallel, with lamina thickness ranging from 0.10 to 3.50 mm. The carbonate laminae are distributed in white and dark gray, with distinct boundaries, and the sedimentary structures are primarily horizontally continuous, with lamina thickness ranging from 0.05 to 2 mm. In some shale oil intervals, small-scale cross-laminations and rhythmic laminations are developed.

2.3. Criteria for Lithological Identification and Classification

With reference to a lithologic classification scheme for fine-grained sedimentary rocks [32,33], the mineral components determined by XRD whole-rock mineral diffraction analysis in the shale oil reservoirs of the study area are categorized as follows: quartz, potassium feldspar, and plagioclase are classified as felsic minerals; calcite and dolomite are classified as carbonate minerals; and illite, illite–smectite mixed layer, kaolinite, and chlorite are classified as clay minerals. Using felsic minerals, carbonate minerals, and clay minerals as the three end-members, a ternary diagram (Figure 6) was plotted. With the relative content of the three end-member minerals set at 50% as the boundary for lithological classification and nomenclature, the continental shale oil reservoirs in the Nanpu Sag were divided into four rock types: clay-rich shale, felsic shale, carbonate-rich shale, and mixed shale.
To effectively classify lithofacies types, the shale oil reservoirs in the study area are divided into three types of sedimentary structural characteristics based on the lamina development and sedimentary structures observed in cores and thin sections: laminated (single-layer thickness < 1 mm), layered (single-layer thickness 1 mm–10 mm), and massive (single-layer thickness > 10 mm). Detailed observations and statistical analysis of 289.5 m of core samples from 26 wells in the study area reveal that massive structures are the most developed, followed by laminated and layered structures.
On the basis of the classification of mineral rock types and the study of sedimentary structure characteristics, a “rock type + sedimentary structure” shale oil reservoir lithofacies classification scheme is established (Table 1). The mineral composition is divided into four rock types: feldspathic shale, clayey shale, carbonate shale, and mixed shale, based on the ternary components of feldspathic minerals, carbonate minerals, and clay minerals, with a relative content threshold of 50% as the boundary. Based on sedimentary structural features, they are classified into three types: laminated, bedded, and massive, with thresholds of 1 mm and 10 mm for single-layer thickness. The continental shale oil reservoir in the Nanpu Sag is divided into twelve lithofacies associations.

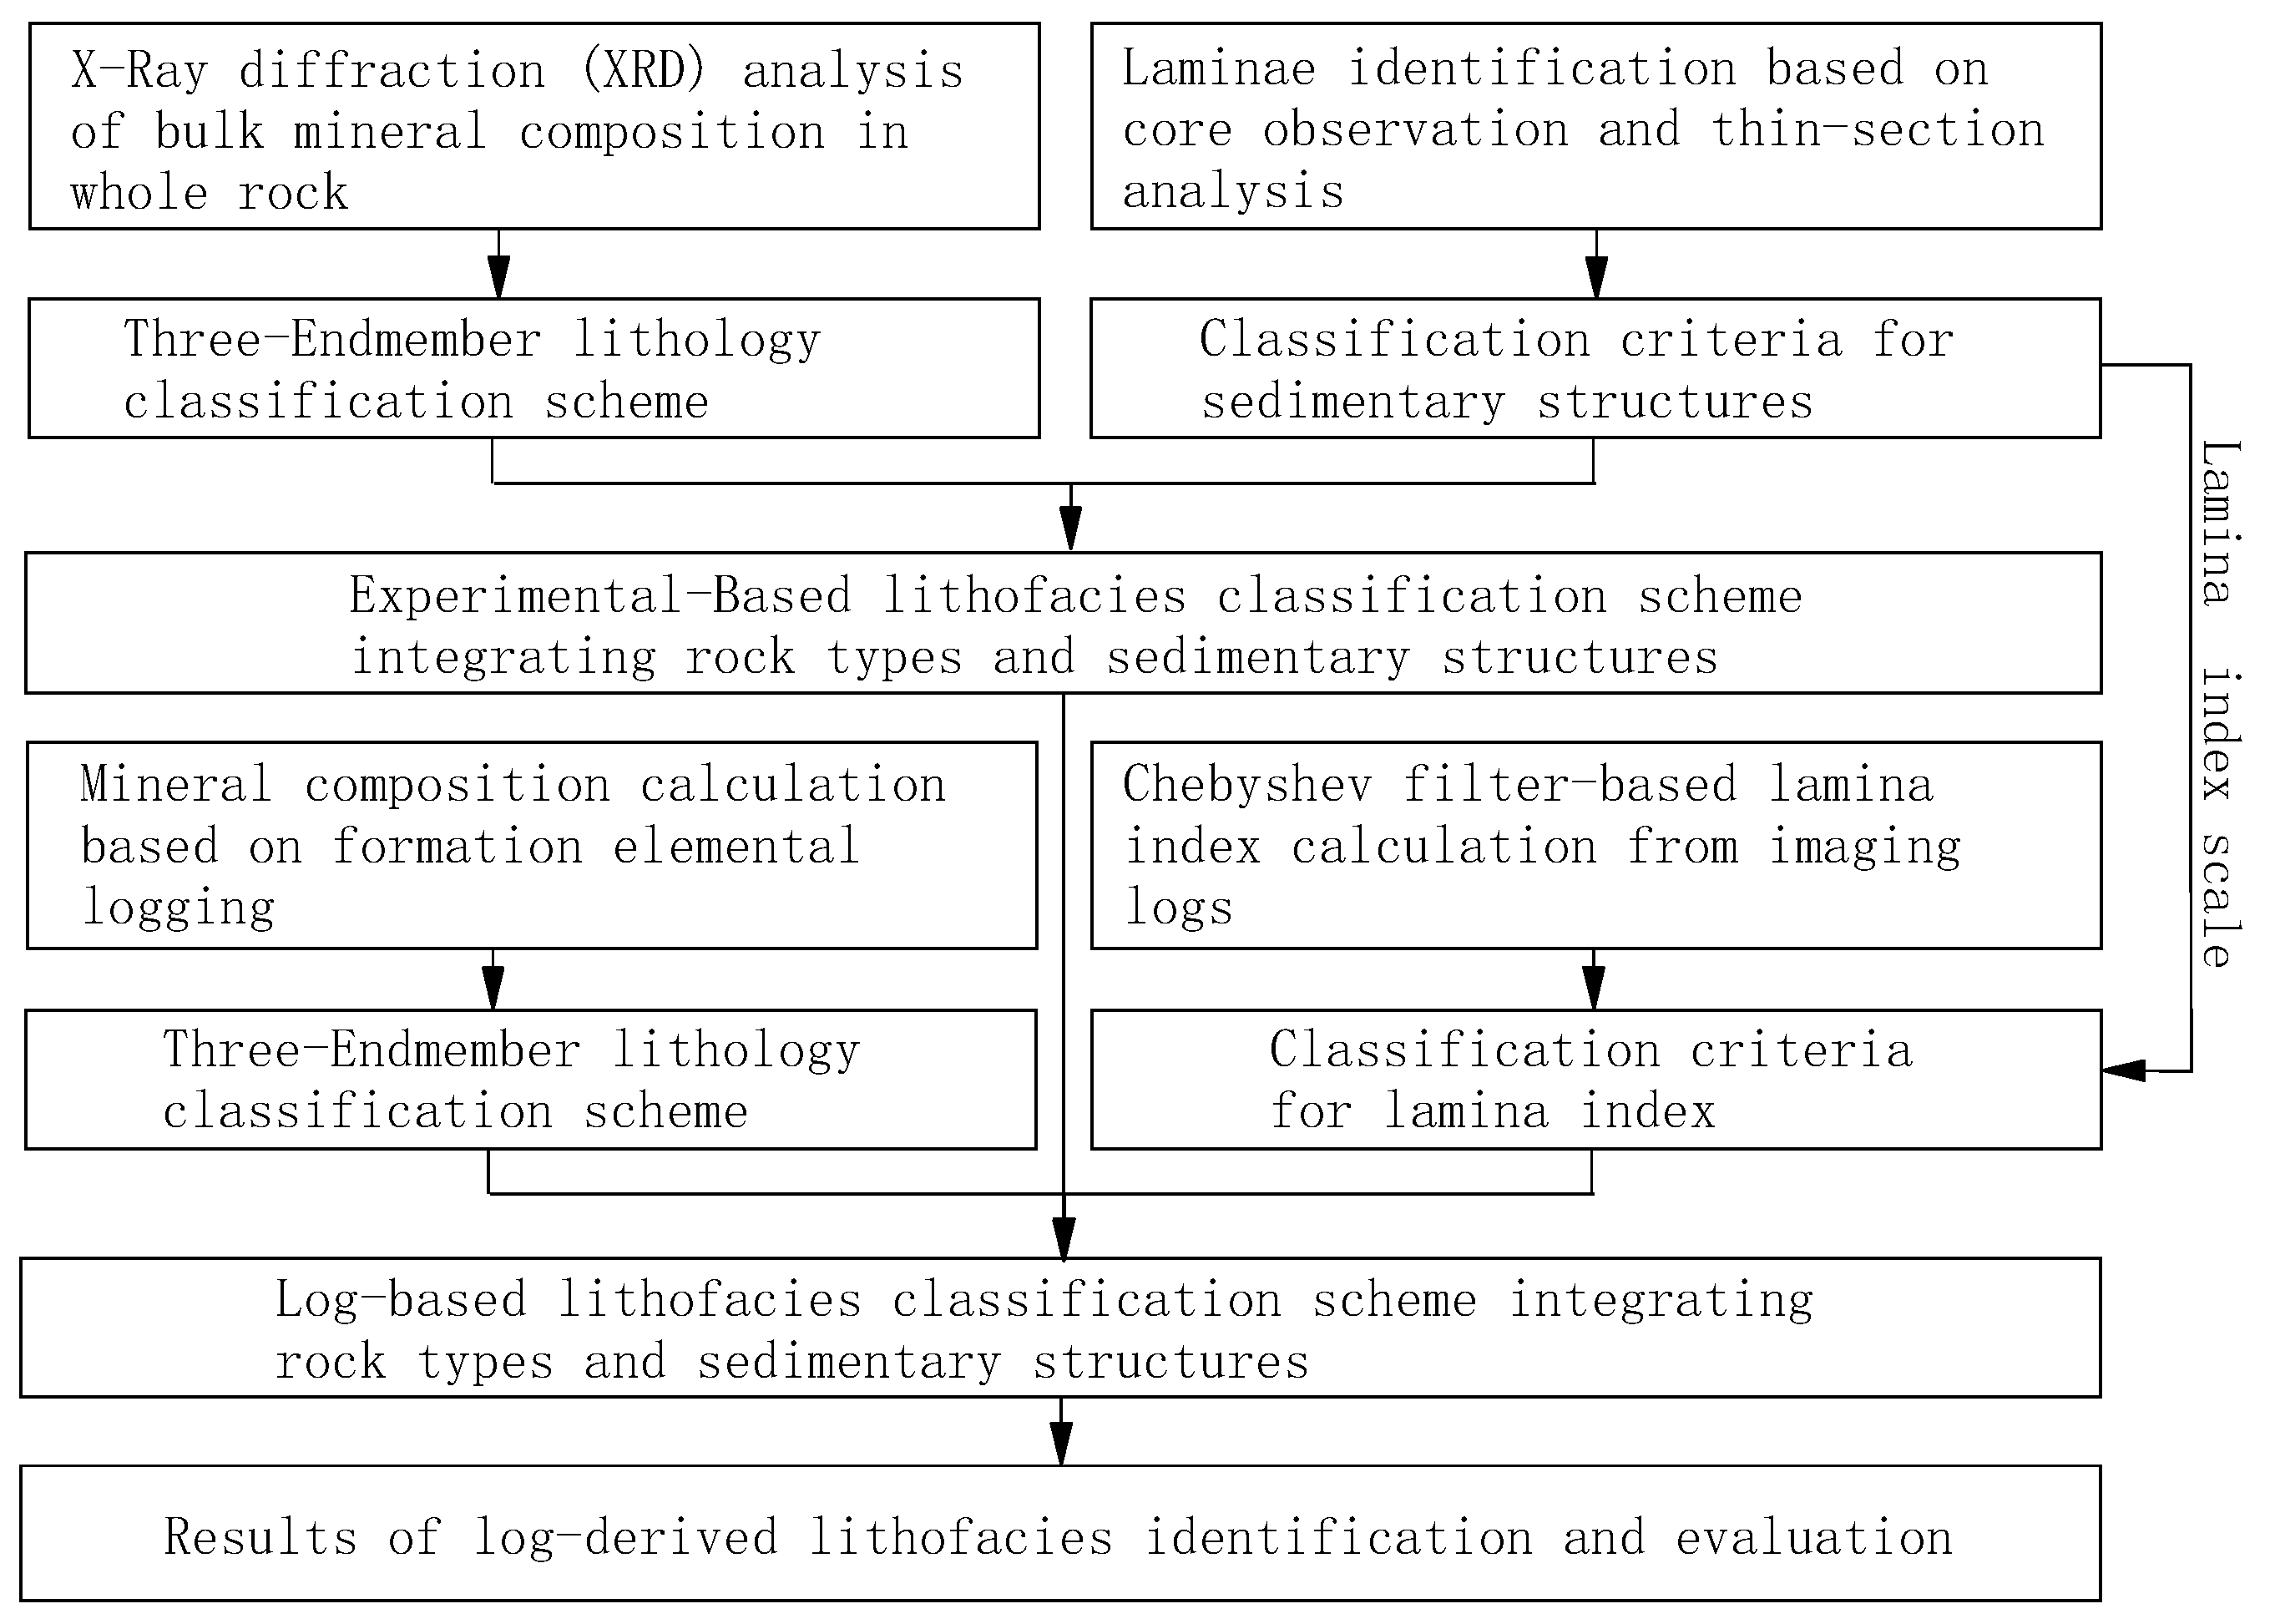
3. Fine Identification Methods of Lithofacies Logging

Based on logging data, this study reveals the petrological characteristics of continental shale oil reservoirs in the Nanpu Sag from multiple perspectives such as mineral composition and sedimentary structures. It scales rock physics experimental analysis data and establishes a lithology logging division scheme based on “rock type + sedimentary structures”.

3.1. Mineral Composition Calculation

The lithology of continental shale oil reservoirs in the Nanpu Sag is complex, and the response characteristics of conventional logging curves exhibit minimal differences, making effective identification challenging. Formation elemental logging technology utilizes the principles of inelastic scattering collisions between fast neutrons and atomic nuclei in the formation, as well as thermal neutron capture, to calculate the elemental content information of the formation through spectral decomposition and oxygen closure models.
Using optimization methods to establish a quantitative relationship between mineral components and the relative content of formation elements, response equations for the relative content of elements in different mineral components of the reservoir are constructed. Using core experimental data as constraints, the difference between theoretical logging values and actual logging values of the response equations is iteratively calculated. When these differences meet error conditions, the calculated mineral content reflects the actual mineral content of the reservoir.
According to the principle of the linear least squares method, a constrained elemental logging optimization interpretation objective function model is established as follows:
min f ( V ) = i = 1 m ( j = 1 n ( V j × r i a i ) ) j = 1 n V j = 1 0 V j 1
where f ( V ) is the objective function; r i is the response function of the i type of mineral in the formation; V j represents the volume percent content of the j type of mineral; a i represents the volume percent content of the i type of mineral in the formation.
Since the number of elements in formation element logging spectroscopy is greater than the types of reservoir mineral components (m > n), the least squares solution of the linear equation system (1) is unique. By solving for the minimum value of the objective function f ( V ) , the optimal solution of the system of equations established using various elemental logging curves can be obtained, and it represents the geological content of each mineral component.
Using the aforementioned method for refined processing and interpretation, the contents of clay, quartz, feldspar, carbonate minerals, and pyrite were calculated (Figure 7). In Figure 7, the third brown-red curve represents the modeled clay content, with black dots indicating the clay from core analysis; the fourth red curve depicts the modeled quartz content, with black dots indicating the quartz content from core analysis; the fifth blue curve represents the modeled feldspar content, with black dots indicating the feldspar content from core analysis; the sixth and seventh purple curves represent the modeled carbonate mineral and pyrite contents, respectively, with black dots indicating the carbonate mineral and pyrite contents from core analysis. From Figure 7, it can be observed that the calculated mineral content closely matches the results from the core analysis, demonstrating the accuracy of this method in calculating mineral content in shale reservoirs.

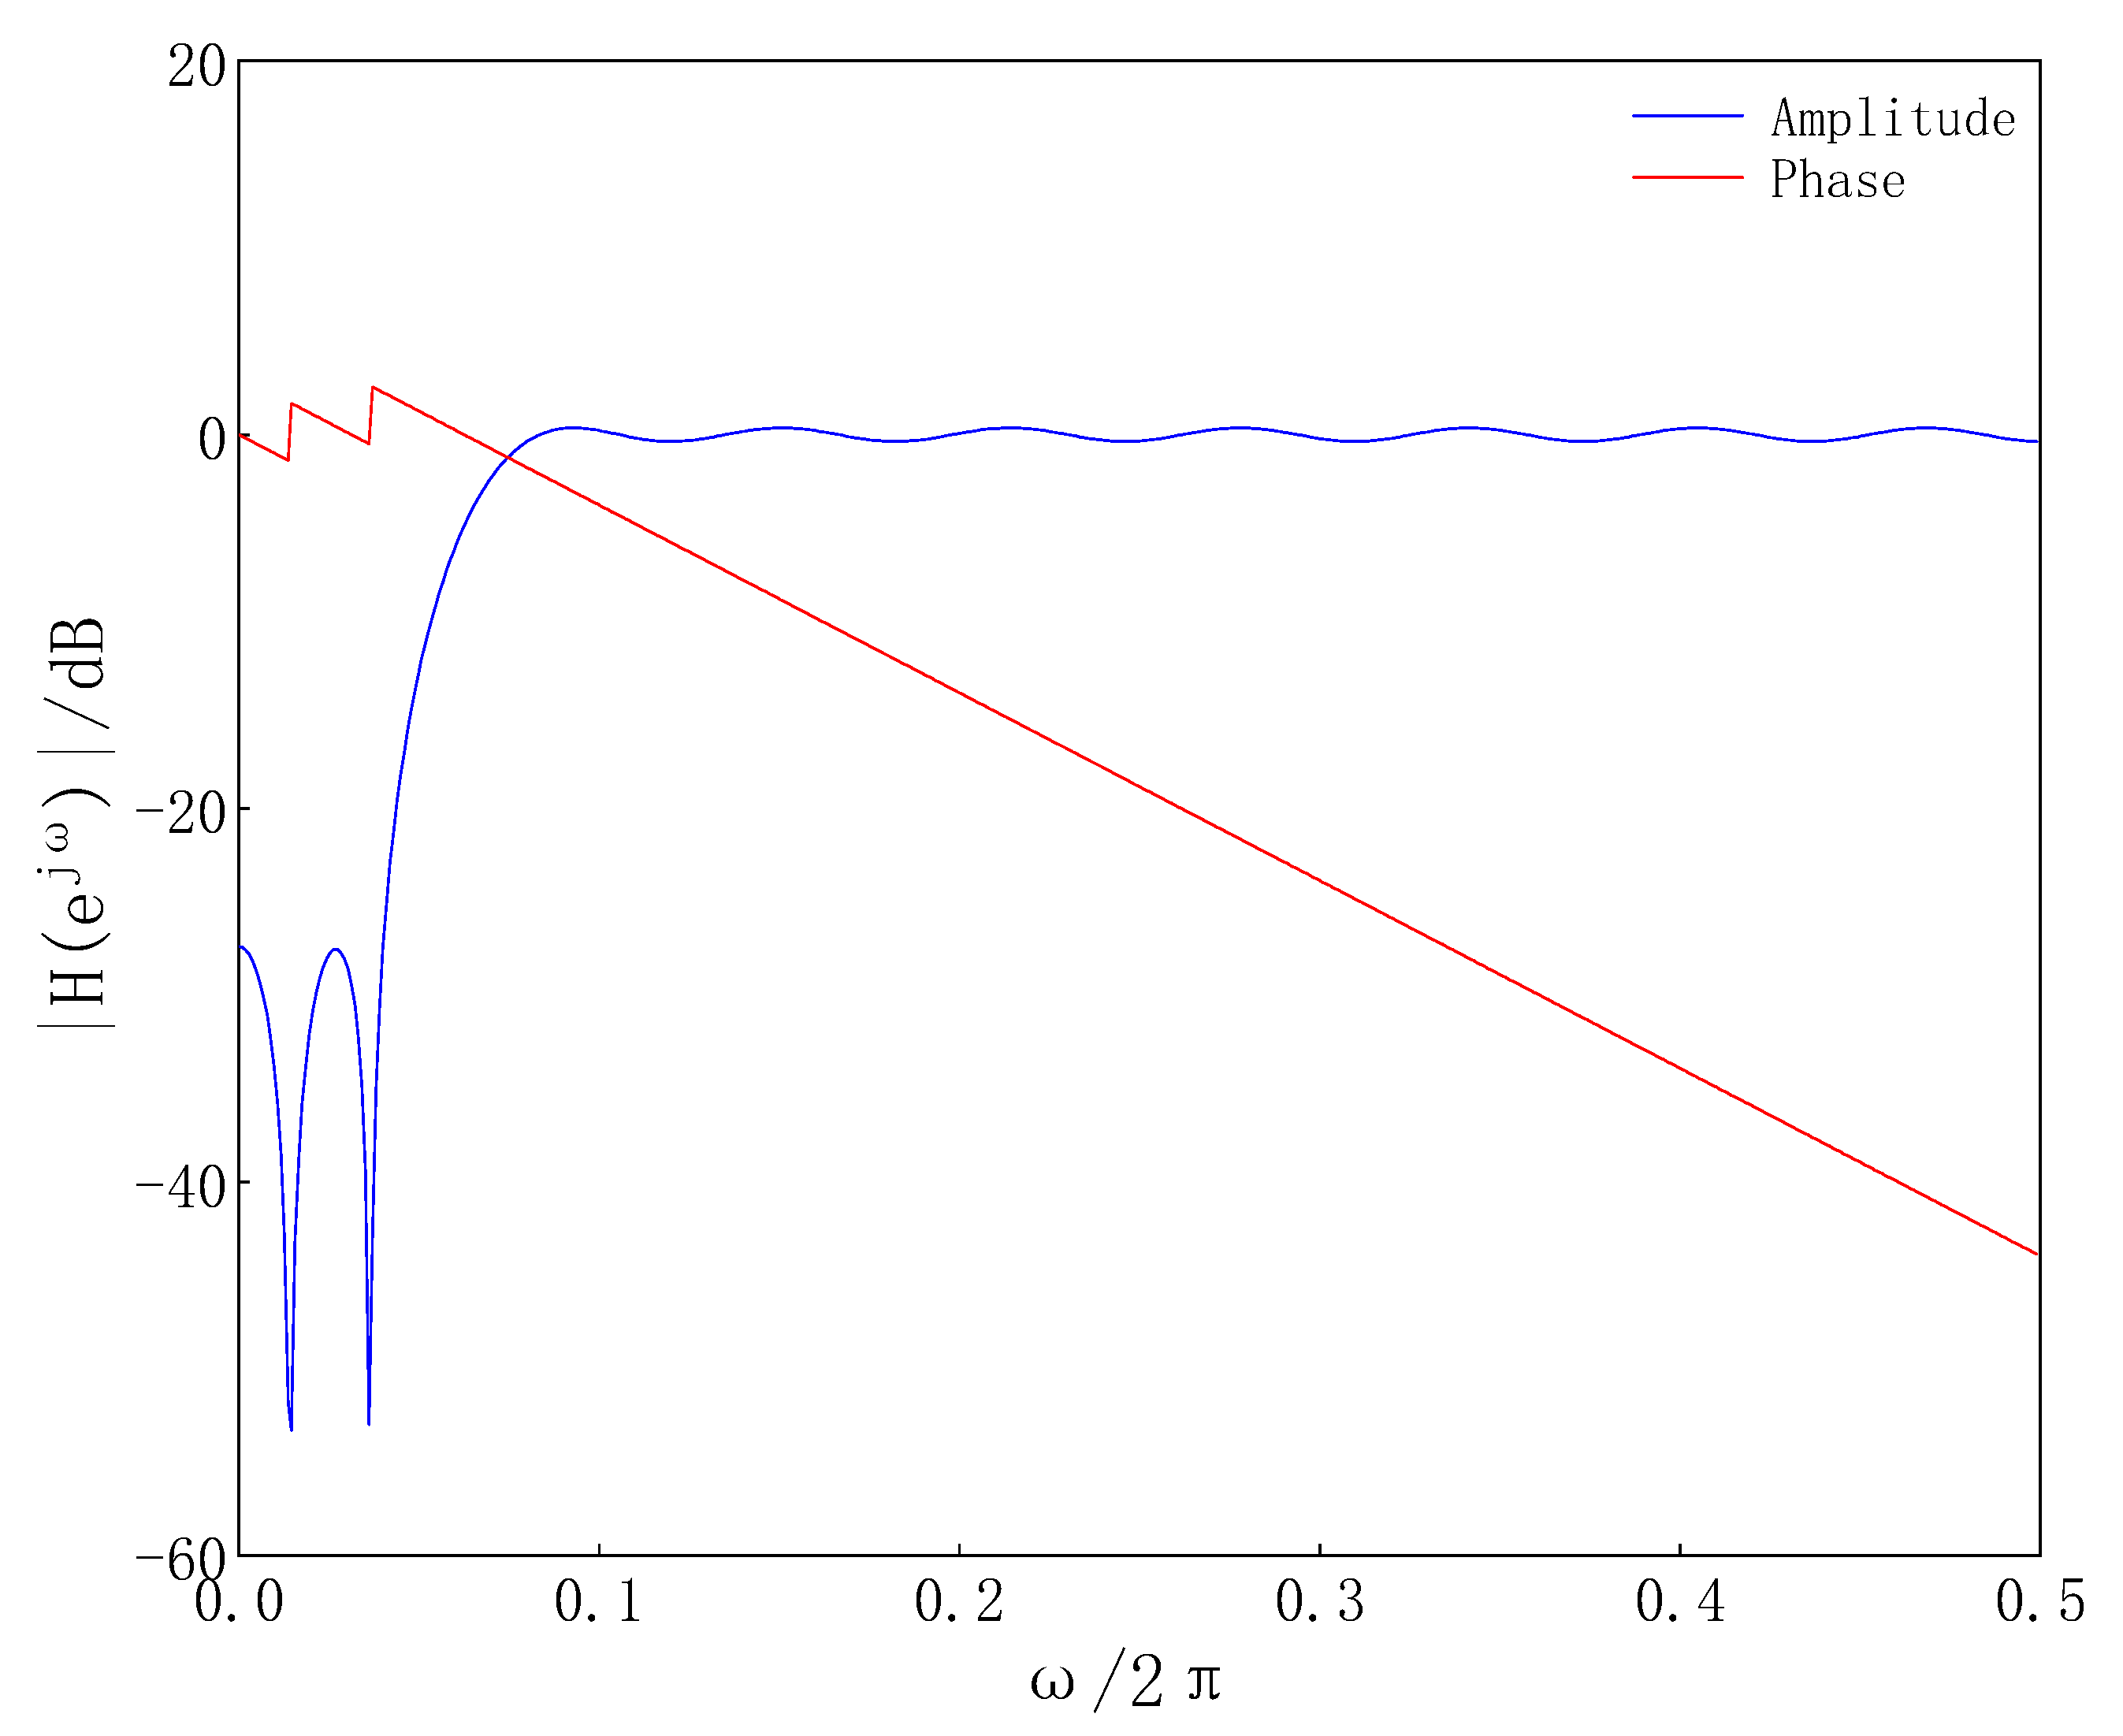
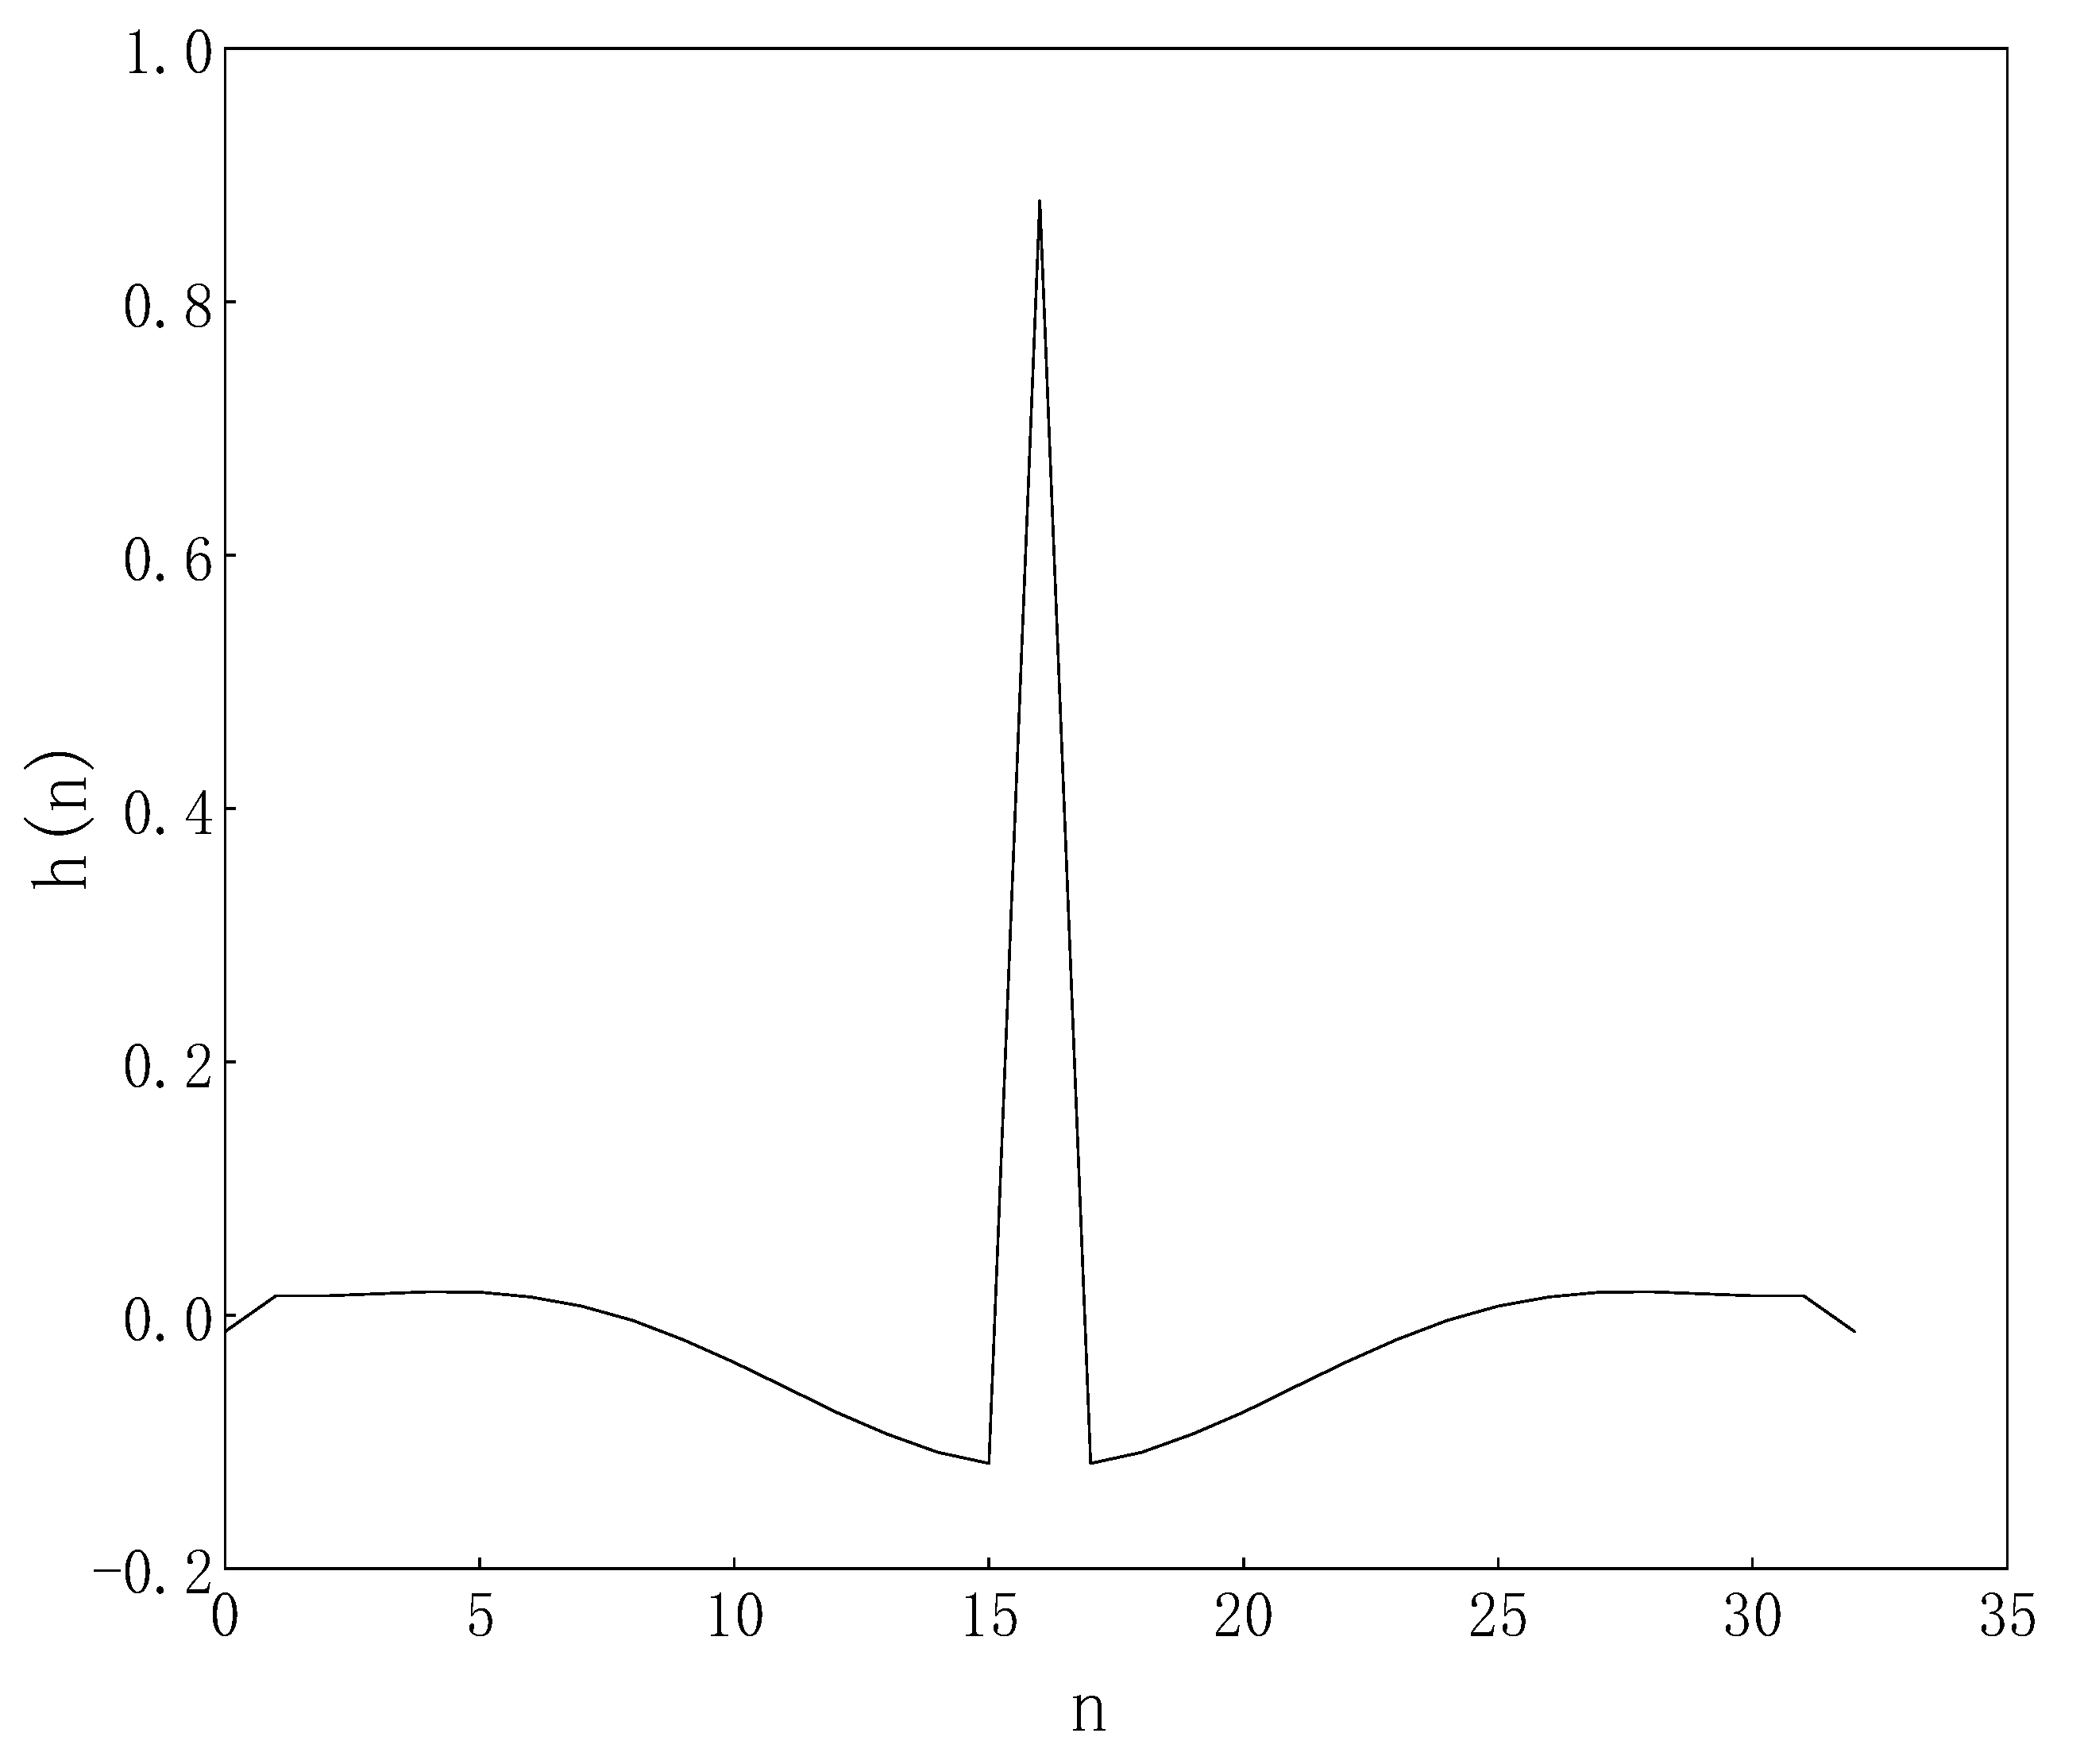
3.2. Sedimentary Structure Identification

Sedimentary structures refer to the overall characteristics of the spatial distribution and arrangement of sedimentary rock components, reflecting the genesis and sedimentary environment of sedimentary rocks [34,35]. In the Sandhejie Formation shale oil reservoirs of the Nanpu Sag, three main types of sedimentary structures are observed: laminar, thinly bedded, and blocky. Electrical imaging logging theoretically achieves a longitudinal resolution of up to 5 mm, clearly revealing millimeter-scale laminar and thinly bedded structures. It is the most important and effective logging technique for evaluating sedimentary structures in shale oil. By comparing core observations with electrical imaging logging data, it is found that as the lamellae and thin layers in the core become more developed, the microelectrode curve in the electrical imaging logging fluctuates more frequently, indicating high-frequency curve characteristics. However, these high-frequency signals are often masked by background low-frequency signals, reducing the effective identification accuracy of laminar structures. Therefore, it is necessary to employ certain filtering techniques to extract these signals.
The Chebyshev equal ripple approximation method is one of the FIR filter design methods [36,37,38]. It adopts the optimization criterion of “minimizing maximum error” and uses the Remez exchange algorithm and Chebyshev approximation theory to design filters that achieve optimal matching between desired and actual filter frequency responses. Filters designed using this method can obtain good passband and stopband performance and accurately specify passband and stopband edges. Because the errors in the passband and stopband are uniformly distributed, the frequency responses exhibit equal ripple characteristics within the passband and stopband, and the order is relatively low. In the above sense, Chebyshev equal ripple approximation filters are optimal.
Chebyshev Filter Design Principles: Without loss of generality, assuming the designed FIR filter’s unit sample impulse response satisfies an even symmetric condition, that is, h[n] = h[n−1-n], when its length (N) is odd, its frequency response can be represented by the following equation:
H ( e j ω ) = e j ( N 1 ) ω / 2 H g ( e j ω )
where
H g ( e j ω ) = e j ( N 1 ) ω / 2 n = 0 ( N 1 ) / 2 a ( n ) cos ( n ω )
a ( n ) = h ( N 1 2 )                                                         n = 0 2 h ( N 1 2 n )               n = 1 , 2 , , ( N 1 ) / 2
Clearly, H ( e j ω ) has a linear phase. Therefore, the design problem of FIR digital filters is to find the coefficients a ( n ) , n = 0 , 1 , , ( N 1 ) / 2 such that they approximate the desired ideal amplitude–frequency characteristic according to a certain criterion.
The weighted error function E ( e j ω ) is defined as follows:
E ( e j ω ) = W ( e j ω ) H d ( e j ω ) H g ( e j ω ) = W ( e j ω ) H d ( e j ω ) n = 0 M a ( n ) cos ( n ω )
where M = N 1 / 2 and H d e j ω refers to the expected ideal frequency response:
H d ( e j ω ) = 1 ,             0 ω ω p 0 ,             ω s ω π
And W ( e j ω ) is the weighted function:
w ( e j ω ) = δ 2 / δ 1 ,             0 ω ω p 1 ,             ω s ω π
In the equation, ω p is the passband frequency, ω s is the stopband frequency, δ 1 is the peak of the passband ripple, and δ 2 is the peak of the stopband ripple.
Therefore, the best uniform approximation problem is how to determine the M + 1 coefficients of a ( n ) to make the maximum value of the weighting error of E e j ω be the minimum, that is, M i n max E ( e j ω ) .
According to the Alternation Theorem, the necessary and sufficient condition for the unique best uniform approximation form H g e j ω to H d e j ω on a subset F is that the error function of E ( e j ω ) exhibits at least M + 2 staggered frequency on the subset F; i.e., there are ω 0 , ω 1 , ω 2 , , ω M + 1 to realize that
E e j ω i = E e j ω i + 1 = max ω F E e j ω
For the M + 2 staggered frequency on subset F, from Equation (5), we have
W e j ω k H d e j ω k n = 0 M a n cos n ω k = 1 k max ω F e j ω , k = 0 ,
When the correct staggered frequency point group cannot be given in advance, the initial value of the staggered frequency point group can be given. By substituting it into Equation (9) and using the Remez algorithm to calculate H g e j ω without solving a 0 , a 1 , , a M and then repeatedly iterating to correct the staggered frequency point group, the optimal H g e j ω can be found finally. Then, by multiplying it with the linear phase in Equation (2) and then performing an inverse transformation, the unit sampling response h ( n ) of the FIR filter can be obtained.
Actual Processing Effect: According to the design principle of the Chebyshev optimal filter, a study was conducted on electrical imaging logging data, and comparative analysis with core data revealed regularly distributed light and dark laminae. This allows for the determination of the developmental frequency of fine, regular laminae. Therefore, a high-pass filter cutoff frequency of 0.16 π was set, utilizing the Chebyshev high-pass filter and phase as shown in Figure 8. The corresponding time-domain unit sample response is shown in Figure 9. Using this time-domain pulse, processing was applied to 192 micro-focused resistivity curves from electrical imaging, enhancing the laminations. In the enhanced high-frequency images, the development of fine-scale laminations is clear, matching closely with observations from the core, thus confirming the validity of this method (Figure 10). The technique effectively enhances the imaging characteristics of laminations and thin layers while suppressing lithological background information, removing influences from wellbore collapse and abnormal noise. It improves the resolution of dynamic and static electrical imaging well logging images by 2 to 3 times.
The comparison between the detailed core descriptions and high-frequency electrical imaging well logs reveals that better-developed textures result in denser light–dark stripes in high-frequency images. Therefore, the degree of texture development can be quantitatively characterized by statistically analyzing the variation in the number of light and dark bands within a unit window length in high-frequency images. The concept of a “lamination index” is introduced to quantitatively define the degree of development of laminations and thin layers [39]. The lamination index is defined as the number of laminations determined by high-frequency images within a statistically significant depth interval of 1 m. Although there is a significant absolute difference between the calculated lamination index and the lamination and bedding density described by the core, their changing trends show good consistency. This method can clearly describe the degree of development of laminations and thin layers and effectively indicate the degree of lamination development.
Adopting the method of core-calibrated logging, we use the results of detailed core description and thin section identification to calibrate the high-frequency images from electrical imaging logging and the calculated lamina index, which correspond to the sedimentary structural features of laminae, beds, and massive deposits. The results indicate that for laminae sedimentary structures, the calculated lamina index is generally greater than 30 laminae per meter; for thin-layered sedimentary structures, the lamina index typically ranges between 10 and 30 laminae per meter; and for massive sedimentary structures, the lamina index is generally less than 10 laminae per meter.

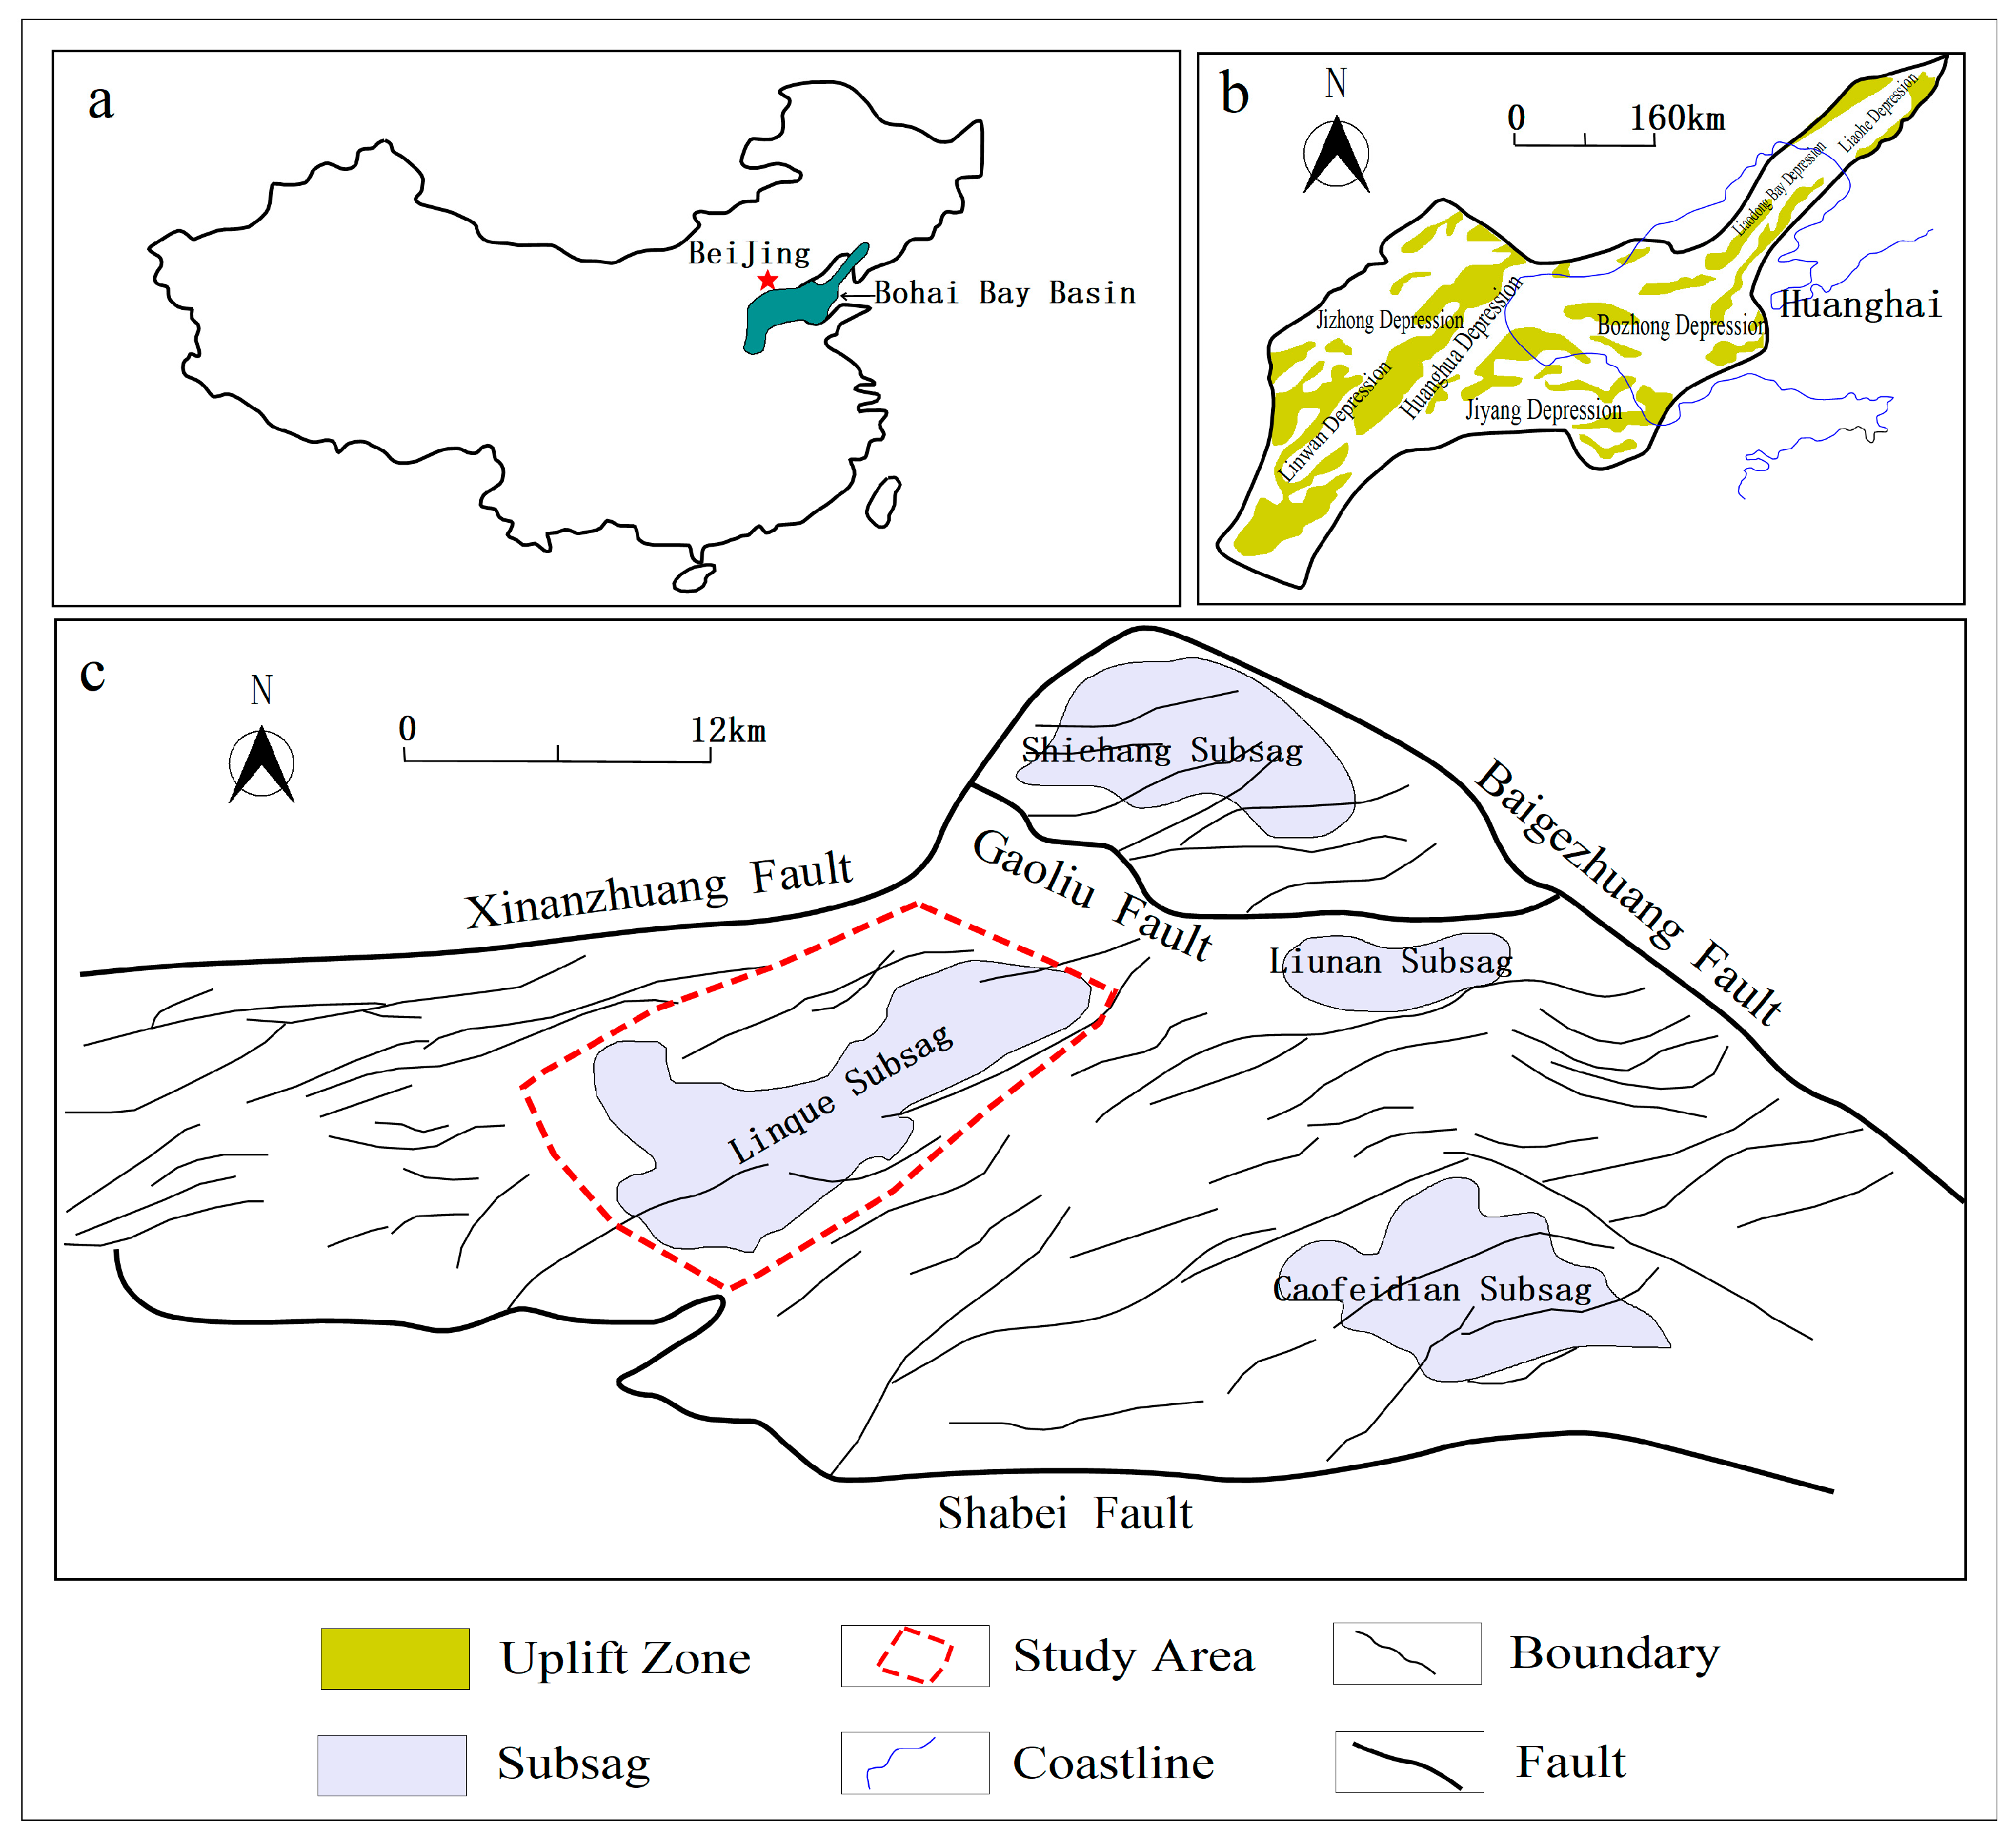
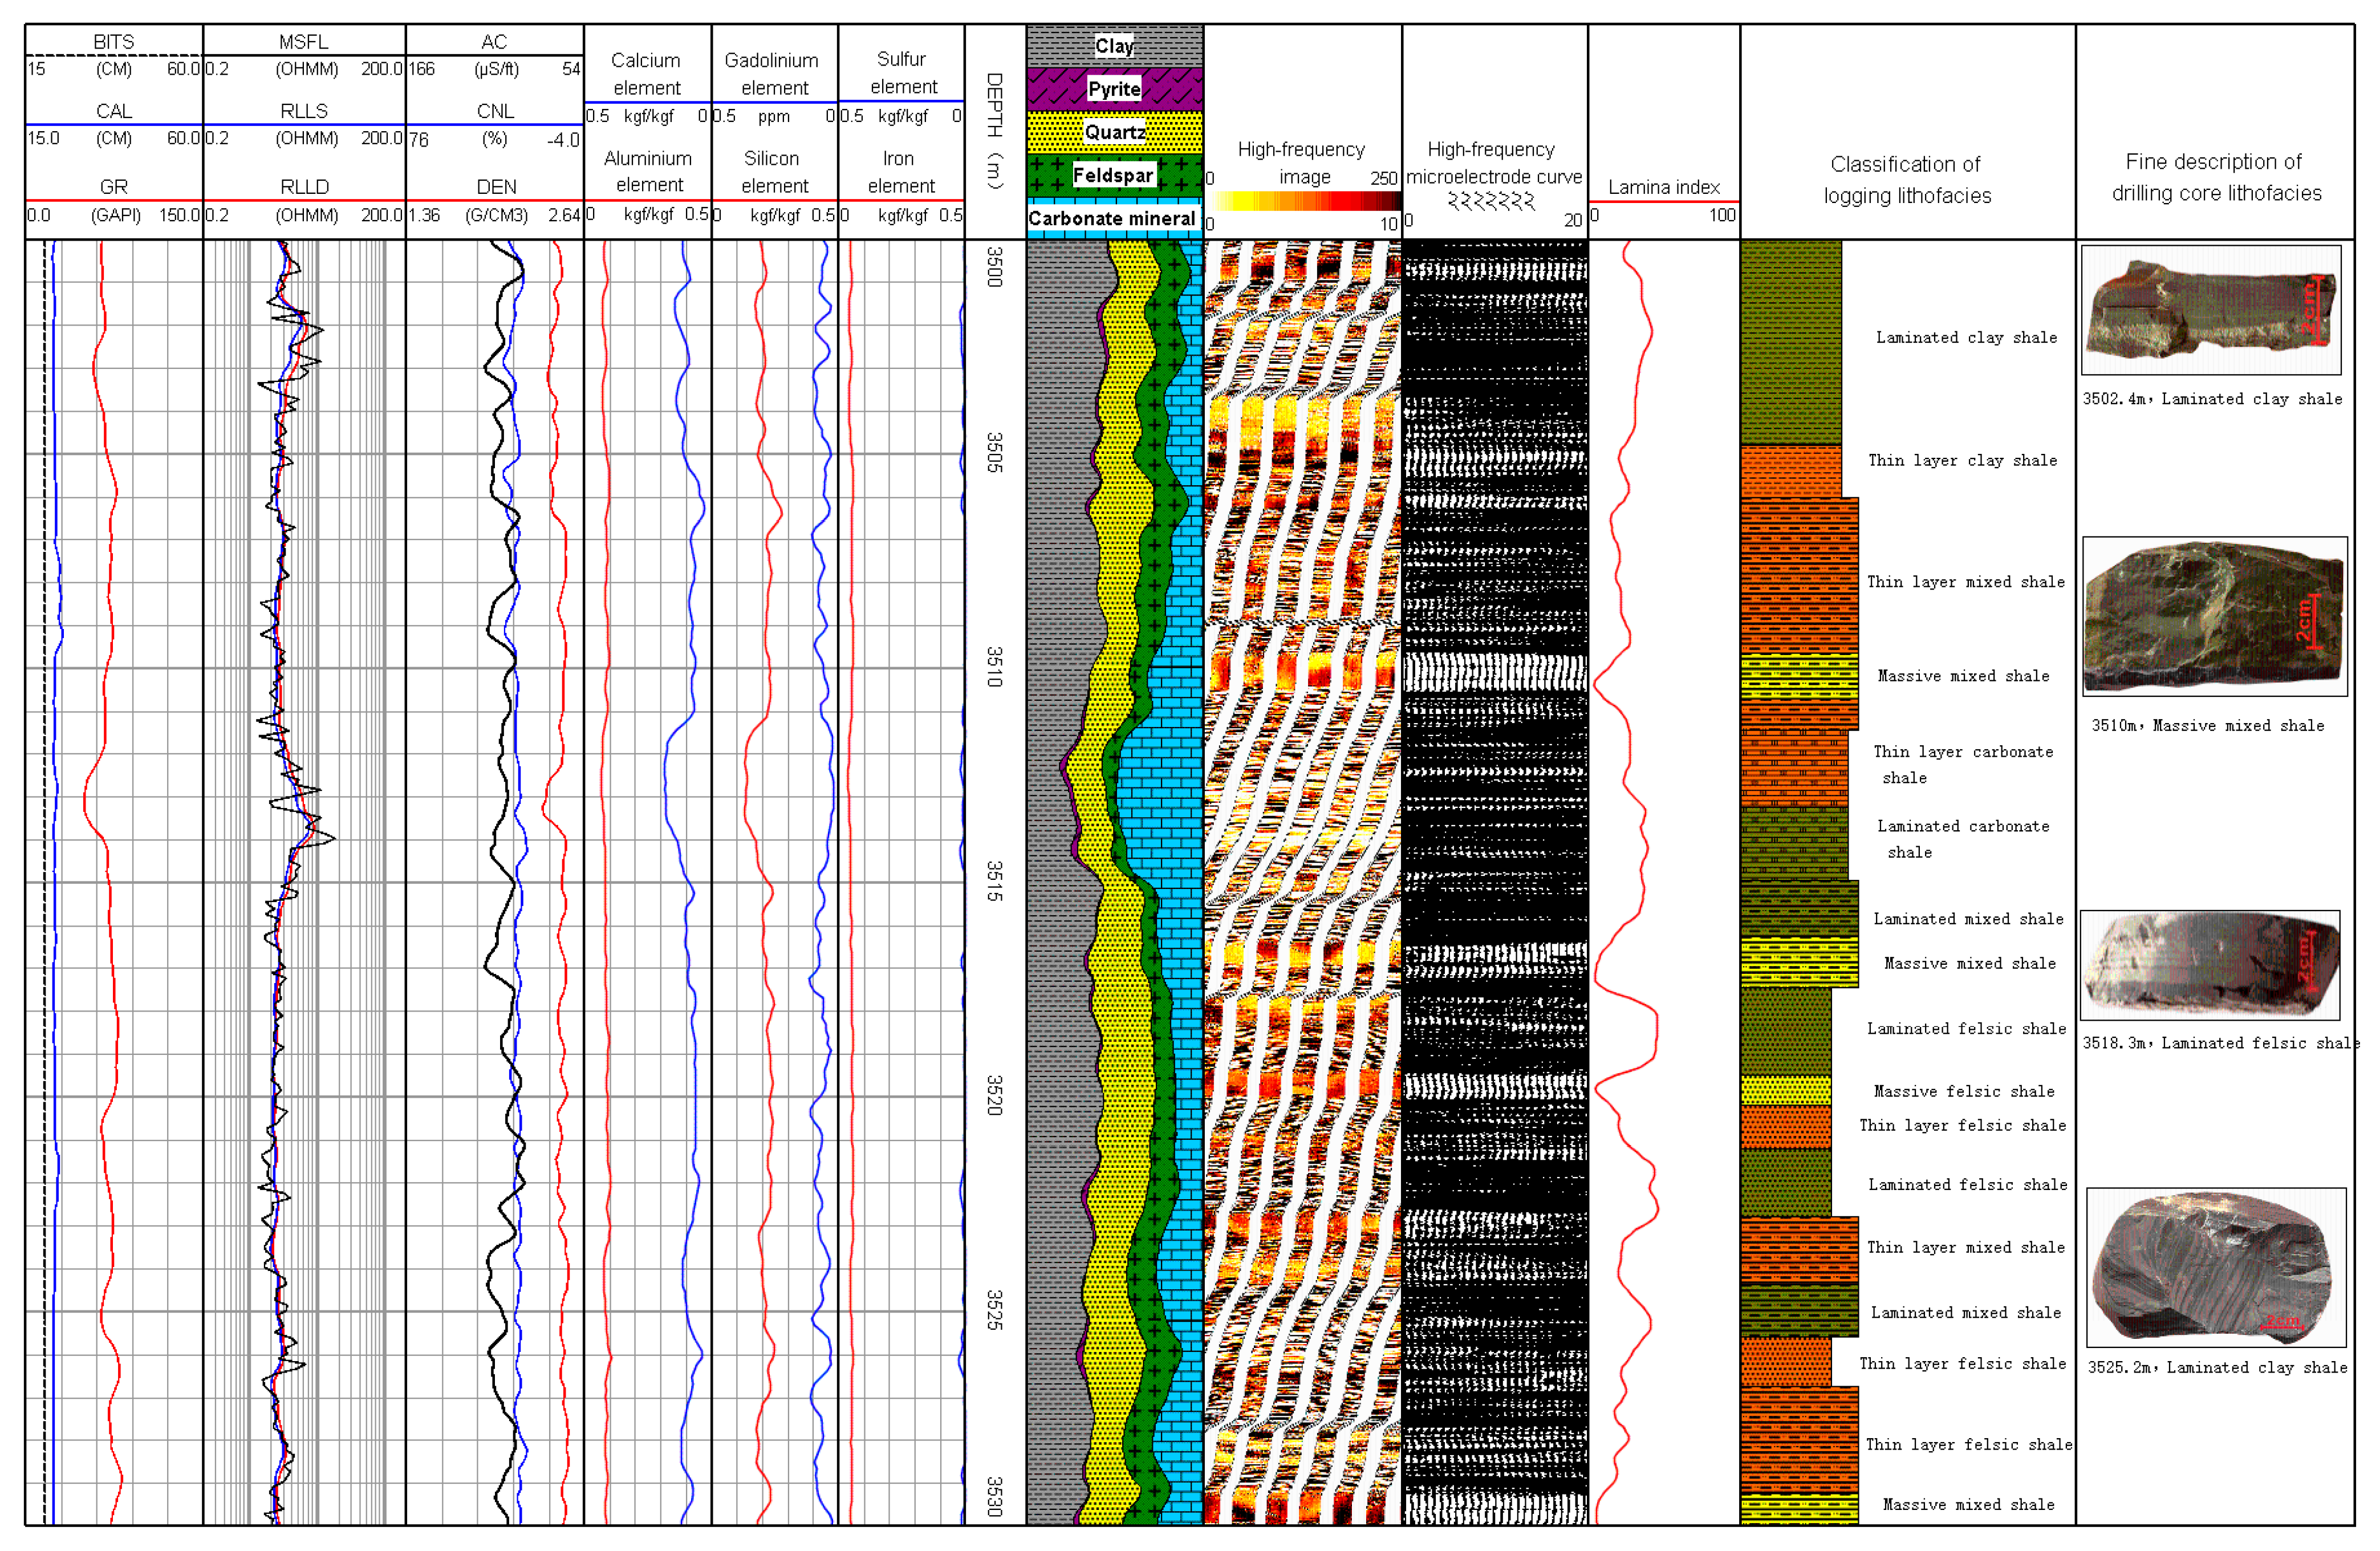
4. Application Examples

Based on the established shale oil reservoir lithofacies classification scheme, the mineral composition content calculated from formation element logging is used to classify rock types, and the lamina index calculated from electrical imaging logging is used to classify sedimentary structures. This forms a logging-based lithofacies classification standard for shale oil reservoirs, enabling the continuous evaluation of lithofacies in continental shale oil reservoirs using logging data and obtaining accurate lithofacies interpretation profiles.
Figure 11 shows the lithology identification results of the continental shale oil reservoir in Well NP1 of the study area. The eighth track in the figure shows the mineral composition calculated from the formation element logging, indicating a high content of clay minerals and felsic minerals, a low content of carbonate minerals, and localized enrichment. The 9th to 11th tracks show the high-frequency image from the electrically imaged logging after high-resolution processing, the microelectrode curve, and the calculated lamina index, respectively, indicating a relatively low lamina index in this shale oil reservoir section, which is dominated by thin-layered sedimentary structures. The 12th trace represents the log facies identified using the “rock type + sedimentary structure” facies identification method based on logging data. Within the 30 m interval from 3500 to 3530 m, four rock types and three sedimentary structural features were identified, totaling ten combinations of facies. The predominant lithofacies include thin-bedded mixed shale, laminated felsic shale, and laminated clayey shale. The identification results are consistent with the detailed core description presented in the 13th trace, and the lithofacies exhibit distinct vertical variations, providing richer information than the detailed core description.

5. Conclusions

Utilizing the Chebyshev optimal approximation method to design FIR high-pass filters, high-frequency information was extracted from electric imaging microresistivity curves. Effectively filtering out low-frequency impacts caused by lithological changes and borehole environmental factors, the generated high-frequency images enhance the fine structures of lamination and thin layers. The established lamination index quantitatively characterizes the degree of lamination development, achieving precise identification and division of lamination sedimentary structures.
Based on the optimal solution model for stratigraphic elemental logging calibrated by X-ray diffraction whole-rock analysis, the accuracy of mineral composition calculations from elemental logging can be effectively enhanced. Combined with the XRD mineral composition fine-grained sedimentary rock lithological division scheme, the optimal solution model meets the technical requirements for the precise lithological division of continental shale oil reservoirs in the Nanpu Sag.
Using electric imaging logging and stratigraphic elemental logging data, the “mineral composition + sedimentary structure” fine identification and division technology for continental shale oil lithofacies in the Nanpu Sag achieves excellent consistency with core descriptions in lithofacies identification. This technology provides effective technical support for identifying sweet spots in shale oil reservoirs.

Author Contributions

Conceptualization, Z.L.; formal analysis, A.S.; funding acquisition, H.W.; software, Q.W.; writing—original draft, Z.L.; writing—review and editing, X.L., H.Z., L.M. and H.W. All authors have read and agreed to the published version of the manuscript.

Funding

Crushability Evaluation of Continental Shale Oil Reservoirs Based on Dynamic Transformation of Clay Minerals (LH2024D010), to Huijian Wen.

Institutional Review Board Statement

This article does not include any studies involving humans or animals.

Data Availability Statement

The raw data supporting the conclusions of this article will be made available by the authors without undue reservation.

Conflicts of Interest

Author Zhongkui Liang, He Zhou, Lingjian Meng, Aiyan Sun and Qiong Wu were employed by the company PetroChina. The remaining authors declare that the research was conducted in the absence of any commercial or financial relationships that could be construed as a potential conflict of interest.

References

  1. Li, G.; Liu, G.; Hou, Y.; Zhao, X.; Wu, J.; Li, S.; Xian, C.; Liu, H. Optimization method of favorable lithofacies and fracturing parameter for continental shale oil. Acta Pet. Sin. 2021, 42, 1405–1416. [Google Scholar] [CrossRef]
  2. Carvajal-Ortiz, H.; Gentzis, T.; Ostadhassan, M. Sulfur Differentiation in Organic-Rich Shales and Carbonates via Open-System Programmed Pyrolysis and Oxidation: Insights into Fluid Souring and H2S Production in the Bakken Shale, United States. Energy Fuels 2021, 35, 12030–12044. [Google Scholar] [CrossRef]
  3. Zou, C.; Zhu, R.; Bai, B.; Yang, Z.; Hou, L.; Zha, M.; Fu, J.; Shao, Y.; Liu, K.; Cao, H. Significance, Geologic Characteristics, Resource Potential and Future Challenges of Tight Oil and Shale Oil. Bull. Mineral. Petrol. Geochem. 2015, 34, 3–17. [Google Scholar] [CrossRef]
  4. Taghavinejad, A.; Sharifi, M.; Heidaryan, E.; Liu, K.; Ostadhassan, M. Flow modeling in shale gas reservoirs: A comprehensive review. J. Nat. Gas Sci. Eng. 2020, 83, 103535. [Google Scholar] [CrossRef]
  5. Li, N.; Feng, Z.; Wu, H.; Tian, H.; Liu, P.; Liu, Y.; Liu, Z.; Wang, K.; Xu, B. New advances in methods and technologies for well logging evaluation of continental shale oil in China. Acta Pet. Sin. 2023, 44, 28–44. [Google Scholar] [CrossRef]
  6. Chen, Z.; Jiang, C. An integrated mass balance approach for assessing hydrocarbon resources in a liquid-rich shale resource play: An example from upper devonian Duvernay formation, western Canada sedimentary basin. J. Earth Sci. 2020, 31, 1259–1272. [Google Scholar] [CrossRef]
  7. Basu, S.; Jones, A.; Mahzari, P. Best practices for shale core handling: Transportation, sampling and storage for conduction of analyses. J. Mar. Sci. Eng. 2020, 8, 136. [Google Scholar] [CrossRef]
  8. Day-Stirrat, R.J.; Hillier, S.; Nikitin, A.; Hofmann, R.; Mahood, R.; Mertens, G. Natural gamma-ray spectroscopy (NGS) as a proxy for the distribution of clay minerals and bitumen in the Cretaceous McMurray Formation, Alberta, Canada. Fuel 2021, 288, 119513. [Google Scholar] [CrossRef]
  9. Liu, B.; Shi, J.; Fu, X.; Lyu, Y.; Sun, X.; Gong, L.; Bai, Y. Petrological characteristics and shale oil enrichment of lacustrine fine-grained sedimentary system: A case study of organic-rich shale in first member of Cretaceous Qingshankou Formation in Gulong Depression, Songliao Basin, NE China. Pet. Explor. Dev. 2018, 45, 828–838. [Google Scholar] [CrossRef]
  10. Liu, B.; Sun, J.; Zhang, Y.; He, J.; Fu, X.; Yang, L.; Xing, J.; Zhao, X. Reservoir space and enrichment model of shale oil in the first member of Cretaceous Qingshankou Formation in the Changling Depression, southern Songliao Basin, NE China. Pet. Explor. Dev. 2021, 48, 521–535. [Google Scholar] [CrossRef]
  11. Kumar, S.; Das, S.; Bastia, R.; Ojha, K. Mineralogical and morphological characterization of older Cambay shale from North Cambay Basin, India: Implication for shale oil/gas development. Mar. Pet. Geol. 2018, 97, 339–354. [Google Scholar] [CrossRef]
  12. Körmös, S.; Varga, A.; Raucsik, B. Reservoir heterogeneity of an Eocene mixed siliciclastic-carbonate succession, northern Pannonian Basin. Mar. Pet. Geol. 2023, 147, 105984. [Google Scholar] [CrossRef]
  13. Haluch, A.; Rybak-Ostrowska, B.; Wygladala, M. Interplay of organic matter, rock anisotropy, and horizontal shortening in bed-parallel vein development within the lower Palaeozoic shale formations from the northern part of the Caledonian Foredeep Basin (Poland). Mar. Pet. Geol. 2023, 155, 106387. [Google Scholar] [CrossRef]
  14. Liu, H.; Yu, B.; Xie, Z.; Han, S.; Shen, Z.; Bai, C. Characteristics and implications of micro-lithofacies in lacustrine- basin organic-rich shale: A case study of Jiyang depression, Bohai Bay Basin. Acta Pet. Sin. 2018, 39, 1328–1343. [Google Scholar] [CrossRef]
  15. Liu, H.; Wang, Y.; Yang, Y.; Zhang, S. Sedimentary Environment and Lithofacies of Fine-Grained Hybrid Sedimentary in Dongying Depression: A Case of Fine-Grained Sedimentary System of the Es4. Earth Sci. 2020, 45, 3543–3555. [Google Scholar] [CrossRef]
  16. Bhattacharya, S.; Carr, T.R. Integrated Data-Driven 3D Shale Lithofacies Modeling of the Bakken Formation in the Williston Basin, North Dakota, United States. J. Pet. Sci. Eng. 2019, 177, 1072–1086. [Google Scholar] [CrossRef]
  17. Bhattacharya, S.; Carr, T.R.; Pal, M. Comparison of Supervised and Unsupervised Approaches for Mudstone Lithofacies Classification: Case Studies from the Bakken and Mahantango-Marcellus Shale, USA. J. Nat. Gas Sci. Eng. 2016, 33, 1119–1133. [Google Scholar] [CrossRef]
  18. Bressan, T.S.; Kehl De Souza, M.; Girelli, T.J.; Junior, F.C. Evaluation of Machine Learning Methods for Lithology Classification Using Geophysical Data. Comput. Geosci. 2020, 139, 104475. [Google Scholar] [CrossRef]
  19. Li, Z.; Tang, X.; Huang, L.; Chang, Q.; Yang, L.; Yang, R. Lithofacies development characteristics of Fengcheng Formation shale in Mahu Depression, Junggar Basin. China Energy Environ. Prot. 2021, 43, 108–114. [Google Scholar] [CrossRef]
  20. Liu, Z.; Liu, G.; Hu, Z.; Feng, D.; Zhu, T.; Bian, R.; Jiang, T.; Jin, Z. Lithofacies types and assemblage features of continental shale strata and their sig- nificance for shale gas exploration: A case study of the Middle and Lower Jurassic strata in the Sichuan Basin. Nat. Gas Ind. 2019, 39, 10–21. [Google Scholar]
  21. Zhu, X.; Duan, H.; Sun, Y. Breakthrough and significance of Paleogene continental shale oil exploration in Gaoyou Depression, Subei Basin. Acta Pet. Sin. 2023, 44, 1206–1221. [Google Scholar] [CrossRef]
  22. Avanzini, A.; Balossino, P.; Brignoli, M.; Spelta, E.; Tarchiani, C. Lithologic and geomechanical facies classification for sweet spot identification in gas shale reservoir. Interpretation 2016, 4, SL21–SL31. [Google Scholar] [CrossRef]
  23. Ehsan, M.; Gu, H. An integrated approach for the identiBcation of lithofacies and clay mineralogy through Neuro-Fuzzy, cross plot, and statistical analyses, from well log data. J. Earth Syst. Sci. 2020, 129, 101. [Google Scholar] [CrossRef]
  24. Santos, D.T.D.; Roisenberg, M.; Nascimento, M.D.S. Deep Recurrent Neural Networks Approach to Sedimentary Facies Classifica tion Using Well Logs. IEEE Geosci. Remote Sens. Lett. 2022, 19, 3001405. [Google Scholar] [CrossRef]
  25. Liu, G. Challenges and countermeasures of well logging data acquisition technology in unconventional petroleum exploration and development. China Pet. Explor. 2021, 26, 24–37. [Google Scholar]
  26. Liu, S.; Cao, Y.; Liang, C. Lithologic characteristics and sedimentary environment of fine-grained sedimentary rocks of the Paleogene in Dongying Depression, Bohai Bay Basin. J. Palaeogeogr. (Chin. Ed.) 2019, 21, 479–489. [Google Scholar] [CrossRef]
  27. Liu, H.; Sun, S.; Cao, Y.; Cao, Y.; Liang, C.; Zhang, C. Lithofacies characteristics and distribution model of fine-grained sedimentary rock in the lower Es3 member, Dongying Depression. Pet. Geol. Recovery Effic. 2017, 24, 1–10. [Google Scholar]
  28. Zhou, L.; Pu, X.; Deng, Y.; Chen, S.; Yan, J.; Han, W. Several issues in studies on fine-grained sedimentary rocks. Lithol. Reserv. 2016, 28, 6–15. [Google Scholar]
  29. Jarvie, D.M. Shale resource systems for oil and gas: Part 2—Shale-oil resource systems. AAPG Mem. 2012, 97, 89–119. [Google Scholar]
  30. Liu, G.; Zhao, X.; Yuan, C.; Li, S.; Liu, Z. Logging evaluation of macro-structure of continental shale oil reservoir and sweet spots selection. China Pet. Explor. 2023, 28, 120–134. [Google Scholar]
  31. Cavelan, A.; Boussafir, M.; Milbeau, C.L.; Fatima, L. Impact of oil-prone sedimentary organic matter quality and hydrocarbon generation on source rock porosity: Artificial thermal maturation approach. ACS Omega 2020, 5, 14013–14029. [Google Scholar] [CrossRef] [PubMed]
  32. Yan, J.; Pu, X.; Zhou, L.; Chen, S.; Han, W. Naming Method of Fine-grained Sedimentary Rocks on Basis of X-ray Diffraction Data. China Pet. Explor. 2015, 20, 48–54. [Google Scholar] [CrossRef]
  33. Liu, G. Challenges and countermeasures of log evaluation in unconventional petroleum exploration. Pet. Explor. Dev. 2021, 48, 891–902. [Google Scholar] [CrossRef]
  34. Li, N.; Yan, W.; Wu, H.; Zheng, J.; Feng, Z.; Zhang, Z.; Wang, K.; Wang, J. Current situation, problems and countermeasures of the well-logging evaluation technology for Gulong shale oil. Pet. Geol. Oilfield Dev. Daqing 2020, 39, 117–128. [Google Scholar] [CrossRef]
  35. Hakimi, M.; Ahmed, A. Petroleum source rock characterisation and hydrocarbon generation modeling of the Cretaceous sediments in the Jiza sub-basin, eastern Yemen. Mar. Petrol. Geol. 2016, 75, 356–373. [Google Scholar] [CrossRef]
  36. Kumar, A.; Laronga, R.; Kherroubi, J.; Bringer, F.; Kear, G.; Herrera, J. Visualizing Borehole Images in a Slabbed-Core Format; EAGE: Dubai, United Arab Emirates, 2014. [Google Scholar]
  37. Cui, B.; Chen, C.; Lin, X.; Zhao, Y.; Chen, X.; Zhang, Y.; Lu, G. Characteristics and distribution of sweet spots in Gulong shale oil reservoirs of Songliao Basin. Pet. Geol. Oilfield Dev. Daqing 2020, 39, 45–55. [Google Scholar] [CrossRef]
  38. Du, J.; Hu, S.; Pang, Z.; Lin, S.; Hou, L.; Zhu, R. The types, potentials and prospects of continental shale oil in China. China Pet. Explor. 2019, 24, 560–568. [Google Scholar] [CrossRef]
  39. Wu, J.; Li, H.; Yang, X.; Zhao, S.; Guo, W.; Sun, Y.; Liu, Y.; Liu, Z. Types and combinations of deep marine shale laminae and their effects on reservoir quality: A case study of the first submember of member 1 of Longmaxi Formation in Luzhou block, South Sichuan Basin. China Pet. Acta Petrolei Sinica. 2023, 44, 1517–1531. [Google Scholar]
Figure 1. Technology roadmap for lithofacies identification based on well logging data.
Minerals 15 00484 g001
Figure 2. The development map of favorable zones for shale oil reservoirs in the Nanpu Sag. (a) General location map of the study area in China, (b) Map of the Bohai Bay, (c) Location map of the study area in the Nanpu Sag.
Minerals 15 00484 g002
Figure 3. X-ray diffraction mineral component distribution map of the continental shale oil reservoir in the Nanpu Sag. (A) The graph of the lithological distribution. (B) The graph of the clay mineral distribution.
Minerals 15 00484 g003
Figure 4. Acroscopic characteristics of sedimentary structure in Nanpu Sag.
Minerals 15 00484 g004
Figure 5. Microscopic characteristics of sedimentary structure in Nanpu Sag.
Minerals 15 00484 g005
Figure 6. Ternary diagram for lithology classification based on XRD.
Minerals 15 00484 g006
Figure 7. Comparison between the mineral components from elemental capture spectroscopy logging and the mineral components from X-ray diffraction whole-rock analysis results.
Minerals 15 00484 g007
Figure 8. The amplitude frequency response of FIR high-pass filter.
Minerals 15 00484 g008
Figure 9. The unit sampling response of FIR high-pass filter.
Minerals 15 00484 g009
Figure 10. Identification results of sedimentary structures in electric imaging logging.
Minerals 15 00484 g010
Figure 11. Results of identification and evaluation of logging lithofacies in NP1 well.
Minerals 15 00484 g011
Table 1. Lithofacies division scheme of the continental shale oil reservoir in Nanpu Sag.
Type of RockMineral Component Content (%)Sedimentary Structure (mm)Lamination
Index
Quartz + FeldsparCalcite + DolomiteClay.
Laminated felsic shale≥50<50<50<1>30
Thin layer felsic shale≥50<50<501 ≤ && ≤ 1010 ≤ && ≤ 30
Massive felsic shale≥50<50<50>10<10
Laminated carbonate shale<50≥50<50<1>30
Thin layer carbonate shale<50≥50<501 ≤ && ≤ 1010 ≤ && ≤ 30
Massive carbonate shale<50≥50<50>10<10
Laminated clay shale<50<50≥50<1>30
Thin layer clay shale<50<50≥501 ≤ && ≤ 1010 ≤ && ≤ 30
Massive clay shale<50<50≥50>10<10
Laminated mixed shale<50<50<50<1>30
Thin layer mixed shale<50<50<501 ≤ && ≤ 1010 ≤ && ≤ 30
Massive mixed shale<50<50<50>10<10
Disclaimer/Publisher’s Note: The statements, opinions and data contained in all publications are solely those of the individual author(s) and contributor(s) and not of MDPI and/or the editor(s). MDPI and/or the editor(s) disclaim responsibility for any injury to people or property resulting from any ideas, methods, instructions or products referred to in the content.

