


Critical Metal Potential of Tasmanian Greisen: Lithium, Rare Earth Elements, and Bismuth Distribution and Implications for Processing
 , , ,
, , ,
Abstract
1. Introduction
2. Materials and Methods
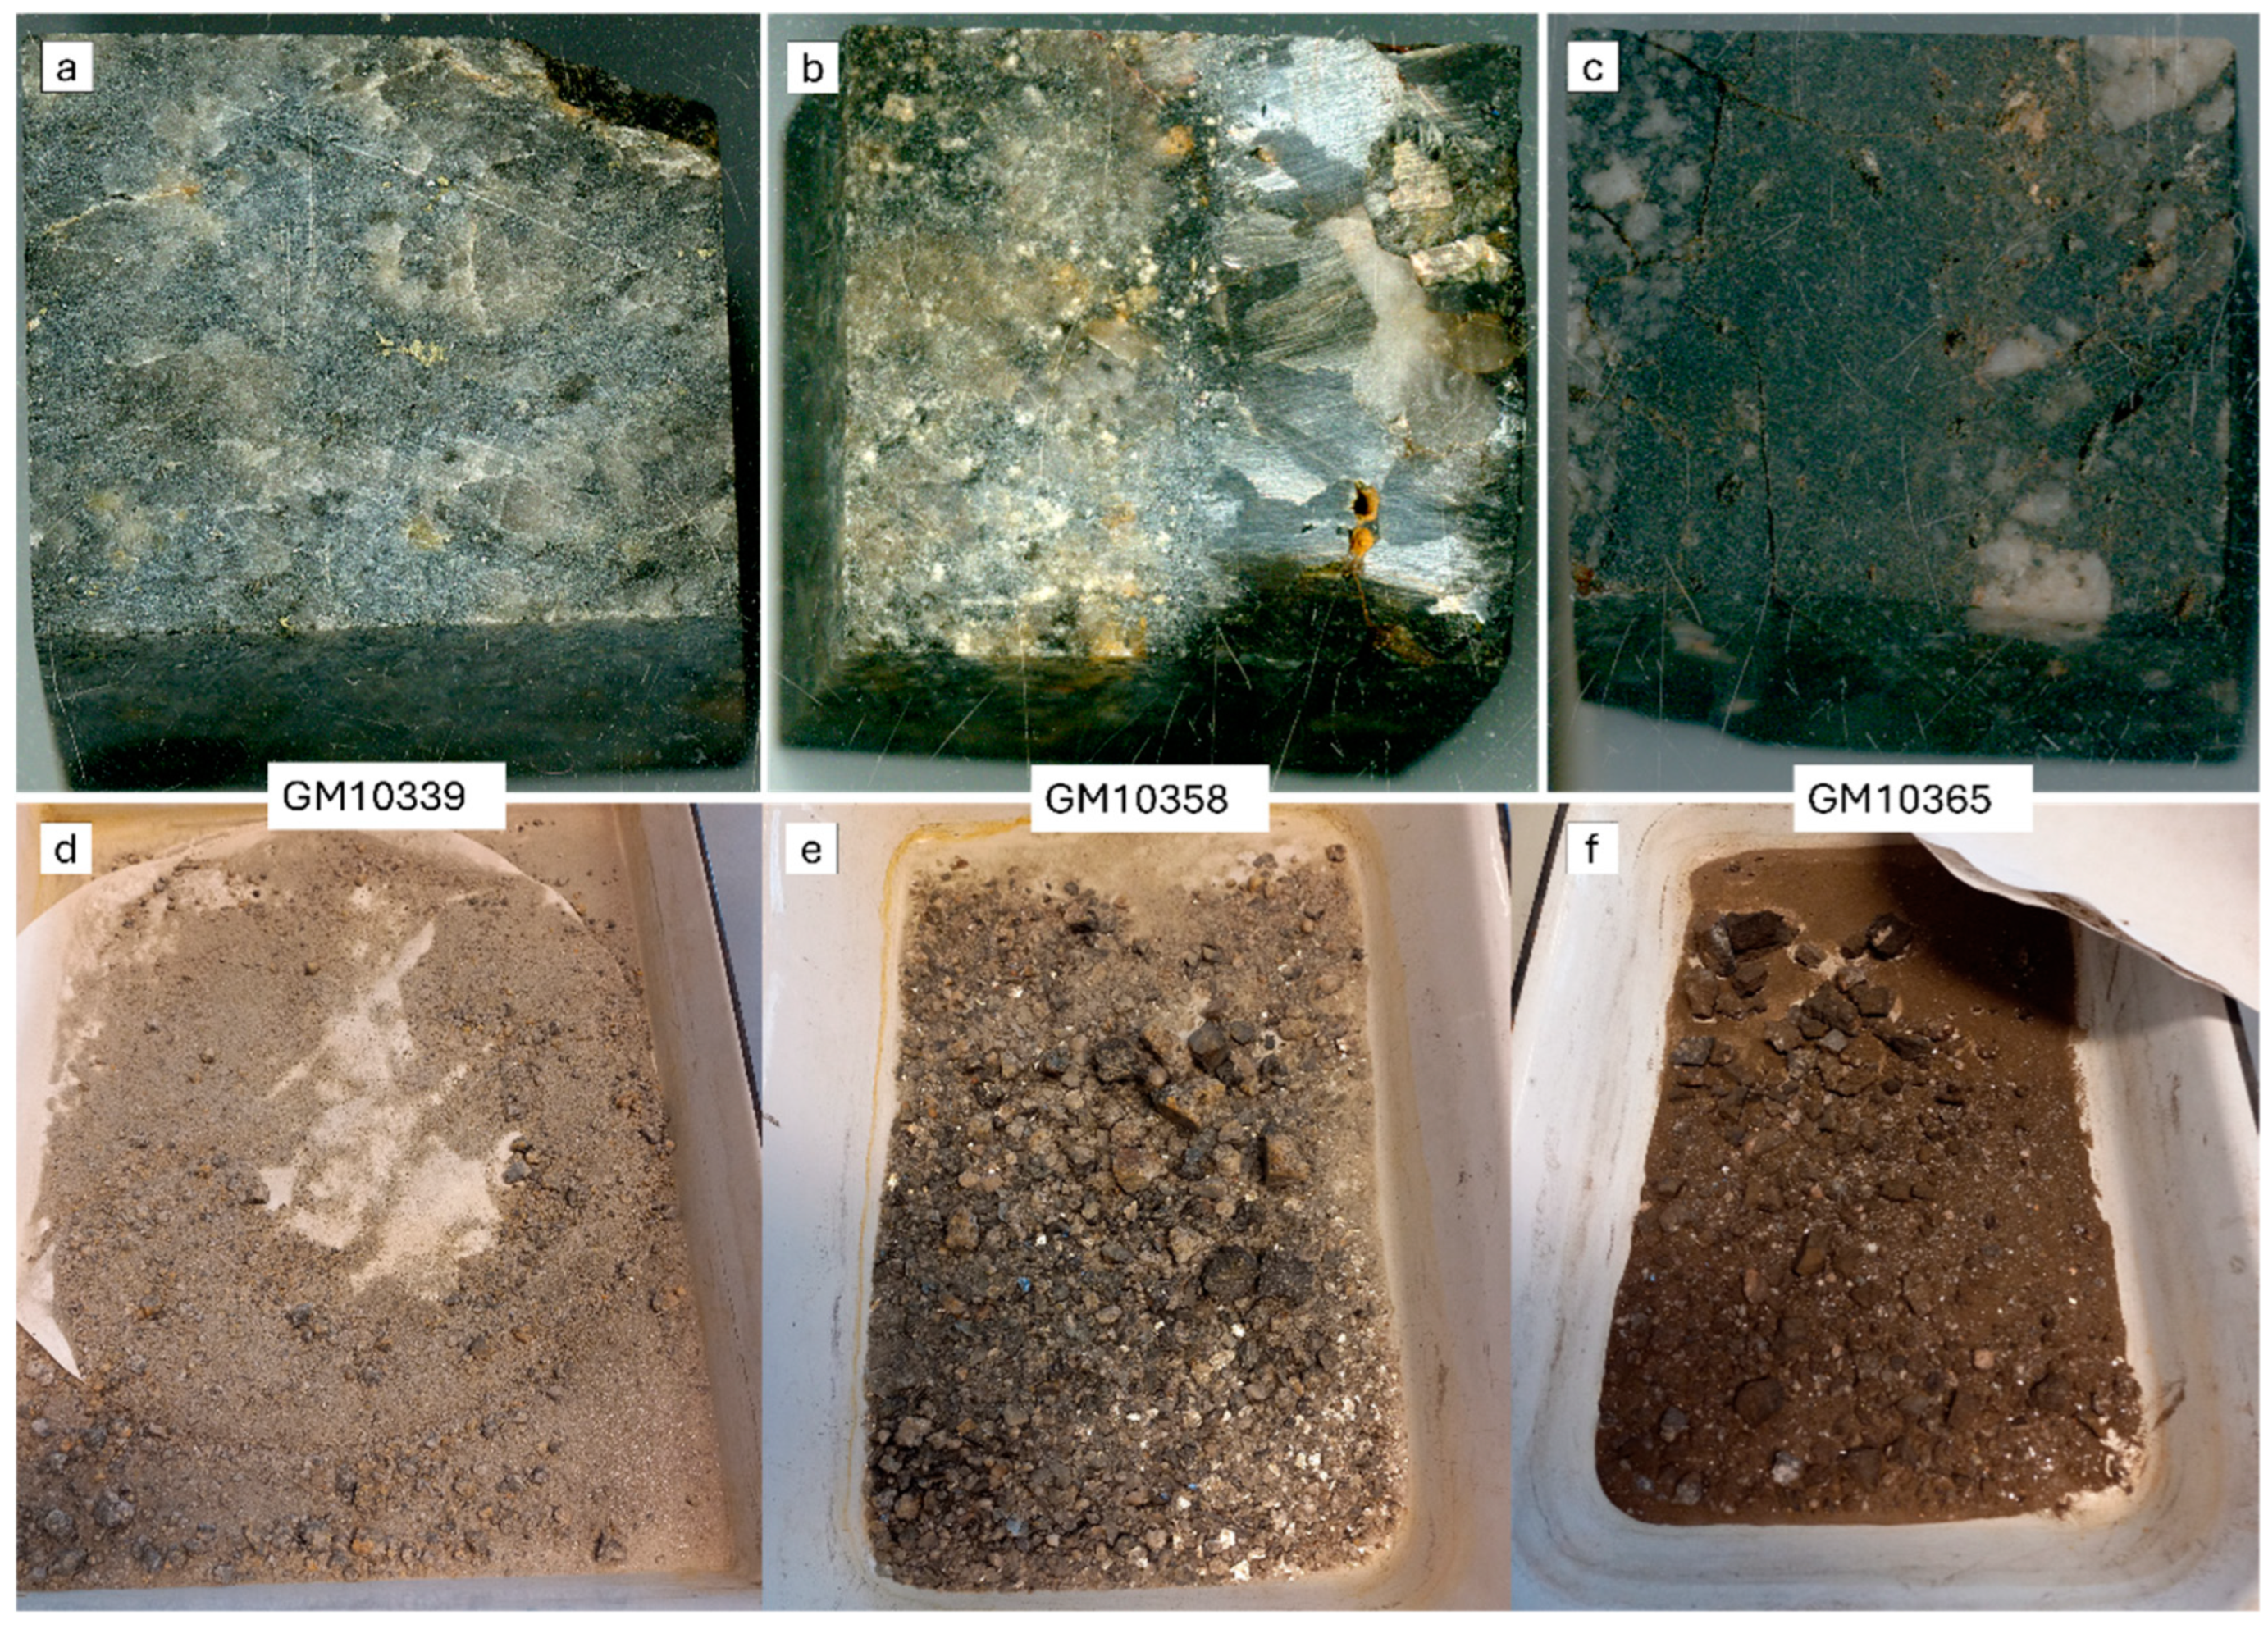
2.1. Samples
2.2. Geochemistry
2.3. Methods
2.3.1. Comminution—Electric Pulse Fragmentation (EPF)
2.3.2. Mineralogy—Scanning Electron Microscope (SEM)-Based Automated Mineralogy
2.3.3. Element Distribution—LA ICP-MS
2.3.4. Element Mapping—LA ICP-TOF-MS
3. Results
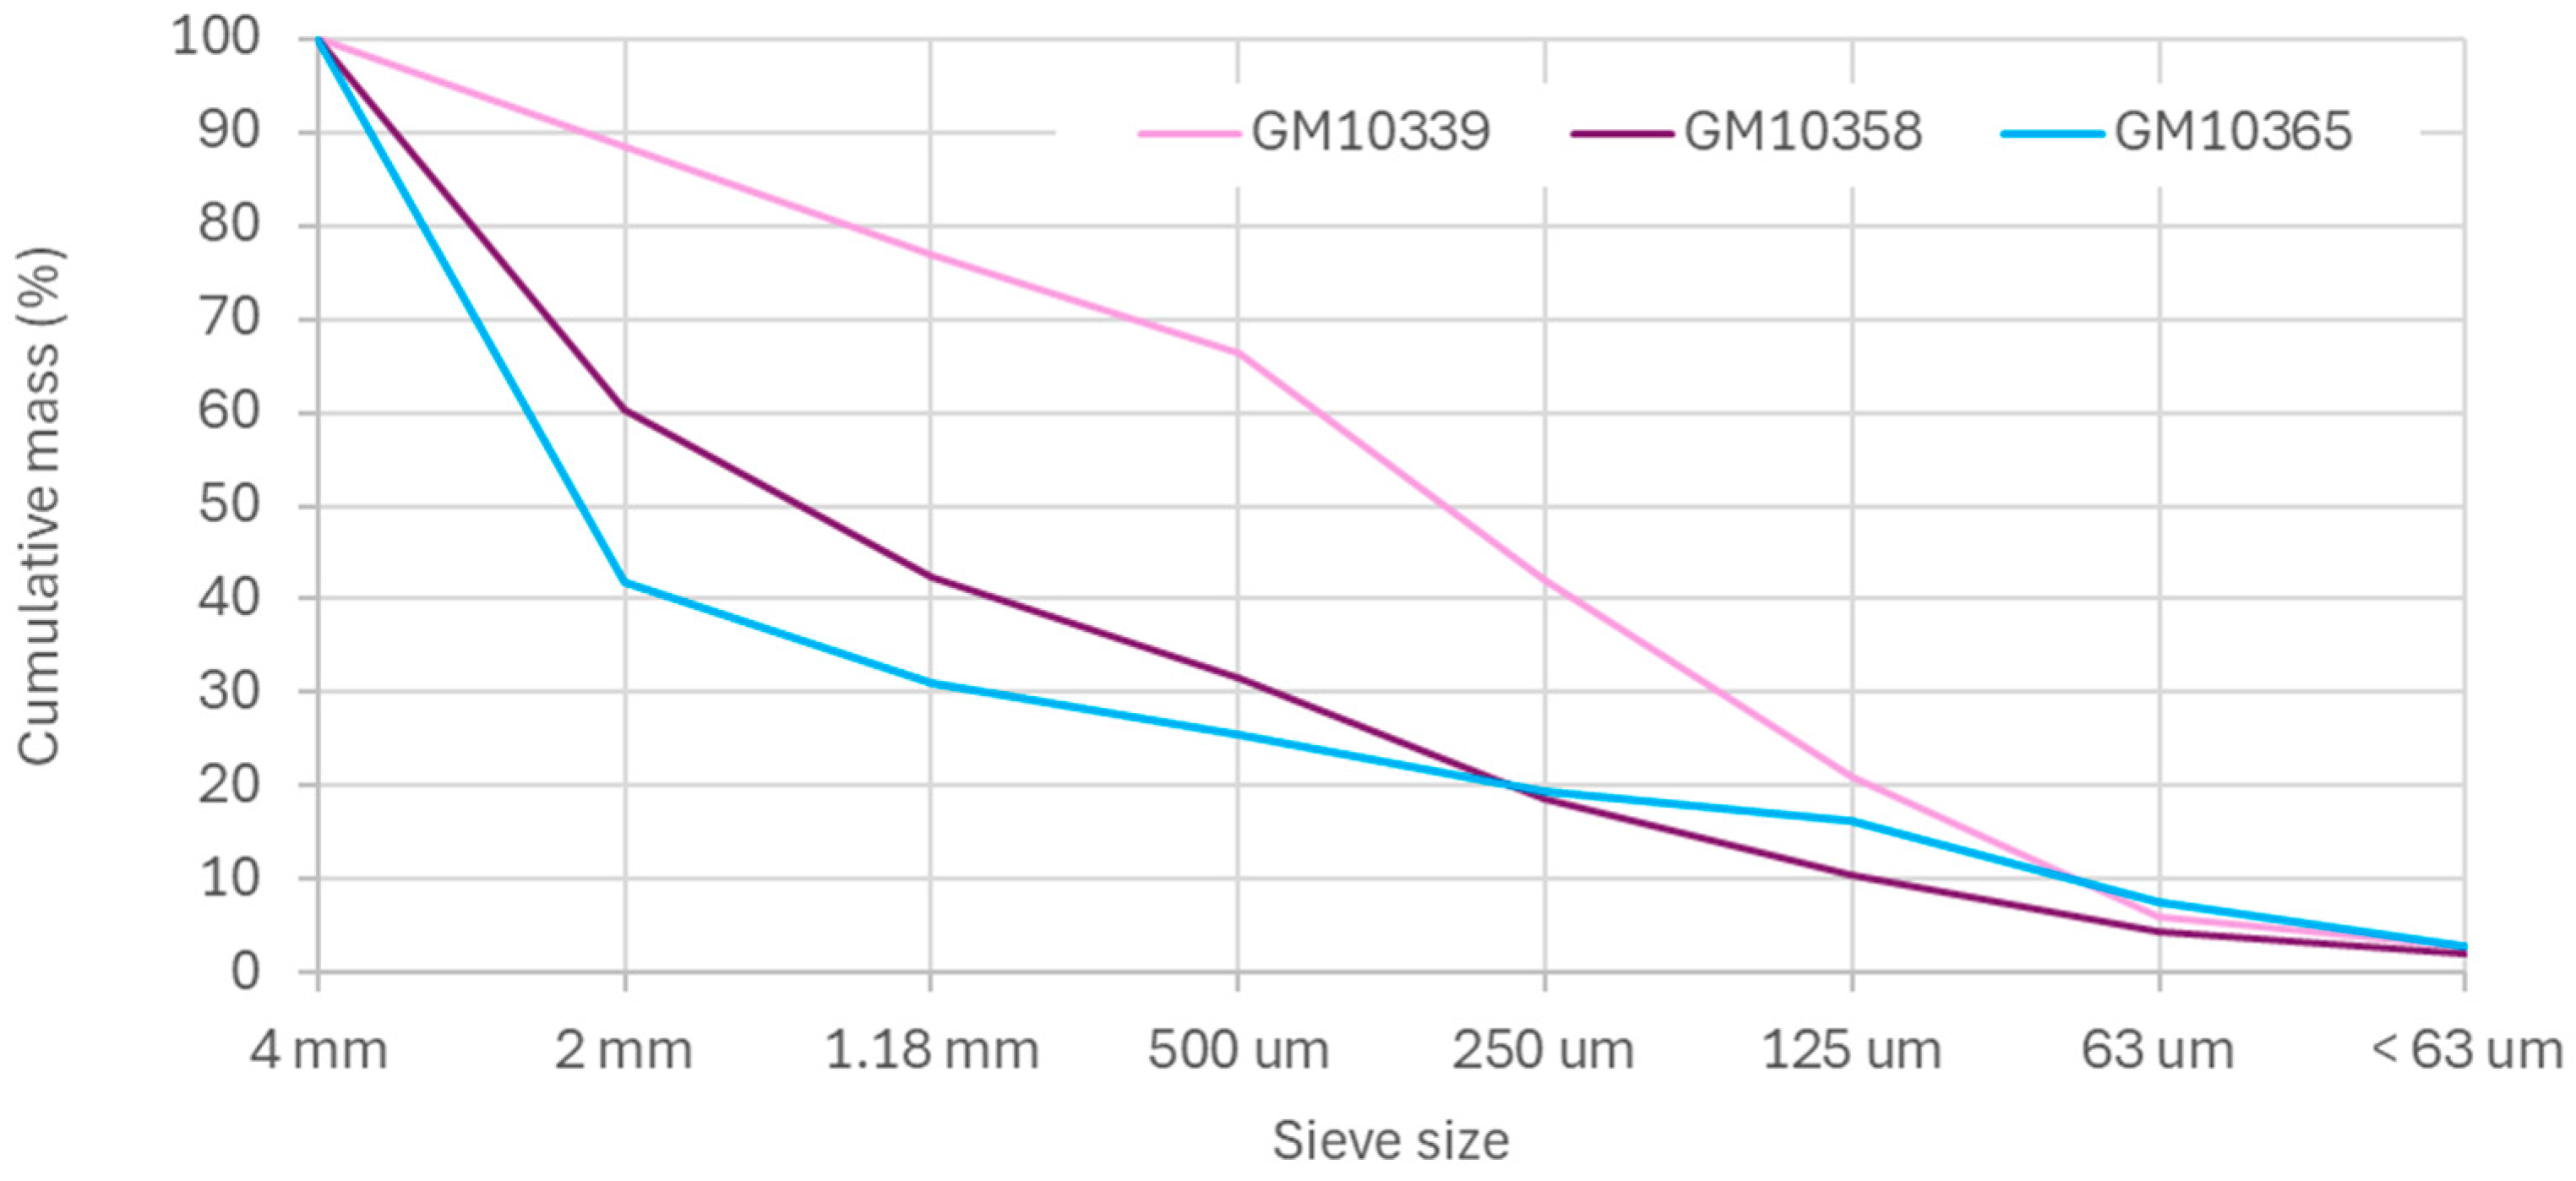
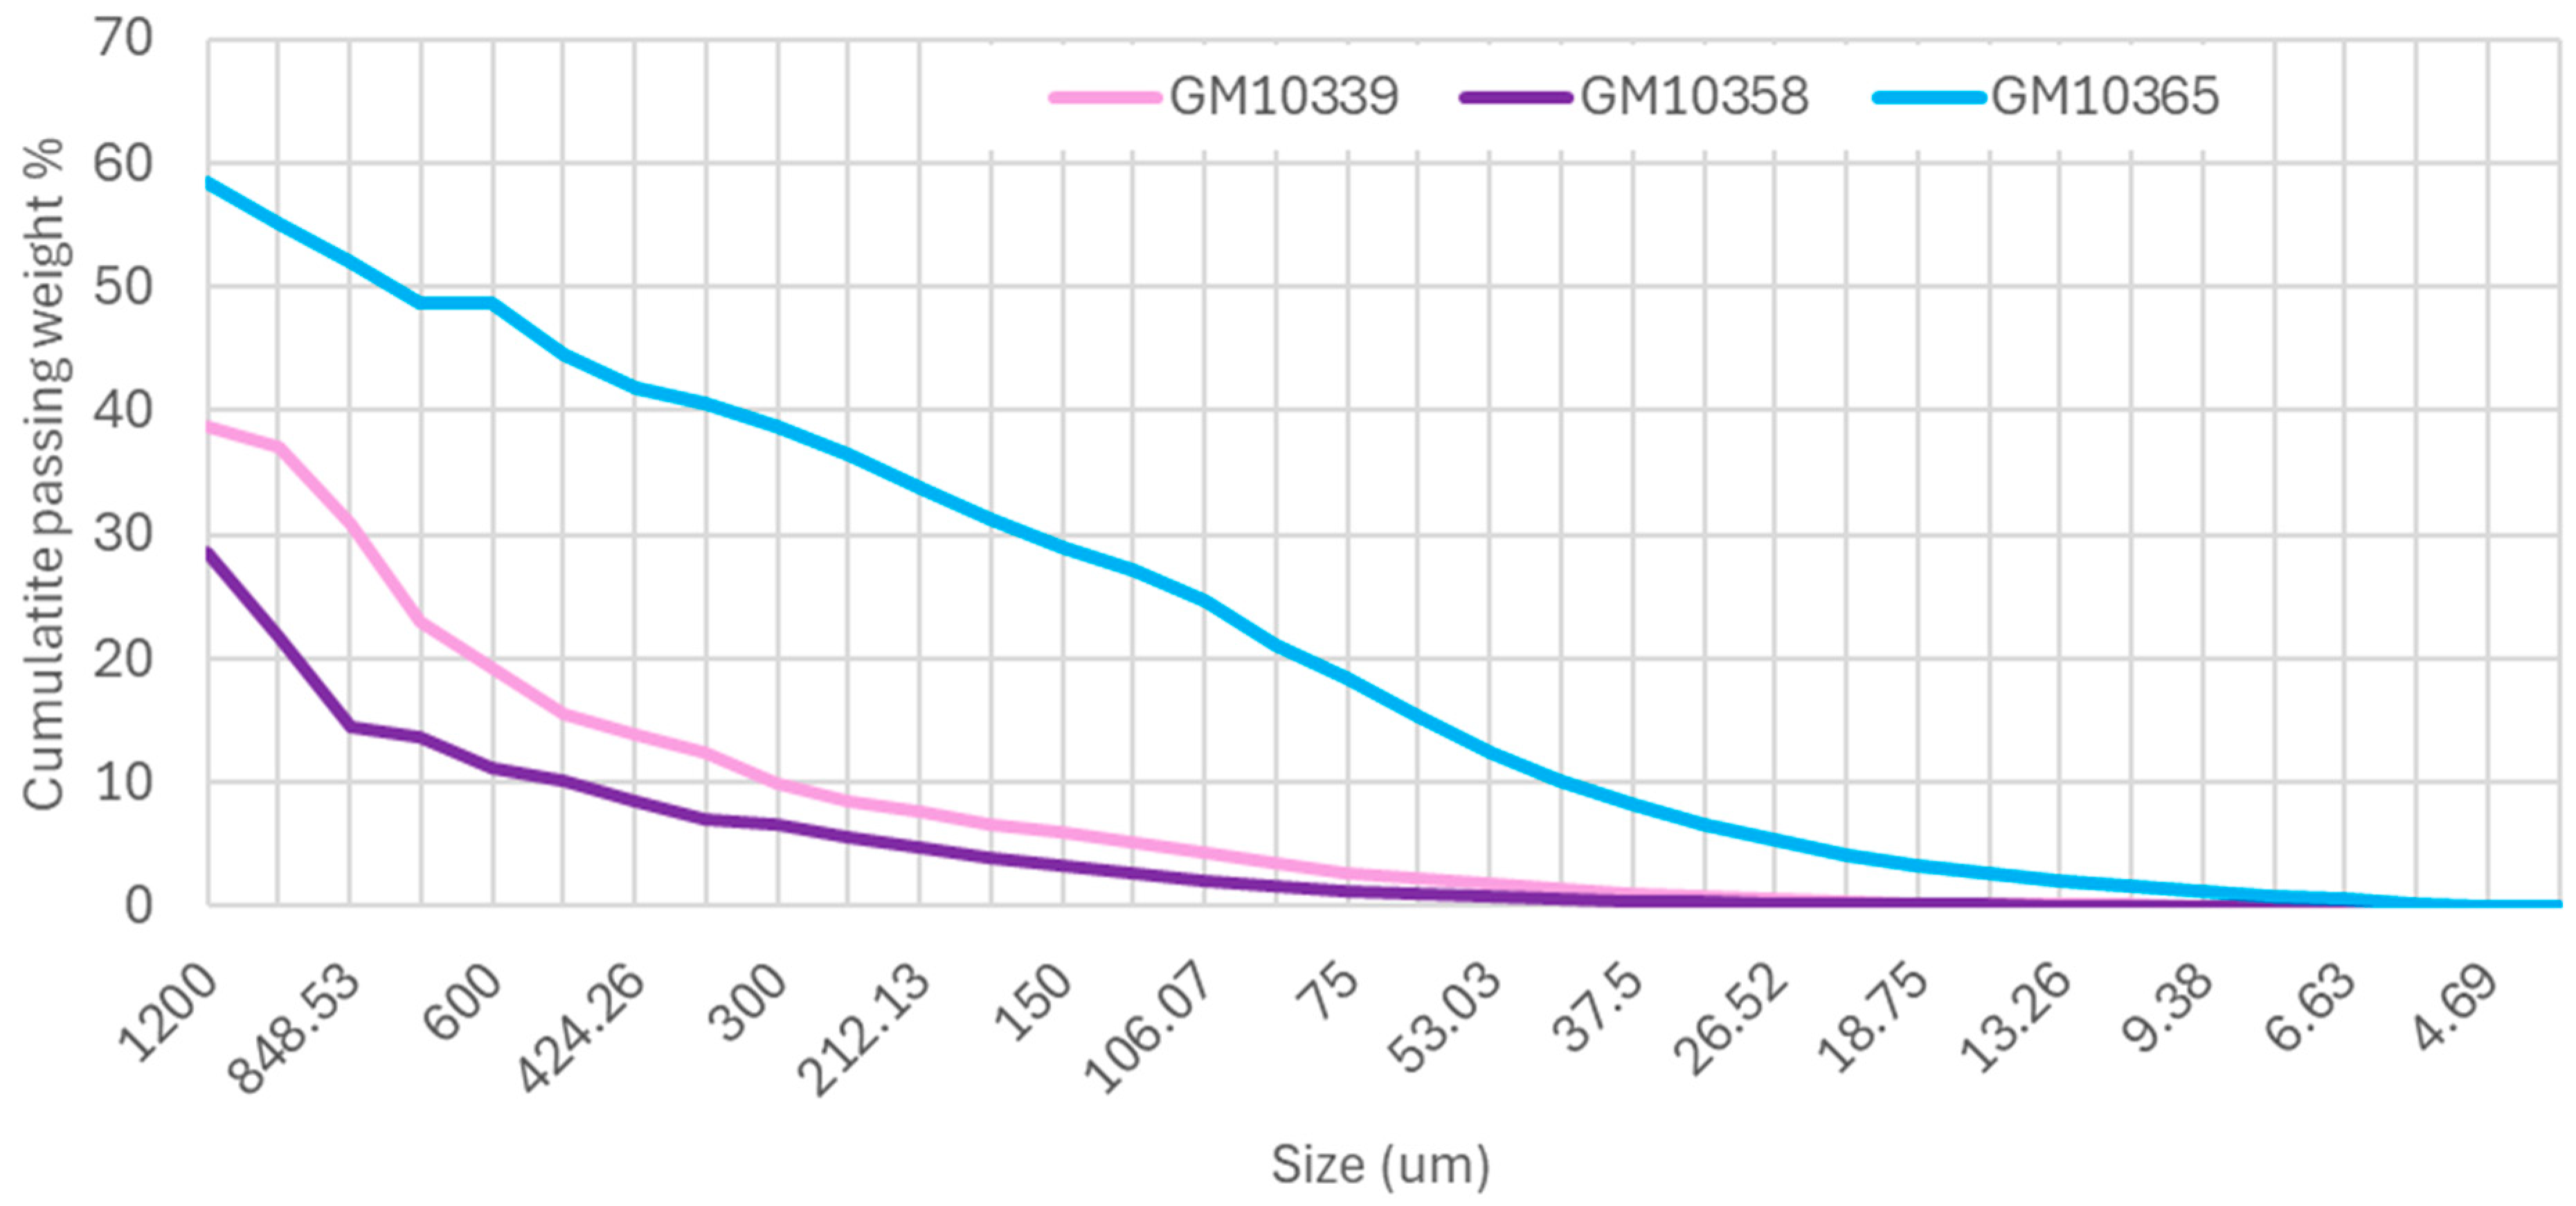
3.1. Electric Pulse Fragmentation (EPF)
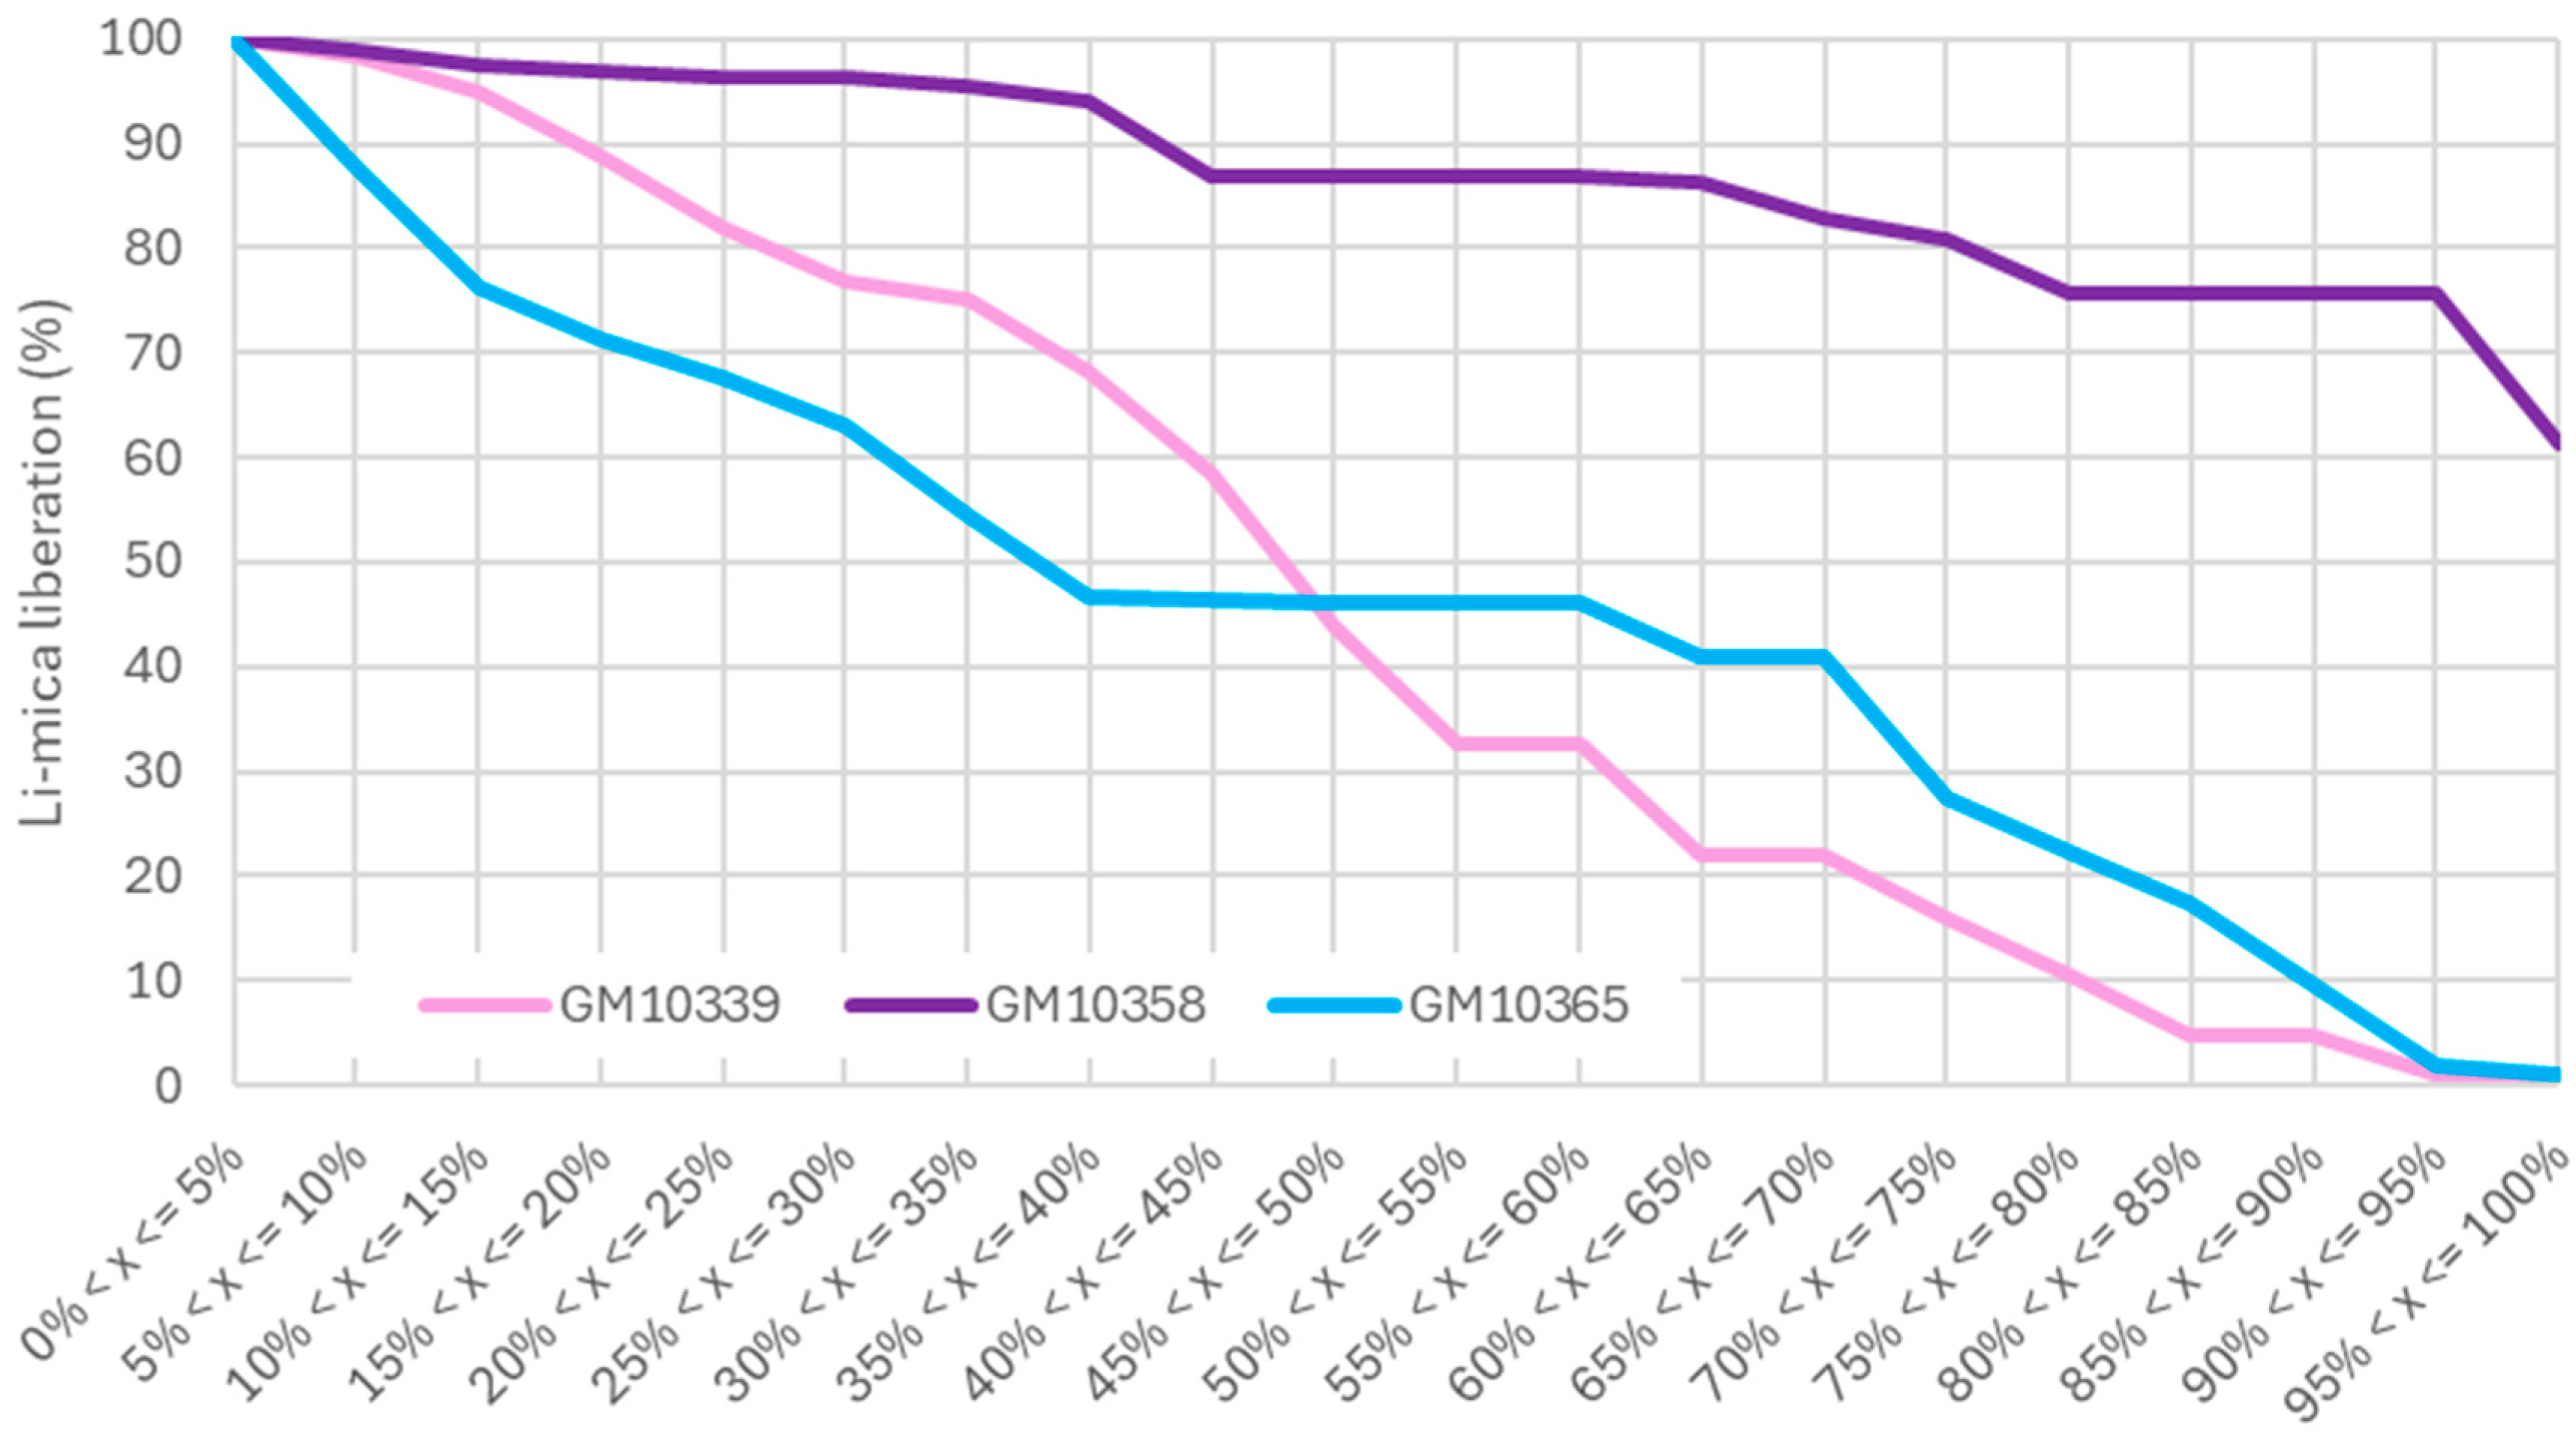
3.2. Mineralogy—Abundance, Liberation, and Association
3.2.1. Abundance
3.2.2. Liberation
3.2.3. Association
3.3. Element Distribution
3.3.1. SEM-AMICS Data
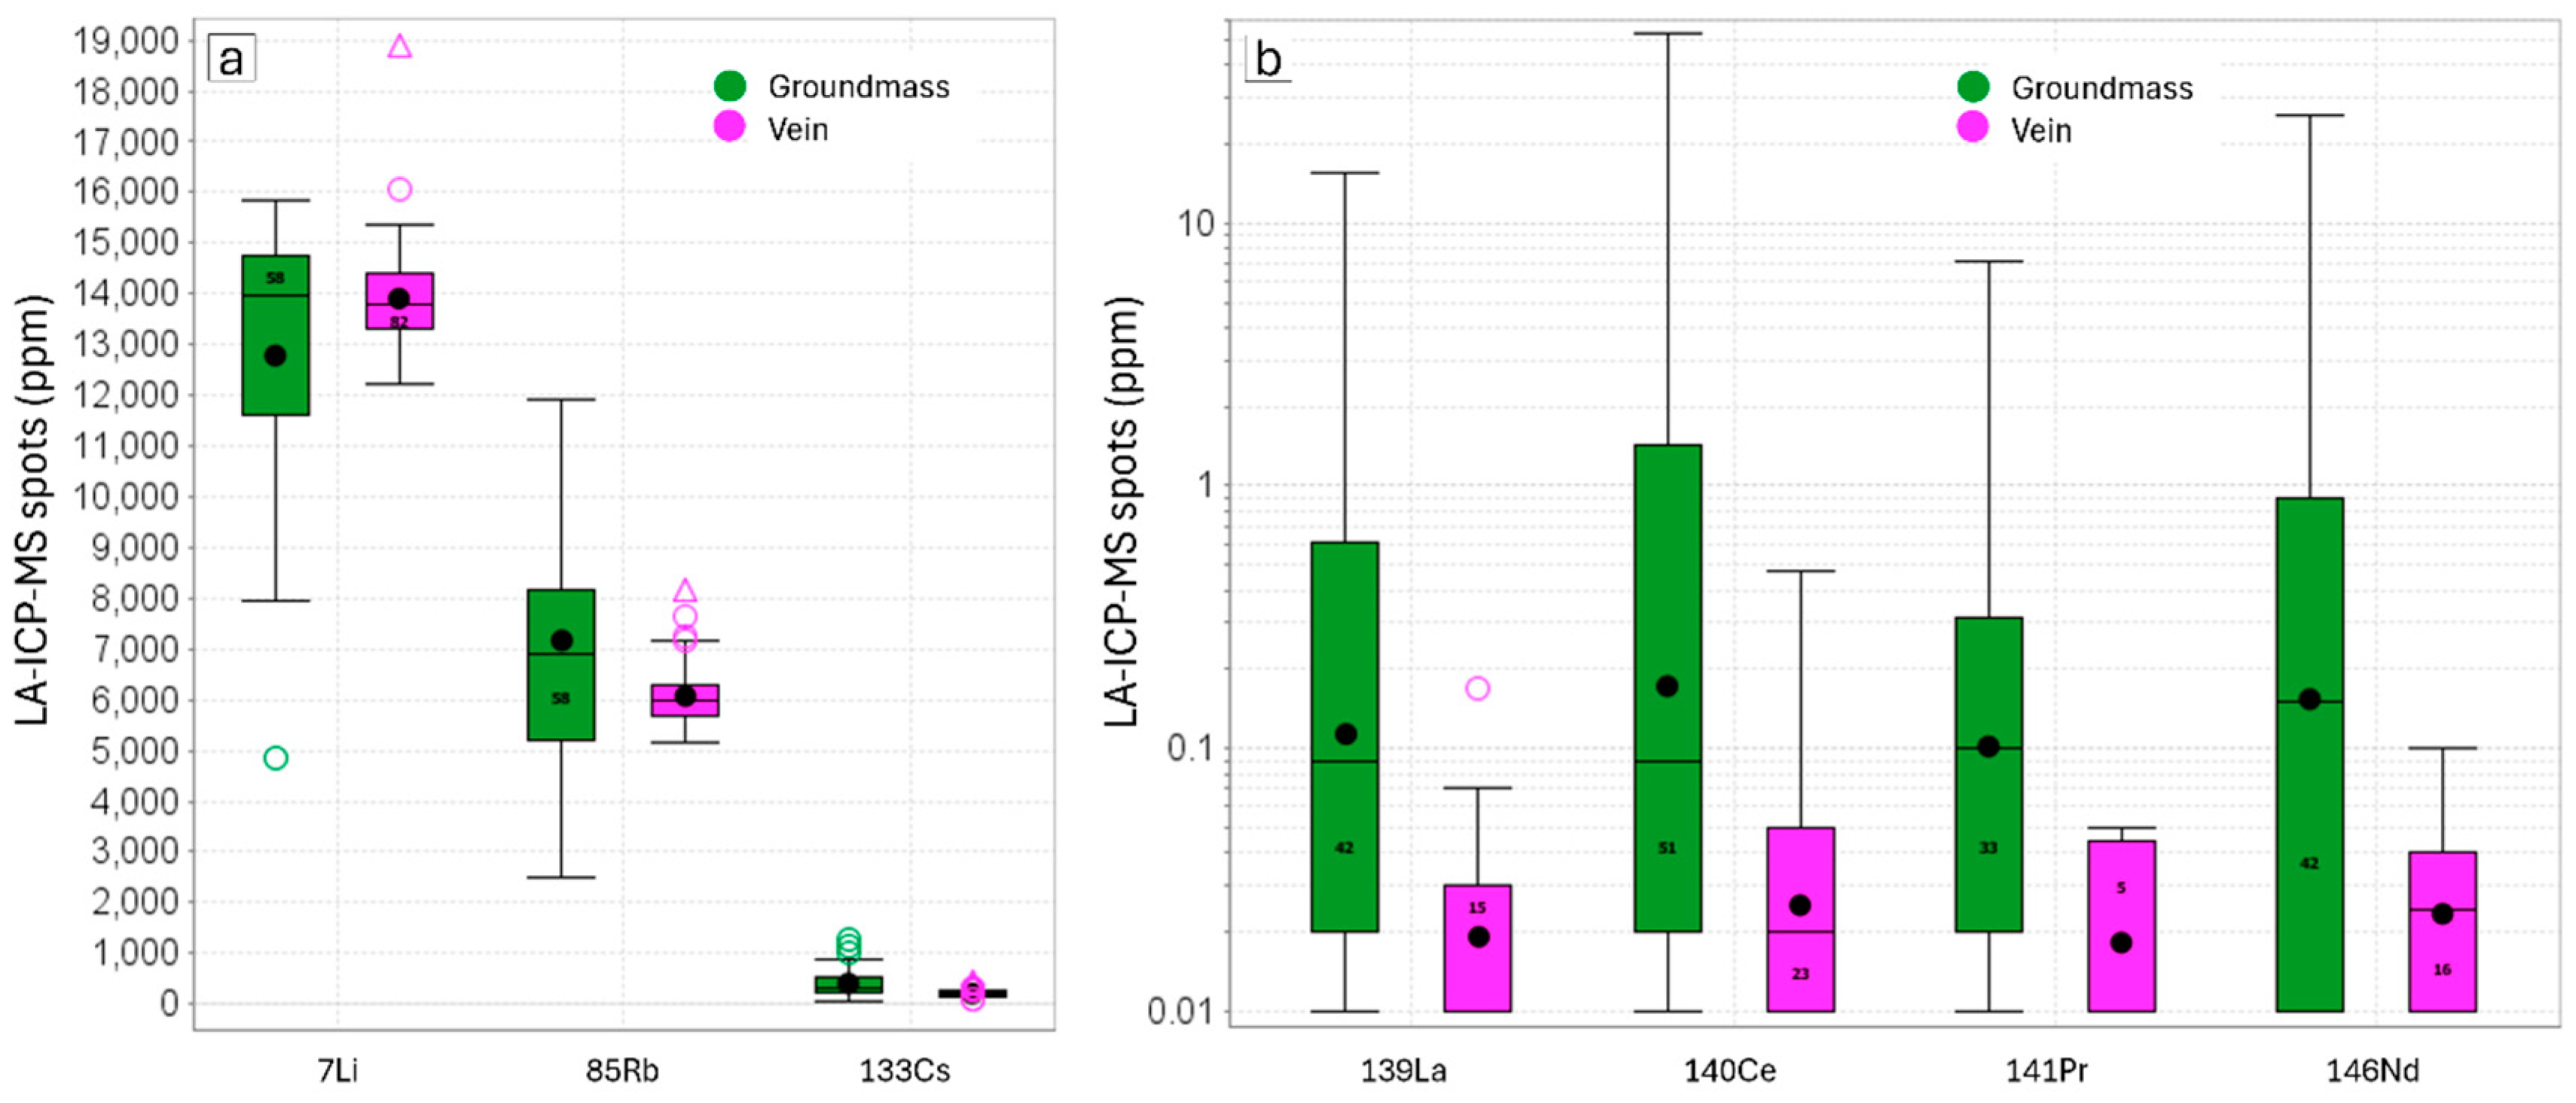
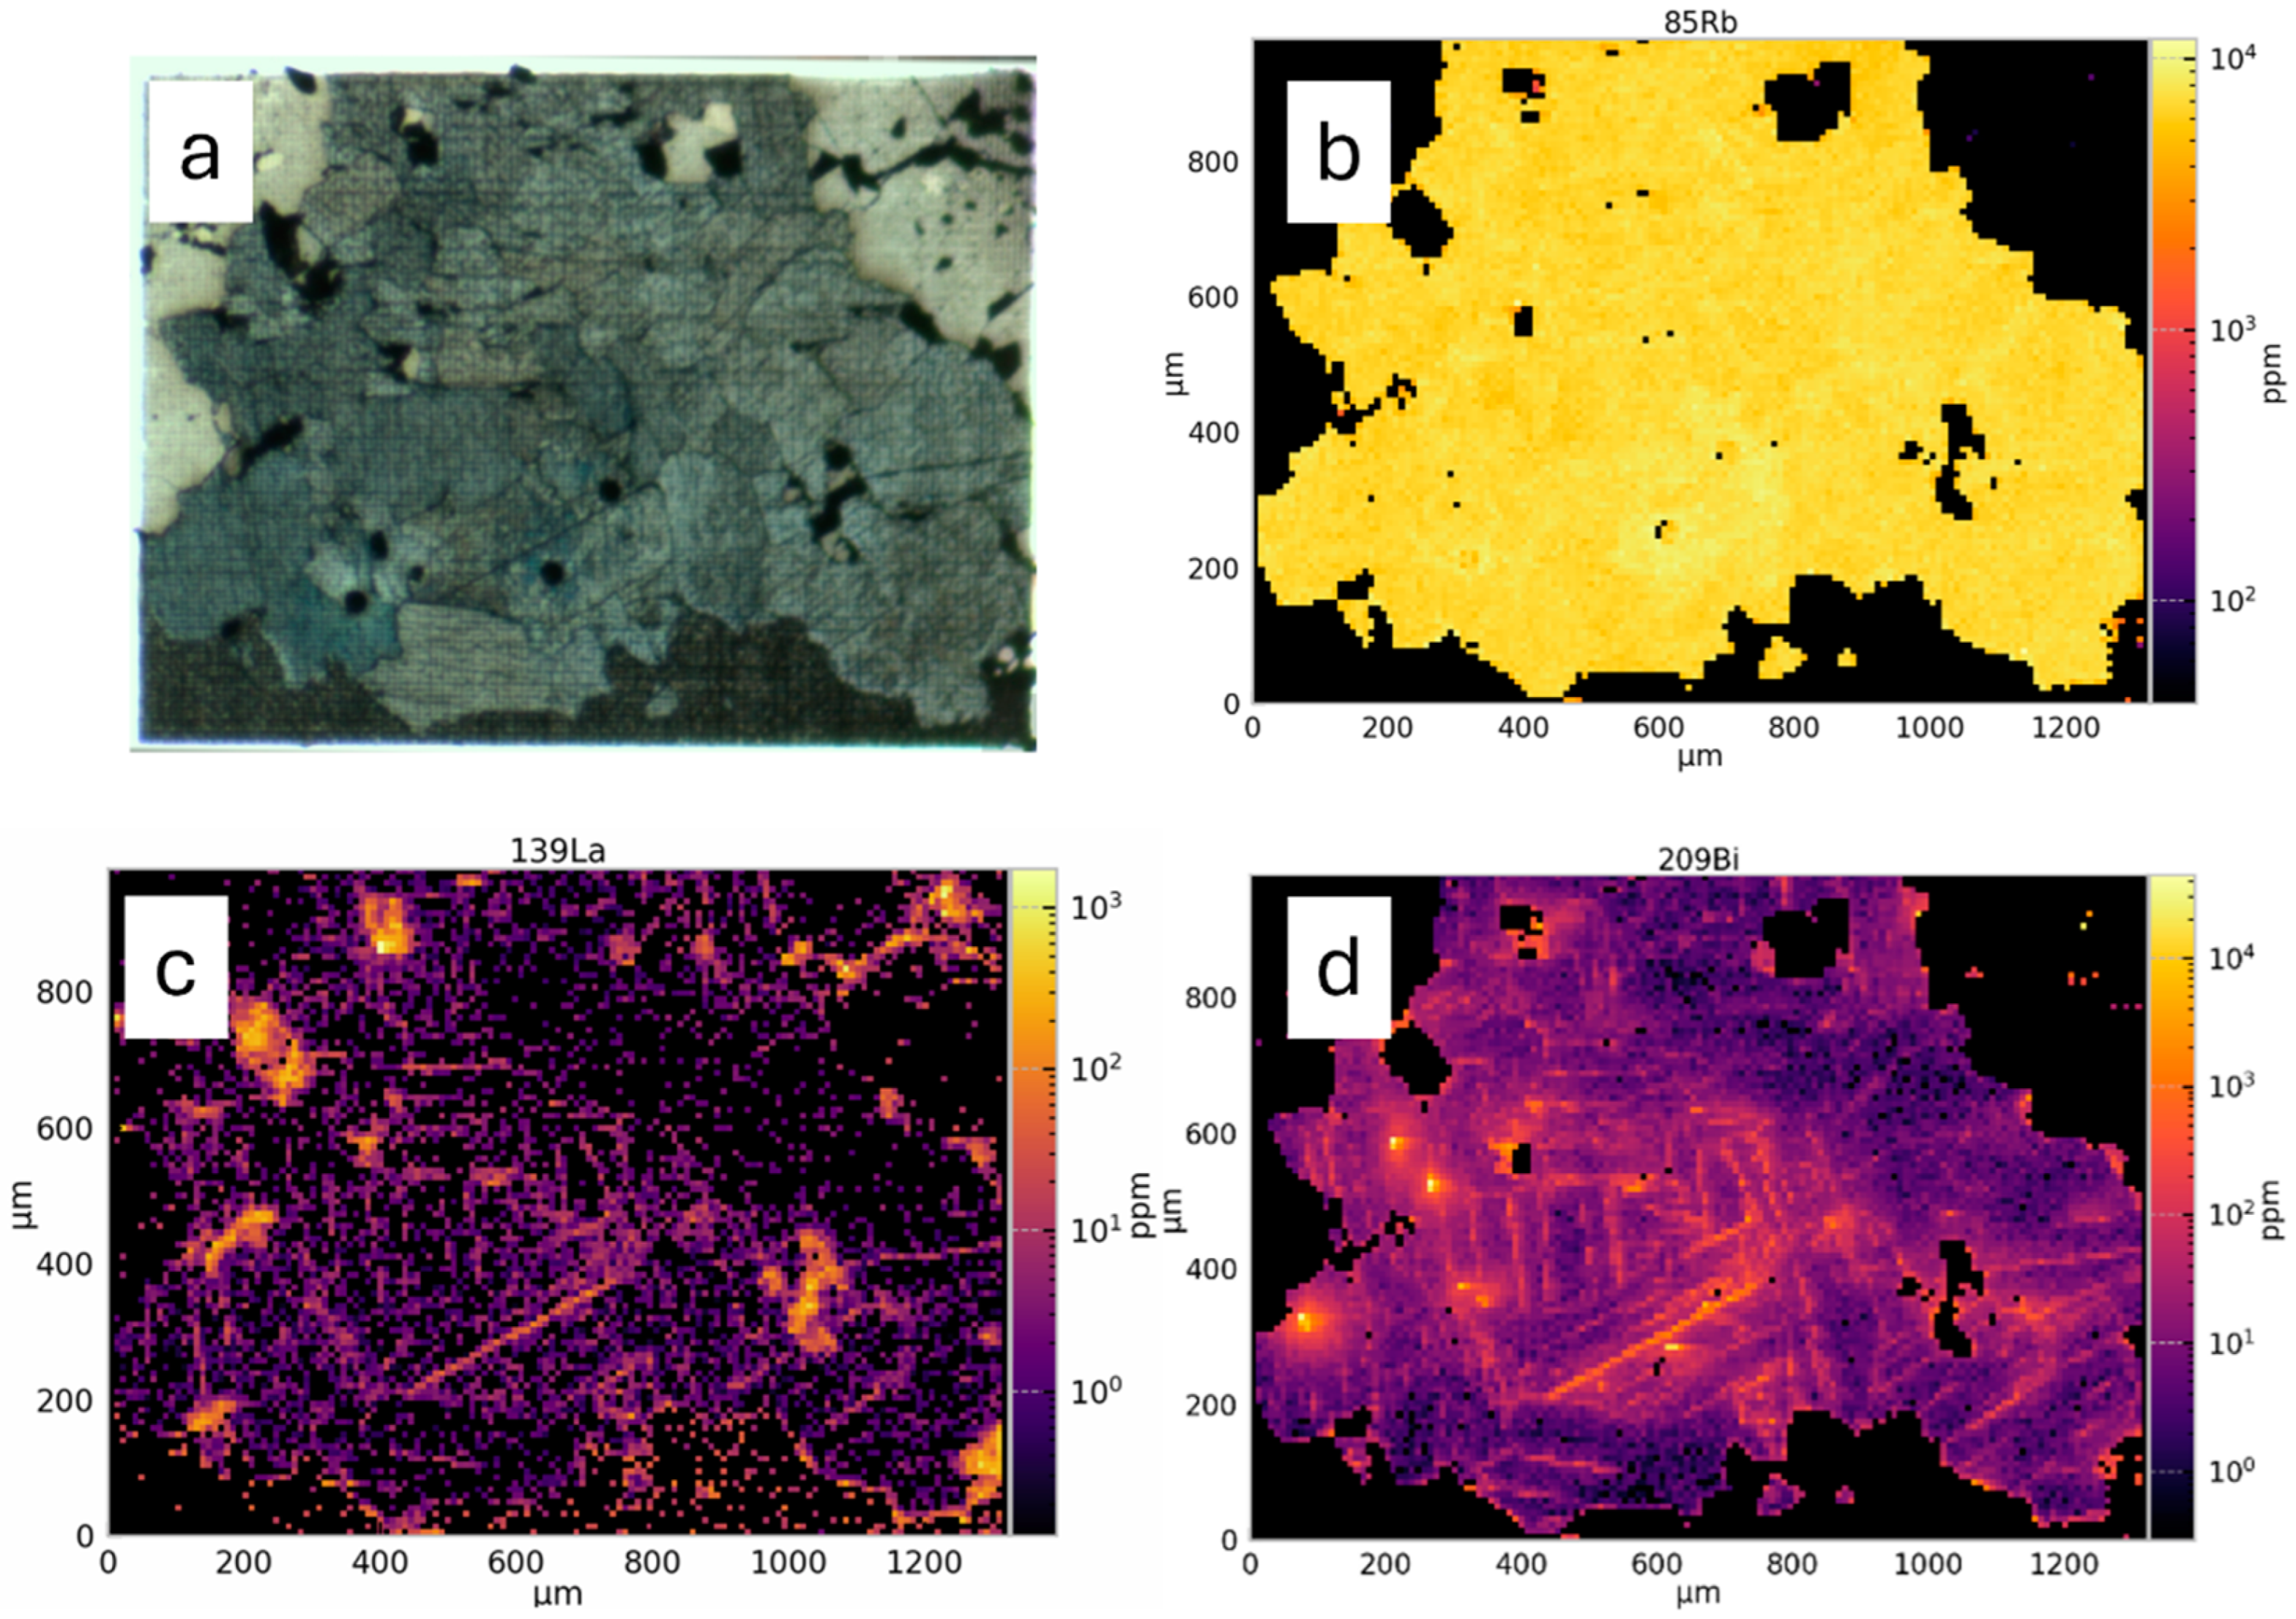
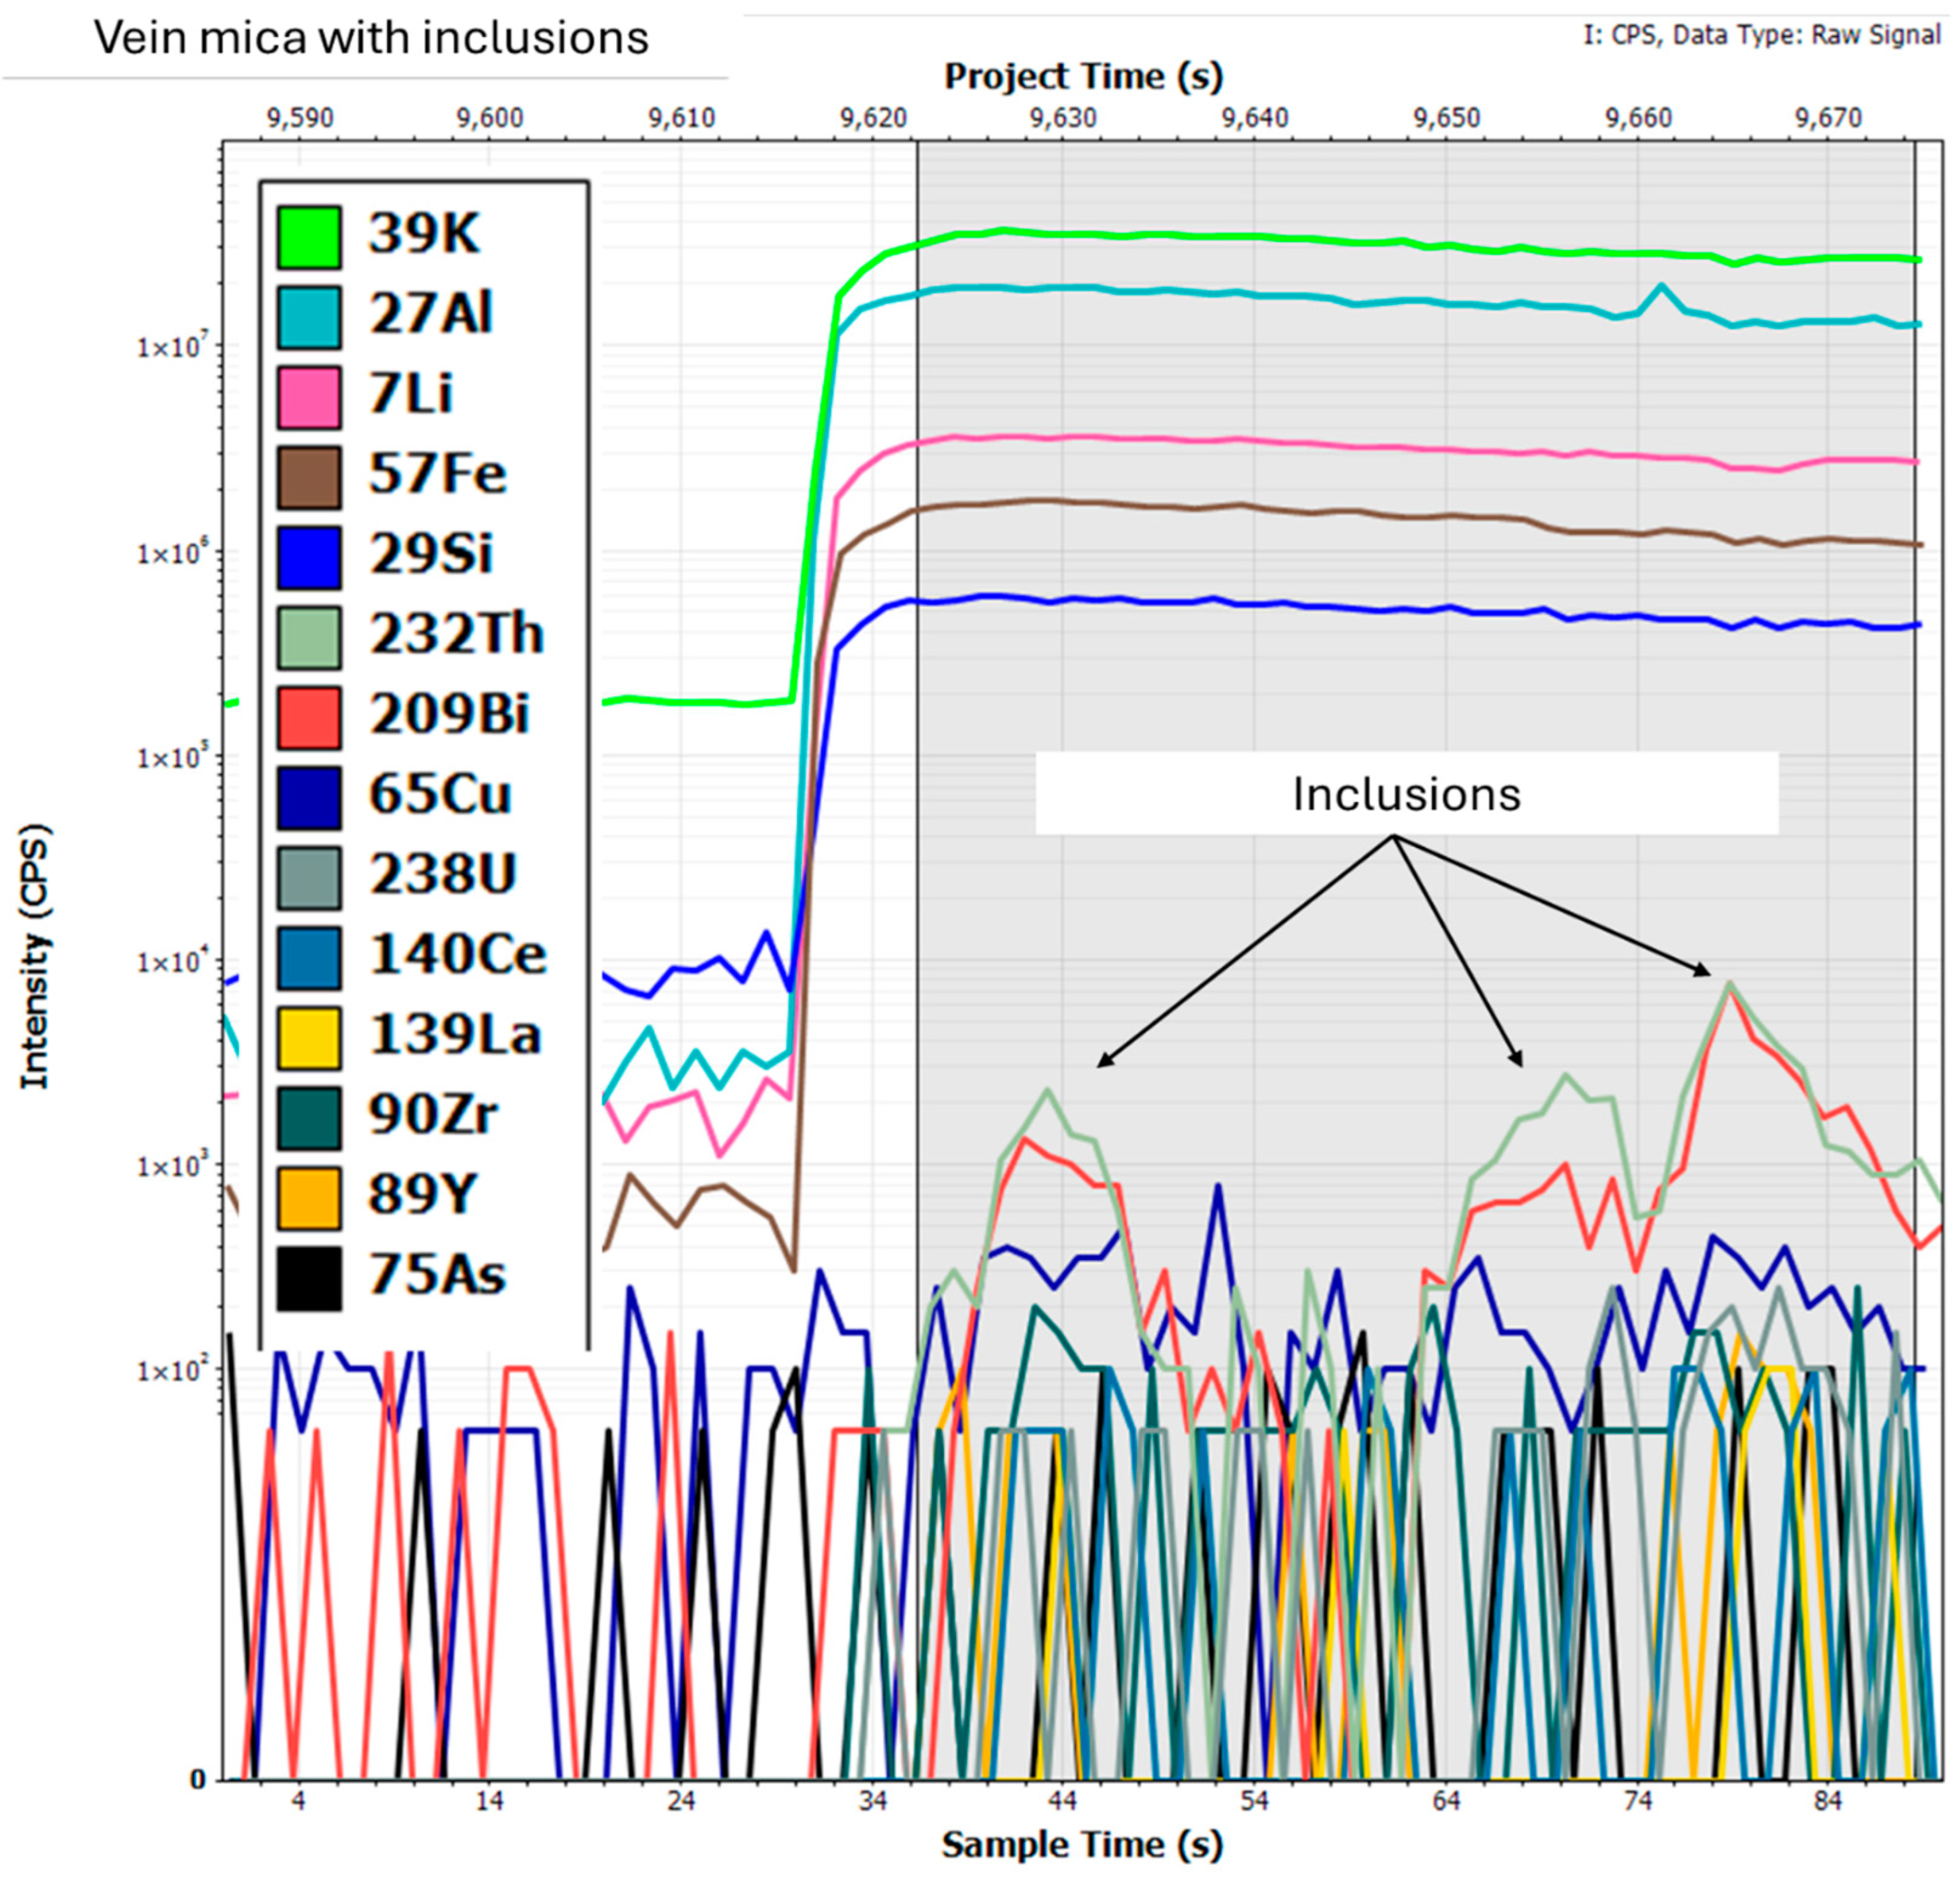
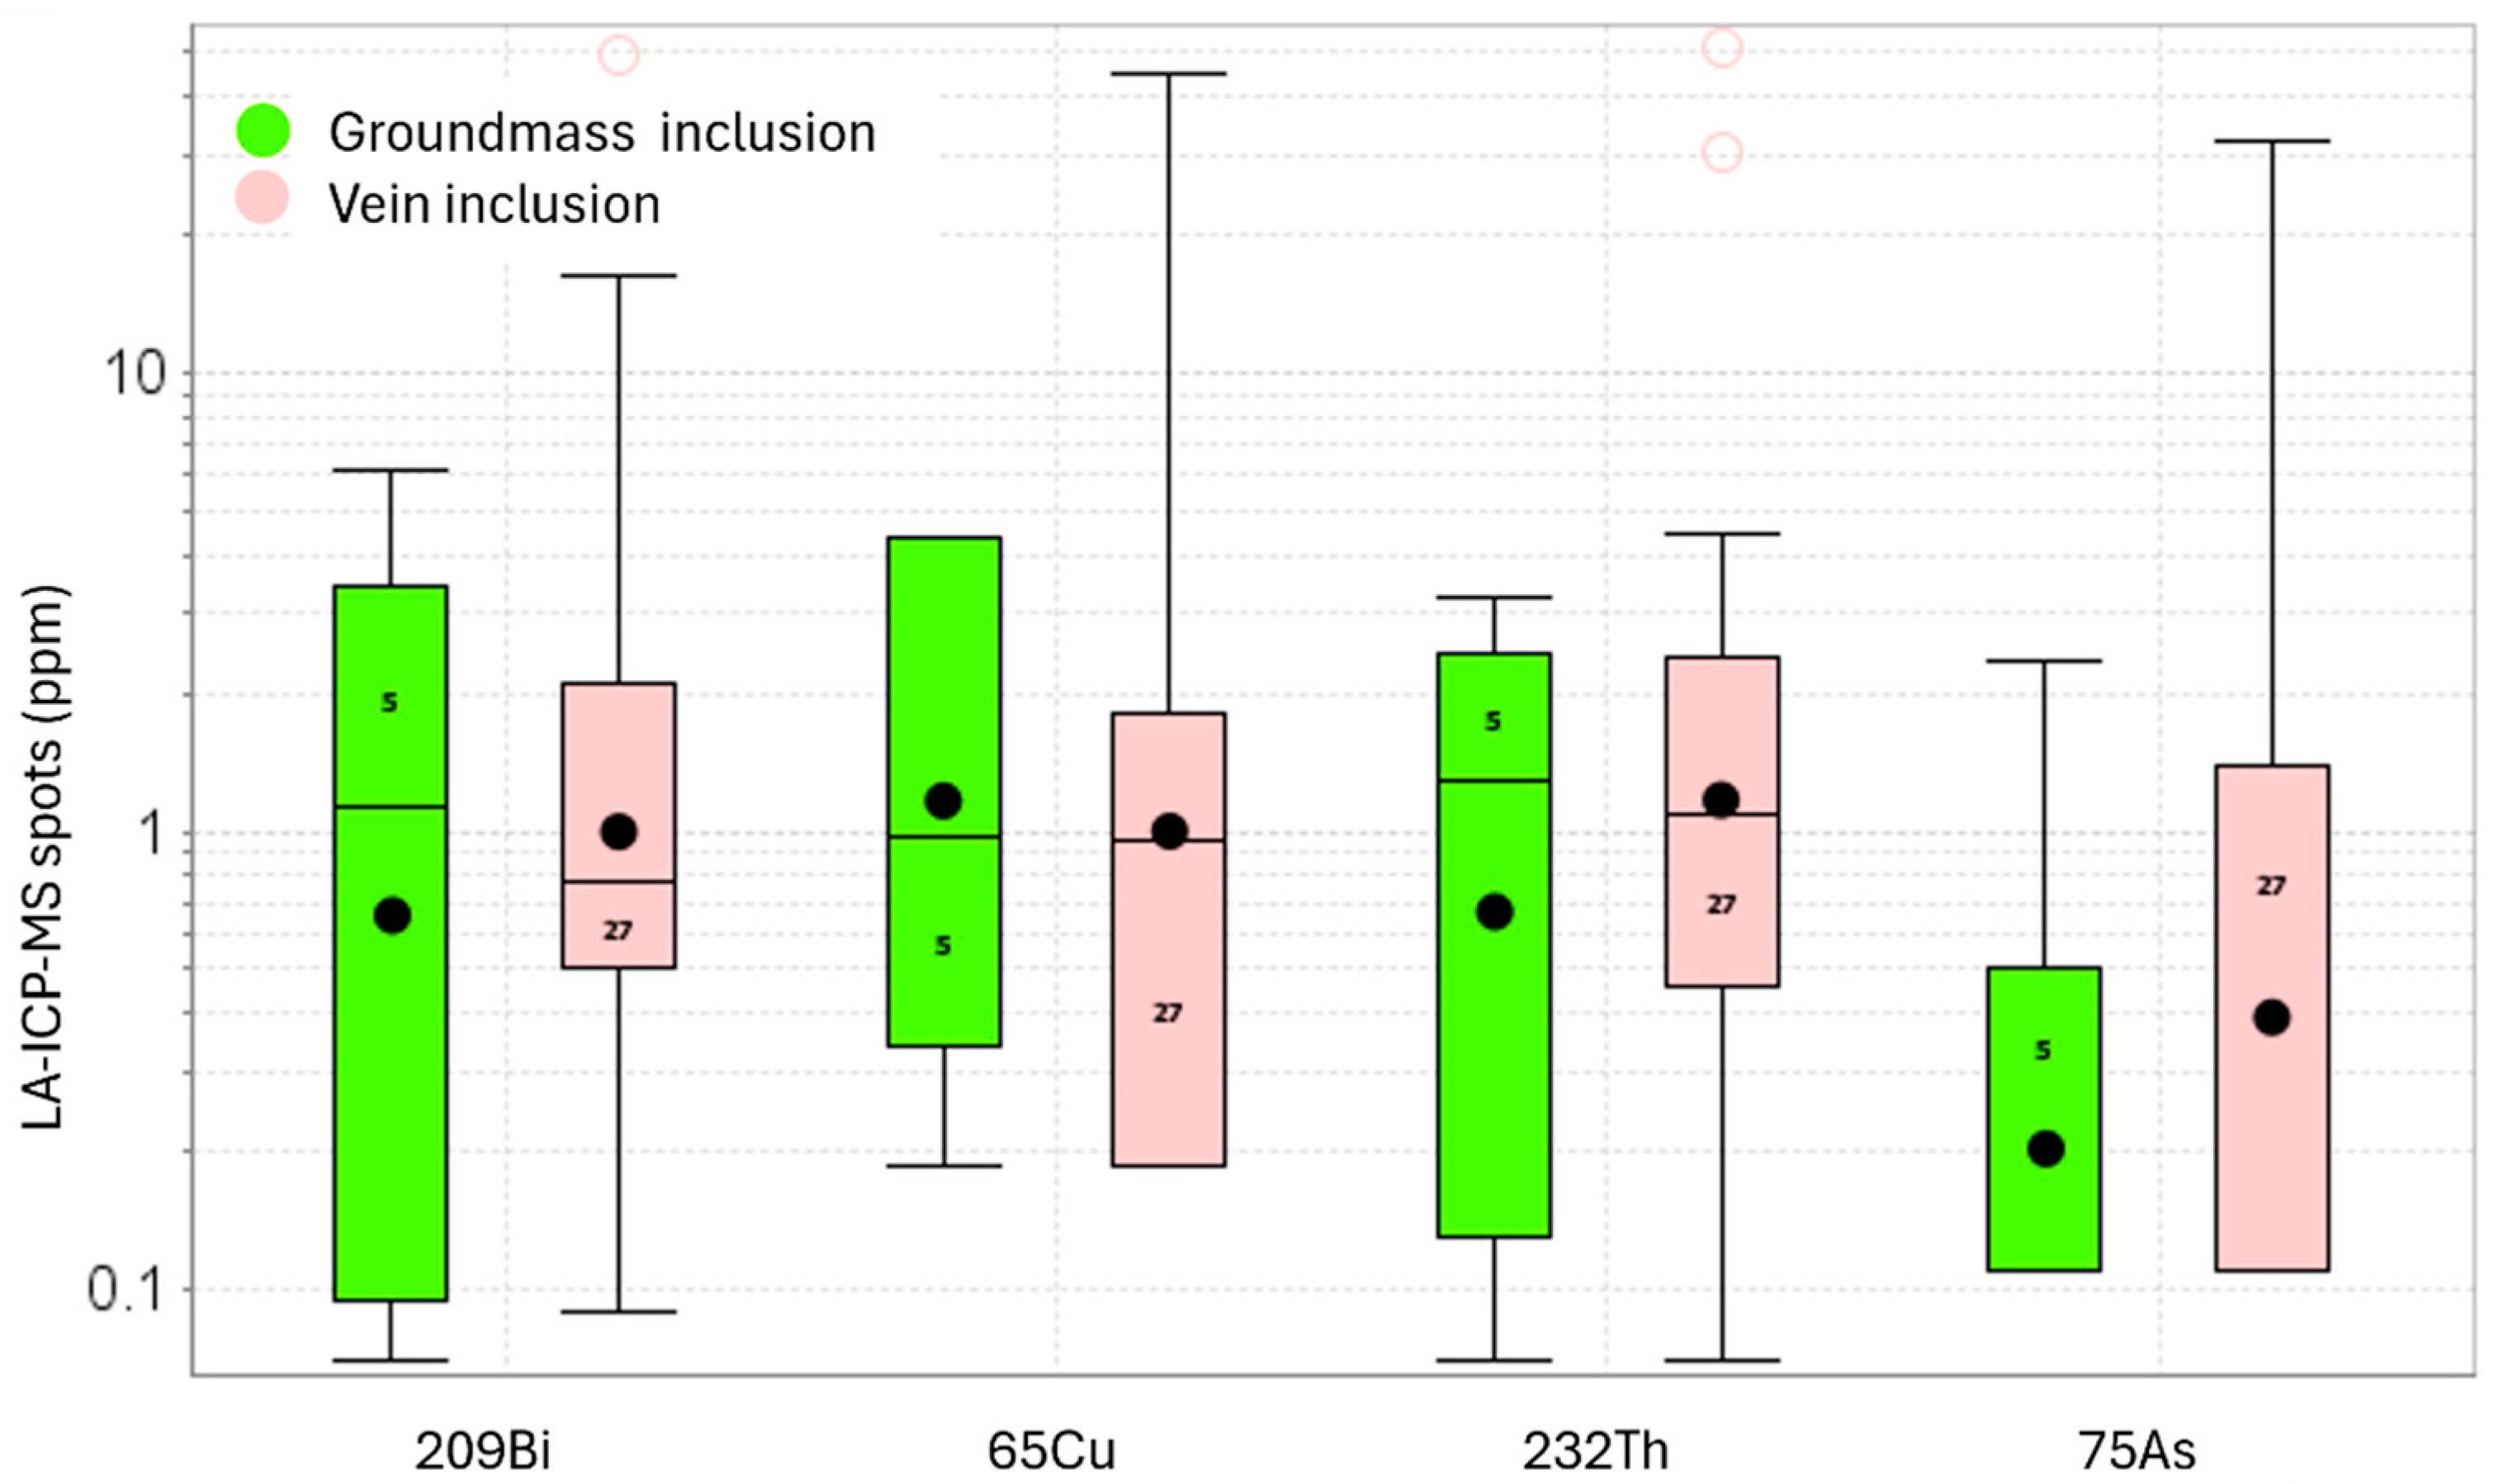
3.3.2. LA-ICP-MS Data
4. Summary and Conclusions
Author Contributions
Funding
Data Availability Statement
Acknowledgments
Conflicts of Interest
References
- Pehlken, A.; Albach, S.; Vogt, T. Is there a resource constraint related to lithium ion batteries in cars? Int. J. Life Cycle Assess. 2017, 22, 40–53. [Google Scholar] [CrossRef]
- Brunelli, K.; Lee, L.; Moerenhout, T. Fact Sheet: Lithium Supply in the Energy Transition. Centre on Global Energy Policy Website. Available online: https://www.energypolicy.columbia.edu/publications/fact-sheet-lithium-supply-in-the-energy-transition/ (accessed on 3 March 2025).
- Critical Minerals at Geoscience Australia. Geoscience Australia Website. Available online: https://www.ga.gov.au/scientific-topics/minerals/critical-minerals (accessed on 2 December 2024).
- Grohol, M.; Veeh, C. Study on the Critical Raw Materials for the EU 2023—Final Report; Publications Office of the European Union European Commission, Directorate-General for Internal Market, Industry, Entrepreneurship and SMEs, Publications Office of the European Union: Luxembourg, 2003; ISBN 978-92-68-00414-2. [Google Scholar] [CrossRef]
- List of Critical Minerals. United States Geological Survey Website. Available online: https://www.usgs.gov/news/national-news-release/us-geological-survey-releases-2022-list-critical-minerals (accessed on 2 December 2024).
- Cinovec Lithium Project Update. European Metals Holdings Limited Website. Available online: https://api.investi.com.au/api/announcements/emh/387cfa8b-b66.html (accessed on 2 December 2024).
- Zinnwald Lithium Project. Zinnwald Lithium Website. Available online: https://zinnwaldlithium.com/project/the-resource/ (accessed on 2 December 2024).
- Announcement May 2023, Testwork Realizes Continued Outstanding Lithium Recoveries. European Metals Holdings Limited Website. Available online: https://www.europeanmet.com/announcements/ (accessed on 3 March 2025).
- Process Metallurgy. British Lithium Website. Available online: https://imerysbritishlithium.com/process-metallurgy/ (accessed on 1 April 2025).
- Andres, U.; Jirestig, J.; Timoshkin, I. Liberation of minerals by high-voltage electrical pulses. Powder Technol. 1999, 104, 37–49. [Google Scholar] [CrossRef]
- Ménard, Y. Energy Savings in Comminution—Innovative Routes for Mineral Ores Embrittlement. Contribution to Deliverable 4.4—Promine Project (FP7). BRGM/RP-60127-FR. 2011. 36p. Available online: https://infoterre.brgm.fr/rapports/RP-60127-FR.pdf (accessed on 1 April 2025).
- Sperner, B.; Jonckheere, R.; Pfänder, J.A. Testing the influence of high-voltage mineral liberation on grain size, shape and yield, and on fission track and 40Ar/39Ar dating. Chem. Geol. 2014, 371, 83–95. [Google Scholar] [CrossRef]
- Rudashevsky, N.S.; Weiblen, P.W.; Stoynov, H.; Saini-Eidukat, B. Products of electric pulse desaggregation of some Keweenawan rocks. In Proceedings of the Institute on Lake Superior Geology 41st Annual Meeting, Marathon, ON, Canada, 13–18 May 1995; Volume 41, p. 61. [Google Scholar]
- Saini-Eidukat, B.; Weiblen, W. A New Method of Fossil Preparation, Using High-Voltage Electric Pulses. Curator 1996, 39, 139–144. Available online: https://www.ndsu.edu/pubweb/~sainieid/PPD/Saini-Eidukat-and-Weiblen-Liberation-of-Fossils-using-Electric-Pulses.pdf (accessed on 1 April 2025). [CrossRef]
- Andres, U. Development and prospects of mineral liberation by electrical pulses. Int. J. Miner. Process. 2010, 97, 31–38. [Google Scholar] [CrossRef]
- Wang, E.; Shi, F.; Manlapig, E. Pre-weakening of mineral ores by high voltage pulses. Miner. Eng. 2011, 24, 455–462. [Google Scholar] [CrossRef]
- Wang, E.; Shi, F.; Manlapig, E. Mineral Liberation by High Voltage Pulses and Conventional Comminution with Same Specific Energy Levels. Miner. Eng. 2012, 27–28, 28–36. [Google Scholar] [CrossRef]
- van der Wielen, K.P.; Pascoe, R.; Weh, A.; Wall, F.; Rollinson, G. The influence of equipment settings and rock properties on high voltage breakage. Miner. Eng. 2013, 46–47, 100–111. [Google Scholar] [CrossRef]
- Lyons, R.J.P. The Aberfoyle vein system, Rossarden, Tasmania. In Proceedings of the AUSIMM, Sydney, Australia, 10–15 August 1957; No. 181. pp. 75–91. Available online: https://www.ausimm.com/publications/conference-proceedings/the-ausimm-proceedings-1957/the-aberfoyle-vein-system-rossarden-tasmania/ (accessed on 2 December 2024).
- Seymour, D.B.; Green, G.R.; Calver, C.R. The Geology and Mineral Deposits of Tasmania: A Summary; Mineral Resources Tasmania Geological Survey Bulletin: Hobart, Australia, 2006. [Google Scholar]
- TinOne Resources Inc. Aberfoyle Tin Project. Available online: https://tinone.ca/ (accessed on 8 October 2024).
- Müller, A.; Herklotz, G.; Giegling, H. Chemistry of quartz related to the Zinnwald/Cínovec Sn-W-Li greisen-type deposit, Eastern Erzgebirge, Germany. J. Geochem. Explor. 2018, 190, 357–373. [Google Scholar] [CrossRef]
- High Voltage Pulse Power Machines. SELFRAG Website. Available online: https://www.selfrag.com/high-voltage-pulse-power-machines (accessed on 3 March 2024).
- AMICS Automated Mineralogy System for SEM. Bruker Website. Available online: https://www.bruker.com/en/products-and-solutions/elemental-analyzers/eds-wds-ebsd-SEM-Micro-XRF/software-amics-automated-mineralogy-system.html (accessed on 3 March 2024).
- Jochum, K.P. Determination of reference values for NIST SRM 610–617 glasses following ISO guidelines. Geostand. Geoanalytical Res. 2011, 35, 397–429. [Google Scholar] [CrossRef]
- GeoReM Preferred Values. GeoRem Website. Available online: http://georem.mpch-mainz.gwdg.de/ (accessed on 24 September 2024).
- Longerich, H.P.; Jackson, S.E.; Günther, D. Inter-laboratory note—Laser ablation inductively coupled plasma mass spectrometric transient signal data acquisition and analyte concentration calculation. J. Anal. At. Spectrom. 1996, 11, 899–904. [Google Scholar] [CrossRef]
- Norris, A.; Danyushevsky, L. Towards estimating the complete uncertainty budget of quantified results measured by LA-ICP-MS. In Proceedings of the Goldschmidt Conference, Boston, MA, USA, 12–17 August 2018. [Google Scholar]
- Ghosh, U.; Upadhyay, D.; Mishra, B.; Abhinay, K. In-situ trace element and Li-isotope study of zinnwaldite from the Degana tungsten deposit, India: Implications for hydrothermal tungsten mineralization. Chem. Geol. 2023, 632, 121550. [Google Scholar] [CrossRef]
- Breiter, K.; Hložková, M.; Korbelová, Z.; Galiová, M.V. Diversity of lithium mica compositions in mineralized granite-greisen system: Cinovec Li-Sn-W deposit, Erzgebirge. Ore Geol. Rev. 2019, 106, 12–27. [Google Scholar] [CrossRef]
- Technologies Leading the Next Lithium Cycle. Lepidico Website. Available online: https://lepidico.com/technology (accessed on 2 December 2024).
- Processing Technology. Cornish Lithium Website. Available online: https://cornishlithium.com/projects/lithium-in-hard-rock/processing-technology/ (accessed on 2 December 2024).
- Mende, R.; Kaiser, D.; Pavon, S.; Bertau, M. The COOL process: A holistic approach towards lithium recycling. Waste Biomass Valorization 2023, 14, 3027–3042. [Google Scholar] [CrossRef]


| Sample | Voltage (kV) | Electrode Gap (mm) | Pulse Rate (Hz) | Number of Pulses |
|---|---|---|---|---|
| GM10339 | 120 | 30 | 5 | 60 |
| GM10358 | 120 | 30 | 5 | 30 |
| GM10365 | 200 | 40 | 5 | 10 |
| Range | 90 to 200 | 10 to 40 | 1 to 5 | 1 to >1000 |
| Sieve Size % Mass | GM10339 | GM10358 | GM10365 |
|---|---|---|---|
| 4 mm | 11.5 | 39.7 | 58.2 |
| 2 mm | 11.7 | 17.8 | 10.8 |
| 1.18 mm | 10.4 | 10.9 | 5.5 |
| 500 μm | 24.3 | 12.8 | 6.1 |
| 250 μm | 21.2 | 8.2 | 3.2 |
| 125 μm | 14.8 | 6 | 8.8 |
| 63 μm | 3.4 | 2.3 | 4.7 |
| <63 μm | 2.7 | 2.1 | 2.7 |
| Mineral (Weight %) | GM10339 | GM10358 | GM10365 |
|---|---|---|---|
| Zinnwaldite | 27.43 | 42.28 | 12.25 |
| Quartz | 59.3 | 48.88 | 37.24 |
| Topaz | 11.53 | 7.81 | 1.68 |
| Tourmaline (schorl) | 0.01 | 0 | 44.16 |
| Muscovite-illite | 0.26 | 0.27 | 3.06 |
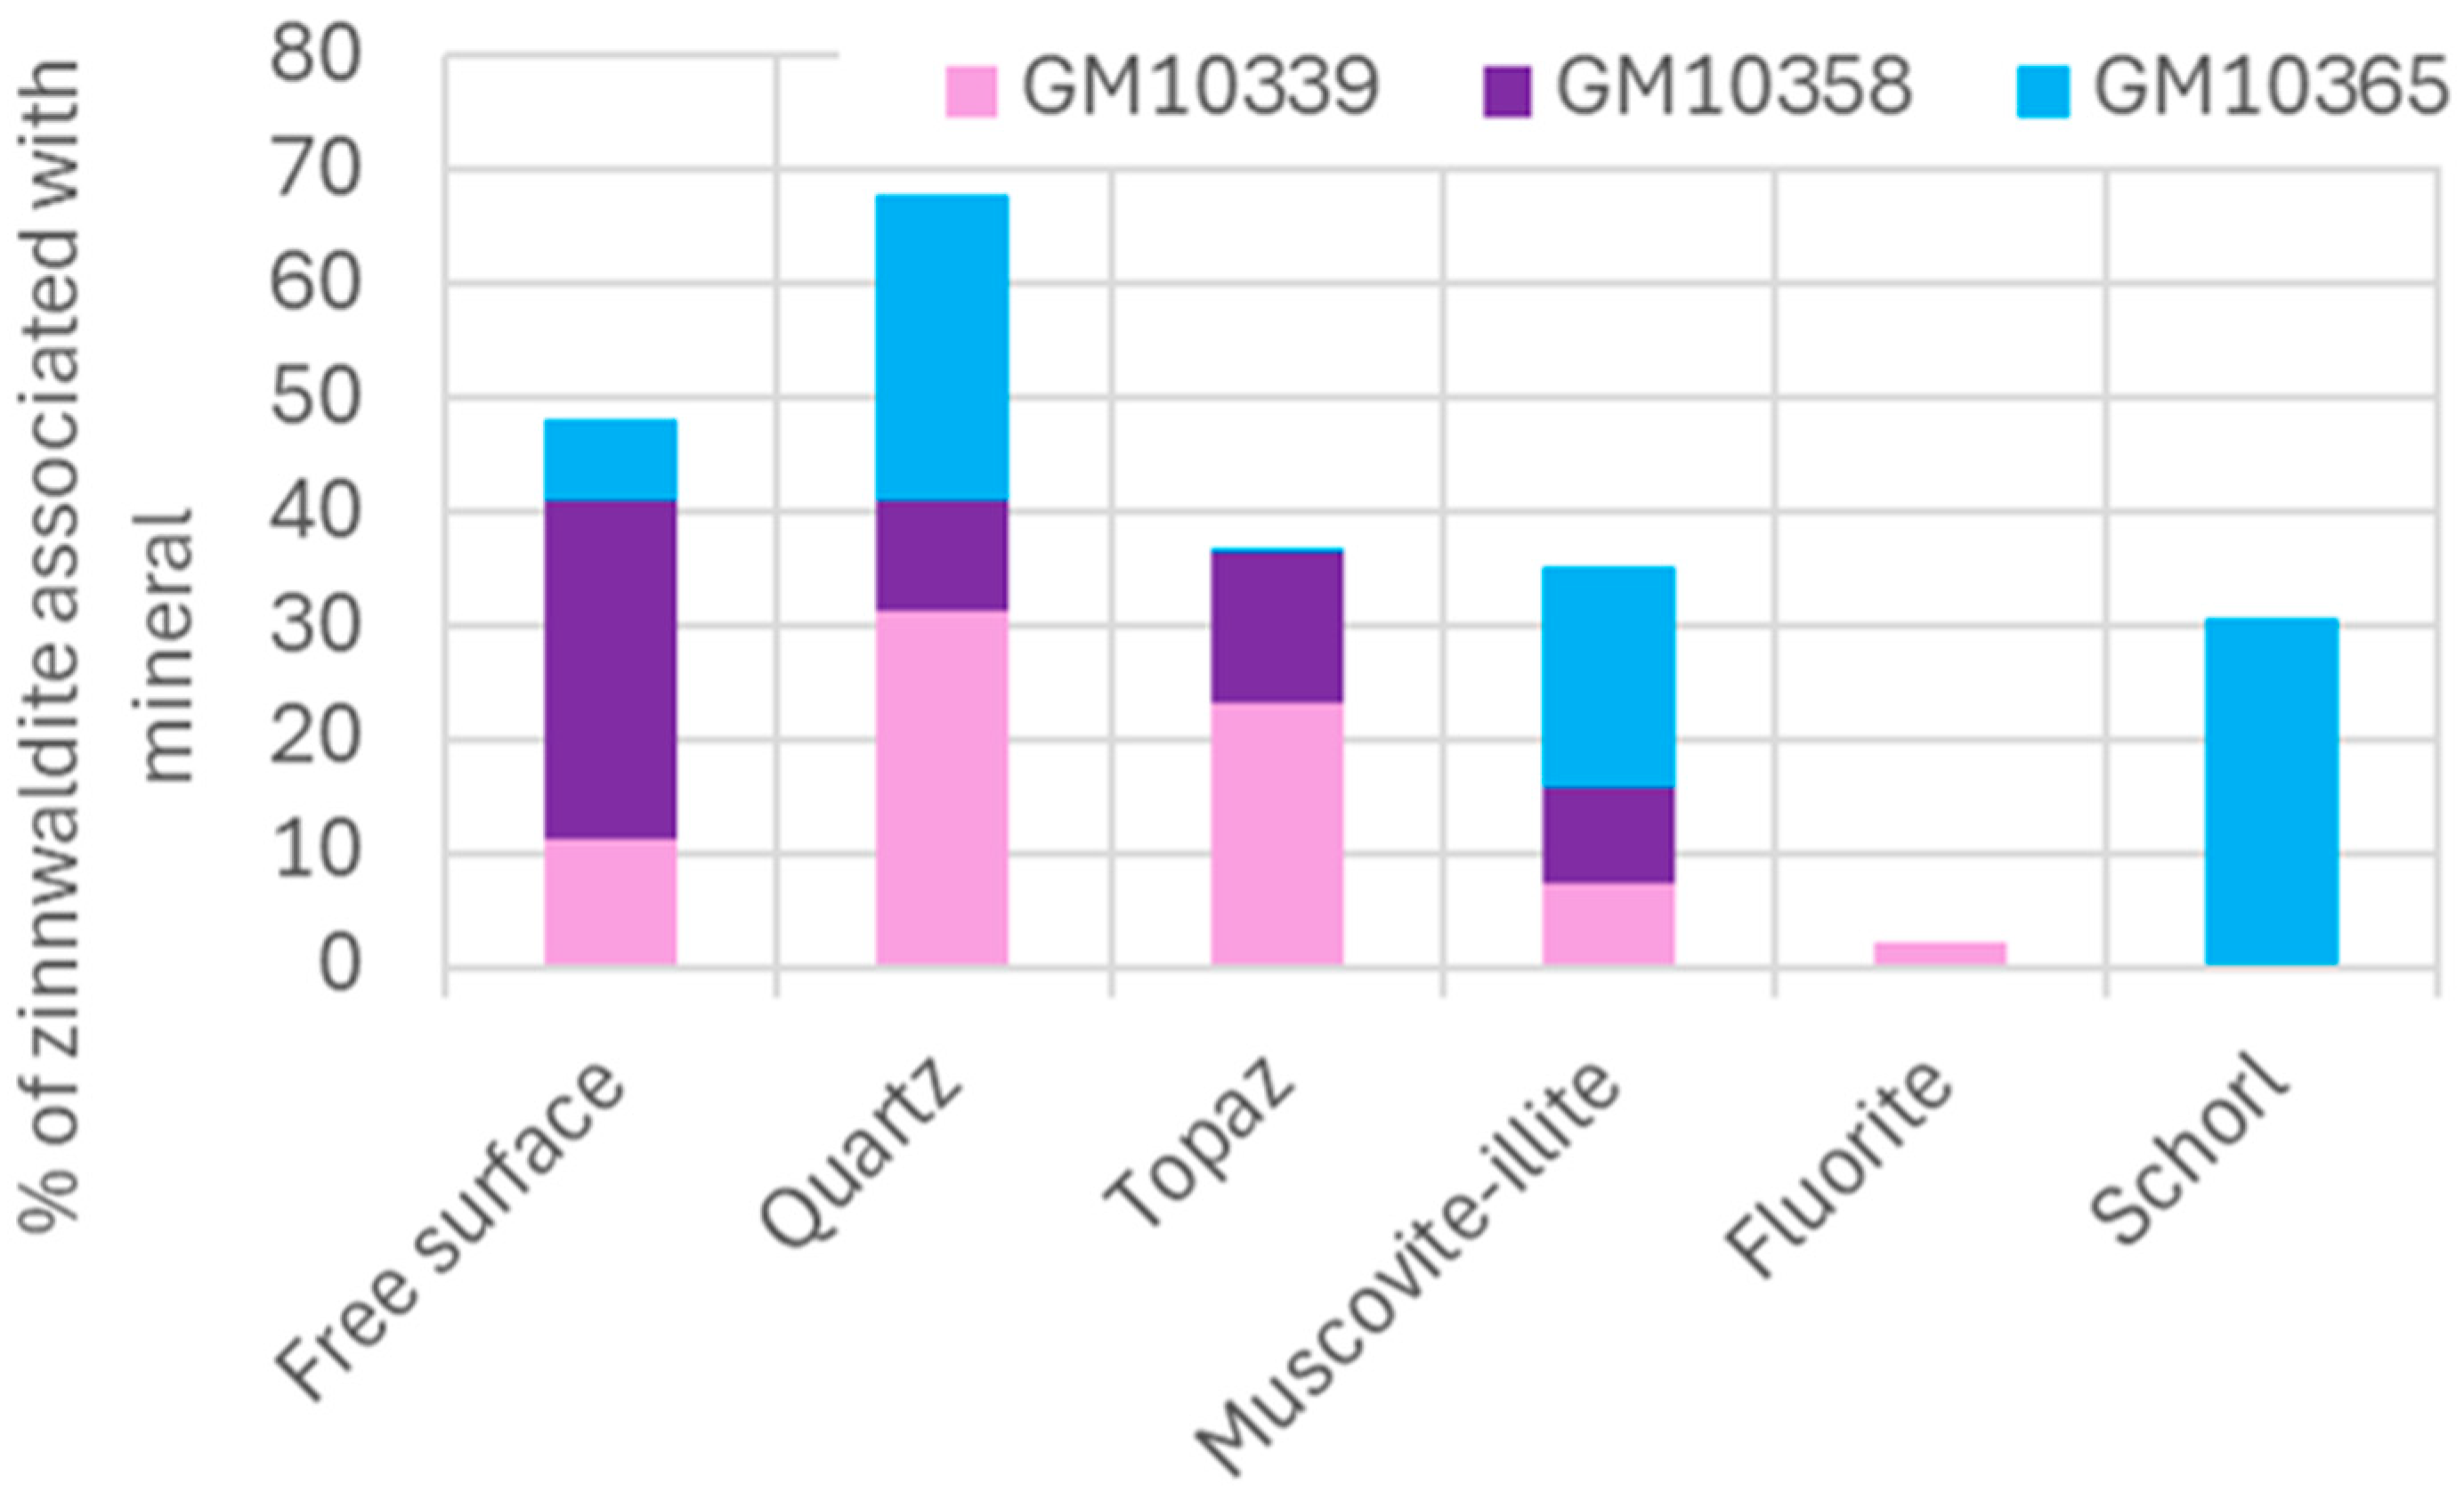
| Sample | Free Surface | Quartz | Topaz | Muscovite-Illite | Fluorite | Tourmaline (Schorl) |
|---|---|---|---|---|---|---|
| GM10339 | 11.19 | 31.37 | 23.31 | 7.40 | 2.15 | 0.08 |
| GM10358 | 29.74 | 9.58 | 13.14 | 8.47 | 0 | 0.08 |
| GM10365 | 7.06 | 26.99 | 0.45 | 19.47 | 0 | 30.47 |
Disclaimer/Publisher’s Note: The statements, opinions and data contained in all publications are solely those of the individual author(s) and contributor(s) and not of MDPI and/or the editor(s). MDPI and/or the editor(s) disclaim responsibility for any injury to people or property resulting from any ideas, methods, instructions or products referred to in the content. |
© 2025 by the authors. Licensee MDPI, Basel, Switzerland. This article is an open access article distributed under the terms and conditions of the Creative Commons Attribution (CC BY) license (https://creativecommons.org/licenses/by/4.0/).
Share and Cite
Hunt, J.; Oalmann, J.; Aâtach, M.; Pirard, E.; Fulton, R.; Feig, S. Critical Metal Potential of Tasmanian Greisen: Lithium, Rare Earth Elements, and Bismuth Distribution and Implications for Processing. Minerals 2025, 15, 462. https://doi.org/10.3390/min15050462
Hunt J, Oalmann J, Aâtach M, Pirard E, Fulton R, Feig S. Critical Metal Potential of Tasmanian Greisen: Lithium, Rare Earth Elements, and Bismuth Distribution and Implications for Processing. Minerals. 2025; 15(5):462. https://doi.org/10.3390/min15050462
Chicago/Turabian StyleHunt, Julie, Jeffrey Oalmann, Mohamed Aâtach, Eric Pirard, Russell Fulton, and Sandrin Feig. 2025. "Critical Metal Potential of Tasmanian Greisen: Lithium, Rare Earth Elements, and Bismuth Distribution and Implications for Processing" Minerals 15, no. 5: 462. https://doi.org/10.3390/min15050462
APA StyleHunt, J., Oalmann, J., Aâtach, M., Pirard, E., Fulton, R., & Feig, S. (2025). Critical Metal Potential of Tasmanian Greisen: Lithium, Rare Earth Elements, and Bismuth Distribution and Implications for Processing. Minerals, 15(5), 462. https://doi.org/10.3390/min15050462