Abstract
This paper investigated pre-concentration of a low-grade Upper Group 2 (UG2) ore to assess the possibility of rejecting waste at a typical discard Platinum Group Metals (PGMs) grade of <0.4 g/t at mass rejection to floats greater than 16% by comparing feed prepared by High pressure grinding rolls (HPGR) to Conventional crushers (Cone crushers). Heavy Liquid Separation (HLS) was conducted as a benchmark test to Dense Medium Separation (DMS) to determine the expected grade, recovery, and mass yield for various size classes and crusher. The comparison between fine size classes −9.5 + 1.18 mm and −6.7 + 1.18 mm crushed by HPGR and conventional crushing showed that, under the conditions tested, the conventional crusher outperformed HPGR in terms of high sinks grade and a higher percentage of material exposed to pre-concentration. Looking at coarser size fractions (+12 mm), HLS results showed that under the conditions tested, size fraction −20 + 1.18 mm crushed by a conventional crusher at an optimum density of 3.4 g/cm3 is an optimized size fraction to run the DMS plant. The pilot DMS cyclone testwork showed that 61.1% by mass could be rejected to the floats stream based on Run of Mine (ROM) feed at 1.12% Cr2O3 and 0.42 g/t Total PGMs + Au grade, a typical discardable PGMs grade.
1. Introduction
Bushveld Igneous Complex in South Africa is one of the biggest sources of PGMs [1,2,3]. Merensky, UG2, and Platreef are the three principal PGM reefs in the Bushveld Igneous Complex. The three reefs depict different properties because of their mineralogical differences and the PGM head grade [4,5]. Comparing the Merensky reef to the UG2 reef, UG2 contains lower quantities of platinum, but higher quantities of palladium and rhodium. UG2 is higher in quantities of small metals such Ruthenium, Iridium, and Osmium [3]. In 2023–2024 South Africa’s platinum output declined due to high production costs, electricity outages, and low demand. Currently, the prices of PGMs are low due to decreased demands from China and Russia selling PGMs at a discount [6]. This means the costs of producing PGMs are currently high, and thus to preserve the life of the mine, and save jobs, there is a need to relook at some of the PGMs processing methods to save costs. This includes pre-concentration of low-grade PGMs ores prior to downstream processing to maintain the same head grade to the flotation plant.
For example, pre-concentration of low-grade UG2 ores by dense medium separation (DMS) improves the economics of downstream processing by reducing the power, water, and reagents requirements and increasing the throughput of the Mill-Flotation, Mill-Flotation (MF2) plant. This will further reduce cutoff grade, thus simplifying the mining method and increasing ore reserves [7]. Other benefits include removal of harder ore minerals such as pyroxenites prior to milling and removal of flotable waste minerals such as talc, which slimes easily during milling, diluting the flotation concentrate [8]. Previous studies showed that pre-concentration of UG2 ores on crushed −20 mm + 1 mm run of mine (ROM) by dense medium separation (DMS) result in some PGMs losses to the floats [9]. The current operations using DMS as a pre-concentration stage on a −20 mm + 2 mm crushed run of mine feed reject about 11%–66% mass at 91%–97% PGM recoveries to the sinks. About 5%–15% PGMs are lost to the DMS floats at about 0.3–0.8 g/t grade. Platinum producers regard 5% to more than 10% recovery losses to the floats still high due to the low 4E basket price.
Asakawa [10] investigated the effect of three crusher mechanisms—jaw, impact, and HPGR—for a pre-concentration process on laboratory dense medium separation, heavy liquid separation (HLS) using three different ores, iron, copper, and polymetallic ores. The impact crusher was found to be the best option for selective comminution on the polymetallic ore, while no differences were observed between the crushers on iron and copper ores [10]. Recent studies on pre-concentration of PGMs ores by DMS using conventional crushers do not always achieve a DMS overflow with a grade <0.4 g/t. Marape [9] conducted DMS pre-concentration on size fraction −12 mm + 1 mm of the UG2 ore crushed with conventional crushers, targeting a cut point of 3.3 g/cm3. The overall mass balance showed that 17.17% of the mass could be rejected with 3.64% of PGMs + Au lost to the floats at a grade of 0.64 g/t PGMs + Au and 1.18% Cr2O3, respectively. Although a grade of 0.64 g/t is low, according to industry standards it is not regarded as a discardable PGMs grade. Prior to that, Govender and Gericke [11] conducted DMS pre-concentration on −20 mm + 2 mm of the UG2 crushed run of mine ore with conventional crushers at a density cut point of 3.7 g/cm3. The head grade of the feed was 3.46 g/t total PGMs + Au. The grade of the PGMs + Au increased to 4.9 g/t at a mass pull of 39.5% to the sinks. However, the 60.5% of the mass was rejected to the floats at a grade of 1.3 g/t PGMs + Au and 5% Cr2O3, which is a significant PGMs loss [11].
Bergmann [12] investigated the effect of DMS pre-concentration by comparing the effect of using HPGR as a secondary crusher on DMS floats to conventional crusher. A −20 mm + 1.7 mm fraction of UG2 ore at a grade of 3.46 g/t PGM + Au was crushed with a conventional crusher. The PGMs + Au losses to floats were 11.3%, 7.08%, and 2.16%, respectively, after using DMS [12]. The floats fractions were further crushed by HPGR using two pressures (15 bar and 30 bar) to liberate chromite and associated PGM into a fine fraction of −1.7 mm and coarse +1.7 mm fraction treated by the DMS. The results show that significant −1.7 mm material generated by the two pressures was enriched in PGMs. The high-pressure condition was more effective in liberating PGMs from the +1.7 mm fraction. In the instance the objective was achieved, however, it is not clear if substituting conventional crushing with HPGR on the feed can improve PGMs liberation to reduce losses to the floats [12].
The extraction of valuable elements from the UG2 ore using conventional crushers such as Jaw and Cone crushers is energy intensive because of the amount of energy used to grind the ore to liberate fine PGMs grains. With the potential of rejecting gangue prior to the milling and flotation stage, the high-pressure grinding roll (HPGR) developed by Schönert in the 1970s is one such possible device that could achieve liberation of the valuable minerals and allow for efficient dense media separation [13].
The high-pressure grinding roll (HPGR) utilizes inter-particle crushing, which leads to preferential breakage of softer components. Compared to conventional crushers, they are easy to maintain, consume less energy in the range of 10 to 30% less, and improve mineral liberation due to the pressure of residual micro-cracks in the particles [14,15,16]. The previous study by Nghipulile [14] showed that sulphides pre-crushed using HPGR depicted a better liberation than those crushed by conventional crushers. However, at finer grind sizes, this advantage was not so apparent.
This study investigated the effect of conventional crushing (Jaw and Cone) and High Pressure Grinding Rolls (HPGR) on the pre-concentration of UG2 ore by DMS to ascertain if the crushing method can minimize PGMs losses to a grade of <0.4 g/t in the DMS float stream. In this paper, the use of High Pressure Grinding Rolls (HPGR) was investigated as an alternative to the conventional crusher methods Jaw and Cone. The majority of UG2 processing plants use DMS as a pre-concentration step due to density difference between chromite (4.6 g/cm3) and silicates (2.8–3.4 g/cm3) to produce high PGMs grade sinks product and low-grade float stream [8].
2. Material and Methodology
2.1. Material
The sample used in this study was a Run of mine (ROM) UG2 ore with a chromite and PGMs head grade of Cr2O3 (10%) and (1.72 g/t), respectively. The sample had a top size of +60 mm.
2.2. Methodology
Figure 1 shows the steps used to prepare the sample before testwork, and Figure 2 shows the schematic diagram of a flowsheet, which shows the experimental procedure, followed. Each process will be explained separately below:
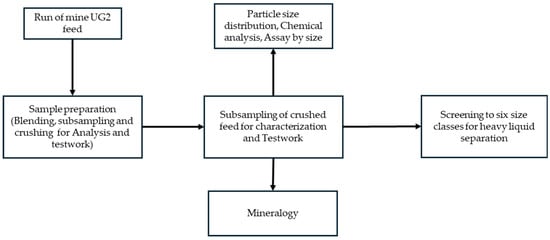
Figure 1.
Sample preparation, chemical, and mineralogical analysis schematic diagram.
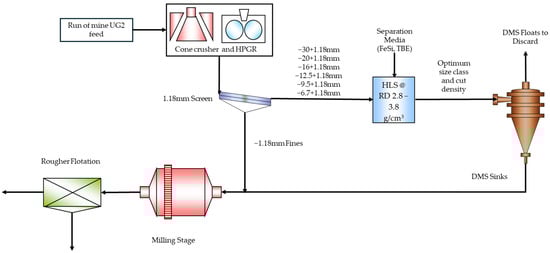
Figure 2.
Experimental procedure flowsheet.
2.2.1. Sample Preparation and Head Chemical Analysis
Looking at Figure 1 and Figure 2, the fresh feed sample (ROM Feed) was stage crushed using a jaw and cone crusher followed by screening depending on the target size fraction. Representative subsamples of the ROM ore crushed to −6.7 mm were further crushed to −1.18 mm and submitted for ore characterization by elemental chemical analysis and mineralogy. Removed subsamples were analysed to determine the deportment of PGMs and major gangue elements. Mineralogy of the sample included PGMs search followed by bulk modal and chromite characterization mineralogy. The purpose of mineralogy investigation was to establish the presence, identity, and relative abundance of PGMs bearing minerals as well as to obtain information on PGMs minerals abundance, deportment, and grain size distribution, liberation, and mineral associations.
Representative subsamples crushed to −30 mm were further stage crushed to −20 mm, −9.5 mm, and −6.7 mm conventional crushing followed by screening at −1.18 mm in preparation for laboratory HLS test. The polysius High pressure grinding roll (HPGR) available at the time of the testwork was limited to a top size of 12 mm. Thus, only two size classes—−9.5 mm and −6.7 mm—could be generated through HPGR followed by screening at 1.18 mm. Figure 1 shows the schematic diagram of sample preparation that followed.
After the optimum size fraction was selected based on HLS test, the remaining sample was crushed to −20 mm using the jaw crusher followed by screening at 1.18 mm in preparation of the pilot DMS test to produce DMS sinks and floats.
2.2.2. Chemical Analysis
The chemical analysis on the feed and process products were conducted using analysis methods Fire Assay for 4E (PGMS + Au), ICP 21 for low concentrate base metals in solids, and ICP metal oxide in solids.
For fire assay, the sample is fused with a flux in a furnace and the pills are digested on the hot plate to analyze the sample using ICP OES instrument, model 5900 manufactured by Chemtrix BV, Zwolle, The Netherlands. The detection limit of Fire assay for 4E is 0.02 ppm. ICP 21 is used for low base concentrations that cannot be detected by ICP Metal oxides. The methods used for ICP metal oxide and ICP 21 involve mixing the sample with flux, fusing in the autofusion, leaching with water and acid, and analyzing using Agilente ICP OES instrument model 5100 manufactured by Chemtrix BV, Zwolle, The Netherlands. For ICP 21, the sample is digested using four acids. ICP metal oxide has a lower detection limit of 0.05%, after which ICP 21 will be employed, which has a lower detection limit of 10 ppm.
2.3. Mineralogical Analysis
2.3.1. PGM Search
The sample was representatively sub-sampled and screened to produce polished mounts for analysis by the AutoSEM—using the FEG Mineral Liberation Analyzer (MLA) platform. The FEG MLA used was 650F model, with a detection limit of 0.05%. The analysis was based on a bright phase search, which searches out platinum group metals (PGM) based on their higher backscattered electron intensity under the electron beam, compared with gangue minerals. The bright phase, along with any other phases in the particle in which it occurs, was mapped using image analysis software. The bright PGMs were identified through the setting up of a standards library and described in terms of the species present and their relative abundance, grain size distributions, liberation characteristics, and mineral associations (i.e., what other minerals are associated with the identified PGM grains in particles). The PGM search analyses provided PGM species identification, grain size distribution, liberation characteristics, and gangue associations of PGM-bearing particles detected in the sample.
2.3.2. Bulk Modal
Representative polished sections of the sample were prepared for analysis by QEMSCAN AutoSEM platform. The sizing of the sample provides better accuracy of results from the QEMSCAN system.
Quantitative mineralogical assessment was conducted using a FEQ Qemscan 650F instrument manufactured by Field Electron and Ion Company, Hillsboro, OR, USA. The instrument uses backscattered electron (BSE) and energy-dispersive X-ray (EDX) signals from a scanning electron microscope (SEM) to create digital images in which each pixel corresponds to mineral species in the corresponding region under the electron beam. The analysis was carried out using the Particle Mineral Analysis (PMA) measurement mode. The particle mineralogical analysis (PMA) mode was used to provide information on the bulk modal mineral proportions by locating and identifying all the mineral phases present in the sample using a relevant SIP (Species Identification Protocol) composed of pre-defined compositions and BSE criteria. Combination of iDiscover and iMeasure software (version 5.2.3.2) were employed for the analysis. The Qemscan technique provides quantitative bulk mineralogy data, liberation, grain size distribution, and mineral association of the mineral of interest. The detection limit of this technique is approximately 0.05 mass percentage.
2.4. Heavy Liquid Separation (HLS)
Laboratory HLS testwork depicted in Figure 3 was conducted to determine if the UG2 ore was suitable for pre-concentration using dense media separation. HLS allows the separation of the feed into different density fractions providing insight into the recovery and gangue rejection at different density cut points [17]. It is fast and inexpensive and provided optimum cut density for pilot scale DMS processing. Tests were conducted on size classes −30 + 1.18 mm, −20 + 1.18 mm, −16 + 1.18 mm, −12.5 + 1.18 mm, −9.5 + 1.18 mm, and −6.7 + 1.18 mm fractions crushed using conventional crushing and two fractions crushed by High Pressure Grinding Rolls (HPGR), the −9.5 + 1.18 mm and −6.7 + 1.18 mm fractions.
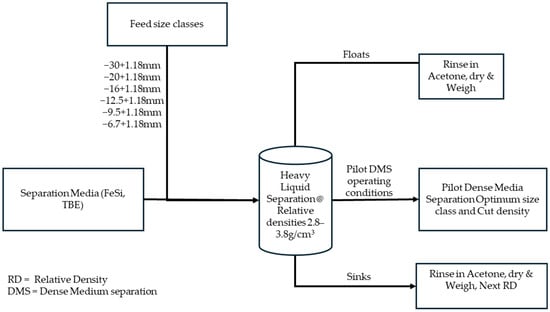
Figure 3.
Overview of the HLS procedure.
HLS tests were conducted on an array of density cut points ranging from 2.8 g/cm3 to 3.8 g/cm3 to determine the optimum cut density for maximum waste rejection at minimum PGMs losses to the floats. This was conducted to characterize the feed, determine the washability size fraction, and type of crusher that will minimize PGMs losses during DMS processing. The selection of the optimum size fraction was dependent on the grade, recovery, and mass yield that will limit PGMs losses to floats to a grade equal to and less than 0.4 g/t. Results from HLS were used to generate washability curves used to determine the DMS response profile confirming the optimum DMS cut point to reject barren waste.
2.5. Pilot Dense Medium Separation Testwork
A representative ROM feed sample was crushed using conventional crushing—i.e., jaw and cone crusher—depending on the size fraction for DMS testwork as it was deemed optimum compared to HPGR under the conditions tested. HLS results were used to determine the optimum cut point, size class, and crushing method. Pilot DMS was conducted using Mintek Pilot DMS cyclone facility (refer to Figure 4), 350 mm diameter cyclone at a feed pressure of 80 kPa and feed density of 3.4 g/cm3 for size class −20 + 1.18 mm.
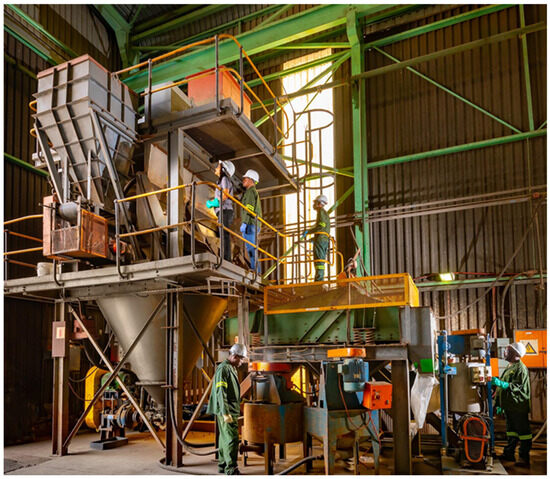
Figure 4.
Mintek’s Pilot Dense Medium Separation cyclone rig.
Coarse atomised FeSi 270D powder supplied by DMS Powders, Vereeniging, South Africa was employed. Circulating density, cyclone underflow and overflow densities, and feed pressure were monitored during operation to ensure steady conditions and constant feed. Once operating parameters meet optimum conditions, overflow and underflow products were collected, sun dried, and weighed.
10 kg sub-samples of float and sink products were prepared using riffle splitter for HLS and chemical analysis. HLS products were dried and weighed. The masses obtained were used to generate a tromp curve to determine the Ecart Probable (EP), used to measure cyclone efficiency.
3. Results and Discussion
3.1. Particle Size Distributions After Crushing
Figure 5 and Figure 6 shows the particle size distribution of size fractions products after crushing with conventional crushers (C.C.) followed by the comparison with HPGR for size classes −9.5 + 1.18 mm and −6.7 + 1.18 mm. According to Legault-Seguin [17], it is recommended to test multiple size classes to assess the mass yield and value recoveries at different size classes for each ore. The most common tested size classes have been 100% passing 12.5 mm. In this study, size classes above 12.5 mm were explored. Figure 5 shows that crushing from −30 mm to −6.7 mm increases the percentage of the material to the −1 mm size fraction. For −6.7 + 1.18 mm fraction, only 60% will be exposed to pre-concentration, while for −30 + 1.18 mm fraction, 83% of the feed will be exposed to pre-concentration. This shows that to upgrade finer size fractions using DMS, a secondary process to upgrade the −1.18 mm fraction, such as spirals, will be required.
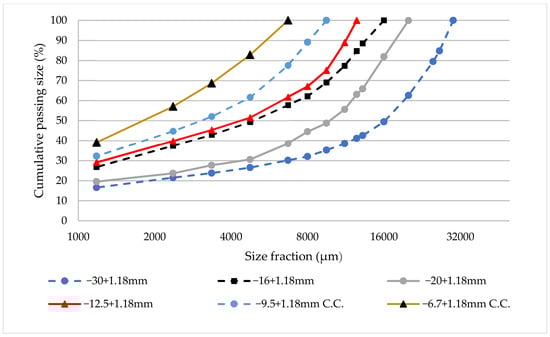
Figure 5.
Conventional crusher particle size distribution of the six size fractions.
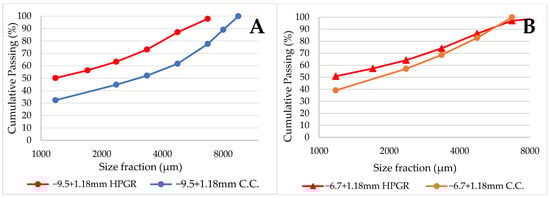
Figure 6.
PSD comparison between HPGR and Conventional crushers for size classes −9.5 + 1.18 mm (A) and −6.7 + 1.18 mm (B).
Figure 6 shows the particle size distribution comparison between the two crushers and showed that for HPGR 50% by mass reports to the −1.18 mm size fraction compared with the conventional crusher (30%). This shows that more feed material will be exposed to pre-concentration when a conventional crusher is used. The production of high amounts of fine material by HPGR will lead to a lower feed grade to the mill flotation plant, minimizing the importance of a pre-concentration stage. Optimization of HPGR is therefore recommended to reduce the number of fines. According to Nghipulile [14] and Weir [18], HPGR produces more fines than conventional crushing because of inter-particle grinding subjecting particles to a force applied in all directions and to all particle sizes and shapes. Inter-particle grinding is the driving force behind 40% less energy consumption by HPGR compared to conventional crushers. HPGR promotes better liberation of the feed; thus, with less mass split to the coarser size fractions it can still outperform a conventional crusher.
3.2. Head Analysis and Mineralogical Evaluation
Table 1 shows the chemical composition of the UG2 ore. It is observed that the PGMs collectively constitute 1.72 g/t of the feed sample. A feed grade of 1.72 g/t shows that the ore is low grade, and thus there is a need to pre-concentrate to an economic feasible grade before mill—flotation circuit.

Table 1.
UG2 ore head grade.
Figure 7 shows the PGMs distribution between the coarse and fine fractions for conventional crusher followed by Figure 8, which compares the PGMS distribution between conventional and HPGR crushers on −9.5 + 1.18 and −6.7 + 1.18 mm size fractions. The PGMs distribution increases with increasing mass distribution to the fines for a conventional crusher. Bergman [12] generated +1.7 mm and −1.7 mm size factions and found that the −1.7 mm size fraction was enriched with PGMs compared to the +1.7 mm size fraction. This is because crushing liberated PGMs from the +1.7 mm fraction, resulting in a PGMs-enriched −1.7 mm size fraction. In Figure 8, the HPGR fractions showed a similar mass split between the +1.18 mm size fractions (−9.5 + 1.18 mm and −6.7 + 1.18 mm) and the fine fraction (−1.18 mm), but the fine fraction (−1.18) was enriched with PGMs. For conventional crushers, the mass distribution was higher in the +1.18 mm fractions, but like HPGR, the distribution of PGMs reported higher to the fine fraction (−1.18 mm). The distribution of PGMs to the finer fractions was high for HPGR compared to conventional crushers, due to improved liberation from HPGR. According to Nghipulile [14], HPGR improve liberation due to the pressure of residual micro-cracks in the particles.
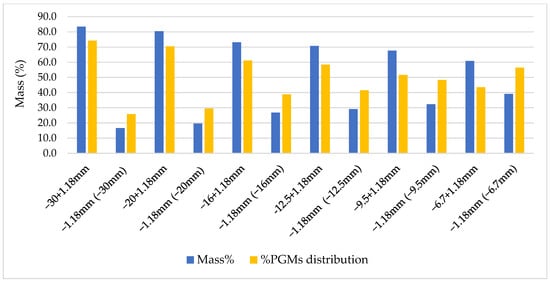
Figure 7.
Conventional crusher Mass and PGMs distribution of the six size fractions.
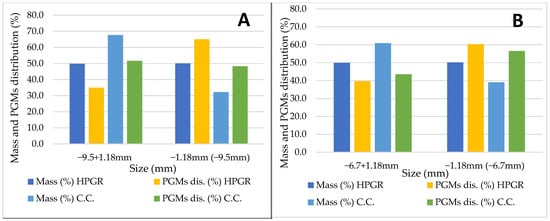
Figure 8.
Conventional crusher and HPGR PGMs distribution for size classes −9.5 + 1.18 mm (A) and −6.7 + 1.18 mm (B).
Bulk mineralogy of the samples (see Figure 9) shows that Pyroxene is the predominant mineral phase in the sample, followed by chromite, feldspar trace chlorite, serpentine, olivine, quartz, talc, and mica. All other mineral phases are present in amounts < 1 mass%.
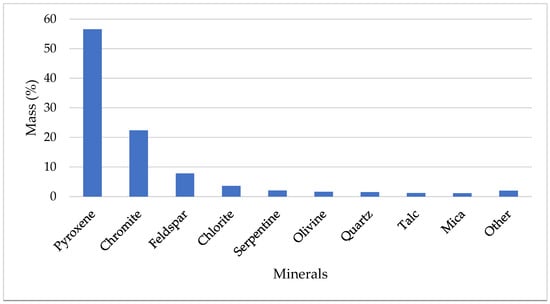
Figure 9.
Bulk modal mineralogy.
3.3. PGM Search Mineralogy
3.3.1. PGMs—Grouped Species
A graphical representation of the grouped PGM species in the sample is presented in Figure 10. Grouped PGM species include PGE-sulphides, PGE-bismuthotellurides, PGE-arsenides, PGE-sulfurarsenides, and laurite (Ru, Ir, Os sulphide). PGE-sulphides are the dominant PGM species, comprising ~57.6 vol %, followed by laurite (~19 vol %), PGE-alloys (~14.6 vol %), PGE-sulfurarsenides (4.2 vol %), PGE-arsenide (3.6 vol %), and PGE-bismuthotellurides (1.1 vol %). McCall [19] discussed that the mineralogy of the UG2 Reef showed that the UG2-Reef is made up of >90% PGE-sulphides such as Laurite ((Ru, Os, Ir)S2), cooperite (PtS), malanite ((Pt, Rh, Ir)2CuS4), braggite ((Pt, Pd)S), and occasionally vysotskite (PdS). PGMS are highly associated with sulphides, and an estimated grade of the PGMs is typically 4–9 ppm [19].
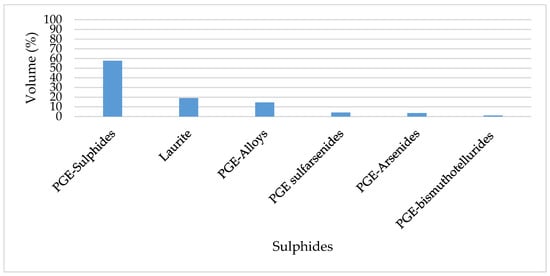
Figure 10.
PGM grouped species.
3.3.2. PGM Grain Size Distribution
The grain sizes of the PGMs are divided into size classes using the equivalent circle diameter (ECD). Image analysis measures the area of a grain in two dimensions, and as most grains are irregular in shape, the resultant area is converted into an equivalent area to that of a circle. The diameter of that circle is the equivalent circle diameter (ECD) of the grain. PGM grains larger than 3 μm ECD are likely to be fast floating, while those smaller than 3 μm ECD are slow floating. The majority of PGM grains by volume percent (55.9 vol %) report to the 0–6 μm size class (Figure 11). By number percent, however, ~90% of PGM grains report to the finer 0–6 µm size class and 52% report to the 0–3 µm size class. According to literature, the grains of PGMs are typically very small (smaller than ~10 µm in diameter); thus, there is a need for preconcentration without losing significant recovery of PGMs to the discard stream [20]. Fine-grained PGMs show that using the DMS at coarser size fractions (+1 mm) will assist with removing the coarse gangue material at minimum PGMs losses and increase the PGMs grade in the feed.
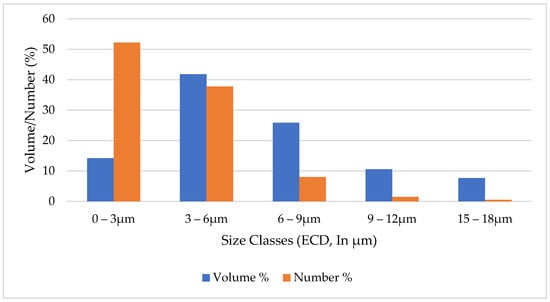
Figure 11.
PGM grain size distribution.
3.4. Chromite Characterization—Grain Size Distribution
Mineralogical characterization of the chromite minerals involves a specific mineral search by AutoSEM (QEMSCAN platform), whereby the particles containing chromite are analysed in terms of their modal abundance, liberation, and mineral association.
3.4.1. Chromite Grain Size
Size is reported in equivalent circle diameter (ECD), the diameter of a circle of the equivalent area to that of the grain, in microns. The grain sizes of the minerals of interest are divided into size classes using ECD and presented in mass%. The grain size distribution of chromite is presented in Figure 12.
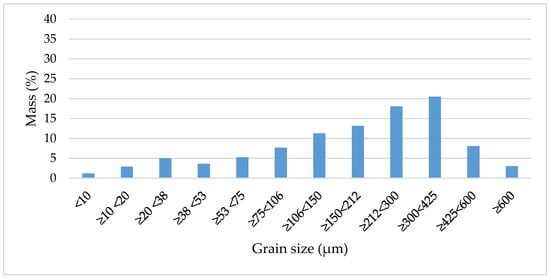
Figure 12.
Chromite grain size distribution.
Chromite grains are variably distributed with the majority reporting to the 106–600 µm size classes (78.9 mass%).
3.4.2. Chromite Liberation
Cumulatively, chromite is well-liberated with 75.5% better than 80% liberated in the feed sample (Figure 13).
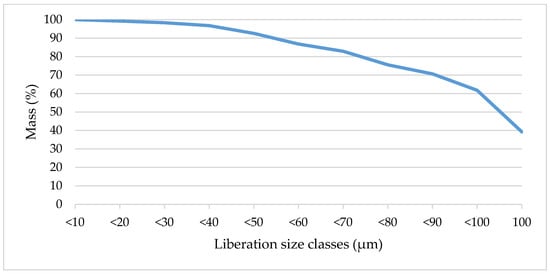
Figure 13.
Chromite cumulative area % liberation.
For degree of liberation greater than 80%, 75.5% of chromite is liberated, meaning that separation of chromite from gangue material is possible.
4. Heavy Liquid Separation
4.1. Mass Distribution Across Density Cutpoint
About 10–50 kg of as-received and screened six size fractions were subjected to laboratory HLS test at densities 2.8 g/cm3 to 3.8 g/cm3 at increments of 0.1. Figure 14 and Figure 15 show the discrete mass distribution of each size fraction across the various size classes for the conventional crusher and comparison with HPGR.
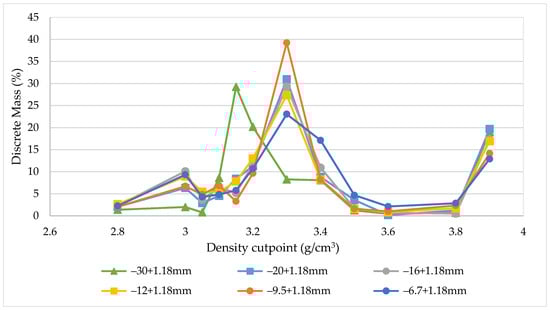
Figure 14.
Discrete mass distribution washability curves for six conventional crusher size fractions.
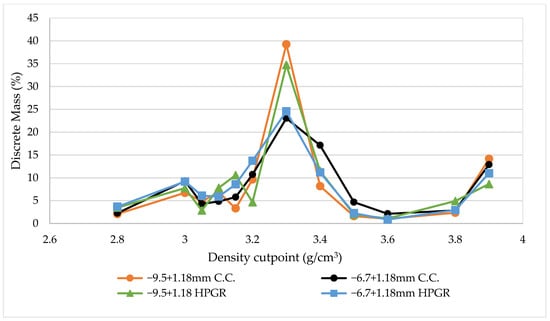
Figure 15.
Comparison between conventional crusher and HPGR discrete mass distribution washability curves for −9.5 + 1.18 mm and −6.7 + 1.18 mm size fractions.
The washability profile for both crushing methods shows a similar mass distribution trend across different size classes. The comparison between HPGR and conventional crusher shown in Figure 15 shows that each size fraction for both crushers showed a similar mass distribution. For both crushing methods, presence of near density material has been observed for size class −30 + 1.18 mm at densities 3.1 g/cm3 and 3.15 g/cm3 and at 3.2–3.3 g/cm3 for other fractions except with conventional crusher. Operating the DMS plant at high near density material would adversely affect performance of the DMS plant, leading to misplacement of the material. The cut point where <0.4 g/t of PGMs losses to the floats can be achieved is in the 3.1–3.5 g/cm3 range. To minimize the adverse effects of high near density material, a density between 3.4 to 3.5 g/cm3 will be the optimum cut point (see Table 2, Table 3 and Table 4). Literature shows that the same washability curves trend was observed for UG2 ore conducted by Marape [9].
Table 2.
−9.5 + 1.18 mm conventional crusher overall HLS mass balance.
Table 3.
−9.5 + 1.18 mm HPGR overall HLS mass balance.
Table 4.
−20 + 1.1.8 mm Conventional HLS Mass Distribution.
4.2. Heavy Liquid Separation—Overall Mass Balance Comparison Using −9.5 + 1.18 mm Between HPGR and Conventional Crushers
To compare the performance of HPGR to Conventional Crushers, size class −9.5 + 1.18 mm HLS results at a cut point of 3.4 g/cm3 were used. Compared to −9.5 + 1.18 mm size class, the size class displayed better optimum performance in terms of sinks grade and total PGMs recovery losses to the overflow. Table 2 and Table 3 show the comparison between HPGR to conventional crusher.
Conventional crushing depicted a higher overall PGMs upgrade than HPGR crushing. This is attributed to the increased −1 mm fines generated by HPGR, which was not subjected to the pre-concentration stage. Literature showed that Bergmann [12] found a significant generation of fines fraction by HPGR at both low and high pressures, suggesting that the use of HPGR before DMS pre-concentration reduces the fraction of feed exposed to pre-concentration. The difference between the conventional crushing and HPGR size fractions at density 3.4 g/cm3 for the −9.5 + 1.18 mm size fraction in terms of overall mass rejection to the floats and PGMs recovery losses to floats was very minor at less than 1%. Bergmann [12] found that in a situation where HPGR is substituting conventional crushing methods, the same effect is expected and therefore it is of importance to investigate the economic impact of using HPGR instead of conventional crushing methods.
It is therefore recommended to pre-concentrate the DMS using the conventional crusher due to less generation of fines, exposing the material to pre-concentration stage, which increases the overall grade of PGMs in the final overall product. Based on the results in Table 3, 50% of the material from HPGR was not subjected to a pre-concentration stage, thus leading to a less overall grade of the product after pre-concentration. It is recommended HPGR be optimized to produce a mass split like that of conventional crushers.
4.3. Heavy Liquid Separation—HLS Overall Mass for Coarser Size Fractions and Optimum Size Class Selection
Under the conditions tested, comparing coarser size fractions showed that −20 + 1.18 mm size class at an optimum density of 3.4 g/cm3 produced the optimum HLS results and can be used as an optimized size fraction to run the pilot DMS plant. Compared to −9.5 + 1.18 mm size class, −20 + 1.18 mm had the highest PGMs grade to the mill flotation plant, as shown by Table 4 below. The PGMs recovery losses to the floats only differed by 0.57% in favor of the −9.5 + 1.18 mm size class.
To select the optimum size class that will minimize losses to the floats, size classes −20 + 1.18 mm and −9.5 + 1.18 mm crushed by conventional crusher were selected at density 3.4 g/cm3. Both the classes have a low PGM recovery loss to the floats in a range of 11%–12% and 4E grade < 0.4 g/t. The −20 + 1.18 mm size class was selected to run the pilot DMS plant on the UG2 sample because the cost of crushing to −20 + 1.18 mm is expected to be lower than the cost to crush to −9.5 + 1.18 mm. The HPGR used could only accept a top size of 12 mm; thus, it is recommended to use a pilot HPGR to test coarser size fractions on the HPGR and compare.
5. Dense Medium Separation (DMS)
Pilot DMS testwork was conducted on crushed and screened −20 + 1.18 mm fraction prepared by conventional crusher. The testwork was conducted using milled 270D Ferrosilicon to target a cut point of 3.4 g/cm3. Table 5 shows pilot DMS test conditions employed.
Table 5.
Pilot DMS test conditions.
The overall recovery of Total PGMs + Au to the DMS sinks and the −1.18 mm fines was approximately 84.96% (refer to Table 6). In overall, the DMS cyclone could reject 61.1% mass to the floats based on ROM at 1.12% Cr2O3 and 0.42 g/t Total PGMs + Au grade at 15.04% of the Total PGMs + Au recovery losses. Compared to the testwork conducted by Marape [9], Govender and Gericke [11] at Mintek, the grade is discardable (approximately 0.4 g/t) at no cost and a higher mass yield to the floats.
Table 6.
Overall −20 + 1.18 mm Pilot DMS mass balance relative to ROM feed.
Subsamples of −20 + 1.18 mm DMS floats and sinks products from the pilot DMS testwork were subjected to HLS testwork to determine the separation efficiency and actual density cut point attained on the pilot DMS run. Table 7 shows the actual SG50 cut point achieved as well as the Ecart Probable (Ep) obtained from the partition curve.
Table 7.
−20 + 1.18 mm size class actual cut point and Ep based on DMS partition.
The partition profile of the DMS plant run (Tromp curve) suggested that the actual density cut point obtained during the pilot DMS run on material using milled 270D FeSi was 3.46 g/cm3 at Ep of 0.04. The actual cut point and overall mass split to the floats was higher than that targeted based on the HLS test. Table 8 compares DMS mass yield to floats at 3.46 g/cm3 to HLS. Results show that DMS reported a 2% mass yield slightly lower than predicted by HLS at a density of 3.46 g/cm3 but similar to density 3.40 g/cm3 from the heavy liquid separation. Compared to Marape [9], the DMS reported a 3% mass yield slightly lower than predicted by heavy liquid separation.
Table 8.
Comparison of DMS mass yield to HLS at 3.46 g/cm3 cut point.
6. Conclusions
The overall chemical analysis of the treated sample reported a low head grade at 1.72 g/t Total PGMs + Au. PGM search mineralogy showed that 90% of the PGMs grains report to the finer the 0–6 µm size class, suggesting very fine PGMs. HLS results showed that significant waste rejection of 50% mass relative to ROM can be achieved at densities between 3.4 and 3.6 g/cm3 with PGM losses to the floats recoveries at a range of 8.5%–15% at <0.4 g/t Total PGMs + Au grade. Conventional crushing depicted a higher overall PGMs upgrade than HPGR crushing under conditions tested for −9.5 + 1.18 mm size fraction. Crushing by HPGR increases generation of fines, resulting in lower mass subjected to the pre-concentration stage.
It is recommended to use a pilot HPGR to crush to coarser size fractions for comparison between the crushers. Size class −20 + 1.18 mm depicted the most optimum HLS results compared to other size classes and was selected as the optimum size class to run DMS. Overall, the DMS cyclone could reject 61.1% mass to the floats based on ROM at 1.12% Cr2O3 and 0.42 g/t Total PGMs + Au grade. In total, about 15.04% of the Total PGMs + Au was lost to the floats based on ROM. The partition profile of the DMS plant run (Tromp curve) suggests that the actual density cut point obtained during the pilot DMS run on material using milled 270D FeSi was 3.46 g/cm3 at Ep of 0.04. Flotation tests and PGMs search are recommended on the DMS floats to investigate if PGMs lost to DMS floats are of value and recoverable by flotation.
Author Contributions
Methodology, G.M. and R.M.; Investigation, T.M. and R.M.; Resources, G.M.; Data curation, T.M. and G.M.; Writing—original draft, T.M.; Writing—review & editing, T.M.; Visualization, T.M.; Supervision, G.M.; Project administration, T.M. and R.M.; Funding acquisition, G.M. All authors have read and agreed to the published version of the manuscript.
Funding
This research received no external funding.
Data Availability Statement
The data presented in this study are available on request from the corresponding author. The data is not publicly available due to internal research from within the organization.
Conflicts of Interest
The authors declare no conflict of interest.
References
- Cawthorn, R. The platinum and palladium resources of the Bushveld Complex. S. Afr. J. Sci. 1999, 95, 481. [Google Scholar]
- Corin, K.C.; McFadzean, B.J.; Shackleton, N.J.; O’Connor, C.T. Challenges Related to the Processing of Fines in the Recovery of Platinum Group Minerals (PGMs). Minerals 2021, 11, 533. [Google Scholar] [CrossRef]
- Davis, D. Auctus Metal Portfolios. 2022. Available online: https://auctusmetals.com/platinum-analysis-ore-grades-s-african-pgm-mines-geological-structure-part-ii-by-dr-david-davis/ (accessed on 3 June 2024).
- Steyn, J. Developing a Framework for the Design of the Milling and Rougher Circuits for a Platinum-Bearing UG2 Ore. Ph.D. Thesis, University of Cape Town, Cape Town, South Africa, 2012. [Google Scholar]
- Valenta, M.M. Balancing the reagent suite to optimise grade and recovery. Miner. Eng. 2007, 20, 979–985. [Google Scholar] [CrossRef]
- Neethling, B. Daily Investor. 2024. Available online: https://dailyinvestor.com/business/46007/south-africas-platinum-mining-industry-in-trouble/#:~:text=This%20is%20due%20to%20a,noticeable%20decline%20in%20PGM%20prices (accessed on 26 April 2024).
- Valery, K.; Duffy, K.-A. Mining Magazine. 2017. Available online: https://www.miningmagazine.com/processing/news/1331378/preconcentrate (accessed on 5 June 2024).
- Smit, F.; CoetzeeI, V.; Seymour, M.; Notnagel, S. Preconcentration of UG2 platinum ore: Economic benefits. J. S. Afr. Inst. Min. Metall. 2013, 113, 297–304. [Google Scholar]
- Marape, G. Investigation of The Potential to Apply DMS as a Waste Rejection Step Ahead of MF2 PGM Flotation Process on a Crushed UG2 Rom Sample from Two Rivers Platinum; Mintek: Ranburg, South Africa, 2020. [Google Scholar]
- Asakawa, A.H.; Bergerman, M.G.; Chaves, A. Evaluation of the crushing method impact on the mineral liberation in pre-concentration circuits. REM-Int. Eng. J. 2024, 77, e230036. [Google Scholar] [CrossRef]
- Govender, Y.; Gericke, M. Biotransformation of Platinum Group Metal (PGM) Containing ORES (PGM Cluster, PGM 12); Mintek: Randburg, South Africa, 2010. [Google Scholar]
- Bergmann, C.; Singh, A.; Ramlall, N. Dense Medium Separation (DMS) of UG2 ORES; The Southern African Institute of Mining and Metallurgy: Johannesburg, South Africa, 2010; pp. 225–232. [Google Scholar]
- Solomon, N.; Becker, M.; Mainza, A.; Petersen, J.; Franzidis, J. Understanding the influence of HPGR on PGM flotation behavior using mineralogy. Miner. Eng. 2011, 24, 1370–1377. [Google Scholar] [CrossRef]
- Nghipulile, T.; Nkwanyana, S.; Lameck, N. The Effect of HPGR and Conventional Crushing on the Extent of Micro-Cracks, Milling Energy Requirements and the Degree of Liberation: A Case Study of UG2 Platinum Ore. Minerals 2023, 13, 1309. [Google Scholar] [CrossRef]
- Ozcan, O.; Benzer, H. Comparison of different breakage mechanisms in terms of product particle size distribution and mineral liberation. Miner. Eng. 2013, 49, 103–108. [Google Scholar] [CrossRef]
- Rosario, P.; Hall, R.; Grundy, M.; Klein, B. A preliminary investigation into the feasibility of a novel HPGR-based circuit for hard, weathered ores containing clayish material. Miner. Eng. 2011, 24, 290–302. [Google Scholar] [CrossRef]
- Rylatt, E.L.-S.M. Dense Medium Separation: An Effective and Robust Preconcentration Technology. In Proceedings of the 48th Annual Canadian Mineral Processors Operators Conference, Ottawa, ON, Canada, 19–21 January 2016; pp. 381–400. [Google Scholar]
- Weir. 2019. Available online: https://www.global.weir/newsroom/global-news/why-hpgrs-are-revolutionising-mill-circuits/#:~:text=The%20inter%2Dparticle%20grinding%20of,just%20the%20coarser%20size%20fractions (accessed on 10 July 2024).
- McCall, M.-J. Mineralogical and Geochemical Variations in the UG2 Reef at Booysendal and Zondereinde Mines, with Implications for Beneficiation of PGM. Master’s Thesis, Stellenbosch University, Stellenbosch, South Africa, 2016. [Google Scholar]
- Van Gruenewaldt, G.H.C. Platinum-group metals-a resource in the tailings of chromium mines in South Africa. J. S. Afr. Inst. Min. Metall. 1987, 87, 265–268. [Google Scholar]
Disclaimer/Publisher’s Note: The statements, opinions and data contained in all publications are solely those of the individual author(s) and contributor(s) and not of MDPI and/or the editor(s). MDPI and/or the editor(s) disclaim responsibility for any injury to people or property resulting from any ideas, methods, instructions or products referred to in the content. |
© 2025 by the authors. Licensee MDPI, Basel, Switzerland. This article is an open access article distributed under the terms and conditions of the Creative Commons Attribution (CC BY) license (https://creativecommons.org/licenses/by/4.0/).