Abstract
Hydraulic fracturing is widely used for developing shale reservoirs with low porosity and permeability. Large volumes of fracturing fluids are injected into reservoirs, yet the impact of these fluids on shale is not entirely understood. This study investigates the effects of commonly used fracturing fluids on the fundamental properties of shale during the shut-in period using experimental methods. Shale samples are collected from the Longmaxi Formation in the Sichuan Basin. Two types of fracturing fluids (guar gel and slickwater) are prepared for tests. The effects of these fluids on shale’s mineral composition, pore distribution, and fracture structure are analyzed using a range of techniques, including X-ray diffraction, nuclear magnetic resonance, nitrogen adsorption-desorption, and X-ray computed tomography scanning. The results show that the shale is composed of quartz, siderite, and clay minerals. The reservoir’s pore structure is relatively uniform, with a higher proportion of small pores and a predominance of wedge-shaped pore types. The porosity ranges from 1.8% to 4.33%, with an average pore diameter varying between 10.8 nm and 24.8 nm. More fracturing fluid enters the reservoir as shut-in time increases. Initially, fluid invasion occurs rapidly, but the volume of infiltrated fluid stabilizes after 15 days. The fracturing fluids cause chemical reactions and hydration of clay minerals. Both fracturing fluids lead to a decrease in the proportion of clay minerals and an increase in the proportion of quartz. After soaking in guar gel, the shale’s surface area and pore volume decrease while the average pore diameter increases. The breakdown of guar gel leads to a residue that blocks pore spaces, resulting in lower surface porosity. In contrast, slickwater increases surface area and pore volume while reducing the average pore diameter. Slickwater also promotes the development of fractures, with larger pores forming around them. The results suggest that slickwater is more effective than guar gel in improving shale’s pore structure.
1. Introduction
As global oil and gas demand grows, unconventional oil and gas with significant resource potential have gradually become a new development focus [1,2,3]. Shale gas is an important, clean, and efficient source of energy with significant resource potential [4,5]. Due to the low porosity, low permeability, and poor pore-throat connectivity of shale gas reservoirs, hydraulic fracturing technology is essential for enhancing the reservoir’s productivity [6].
Hydraulic fracturing injects large volumes of water into tight shale reservoirs to increase flow along newly created pathways or reopen natural flow channels for gas production [7,8,9]. After fracturing, the well is shut in for a period before production begins. The shut-in period can significantly affect future production. Longer shut-in periods generally lead to lower fluid recovery, reduced long-term yield, and potential groundwater contamination [10,11,12].
Previous studies have shown that the properties of fracturing fluids and their interaction with the shale directly affect fracturing efficiency and reservoir performance [13,14,15,16]. During the fracturing process and shut-in stages, fracturing fluid gradually enters the reservoir due to filtration and imbibition [17,18]. This interaction between the fluid and the shale, including chemical and physical alterations to the shale caused by the fluid, can lead to changes in the reservoir’s mineral content [19,20,21,22,23,24,25]. The interaction also leads to changes in the rock’s physical properties, including variations in porosity and the development of microfractures [26]. These changes alter fluid flow paths, which in turn influence gas storage and production [27,28].
In recent decades, some researchers have made progress in developing testing methods for evaluating shale reservoirs [29,30,31,32], which provides us with excellent technical means to study the effects of fracturing fluid on shale pore-fracture structure. Pore parameters can be directly measured using testing instruments. Nuclear magnetic resonance (NMR) can determine the distribution of fracturing fluid in the pore-fracture structure, which helps estimate pore structures at various scales [33,34]. Nitrogen adsorption-desorption is an effective method for calculating micro-pore and meso-pore structural parameters (including pore volume, pore size distribution, and specific surface area) [35,36,37,38]. X-ray computed tomography scanning (CT) is also useful for identifying the three-dimensional arrangement of pores and fractures in shale, allowing for a detailed assessment of pore connectivity [39,40,41,42,43,44,45,46].
In recent years, guar gel and slickwater fracturing fluids have been widely applied in shale gas exploitation, but their specific impacts on shale pore structures, mineral compositions, and fracture development remain insufficiently understood [13,47]. This study focuses on the shut-in period after fracturing and provides a comprehensive evaluation of how different fracturing fluids influence shale properties over time. Mineral composition changes in the reservoir before and after soaking in fracturing fluids are determined by X-ray diffraction (XRD). By combining pore testing, low-temperature liquid adsorption-desorption, and CT, the study offers a multidimensional analysis of the effects of fracturing fluids during the shut-in period on shale pores and fracture structures. These findings will enhance our understanding of fracturing fluid effects and provide valuable insights for shale resource evaluation and exploitation.
2. Materials and Samples
This study focuses on shales from the Longmaxi Formation in the Luzhou Block, an important shale gas production area within the Sichuan Basin known for its abundant shale gas resources. The Longmaxi Formation was formed in a marine sedimentary environment with strong reductive conditions in stratified water, which provided ideal conditions for the development of organic-rich shale [48,49]. As a result, the Lower Silurian Longmaxi Formation shale has become an important layer for shale gas accumulation.
Shales in the Luzhou Block are typically found at depths ranging from 3500 m to 5000 m, which is a typical deep shale gas reservoir. The shale reservoir is characterized by large thickness, high organic matter content, and a well-developed oil window, which has relatively high hydrocarbon generation potential. The formation has a relatively gentle dip, with few developed fractures. The fractures are mainly low-angle bedding fractures, with fewer vertical fractures, which are favorable for the formation of over-pressured shale gas accumulation areas and the improvement of the preservation potential of shale gas.
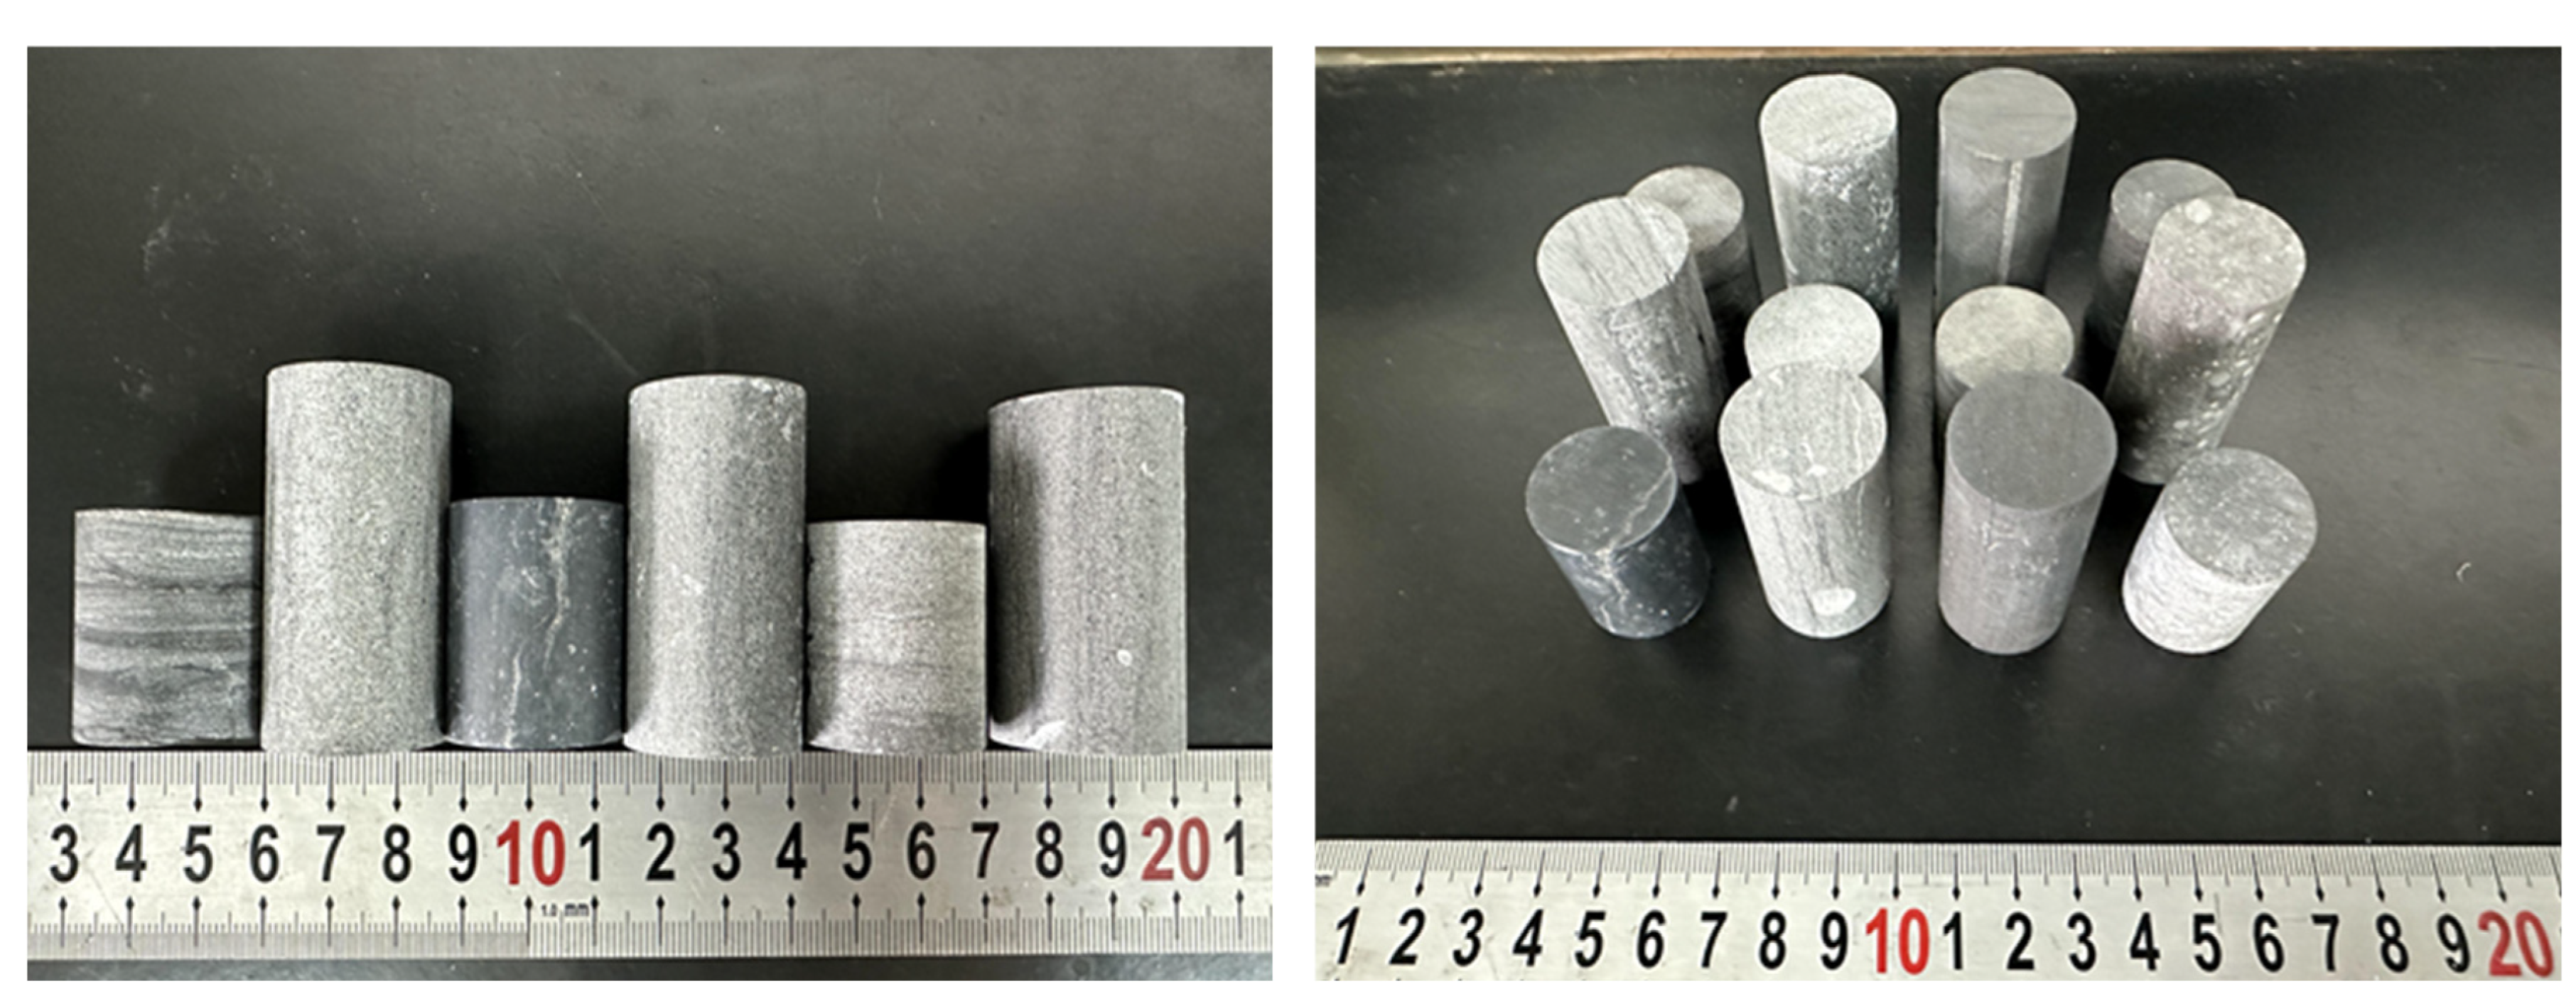
This study selected intact and unstimulated samples from the research area. The two largest samples are chosen as two groups to ensure that each group of rock samples has similar mineral compositions and physical properties. As shown in Figure 1, each sample is cut into four long cores (approximately 50 mm in length and 25 mm in diameter) and three short cores (approximately 30 mm in length and 25 mm in diameter). These cores are used for NMR, porosity tests, and CT. The remaining sample sections are crushed and used for low-temperature nitrogen adsorption-desorption and XRD.
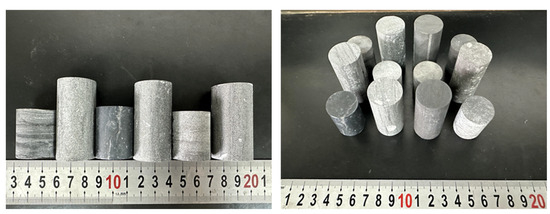
Figure 1.
Photograph of partial shale samples.
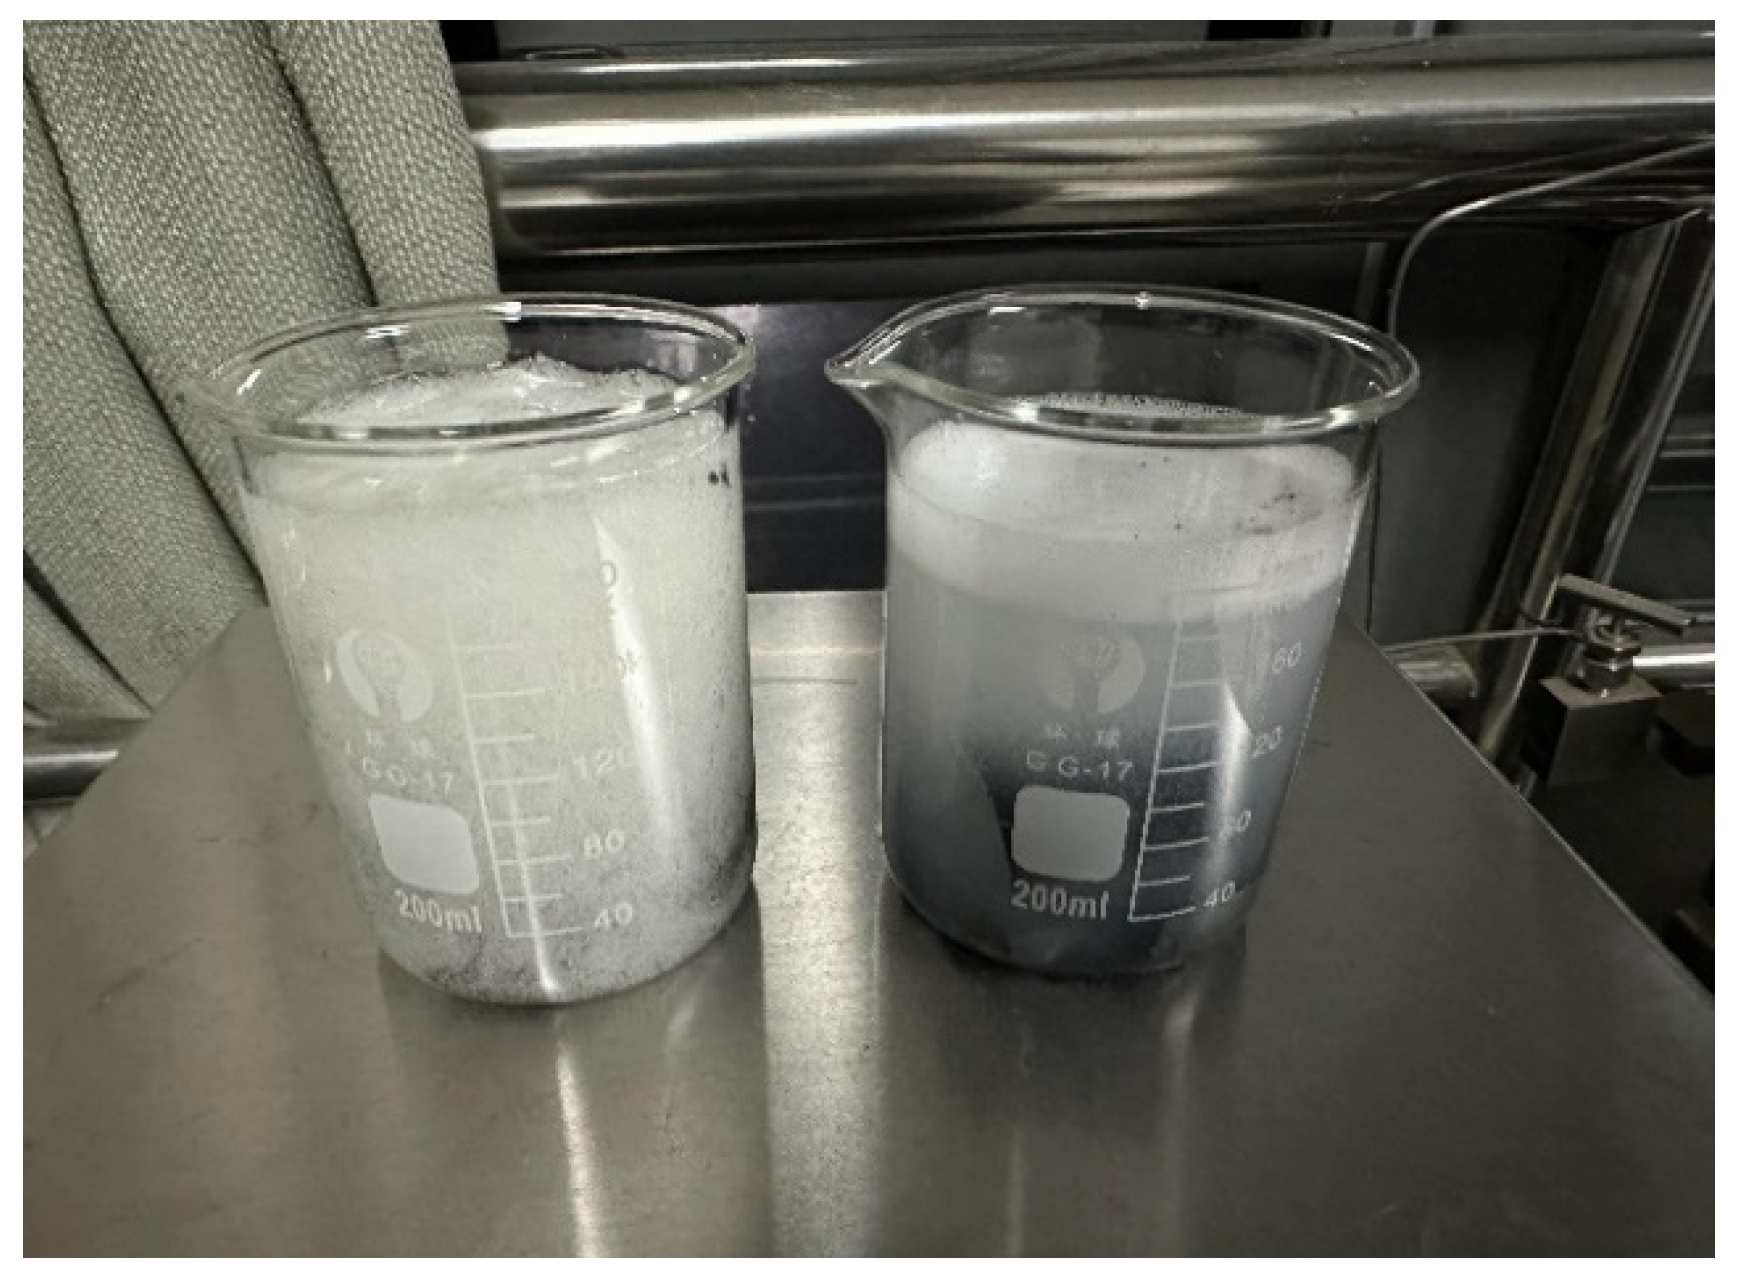
Slickwater and guar gel fracturing fluids are commonly applied in shale gas reservoir fracturing operations. Slickwater, which has been used since 1997, consists of about 99% water and is known for its low cost and relatively low viscosity. Guar gel, typically used in clay-rich shale gas reservoirs, has a higher viscosity, strong fracture-creating ability, low fluid loss, and good proppant-carrying capacity. For the two groups of rock samples, both slickwater and guar gel fracturing fluids were prepared for this study (Figure 2). The slickwater fracturing fluid used in this study was prepared by adding 0.3% friction reducer to deionized water, resulting in a viscosity of 18 mPa·s. The guar gel fracturing fluid consisted of 1% guar gum, 0.1% crosslinker, 0.3% regulator, and 98.6% deionized water, with a final viscosity exceeding 39 mPa·s. The fluids were initially unbroken, with guar gel resembling a jelly-like consistency. Both fracturing fluids were broken using 0.01% ammonium sulfate at 80 °C.
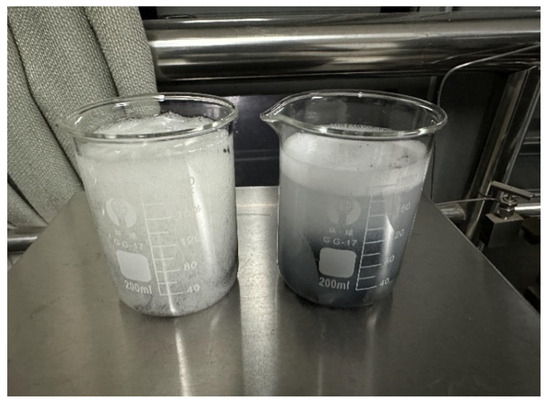
Figure 2.
Unbroken guar gel and slickwater fracturing fluid soaking.
The core samples and crushed samples were soaked in the fracturing fluids under ambient pressure for periods of 5, 10, 15, 20, 25, and 30 days. According to the soaking duration, samples (cores and debris) soaked in slickwater fracturing fluid were named H0, H5, H10, H15, H20, H25, and H30. Similarly, samples soaked in guar gel fracturing fluid were named G0, G5, G10, G15, G20, G25, and G30. After the soaking period, the core samples were removed and subjected to various experiments.
3. Methods
3.1. X-Ray Diffraction Analysis
The mineral composition of shale samples is identified and quantified using XRD [50,51,52]. The samples are ground to a fine powder (less than 200 mesh) and placed on slides. A Bruker D8 Advance X-ray diffractometer is used with a voltage of 60 kV and a current of 80 mA, using CuKα radiation (λ = 1.5406). Data are collected at a scanning rate of 2°/min over a range of 5° to 70° with a step size of 0.02°. The collected data are processed using Jade 6.5 software, which matches the diffraction peaks to a reference database to identify the minerals, and the mineral composition is reported as percentages.
3.2. Porosity and Permeability Measurement
Before testing porosity, the core samples are dried to remove moisture, ensuring the accuracy of results. Drying is performed at a temperature below 105 °C to prevent any alteration in the physical properties of cores. The drying time is at least 2 h, with an ideal duration of 8 h or more, depending on the core’s size and moisture content. When the soaking time is reached, the core samples are dried at 100 °C for 24 h. Then the porosity of the core is measured by a porosity instrument located in a laboratory of China University of Geosciences (Beijing). Porosity is measured based on Boyle’s law, where gas expands into the core chamber from a standard pressure. The gas pressure change is monitored and used, along with known volume data, to calculate the core’s effective pore volume.
3.3. Nuclear Magnetic Resonance Experiment
NMR works by observing the behavior of hydrogen nuclei (1H) in fluids. When the rock sample is saturated with water and placed in a uniform magnetic field, the hydrogen nuclei align with the magnetic field. Applying a radiofrequency field induces resonance, after which the signal decays exponentially. This decay can be described by longitudinal relaxation time (T1) and transverse relaxation time (T2) [53,54]. T2 is mostly used for measurement due to its faster response. T2 can be expressed as:
where T2B is body relaxation time; T2S is surface relaxation caused by the interaction of fluid and void solid surfaces; T2D is relaxation time due to diffusion.
During the soaking process, two core samples (H30 and G30) are removed every five days for NMR testing. NMR is conducted using a SPEC-RC1 multiphase flow analysis instrumentlocated in a laboratory of China University of Geosciences (Beijing), which operates at a magnetic field strength of 0.28 T and a proton resonance frequency of 12 MHz. The results are processed using the instrument’s software to generate T2 spectra, which provide a visual representation of the pore space distribution within samples.
3.4. Nitrogen Adsorption-Desorption
The instrument is the 3H-2000PS1/2 (Xian Yima Optoelec Co., Ltd. , Xi’an, China) static container surface area and pore size analyzer. It generates adsorption and desorption isotherms, BET single-point surface area, BET multi-point surface area, BET constant, Langmuir surface area, and Langmuir equilibrium constant. The device operates in a pressure range of 0–0.16 MPa, with a pore size measurement range of 0.35–400 nm and a specific surface area measurement range of ≥0.0005 m2/g, exhibiting a reproducibility error of ≤1%. The experiment is conducted at a liquid nitrogen temperature of −196.15 °C.
The nitrogen adsorption volume is closely related to the relative pressure (P/P0) during the experiment. When the relative pressure is between 0.05 and 0.35, the adsorption follows the BET multilayer adsorption model [55].
The pore volume and pore size distribution of the shale are determined by the Barrett–Joyner–Halenda (BJH) theory, which refines the Kelvin equation. The BJH model accounts for the adsorption of nitrogen molecules on pore walls before capillary condensation, providing more accurate pore volume and size distribution [56]. The relationship between pore diameter and relative pressure is given by:
where Vpm is the pore volume; rpm is the maximum pore radius; rkm is the capillary radius; Vn is the capillary volume; tn is the thickness of adsorbed nitrogen layer; Acj is the area after previous evacuation.
3.5. X-Ray Computed Tomography Scanning
While nitrogen adsorption-desorption is effective for measuring small pores, CT is used to analyze macro-pore and fracture changes before and after the reaction of fracturing fluid with shale. CT is based on X-ray penetration, which allows for non-destructive analysis of the sample’s internal structure. By absorbing X-rays at varying intensities, the sample generates two-dimensional projection images that are reconstructed into a three-dimensional model using computational algorithms [57,58]. This technique provides detailed structural information about the shale.
NanoVoxel-5000 series CT scanner from Tianjin Sanying Company (Tianjin, China) is used in this study. The equipment has a tube resolution of 5 μm, with an X-ray tube voltage of 90 kVp and a current of ≤0.25 mA. The shale core sample is secured onto the scanning platform to ensure stability during the scan. The CT scanner rotates around the core, capturing a series of two-dimensional projection images from various angles. These images undergo preprocessing, including grayscale conversion and noise reduction, to improve image quality. Using reconstruction algorithms, the two-dimensional images are transformed into slice images and further reconstructed into a three-dimensional model. CT helps extract pore structures, fracture distribution, and mineral composition, which provides insights into the shale’s porosity and fracture connectivity.
4. Results and Discussion
4.1. Fracturing Fluid Infiltration
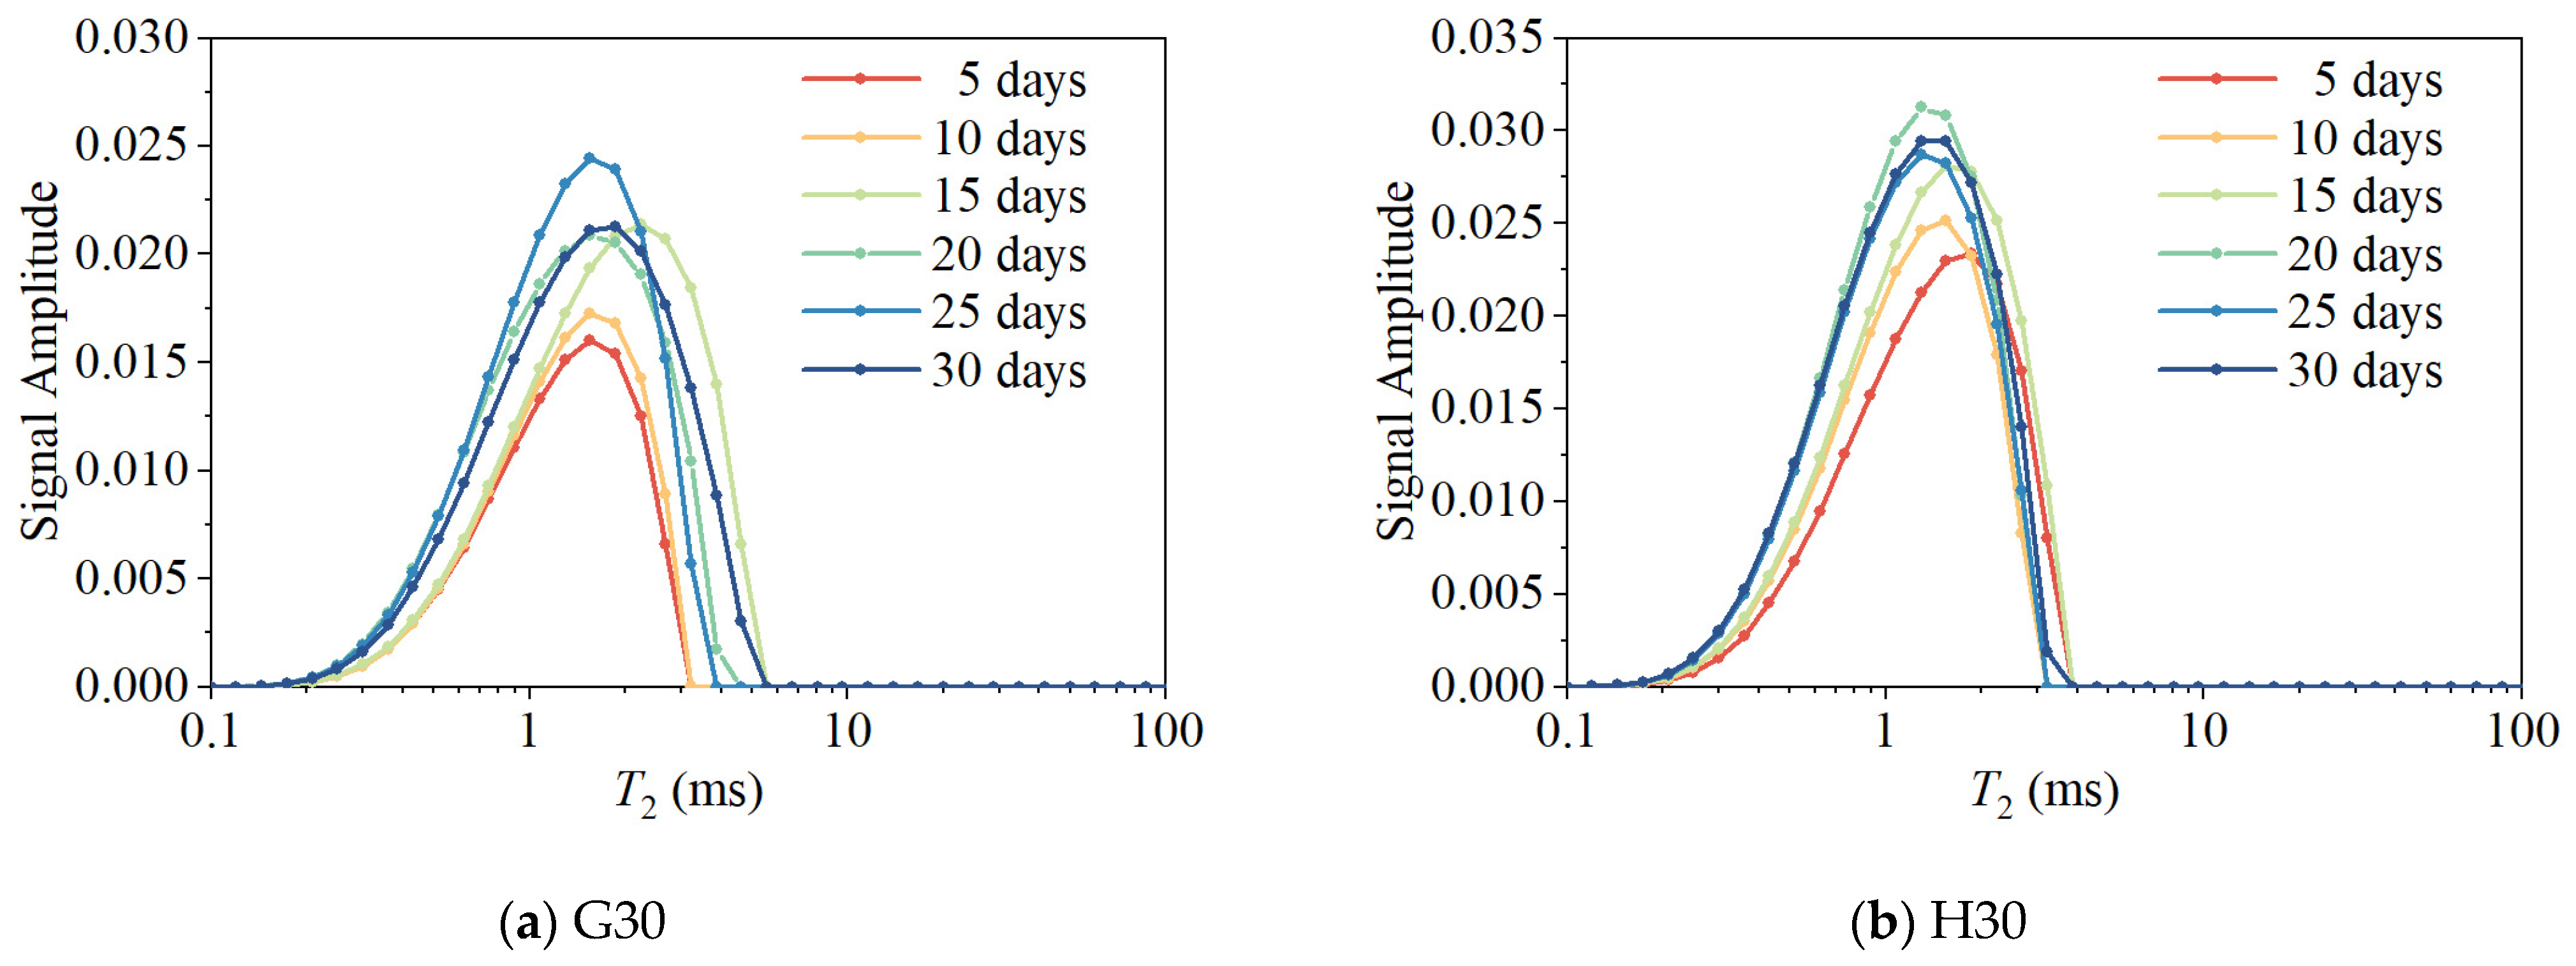
The fluid distribution characteristics in the shale can be analyzed based on the NMR experiment. The NMR signals come from the hydrogen-containing fluids in pores and reflect the distribution of pore sizes. Small pores exhibit short relaxation times, while large pores show longer relaxation times [59]. The distribution of the T2 spectra consists of a single-peak distribution, a double-peak distribution, and a triple-peak distribution. Both H30 and G30 after immersion show typical single-peak distribution characteristics (Figure 3). This characteristic of high peak and narrow distribution of spectra indicates that the peak corresponds to a large percentage of pores and the pore distribution of this core is relatively uniform. The relaxation time of small pores is short, and the relaxation time of large pores is long [60]. According to the relaxation time concentrated near 1 ms, the target layer of the study area develops abundant small and medium-sized pores.
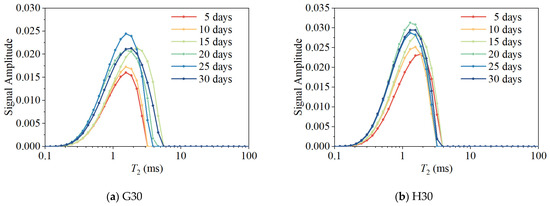
Figure 3.
T2 spectra distributions of shale samples: (a) core treated with guar gel fracturing fluid; (b) core treated with slickwater fracturing fluid.
The integral area of the T2 spectra is directly proportional to the amount of hydrogen in the pore fluid. Higher fracturing fluid content in the pores leads to a larger T2 spectrum area. The T2 spectral signal amplitude and spectral peak area show an increasing trend with increasing immersion time for both slickwater and guar gel fracturing fluids. This increase is more obvious at the beginning. After 15 days, the peak area of the T2 spectrum is more stable, and the signal intensity fluctuates. This indicates that at the early stage of imbibition, more fracturing fluid enters the pores of samples as time goes on, and the intrusion of fracturing fluid is regular and stable. At the later stage of imbibition, the volume of the intruded fluid is relatively stable, and some signal fluctuations may be related to the uncontrollable volatilization of the fluid during the experimental process of wiping the surface of the samples and exposing the cores in the air.
The T2 spectrum shows a slight shift to the left during the slickwater fracturing fluid immersion (Figure 3b). It can be assumed that the fluid mainly enters larger pores in the early stage of immersion. Due to the small pore adsorption and differential pressure, the fluid is transported between pores and more fluid enters the smaller channels. However, this feature is relatively insignificant in the soaking process of guar gel fracturing fluid, which may be related to the greater viscosity of guar gel fracturing fluid.
The signal intensity and spectral peak area are stronger for slickwater fracturing fluid compared to the guar gel fracturing fluid. Field practice results indicate that the fracturing fluid has low viscosity and residue, and it is well-matched with the formation water, without generating precipitation and flocculation. This difference may be related to the distinct properties of two types of fracturing fluids. The slickwater fracturing fluid exhibits low viscosity without residual particles upon breaking down, which facilitates its entry into shale pores. In contrast, guar gel fracturing fluid initially shows a much higher viscosity, making it difficult for the fracturing fluid to flow through the shale matrix. The polymer residue may remain in the fractures, potentially blocking the pore-fracture channels and hindering the invasion of fracturing fluid.
4.2. Changes in Mineral Composition
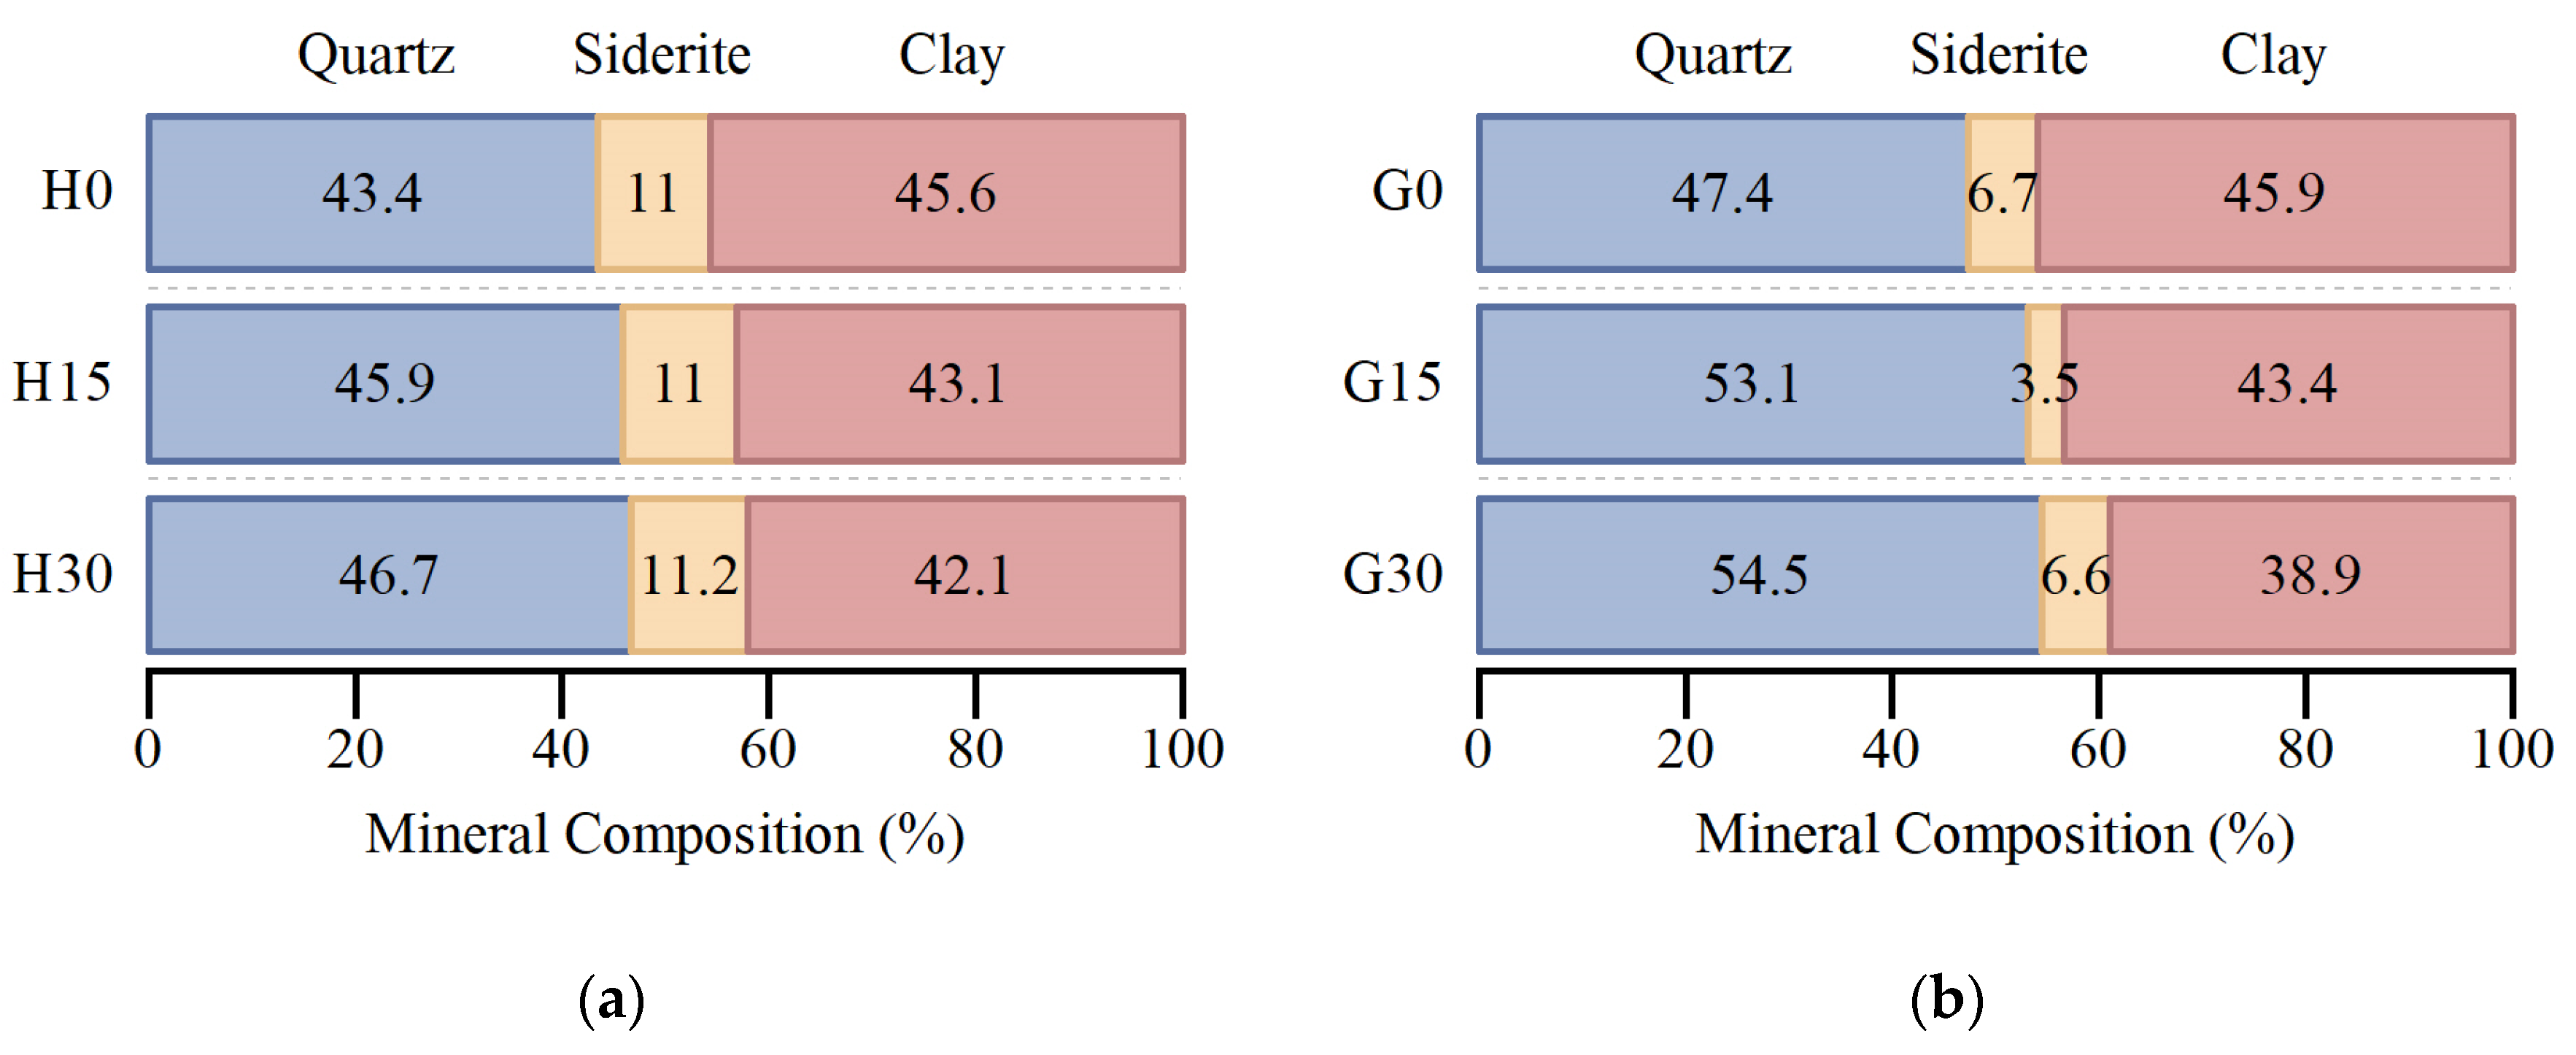
Figure 4 shows the XRD results of shale samples before and after the water-rock reaction, which are mainly composed of quartz, siderite, and clay minerals. The mineral composition of the 30-day samples is slightly different from the 0-day samples, especially the content of quartz and clay minerals. For H0–H30, the content of quartz increases from 43.4 to 46.6% and the content of clay decreases from 45.5% to 42.1%. For G0–G30, the content of quartz increases from 47.4 to 54.5% and the content of clay decreases from 45.9% to 38.9%. After the samples are immersed in the guar gel fracturing fluid for 30 days, the quartz percentage content increases by 8%, and the clay mineral percentage content decreases by 7%. The siderite percentage decreases first and then increases, with siderite accounting for about 7% at both the 0-day and 30-day immersions. The changes in mineral abundance indicate that mineral reactions occurred during the immersion experiment.
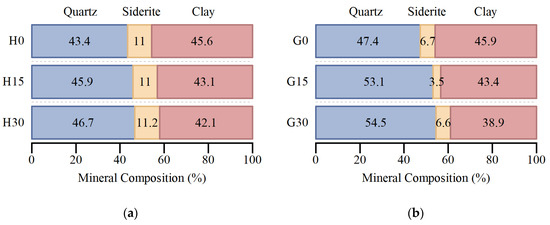
Figure 4.
Distribution diagrams of mineral composition before and after the water-rock reaction: (a) samples treated with guar gel fracturing fluid; (b) samples treated with slickwater fracturing fluid.
Slickwater fracturing fluid immersion causes similar mineral composition changes in the shale, with fracturing fluids causing the transformation or dissolution of clay minerals (e.g., montmorillonite, illite, etc.), resulting in a 3.5% decrease in clay minerals, a nearly unchanged percentage of siderite, and an increase in the percentage of quartz.
Fracturing fluids use water as the base fluid and water entering the shale will hydrate with clay minerals, which leads to the expansion of clay minerals and the structure of the expanded clay minerals becomes loose. The decrease in clay could be due to mineral dissolution or changes in mineral properties, which may affect diffraction data. The chemical additives in the fracturing fluid may also react with clay minerals, destroying the crystal structure of clay and causing it to lose its original stability. This causes the dissolution of partial clay minerals, and dissolved clay minerals enter the fracturing fluid in the form of ions, which further reduces the percentage of clay in the shale [61]. During the fracturing, some clay particles may be transported with the fracturing fluid into fractures or pores, which forms blockages and a localized increase in the clay percentage [62]. As a whole, clay is removed from the shale matrix, resulting in a decrease in the clay percentage in the shale. Quartz is a chemically stable mineral that is not susceptible to chemical reactions with fracturing fluids or to hydration expansion. The absolute content of quartz minerals may remain essentially unchanged, and the reduction in clay minerals allows the relative percentage of other minerals (e.g., quartz) to increase.
4.3. Changes in Porosity and Permeability
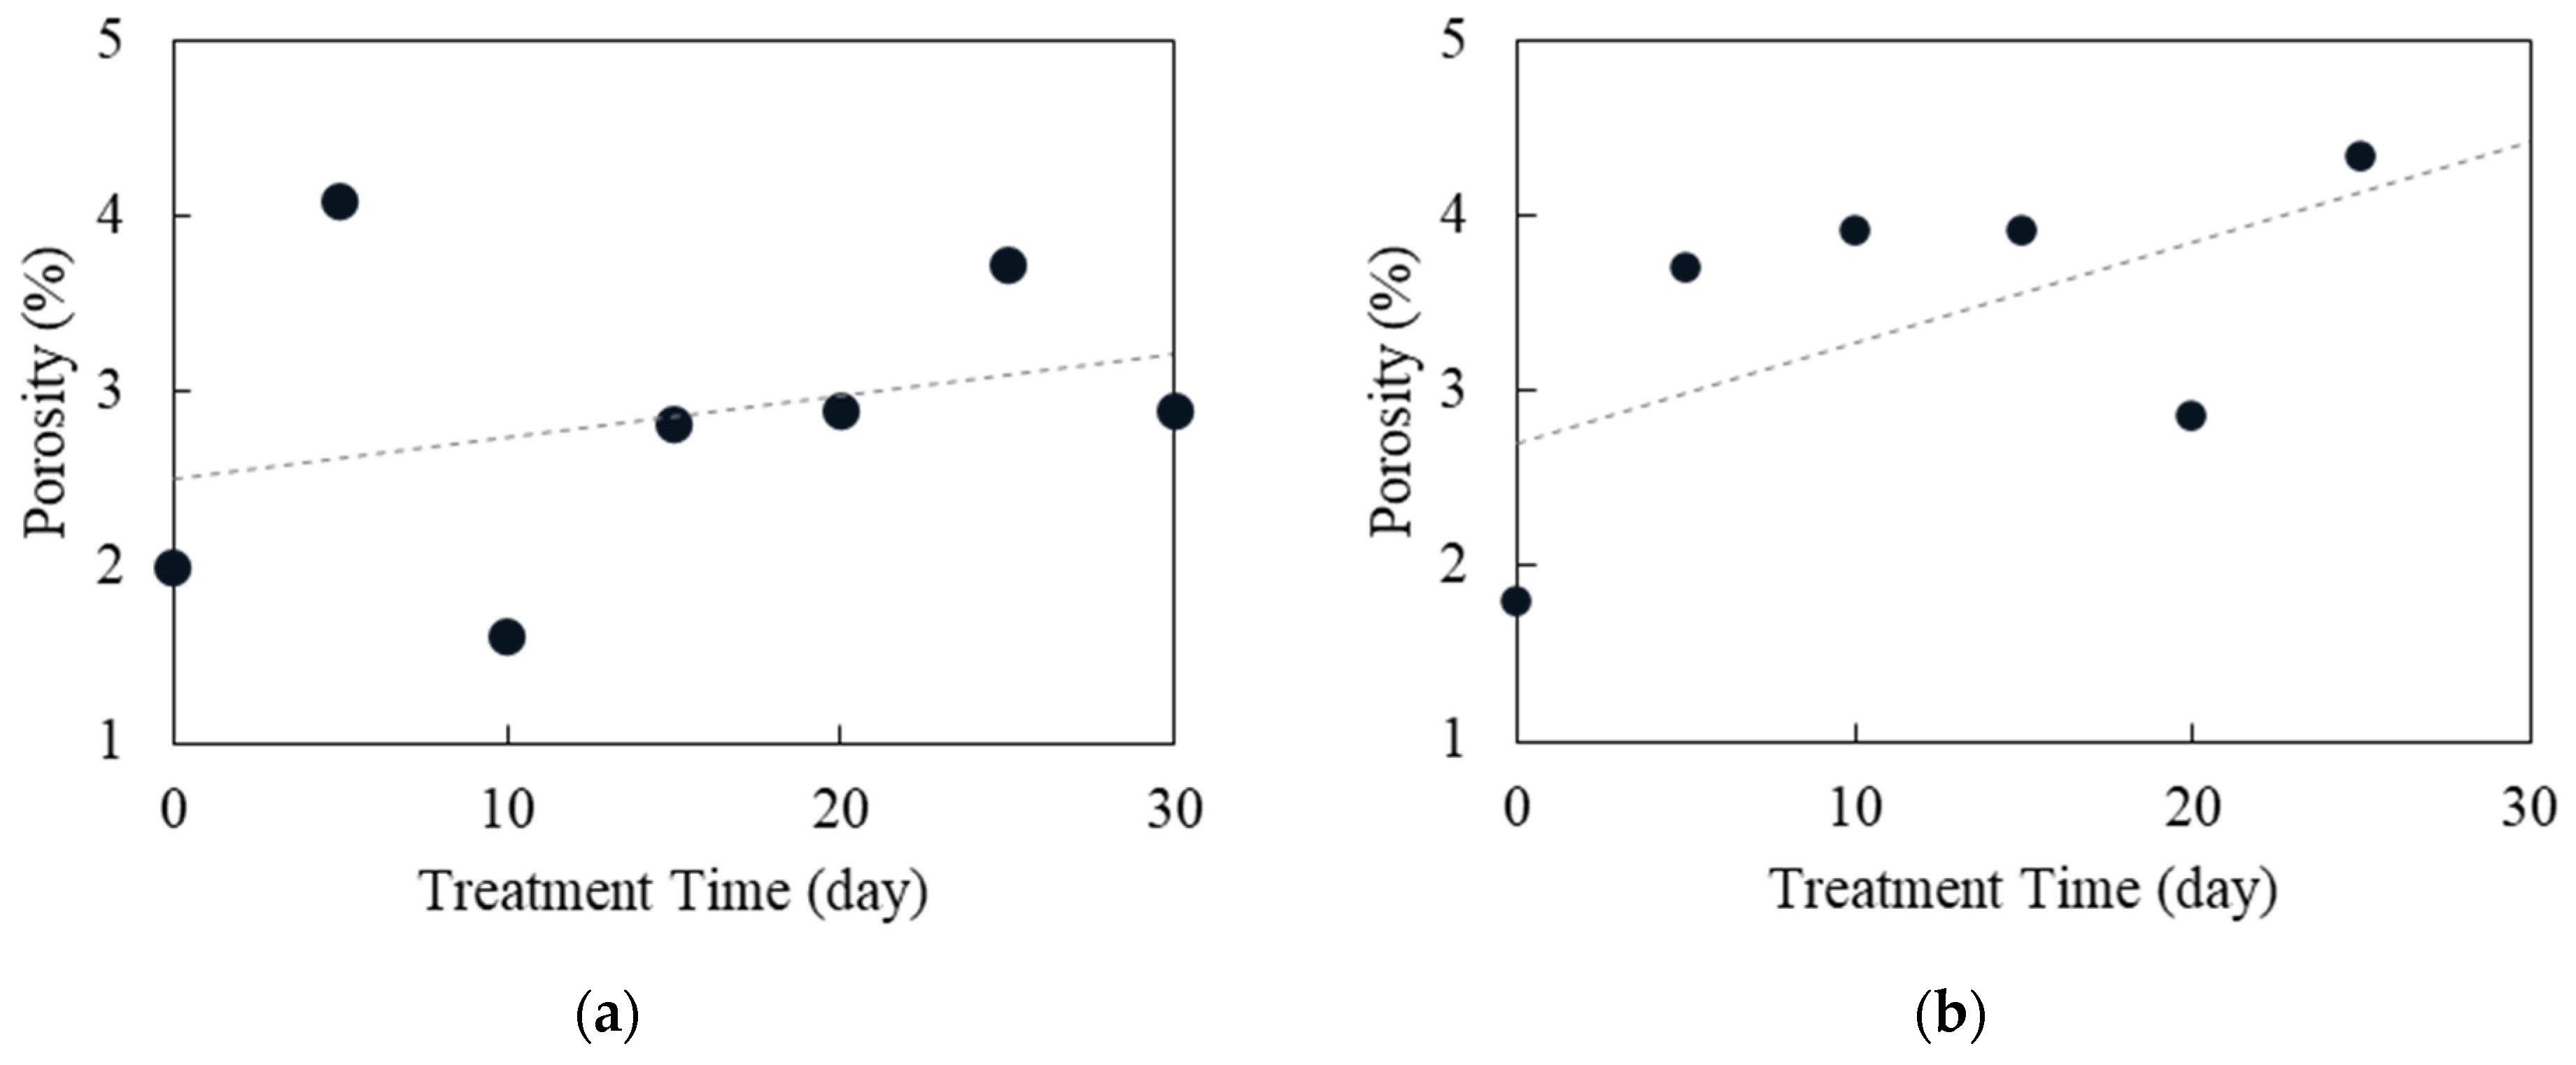
The porosity of the 14 cores under different soaking conditions is measured by a pore experimental instrument and the results are shown in Table 1. Core H30 cannot be tested due to the formation of penetrating fractures in the core soaked for 30 days by the slickwater fracturing fluid. The result shows that the porosity of shale samples used in this study is low. The porosity distribution corresponding to different treatment times ranges from 1.6% to 4.33% with an average value of 3.11%.

Table 1.
Porosity of shale cores.
The gray dashed line in Figure 5 represents the fitted relationship between porosity and time. With increasing immersion time, the porosity of the core shows a certain increasing trend. It indicates that the soaking of fracturing fluid improves the porosity of the core to different degrees. It can be temporarily considered that the slickwater fracturing fluid can improve the porosity of the reservoir. Compared with the effect of guar gel fracturing fluid, the slickwater fracturing fluid has a greater influence on reservoir physical properties. The effect of guar gel fracturing fluid on reservoir physical properties is not clear enough.
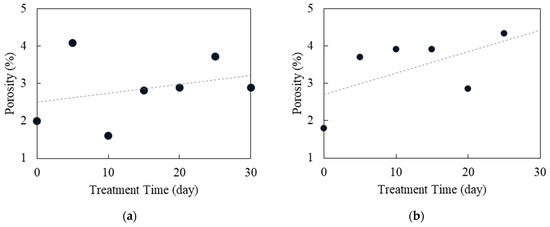
Figure 5.
Relationship between porosity and treatment time: (a) cores treated with guar gel fracturing fluid; (b) cores treated with slickwater fracturing fluid. The dashed line shows the fitting relationship between porosity and treatment time.
4.4. Changes in Pore Structure of Shale Mesopores
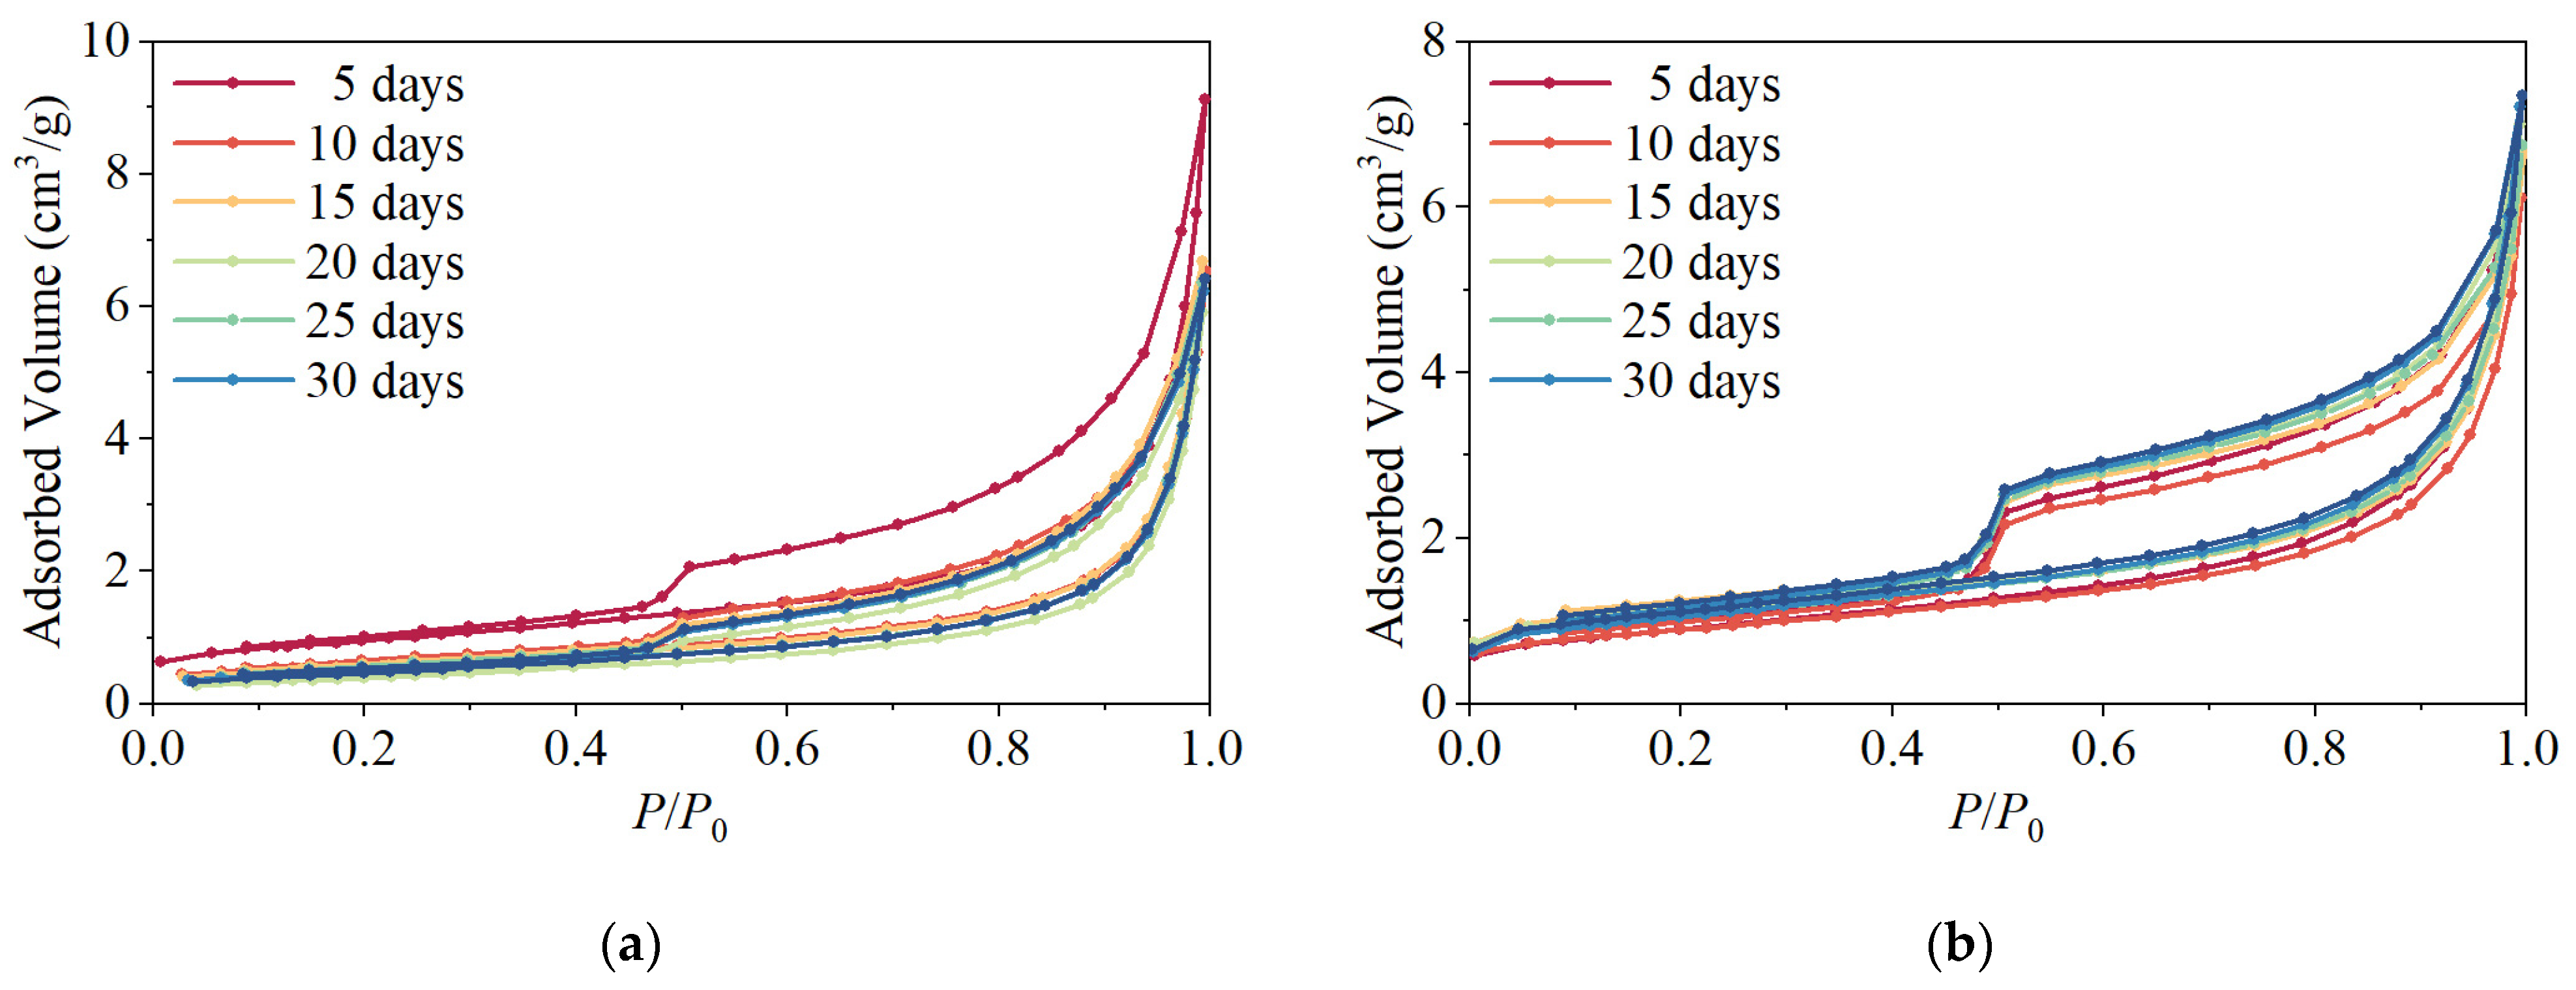
Low-temperature nitrogen adsorption-desorption experiment is performed on the Longmaxi Formation shales that have been soaked at different times by slickwater fracturing fluid and guar gel fracturing fluid. The overall morphology of all samples is consistent, with hysteresis loops arising from each sample curve.
In the nitrogen adsorption isotherm, the different intervals of the horizontal coordinate P/P0 (relative pressure) reflect the adsorption behavior of the shale surface and its pore structure characteristics (as shown in Figure 6). When 0 < P/P0 < 0.45, the nitrogen adsorption shows a slow-increasing trend. This stage is mainly dominated by monomolecular layer adsorption, where nitrogen molecules gradually cover the shale surface and eventually reach saturation. This behavior indicates that there are many micropores on the shale surface, which are small and mainly adsorb monolayer gas molecules. When 0.45 < P/P0 < 0.9, the adsorption behavior changes to multilayer adsorption. With further increase in relative pressure, nitrogen molecules not only form multilayer adsorption on the shale surface but also fill the mesopores in the shale due to the capillary condensation phenomenon. In this process, the adsorption isotherm will appear obvious hysteresis loop, which is due to the inconsistent adsorption and desorption paths of nitrogen in the pores. The appearance of hysteresis loops is direct evidence of the presence of many mesopores in the shale, which usually have pore sizes ranging from 2 to 50 nm. Nitrogen adsorption rises rapidly when 0.9 < P/P0 < 1.0 and eventually reaches maximum adsorption. The rapid adsorption behavior at this stage indicates the presence of many macropores in the shale, and these pores with large pore sizes are capable of rapidly filling with nitrogen at high relative pressures. These characteristics of pore structure help to understand the effect of fracturing fluid soaking on shale reservoir properties.
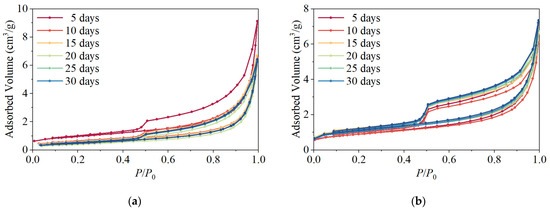
Figure 6.
N2 adsorption-desorption isotherms: (a) shale samples soaked by guar gel fracturing fluid; (b) shale samples soaked by slickwater fracturing fluid.
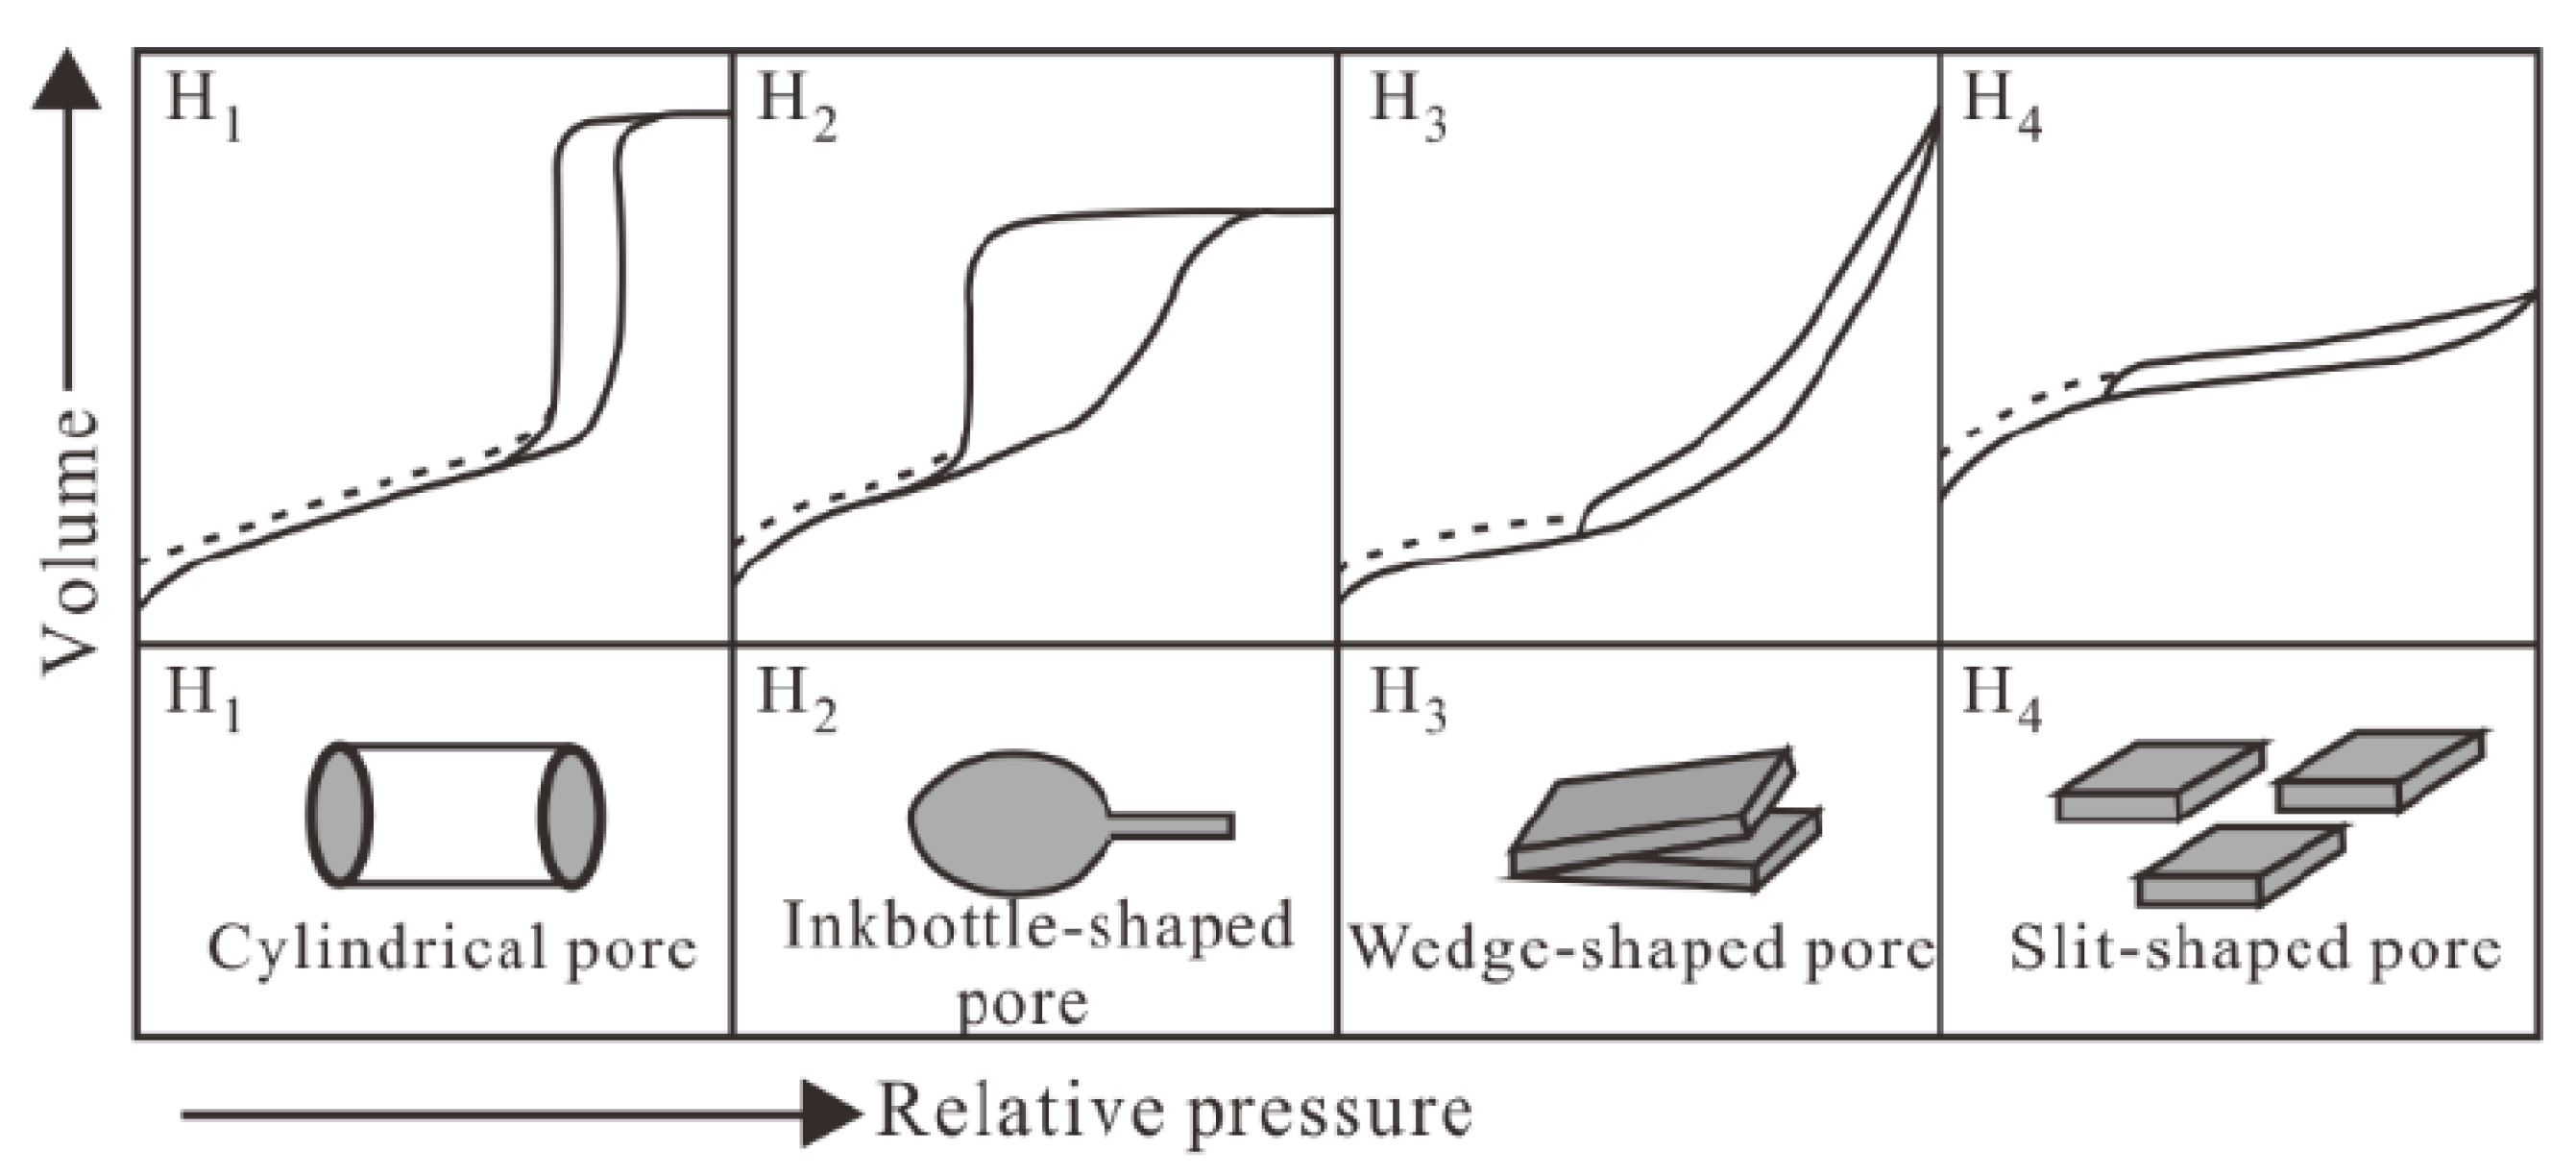
According to the International Union of Pure and Applied Chemistry classification, hysteresis loops can be classified into four types and each one corresponds to a different pore structural feature (Figure 7). The hysteresis loops in the study area belong to type H3. Type H3 adsorption curves rise rapidly in the second half of the relative pressure, indicating a faster pore-filling process. This type is mainly associated with wedge-shaped pores formed by the loose accumulation of lamellar particles [63]. The development of wedge-shaped pores is closely related to the mineral composition in the shale, which contains a large number of clay components. Montmorillonite and ilmenite mixed-layer minerals mainly develop parallel plate pores, while illite, kaolinite, and chlorite tend to form wedge-shaped pores. Kaolinite and illite are relatively dominant.
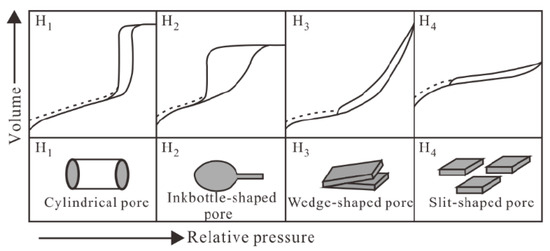
Figure 7.
Types of hysteresis loops and corresponding pore types [55].
Based on the data from nitrogen adsorption experiments, the BET method is used to calculate the specific surface area (SSA) of the shale, in which the points with relative pressures between 0.05 and 0.35 are reasonably effective. Using the BJH model, dV/dD curves are plotted to analyze the pore distribution characteristics and pore volume changes of mesopores [64]. The SSA (1.6789–3.8088 m2/g), pore volume (PV, 0.0086–0.0124 cm3/g), and average pore diameter (APD, 10.8–24.8 nm) of two fracturing fluid-soaked shale samples are calculated (Table 2).
Table 2.
Pore structure parameters of shale by nitrogen adsorption-desorption experiments.
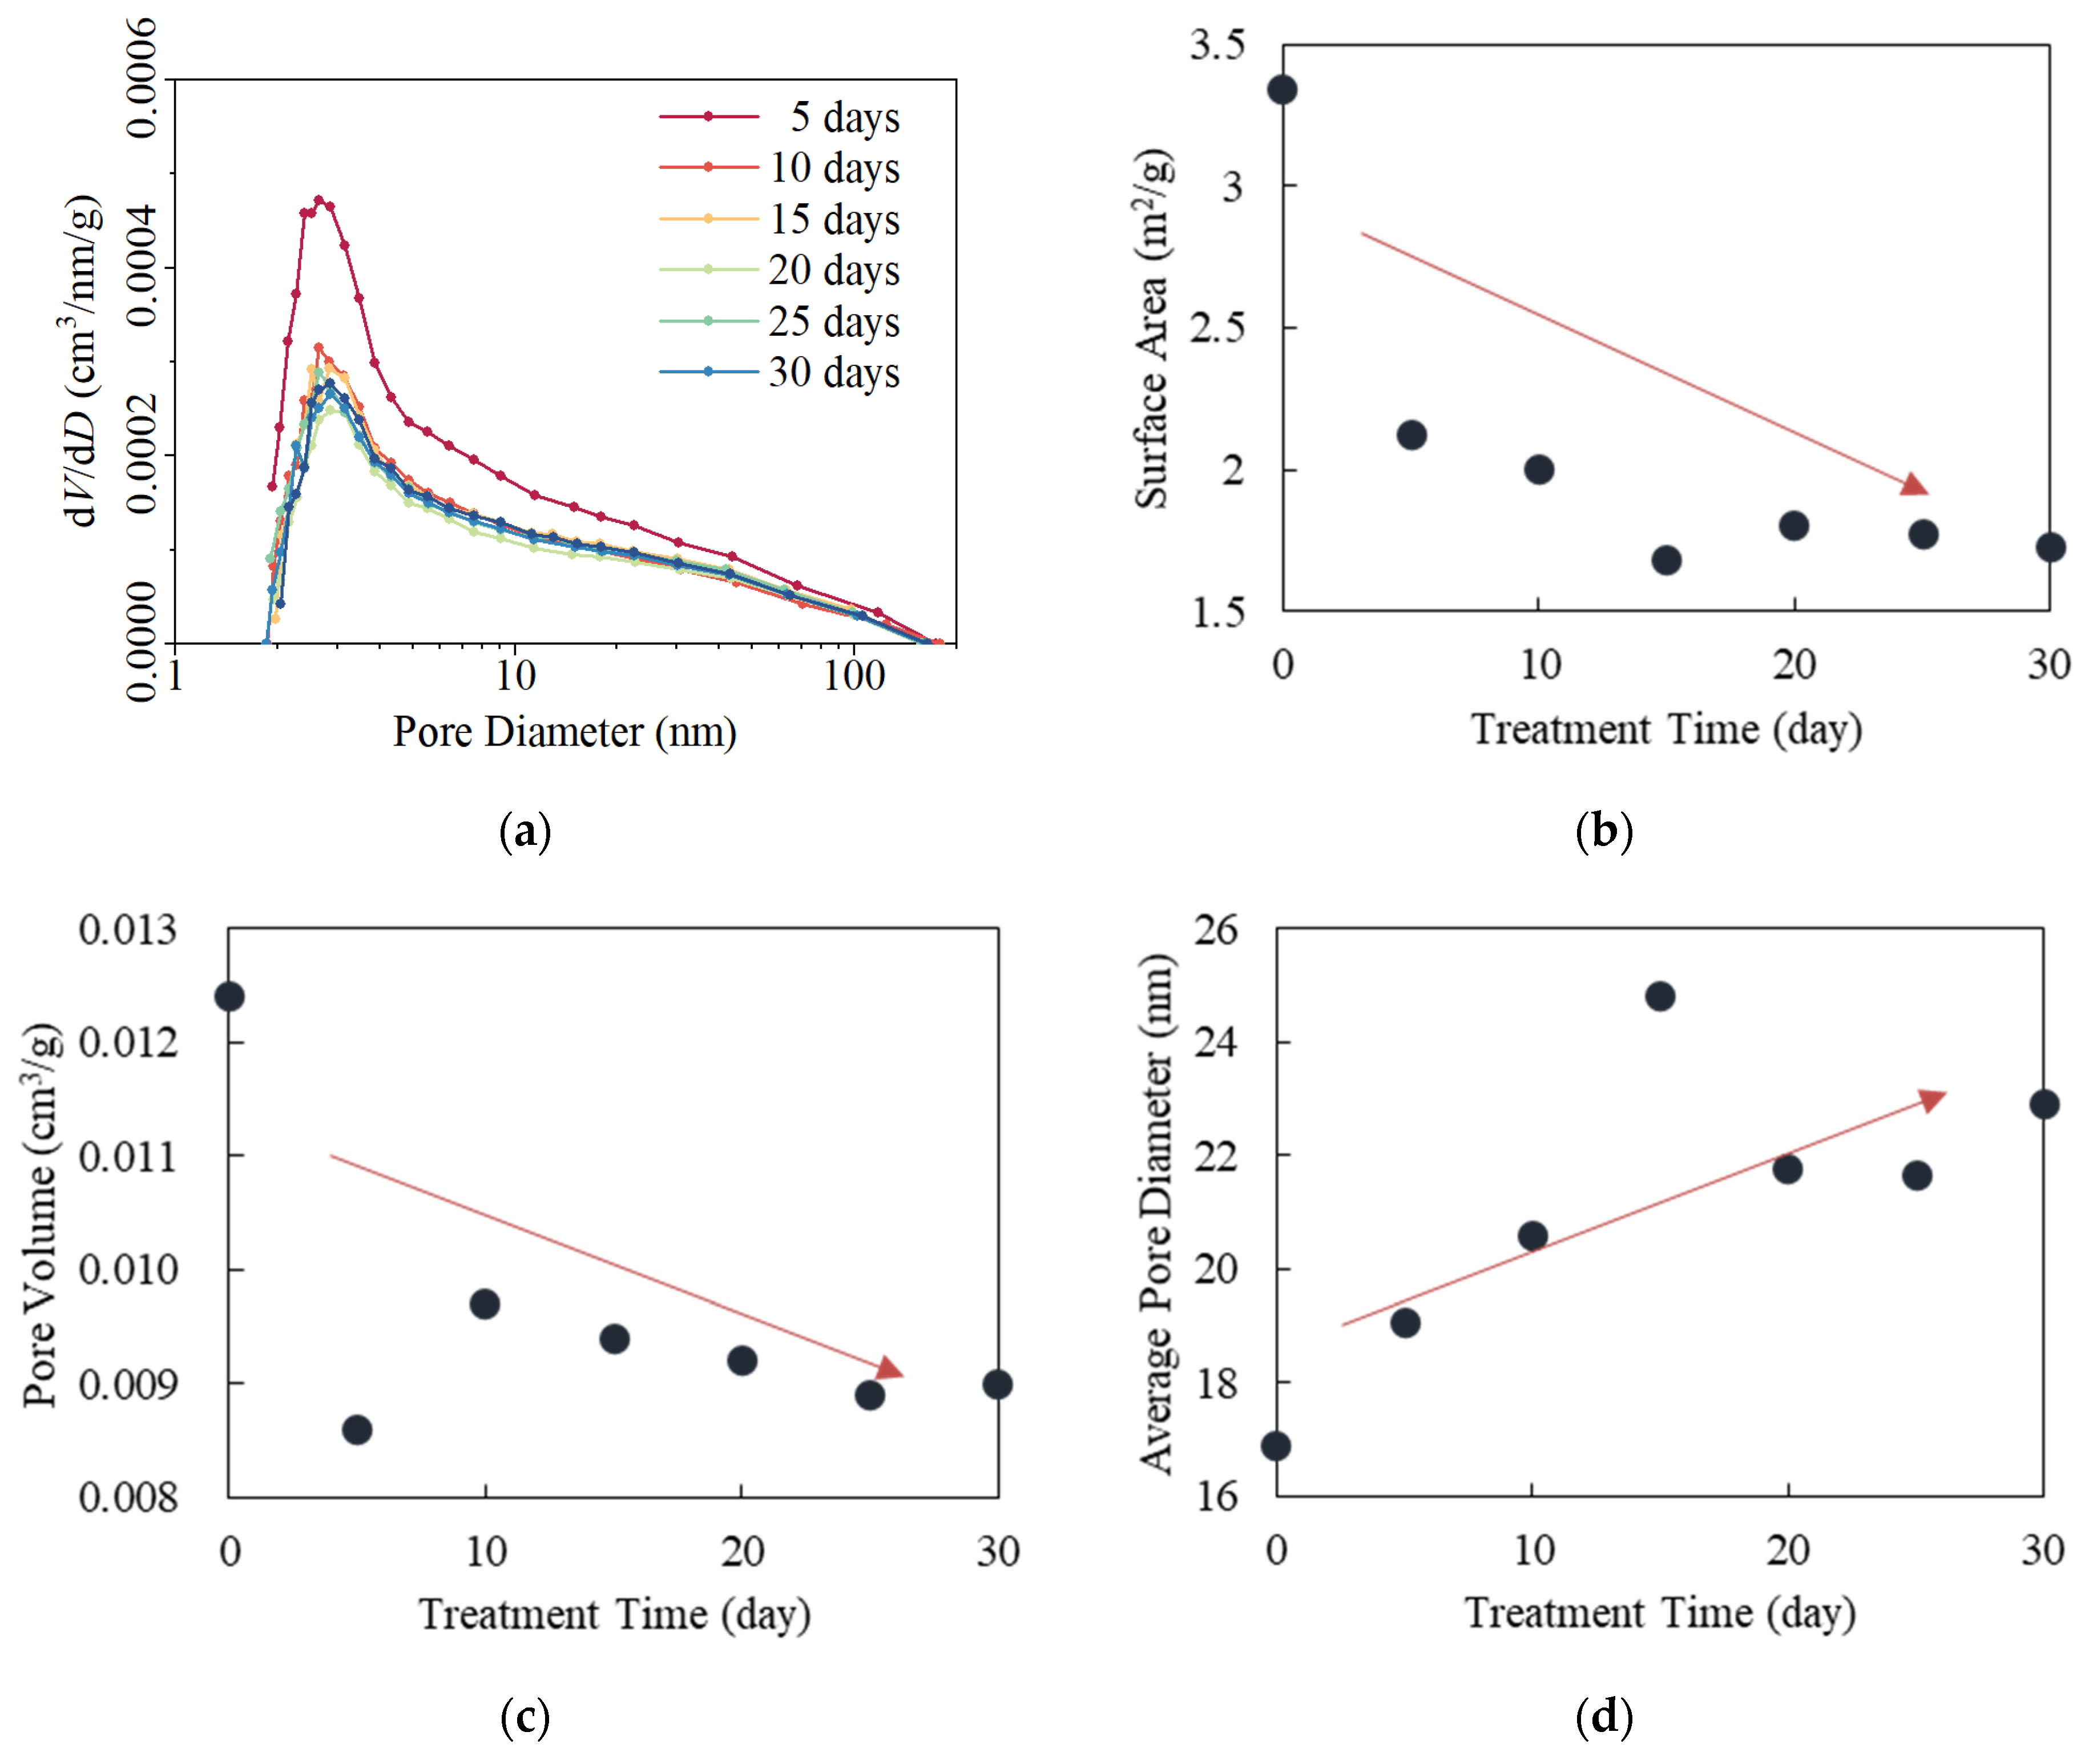
The hysteresis loop lines of samples treated with guar gel fracturing fluid are all shifted downward compared to the original samples (Figure 6a). The SSA of the shale samples not soaked with guar gel fracturing fluid is 3.3375 m2/g, the PV is 0.0124 cm3/g, and the APD is 16.9 nm. Combined with Table 2 and Figure 8, it can be indicated that after soaking with guar gel fracturing fluid for 5 days, the SSA, PV, and APD change significantly. After 30 days of immersion, the SSA of the shale sample is 1.7287 m2/g, the PV is 0.009 cm3/g, and the APD is 22.9 nm, with a high percentage of changes in the three parameters. Overall, the SSA decreases significantly with longer soaking time, with a faster rate of decrease at the initial stage and a gentler change at the later stage. The PV also tends to decrease. On the contrary, the longer the soaking time, the APD increases significantly, and the growth ratio is 35.5%. Except for the sample with a soaking time of 15 days, which shows an abnormally high APD, the APD of the remaining six groups of samples shows a linear growth trend with a goodness of fit of 0.89.
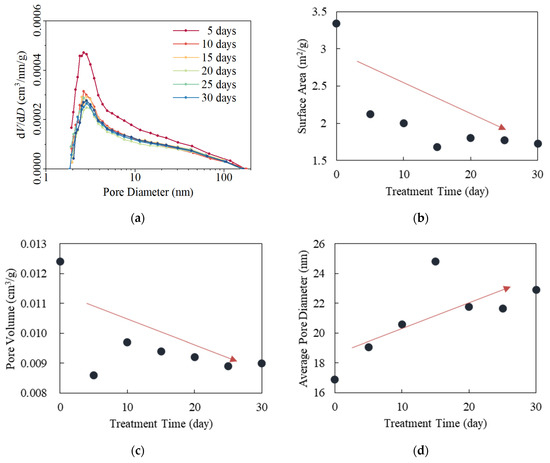
Figure 8.
Effect of guar gel fracturing fluid soaking on mesopores: (a) Barrett–Johner–Halenda (BJH) pore size distribution curve; (b) relationship between surface area and treatment time; (c) relationship between pore volume and treatment time; (d) relationship between average pore diameter and treatment time. The red arrows represent the trend of the scatter.
The reduction in PV and SSA may be attributed to the properties of the guar gel fracturing fluid. After gel breakdown, guar gel fracturing fluid generates large insoluble residues, typically between 60 and 150 μm. When the residue particle size matches the pore radius, it can block the pores. These residues may also cause further pore blocking through a bridging effect, leading to a decrease in total PV and a more uneven pore structure. Smaller pores are more susceptible to residue blockage, reducing their proportion and increasing the APD. The reduction in total PV and smaller pores contributes to the decrease in SSA.
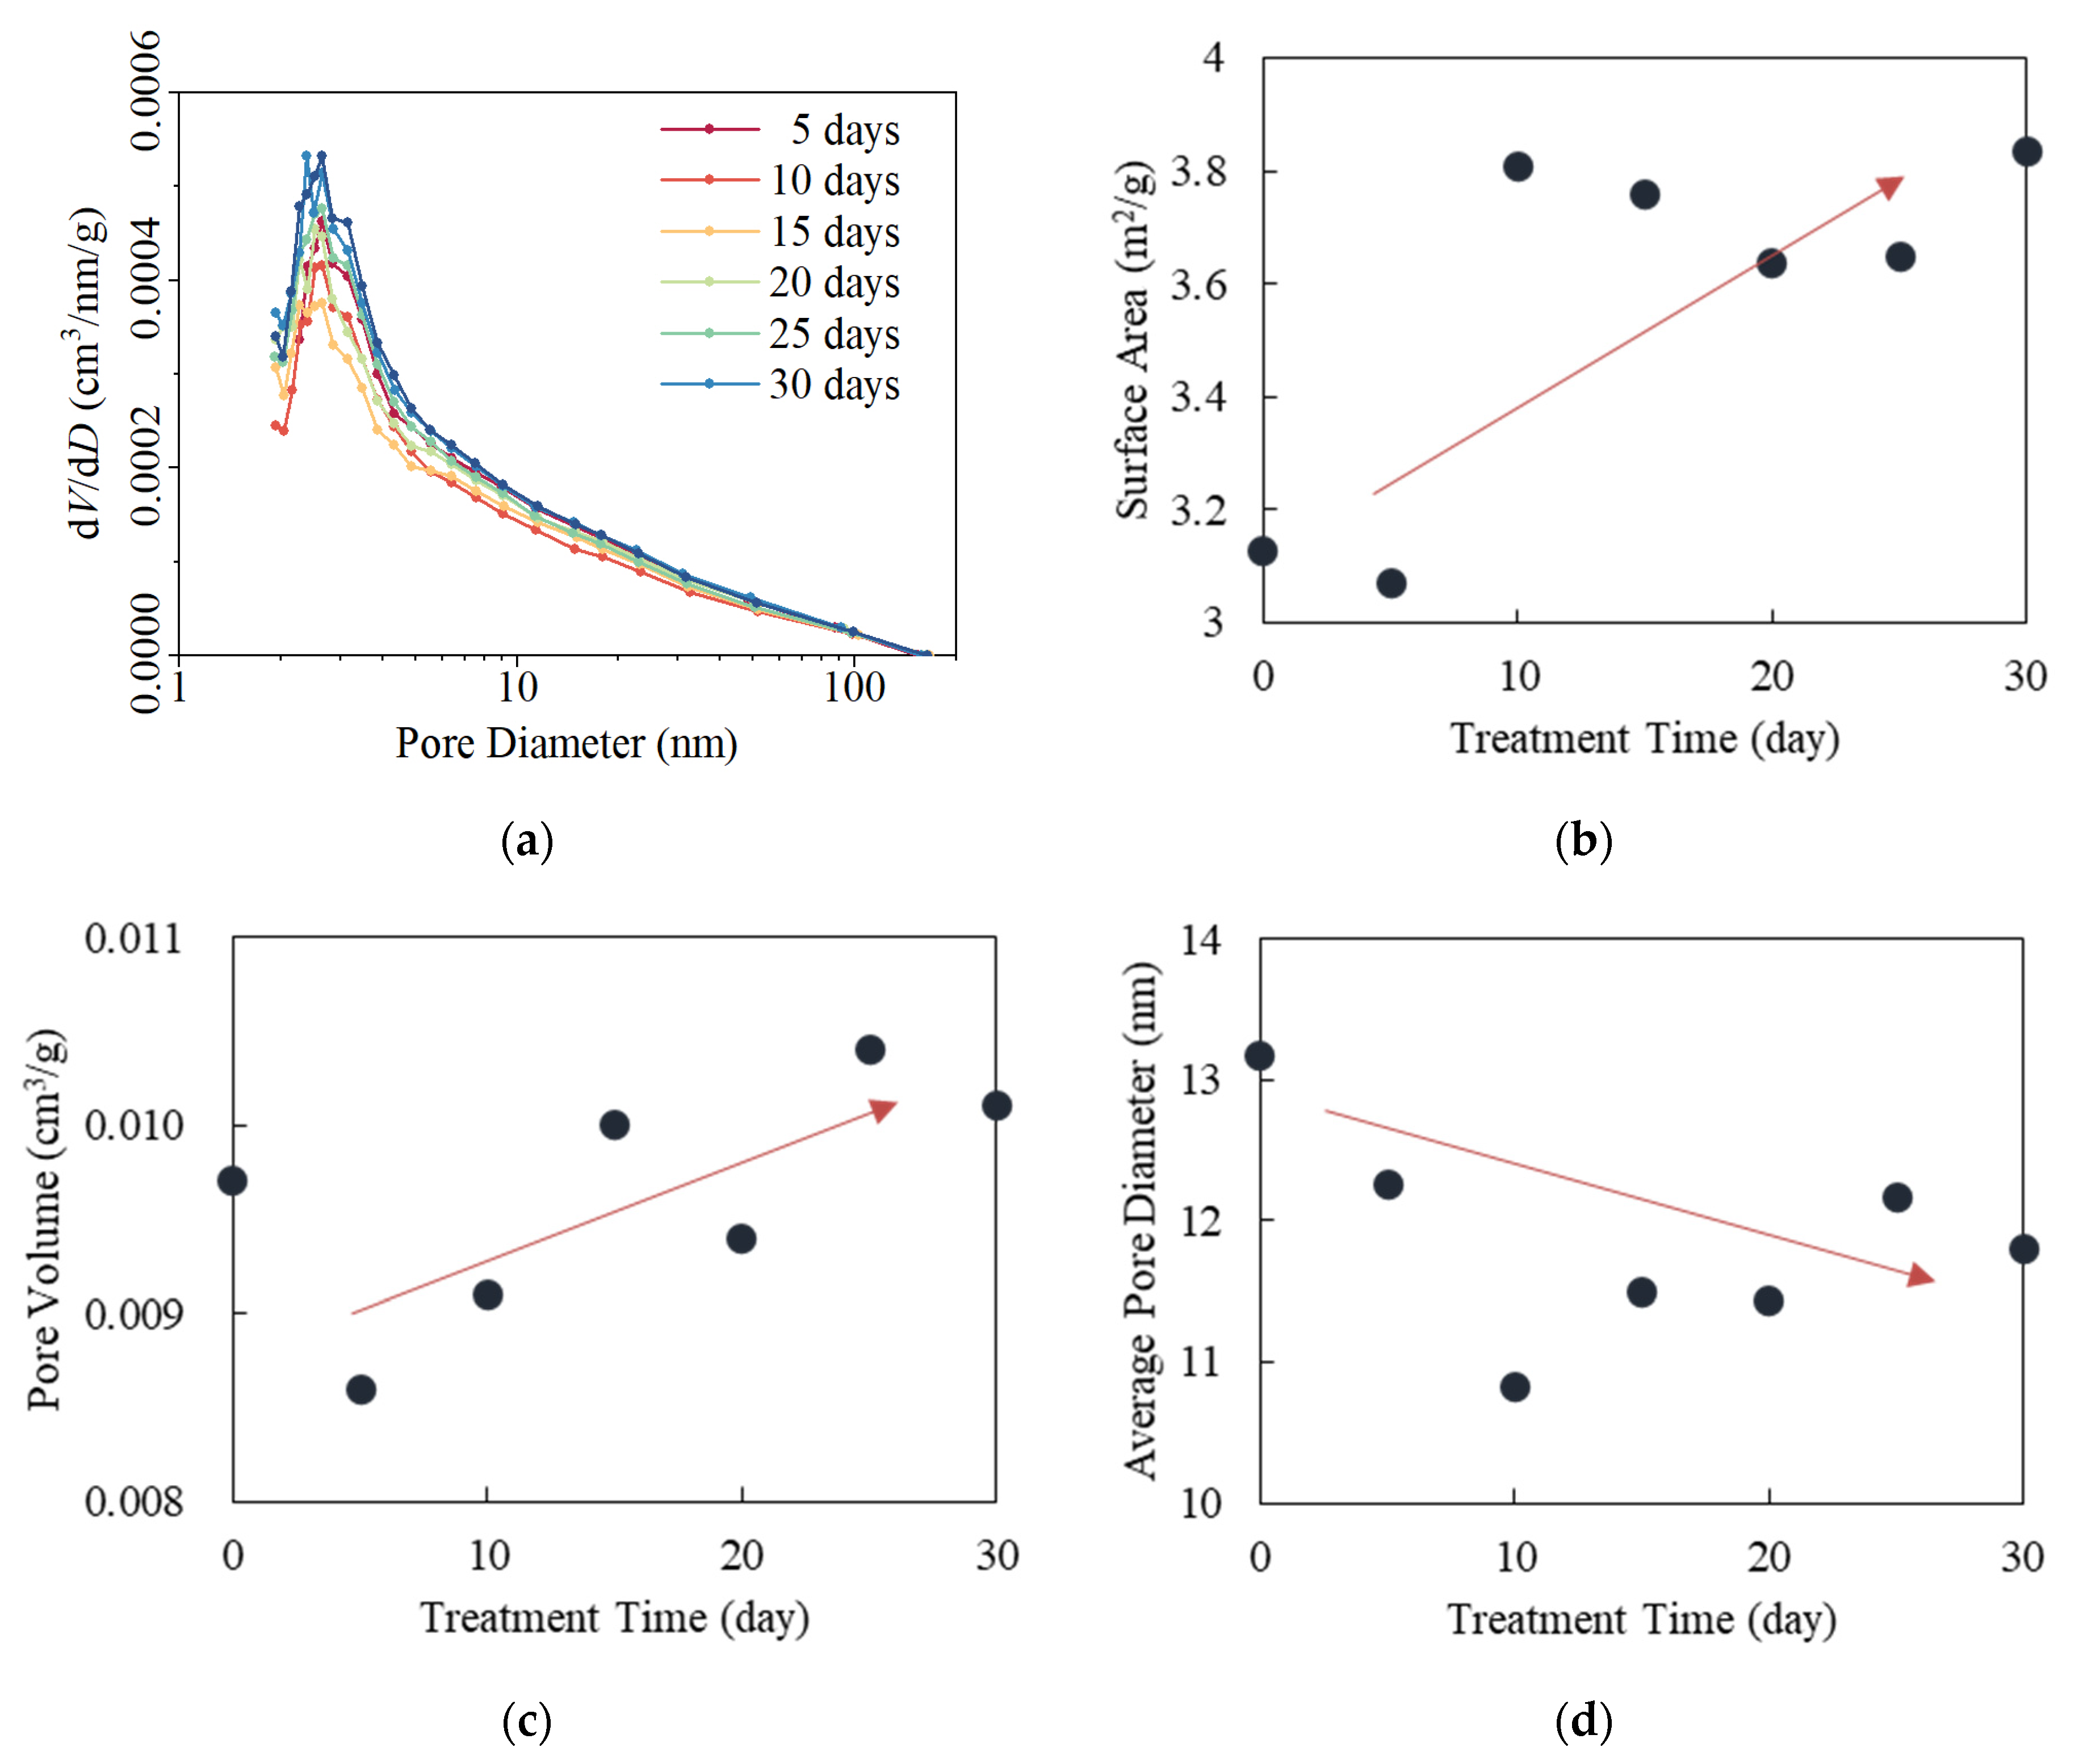
The effect of slickwater fracturing fluid on pore properties is different. The hysteresis loops shift upward after treatment with slickwater (Figure 6b). SSA, PV, and APD of the shale samples soaked in slickwater are shown in Table 2 and Figure 9. The original shale sample has an SSA of 3.128 m2/g, PV of 0.0097 cm3/g, and APD of 13.2 nm. After 30 days of soaking in slickwater, the SSA increases to 3.8324 m2/g, the PV increases to 0.0101 cm3/g, and the APD decreases to 11.8 nm. Overall, the pore size distribution remains below 200 nm, with significant increases in SSA and PV, while the APD decreased. The rate of pore volume change slows as pore size increases, indicating a predominance of smaller pores.

Figure 9.
Effect of slickwater fracturing fluid soaking on mesopores: (a) BJH pore size distribution curve; (b) relationship between surface area and treatment time; (c) relationship between pore volume and treatment time; (d) relationship between average pore diameter and treatment time.
Slickwater fracturing fluid promotes the generation and expansion of microfractures in shale, connecting previously isolated pores and fractures, which alters the pore structure. The shale contains a large amount of illite/montmorillonite mixed-layer minerals, which tend to expand when reacting with slickwater. Hydration causes the dissolution of minerals on the margin and increases total pore volume. Since the water–rock reaction time is relatively short, large pores do not form, and the increase in small pores may cause water-locking effects.
Although the guar gel fracturing fluid increases pore size, the reduction in total pore volume suggests a negative impact on the connectivity of the reservoir, which may hinder subsequent fracturing fluid flowback and gas production. Slickwater’s effects on pore structure are less damaging in comparison.
4.5. Changes in Pore Structure of Shale Macropores and Fractures
CT scans are performed on two shale cores (G20, G30) soaked in guar gel fracturing fluid for different durations. The reconstructed images for each core are shown in Figure 10. The cores exhibited lower porosity at the ends and higher porosity in the middle. This difference highlights the effect of fluid on the shale’s properties. Both ends of the samples, which are more exposed to the fracturing fluid, show more noticeable changes in porosity compared to the middle sections. Longer surface contact times lead to more pronounced water-rock interactions. The fracturing fluid’s residues, which are filtered through the core, tend to block surface pores, resulting in less damage to the core’s internal pore structure.
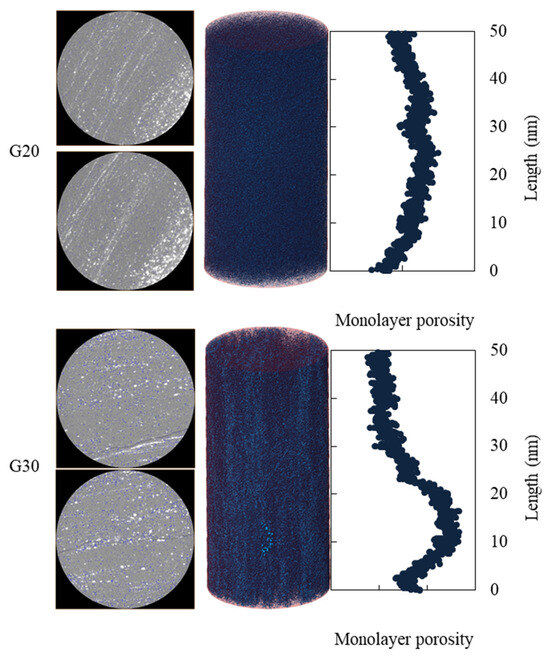
Figure 10.
Effects of guar gel fracturing fluid on fracture structure of shale. The core surface is in a red perspective. The render of the pores is shown in blue.
Longer immersion time allows the fracturing fluid to penetrate deeper into the core, making the change in the core’s porosity more pronounced. In contrast, shorter soaking times mainly affect the surface, with little impact on the internal pore structure. Therefore, the porosity measured after a short-term duration primarily reflects the original characteristics of the core.
CT scans are also conducted on two shale core samples (H20, H30) soaked in slickwater fracturing fluid for 20 and 30 days. The reconstructed images for each core are shown in Figure 11. The porosity curves for these samples differ significantly, especially due to fracture development after soaking. The core soaked for 20 days (H20) has two noticeable fractures at one end. After 30 days of soaking, the core (H30) develops a through-going fracture, which prevents obtaining reliable porosity results. For H20 and H30, the porosity near the fractures is higher, with larger pores primarily concentrated around the fracture zones. This is due to the high water content of slickwater, which causes strong hydration and expansion of minerals, leading to the development of fractures and pores over time.
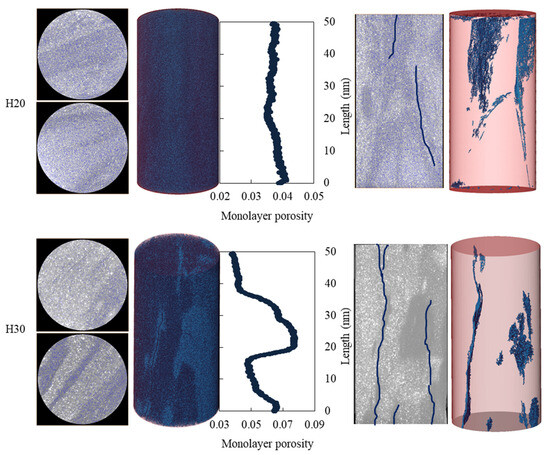
Figure 11.
Effects of slickwater fracturing fluid on fracture structure of shale. The core surface is in a red perspective. The render of the pores is shown in blue.
5. Conclusions
The Longmaxi Formation shale of the Sichuan Basin mainly consists of quartz, siderite, and clay. The samples’ average porosity is 1.9%. It is a typically low-porosity reservoir. The porosity is relatively uniform, with a higher proportion of small pores, and the predominant pore structure mainly consists of wedge-shaped pores.
As shut-in time increases, more fracturing fluid enters the reservoir. Initially, the fluid penetrates quickly. After about 15 days, the volume of fluid entering stabilizes. The slickwater fracturing fluid enters through larger pores at first and then gradually moves into smaller pores. The guar gel fracturing fluid infiltrates more slowly due to its higher viscosity.
With increased treatment time, the quartz content in the shale increases, while the clay content decreases. The hydration and chemical reactions between the fracturing fluid and the clay minerals cause the clay to swell, dissolve, or migrate, thereby reducing the clay proportion in the shale. In contrast, quartz minerals remain stable and increase in relative abundance.
Samples treated with guar gel fracturing fluid show a decrease in both surface area and total pore volume, with a rapid initial decrease followed by a more gradual reduction. The average pore diameter increases linearly with treatment time, and the increase ratio is up to 35.5%. After interacting with the guar gel fracturing fluid, cores show lower porosity at the surface and higher porosity internally. The main reason is that the gel residues of broken fracturing fluid block the pores, primarily at the core surface. The pore-blocking effect of guar gel fracturing fluid on small pores leads to a reduction in pore volume in the near-wellbore region, degrading reservoir properties. Longer shut-in times are more detrimental to subsequent flowback production. To minimize these effects, it is recommended to flowback soon after the guar gel is broken, avoiding prolonged shut-in periods.
For cores treated with slickwater fracturing fluid, both the surface area and pore volume increase with longer shut-in times, while the average pore diameter decreases. With longer soaking time, the fractures develop more significantly and the porosity around these fractures becomes larger and more intensive. This is due to slickwater’s high water content and strong hydration effects, which cause clay minerals to detach and dissolve. Hydration fractures and pores develop, and pore connectivity is enhanced. Slickwater fracturing fluid has minimal residue after gel breakdown, resulting in weaker pore-blocking effects. The slickwater fracturing fluid can enhance pore formation and increase pore volume. If hydration fractures develop under formation pressure during shut-in periods, slickwater may create favorable flow channels for future production.
Author Contributions
Data curation, Y.C.; Methodology, Y.C.; Resources, Z.L.; Supervision, Z.L.; Visualization, L.X.; Writing—original draft, Y.C.; Writing—review & editing, L.X. All authors have read and agreed to the published version of the manuscript.
Funding
This research was funded by the National Natural Science Foundation of China, grant number U22B2073.
Data Availability Statement
Data is contained within the article.
Conflicts of Interest
The authors declare no conflicts of interest.
References
- Li, Q.; Wang, Y.; Wang, F.; Wu, J.; Usman Tahir, M.; Li, Q.; Yuan, L.; Liu, Z. Effect of thickener and reservoir parameters on the filtration property of CO2 fracturing fluid. Energy Sources Part A Recovery Util. Environ. Eff. 2020, 42, 1705–1715. [Google Scholar]
- Li, Q.; Liu, J.; Wang, S.; Guo, Y.; Han, X.; Li, Q.; Cheng, Y.; Dong, Z.; Li, X.; Zhang, X. Numerical insights into factors affecting collapse behavior of horizontal wellbore in clayey silt hydrate-bearing sediments and the accompanying control strategy. J Ocean. Eng. 2024, 297, 117029. [Google Scholar]
- Liu, H.; Huang, Y.; Cai, M.; Meng, S.; Tao, J. Practice and development suggestions of hydraulic fracturing technology in the Gulong shale oil reservoirs of Songliao Basin, NE China. Pet. Explor. Dev. 2023, 50, 688–698. [Google Scholar]
- Binnion, M. How the technical differences between shale gas and conventional gas projects lead to a new business model being required to be successful. Mar. Pet. Geol. 2012, 31, 3–7. [Google Scholar]
- Davies, R.J.; Almond, S.; Ward, R.S.; Jackson, R.B.; Adams, C.; Worrall, F.; Herringshaw, L.G.; Gluyas, J.G.; Whitehead, M.A. Oil and gas wells and their integrity: Implications for shale and unconventional resource exploitation. Mar. Pet. Geol. 2014, 56, 239–254. [Google Scholar]
- Mayerhofer, M.J.; Wolhart, S.L.; Rogers, J.D. Results of U.S. Department of Energy Deep Gas Well Stimulation Study. In Proceedings of the SPE Annual Technical Conference and Exhibition, Dallas, TX, USA, 9–12 October 2005. [Google Scholar]
- Lin, A.; Ma, J. Stimulated-rock characteristics and behavior in multistage hydraulic-fracturing treatment. SPE J. 2015, 20, 784–789. [Google Scholar]
- Ibrahim, A.F. Optimizing cluster spacing in multistage hydraulically fractured shale gas wells: Balancing fracture interference and stress shadow impact. J. Pet. Explor. Prod. Technol. 2024, 14, 2297–2313. [Google Scholar]
- Nicot, J.-P.; Scanlon, B.R. Water Use for Shale-Gas Production in Texas, U.S. Environ. Sci. Technol. 2012, 46, 3580–3586. [Google Scholar]
- Nicot, J.-P.; Scanlon, B.R.; Reedy, R.C.; Costley, R.A. Source and fate of hydraulic fracturing water in the Barnett Shale: A historical perspective. Environ. Sci. Technol. 2014, 48, 2464–2471. [Google Scholar]
- Jiang, M.; Hendrickson, C.T.; VanBriesen, J.M. Life Cycle Water Consumption and Wastewater Generation Impacts of a Marcellus Shale Gas Well. Environ. Sci. Technol. 2014, 48, 1911–1920. [Google Scholar]
- Gao, J.; Zou, C.; Zhang, X.; Guo, W.; Yu, R.; Ni, Y.; Liu, D.; Kang, L.; Liu, Y.; Kondash, A.; et al. The water footprint of hydraulic fracturing for shale gas extraction in China. Sci. Total Environ. 2024, 907, 168135. [Google Scholar]
- Barati, R.; Liang, J.-T. A review of fracturing fluid systems used for hydraulic fracturing of oil and gas wells. J. Appl. Polym. Sci. 2014, 131. [Google Scholar] [CrossRef]
- Fakcharoenphol, P.; Kurtoglu, B.; Kazemi, H.; Charoenwongsa, S.; Wu, Y.-S. The effect of osmotic pressure on improve oil recovery from fractured shale formations. In Proceedings of the SPE Unconventional Resources Conference/Gas Technology Symposium, The Woodlands, TX, USA, 1–3 April 2014; SPE: St. Bellingham, WA, USA, 2014; p. D021S003R004. [Google Scholar]
- Dustin, M.K.; Bargar, J.R.; Jew, A.D.; Harrison, A.L.; Joe-Wong, C.; Thomas, D.L.; Brown, G.E., Jr.; Maher, K.J.E. Shale kerogen: Hydraulic fracturing fluid interactions and contaminant release. Energy Fuels 2018, 32, 8966–8977. [Google Scholar]
- McAdams, B.; Burrows, L.; Hakala, J.A. Abiotic Transformation Kinetics of Surfactants used in Hydraulic Fracturing Fluid. In Proceedings of the SPE/AAPG/SEG Unconventional Resources Technology Conference, Denver, CO, USA, 22–24 July 2019. [Google Scholar]
- Makhanov, K.; Habibi, A.; Dehghanpour, H.; Kuru, E. Liquid uptake of gas shales: A workflow to estimate water loss during shut-in periods after fracturing operations. J. Unconv. Oil Gas Resour. 2014, 7, 22–32. [Google Scholar]
- Ghanbari, E.; Dehghanpour, H. Impact of rock fabric on water imbibition and salt diffusion in gas shales. Int. J. Coal Geol. 2015, 138, 55–67. [Google Scholar]
- Li, Q.; Jew, A.D.; Kohli, A.; Maher, K.; Brown, G.E., Jr.; Bargar, J.R. Thicknesses of Chemically Altered Zones in Shale Matrices Resulting from Interactions with Hydraulic Fracturing Fluid. Energy Fuels 2019, 33, 6878–6889. [Google Scholar]
- Herz-Thyhsen, R.J.; Kaszuba, J.P.; Dewey, J.C. Mineral dissolution and precipitation induced by hydraulic fracturing of a mudstone and a tight sandstone in the Powder River Basin, Wyoming, USA. Appl. Geochem. 2020, 119, 104636. [Google Scholar]
- Renock, D.; Landis, J.D.; Sharma, M. Reductive weathering of black shale and release of barium during hydraulic fracturing. Appl. Geochem. 2016, 65, 73–86. [Google Scholar]
- Kreisserman, Y.; Emmanuel, S. Release of Particulate Iron Sulfide during Shale-Fluid Interaction. Environ. Sci. Technol. 2018, 52, 638–643. [Google Scholar] [PubMed]
- Hakala, J.A.; Phan, T.; Stuckman, M.; Edenborn, H.; Lopano, C. Role of Organic Acids in Controlling Mineral Scale Formation During Hydraulic Fracturing at the Marcellus Shale Energy and Environmental Laboratory (MSEEL) Site. In Proceedings of the SPE/AAPG/SEG Unconventional Resources Technology Conference, Austin, TX, USA, 24–26 July 2017. [Google Scholar]
- Hakala, J.A.; Crandall, D.; Moore, J.; Phan, T.; Sharma, S.; Lopano, C. Laboratory-Scale Studies on Chemical Reactions Between Fracturing Fluid and Shale Core From the Marcellus Shale Energy and Environmental Laboratory (MSEEL) Site. In Proceedings of the SPE/AAPG/SEG Unconventional Resources Technology Conference, Austin, TX, USA, 24–26 July 2017. [Google Scholar]
- Xiong, W.; Lopano, C.; Hakala, A.; Carney, B. Investigation of Barite Scaling During Reaction between Pre-Treated Hydraulic Fracturing Fluid from the Field and Marcellus Shale. In Proceedings of the SPE/AAPG/SEG Unconventional Resources Technology Conference, Virtual, 20–22 July 2020. [Google Scholar]
- Harrison, A.L.; Jew, A.D.; Dustin, M.K.; Thomas, D.L.; Joe-Wong, C.M.; Bargar, J.R.; Johnson, N.; Brown, G.E., Jr.; Maher, K. Element release and reaction-induced porosity alteration during shale-hydraulic fracturing fluid interactions. Appl. Geochem. 2017, 82, 47–62. [Google Scholar]
- O’Brien, N.R.; Slatt, R.M. Pore types in the Barnett and Woodford gas shales: Contribution to understanding gas storage and migration pathways in fine-grained rocks. AAPG Bull. 2011, 95, 2017–2030. [Google Scholar]
- Ross, D.J.K.; Marc Bustin, R. The importance of shale composition and pore structure upon gas storage potential of shale gas reservoirs. Mar. Pet. Geol. 2009, 26, 916–927. [Google Scholar]
- Hubert, E.; King, J.; Eberle, A.P.R.; Walters, C.C.; Kliewer, C.E.; Ertas, D.; Huynh, C. Pore Architecture and Connectivity in Gas Shale. Energy Fuels 2015, 29, 1375–1390. [Google Scholar]
- Josh, M.; Esteban, L.; Delle Piane, C.; Sarout, J.; Dewhurst, D.N.; Clennell, M.B. Laboratory characterisation of shale properties. J. Pet. Sci. Eng. 2012, 88–89, 107–124. [Google Scholar]
- Kuila, U.; McCarty, D.; Derkowski, A.; Fischer, T.; Topor, T.; Prasad, M. Nano-scale texture and porosity of organic matter and clay minerals in organic-rich mudrocks. Fuel 2014, 135, 359–373. [Google Scholar]
- Clarkson, C.; Solano, N.; Bustin, R.; Bustin, A.; Chalmers, G.; He, L.; Melnichenko, Y.; Radlinski, A.; Blach, T. Pore structure characterization of North American shale gas reservoirs using USANS/SANS, gas adsorption, and mercury intrusion. Fuel 2013, 103, 606–616. [Google Scholar]
- Veselinovic, D.; Green, D.; Dick, M. Determination of Natural Fracture Porosity Using NMR. In Proceedings of the SPE/AAPG/SEG Unconventional Resources Technology Conference, San Antonio, TX, USA, 1–3 August 2016. [Google Scholar]
- Song, Y.-Q.; Kausik, R. NMR application in unconventional shale reservoirs—A new porous media research frontier. Prog. Nucl. Magn. Reason. Spectrosc. 2019, 112, 17–33. [Google Scholar]
- Kuila, U.; Prasad, M. Specific surface area and pore-size distribution in clays and shales. Geophys. Prospect. 2013, 61, 341–362. [Google Scholar]
- Schmitt, M.; Fernandes, C.P.; da Cunha Neto, J.A.B.; Wolf, F.G.; dos Santos, V.S.S. Characterization of pore systems in seal rocks using Nitrogen Gas Adsorption combined with Mercury Injection Capillary Pressure techniques. Mar. Pet. Geol. 2013, 39, 138–149. [Google Scholar]
- Liang, L.; Xiong, J.; Liu, X. An investigation of the fractal characteristics of the Upper Ordovician Wufeng Formation shale using nitrogen adsorption analysis. J. Nat. Gas Sci. Eng. 2015, 27 Pt 2, 402–409. [Google Scholar]
- Liu, X.; Xiong, J.; Liang, L. Investigation of pore structure and fractal characteristics of organic-rich Yanchang formation shale in central China by nitrogen adsorption/desorption analysis. J. Nat. Gas Sci. Eng. 2015, 22, 62–72. [Google Scholar]
- Zou, Y.; Zhang, S.; Zhou, T.; Zhou, X.; Guo, T. Experimental Investigation into Hydraulic Fracture Network Propagation in Gas Shales Using CT Scanning Technology. Rock Mech. Rock Eng. 2016, 49, 33–45. [Google Scholar]
- Zhang, Y.; Yang, D. Simulation Study on the Heat Transfer Characteristics of Oil Shale under Different In Situ Pyrolysis Methods Based on CT Digital Rock Cores. Energies 2024, 17, 4169. [Google Scholar] [CrossRef]
- Cong, W.; Li, T.; Shi, Y.; Tang, C.A. Study on the Mechanical Properties and Failure Characteristics of Heterogenous Shale Based on CT Scanning. SPE J. 2024, 29, 7088–7107. [Google Scholar]
- Lei, W.; Wu, Z.; Song, H.; Wang, W.; Cui, H.; Tang, M. 3D Numerical Simulation Study of Brazilian Splitting in Calcite Vein-bearing Shale Based on CT Scans. KSCE J. Civ. Eng. 2024, 28, 2159–2172. [Google Scholar]
- Moore, J.; Xiong, W.; Lopano, C.; Phan, T.; Vankeuren, A.; Sharma, S.; Pilewski, J.; Jarvis, K.; Brown, S.; Crandall, D.; et al. Bench-Top Experiments Evaluating Simulated Hydraulic Fracturing Fluid Interactions With Marcellus Shale Core. In Proceedings of the SPE/AAPG/SEG Unconventional Resources Technology Conference, Houston, TX, USA, 23–25 July 2018. [Google Scholar]
- Elkady, Y.; Kovscek, A. Laboratory Visualization of Enhanced Gas Recovery in Shale. In Proceedings of the SPE Annual Technical Conference and Exhibition, Virtual, 26–29 October 2020. [Google Scholar]
- Kim, T.W.; Kovscek, A. High-Temperature Imbibition for Enhanced Recovery from Diatomite. In Proceedings of the SPE Western Regional Meeting, Bakersfield, CA, USA, 23–27 April 2017. [Google Scholar]
- Hascakir, B.; Ross, C.M.; Castanier, L.M.; Kovscek, A.R. Fuel Formation and Conversion During In-Situ Combustion of Crude Oil. SPE J. 2013, 18, 1217–1228. [Google Scholar]
- Sun, Z.; Ni, Y.; Wang, Y.; Wei, Z.; Wu, B.; Li, J.; Fan, W.; Wang, G.; Li, Y. Experimental investigation of the effects of different types of fracturing fluids on the pore structure characteristics of Shale Reservoir Rocks. Energy Explor. Exploit. 2020, 38, 682–702. [Google Scholar]
- Li, Y.; Feng, Y.; Liu, H.; Zhang, L.; Zhao, S. Geological characteristics and resource potential of lacustrine shale gas in the Sichuan Basin, SW China. Pet. Explor. Dev. 2013, 40, 454–460. [Google Scholar]
- Wang, Y.-M.; Wang, C.-F.; Dong, D.-Z.; Li, X.-J.; Huang, J.-L.; Zhang, C.-C.; Guan, Q.-Z. Lithofacies characterization of Longmaxi Formation of the Lower Silurian, southern Sichuan. Earth Sci. Front. 2016, 23, 119. [Google Scholar]
- Liu, G.; Tang, Y.; Liu, K.; Liu, Z.; Zhu, T.; Zou, Y.; Liu, X.; Yang, S.; Xie, A. Comparison of Pore Structure Characteristics of Shale-Oil and Tight-Oil Reservoirs in the Fengcheng Formation in Mahu Sag. Energies 2024, 17, 4027. [Google Scholar] [CrossRef]
- Tang, J.; Liu, Y.; Cheng, Q.; Jia, Y.; Lu, Y.; Xiao, Y.; Sun, X.; Liu, J. Comparative Study of Pore Structure Response in Longmaxi Marine Shale and Yanchang Continental Shale under the Combined Action of CO2 and Slickwater. Energy Fuels 2024, 38, 12718–12729. [Google Scholar]
- Wang, X.; Zhou, X. Research on quantitative analysis method of shale oil reservoir sensitivity based on mineral analysis. Geoenergy Sci. Eng. 2024, 239, 212952. [Google Scholar] [CrossRef]
- Fleury, M.; Kohler, E.; Norrant, F.; Gautier, S.; M’Hamdi, J.; Barré, L. Characterization and Quantification of Water in Smectites with Low-Field NMR. J. Phys. Chem. C 2013, 117, 4551–4560. [Google Scholar]
- Fleury, M.; Soualem, J. Quantitative analysis of diffusional pore coupling from T2-store-T2 NMR experiments. J. Colloid Interface Sci. 2009, 336, 250–259. [Google Scholar] [CrossRef] [PubMed]
- Sing, K.S.W. Reporting physisorption data for gas/solid systems with special reference to the determination of surface area and porosity (Recommendations 1984). Pure Appl. Chem. 1985, 57, 603–619. [Google Scholar]
- Barrett, E.P.; Joyner, L.G.; Halenda, P.P. The determination of pore volume and area distributions in porous substances. I. Computations from nitrogen isotherms. J. Am. Chem. Soc. 1951, 73, 373–380. [Google Scholar] [CrossRef]
- Huang, S.; Zhang, J.; Shi, J.; Zhao, F.; Duan, X. Characteristics of Fracturing Fluid Invasion Layer and Its Influence on Gas Production of Shale Gas Reservoirs. Energies 2023, 16, 3924. [Google Scholar] [CrossRef]
- Guo, P.; Li, X.; Li, S.; Mao, T. Combined Effect of In Situ Stress Level and Bedding Anisotropy on Hydraulic Fracture Vertical Growth in Deep Marine Shale Revealed via CT Scans and Acoustic Emission. Energies 2023, 16, 7270. [Google Scholar] [CrossRef]
- Kun, W.; Hangyu, Z.; Jie, L.; Kunjie, W.; Yin, L. Application of NMR technology in characterization of petrophysics and pore structure. Chin. J. Sci. Instrum. 2020, 41, 101–114. [Google Scholar]
- Fleury, M.; Romero-Sarmiento, M. Characterization of shales using T1–T2 NMR maps. J. Pet. Sci. Eng. 2016, 137, 55–62. [Google Scholar] [CrossRef]
- Katende, A.; O’Connell, L.G.; Rich, A.; Rutqvist, J.; Radonjic, M. A comprehensive review of proppant embedment in shale reservoirs: Experimentation, modeling and future prospects. J. Nat. Gas Sci. Eng. 2021, 95 (Suppl. C), 104143. [Google Scholar] [CrossRef]
- Dokhani, V.; Yu, M.; Bloys, B. A wellbore stability model for shale formations: Accounting for strength anisotropy and fluid induced instability. J. Nat. Gas Sci. Eng. 2016, 32, 174–184. [Google Scholar] [CrossRef]
- Xu, L.; Zhang, J.; Ding, J.; Liu, T.; Shi, G.; Li, X.; Dang, W.; Cheng, Y.; Guo, R. Pore Structure and Fractal Characteristics of Different Shale Lithofacies in the Dalong Formation in the Western Area of the Lower Yangtze Platform. Minerals 2020, 10, 72. [Google Scholar] [CrossRef]
- Yang, C.; Zhang, J.; Han, S.; Wang, X.; Wang, L.; Yu, W.; Wang, Z. Compositional controls on pore-size distribution by nitrogen adsorption technique in the Lower Permian Shanxi Shales, Ordos Basin. J. Nat. Gas Sci. Eng. 2016, 34, 1369–1381. [Google Scholar] [CrossRef]


Disclaimer/Publisher’s Note: The statements, opinions and data contained in all publications are solely those of the individual author(s) and contributor(s) and not of MDPI and/or the editor(s). MDPI and/or the editor(s) disclaim responsibility for any injury to people or property resulting from any ideas, methods, instructions or products referred to in the content. |
© 2025 by the authors. Licensee MDPI, Basel, Switzerland. This article is an open access article distributed under the terms and conditions of the Creative Commons Attribution (CC BY) license (https://creativecommons.org/licenses/by/4.0/).