

Mechanochemical Treatments of Commercial Vermiculites


Abstract

1. Introduction
2. Materials and Methods
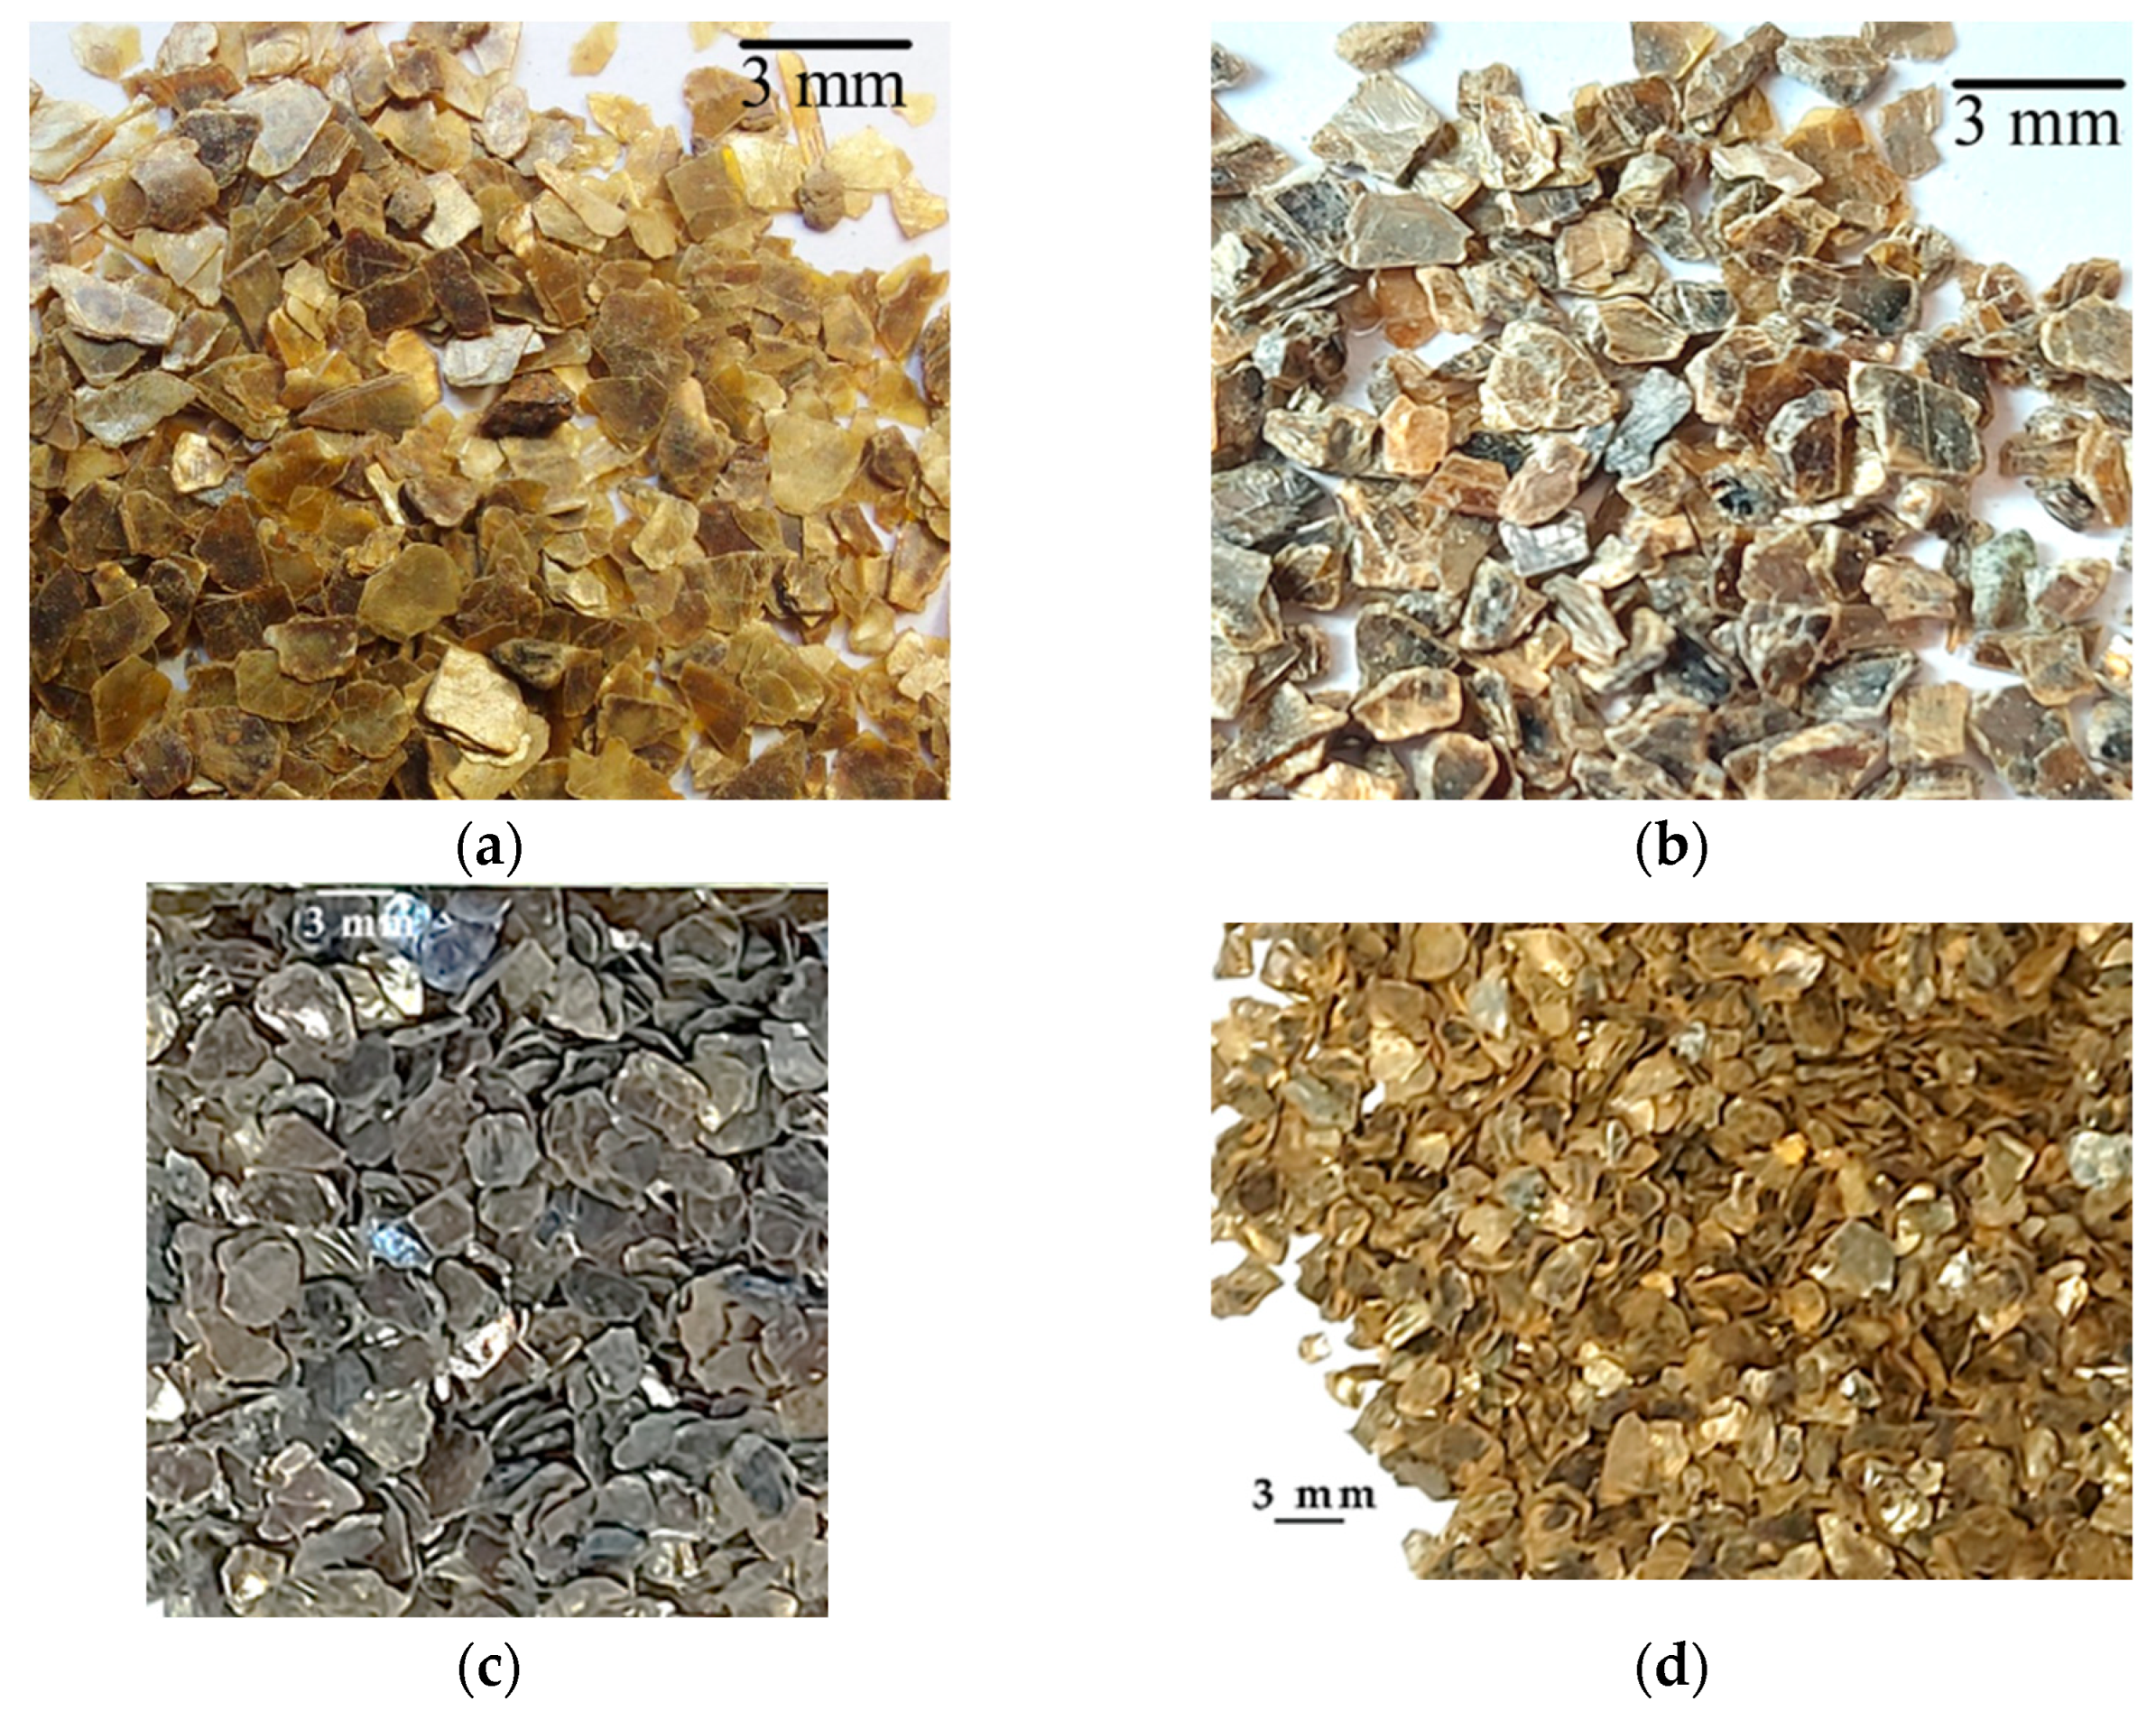
2.1. Materials
2.2. Mechanochemical Treatments
2.3. Samples Characterization
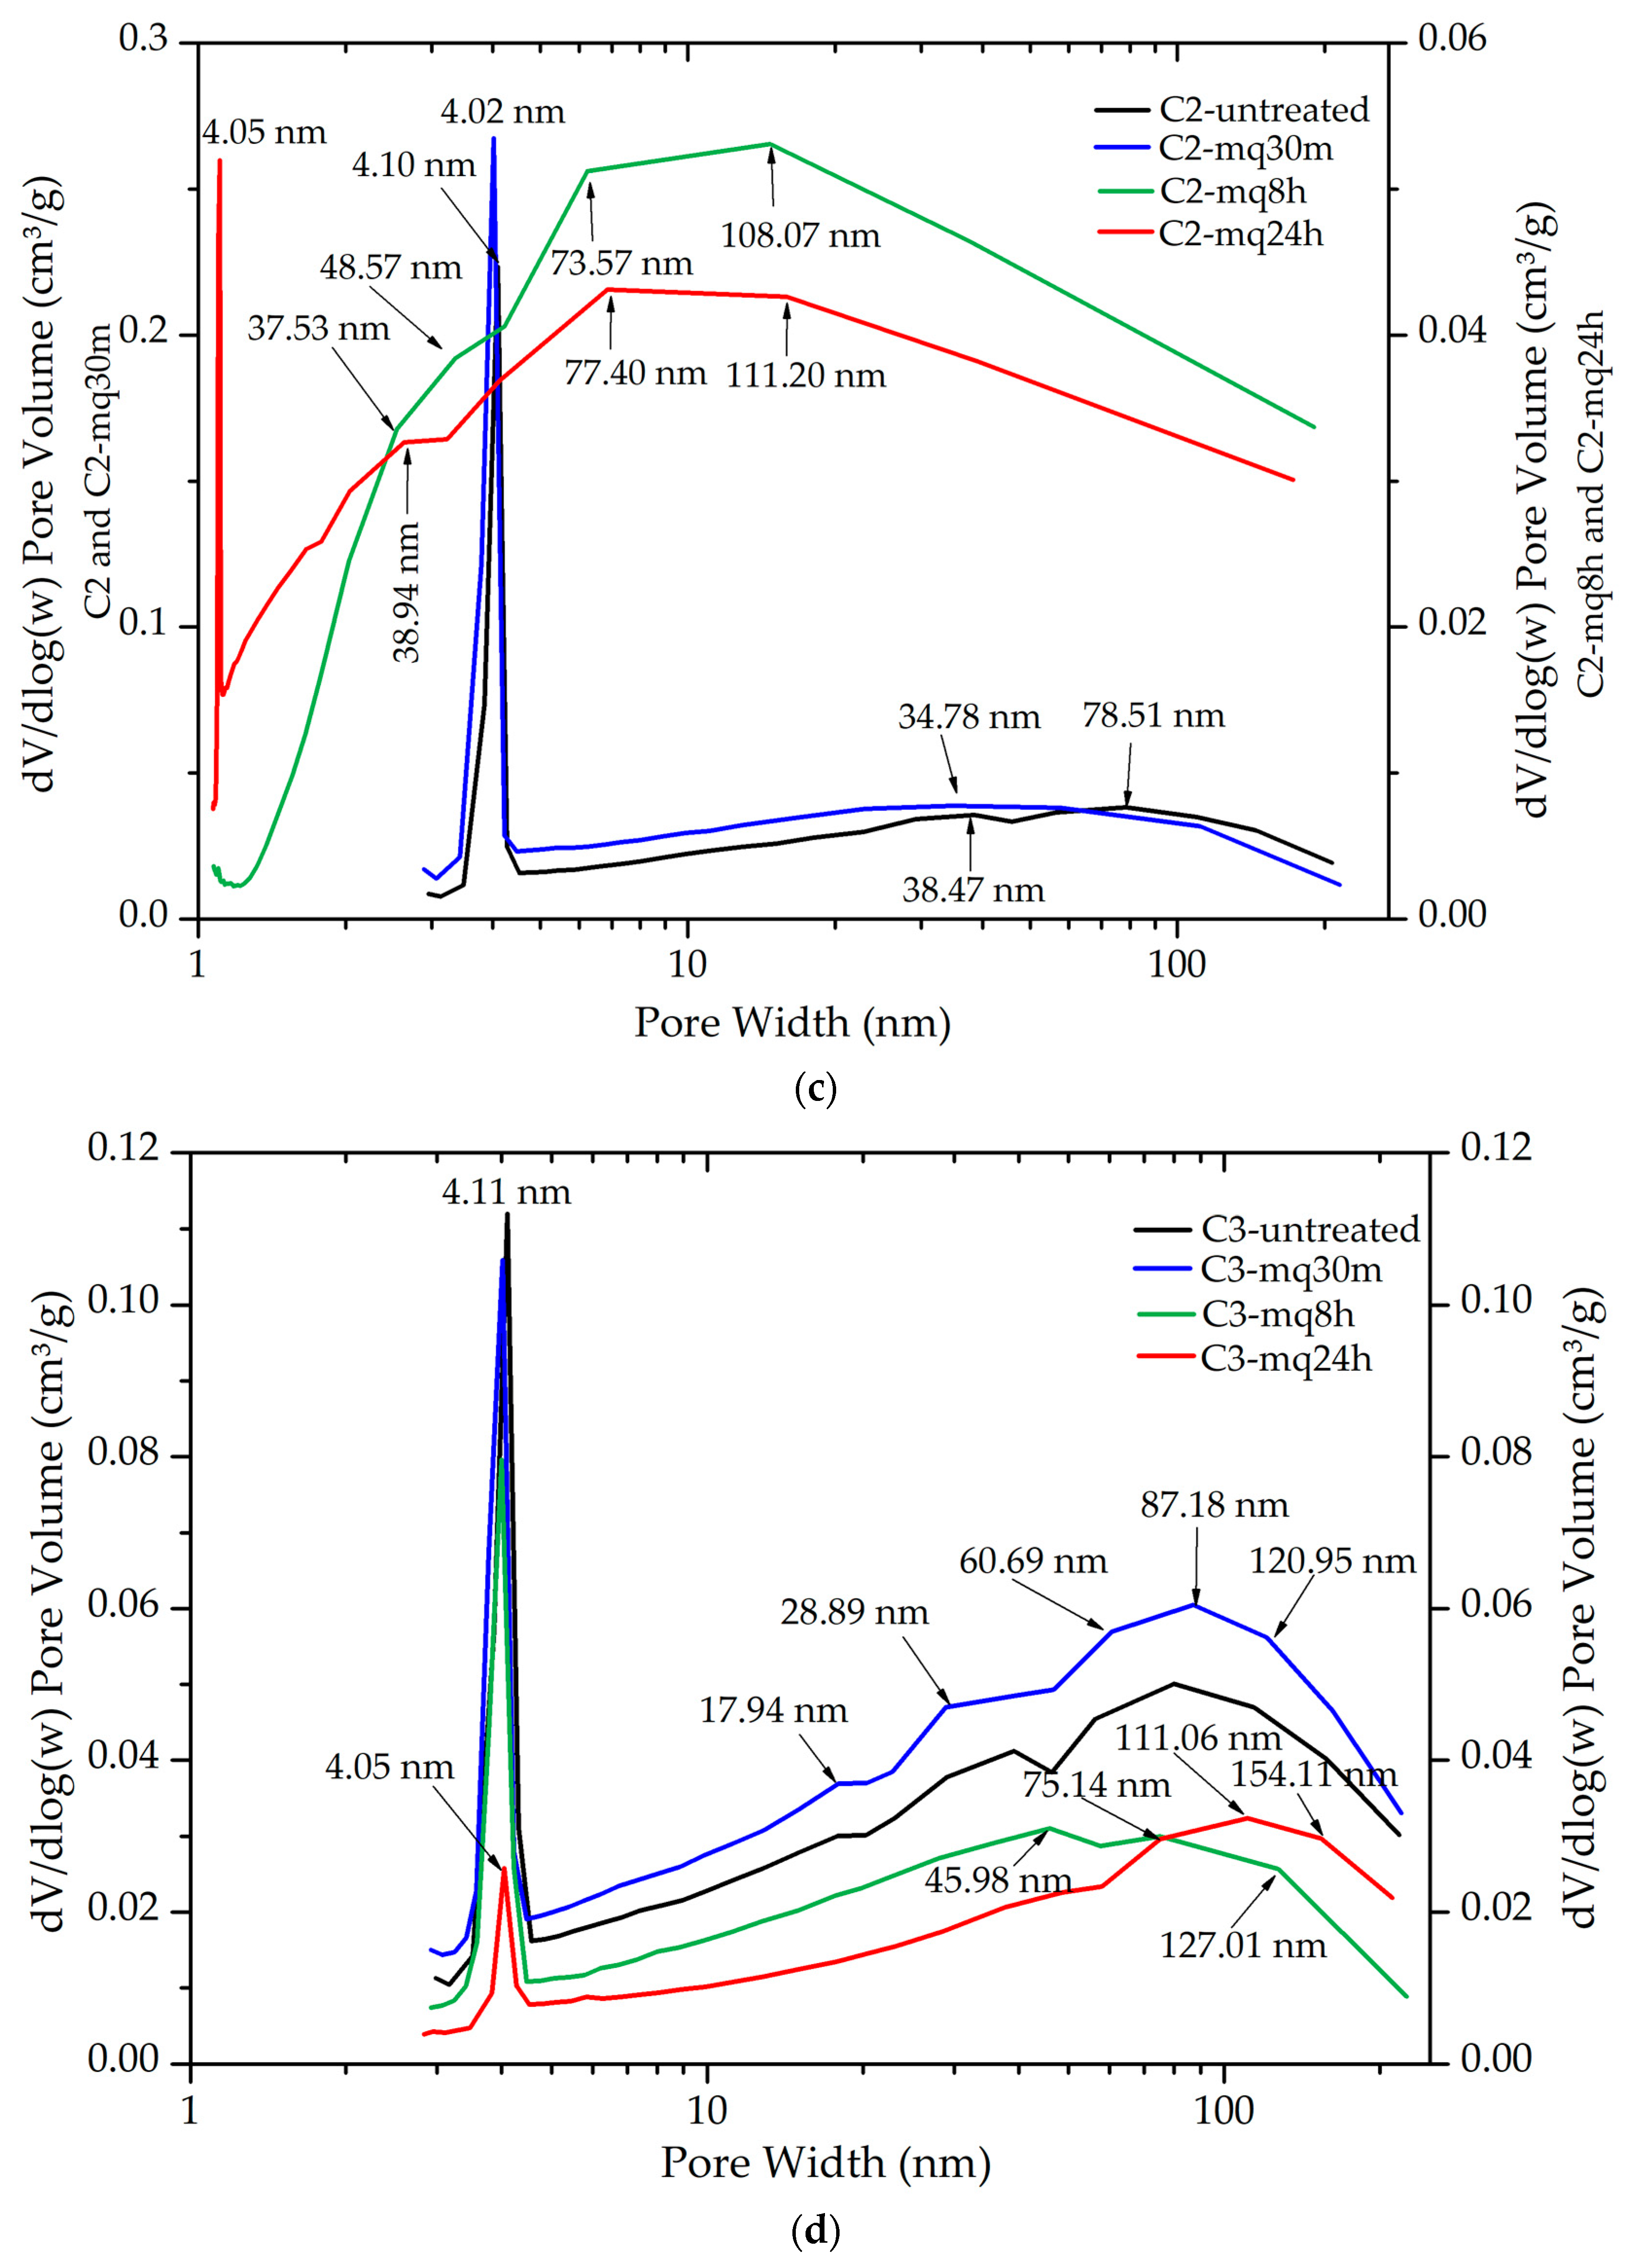
3. Results
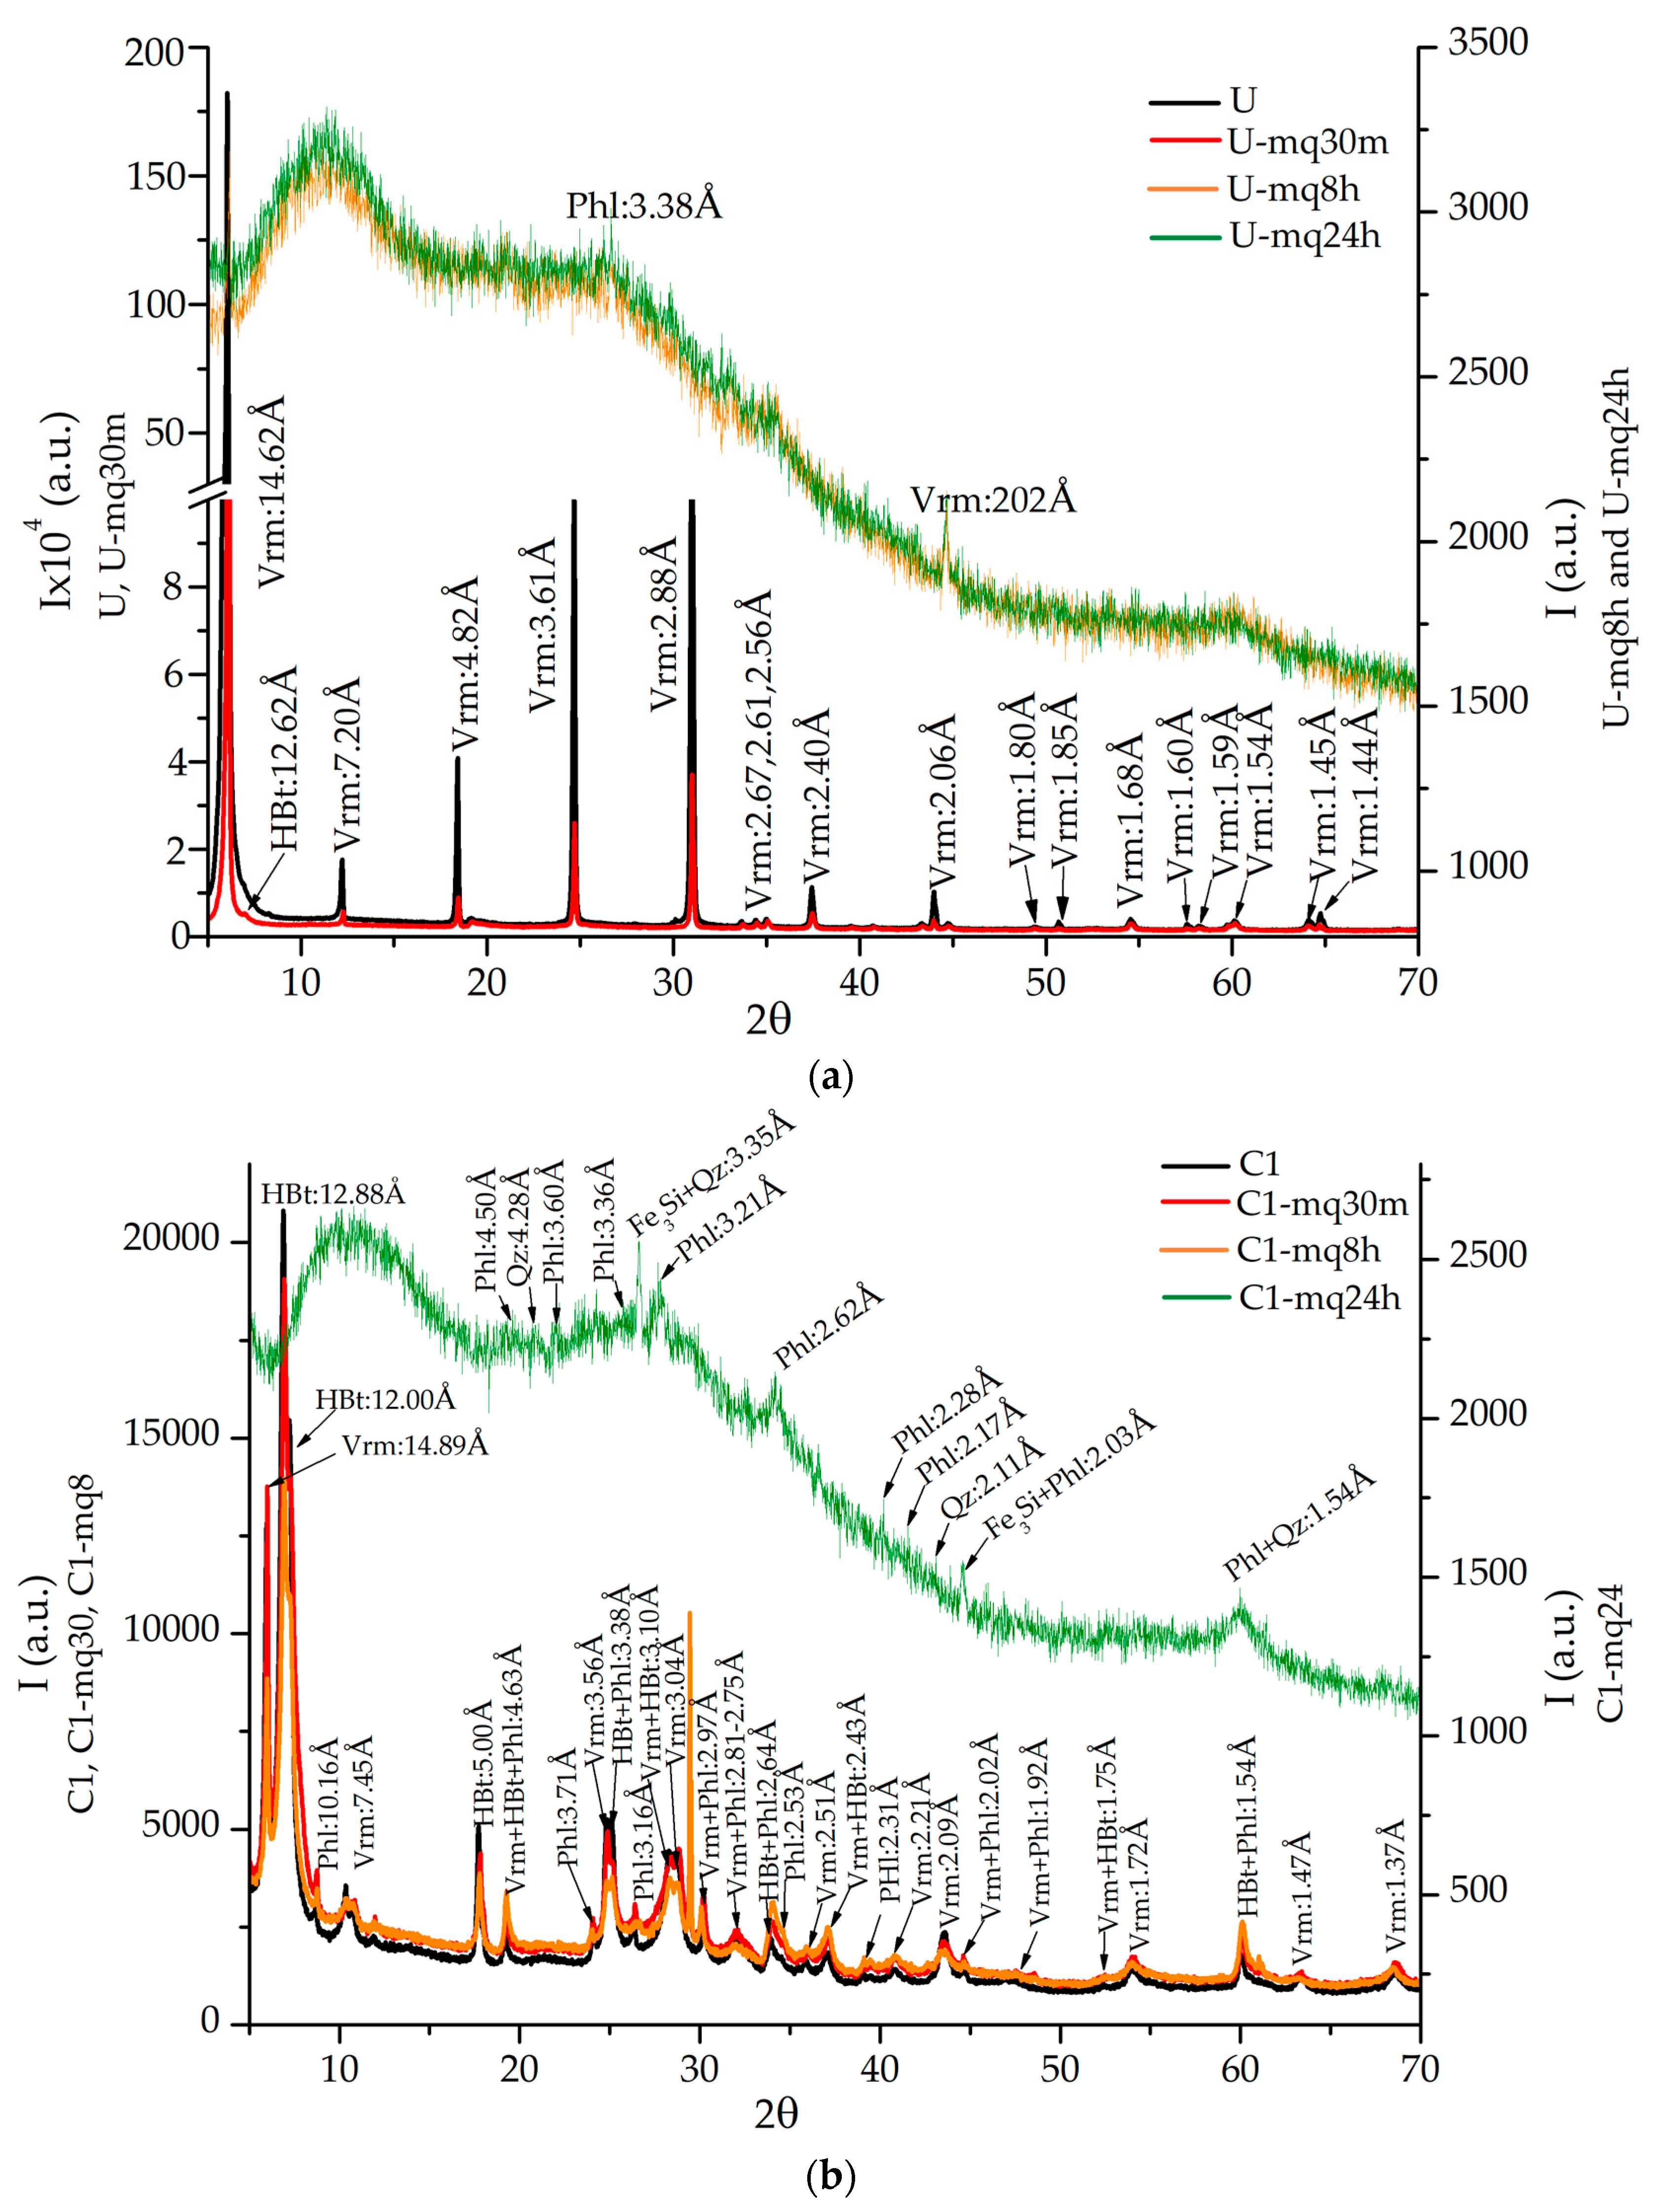
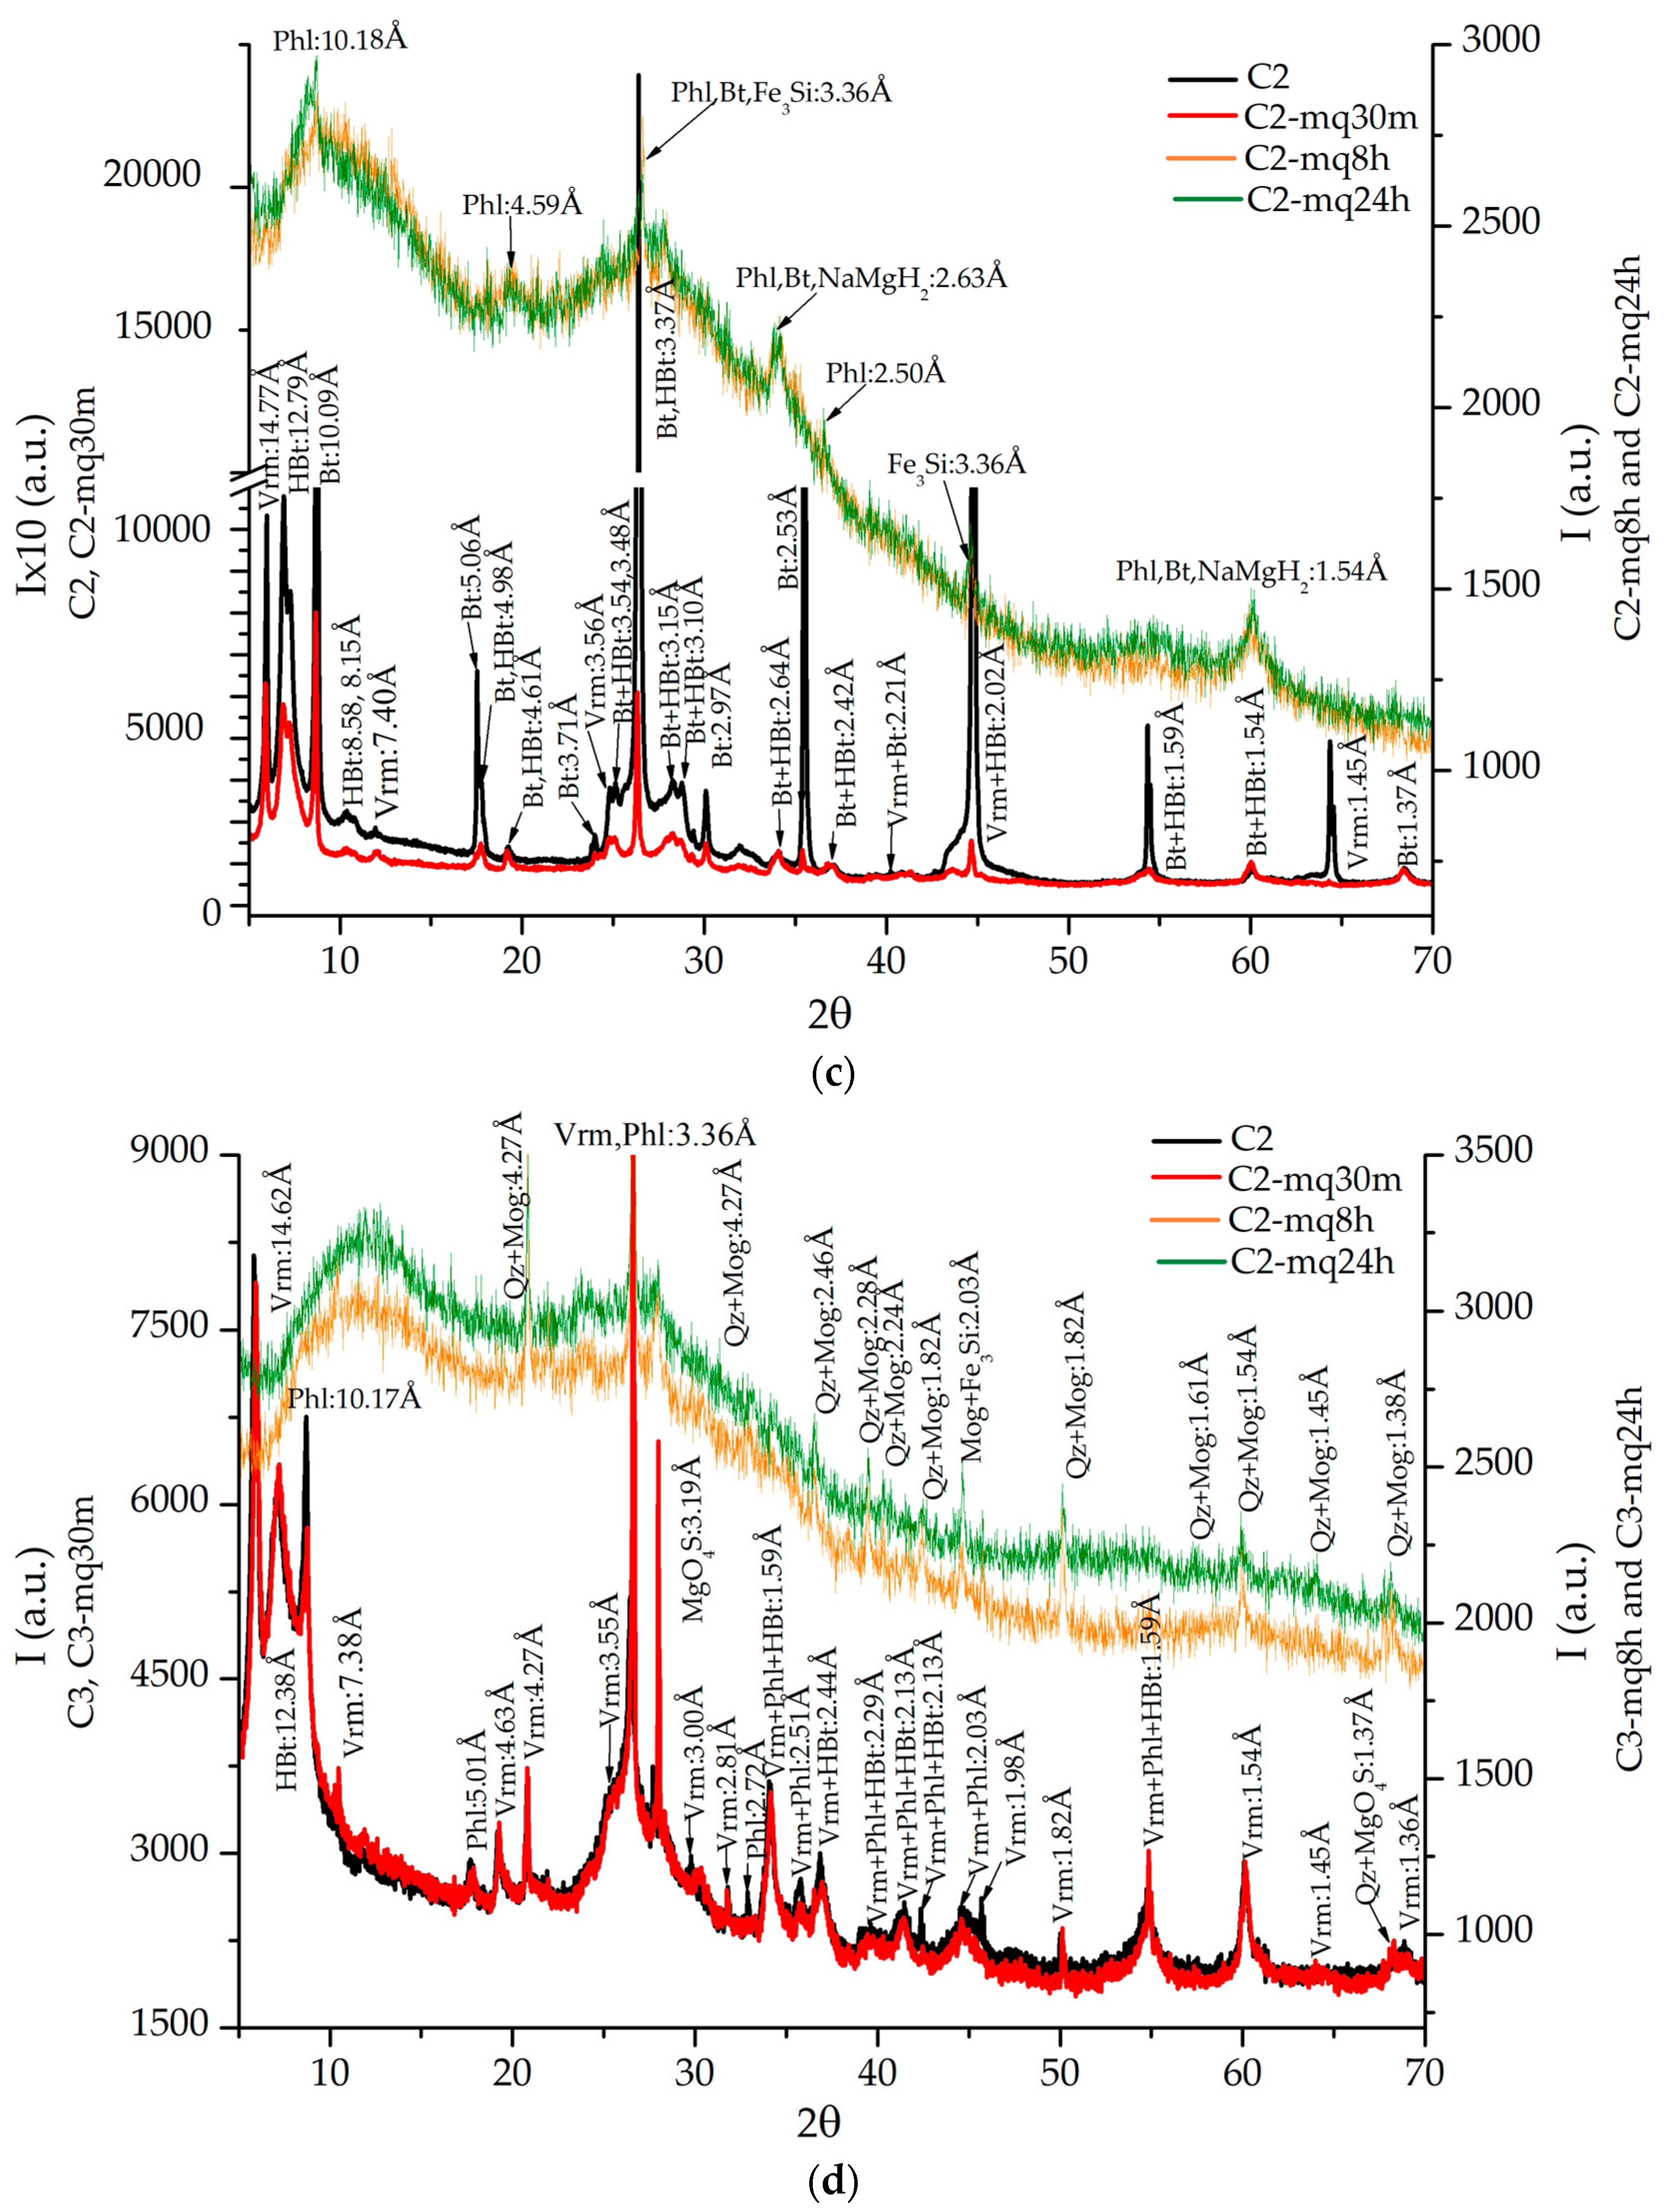
3.1. XRD Analyses
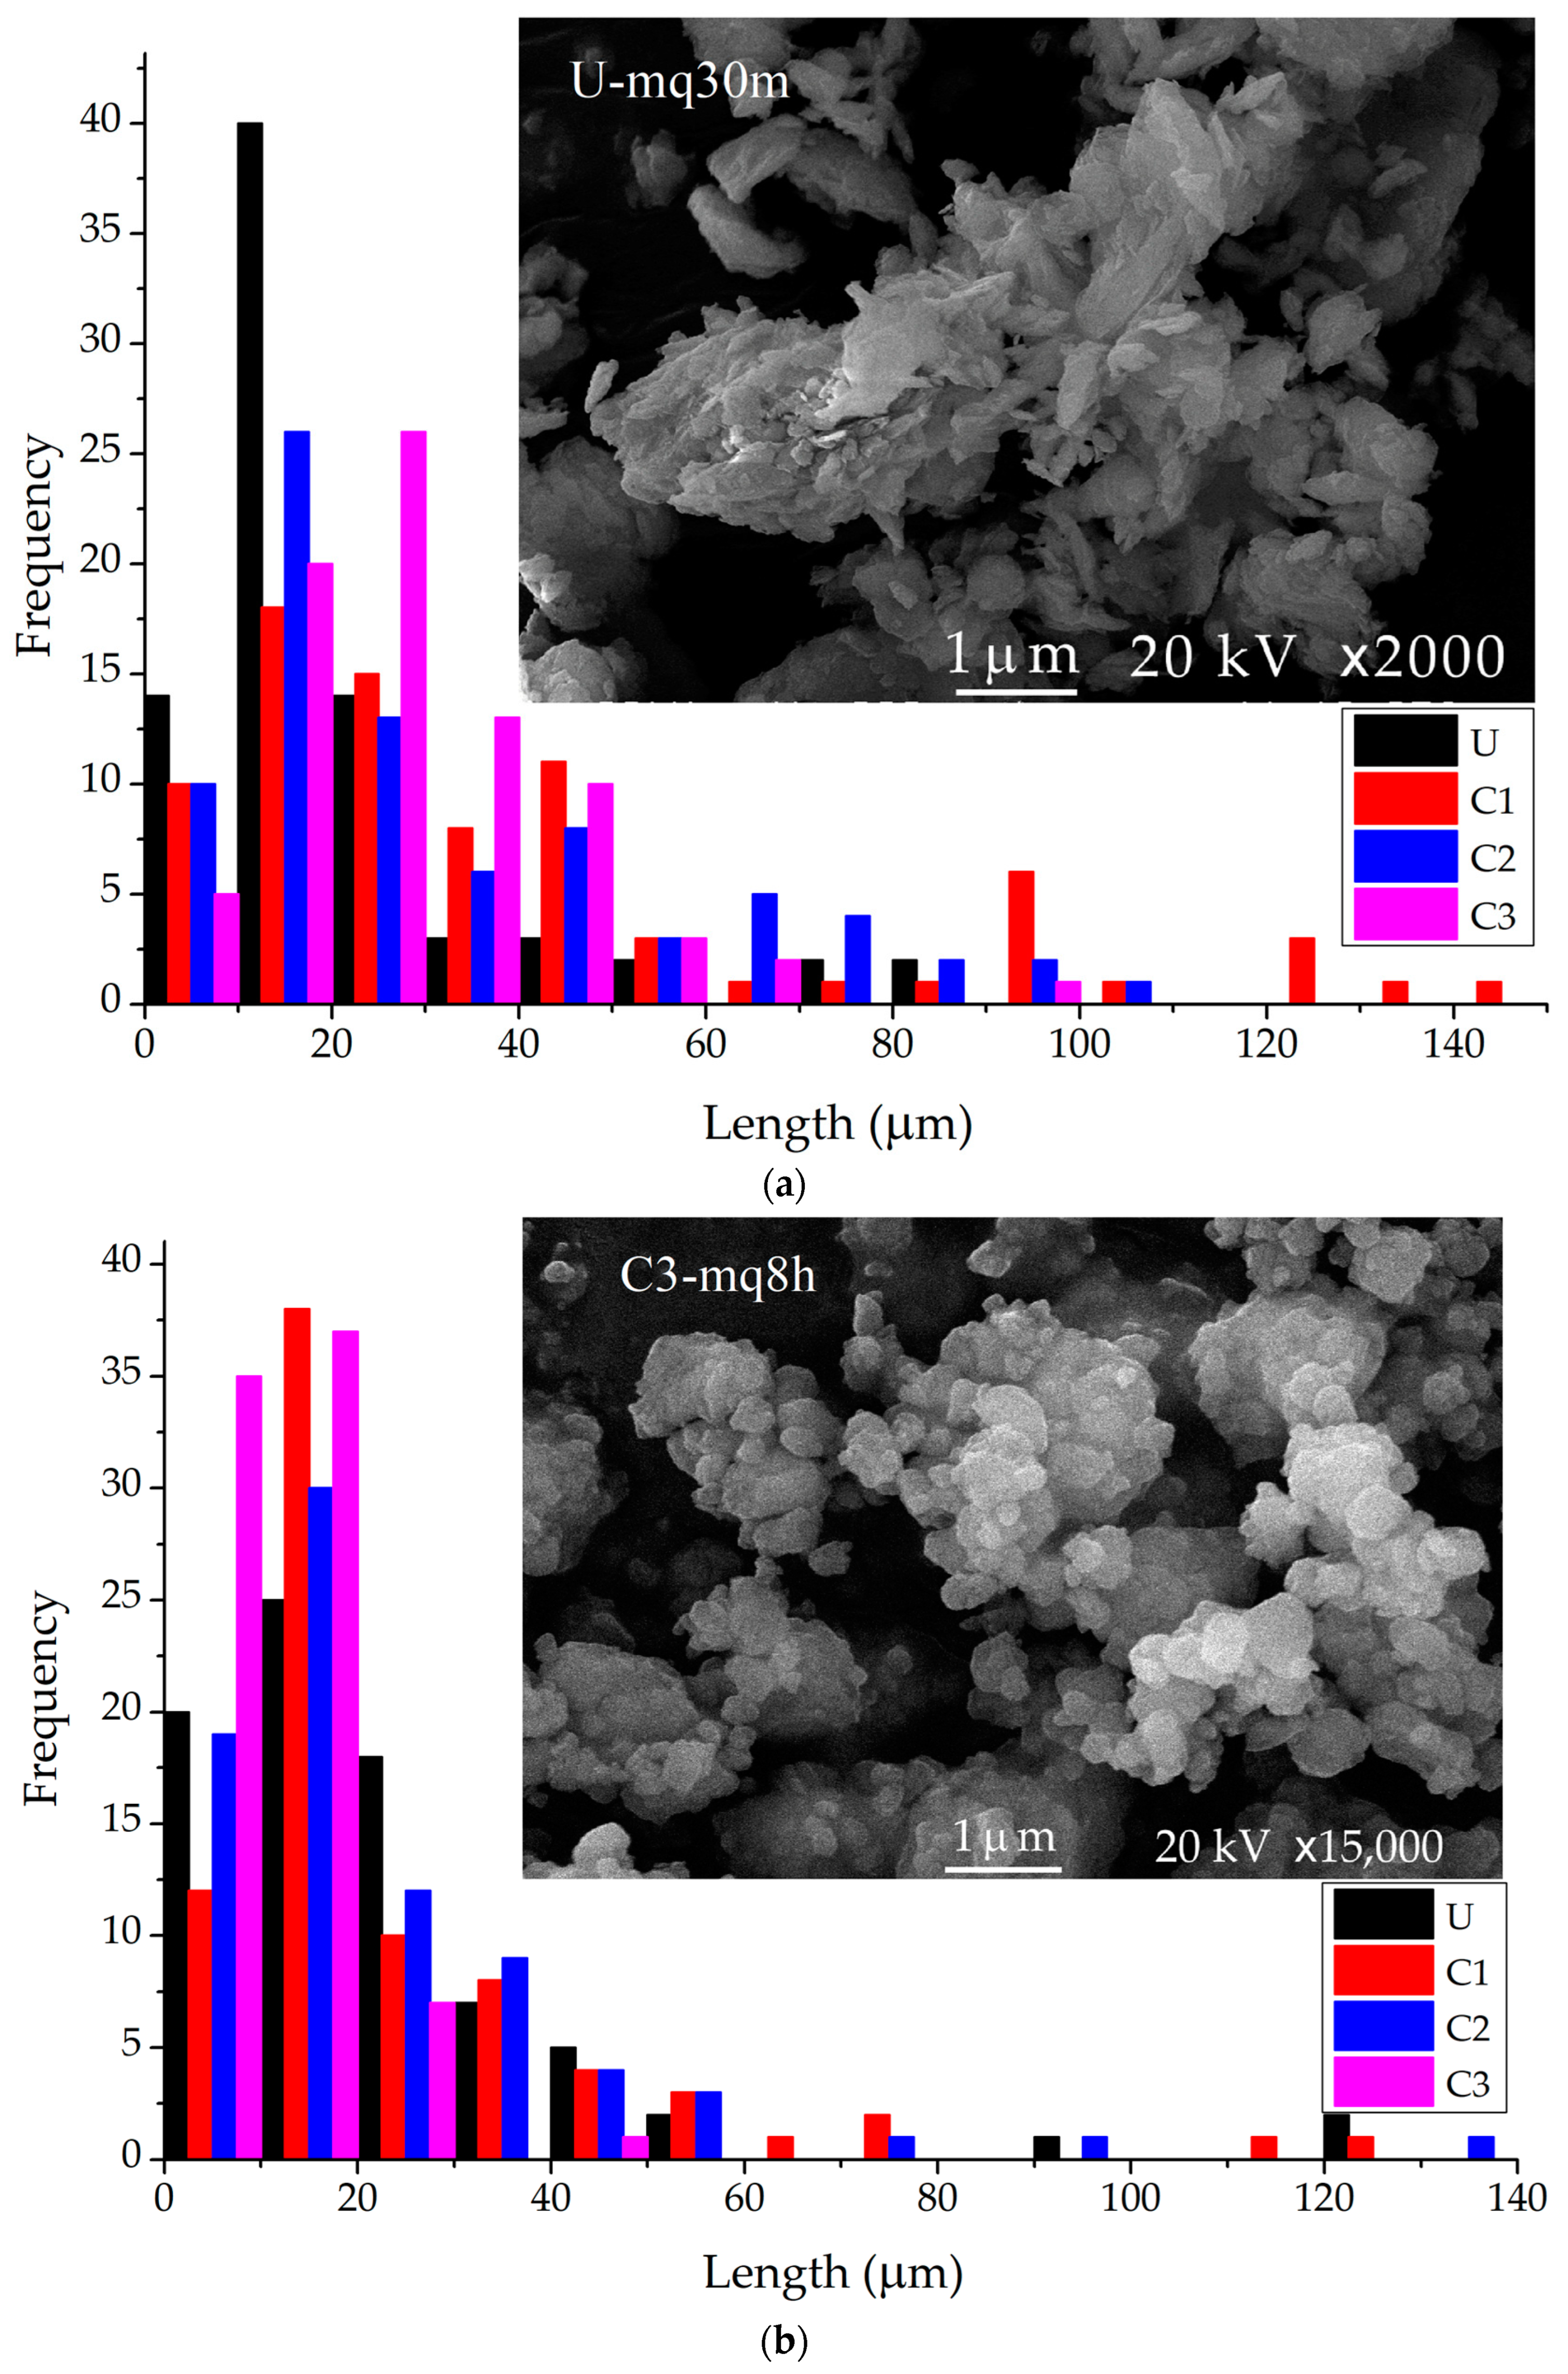
3.2. Particle Size of Mechanochemical Treated Samples
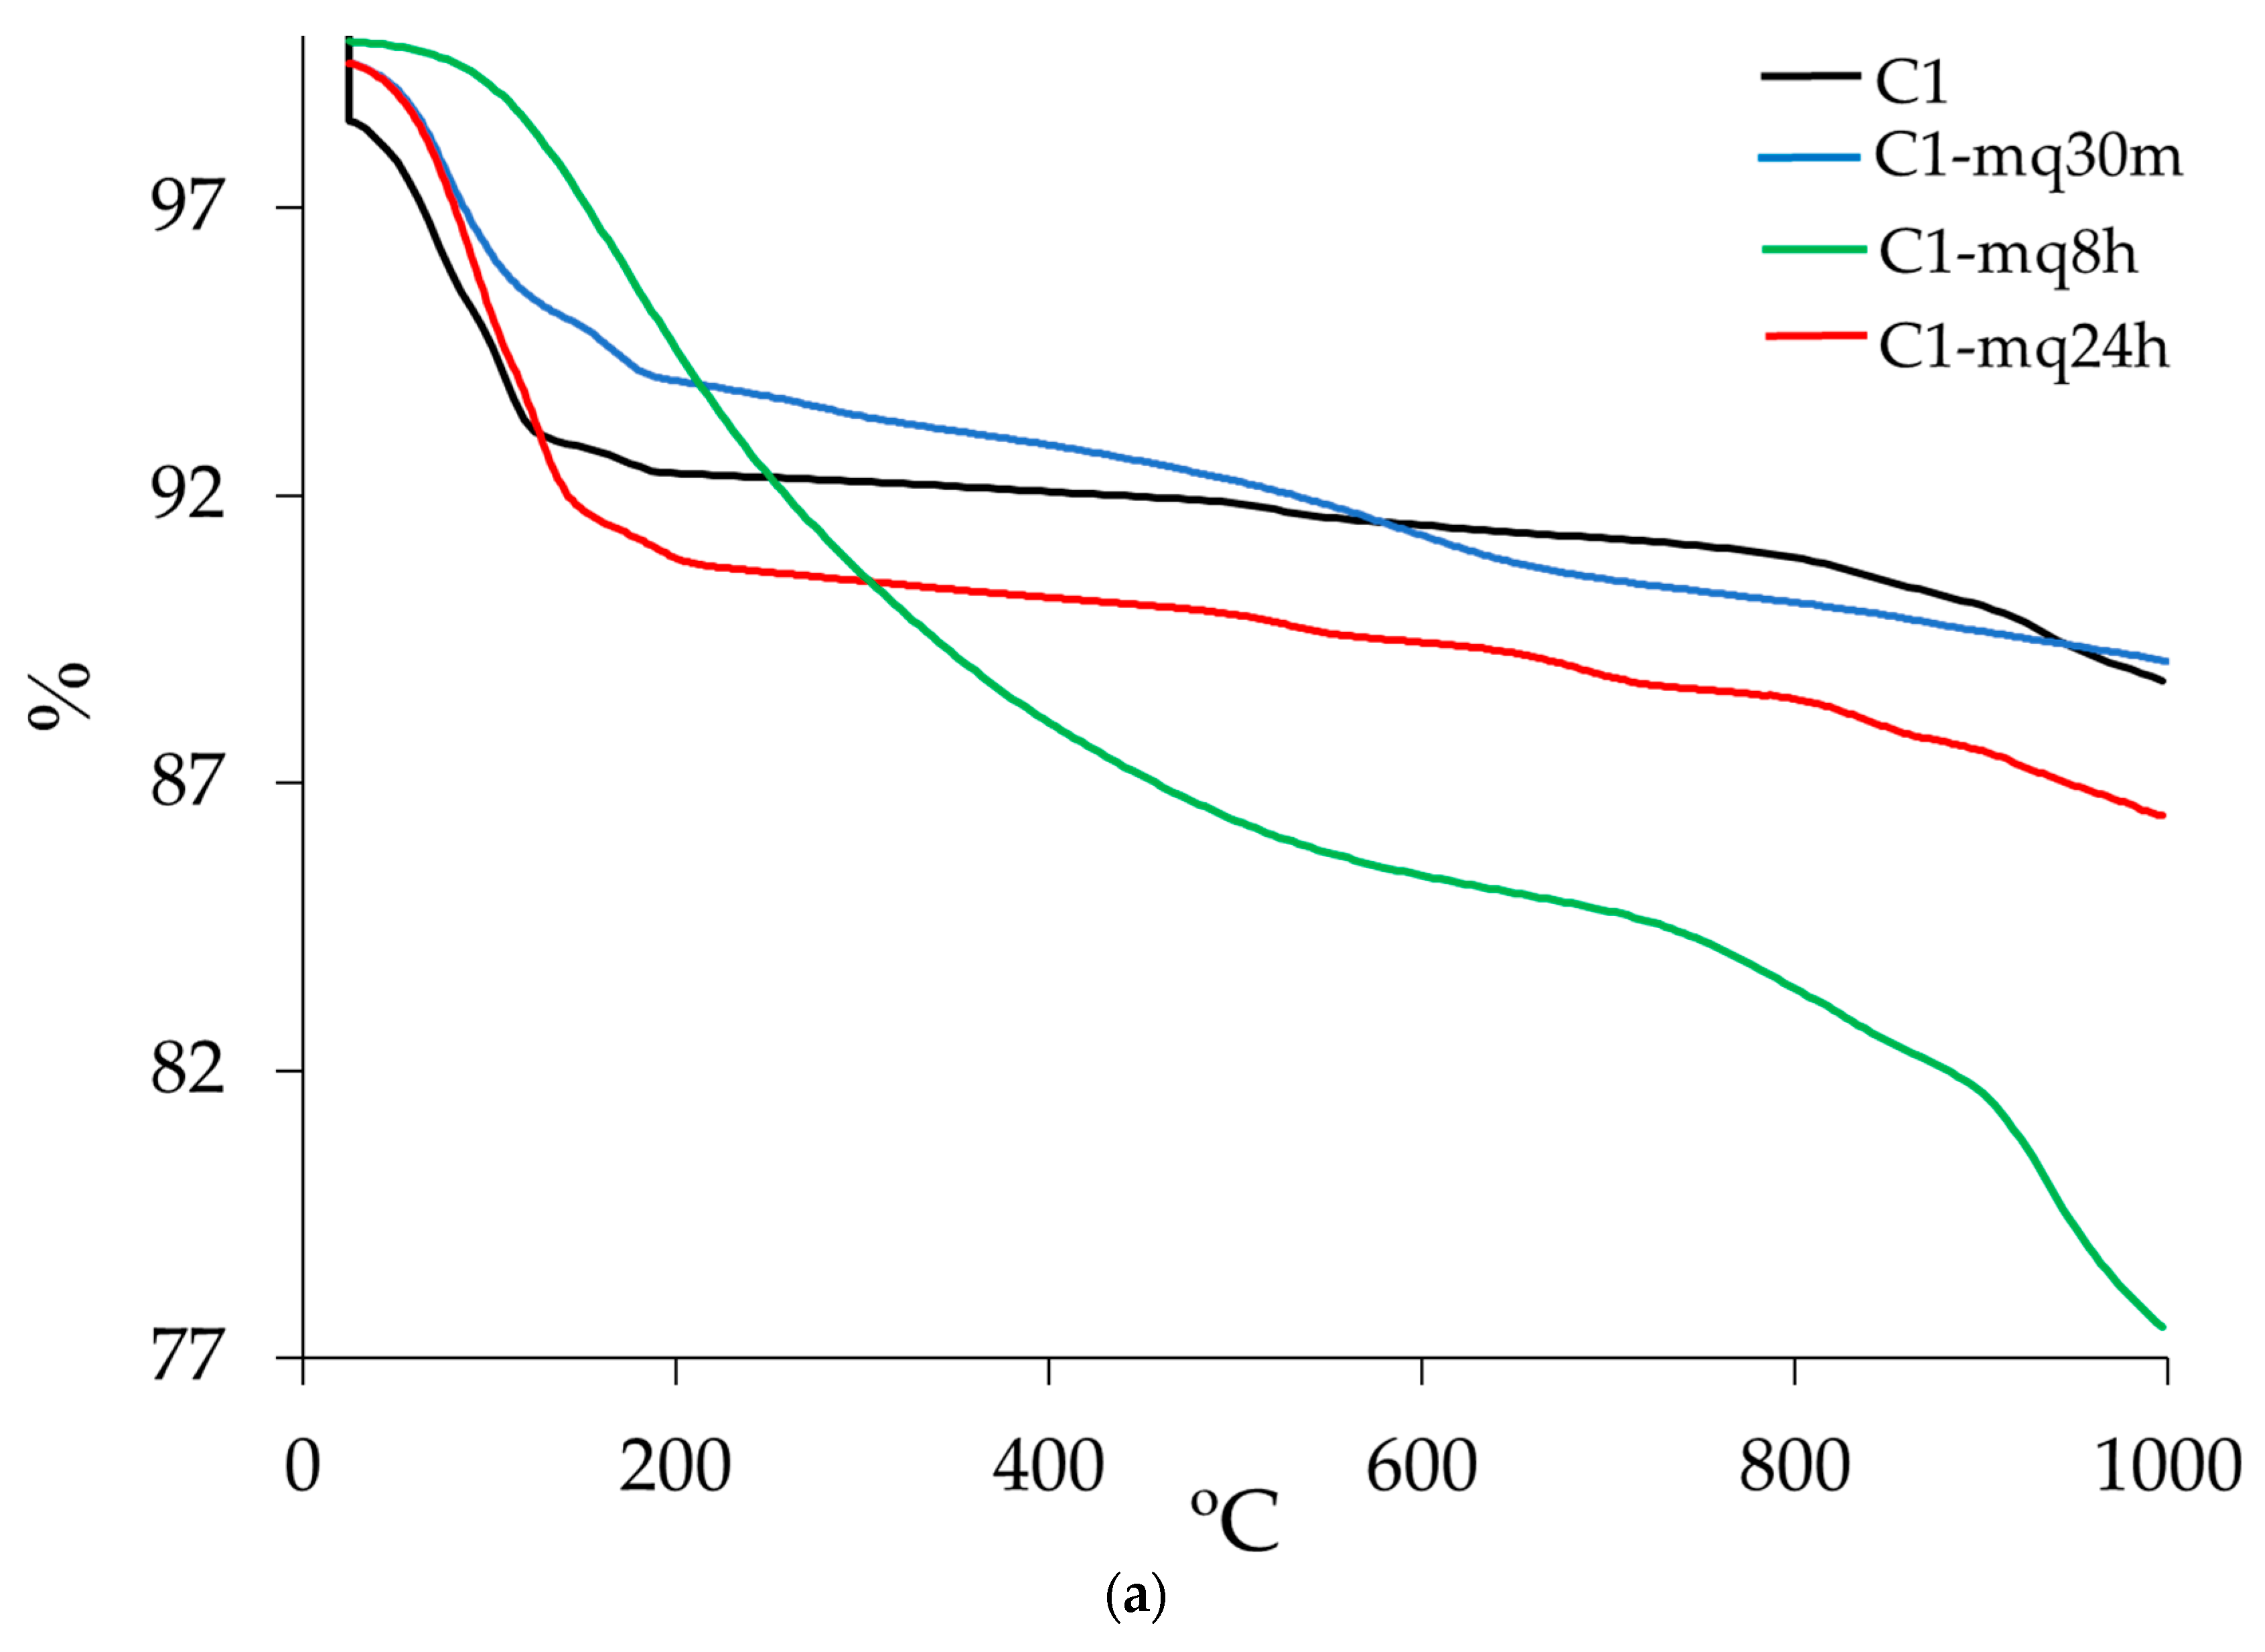
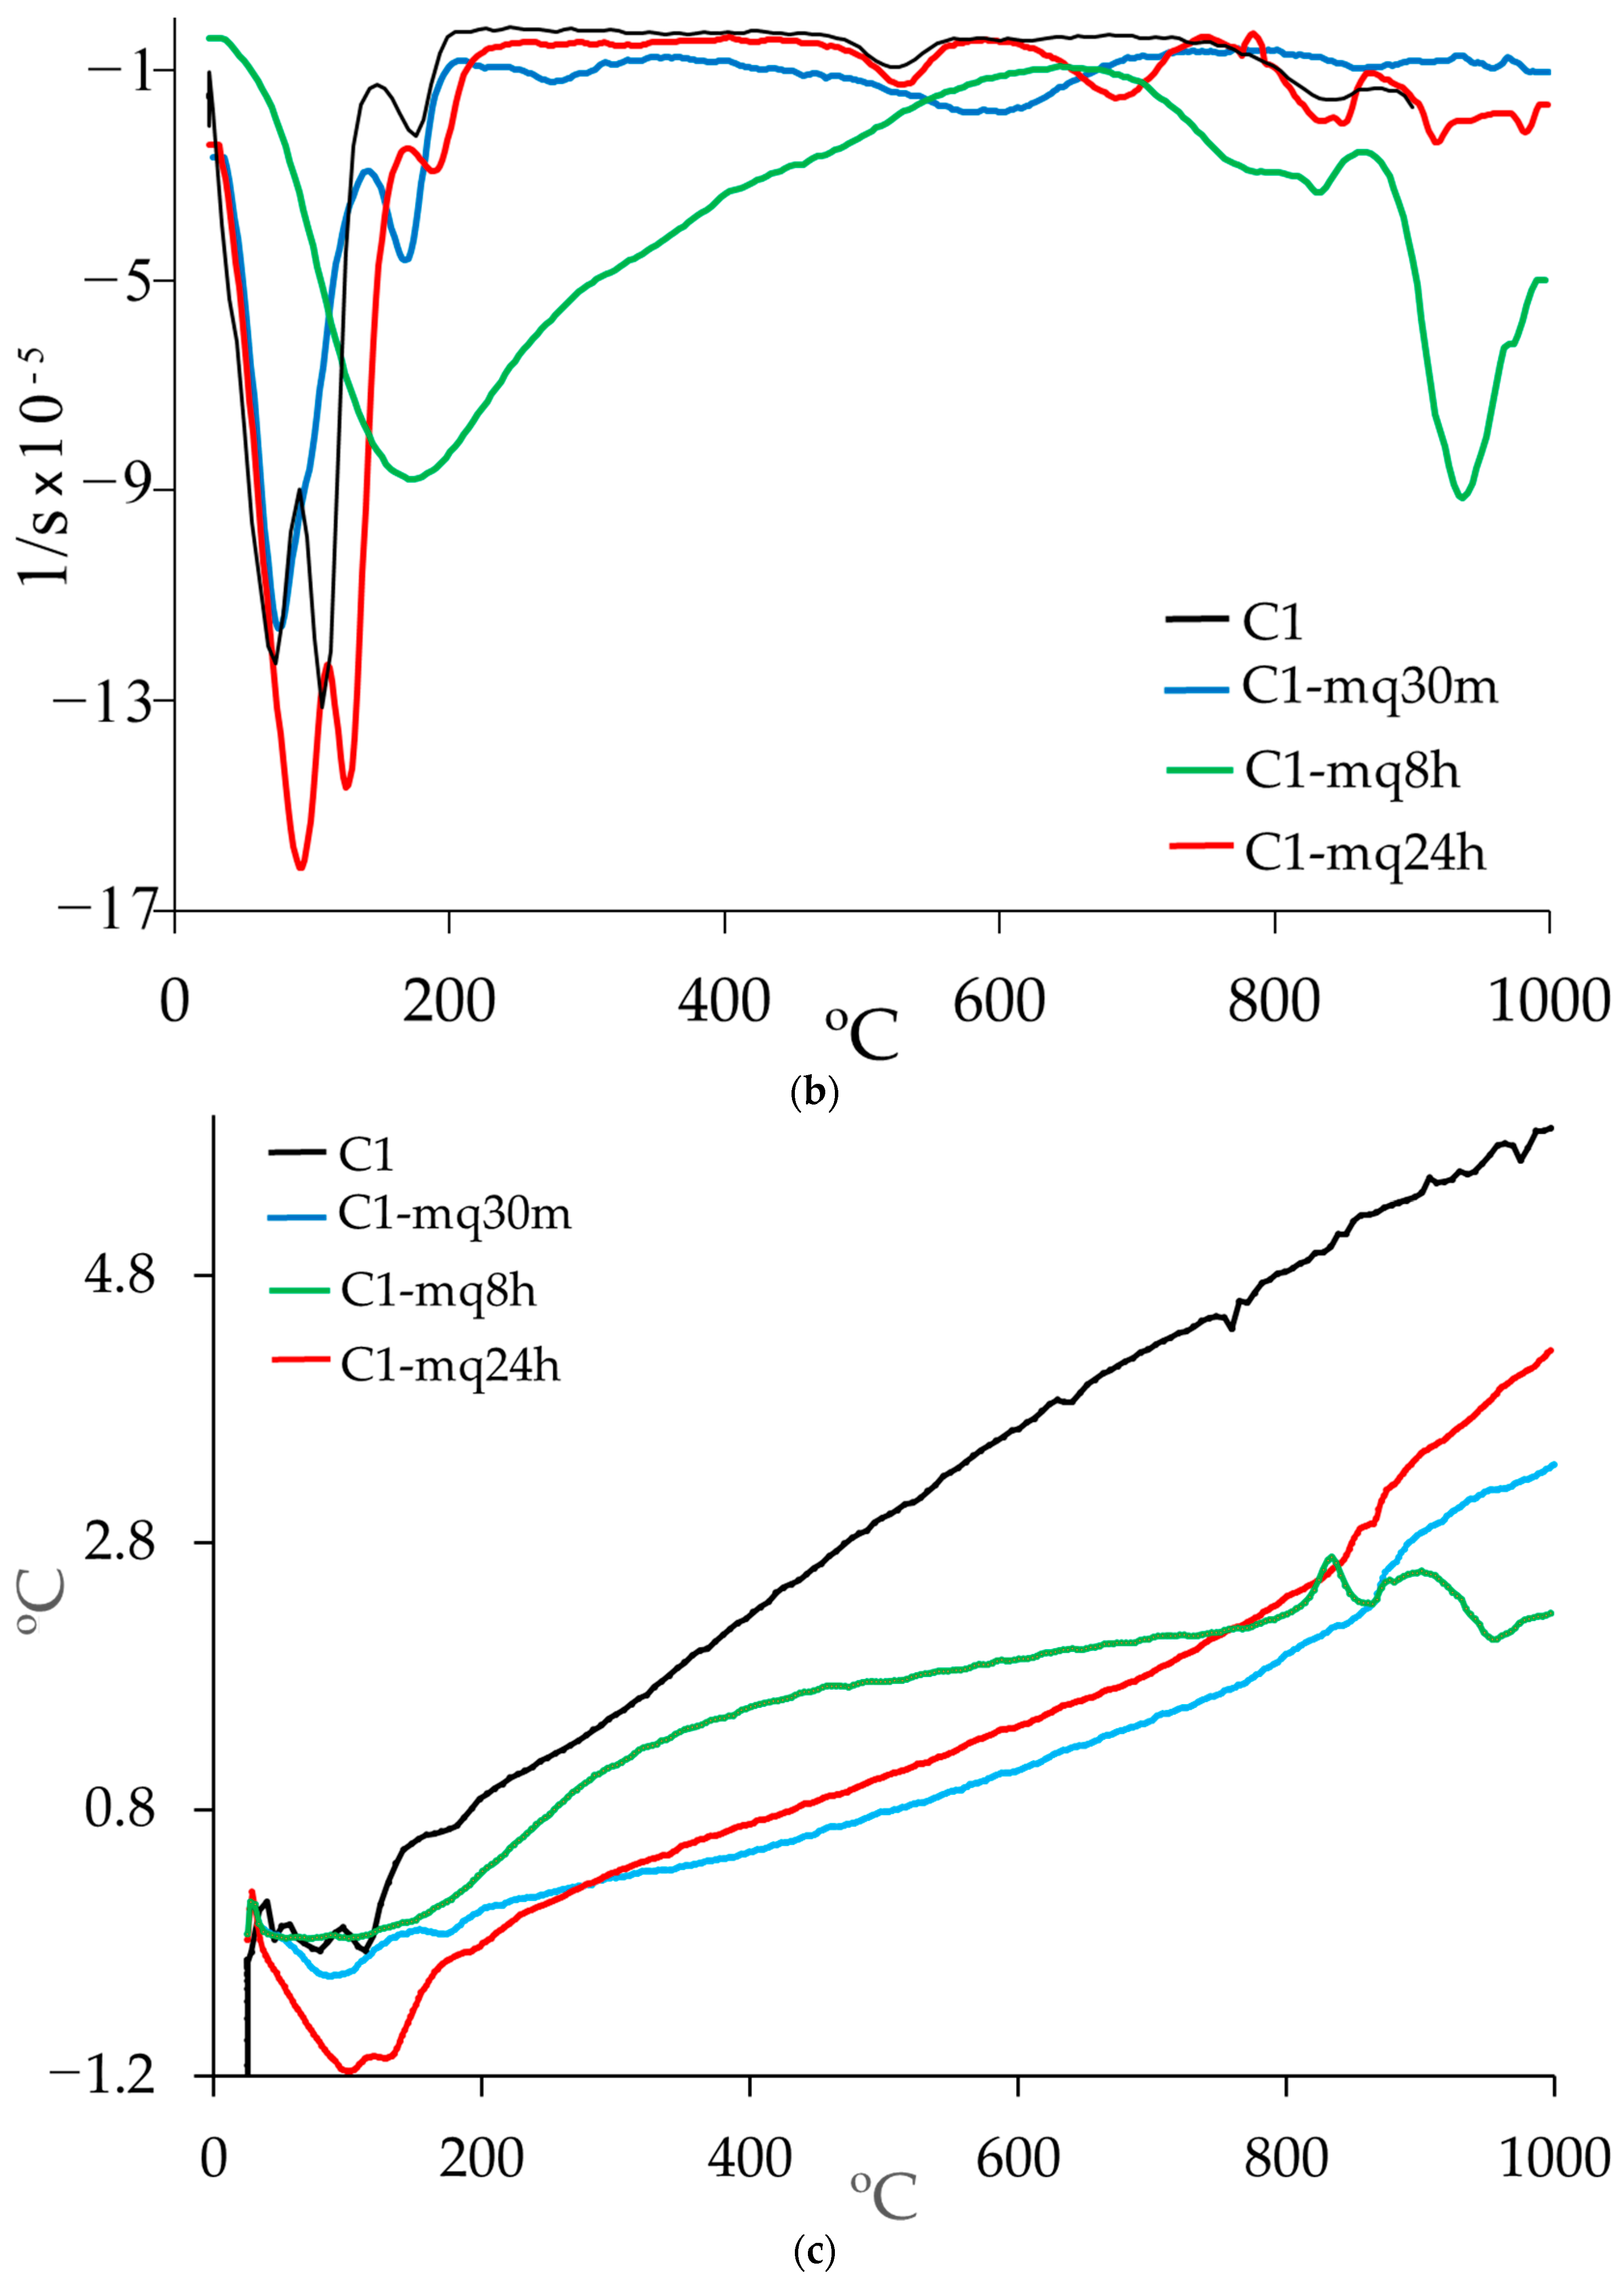
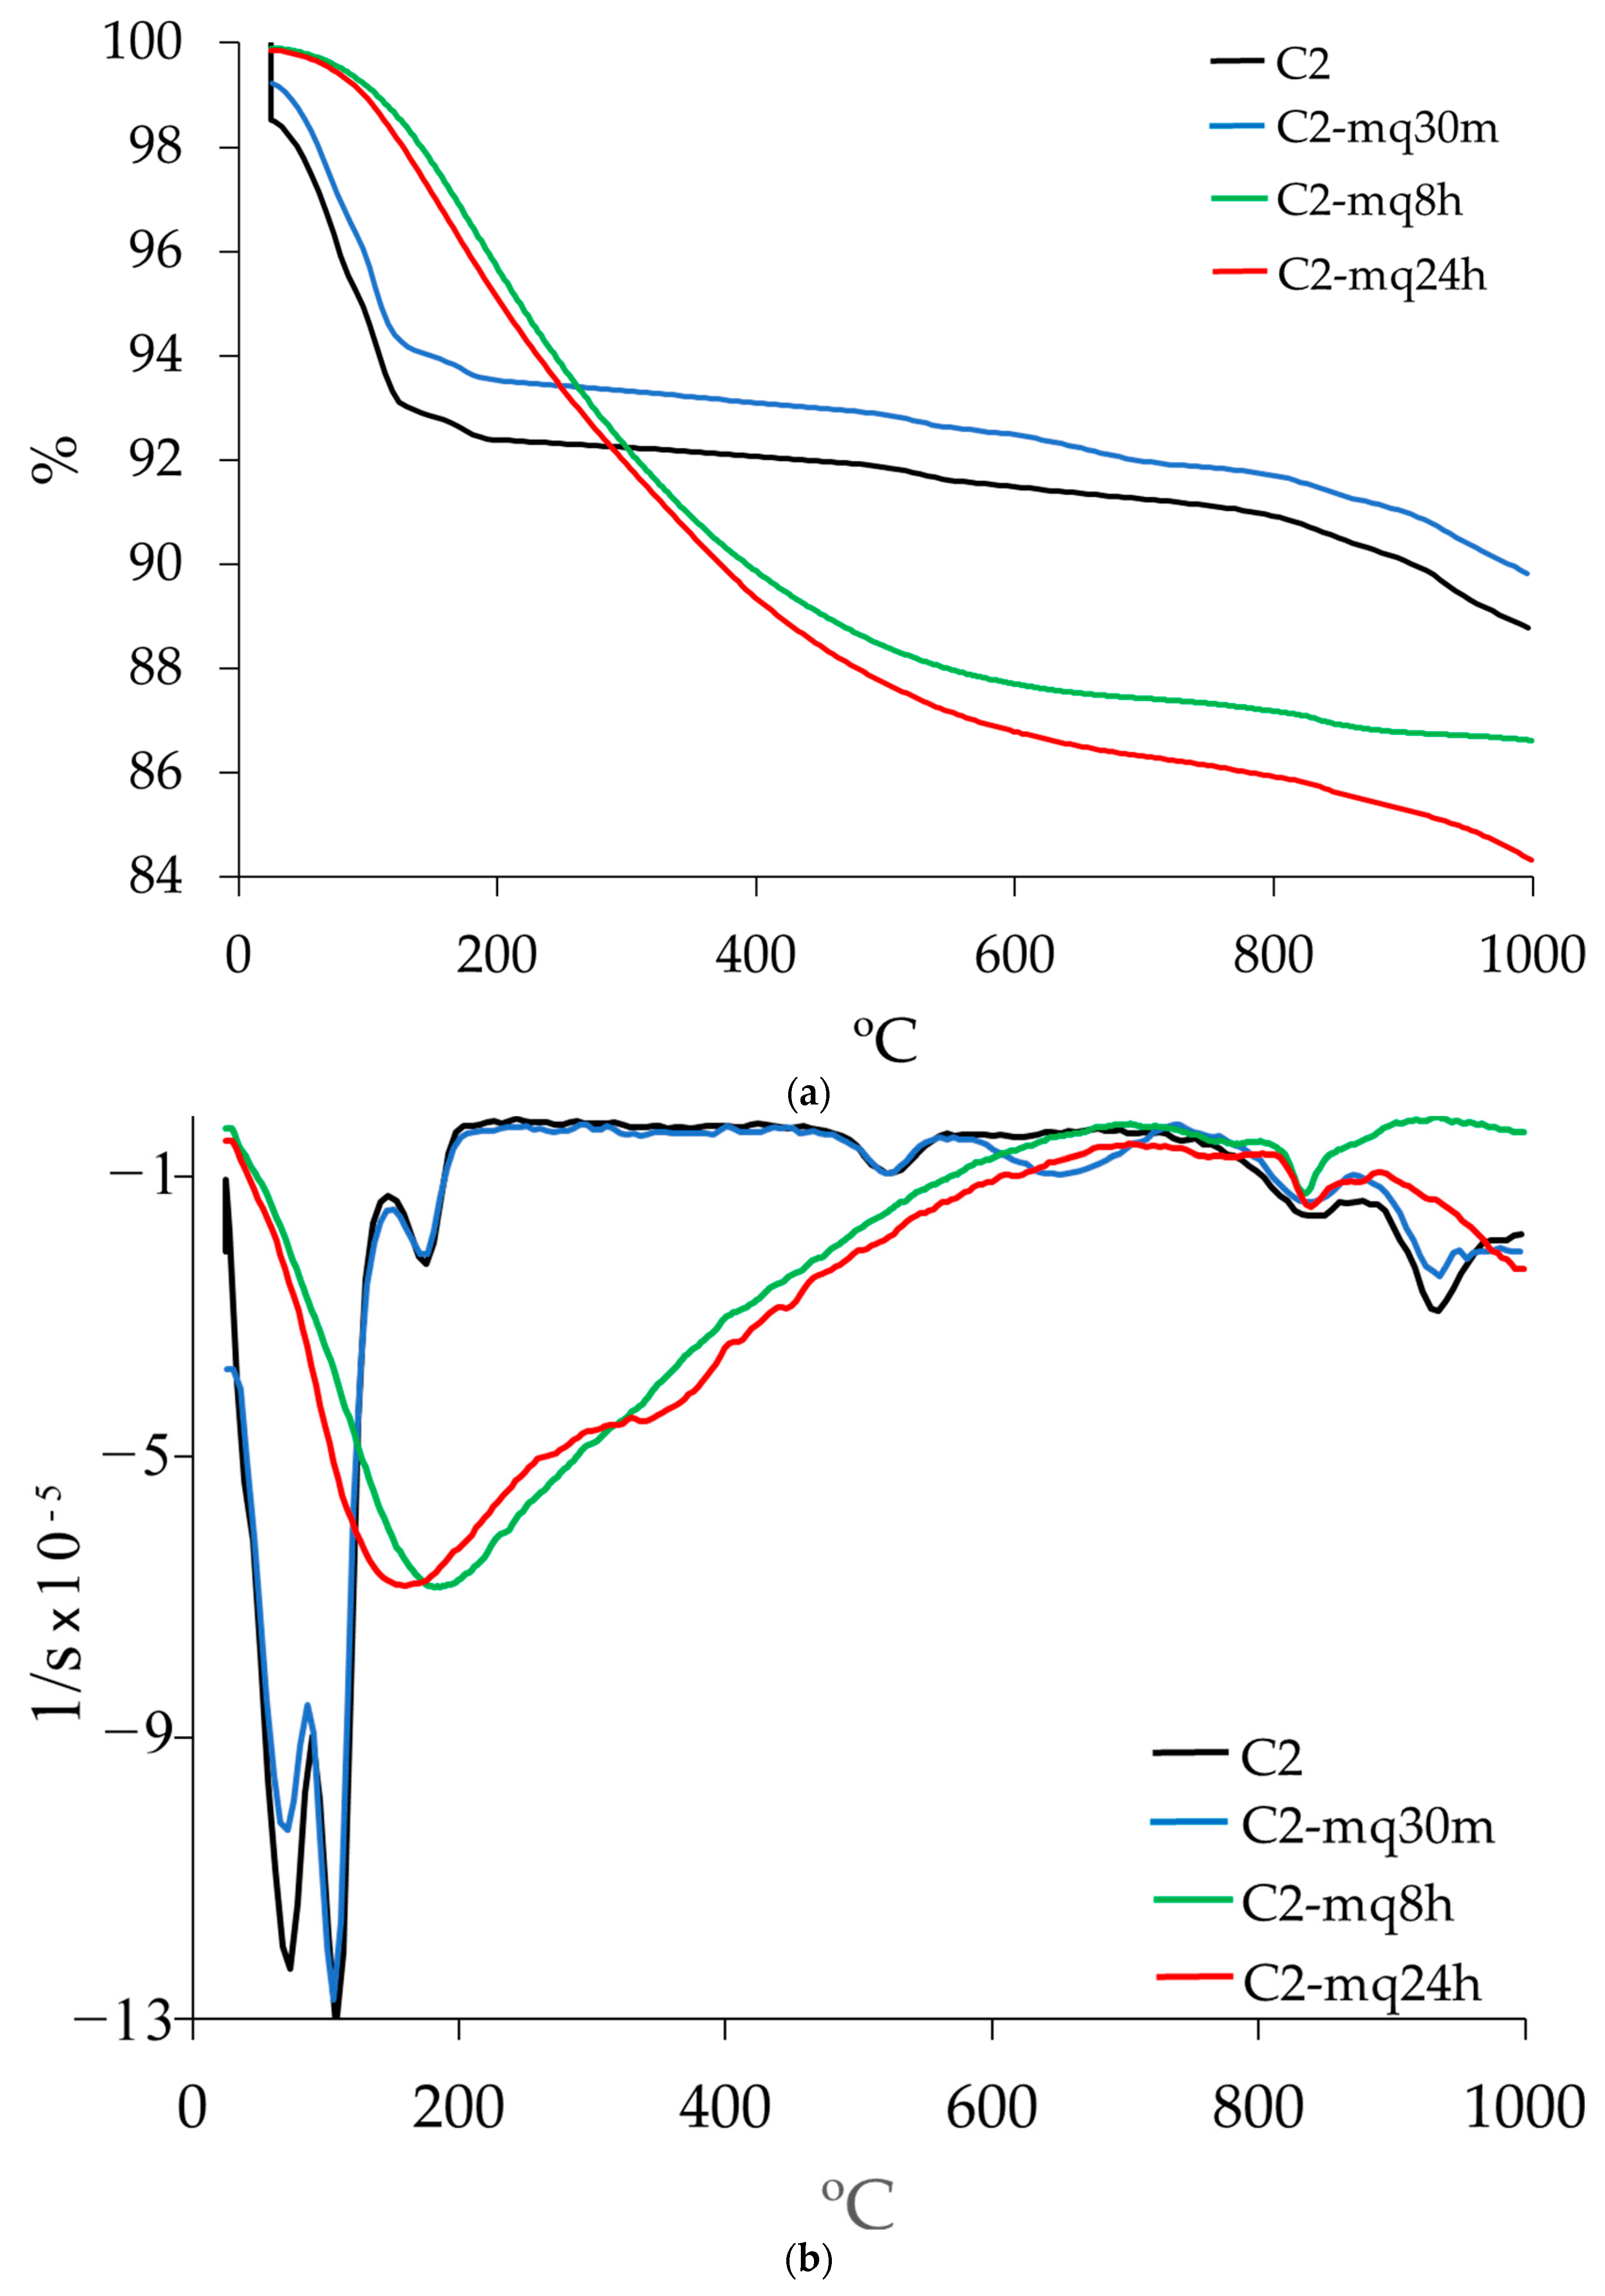
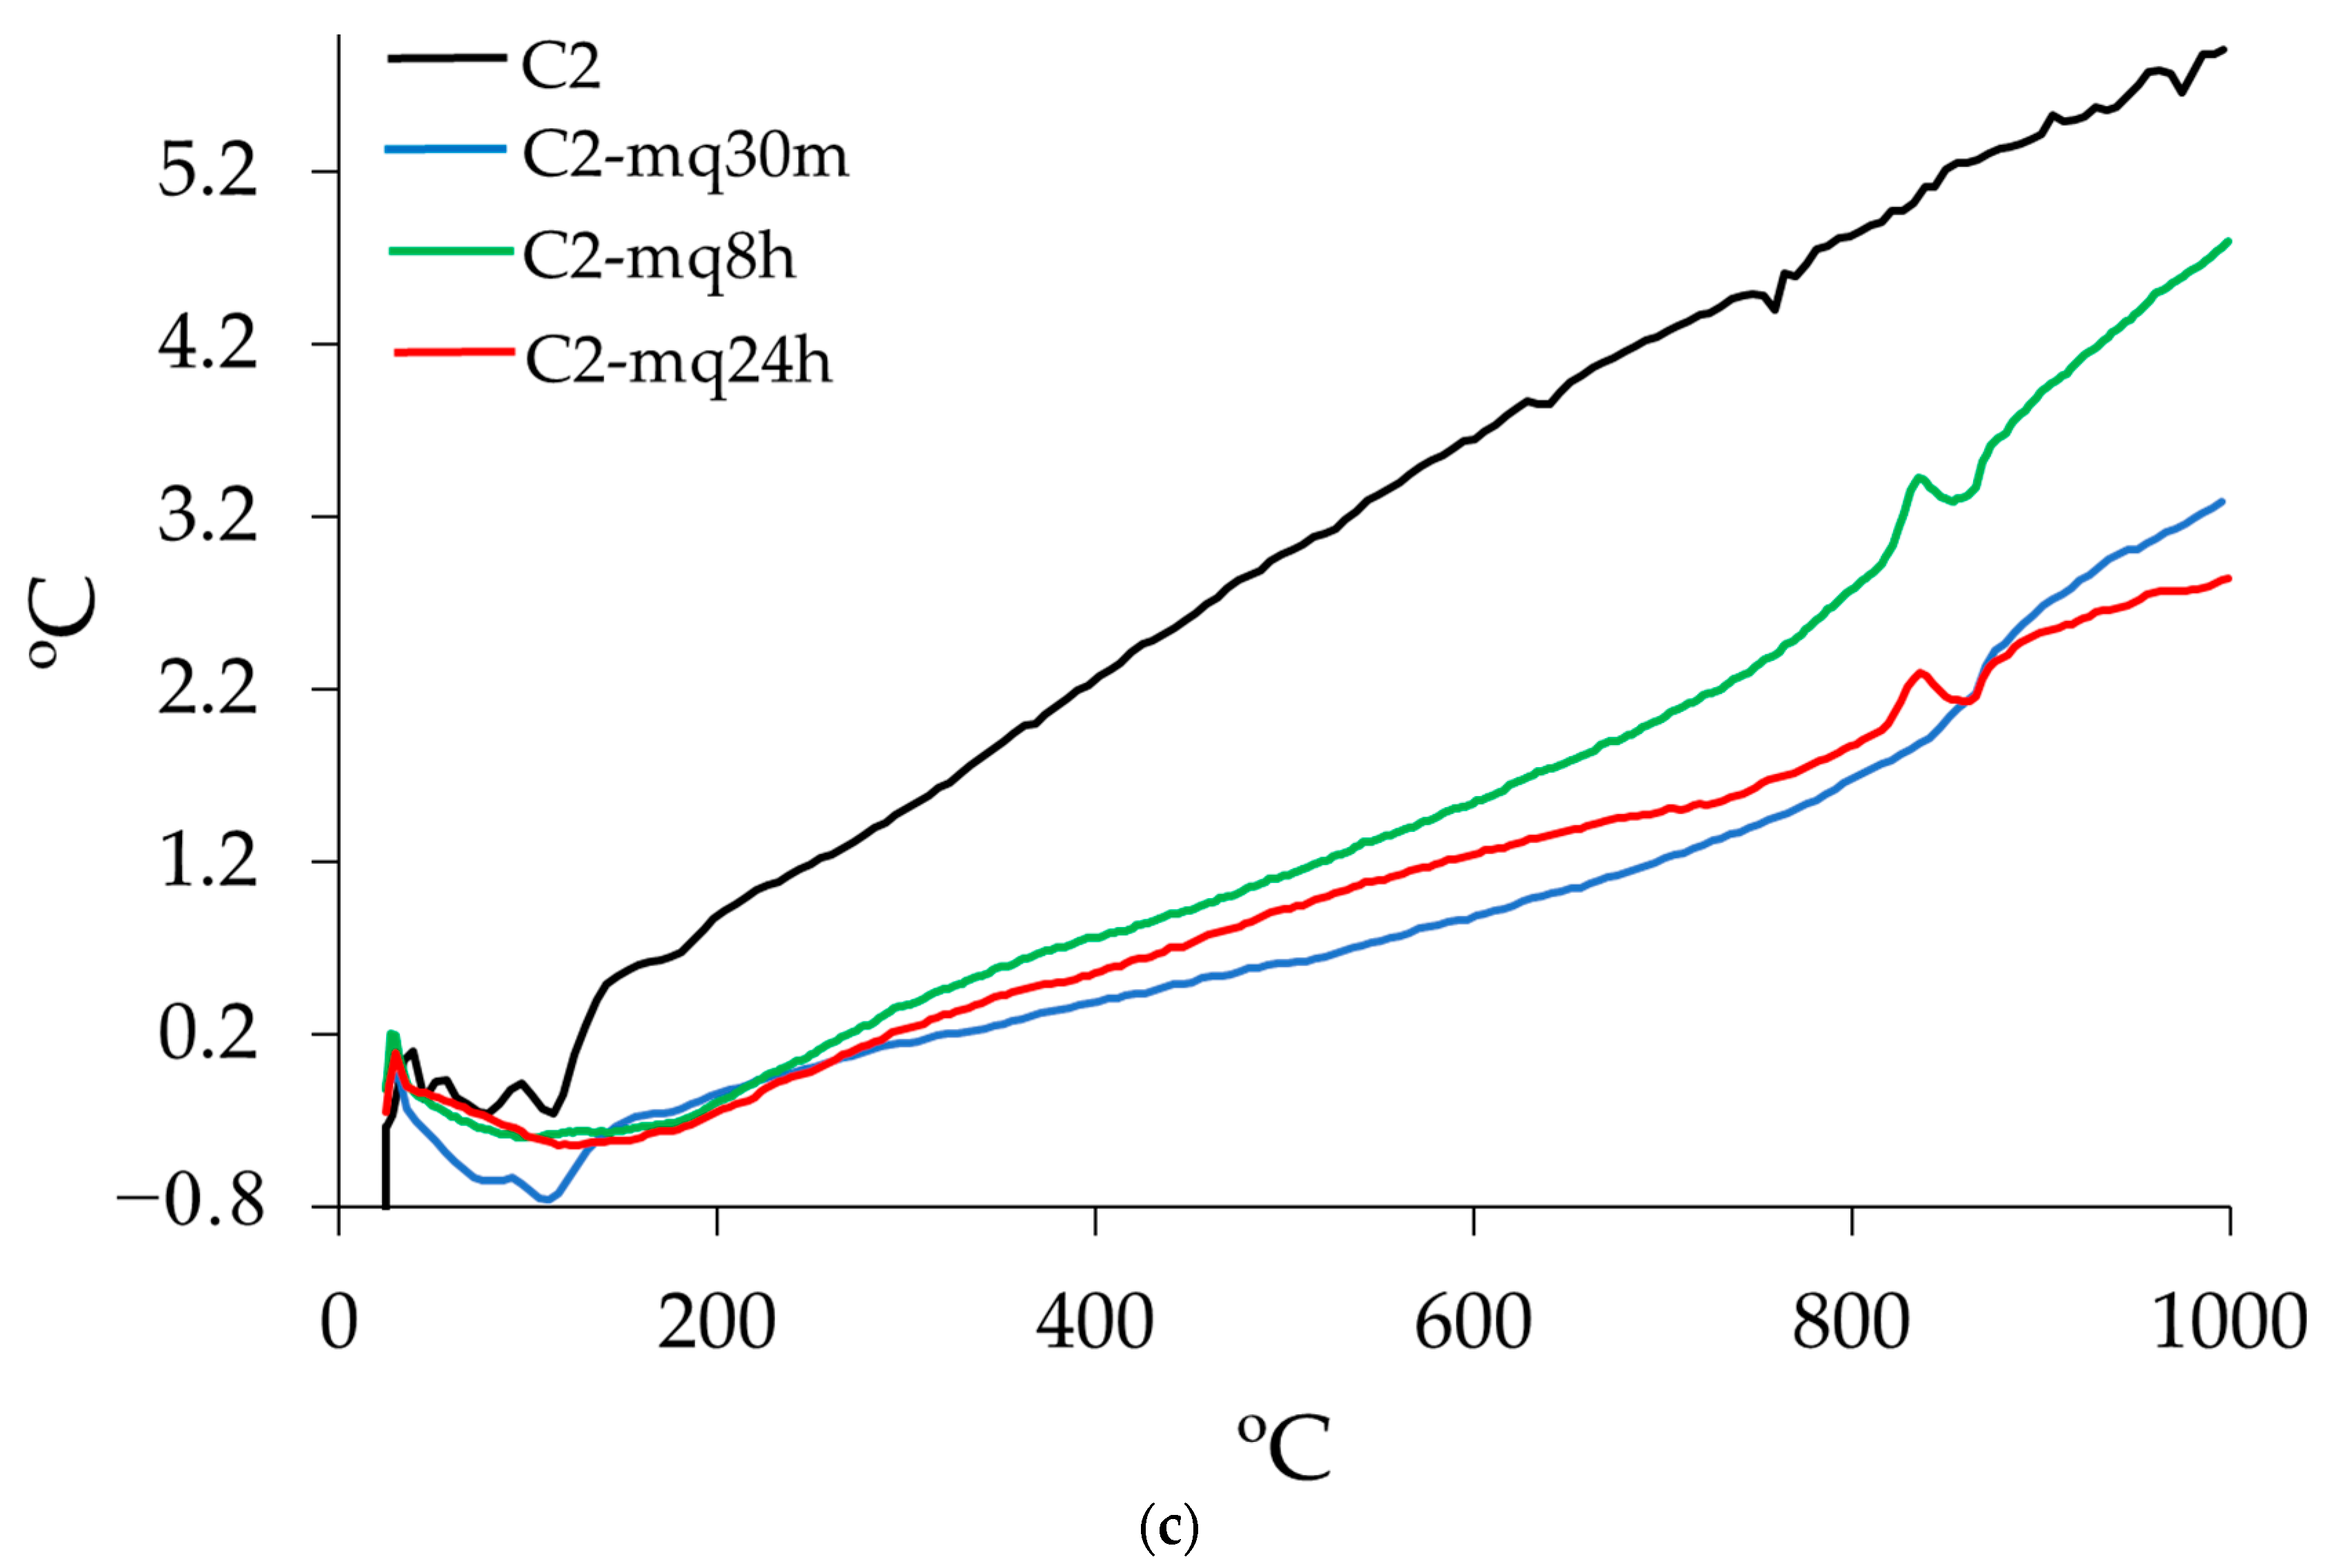
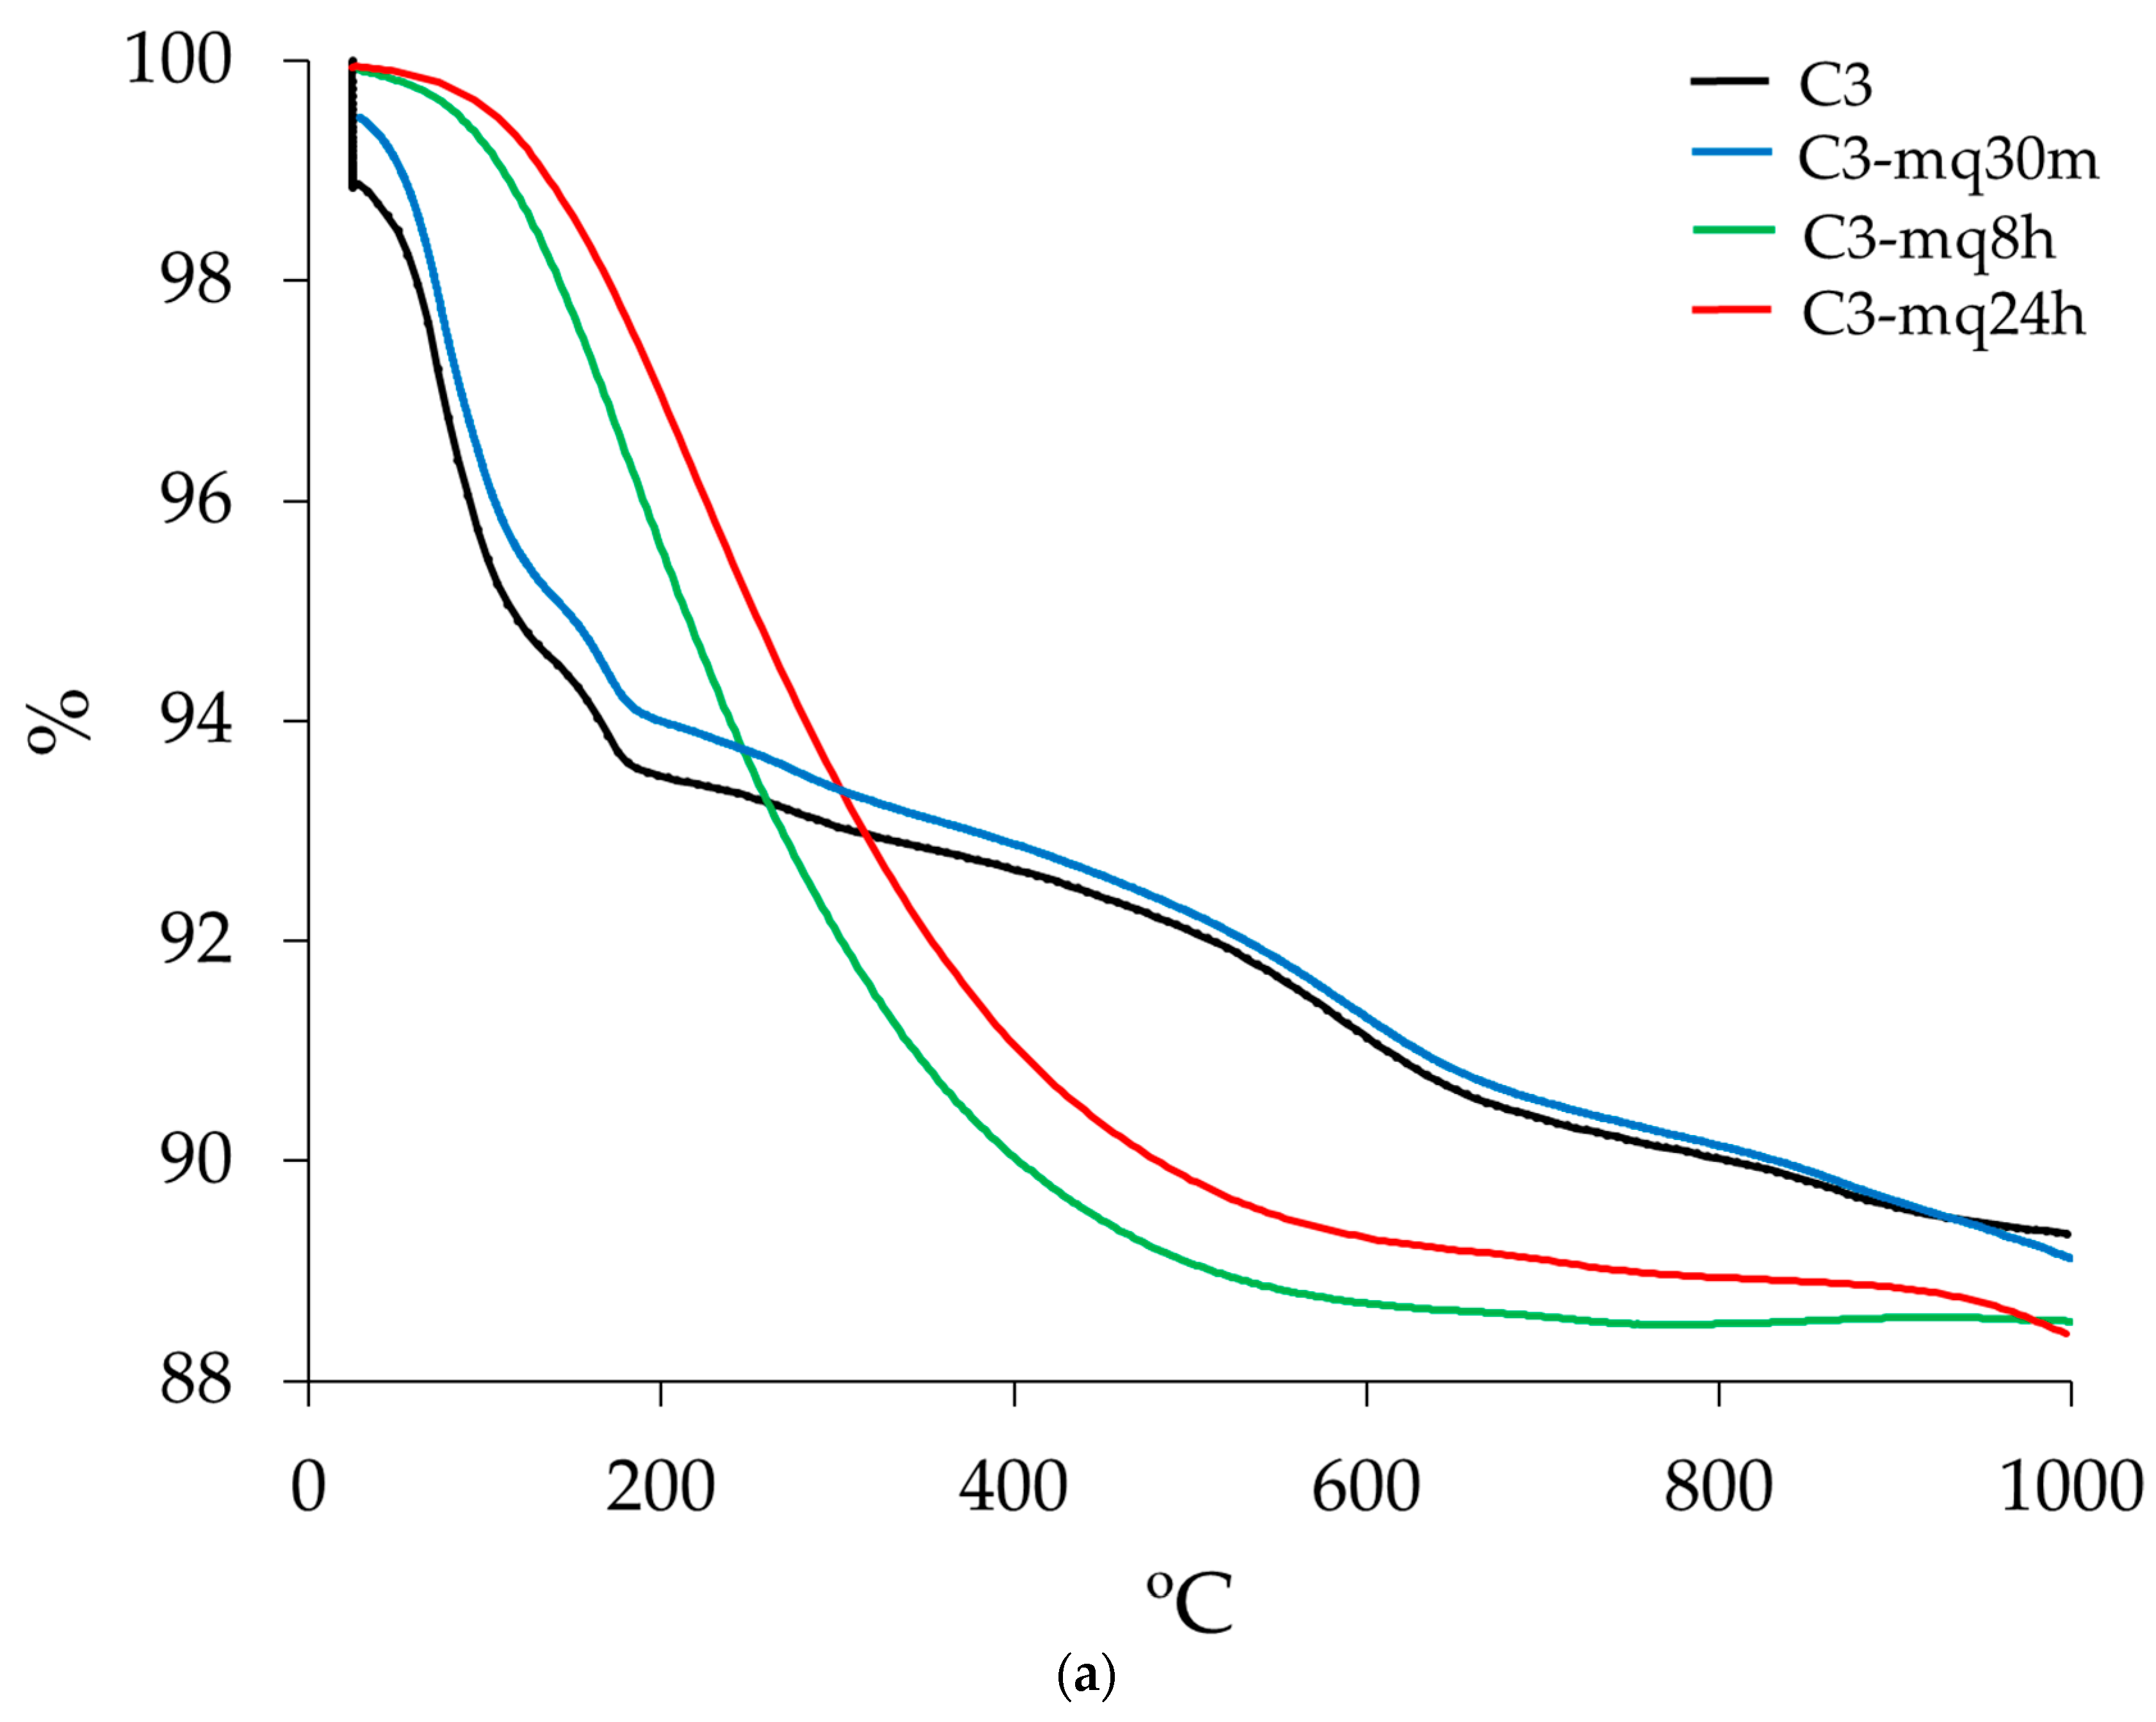
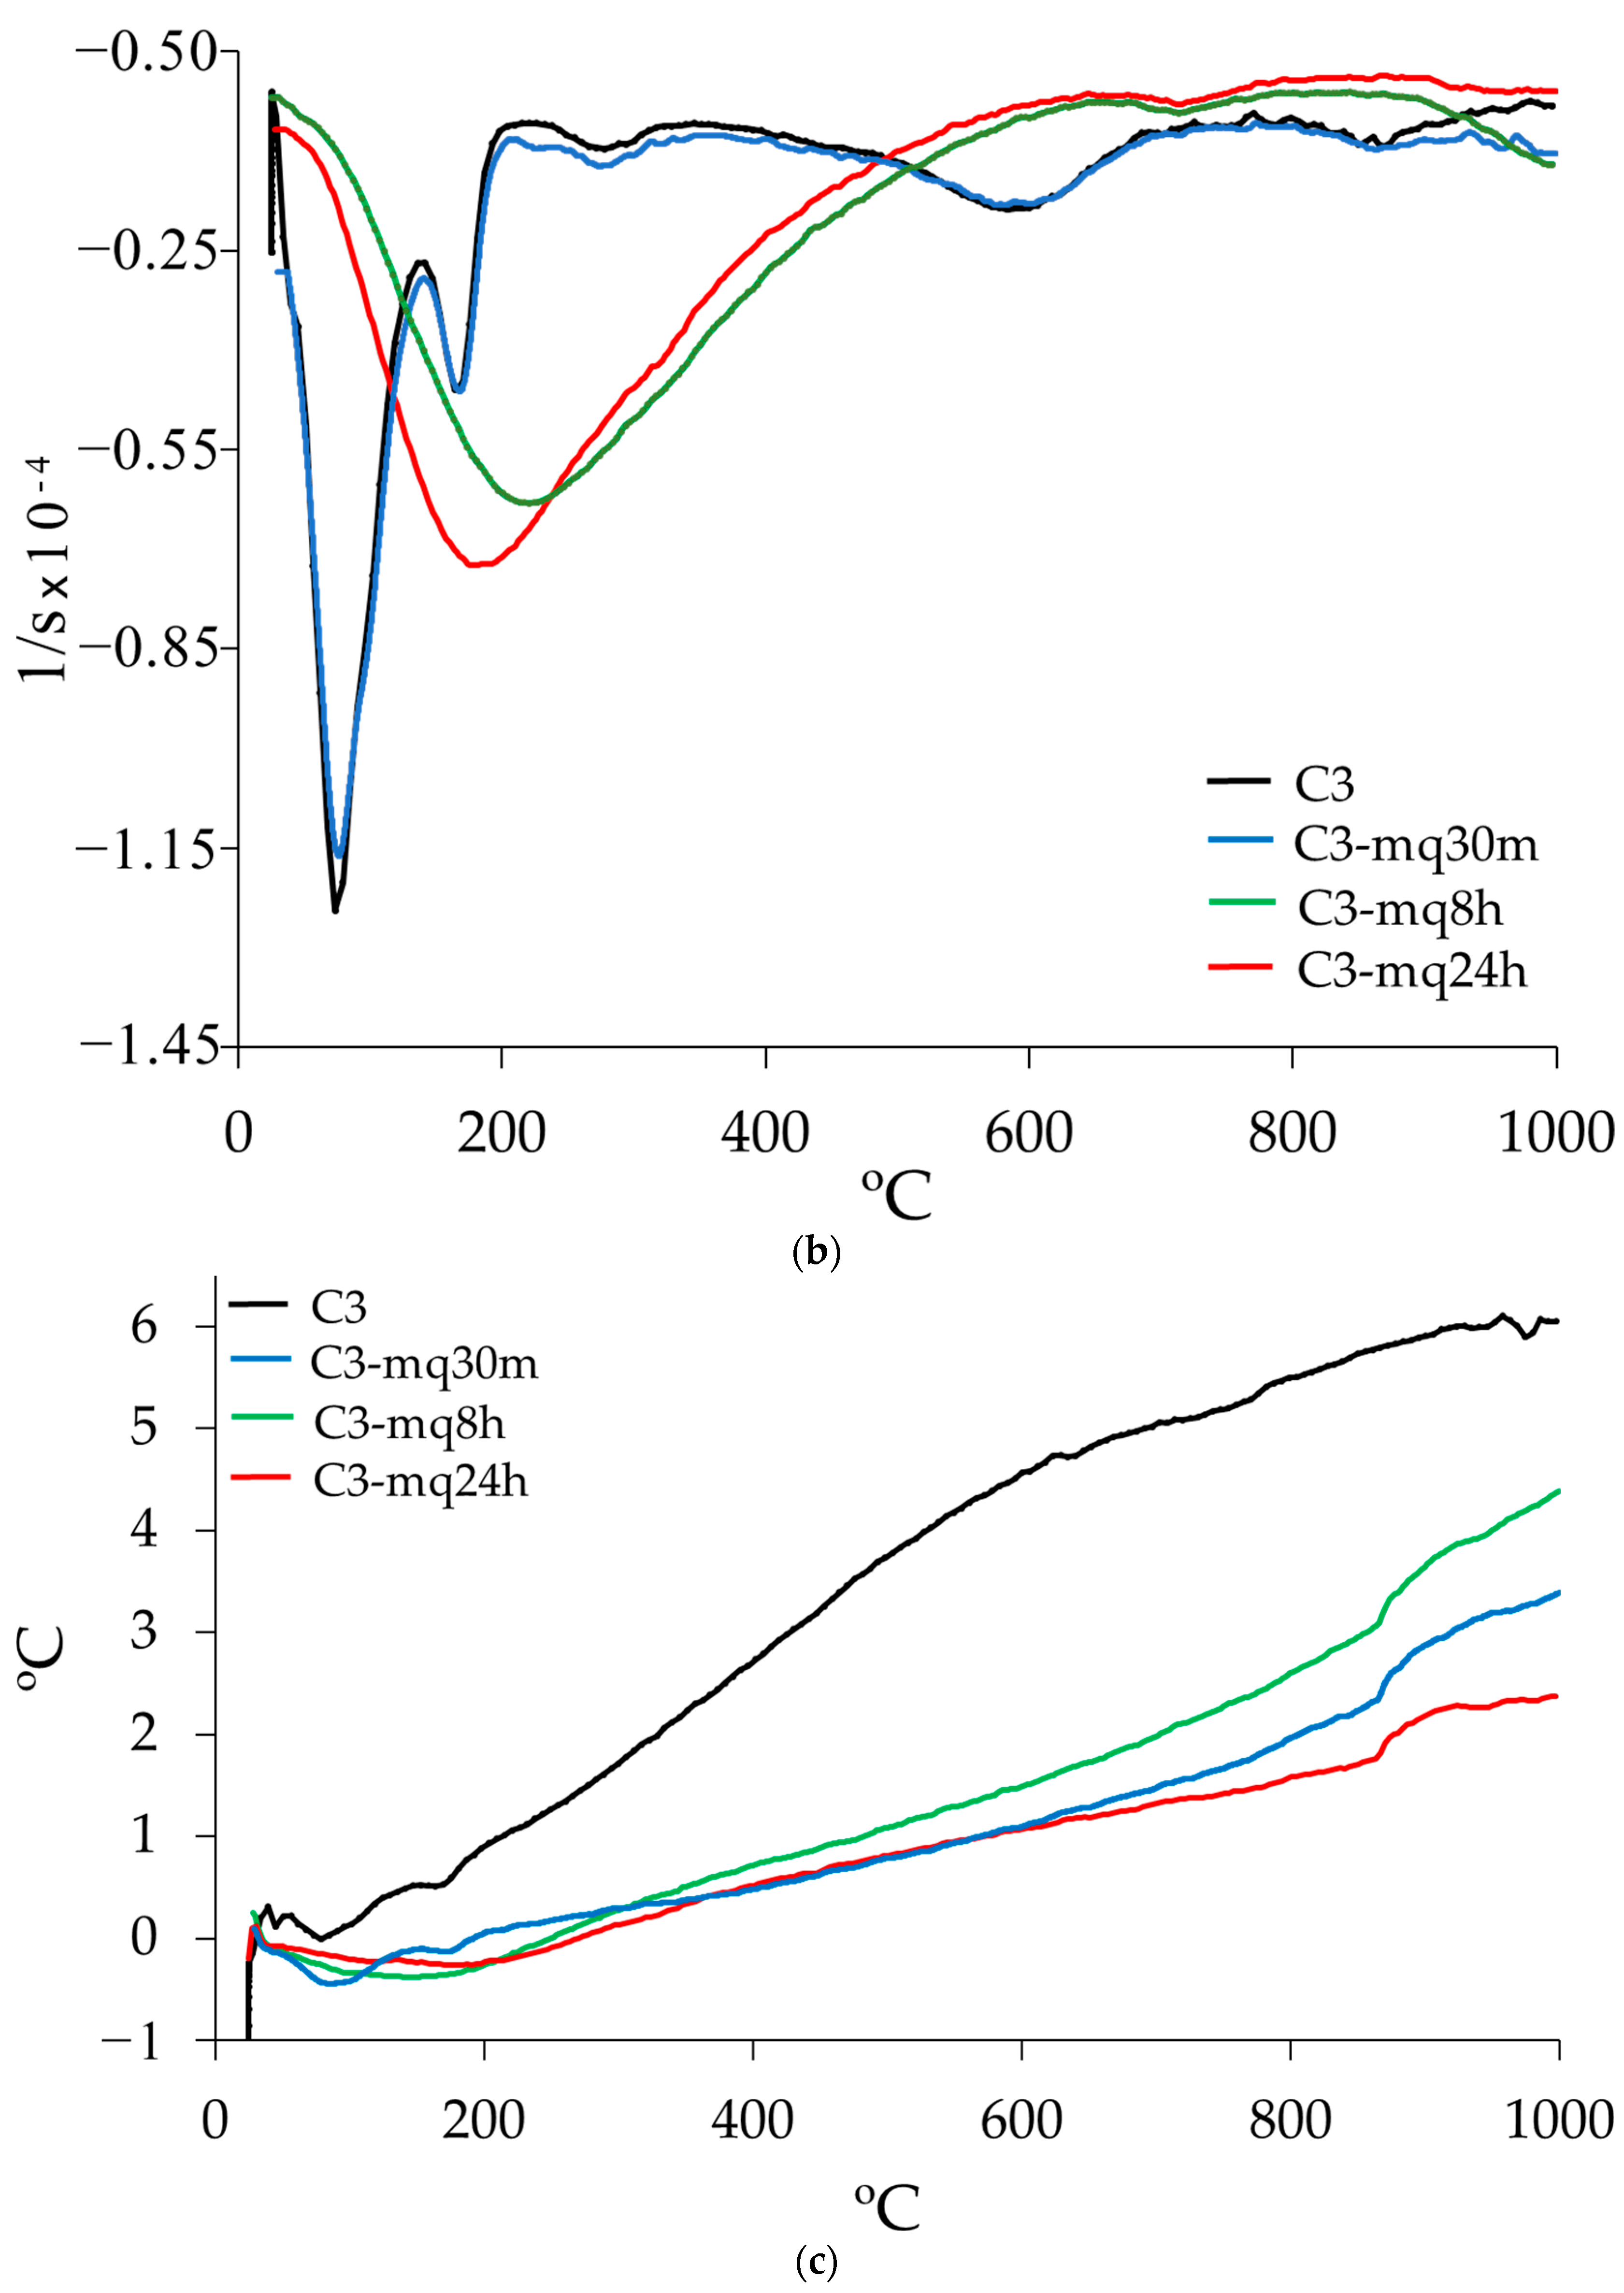
3.3. Thermogravimetric Analysis
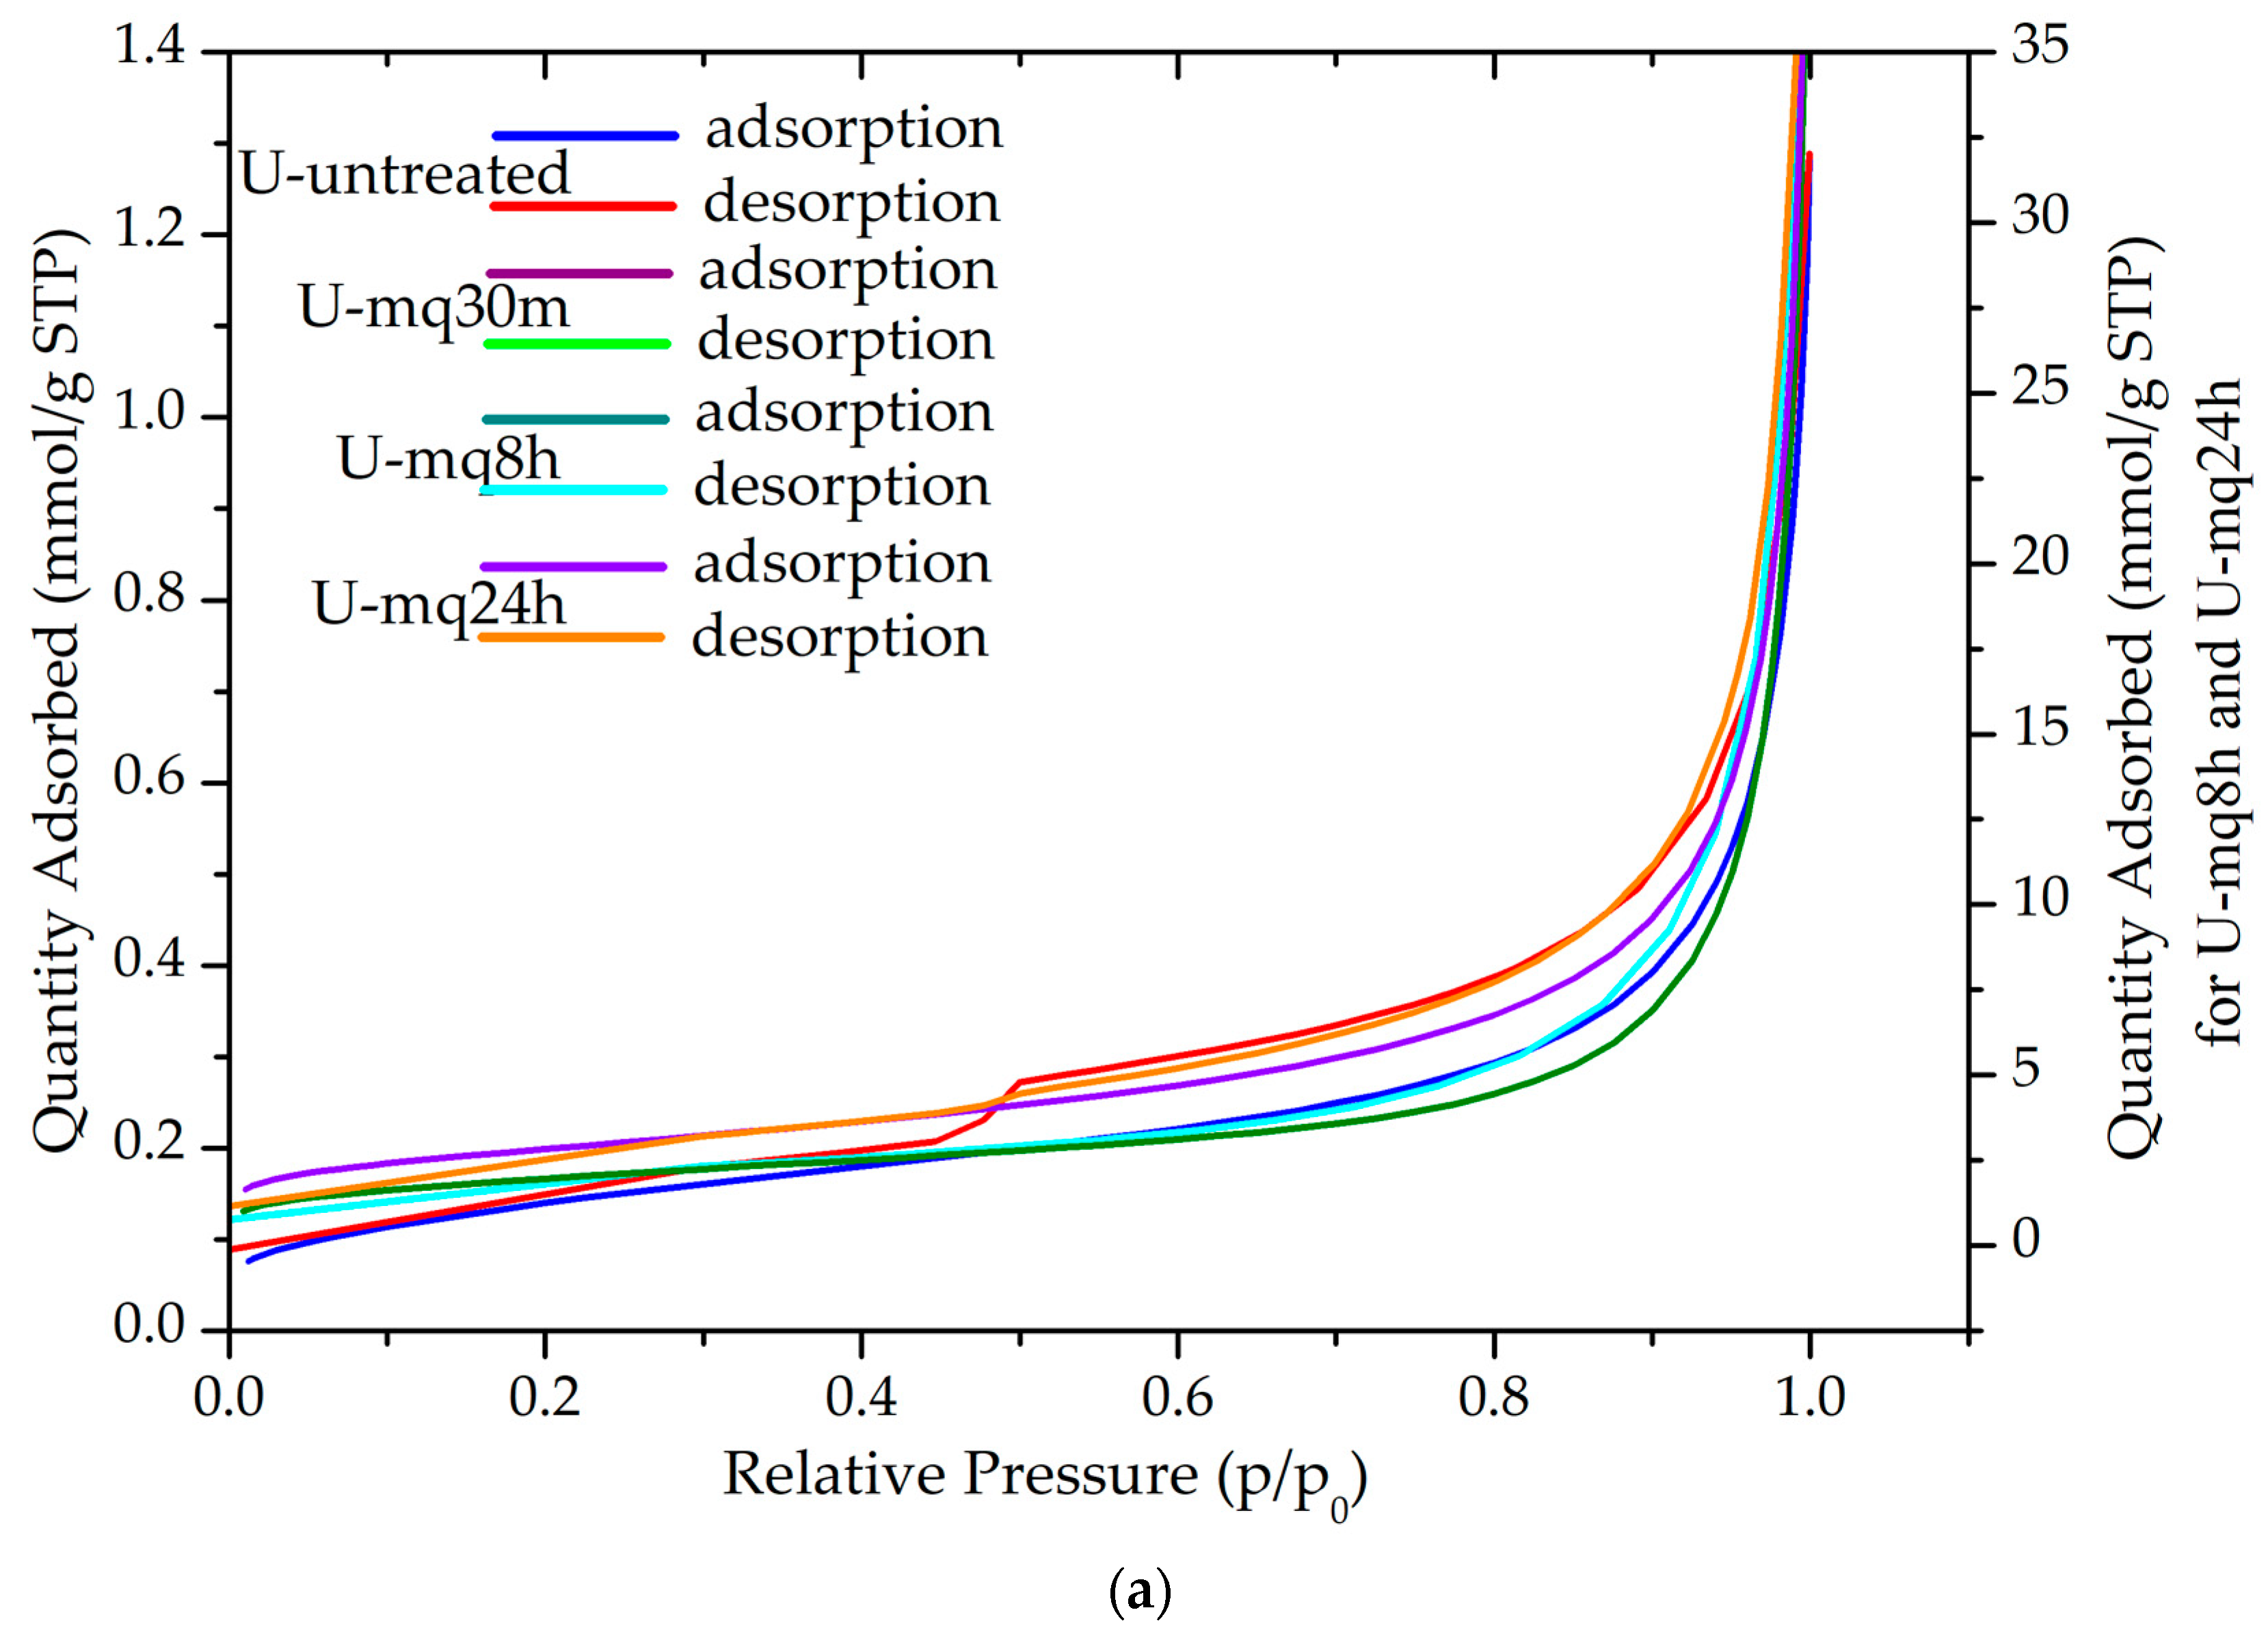
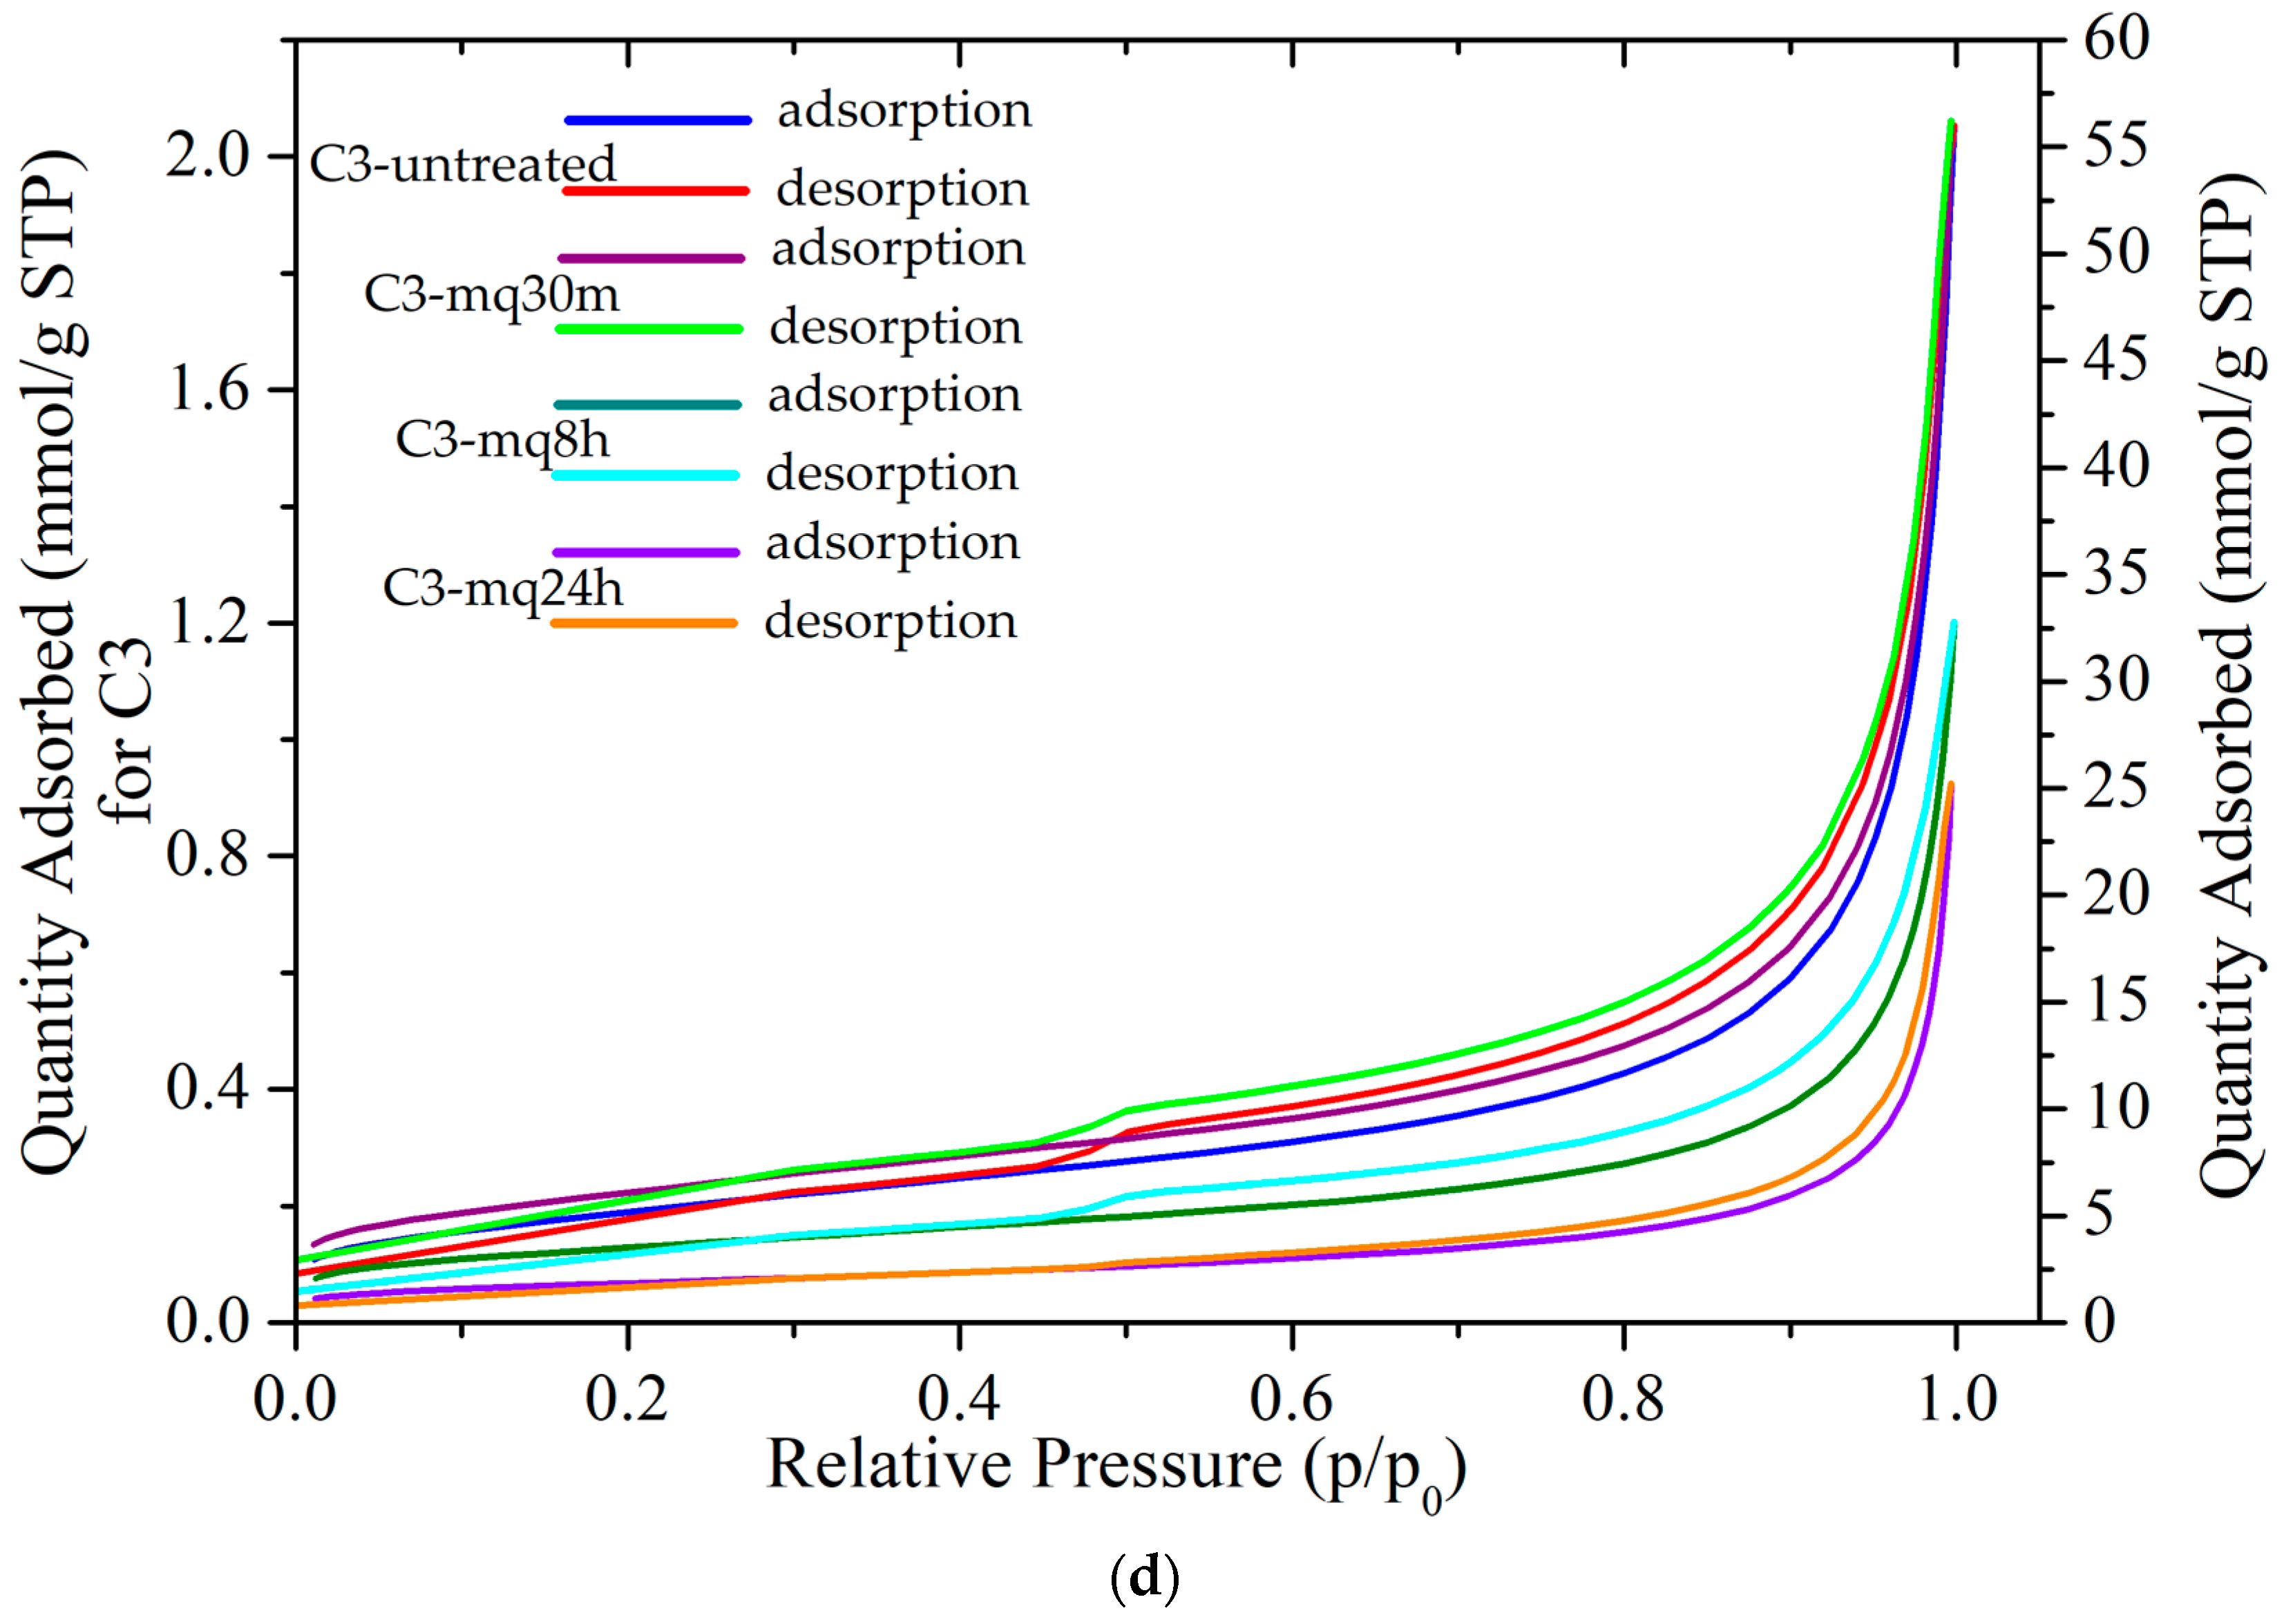
3.4. Textural Analysis (BET)
4. Discussion
5. Conclusions
Author Contributions
Funding
Data Availability Statement
Acknowledgments
Conflicts of Interest
References
- Mathieson, A.M.; Walker, G.F. Crystal structure of magnesium-vermiculite. Am. Min. 1954, 39, 231–255. [Google Scholar]
- Vali, H.; Hesse, R. Identification of vermiculite by transmission electron microscopy and x-ray diffraction. Clay Miner. 1992, 27, 185–192. [Google Scholar] [CrossRef]
- Collins, D.R.; Fitch, A.N.; Catlow, R.A. Dehydration of vermiculites and montmorillonites: A time-resolved powder neutron diffraction study. J. Mater. Chem. 1992, 8, 865–873. [Google Scholar] [CrossRef]
- Reichenbach, H.G.; Beyer, J. Dehydration and rehydration of vermiculites: IV. Arrangements of interlayer components in the 1.43 nm and 1.38 nm hydrates of Mg-vermiculite. Clay Miner. 1994, 29, 327–340. [Google Scholar]
- Reichenbach, H.G.; Beyer, J. Dehydration and rehydration of vermiculites: II. Phlogopitic Ca-vermiculite. Clay Miner. 1995, 30, 273–286. [Google Scholar]
- Reichenbach, H.G.; Beyer, J. Dehydration and rehydration of vermiculites: III. Phlogopitic Sr. and Ba-vermiculite. Clay Miner. 1997, 32, 573–586. [Google Scholar]
- Marcos, C.; Arango, Y.C.; Rodríguez, I. X-ray diffraction studies of the thermal behaviour of commercial vermiculites. Appl. Clay Sci. 2009, 42, 368–378. [Google Scholar] [CrossRef]
- Valášková, M.; Martynková, G.S. Vermiculite: Structural properties and examples of the use. In Clay Minerals in Nature-Their Characterization, Modification and Application; Valášková, M., Martynková, G.S., Eds.; IntechOpen: London, UK, 2012. [Google Scholar] [CrossRef]
- Suzuki, M.; Suzuki, I.S. Superparamagnetic behavior in a Ni vermiculite intercalation compound. Phys. Rev. B 2001, 64, 104418. [Google Scholar] [CrossRef]
- Hindman, J.R. Vermiculite. In Industrial Minerals and Rocks: Commodities, Markets, and Uses; Kogel, J.E., Trivedi, N.C., Krukowsky, S.T., Eds.; Colorado Society for Mining, Metallurgy, and Exploration: Littleton, CO, USA, 2006; pp. 1015–1027. [Google Scholar]
- Bergaya, F.; Theng, B.K.G.; Lagaly, G. Developments in Clay Science. In Handbook of Clay Science, 2nd ed.; Bergaya, F., Lagaly, G., Eds.; Elsevier: Amsterdam, The Netherlands, 2006; Volume 5. [Google Scholar]
- Klein, C.; Dutrow, B. Manual of Mineral Science, 23rd ed.; Wiley: Hoboken, NJ, USA, 2007; 716 p. [Google Scholar]
- Abollino, O.; Giacomino, A.; Malandrino, M.; Mentasti, E. Interaction of metal ions with montmorillonite and vermiculite. Appl. Clay Sci. 2008, 38, 227–236. [Google Scholar] [CrossRef]
- Zhang, K.; Xu, J.; Wang, K.Y.; Cheng, L.; Wang, J.; Liu, B. Preparation and characterization of chitosan nanocomposites with vermiculite of different modification. Polym. Degrad. Stab. 2009, 94, 2121–2127. [Google Scholar] [CrossRef]
- Midgley, H.G.; Midgley, C.M. The mineralogy of some commercial vermiculites. Clay Miner. Bull. 1960, 23, 142–150. [Google Scholar]
- Couderc, P.; Douillet, P. Les Vermiculites industrielles: Exfoliation, caractéristiques mineralogiques et chimiques. Bull. Soc. Franc. Céram. 1973, 99, 51–59. [Google Scholar]
- Hillier, S.; Marwa, E.M.M.; Rice, C.M. On the mechanism of exfoliation of “Vermiculite”. Clay Miner. 2013, 48, 563–582. [Google Scholar] [CrossRef]
- Abidi, S.; Nait-Ali, B.; Joliff, Y.; Favotto, C. Impact of perlite, vermiculite and cement on the thermal conductivity of a plaster composite material: Experimental and numerical approaches. Compos. B Eng. 2015, 68, 392–400. [Google Scholar] [CrossRef]
- Mo, K.H.; Lee, H.J.; Liu, M.Y.J.; Ling, T.-C. Incorporation of expanded vermiculite lightweight aggregate in cement mortar. Constr. Build Mater. 2018, 179, 302–306. [Google Scholar] [CrossRef]
- Alsaman, A.S.; Ibrahim, E.M.M.; Ahmed, M.S.; Askalany, A.A. Composite adsorbent materials for desalination and cooling applications: A state of the art. Int. J. Energy Res. 2022, 46, 10345–10371. [Google Scholar] [CrossRef]
- Cvejn, D.; Martausová, I.; Martaus, A.; Prech, J.; Vesely, O.; Cejka, J.; Lacny, Z.; Nedoma, J.; Martínek, R. Vermiculites catalyze unusual benzaldehyde and dioxane reactivity. Catal. Today 2021, 366, 218–226. [Google Scholar] [CrossRef]
- Ji, X.; Ge, L.; Liu, C.; Zhongmin, T.; Yufen, X.; Wei, C.; Zhouyue, L.; Gao, W.; Blake, S.; Diba, D.; et al. Capturing functional two-dimensional nano sheets from sandwich-structure vermiculite for cancer theranostics. Nat. Commun. 2021, 12, 1124. [Google Scholar] [CrossRef]
- McNaught, A.D.; Wilkinson, A. Compendium of Chemical Terminology. In IUPAC The Gold Book, 2nd ed.; Blackwell Science: New York, NY, USA, 1997. [Google Scholar]
- Baláž, P.; Achimovičová, M.; Baláž, M.; Billik, P.; Cherkezova-Zheleva, Z.; Criado, J.M.; Delogu, F.; Dutková, E.; Gaffet, E.; Gotor, F.J.; et al. Hallmarks of mechano-chemistry: From nanoparticles to technology. Chem. Soc. Rev. 2013, 42, 7571–7637. [Google Scholar] [CrossRef]
- Baláž, P. Mechanochemistry in Nanoscience and Minerals Engineering; Springer: Berlin/Heidelberg, Germany, 2008. [Google Scholar]
- Baláž, P. Extractive Metallurgy of Activated Minerals; Elsevier: Amsterdam, The Netherlands, 2000. [Google Scholar]
- Gregg, S.; Parker, T.; Stephens, M. The effect of grinding on kaolinite. Clay Miner. Bull. 1953, 2, 34–44. [Google Scholar]
- García, G.; Abrio, M.R.; Rodriguez, M.G. Effects of dry grinding on two kaolins of different degrees of crystallinity. Clay Miner. 1991, 26, 549–565. [Google Scholar] [CrossRef]
- Takahashi, H. Effects of dry grinding on kaolin minerals. I. Kaolinite. Bull. Chem. Soc. Jpn. 1959, 32, 235–245. [Google Scholar] [CrossRef]
- Takahashi, H. Effects of dry grinding on kaolin minerals. II. Kibushi-clay. Bull. Chem. Soc. Jpn. 1959, 32, 245–251. [Google Scholar] [CrossRef]
- Marcos, C. Effect of Water Immersion on Raw and Expanded Ugandan Vermiculite. Minerals 2022, 12, 23. [Google Scholar] [CrossRef]
- Marcos, C.; Lahchich, A.; Álvarez-Lloret, P. Hydrothermally treated vermiculites: Ability to support products for CO2 adsorption and geological implications. Appl. Clay Sci. 2023, 232, 106791. [Google Scholar] [CrossRef]
- Lahchich, A.; Álvarez-Lloret, P.; Leardini, F.; Marcos, C. Heat Treatment at 1000 °C under Reducing Atmosphere of Commercial Vermiculites. Minerals 2024, 14, 232. [Google Scholar] [CrossRef]
- Calle, C.d.l.; Suquet, H. Vermiculite. In Hydrous Phyllosilicates. Reviews in Mineralogy, 19; Bailey, S.W., Ed.; Mineralogical Society of America: Washington, DC, USA, 1988; pp. 455–496. [Google Scholar]
- Argüelles, A.; Leoni, M.; Blanco, J.A.; Marcos, C. Semi-ordered crystalline structure of the Santa Olalla vermiculite inferred from X-ray powder diffraction. Am. Mineral. 2010, 95, 126–134. [Google Scholar] [CrossRef]
- Thommes, M.; Kaneko, K.; Neimark, A.V.; Olivier, J.P.; Rodriguez-Reinoso, F.; Rouquerol, J.; Sing, K.S.W. Physisorption of gases, with special reference to the evaluation of surface area and pore size distribution (IUPAC Technical Report). Pure Appl. Chem. 2015, 87, 1051–1069. [Google Scholar] [CrossRef]
- Barrett, E.P.; Joyner, L.G.; Halenda, P.P. The determination of pore volume and area distributions in porous substances. I. computations from nitrogen isotherms. J. Am. Chem. Soc. 1951, 73, 373–380. [Google Scholar] [CrossRef]
- Faass, G.S. Correlation of Gas Adsorption, Mercury Intrusion, and Electron Microscopy Pore Property Data for Porous Glasses; Georgia Institute of Technology: Atlanta, GA, USA, 1981; p. 260. [Google Scholar]
- Marcos, C.; Rodríguez, I. Expansion behaviour of commercial vermiculites at 1000 °C. Appl. Clay Sci. 2010, 48, 492–498. [Google Scholar] [CrossRef]


| Untreated Samples | Mechanochemical Treatment | ||
|---|---|---|---|
| 30 Min | 8 h | 24 h | |
| U | U-mq30m | U-mq8h | U-mq24h |
| C1 | C1-mq30m | C1-mq8h | C1-mq24h |
| C2 | C2-mq30m | C2-mq8h | C2-mq24h |
| C3 | C3-mq30m | C3-mq8h | C3-mq24h |
| Samples | Mineral Phases | |||
|---|---|---|---|---|
| Untreated | Mechanochemical Treatment | |||
| 30 Min | 8 h | 24 h | ||
| U | Vermiculite (JCPDs 34-166) | Vermiculite (JCPDs 34-166), Hydrobiotite (JCPDs 10-362) | Vermiculite (JCPDs 16-613) | Vermiculite (JCPDs 16-613) |
| C1 | Vermiculite (JCPDs 34-166), Hydrobiotite (JCPDs 10-362), Phlogopite (JCPDs 10-495) | Vermiculite (JCPDs 34-166), Hydrobiotite (JCPDs 10-362), Calcite (5-586), Sekaninaite (17-525), KMg3BSi3O10(OH)2 (24-868) | Vermiculite (JCPDs 34−166), Hydrobiotite (JCPDs 10-362), Phlogopite (JCPDs 16-344), Biotite (JCPDs 42-603) | Phlogopite (JCPDs 2-53), Quartz (JCPDs 2-53), Fe3Si (JCPDs 45-1207) |
| C2 | Vermiculite (JCPDs 34-166), Biotite (JCPDs 46-1440), Hydrobiotite (JCPDs 10-358) | Vermiculite (JCPDs 5-518), Phlogopite (JCPDs 10-495), Hydrobiotite (JCPDs 10-362) | Hydrobiotite (JCPDs 10-363), Cuarzo (JCPDs 33-1161), Fe3Si (JCPDs 45−1207) | Phlogopite (JCPDs 16-344), Hydrobiotite (JCPDs 10-362), NaMgH3 (JCPDs 42-1143), Fe3Si (JCPDs 45-1207) |
| C3 | Vermiculite (JCPDs 2-21), Phlogopite (JCPDs 10-495), Hydrobiotite (JCPDs 10-362) | Vermiculite (JCPDs 2-21), Phlogopite (JCPDs 10-493), Biotite (JCPDs 42-1339) Hydrobiotite (JCPDs 10-362), Cuarzo (JCPDs 5-490), MgO4S (JCPDs 1-540) | Quartz (JCPDs 33-1161) Moganite (JCPDs 33-1161) Fe3Si (JCPDs 45-1207) | Quartz (JCPDs 3-444), Phlogopite (JCPDs 14-466), Fe3Si (JCPDs 45-1207) |
| Samples | Crystallinity (%) | |||
|---|---|---|---|---|
| Untreated | Mechanochemical Treatment | |||
| 30 Min | 8 h | 24 h | ||
| U | 66.37 | 41.09 | 3.96 | 3.47 |
| C1 | 33.25 | 27.36 | 23.13 | 6.30 |
| C2 | 55.86 | 25.71 | 5.50 | 5.11 |
| C3 | 12.43 | 12.42 | 4.70 | 3.82 |
| Sample | Length (μm) | |||
|---|---|---|---|---|
| Maximum | Minimum | Mean | Std. | |
| U-mq30m | 85.31 | 3.74 | 20.93 | 17.54 |
| C1-mq30m | 146.61 | 5.04 | 39.47 | 35.64 |
| C2-mq30m | 109.59 | 3.93 | 31.52 | 25.52 |
| C3-mq30m | 94.90 | 6.64 | 28.50 | 16.08 |
| U-mq8h | 122.74 | 5.30 | 23.83 | 24.19 |
| C1-mq8h | 123.24 | 4.61 | 24.95 | 23.81 |
| C2-mq8h | 130.01 | 4.96 | 23.48 | 23.46 |
| C3-mq8h | 44.67 | 3.74 | 12.22 | 7.77 |
| U-mq24h | 0.84 | 0.09 | 0.32 | 0.14 |
| C1-mq24h | 0.65 | 0.19 | 0.39 | 0.11 |
| C2-mq24h | 1.41 | 0.23 | 0.54 | 0.25 |
| C3-mq24h | 2.55 | 0.26 | 0.75 | 0.41 |
| Sample | SBET (m2/g) | Qm (mmol/g) | Vp (cm3) | Pore Width (nm) | C | R2 |
|---|---|---|---|---|---|---|
| U | 11.68 ± 0.1 | 0.12 | 0.003 | 40.00 | 55 | 0.9999 |
| U-mq30m | 19.33 ± 0.0 | 0.20 | 0.05 | 28.84 | 197 | 0.9999 |
| U-mq8h | 7.10 ± 0.1 | 0.07 | 0.003 | 23.06 | 90 | 0.9997 |
| U-mq24h | 10.13 ± 0.0 | 0.10 | 0.06 | 27.26 | 135 | 0.9999 |
| C1 | 17.20 ± 0.1 | 0.18 | 0.04 | 17.50 | 93 | 0.9999 |
| C1-mq30m | 24.40 ± 0.1 | 0.25 | 0.06 | 22.05 | 193 | 0.9999 |
| C1-mq8h | 31.83 ± 0.1 | 0.32 | 0.10 | 22.52 | 221 | 0.9999 |
| C1-mq24h | 9.04 ± 0.0 | 0.09 | 0.04 | 27.75 | 168 | 0.9999 |
| C2 | 15.40 ± 0.1 | 0.16 | 0.04 | 26.40 | 137 | 0.9998 |
| C2-mq30m | 26.50 ± 0.1 | 0.27 | 0.06 | 20.66 | 198 | 0.9999 |
| C2-mq8h | 5.95 ± 0.0 | 0.06 | 0.04 | 24.80 | 135 | 0.9999 |
| C2-mq24h | 12.20 ± 0.0 | 0.12 | 0.04 | 24.37 | 203 | 0.9999 |
| C3 | 15.30 ± 0.1 | 0.16 | 0.05 | 27.15 | 100 | 0.9997 |
| C3-mq30m | 21.65 ± 0.1 | 0.22 | 0.06 | 26.36 | 145 | 0.9998 |
| C3-mq8h | 12.46 ± 0.1 | 0.13 | 0.04 | 22.32 | 146 | 0.9999 |
| C3-mq24h | 6.57 ± 0.0 | 0.07 | 0.03 | 25.95 | 145 | 0.9999 |
Disclaimer/Publisher’s Note: The statements, opinions and data contained in all publications are solely those of the individual author(s) and contributor(s) and not of MDPI and/or the editor(s). MDPI and/or the editor(s) disclaim responsibility for any injury to people or property resulting from any ideas, methods, instructions or products referred to in the content. |
© 2025 by the authors. Licensee MDPI, Basel, Switzerland. This article is an open access article distributed under the terms and conditions of the Creative Commons Attribution (CC BY) license (https://creativecommons.org/licenses/by/4.0/).
Share and Cite
Marcos, C.; Reynes, J.F.; Álvarez-Lloret, P. Mechanochemical Treatments of Commercial Vermiculites. Minerals 2025, 15, 383. https://doi.org/10.3390/min15040383
Marcos C, Reynes JF, Álvarez-Lloret P. Mechanochemical Treatments of Commercial Vermiculites. Minerals. 2025; 15(4):383. https://doi.org/10.3390/min15040383
Chicago/Turabian StyleMarcos, Celia, Javier F. Reynes, and Pedro Álvarez-Lloret. 2025. "Mechanochemical Treatments of Commercial Vermiculites" Minerals 15, no. 4: 383. https://doi.org/10.3390/min15040383
APA StyleMarcos, C., Reynes, J. F., & Álvarez-Lloret, P. (2025). Mechanochemical Treatments of Commercial Vermiculites. Minerals, 15(4), 383. https://doi.org/10.3390/min15040383