1. Introduction
Grinding and grading operation is a critical link in the entire production process of the beneficiation plant, directly related to the processing capacity of beneficiation production and the quality of ground products [
1]. The feed flow rate is the most important parameter for grinding and grading operations, which has a significant impact on the indicators of subsequent concentration operations and even the economic and technical indicators of the entire beneficiation plant. Accurate detection and reasonable control of the feed flow rate are prerequisites for ensuring the safe operation of grinding and grading equipment, qualified grinding products, efficient grinding, and energy conservation and consumption reduction [
2,
3]. Therefore, the accuracy and reliability of feed flow rate detection should be ensured during the grinding process.
Electronic belt scales and nuclear belt scales are commonly used equipment for detecting the grinding feed rate in mineral processing plants [
4,
5]. These devices require regular maintenance, professional calibration, and control of the usage environment to reduce the impact of external factors on the equipment. In addition, serious tension changes in the feed and conveyor belts, belt deviations, and changes in the cross-sectional shape of materials can cause significant detection errors in these detection devices [
6,
7].
Mineral processing is an important part of the metallurgical industry, involving multiple steps such as ore crushing, grinding, flotation, and magnetic separation. Many steps in the traditional beneficiation process, such as adding reagents, adding steel balls to the mill, and detecting slurry concentration, are mainly completed manually, which results in problems such as low detection accuracy, low efficiency, labor waste, and high cost. With the continuous development of computer technology and image processing technology, they have gradually been introduced into the field of mineral processing in recent years, such as online particle size detection [
8,
9], flotation foam detection [
10,
11,
12], and ore composition analysis [
13,
14,
15], which has brought significant results and efficiency improvement for mineral processing.
In order to solve the current problems in the detection of grinding feed flow rate in mineral processing plants, this paper introduces computer technology and digital image processing technology into the detection of grinding feed flow rate, and proposes a new method for detecting the material flow rate of grinding conveyor belts based on computer technology and image processing technology. This method is not affected by factors such as belt tension and material cross-sectional shape [
16]. Image segmentation is a key step in the entire process, and only the accurate segmentation of material cross-sectional images can ensure the correct calculation of material cross-sectional area.
There are many types of image segmentation algorithms, among which the threshold segmentation algorithm is widely used in various fields due to its simplicity and good performance [
17,
18]. Traditional threshold segmentation algorithms include the inter-class variance method [
19], cross-entropy [
20,
21], and Kapur’s entropy [
22]. These algorithms have good performance for single-threshold segmentation, but for multi-threshold segmentation, the computational complexity increases sharply with the number of thresholds. The image segmentation of contrast ruler, material cross-section, and belt active roller in this paper belongs to the problem of multi-threshold segmentation. In order to reduce computational complexity and improve computational speed, this paper proposes a multilevel thresholding segmentation algorithm based on the GOOSE algorithm.
The GOOSE algorithm (GO) is a novel swarm intelligence optimization algorithm proposed by Rebwar Khalid Hamad et al. in 2024 [
23]. This algorithm is inspired by the behavioral characteristics of geese during rest and foraging and seeks the optimal solution to the problem by simulating the interaction and decision-making process in a flock of geese. The GOOSE optimization algorithm has been widely applied in various fields due to its fast convergence speed and high solution accuracy, and has achieved good application results [
24,
25,
26,
27]. However, the basic goose algorithm has the problem of easily falling into local optima. In order to further improve the convergence accuracy and speed of the GOOSE algorithm, this paper first improves the basic GOOSE algorithm, and then applies the improved GOOSE algorithm to the detection of the cross-sectional area of grinding and transportation belt materials, and finally calculates the material flow rate of the grinding conveyor belt based on the cross-sectional area.
The organization of this paper is as follows:
Section 2 gives brief explanations of the basic GOOSE algorithm. The detailed presentation of the improved GOOSE algorithm is presented in
Section 3. Subsequently, the experiments and results of the material flow detection method for grinding conveyor belts based on the improved GOOSE algorithm are presented in
Section 4 to verify the efficiency of the method. Finally, some conclusions and suggestions for future research are presented in
Section 5.
2. GOOSE Algorithm
The inspiration for the GOOSE algorithm comes from the behavioral characteristics of geese during rest and foraging. Geese gather in groups during their rest period, with one goose relying on one leg to maintain balance and occasionally lifting one leg to clamp a small stone. When the stone falls off while sleeping, it wakes them up. When the flock of geese detects any unexpected noise or activity, they will make loud calls to alert other geese in the group. This group protection mechanism has been transformed into a search strategy in algorithms, which is used to find the optimal solution to the problem, thus giving rise to the GOOSE algorithm. The GOOSE optimization algorithm mainly includes three steps: population initialization, development, and exploration process [
23].
2.1. Initialization of Goose Population
In the GOOSE algorithm, the first step is population initialization, known as matrix . The position of the goose is an . Return the search agents that go beyond the search space after the goose initializes the population. The objective function value of each agent is then determined in each iteration via standardized benchmark functions. The value of objective function of every agent in the search (each line within the grid) is measured and contrasted against the objective function value of the remaining agents (other lines) to examine Best Objective Function Value () and Best Position (). and are operations that compare the objective function value of each current row (), and during iterations, the fitness of the row before it () is given back.
In the subsequent steps, the exploration and exploitation stages are then balanced by using a condition and a random variable [
28].
2.2. Exploitation Phase
The implementation of the group protection mechanism based on the behavior of geese relies on this during the development phase [
27].
Firstly, calculate the weight
of the stone clamped by the goose’s feet, which is estimated to be between 5 and 25 g. Randomly allocate the weight of a stone for each iteration using Formula (1)
Then, calculate the time
it takes for the stone to fall to the ground using Formula (2), which is random and ranges from 1 to the number of dimensions in the current loop.
Using Formula (3), determine the time required for the sound emitted by a stone falling to the ground to propagate and be transmitted to other individuals in the group.
Next, use Formula (4) to calculate the total time required for sound to propagate and be transmitted to individual geese in multiple iterations. Then, divide the total time by 2 using Formula (5) to obtain the average time.
where
=
+
.
This algorithm uses a random variable
to balance the distribution between the exploitation and exploration stages. The value of variable
is randomly selected within the range of [0, 1]. Assuming the value of variable
is greater than 0.2 and the weight of the stone
is greater than 12 g, Formula (6) calculates the landing speed
of the stone, which is obtained by dividing the product of
and
the square root of the weight of the stone
by the gravitational acceleration of 9.81.
Calculate the distance
of sound propagation using Formula (7), which is the product of sound velocity
and propagation time
. The speed of sound is 343.2 m per second in the air [
29].
Next, calculate the distance
between the guarding goose and other geese resting or foraging using Formula (8), which is half of the sound propagation distance
.
In order to find a new position in the population, that is, to awaken individuals in the population, we need a new optimal position
, which is described by Formula (9). The formula is composed of the product of the speed of the stone falling into the ground (
), the distance between geese (
), and the square of the average time (
).
If the variables
and
are less than 12 and 0.2, respectively, then use Formula (10) to calculate the new
. This is similar to Formula (6), but further consider the effects of
and gravity
here.
In the other way, we use Formula (11) to recalculate a new position
. In Formula (11), all variables (such as the falling speed of the stone, the distance between geese, the average time, and the coefficient
) are multiplied sequentially, and the coefficient
is used to balance the exploration and exploitation stages, ensuring that the GOOSE algorithm can conduct both extensive exploration and in-depth mining during the search process.
During the exploitation phase, determine the new position using Formulas (9) and (11). The specific formula to be used is determined by the values of variables and .
2.3. Exploration Phase
In the exploration stage, geese are randomly awakened from the currently discovered best position to regulate the behavior of random awakening or protecting individuals. If the goose does not carry stones with its feet, individuals in the flock will be randomly awakened. Once one of the geese wakes up, they will start protecting all individuals in the flock. As is obvious from what we have already mentioned in the previous sections, if the value of the variable is smaller than 0.5, then these equations are applied, such as Equations (3) and (4). Coupled with checking that the value of minimum time is greater than the total time , the minimum time is assigned as the total time.
The value of variable
ranges from 2 to 0, and its value significantly decreases with each iteration in the loop. Its role is mainly reflected in the exploration and exploitation process of the algorithm, by adjusting the resolution and search speed of the search space to quickly and accurately find the optimal solution. Equation (12) is used to improve the results of new
values in the search space.
where
is the number of iterations that can be made. By adjusting the direction of the search phase towards the direction most likely to be the optimal solution, two parameters
and
play an important role in the calculation.
It is necessary to ensure that geese explore individuals in the search space in a random manner. In addition, both
and
variables are used to improve the search performance of the GOOSE algorithm. In Equation (13),
and
are randomly multiplied and then added to the optimal position in the search space.
where
is the number of problem dimensions and
is the
or best position we found in the search space.
In summary, the GOOSE algorithm starts with randomly generating populations. In the first iteration, it checks the values in the population and resets the values outside the boundary before restoring them to within the boundary. In addition, the objective function is used to determine the optimal values and positions within the search boundary.
To control the exploitation and exploration phases, random variable with randomly selected values were used. If the value of is greater than or equal to 0.5, it enters the exploitation phase. In this case, there are also two random variables, such as and the weight of the stone . If is greater than 0.2 and the weight of the stone is greater than or equal to 12, then Equations (1)–(9) apply. On the other hand, if is less than or equal to 0.2 and the weight of the stone is less than 12, Equations (1)–(5), (7), (8), (10), and (11) apply. When is less than 0.5, enter the exploration phase. For this purpose, variables , and were used. In this case, apply Equation (3) in sequence.
3. Improved GOOSE Algorithm
The GOOSE algorithm, as a new type of metaheuristic algorithm, has the advantages of fast convergence and high accuracy. However, it may fall into local optima during the search process, especially in complex multi-modal function optimization problems, which limits the algorithm’s global search ability and may result in the inability to find the global optimum. In addition, while pursuing fast convergence, some search accuracy may be sacrificed. In order to improve the performance of the basic GOOSE algorithm, this paper proposes two improvement strategies based on the initialization of the intermediate population and the updating of alpha parameters. One is to use a reverse strategy to initialize the goose population, and the other is to improve the update formula of the parameter alpha.
The reverse learning strategy [
30,
31] is to reverse learn the positions of individuals with poor fitness in the population, thereby generating new individuals to increase the diversity of the population and improve the global search ability of the algorithm. The specific steps of the reverse learning strategy are as follows.
Firstly, generate initialization by generating the position
of the initial population, as shown in Equation (14).
where
is the maximum value of the population,
is minimum value, and
generates a random function within a range of [0, 1] random numbers.
Next, generate the reverse population
of the initial population
according to Equation (15).
Finally, the reverse population is merged with the initial population to form a new population , and based on the objective function, the first populations are selected as the final initialization population for the GOOSE algorithm.
In the iterative process of the GOOSE algorithm, introducing a nonlinear descent factor can dynamically adjust the resolution and search speed of the search space. The nonlinear descent factor is usually a function that gradually decreases with the increase in iteration times, which can enable the algorithm to have a larger search range in the early stage of iteration, so as to quickly find the approximate position of the global optimal solution. In the later stages of iteration, the search scope gradually narrows down in order to finely search and find the global optimal solution. This strategy can improve the search efficiency and solution accuracy of the algorithm.
In the basic GOOSE algorithm, the initial value of
is 2. As the number of iterations increases, its value gradually decreases and eventually decreases to 0, as shown in Equation (12). In order to improve the convergence speed and accuracy of the GOOSE algorithm, this paper proposes a new
update strategy, as shown in Equation (16).
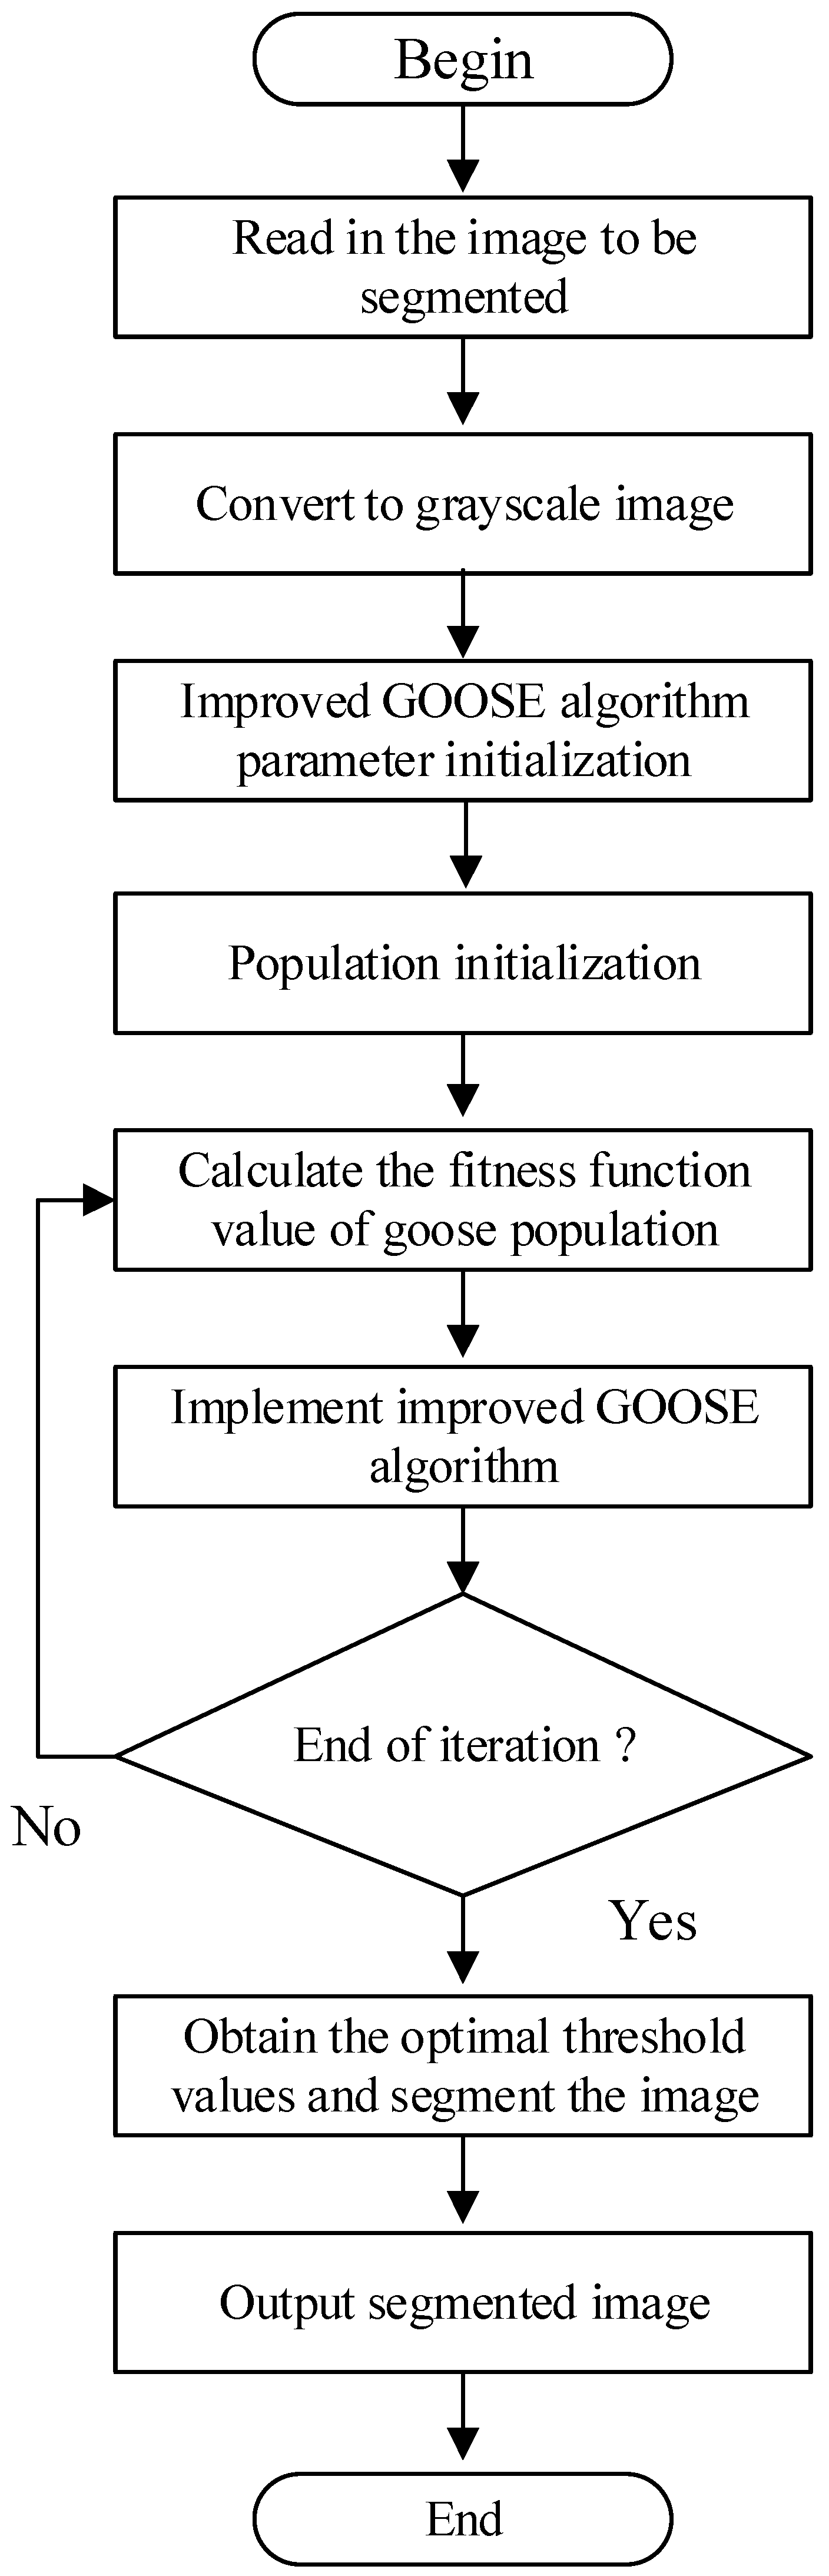
In the experimental section, this paper will use the improved GOOSE algorithm to perform multilevel thresholding segmentation on material cross-sectional images, and detect material flow based on segmentation. The entire segmentation process is shown in
Figure 1. When using optimization algorithms for multilevel thresholding segmentation of images, Kapur’s entropy is a commonly used fitness function due to its good performance [
21,
32,
33]. Therefore, in order to search for the optimal threshold, the maximum Kapur’s entropy method is used as the fitness function value in
Figure 1.
4. Experiments and Results
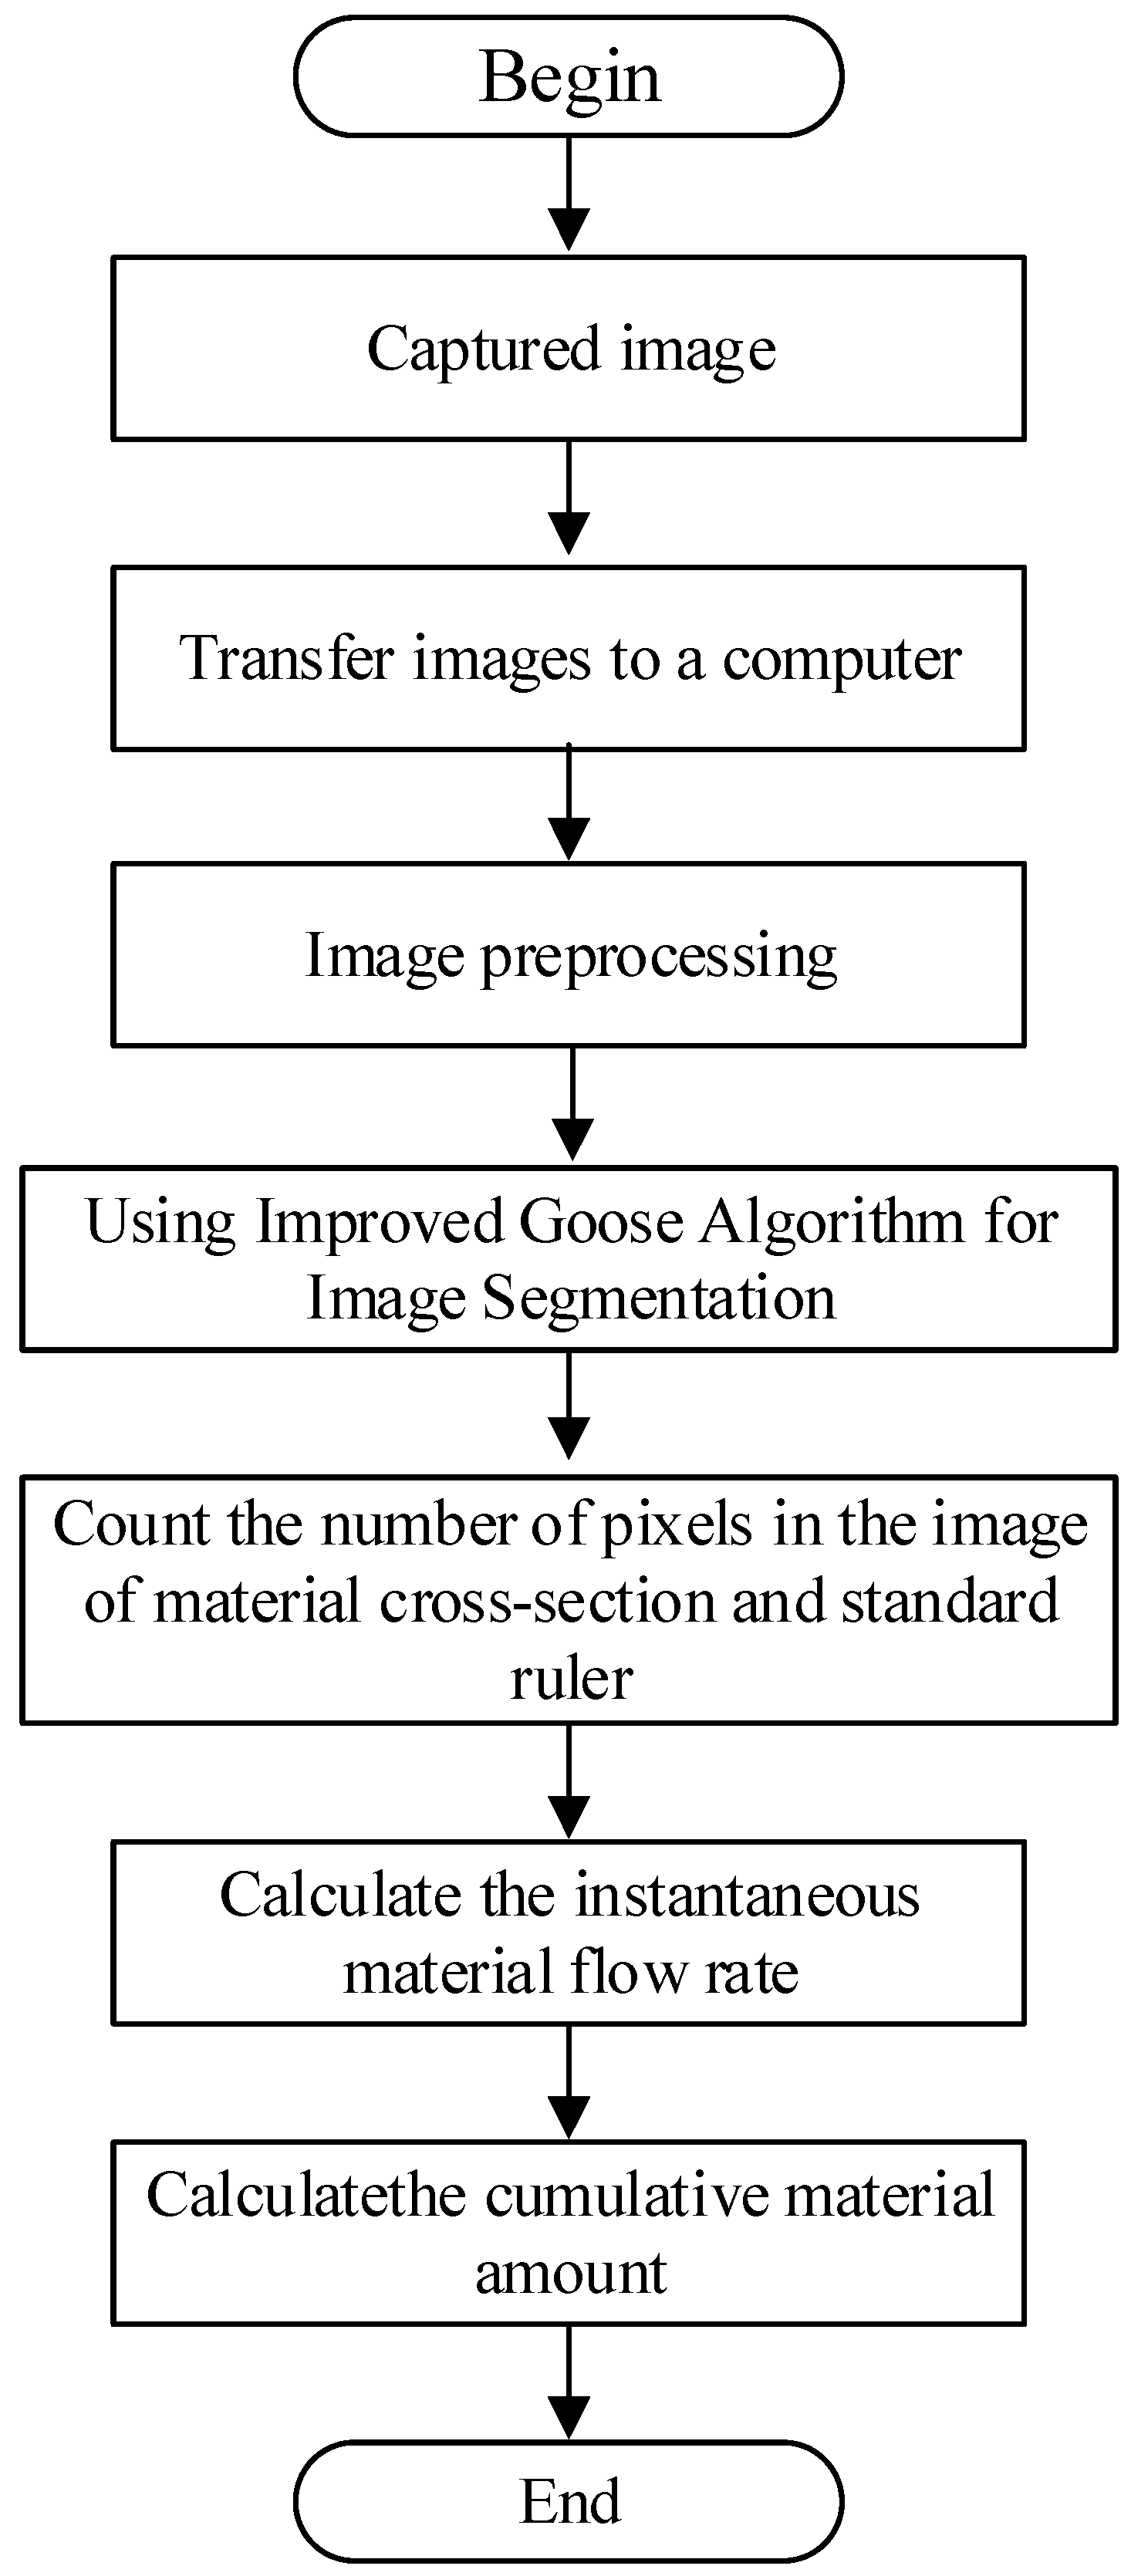
This paper proposes a material flow detection method for grinding and transportation belts based on an improved GOOSE algorithm. The basic process of this method is to first place a camera at the front end of the grinding and transportation belt, and a fixed size contrast ruler is placed above the conveyor belt. The camera captures images containing the contrast ruler, material cross-section, and active roller of the belt. Then, the improved GOOSE algorithm is used to perform threshold segmentation on the images to obtain the images of the contrast ruler and material cross-section. The number of pixels in the contrast ruler and material cross-section images is counted, and the area of the material cross-section is accurately calculated based on the number of pixels and the known size of the contrast ruler. Finally, the instantaneous material flow rate is calculated using mathematical formulas based on the material cross-section area, belt speed, and material packing density. The instantaneous material flow rate is then calculated using the instantaneous material flow rate. The flowchart of the material flow detection method for grinding conveyor belts proposed in this paper is shown in
Figure 2.
This section mainly introduces the experimental process and results. In the experiment, we first use a camera placed in front of the grinding conveyor belt to capture images including material cross-sections and standard scales and transfer the captured images to a computer. Then, we preprocess the image through filtering and contrast enhancement, and use an improved GOOSE algorithm to segment the images, which was developed using Python version 3.12, and count the number of pixels in the material cross-section and standard ruler images. Since the area size of the standard ruler is fixed, Equation (17) can be used to accurately calculate the area of the material cross-section.
where
is the number of pixels in the material cross-section,
is the standard size area, and
is the number of pixels in the standard size.
Then, use Equation (18) to calculate the instantaneous material flow rate, and finally obtain the cumulative material amount through Equation (19).
where
is the sampling period,
is the belt speed,
is the material packing density,
is the instantaneous material flow rate,
is the cumulative material flow rate, and
is the number of sampling periods. The unit of material cross-sectional area
is square meters (m
2), the unit of belt speed
is meters per second (m/s), the unit of material packing density
is kilograms per cubic meter (kg/m
3), and the unit of instantaneous material flow rate
is kilogram per second (kg/s).
4.1. Performance Testing of the Improved GOOSE Algorithm
In the material flow method proposed in this article for grinding conveyor belts, the segmentation algorithm is very important. The accuracy of segmentation determines the correctness of subsequent material flow detection. In order to verify the performance of the improved GOOSE algorithm proposed in this article, in this section, we will compare the performance of the improved GOOSE algorithm with the basic GOOSE algorithm (GO). To compare the performance of the two, we used two standard test functions
and
with dimensions of 30, where the mathematical expressions of the basic test functions are shown in
Table 1. Higher dimensions of standard test functions can better validate the performance of optimization algorithms.
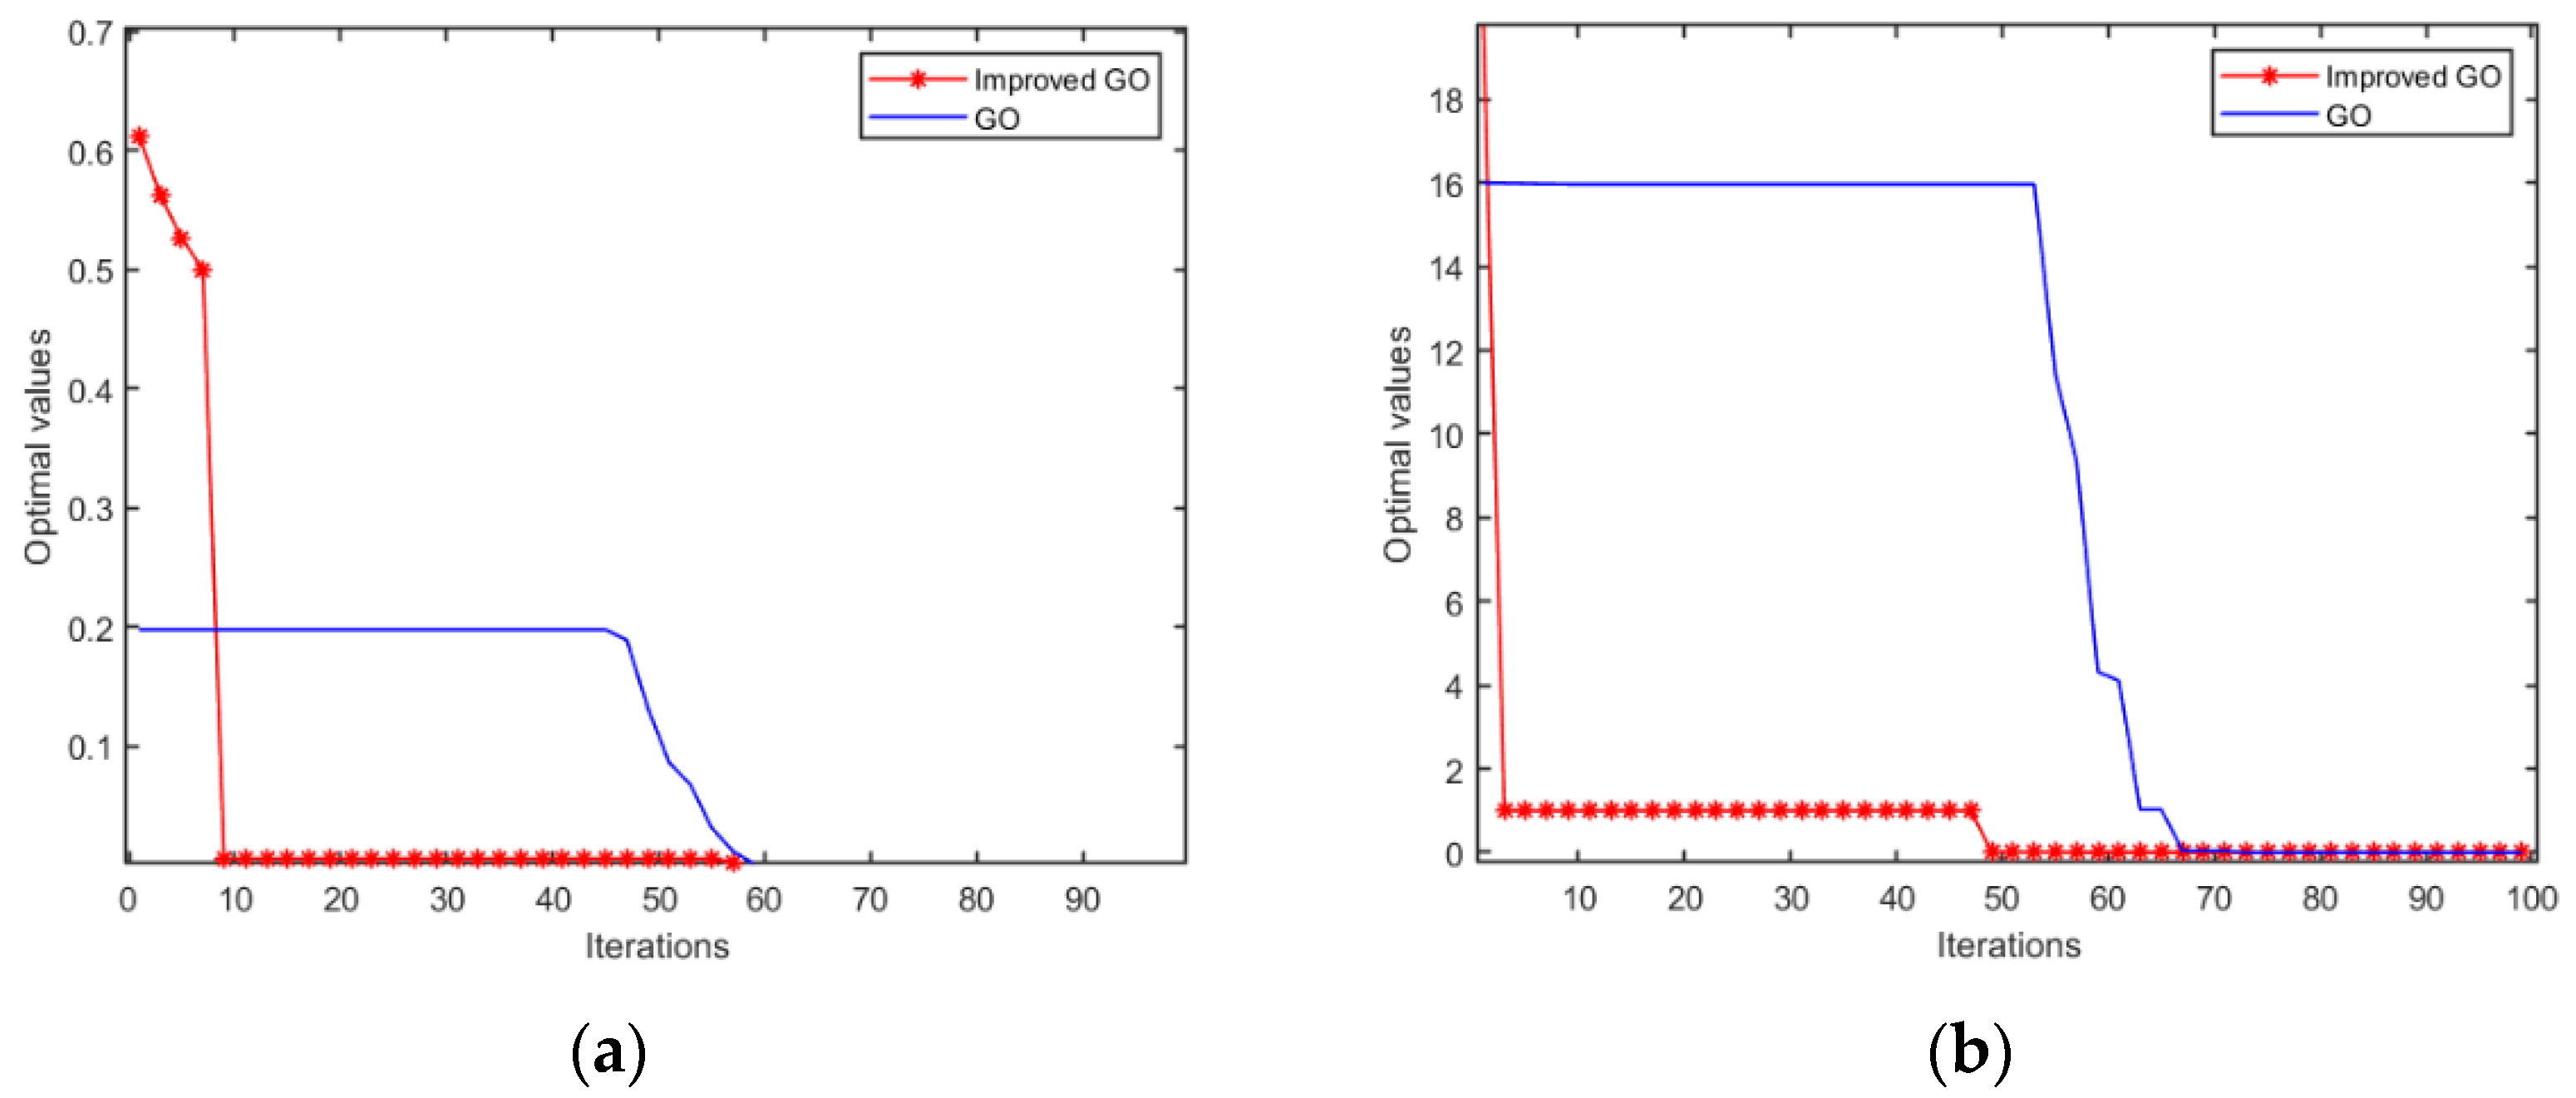
In this experiment, the population size is set to 50 and the maximum number of iterations is 100. Then, the basic GOOSE algorithm and the improved GOOSE algorithm are used to optimize the test functions
and
. The experimental results are shown in
Figure 3. From
Figure 3, it can be seen that, in the process of searching for the optimal value, the improved GOOSE algorithm requires fewer iterations than the basic GOOSE algorithm. For the
function, the improved GOOSE algorithm only needs 10 iterations to search for the optimal value, while the GOOSE algorithm requires about 60 iterations to search for the optimal value. For the
function, the basic GOOSE algorithm requires approximately 70 iterations, while the improved GOOSE algorithm only requires 50 iterations.
Therefore, it can be seen that the improved GOOSE algorithm has a faster convergence speed than the basic GOOSE algorithm, and can search for the optimal value in a shorter time, resulting in better performance.
4.2. Improved GOOSE Algorithm for Material Flow Detection Results
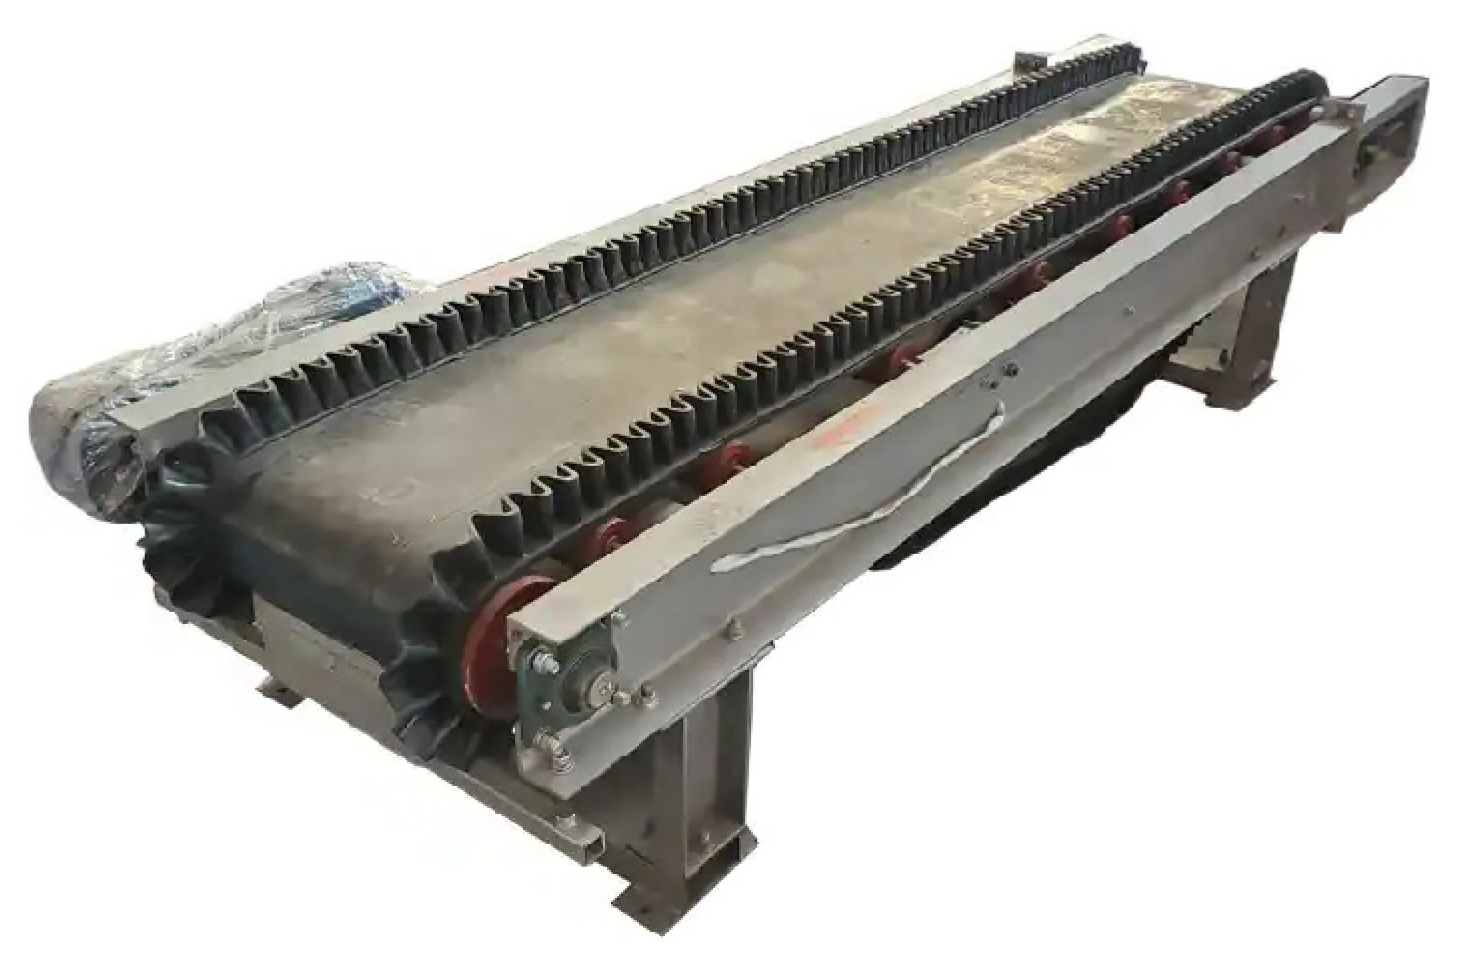
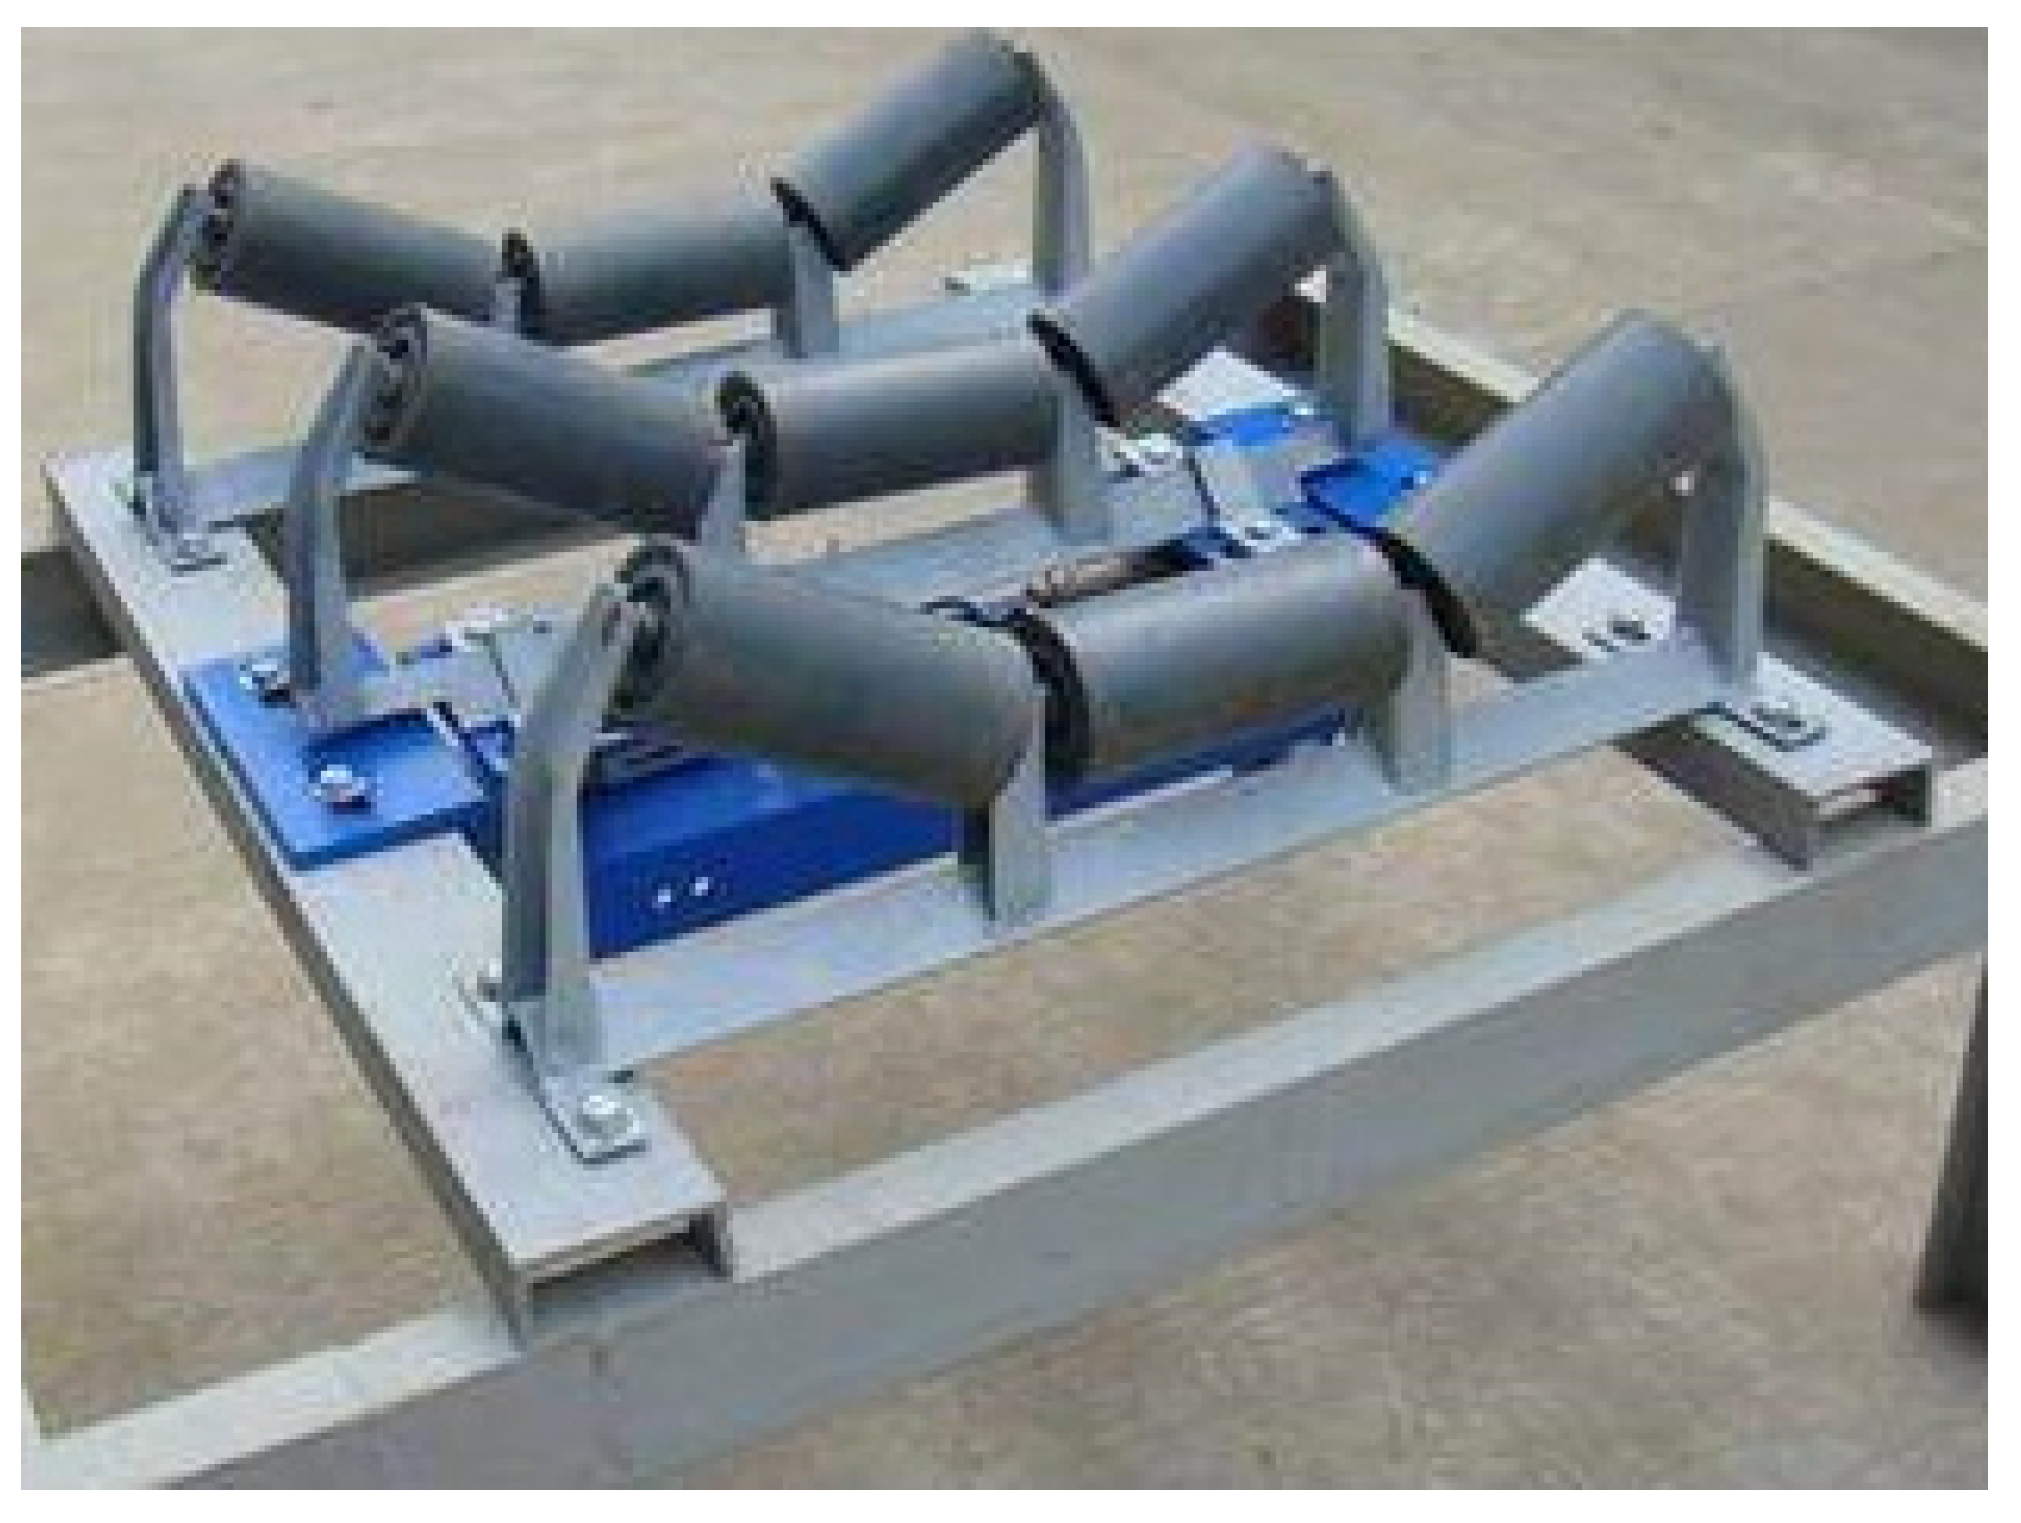
In order to verify the effectiveness and accuracy of the material flow detection method based on the improved GOOSE algorithm for grinding and transportation belts proposed in this paper, Python software is used to program the algorithm. The population size of the improved GOOSE algorithm is set to 30, and the maximum number of iterations is 100. The width of the material conveyor belt used in the experiment is 0.5 m, as shown in
Figure 4. The standard ruler, as shown in
Figure 5b, has a cross-sectional area of 0.3 square meters and it is made of gold stainless steel material.
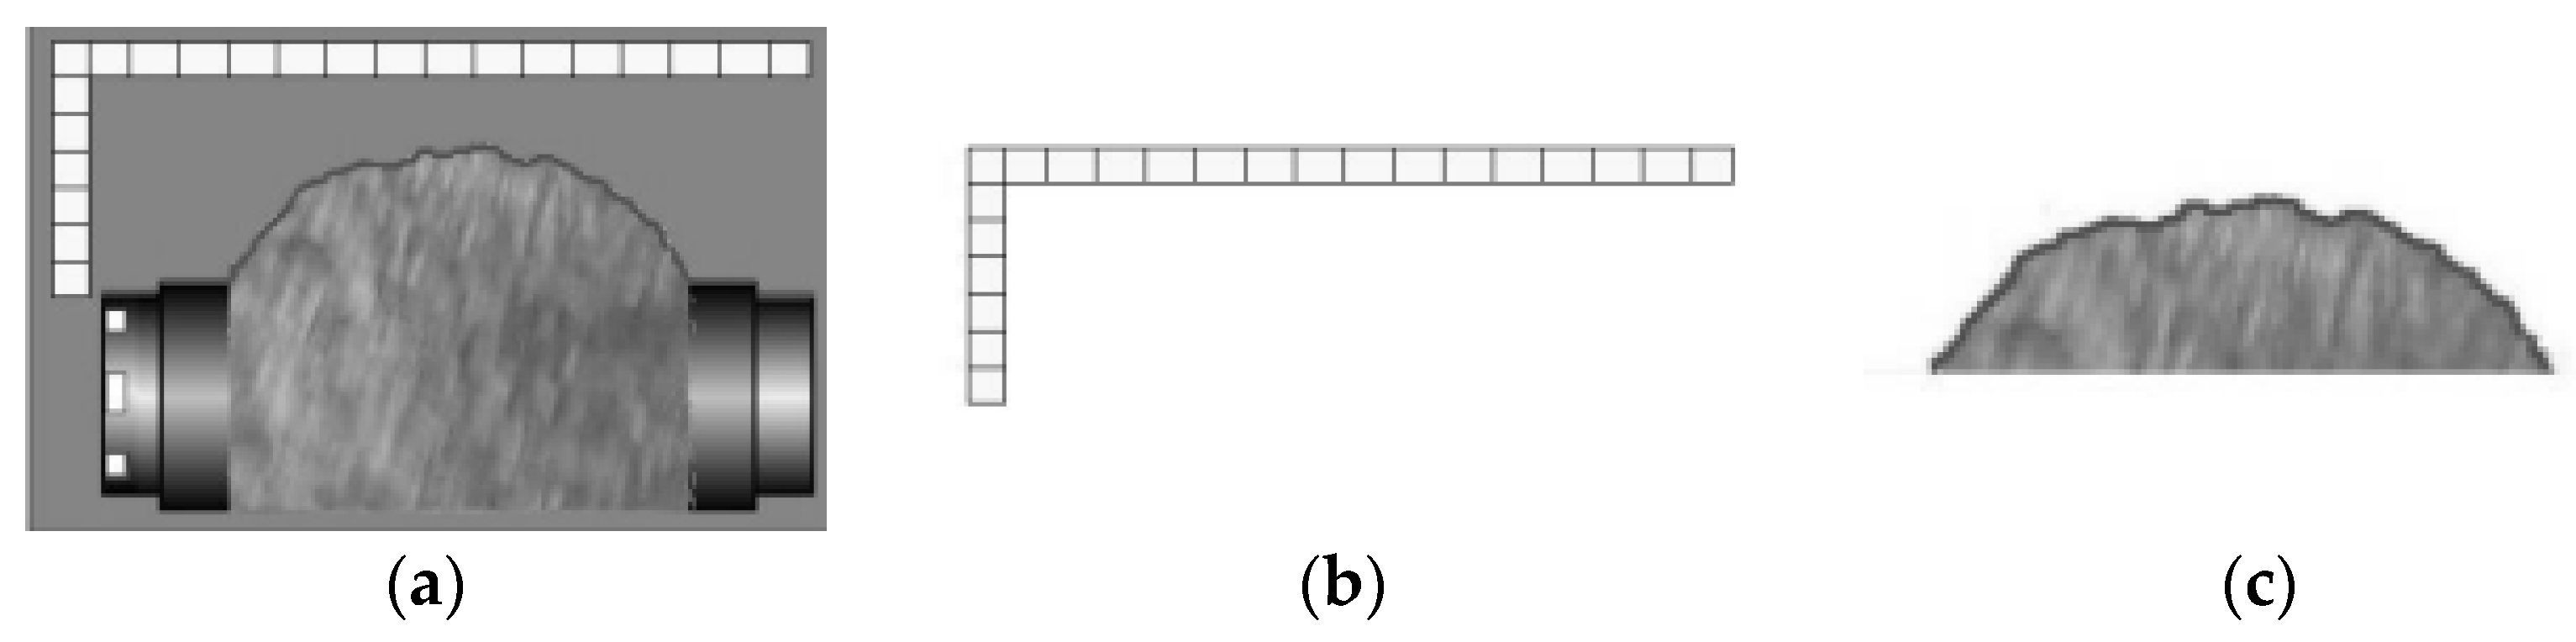
In this section, we tested the material flow rate in the laboratory. Firstly, the image containing the standard ruler and mineral material cross-section transmitted to the computer is grayscale processed, followed by median filtering and contrast enhancement preprocessing. Then, an improved GOOSE algorithm is used to segment the grayscale image, with a uniform size of
. Kapur’s entropy is used as the fitness function during segmentation, and the segmentation results are shown in
Figure 5. It can be seen that the improved GOOSE algorithm can accurately segment the contrast ruler and mineral material cross-sectional images.
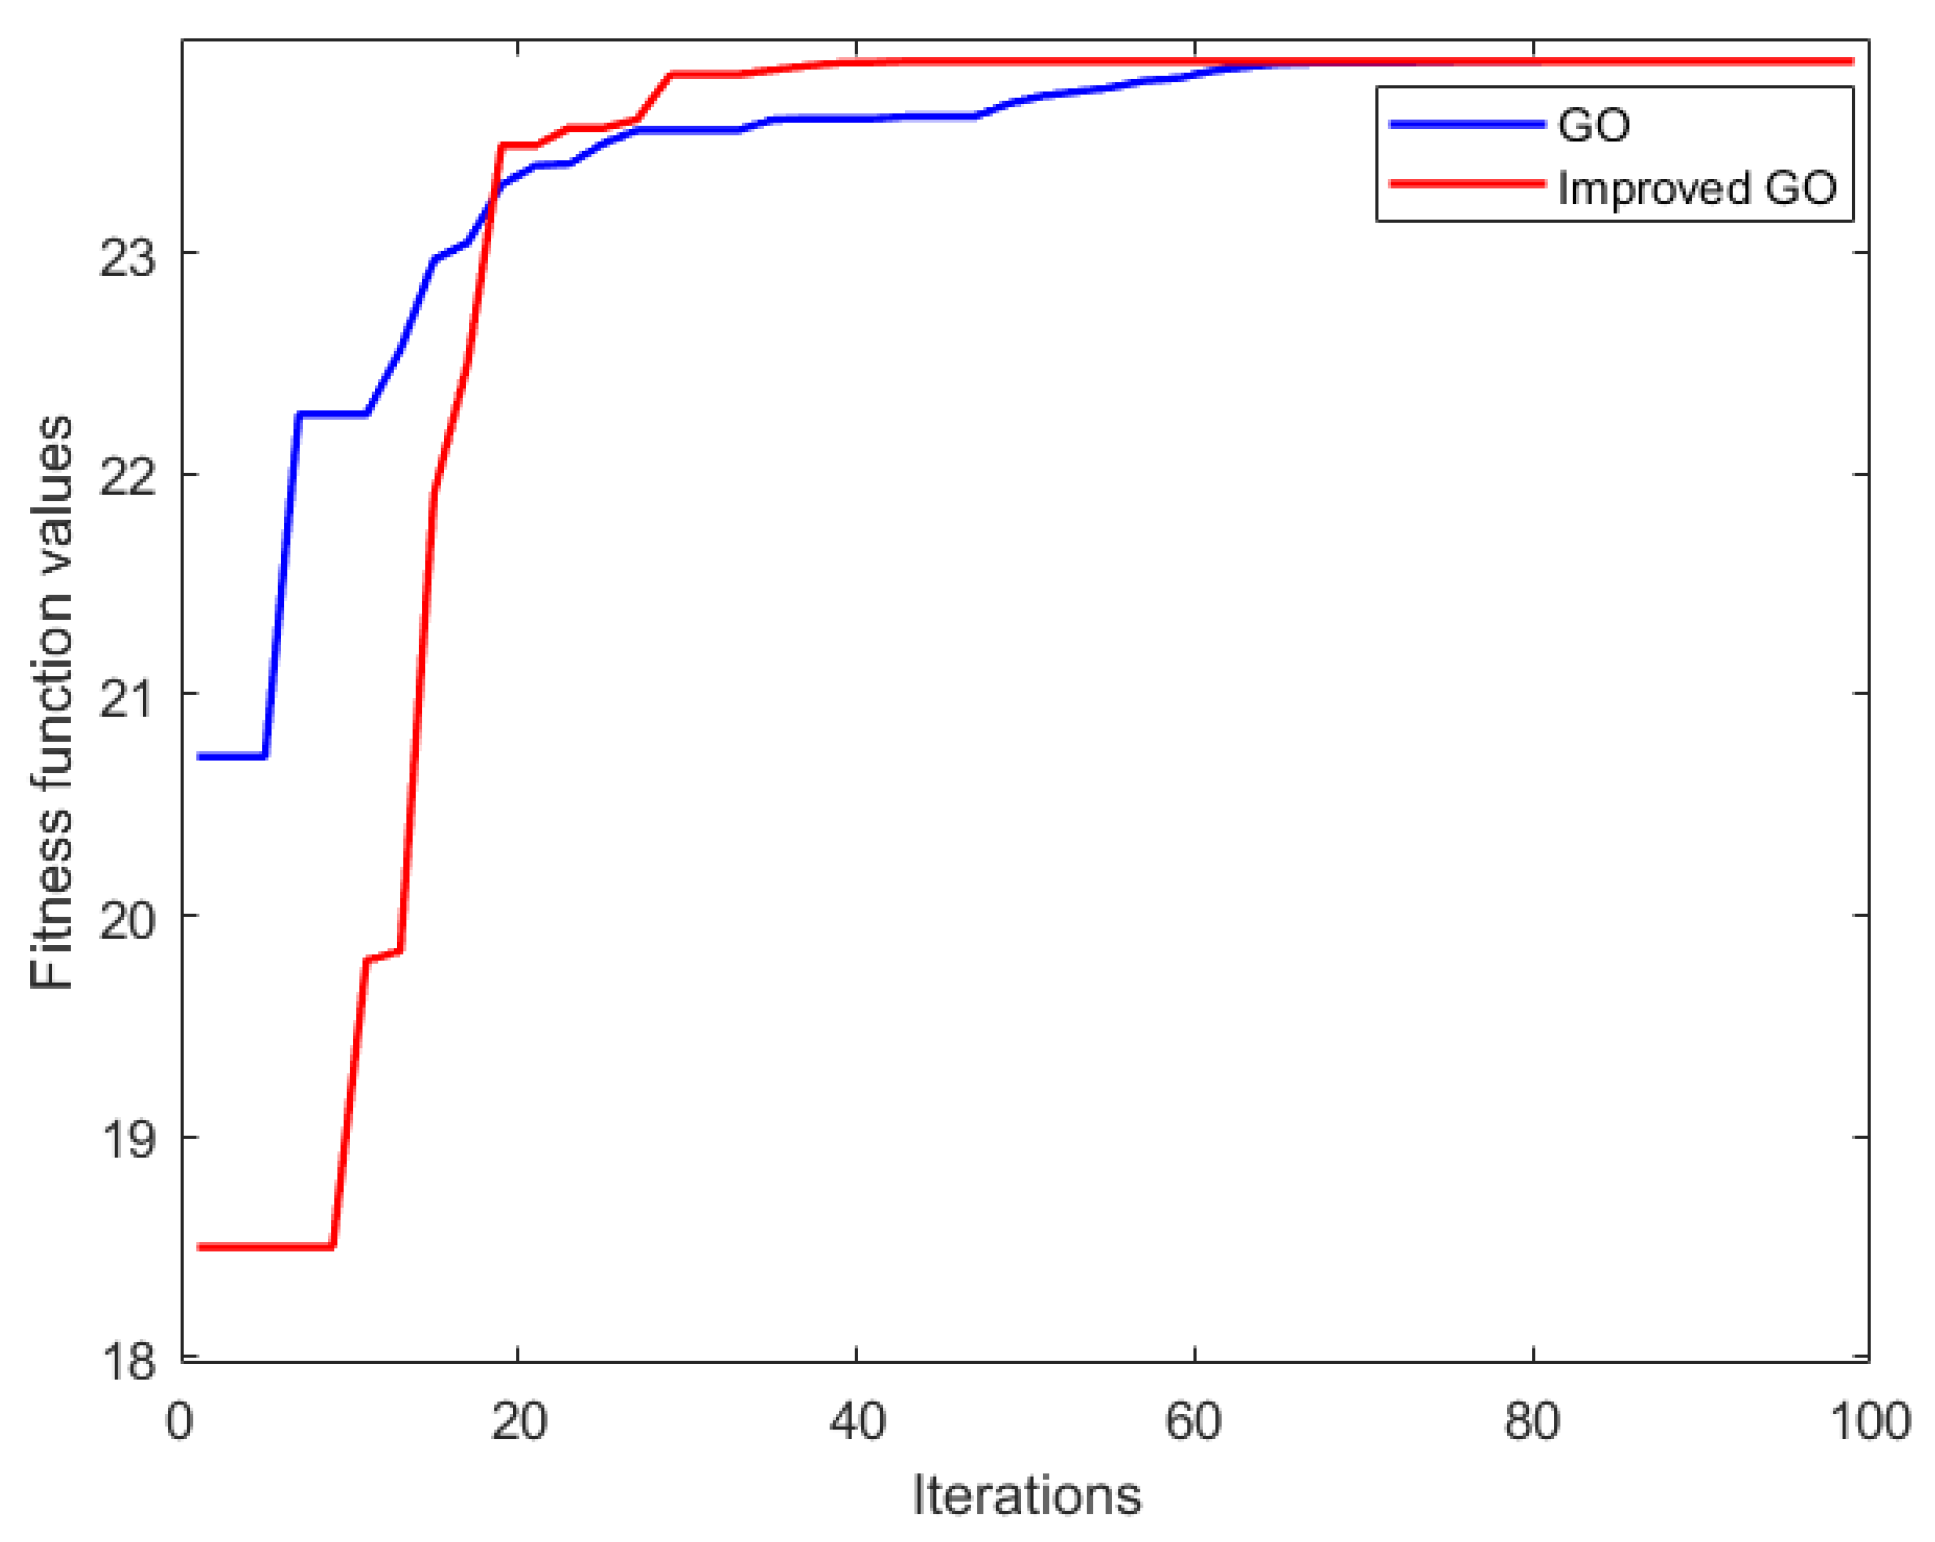
In order to further verify the performance of the improved GOOSE algorithm in segmenting images, its segmentation speed and accuracy were compared with the segmentation performance of the basic GOOSE algorithm, as shown in
Figure 6, where the horizontal axis represents the number of iterations and the vertical axis represents the fitness function value. From
Figure 6, it can be seen that the improved GOOSE algorithm can achieve the optimal fitness function value after 25 iterations; that is, to search for the best threshold for segmenting the image, while the basic GOOSE algorithm requires 55 iterations to search for the optimal value. Therefore, the improved GOOSE algorithm is far superior to the basic GOOSE algorithm in terms of segmentation speed. Accurate segmentation is necessary to ensure accurate material flow detection; therefore, the improved GOOSE algorithm is more suitable for material flow detection in grinding and conveyor belts. Segmentation makes it more suitable for material flow detection in grinding and transportation belts.
On the basis of accurate segmentation, based on the segmentation results, as shown in
Figure 5b,c, a program written in Python software is used to count the number of pixels in the standard ruler and mineral material cross-section. Then, the cross-sectional area of the mineral material is calculated according to Equation (17), and finally the material flow rate of the grinding conveyor belt is calculated according to Equations (18) and (19).
In order to further verify the effectiveness of the material flow detection method for grinding and transportation belts based on the improved GOOSE algorithm, the improved GOOSE algorithm and the basic GOOSE algorithm are used to detect the material flow, and their detection results are compared. They are shown in
Table 2, including the number of pixels in the material cross-section, the material cross-section area, the material flow rate value, and the calculation time required for detection method.
In order to further verify the accuracy of the detection method proposed in this paper, we also used an electronic belt scale to detect the material flow rate, as shown in
Figure 7. The model of the electronic belt scale is ICS-17B. Using it to detect material flow in a good detection environment, the detection results are not affected by belt tension and belt deviation, ensuring the correctness of the detection results and verifying the accuracy of the detection method proposed in this paper.
Through testing, the detection result of the electronic belt scale is 5.125 kg/s, which is compared with the detection results in
Table 2 to verify the accuracy of the grinding and transportation belt material flow detection method based on the improved GOOSE algorithm proposed in this paper. Meanwhile, from
Table 2, it can be seen that the method proposed in this paper outperforms the basic GOOSE algorithm in terms of accuracy and speed.
5. Conclusions
In order to overcome the shortcomings of using electronic belt scales and nuclear belt scales to detect the flow rate of grinding feed, this paper applies computer technology and digital image processing technology to flow detection and proposes a method for detecting the material flow rate of grinding conveyor belts based on an improved GOOSE algorithm. In order to improve the accuracy of detection, this paper first improves the basic GOOSE algorithm by using a reverse strategy to generate a GOOSE population and a strategy to gradually reduce the alpha parameter with increasing iteration times, and proposes an improved GOOSE algorithm. On this basis, an improved GOOSE algorithm is used to segment the material cross-sectional image, and the material flow rate of the transport belt is calculated. Finally, the experimental results are compared with the detection results of the electronic belt scale and GOOSE algorithm. Through comparison, it was found that the method proposed in this article has good performance in both detection accuracy and detection time. This innovative achievement will effectively solve the limitations of material flow detection in grinding conveyor belts, promote the automation and intelligence of mineral processing detection technology, and in the future, this method will be promoted to mineral processing plants.


