1. Introduction
Granitoids are plutonic rocks characterized by a relatively simple felsic mineral assemblage—quartz, alkali feldspar, and plagioclase—with variable but generally minor amounts of mafic minerals [
1]. For over two centuries, granitoids have been an important subject of geological research [
1,
2,
3]. Among the nine representative non-genetic classification schemes proposed during the past century for granitoid rocks, seven are based on the chemical composition of major rock-forming elements [
3].
Through the longstanding efforts of the IUGS Subcommission on the Systematics of Igneous Rocks (IUGS SSIR), the modal mineralogical QAP (quartz–alkali feldspar–plagioclase) classification scheme has gained broad acceptance among geologists worldwide [
4,
5,
6,
7]. Nevertheless, many researchers continue to prefer geochemical diagrams for classifying and naming felsic intrusive rocks [
8,
9,
10,
11,
12]. Compared with point-counting modal mineralogy, whole-rock geochemical analysis is less time-consuming and better suited for machine learning applications [
13]. Therefore, geochemical classification diagrams remain practically valuable in granitoid petrology.
A variety of geochemical diagrams have been proposed as effective proxies for QAP classification. These can be grouped into three categories:
- (1)
Normative mineral-based diagrams, such as the Quartz (Q′)–Anorthite–Orthoclase diagram (Q′–ANOR diagram; [
14] and the Quartz–Orthoclase–Albite–Anorthite normative diagram (2Q–(Or + Ab)–4An diagram, abbreviated QUORAA; [
15];
- (2)
Major-element weight percent-based diagrams, such as the Silica–Total Alkali diagram (TAS; [
8,
9,
16] and the SiO
2–CaO/(CaO + K
2O) diagram (SCK; [
17];
- (3)
Cation-number-based diagrams, such as the Quartz–Plagioclase coordinate diagram (P-Q diagram; [
18,
19].
Despite the proliferation of such diagrams, the IUGS SSIR has not yet officially endorsed any geochemical scheme for plutonic rock classification [
5,
20,
21]. Moreover, few studies have systematically evaluated the consistency between nomenclature derived from these diagrams and the modal QAP classification. Early work by Vilinovic and Petřík [
22] assessed the reliability of the Q′–ANOR diagram using mesonorm calculations from ~100 Carpathian granitoid samples. Bellieni et al. [
16] tested the IUGS-recommended TAS diagram—originally designed for volcanic rocks—on 278 intrusive samples. Galindo et al. [
23] compared the TAS [
8], P-Q, Q′–ANOR, and R1–R2 [
24] diagrams against QAP nomenclature using samples from five Brazilian batholith suites, finding that while geochemical diagrams accurately identify granite
sensu stricto, they perform poorly for more basic rocks (e.g., gabbro and diorite). Our recent studies indicate that normative diagrams such as QUORAA and Q′–ANOR exhibit low accuracy relative to QAP classification [
25,
26], whereas the SCK diagram performs well in identifying tonalite [
27]. Santos and Hartmann [
28] highlighted inconsistencies between the IUGS-recommended QAP scheme for volcanic rocks and the TAS diagram. Sharpenok et al. [
29] proposed a modified TAS diagram for granitoids in an EGU General Assembly abstract, though no detailed methodology or diagram has been published.
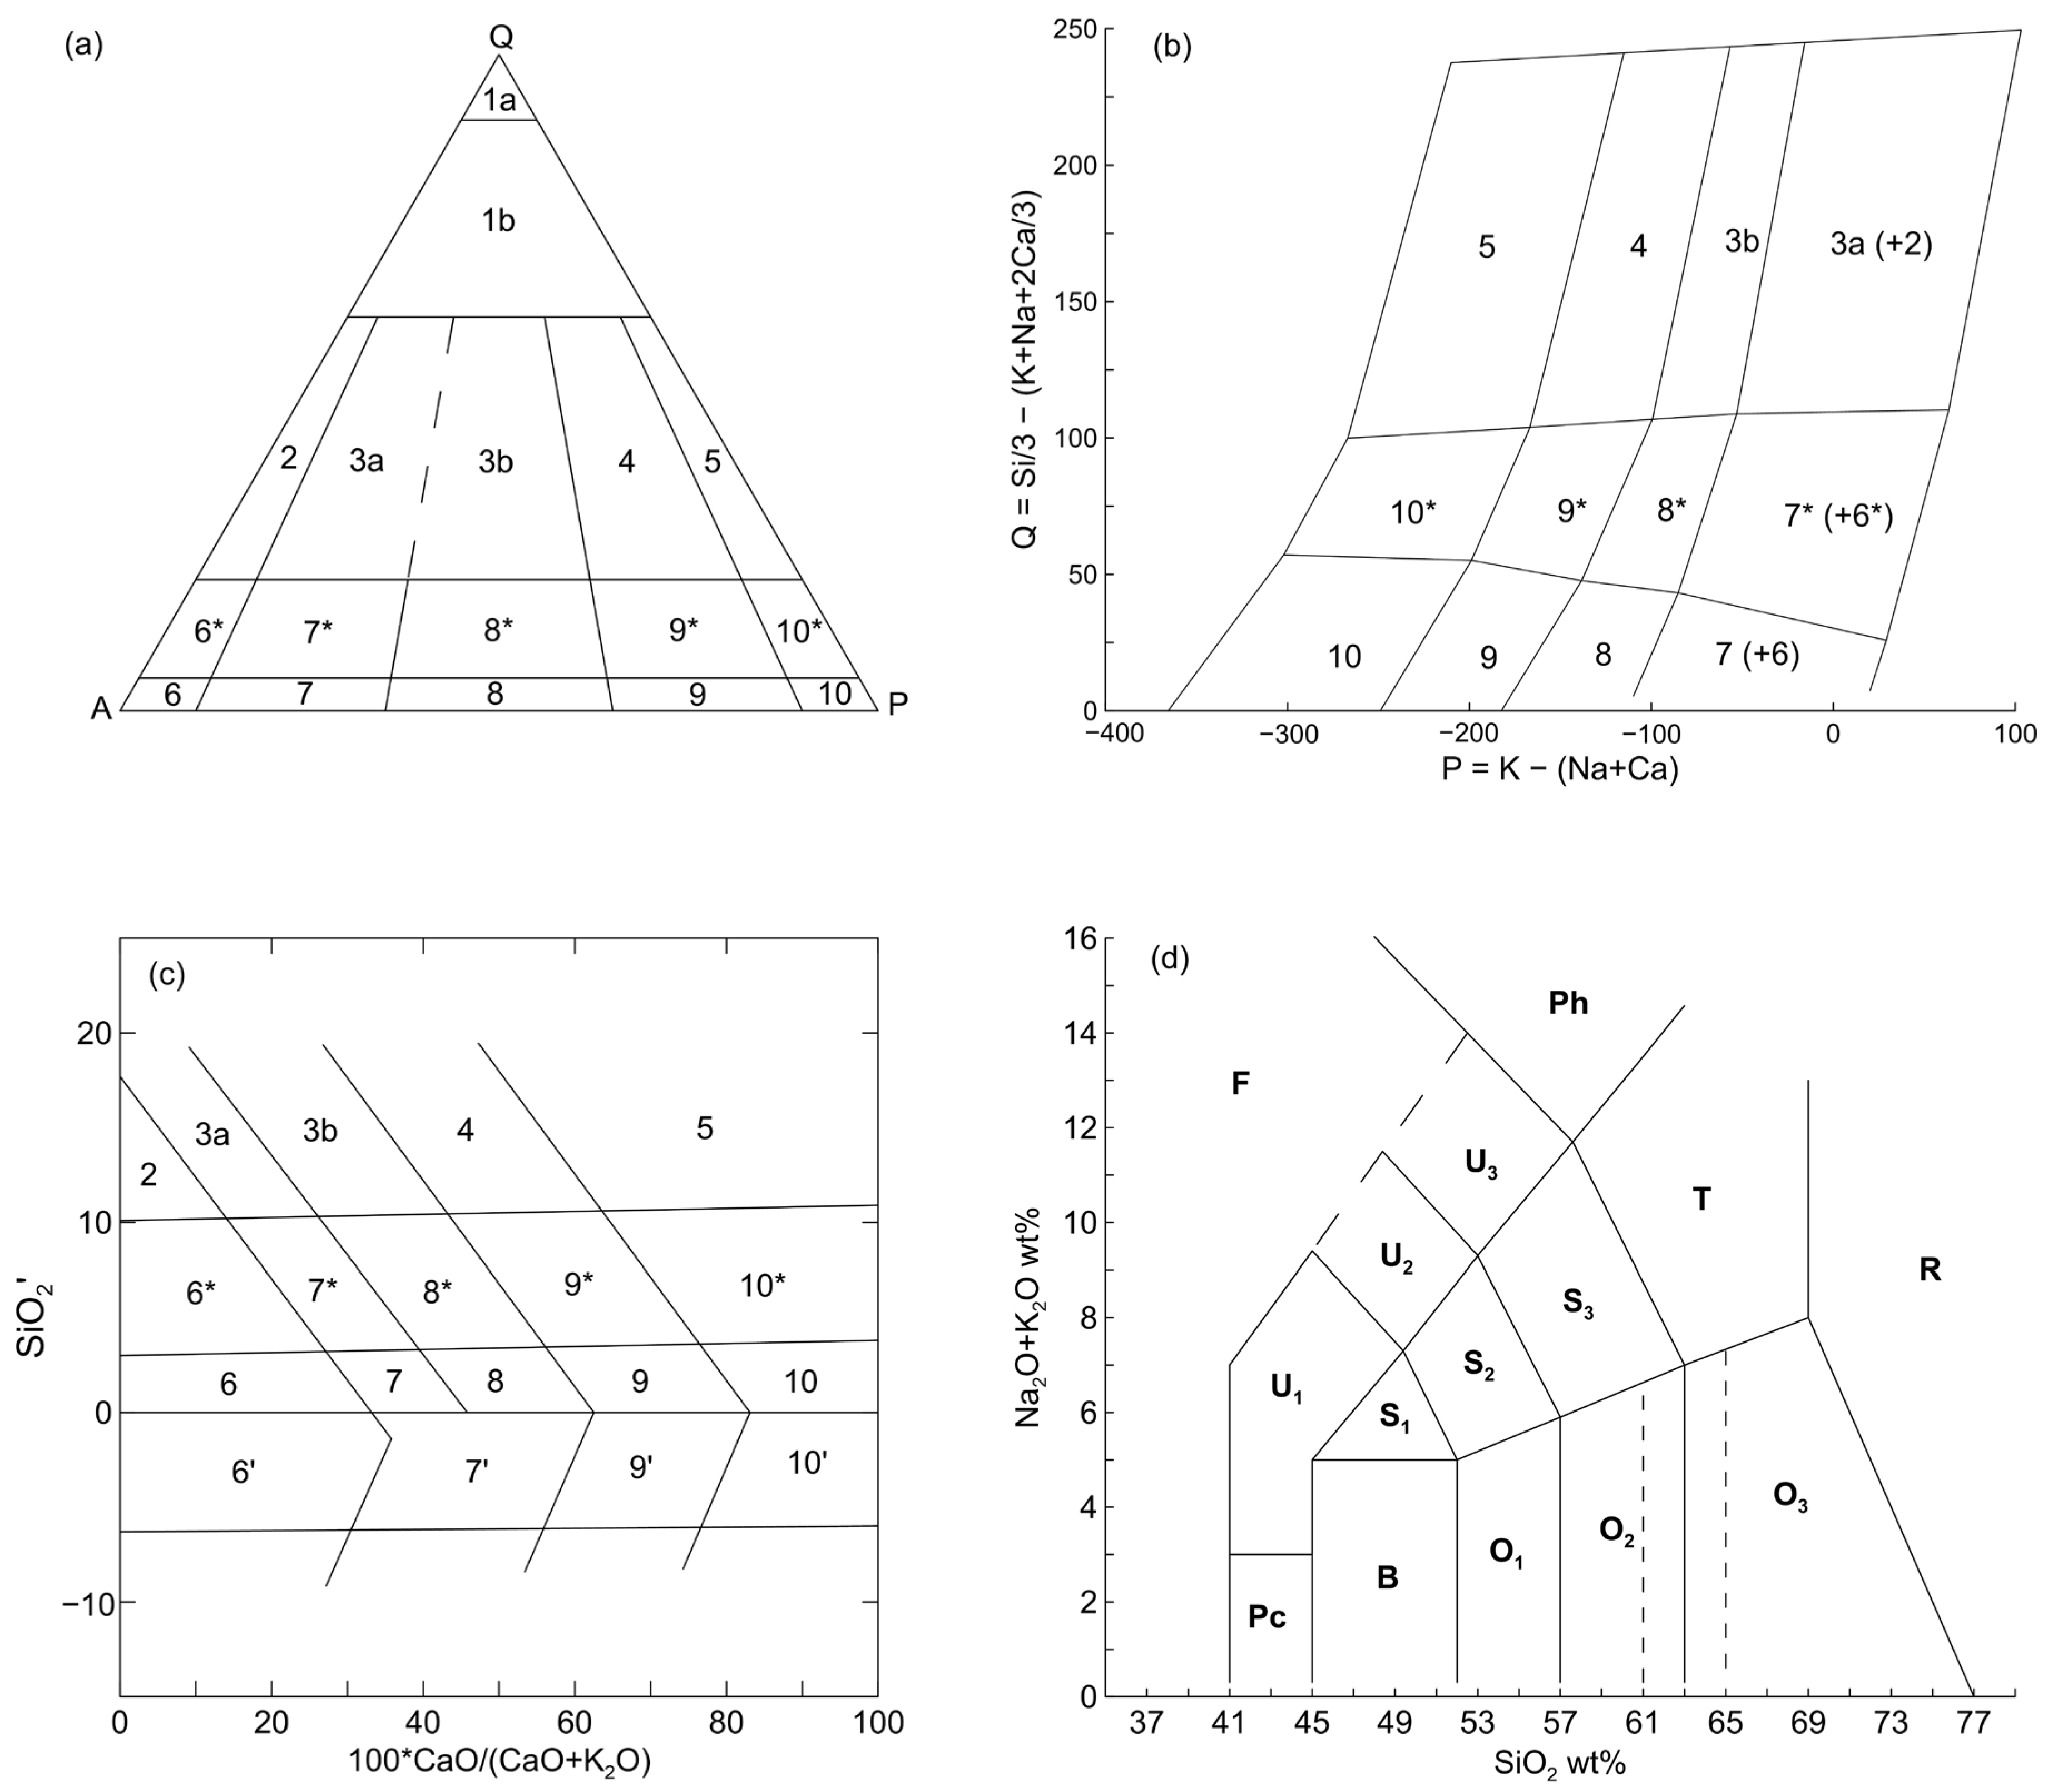
In this study, we compile major oxide and modal mineral content data of granitoid rocks from diverse regions worldwide. Using a dataset of 1981 samples, we evaluate the accuracy of three representative geochemical classification diagrams: the P-Q, SCK, and TAS (
Figure 1). While previous studies [
16,
23,
25] have also assessed the consistency between geochemical diagrams and the QAP scheme, this work advances the field by employing a substantially larger global dataset (1981 samples, compared to <300 in Bellieni et al. [
16] or Galindo et al. [
23]) and by systematically evaluating diagrams based on distinct principles—cation-based (P-Q), element ratio-based (SCK), and oxide-based (TAS).
2. Materials and Methods
This study evaluates the reliability of geochemical classification diagrams against the modal QAP scheme using a systematically compiled global dataset of 1981 samples (
Table 1). Each sample includes both whole-rock geochemical data and corresponding quantitative mineral modes—primarily obtained by point-counting (see
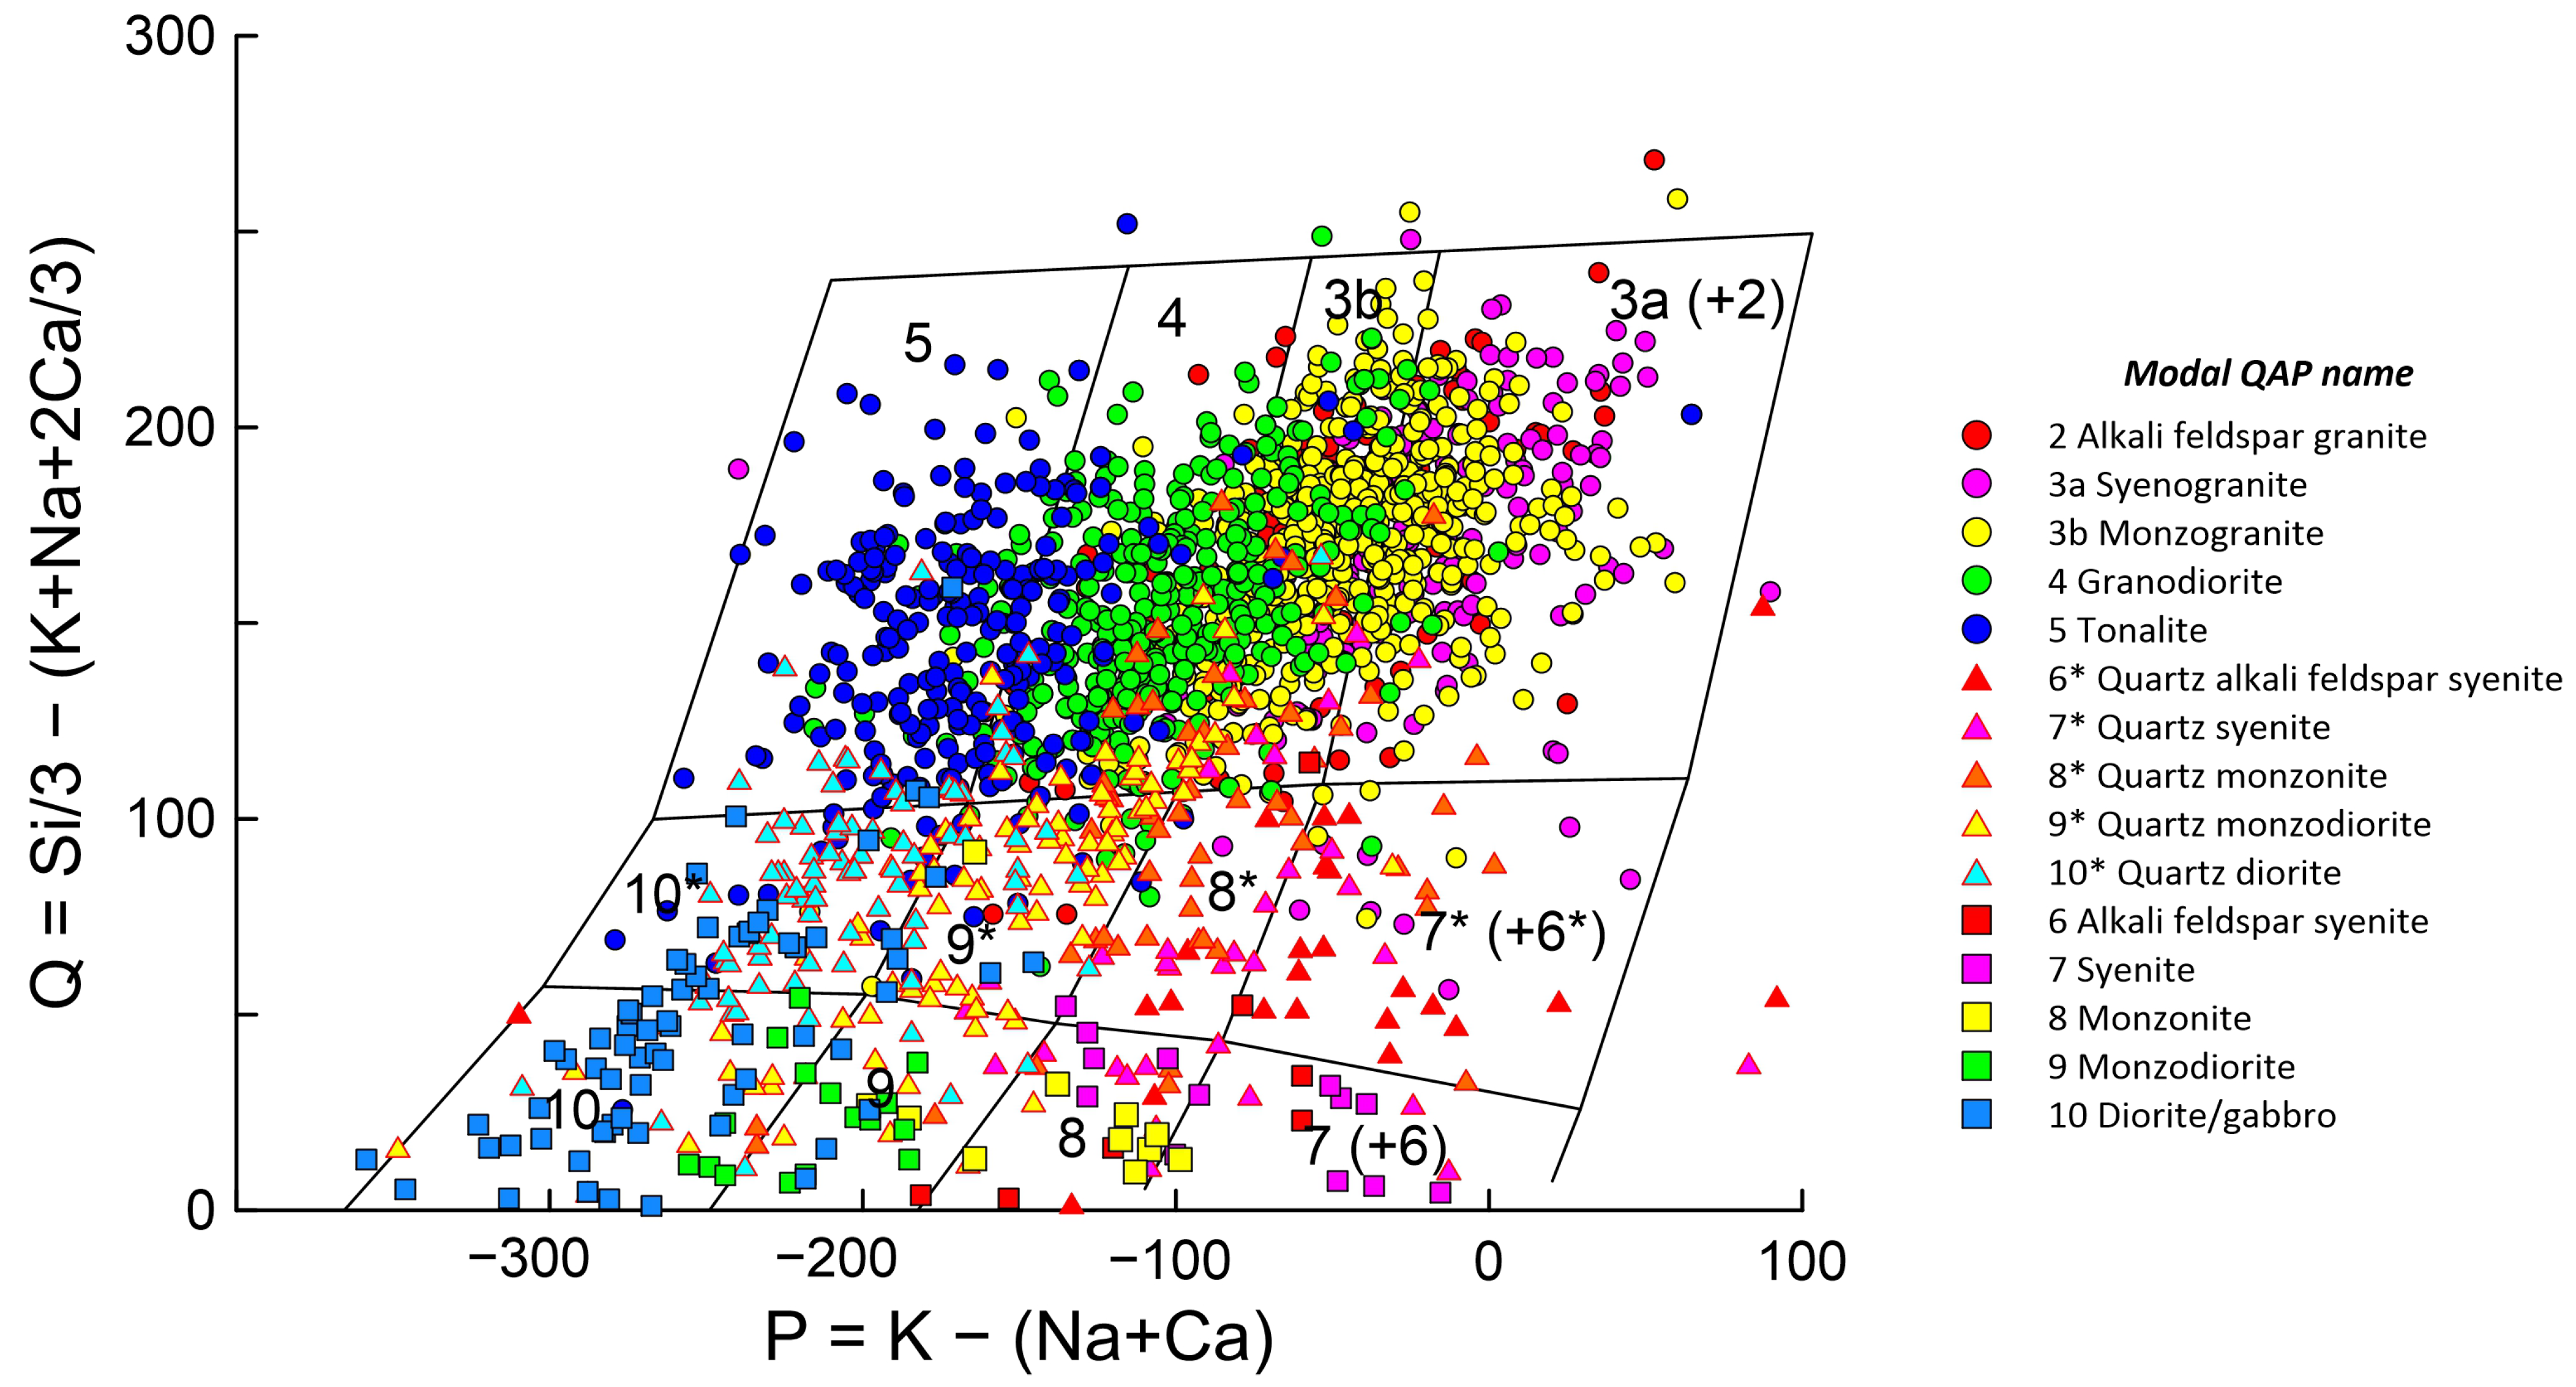
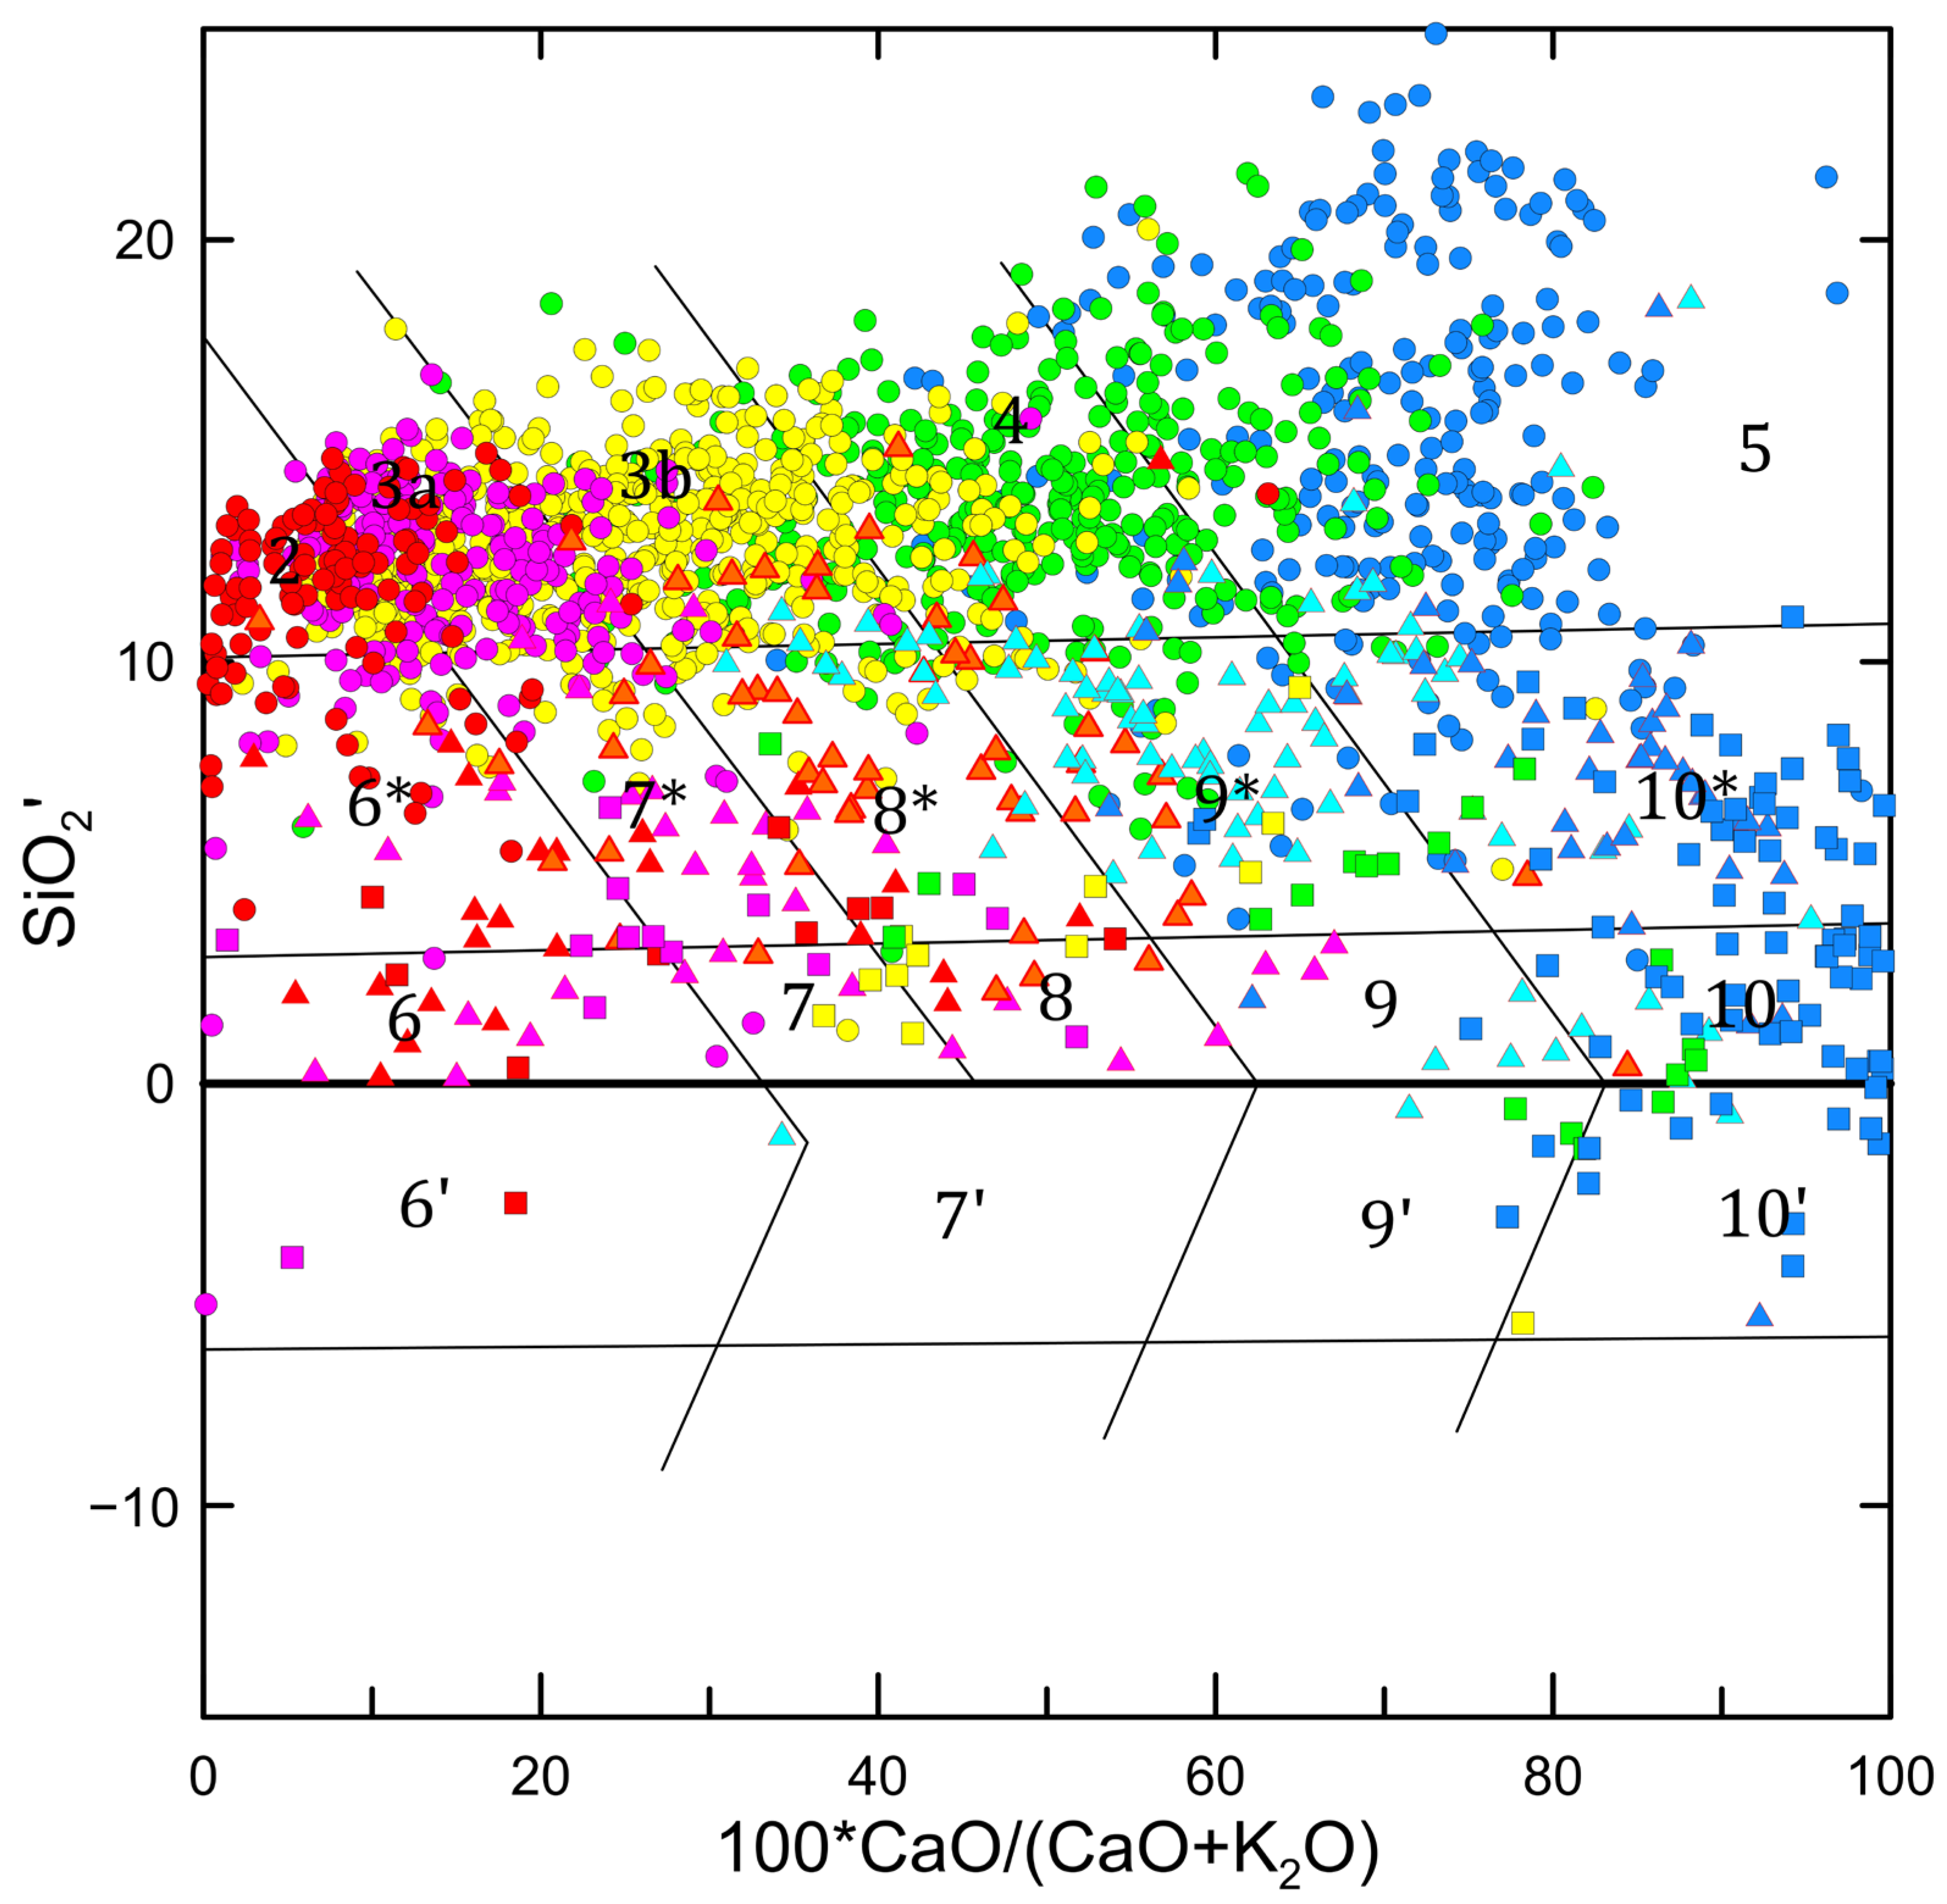
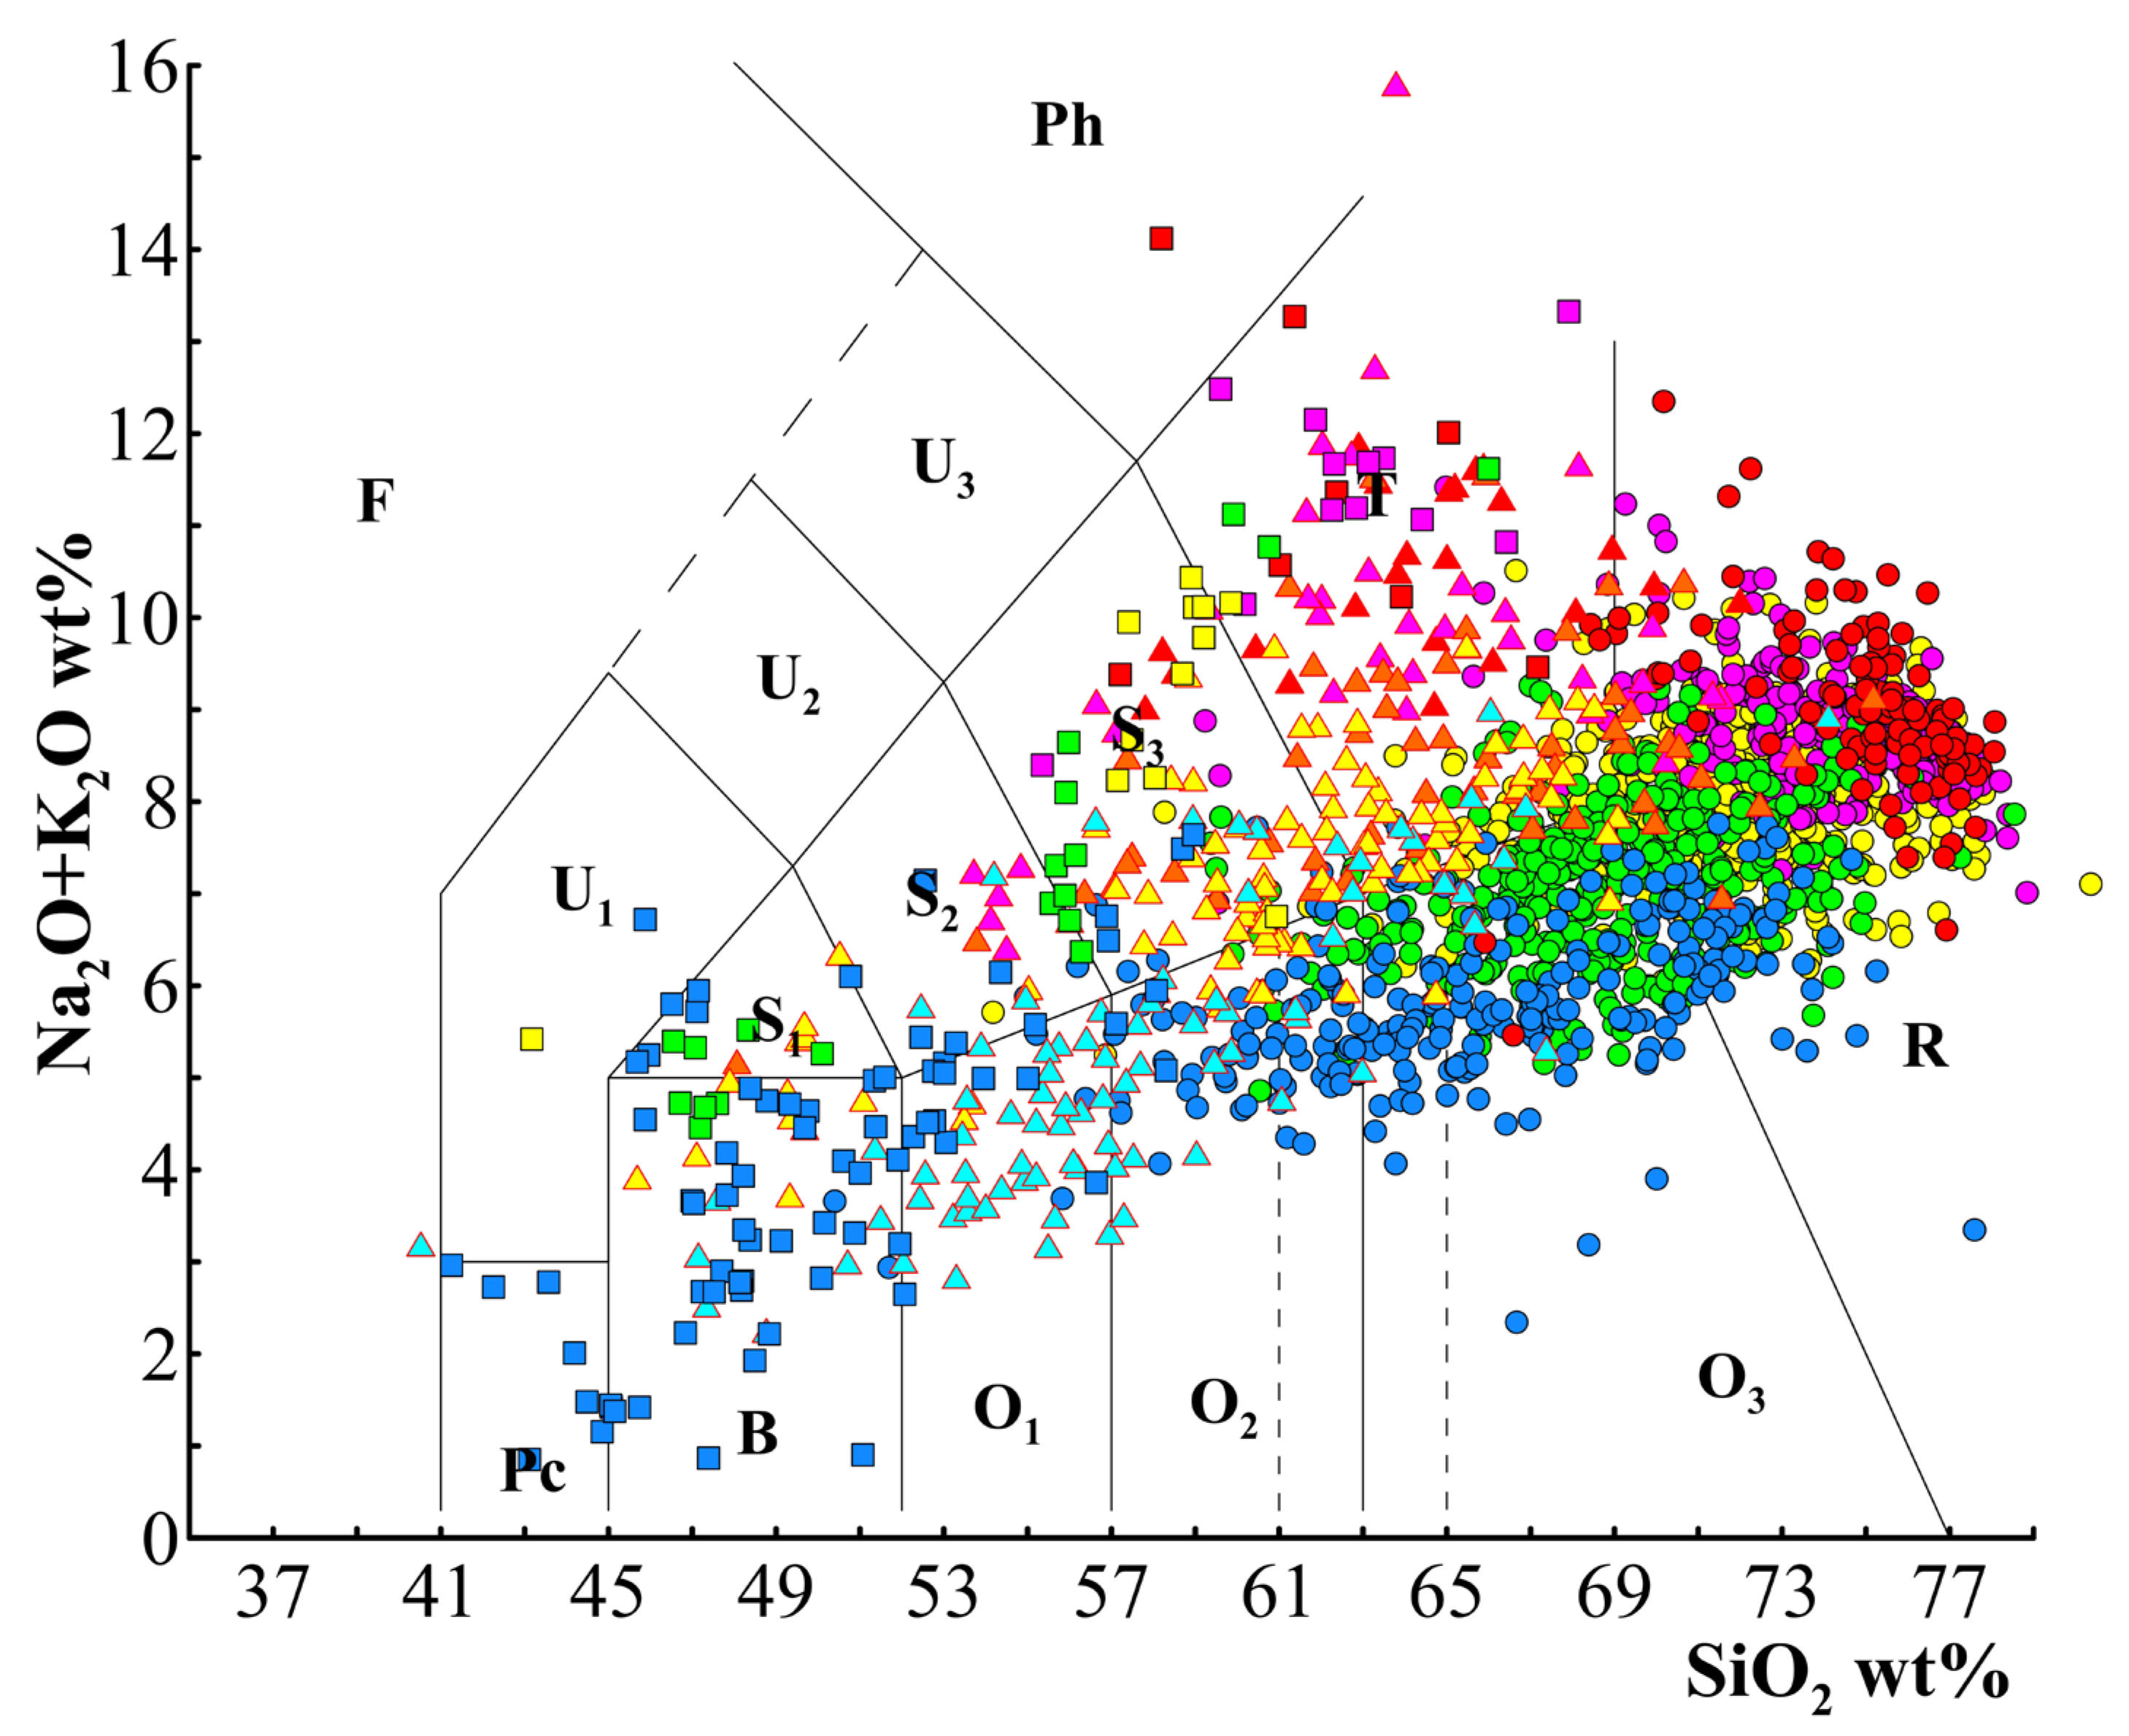
Supplementary Files for data sources). The actual mineral mode of each sample was projected onto the QAP diagram, while its geochemical parameters were plotted in three discrimination diagrams: P-Q, SCK, and TAS (
Figure 2,
Figure 3 and
Figure 4). In these geochemical diagrams, sample points are color-coded according to the lithology determined by their modal QAP projection.
To facilitate comparison, the categories in the P-Q and SCK diagrams were aligned with the zones of the QAP classification system (
Figure 1). A sample was counted as correctly classified (“1”) if the rock name derived from the geochemical diagram matched that from the QAP classification; otherwise, it was marked as incorrect (“0”). The overall accuracy (replication rate) of each diagram was calculated as the proportion of samples falling into the “correct” QAP zones.
For the P-Q and SCK diagrams, accuracy was also evaluated in terms of two criteria:
Quartz Content Discrimination: A sample was considered correctly classified if it fell within the same rock field or an adjacent horizontal zone (i.e., with equivalent quartz content) in the geochemical diagram. For example, QAP-classified syenogranite (Zone 3a) samples plotted in Zones 3a, 3b, or 2 were all deemed correct.
Alkali Feldspar-to-Plagioclase Ratio Discrimination: A sample was regarded as correctly classified if it fell within the same rock zone or an adjacent vertical zone (i.e., with equivalent feldspar ratio). For instance, QAP-classified quartz syenite (Zone 7) samples located in Zones 7, 7*, or 3a were considered correct.
3. Results
3.1. P-Q Diagram
Niggli [
31] proposed that major oxide compositions of igneous, metamorphic, and sedimentary rocks could be converted into cationic values, thereby defining cationic ratios of rock-forming minerals—an approach once widely used in igneous petrology [
32]. Building on this concept, Debon and Le Fort [
18,
19] developed a cation-number-based classification diagram for common intrusive rocks. Its core idea involves chemically simulating the QAP diagram, specifically through two coordinates: the Q coordinate (=[Si/3 − (Na + K + 2 × Ca/3)]), which reflects quartz content in common granitoids, and the P coordinate (=[K − (Na + Ca)]), which indicates the proportion of alkali feldspar to total feldspar [
19].
To evaluate the reliability of the P-Q diagram against the modal QAP classification, we plotted all samples on the P-Q diagram (
Figure 2), with each point colored according to the lithology defined by its actual mineral mode.
Statistical analysis shows that, of the 1981 samples, 1114 are consistently classified by both the P-Q diagram and the QAP scheme, yielding an overall accuracy of approximately 56%. A breakdown by rock type (considering only fields with >50 samples;
Table 2) reveals that, except for alkali feldspar granite (Zone 2) and quartz monzonite (Zone 8*), the P-Q diagram achieves accuracies between 40% and 70% for most rock types, with the majority falling in the 55%–70% range. Notably, when granites
sensu stricto (QAP Zone 3) are not subdivided into syenogranite (Zone 3a) and monzogranite (Zone 3b), the identification accuracy rises significantly to 87%.
We further evaluated the performance of the P-Q diagram in distinguishing quartz content and alkali feldspar-to-plagioclase ratio separately (
Table 3 and
Table 4). As shown in
Table 3, the diagram achieves high accuracy (≥90%) in identifying quartz content for most granitoids (Zones 2, 3a, 3b, 4, 5). In contrast, accuracy drops to 50%–65% for rocks with lower quartz content, such as quartz monzonite (Zone 8*), quartz monzodiorite (Zone 9*), quartz diorite (10*), and diorite (Zone 10).
Table 4 indicates that the P-Q diagram performs moderately (55%–71%) in identifying feldspar ratios for typical granitoids, but achieves higher accuracy (~80%) for quartz diorite (Zone 10*) and diorite (Zone 10).
3.2. SiO2-CaO/(CaO + K2O) Diagram
The SiO
2–CaO/(CaO + K
2O) diagram (SCK diagram) was empirically derived by Enrique and Esteve [
17] as a geochemical proxy for the CIPW normative Q′–ANOR diagram of Streckeisen and Le Maitre [
14]. In this scheme, SiO
2 content serves as an indicator of quartz abundance, while the CaO/(CaO + K
2O) ratio approximates the relative proportion of plagioclase to alkali feldspar.
Projection of the compiled samples onto the SCK diagram (
Figure 3) shows that 989 out of the 1981 samples are consistently classified by both the SCK and QAP schemes, corresponding to an overall accuracy of approximately 50%.
A breakdown by rock type (
Table 5; including only zones with >50 samples) indicates that, except for tonalite (Zone 5), quartz monzonite (Zone 8*), and diorite (Zone 10), the SCK diagram yields accuracies between 40% and 60% for other rock types—a relatively low performance from a statistical perspective. Notably, the diagram performs considerably better for tonalite, with an accuracy of ~80%. When granites
sensu stricto (QAP Zone 3) are considered as a single group without subdivision into syenogranite (Zone 3a) and monzogranite (Zone 3b), the accuracy improves to 70%.
We further assessed the SCK diagram’s ability to discriminate quartz content and feldspar ratio separately (
Table 6 and
Table 7). As summarized in
Table 6, the diagram shows relatively high accuracy (77%–89%) in identifying quartz content for most granitoids (Zones 2, 3a, 3b, 4, 5). Performance is moderate (59%–71%) for rocks with lower quartz content, such as quartz monzonite (Zone 8*), quartz monzodiorite (Zone 9*), and quartz diorite (Zone 10*), but drops markedly to 38% for diorite (Zone 10).
Table 7 shows that the SCK diagram achieves high accuracy (83%–89%) in identifying the feldspar ratio for samples where plagioclase constitutes over 90% of total feldspar, including tonalite (Zone 5), quartz diorite (Zone 10*), and diorite (Zone 10). In contrast, accuracy is considerably lower (44%–66%) for rocks with significant alkali feldspar contents, such as granite (Zones 2, 3a, 3b), granodiorite (Zone 4), quartz monzonite (Zone 8*), and quartz monzodiorite (Zone 9*).
3.3. Total Alkali—Silica (TAS) Diagram
The total alkali–silica (TAS) diagram was initially introduced for the classification of volcanic rocks [
8]. Although it has also been proposed for use in plutonic rock nomenclature [
8,
9,
16], it has not been formally adopted by the IUGS for this purpose. Middlemost [
9] presented a TAS scheme for intrusive rocks that largely mirrors the volcanic TAS diagram in field boundaries, with volcanic rock names replaced by their plutonic equivalents. This version has been widely applied in practice, despite lacking IUGS endorsement. Bellieni et al. [
16] further contended that only minor adjustments were needed to adapt the TAS diagram for common intrusive rocks.
Unlike the P-Q, SCK, and Q′–ANOR diagrams, the TAS diagram uses the sum of Na
2O and K
2O (in wt%) to reflect variations in feldspar composition, whereas the other diagrams employ specific parameters to represent the alkali feldspar-to-plagioclase ratio—corresponding to the horizontal dimension of the QAP triangle. As a result, there is no strict correspondence between the TAS diagram and the QAP system or its geochemical proxies [
28].
This discrepancy raises the question of whether a TAS diagram can be designed to align with the modal QAP scheme—a challenge currently being addressed by the IUGS Task Group on Igneous Rocks [
20,
21].
In this study, we examine this issue using the global dataset of felsic intrusive rocks with both chemical and modal mineralogical data. Two analytical approaches were applied:
As summarized in
Table 8, samples of alkali feldspar granite (Zone 2), syenogranite (Zone 3a), and monzogranite (Zone 3b) predominantly (>85%) plot within the R (granite) field of the TAS diagram. In contrast, other lithologies exhibit more scattered distributions:
Granodiorite (Zone 4) occurs mainly in O3 (52%) and R (36%);
Tonalite (Zone 5) is concentrated in O3 (48%), O2 (24%), and R (20%);
Quartz monzonite (Zone 8*) is distributed across T (50%), R (24%), and S3 (22%);
Quartz monzodiorite (Zone 9*) appears mainly in T (38%), S3 (30%), and O2 (13%);
Quartz diorite (Zone 10*) is found chiefly in O1 (40%), O2 (25%), B (8%), and T (7%);
Diorite (Zone 10) lies predominantly in B (50%), O1 (14%), Pc (9%), S2 (8%), and S1 (8%).
These patterns indicate that, apart from granite sensu stricto and alkali feldspar granite, most lithologies show considerable dispersion and overlap in the TAS diagram, with no statistically consistent correspondence between TAS and QAP classifications for non-granitic felsic intrusive rocks.
A reverse analysis (
Table 9) further confirms this mismatch:
The TAS R field corresponds mainly to monzogranite (~50%), syenogranite (~18%), alkali feldspar granite (~11%), and granodiorite (~14%);
The O3 field is dominated by granodiorite (55%), tonalite (31%), and monzogranite (10%);
The O2 field consists largely of tonalite (53%), quartz diorite (18%), granodiorite (16%), and quartz monzodiorite (11%);
The O1 field includes quartz diorite (64%), diorite (21%), and tonalite (9%);
The B field is composed chiefly of diorite (66%), quartz diorite (12%), and quartz monzodiorite.
Moreover, samples within the T (syenite) and S3 (monzonite) TAS fields exhibit highly dispersed QAP affiliations, covering a wide range of intermediate to felsic lithologies.
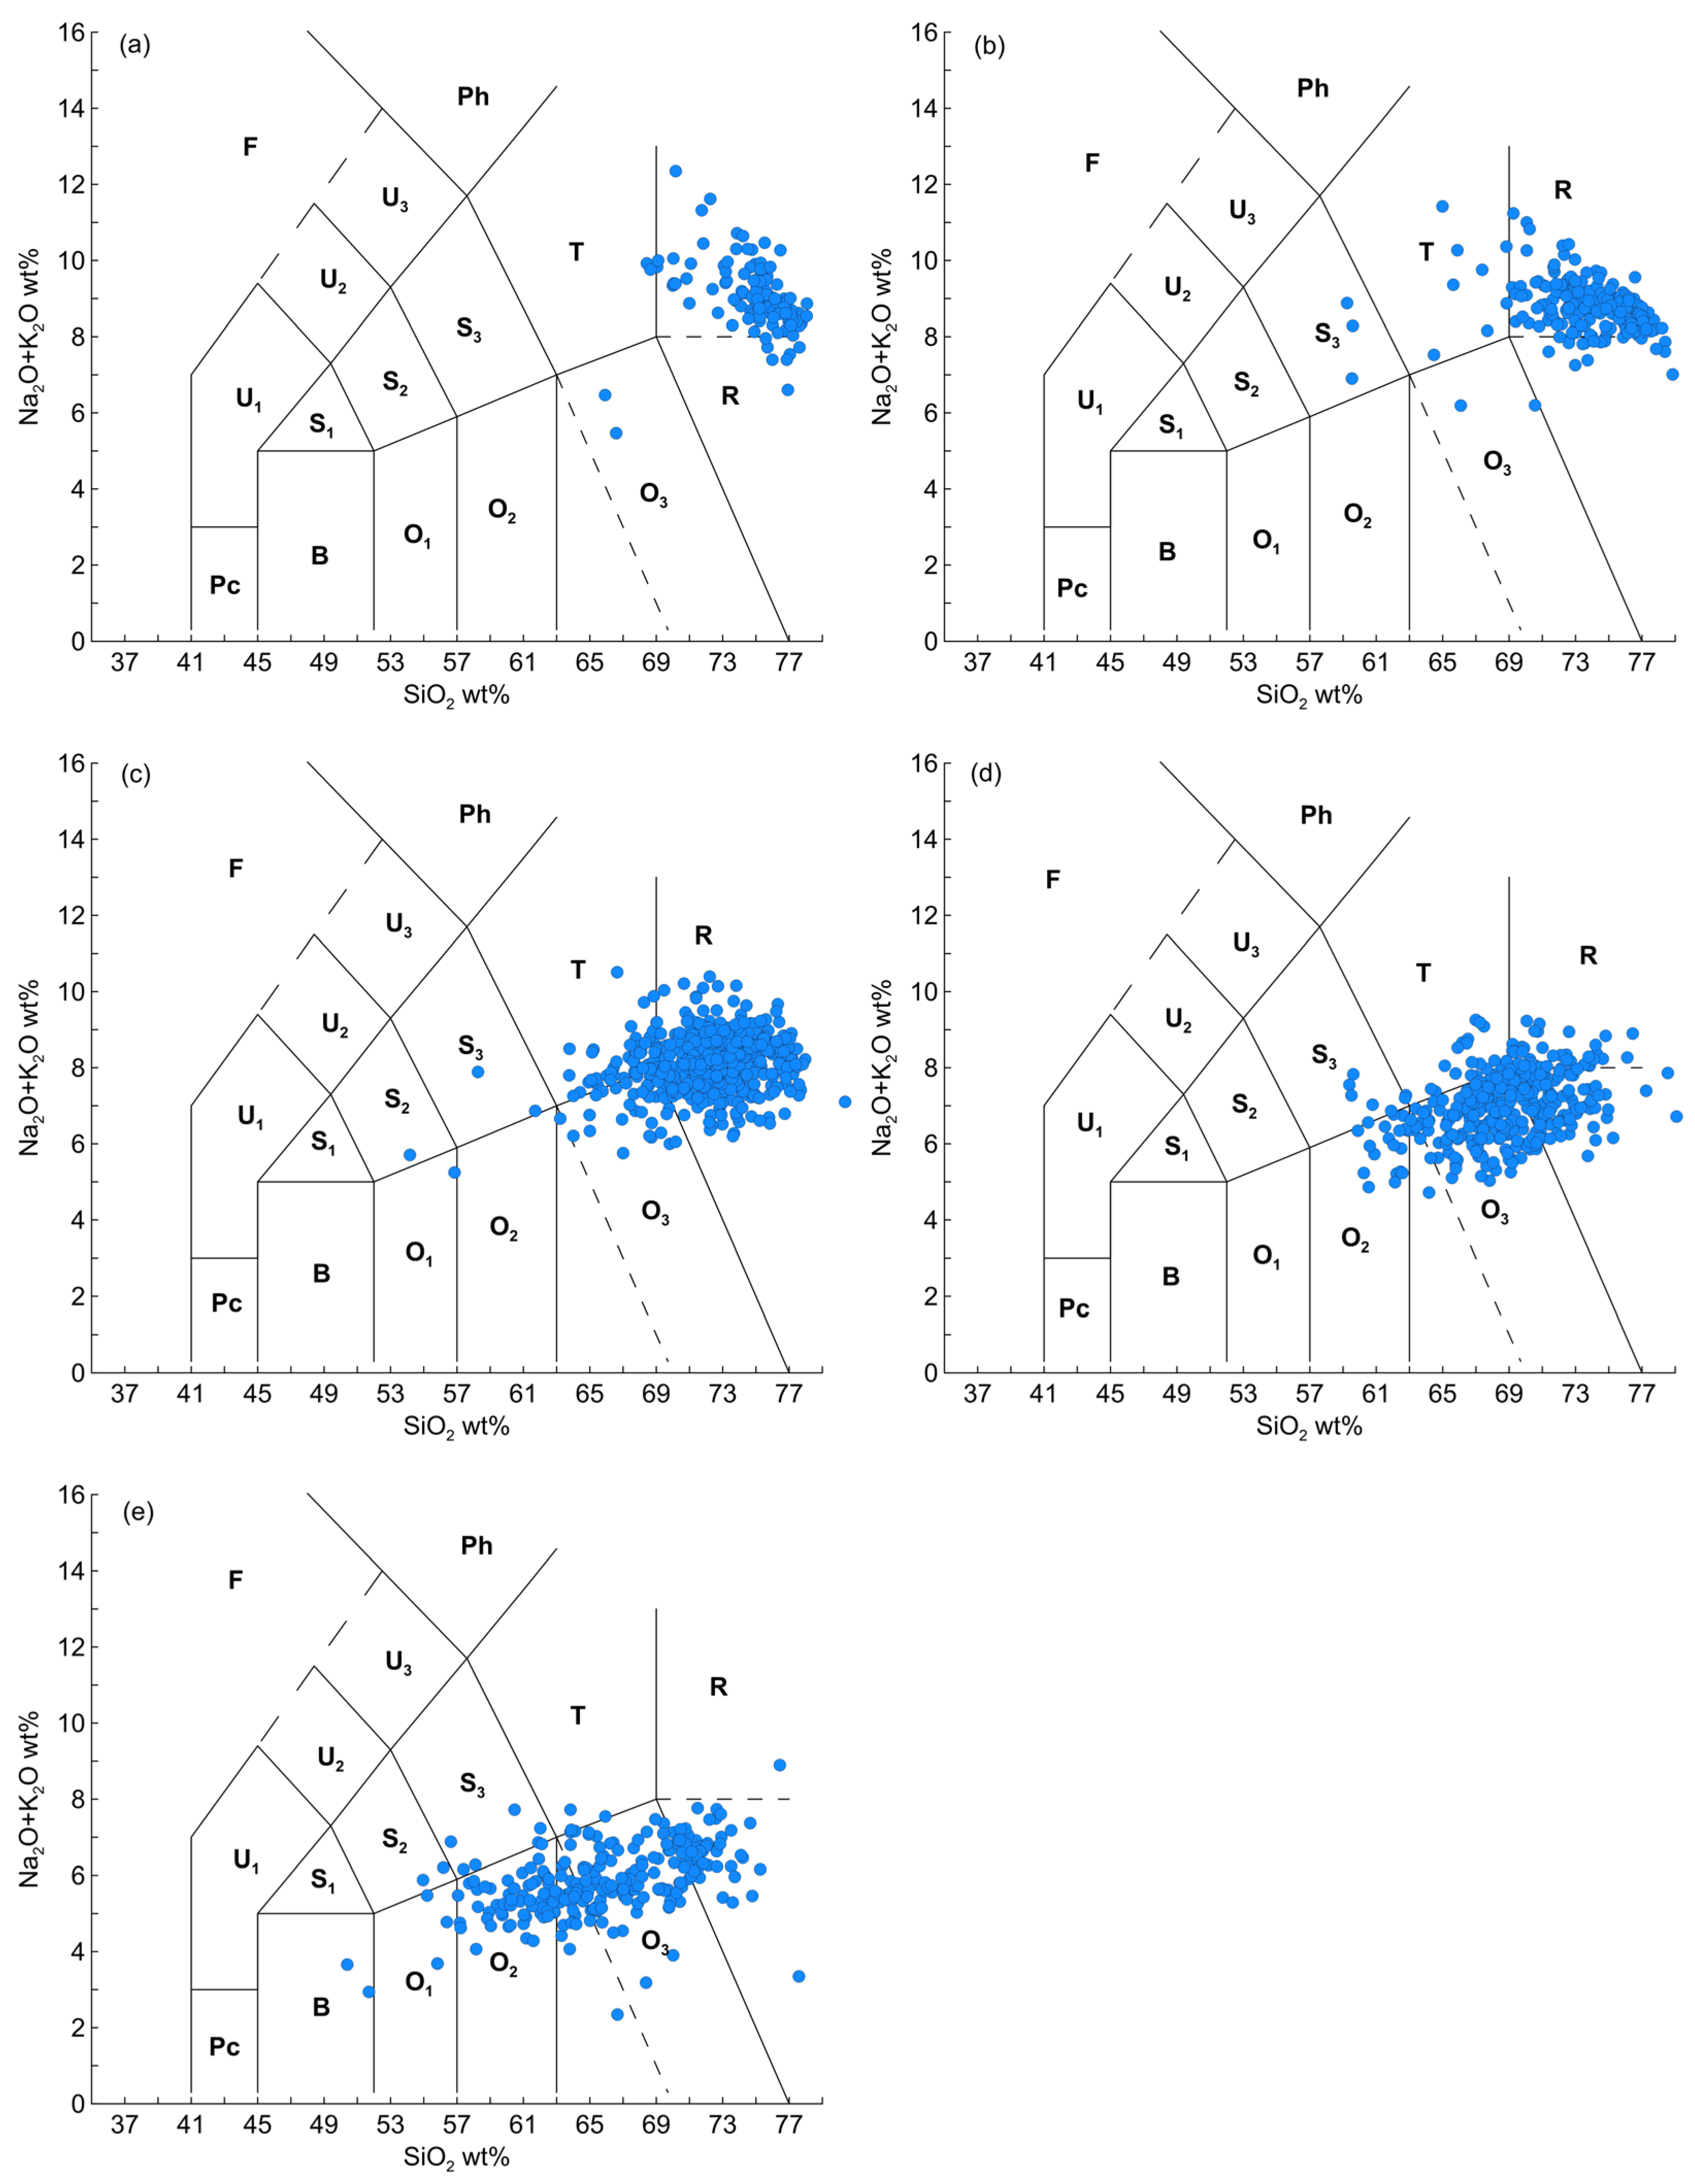
Compared with the earlier study by Bellieni et al. [
16] based on 278 samples, our larger dataset (1981 samples) reveals more pronounced overlaps and misclassifications (
Figure 5). In particular:
Alkali feldspar granite and syenogranite cannot be reliably distinguished in the TAS diagram (
Figure 5a,b);
Syenogranite and monzogranite show substantial overlap in total alkali content (
Figure 5b,c);
Granodiorite primarily plots in the O3 field, with secondary occurrences in R, O2, and T (
Figure 5d);
Tonalite mainly falls in O3, followed by O2 and R (
Figure 5e), making it difficult to distinguish from granodiorite using the TAS diagram alone.
4. Discussions
For common plutonic rocks, neither the cation-based P-Q diagram nor the element-based SCK or TAS diagram performs well in reproducing QAP nomenclature. Our previous studies also indicate that CIPW norm-based diagrams exhibit low consistency with the QAP scheme [
25,
26]. For instance, the Q′–ANOR diagram shows an overall accuracy of only 55% (
Table 10;
Supplementary Figure S6), comparable to that of the SCK diagram. It performs poorly in identifying tonalite (~57%), quartz diorite (~54%), and diorite (~53%)—samples with plagioclase-to-total feldspar ratios exceeding 90%—while achieving better accuracy (~85%) for alkali feldspar granite (Zone 2) [
26].
In the P-Q, SCK, and Q′–ANOR diagrams, the quartz content indicator performs well for granitic rocks (zones 2, 3a, 3b, 4, 5; quartz/(feldspars + quartz) > 20%), but poorly for intermediate and basic types (zones 8, 9, 10, 10*; quartz/(feldspars + quartz) < 20%) (
Table 2 and
Table 5; [
26]). This discrepancy can be attributed to the higher mafic mineral content in intermediate and basic rocks, as noted by Galindo et al. [
23]. Furthermore, the empirical estimation of the alkali feldspar-to-plagioclase ratio leads to unsatisfactory discrimination among different granitic rocks (e.g., alkali feldspar granite, syenogranite, monzogranite, granodiorite) in these diagrams [
28,
33]. The presence of abundant micas also introduces significant inconsistencies between modal QAP and geochemical classifications [
1,
16].
Synthesizing the accuracy results from the P-Q, SCK, and Q′–ANOR diagrams yields several key observations:
Overall accuracy is relatively low, slightly above 50%—comparable to random chance;
Quartz content is more reliably identified than feldspar proportions, with the Q′–ANOR and P-Q diagrams performing better in this regard;
The SCK diagram shows high accuracy in identifying tonalite;
Accuracy improves significantly for granite (s.s.) when syenogranite and monzogranite are grouped together.
The inconsistency between the TAS and QAP classifications indicates that the TAS diagram is unsuitable for nomenclature of common intrusive rocks when the modal QAP scheme is used as the benchmark. Simply replacing volcanic rock names with their intrusive equivalents in the TAS diagram represents an oversimplification. This is because:
The QAP scheme is based on the proportion between plagioclase and alkali feldspar, while the TAS uses (Na2O + K2O) to approximate alkali feldspar content;
The QAP classification considers only quartz and feldspars, whereas the TAS diagram uses whole-rock SiO2 and (Na2O + K2O) values that include contributions from all minerals—particularly significant in basic and intermediate rock types.
Fundamentally, diagrams such as QUORAA, Q′–ANOR, P-Q, SCK, and TAS cannot serve as reliable diagnostic tools for granitoid nomenclature because they estimate major mineral proportions using only three or four major oxides. This approach is equivalent to dimensionality reduction in high-dimensional geochemical data, resulting in substantial information loss. Bonin et al. [
1] applied linear discriminant analysis (LDA) to granitoid major-element data and found that LD1 (mainly determined by SiO
2, TFeO, Na
2O, and K
2O) accounts for 53.6% of variance, LD2 (Al
2O
3, Na
2O) for 32.6%, and LD3 (CaO) for 9.8%. The geochemical diagrams considered here incorporate only three major oxides (SiO
2, K
2O, and CaO or Na
2O) from LD1, reflecting at most 50% of the major-element characteristics, whereas the QAP scheme effectively incorporates oxides contributing to LD1–LD3.
The IUGS-recommended QAP scheme focuses on felsic minerals [
34], but other minerals also contain Si, Ca, and alkali oxides. For example, micas—often the most abundant carriers of K and Al in granitoids—shift geochemical projections toward alkali feldspar-rich fields in the P-Q, SCK, and Q′–ANOR diagrams. Conversely, amphibole and pyroxene, which are Si-deficient and often Ca-rich, shift projections toward silica-poor and plagioclase-rich domains. These effects are particularly pronounced in melanogranitoids rich in mafic minerals [
5].
As noted by Santos and Hartmann [
28], Na is not a discriminating element in igneous rock classification, partly because it partitions into both plagioclase and alkali feldspar [
33]. The P-Q and Q′–ANOR diagrams lack a proper mechanism for allocating sodium between feldspars, potentially leading to misclassification. Similarly, the absence of CaO in the TAS diagram prevents accurate estimation of alkali feldspar-to-plagioclase ratios, resulting in inconsistency with QAP nomenclature.
Glazner et al. [
34,
35] argued that the IUGS-recommended classification of intrusive rocks is overly complex, with some names rarely used in practice. We therefore propose a simplified “low-resolution” scheme: merging Zones 2, 3a, and 3b into granite (broad sense); Zones 6, 6, 7, 7*, 8, and 8* into syenitic rocks; and Zones 9, 9*, 10, and 10* into dioritic rocks, while retaining granodiorite and tonalite as distinct categories. This simplification significantly improves the naming accuracy of the P-Q, SCK, and Q′–ANOR diagrams, with overall identification accuracy exceeding 70% (
Table 11). Both the Q′–ANOR and P-Q diagrams show high accuracy (>85%) for granite but perform poorly for tonalite (57% and 64%, respectively). Since granite constitutes about half of the compiled dataset, the overall accuracy of the Q′–ANOR and P-Q diagrams is slightly higher than that of the SCK diagram. However, based on median accuracy across the five major lithological categories, the SCK diagram performs best, achieving over 70% accuracy for tonalite, granite, dioritic rocks, and syenitic rocks, with only granodiorite showing lower accuracy (54%).
An intuitive and practical two-dimensional diagram for plutonic rock diagnostics should reflect both quartz content and alkali feldspar-to-plagioclase ratio—as in the Q′–ANOR, P-Q, and SCK diagrams—rather than follow the TAS approach. It should also adopt a simplified lithological categorization similar to the IUGS field QAP nomenclature, grouping common granitoids into five categories: granite, granodiorite, tonalite, syenitic rocks, and dioritic rocks. While the original 15-zone QAP diagram is useful for specialists, a “low-resolution” version is more suitable for general geoscientists and practitioners.
Linear programming methods can be used to derive the “true” mode of major minerals from bulk chemistry before projecting onto QAP diagrams [
36]. However, this approach requires individual computation for each sample and is less efficient than conventional two-dimensional diagram plotting.
