Article

Exploring the Structure–Property Relationship in Montmorillonite–Carbon Quantum Hybrid Nanomaterials

by
Elaine S. M. Cutrim
1,
Aline S. Figueredo
2,
Lucilene A. Silva
2,
Vanesa Fernández-Moreira
3 and
Ana C. S. Alcântara
1,*
1
Hybrid and Bionanocomposite Materials Research Group–Bionanos, Department of Chemistry, Universidade Federal do Maranhão, São Luís 65080-805, MA, Brazil
2
Laboratory of Immunophysiology, Universidade do Maranhão, CCBS, São Luís 65080-805, MA, Brazil
3
Departamento de Química Inorgánica, Instituto de Síntesis Química y Catálisis Homogénea (ISQCH), Universidad de Zaragoza, 50009 Zaragoza, Spain
*
Author to whom correspondence should be addressed.
Minerals 2025, 15(11), 1146; https://doi.org/10.3390/min15111146 (registering DOI)
Submission received: 4 September 2025 / Revised: 23 October 2025 / Accepted: 28 October 2025 / Published: 31 October 2025
(This article belongs to the Section Clays and Engineered Mineral Materials)

Abstract

Combining montmorillonite (MMT), a layered silicate clay, with carbon quantum dots (CQD) is a promising strategy to develop hybrid nanomaterials with enhanced and tunable properties. In this work, we explore the structure–property relationships in montmorillonite–carbon quantum dot (MCQD) hybrid nanomaterials synthesized through two distinct routes. In Route 1, pre-synthesized CQDs using citric acid and urea as precursors were physically mixed with MMT, giving rise to MCQD-R1 hybrid nanomaterials. In Route 2, MMT was added in situ in the CQD reaction medium before thermal treatment, with contact times from 1 to 16 h, generating MCQD-R2-1 and MCQD-R2-16, respectively. Structural and spectroscopy techniques were employed to investigate the resulting hybrids. PXRD analysis revealed that the synthesis conditions preserved the crystalline structures of both CQD and MMT clay. The FT-IR indicated that in the MCQD-R1, the interactions with CQD occur primarily via the interlayer water molecules in MMT, whereas in the MCQD-R2-16 samples, the establishment of new chemical bonds involving the carbonyl group of CQD takes place. UV-Vis spectroscopy shows improved colloidal stability of MCQD-R2 hybrids compared to pristine CQDs. Finally, hemolysis assays demonstrated hemolytic activity below 5%, indicating good biocompatibility of the synthesized hybrid nanomaterials.

Graphical Abstract

1. Introduction

The continuous evolution of human society increases the demand for innovative functional materials. In this regard, nanotechnology has made significant progress, enabling the hybridization of different classes of nanomaterials to surpass the limitations associated with single-component nanoparticle systems. Hybrid nanomaterials are defined as the combination of two or more components at the nanoscale that integrates the physical and chemical properties of the counterparts, often benefiting from the rise in synergistic effects that surpass the properties of each material alone [1,2]. This approach offers the possibility of altering their morphology, structure, and composition by modifying the fabrication route, resulting in a hybrid nanomaterial with improved thermal stability, mechanical strength, electrical conductivity, and optical properties [3,4].
Clay minerals are widely used to produce hybrid nanomaterials due to their outstanding properties, including high surface area, layer charge density, cation exchange, swelling capacity, chemical stability, and rheological behavior [5,6]. They also have the benefit of being abundant and low-cost materials, which is particularly attractive for large-scale applications. Montmorillonite (MMT), one of the most representative members of this class, is a 2:1 dioctahedral clay mineral composed of an alumina octahedral sheet sandwiched between two silica tetrahedral sheets (TOT) [7,8,9]. Moreover, the Si4+ in the silicon–oxygen tetrahedron can be replaced by cations such as Al3+ and Fe3+, while the Al3+ in the octahedron is easily replaced by Fe2+, Mg2+, and Zn2+, resulting in the formation of permanent negative charges on the MMT surface [9]. The occurrence of isomorphic substitution also results in ion exchange capacity, swelling behavior, and surface reactivity, allowing interactions with other structural entities such as molecules, particles, and ions, through different mechanisms [10].
Carbon quantum dots (CQDs) are a relatively new type of carbon nanomaterial that has attracted significant attention from the scientific community since their accidental discovery in 2004 [11]. Their excellent properties include simple and low-cost synthesis, good biocompatibility, and tunable optical features [12,13,14]. CQDs are zero-dimensional nanoparticles (<10 nm) characterized by a sp2 core and abundant functional groups on their surface, such as hydroxyl and carbonyl, and amine groups, which contribute to their high hydrophilicity [12]. However, some drawbacks of CQD are associated with nanoparticle aggregation, which leads to fluorescence quenching and loss of stability, limiting their applications [15]. Integrating CQDs with layered hosts such as MMT offers a promising strategy to mitigate these drawbacks. The high surface area and negatively charged layers of MMT facilitate interactions with functional groups of CQD, helping to prevent the aggregation of these nanoparticles. Moreover, MMT can provide a protective microenvironment that improves CQD photostability, extending their lifetime in aqueous and biological media.
In the literature, an association is reported between carbon dots and clay minerals, such as bentonite [16], saponite [17], and halloysite [18]; however, the association of MMT and CQD is still scarce. Qu and coworkers reported the synthesis of green-emissive carbon dot@montmorillonite (g-CDs@MMT) materials that were prepared by embedding g-CDs into the structure of MMT clay. To obtain the CDs, a microwave method was employed, using citric acid and urea as precursors in the presence of water. Due to the confinement of g-CDs in the MMT clay matrix, g-CDs are uniformly dispersed in the resulting g-CDs@MMT, which efficiently prevents the aggregation-induced luminescence quenching of g-CDs [19]. Yu and co-workers demonstrate the rapid synthesis of nitrogen and sulfur co-doped carbon dot@montmorillonite (C-dots@PGV) by adsorption onto Na+-MMT clay. The resultant C-dots@PGV exhibited intense blue photoluminescence under UV light, good dispersibility, and enhanced stability compared to C-dot aqueous solutions [20]. Despite these works, studies addressing the fabrication of MMT-CQD hybrid material via in situ synthesis were not reported. Therefore, this work aims to fill this gap by synthesizing MMT–CQD hybrid nanomaterials via two distinct routes: physical mixing of pre-synthesized CQDs with MMT, and in situ CQD formation in the presence of MMT. To elucidate the structure–property relationships in these hybrid nanomaterials, a comprehensive structural, optical, and biocompatibility study was conducted.

2. Materials and Methods

2.1. Materials

A natural Wyoming montmorillonite clay with Na+ interlayer cation with a Cation Exchange Capacity (CEC) of 93 mEq per 100 g was purchased from Southern Clay Products/BYK (Gonzales, TX, USA) and corresponds to the commercial product Cloisite® Na+, which was used as received. Representative chemical composition for this grade is available in the literature [21]: SiO2 59.50 wt%, Al2O3 21.30 wt%, Fe2O3 4.24 wt%, MgO 2.37 wt%, Na2O 3.84 wt%, CaO 0.47 wt%, TiO2 0.12 wt%, with loss on ignition (LOI) ≈ 7.03 wt% (XRF). Small batch-to-batch variations are possible due to the natural origin of the clay. Dimetilformamide (DMF, >99.8%) and citric acid (CA) were purchased from Êxodo (Sumaré, SP, Brazil). Urea (U) (>99.0%) was provided by Dinâmica (Indaiatuba, SP, Brazil). Sodium hydroxide (>98%) was provided by Synth (Diadema, SP, Brazil).

2.2. Synthesis of Carbon Quantum Dots

Nitrogen-doped CQD was obtained following a procedure reported by Qu and coworkers [22] (Figure 1). In a typical synthesis, citric acid (1 g) and urea (2 g) in a molar ratio of 1:6.4 were added to 10 mL of DMF and sonicated until the precursors were dissolved. The solution was transferred to a 15 mL Teflon-lined stainless-steel autoclave and then heated to 160 °C for 6 h. The obtained dark brown solution was cooled to room temperature naturally before being mixed with 20 mL of NaOH aqueous solution (50 mg·mL−1) and centrifuged at 15,000 rpm for 30 min. The precipitate was collected, suspended in deionized water, centrifuged twice under the same conditions described above, and then freeze-dried at −35 °C for 72 h to obtain the powder product. The addition of sodium hydroxide during the purification step neutralizes carboxyl groups and other acidic by-products, favoring the formation of surface functional groups.

2.3. Preparation of Montmorillonite–Carbon Quantum Dots Hybrid Nanomaterials

Two synthesis routes were adopted to synthesize montmorillonite–carbon quantum dots hybrid nanomaterials. In the first synthesis route, 10 mg of previously prepared CQD and 50 mg of the MMT were dispersed separately in 25 mL of deionized water and stirred for 1 h. The prepared CQD solution was poured into the MMT dispersion and stirred continuously for 24 h. After the reaction time, the system was centrifuged for 10 min at 8000 rpm, washed twice with deionized water, and then dried at 50 °C for further experiments. In the second route, the CQD was prepared in situ. For this, citric acid (1 g) and urea (2 g) were solubilized in DMF, and 50 mg of natural Wyoming Na+ MMT was added. This mixture was allowed to stir for 1 h or 16 h, resulting in MCQD-R2-1 and MCQD-R2-16, respectively. After this, the mixture was transferred and reacted for 6 h at 160 °C. The purification of the material followed the same procedure as for pure CQD.

2.4. Characterization

Powder X-ray diffraction (PXRD) patterns were recorded on a Bruker D8 Advance diffractometer, equipped with a CuKα radiation source (λ = 1.5406 Å), operating at 40 kV and 35 mA, over a 2θ range of 5°–70°, with a step size of 0.02° and an acquisition time of 1.5 s per step. The basal space was calculated from Bragg’s law [5], as shown by Equation (1).
n λ = 2 d s i n   θ ,
where it is assumed n = 1 for the first order reflection, λ is the wavelength of the X-ray beam, d is the distance between the lattice planes, and θ is the diffraction angle. The graphitic-like (002) reflection of CQDs at 2θ ≈ 26.5–27.2° was fitted (24–29.5°) using a pseudo-Voigt profile with linear background to obtain the full width at half maximum (FWHM). The crystallite stacking thickness Lc was estimated by the Scherrer equation, Lc = Kλ/(βcosθ) with K = 0.9 and λ = 1.5406 Å.
The vibrational spectra for all samples were obtained using a Bruker TENSOR 27 FTIR (Ettlingen, Baden-Württemberg, Germany) spectrometer equipped with an ATR (Attenuated Total Reflectance, Ettlingen, Baden-Württemberg, Germany) detector using a BaCl2 cell. The spectra were recorded in the 400–4000 cm−1 range, at a spectral resolution of 2 cm−1 over 64 scans. The thermal behavior of the different materials was obtained using an SDT650 thermal analyzer (TA Instruments, New Castle, DE, USA) from 30 °C to 900 °C. The experiments were carried out under a synthetic air atmosphere (typically a mixture of oxygen and nitrogen used to mimic the composition of air) in a flux of 50 mL min−1 at a heating rate of 10 °C min−1. Approximately 5–10 mg of each sample was used in the analyses. The elemental analysis was carried out in CHN Analyzer 2400 Series II equipment (Perkin Elmer, Shelton, CT, USA). The absorption spectra were acquired using a Hinotek UV-6100 Ultraviolet-visible spectrophotometer (China). The emission spectra of CQD and the hybrid nanomaterials were recorded on a Fluorolog-3 FL3-122 spectrofluorometer from Horiba Jobin Yvon (Edison, NJ, USA). For the measurements, aqueous solutions of the materials were prepared and then excited with progressive increments of 25 nm in the range of 350 nm to 750 nm for emission spectra. The slit was maintained at 3 nm for all measurements. Lifetimes were measured in a PicoQuant, FT300 fluorescence spectrometer (Berlin, Germany). Compounds were excited with a 450 nm picosecond pulsed diode laser (P-C-450, PicoQuant) with an 80 MHz repetition rate. Signals were digitized with a Time Harp 260 PCI card (PicoQuant). Data were recorded in wizard measurement mode of EasyTau software and processed by EasyTau Analysis software (2.3.3485 version) using an exponential re-convolution mode.

2.5. Hemolysis Test with Sheep Erythrocytes

The in vitro hemolytic activity of the hybrid nanomaterials and their respective counterparts was evaluated according to the International Standard Organization 10993 part 5 [23], following the methodology adapted from Almaaytah et al. (2014) [24]. For this, 10 mL of sheep blood was collected in a tube containing EDTA, authorized by the ethics and research committee of the Federal University of Maranhão (CEUA, process nº 23115.005441/2017-62). The blood was centrifuged at 2000 rpm for 10 min at 20 °C, the plasma was removed, and the erythrocytes were washed three times with phosphate-buffered saline (PBS). After, an aliquot of 100 μL of 5% v/v erythrocyte solution (in saline 0.9% w/v) was mixed with 200 μL of the sample test solutions in 96-well microplates with concentrations ranging from 1000 to 7.81 μgmL−1, and incubated for 1 h at 37 °C. The positive and negative controls received 100 μL of Triton x-100 at 1% and PBS, respectively. After the incubation time, the samples were centrifuged at 2000 rpm for 10 min at 20 °C. The supernatant was removed, transferred to a microplate reader, and its absorbance was measured at 450 nm.
The hemolytic activity was expressed as a function of the action of Triton x-100 and calculated by the following formula:
H e m o l y s i s   % = A b s   s a m p l e A b s   P B S A b s   T r i t o n   x 100 A b s   P B S × 100
where Abs sample is the group of erythrocytes treated with the sample tests; Abs PBS is the group treated with only PBS; and Abs Triton x-100 is the group treated with Triton x-100.

3. Results

3.1. Structural Properties

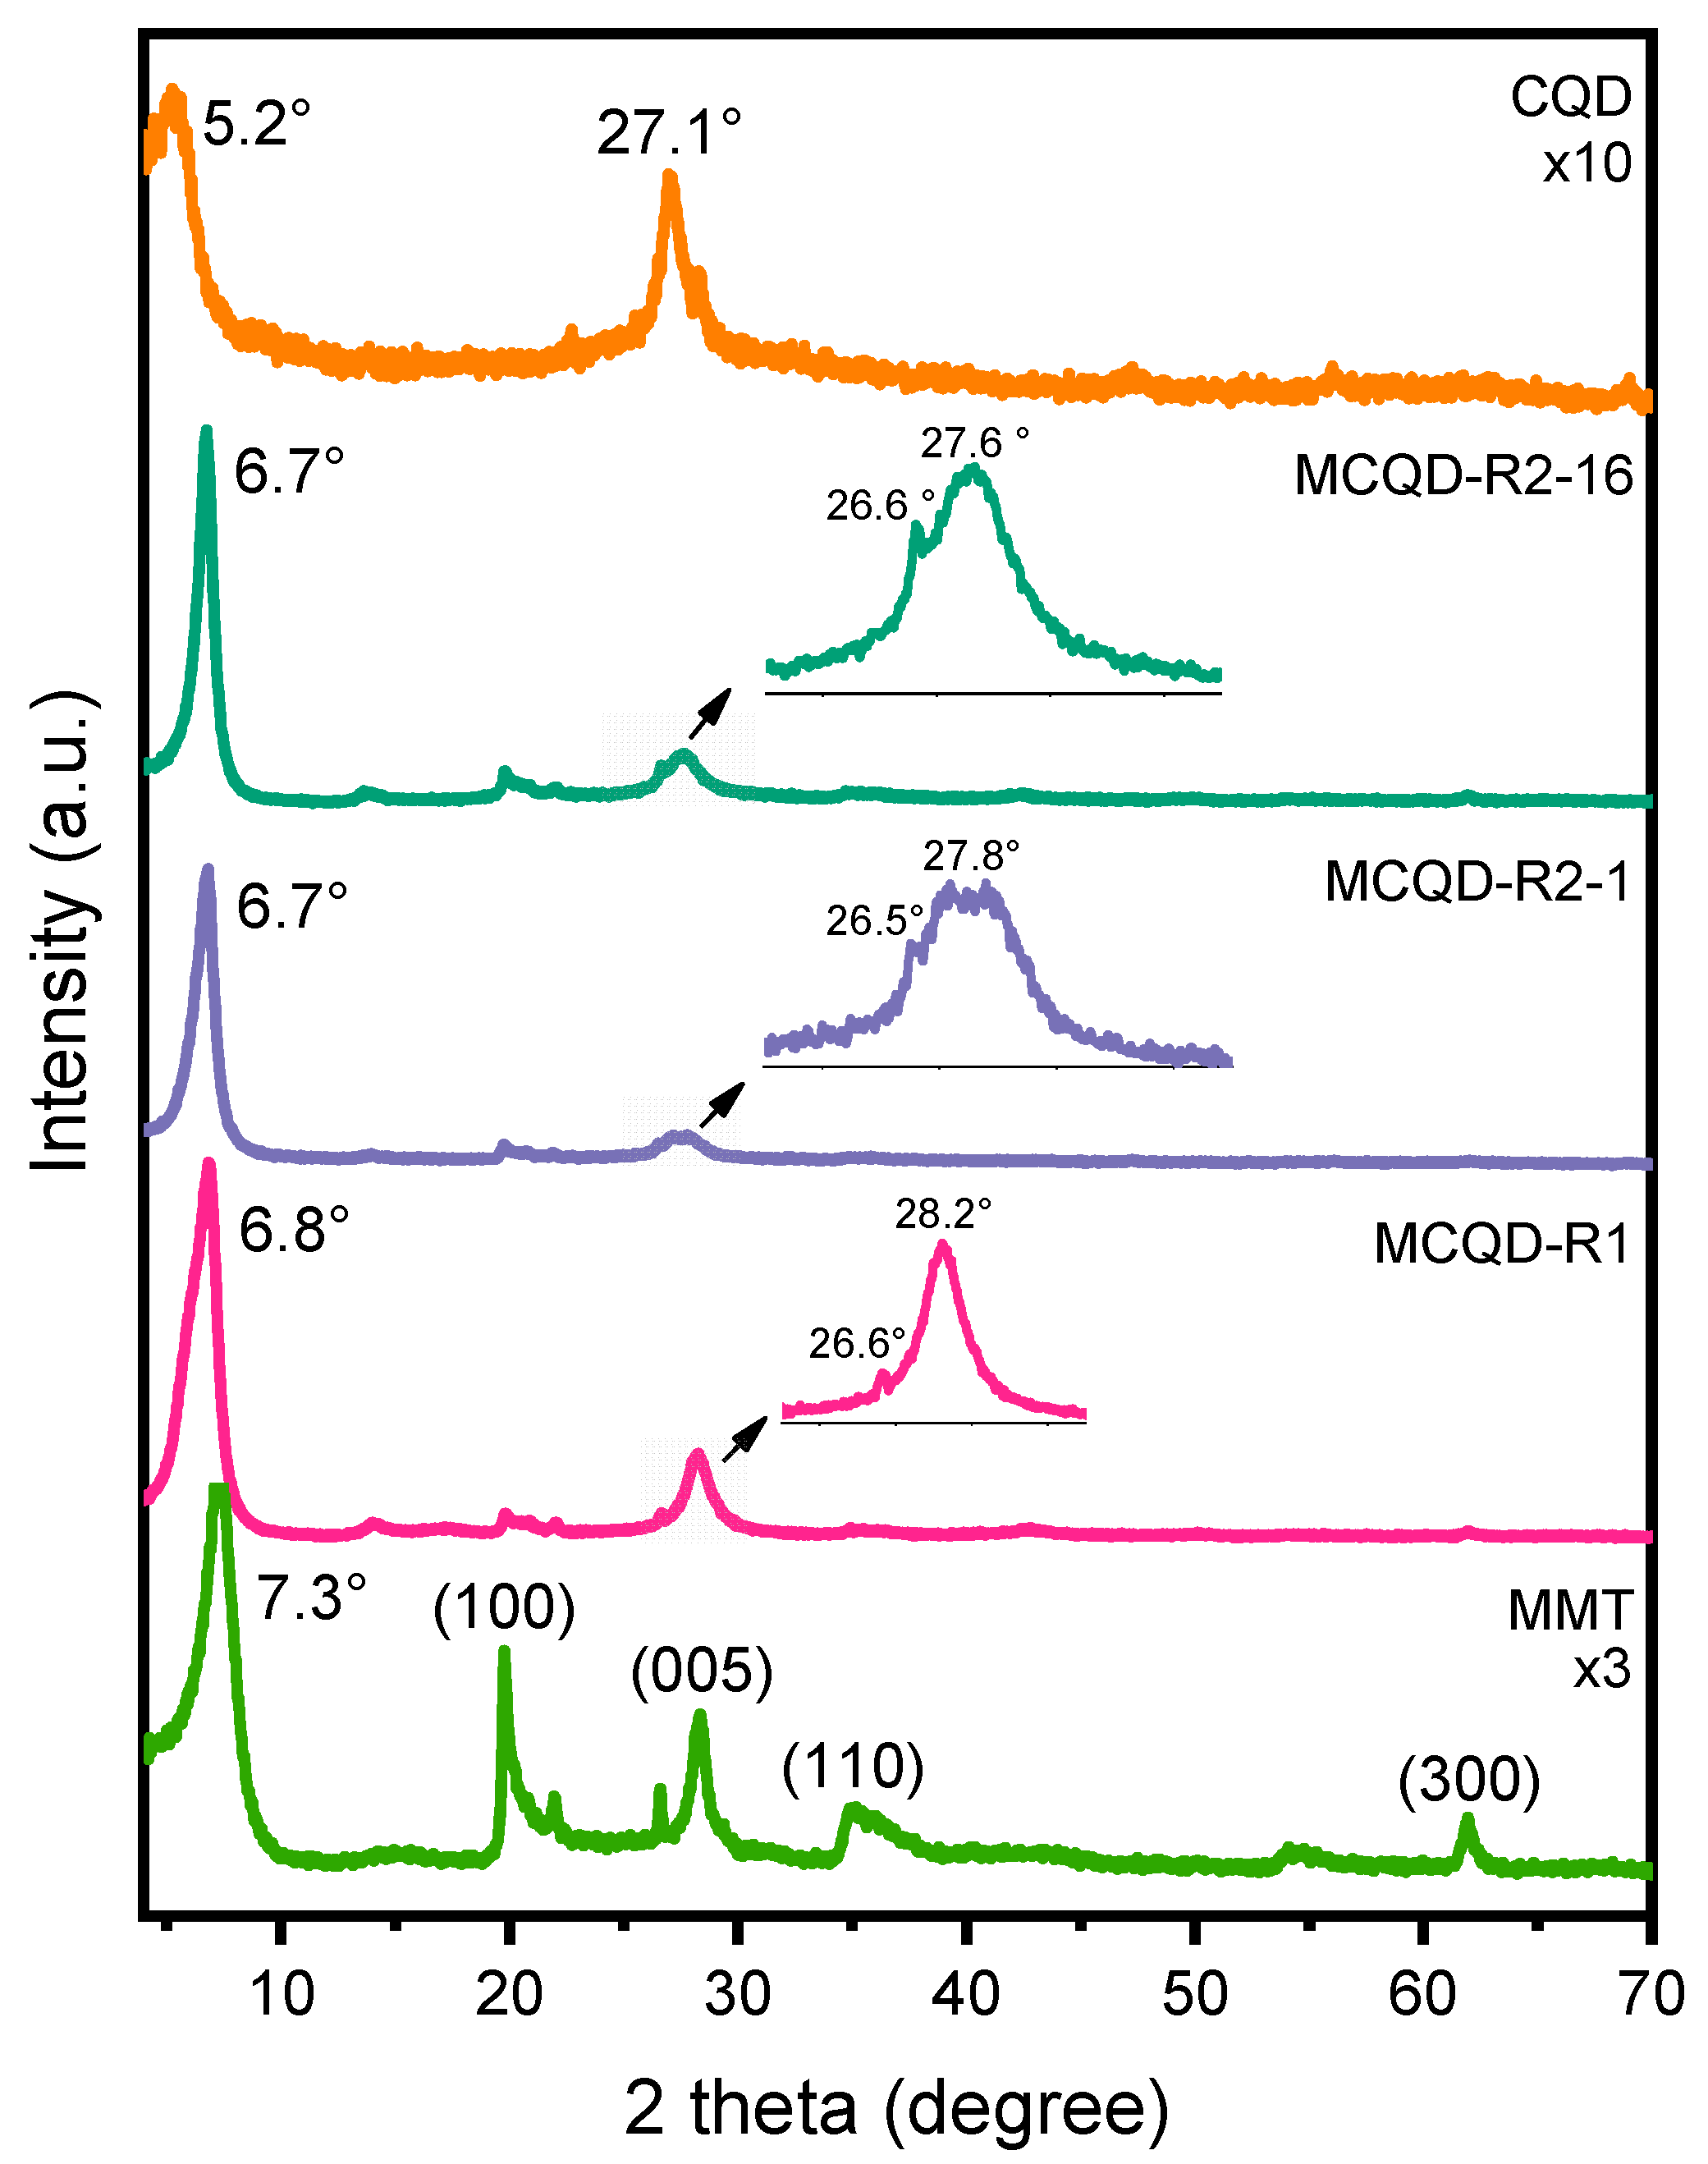
In this study, different synthesis routes are investigated to synthesize hybrid nanomaterials by integrating montmorillonite, a lamellar clay, with carbon quantum dots. Initially, PXRD analysis was conducted on the neat nanomaterials, and then in the hybrid nanomaterials to evaluate if any of the conditions in the synthesis process, i.e., in situ procedure, thermal treatment, basic medium, or solvent, act to modify the structure of clay or CQD. Figure 2 shows the diffraction patterns for CQD, exhibiting peaks at 2θ = 5.4° (d = 1.7 nm) and 2θ = 27.1° (d = 0.33 nm). The first peak can be attributed to the (001) plane diffraction of graphite oxide that occurs at 2θ = 10.6° (JCPDS no 00-041-1487). For CQD, this peak shifted toward lower angles, which is associated with the presence of functional groups such as hydroxyl, carbonyl, carboxylate, and amino groups formed at the edges of the sheets, leading to an increase in the interlayer spacing and introducing structural disorder. The second peak shows a slight difference in d-space from the (002) plane (2θ = 26.5°; d = 0.34 nm) in pure graphite (JCPDS 96-901-2231), exhibits FWHM = 1.478°, yielding a Scherrer stacking thickness Lc = 5.53 nm, which could indicate the formation of a nonideally arranged graphite-like structure [25]. Moreover, the distinct interlayer spacing might be indicative of a heterogeneous multilayered structure [26]. The peaks observed are broad and possess low intensity, indicating a partial graphitization and the presence of disordered carbon, which is consistent with other reported CQD [27,28,29,30,31].
For pristine MMT, peaks at 2θ = 7.3°, 19.8°, 28.3°, 35.0°, and 62.0° are observed in correspondence with the reflection planes (001), (100), (005), (110), and (300), respectively. Considering the sheet thickness of MMT to be 0.96 nm [32], the basal spacing of 1.21 nm (2θ = 7.3°) is observed, consistent with rich Na+-MMT [33]. Considering the hybrid nanomaterials, it is possible to observe diffractions associated with the presence of CQD. For MCQD-R1, the diffraction planes noted at 2θ = 26.5° and 2θ = 28.2° (in detail) are in correspondence with CQD and MMT, respectively. In the MCQD-R2-1 and MCQD-R2-16 hybrid nanomaterials, the diffraction planes observed at 2θ = 26.5° and 2θ = 26.6° are associated with CQD, while the peaks at 2θ = 27.8° and 2θ = 27.6°, respectively, are related to the presence of MMT. In general, slight displacements in this region are observed, suggesting minor structural alteration in the hybrid nanomaterials compared to their counterparts. The intensity associated with CQD in MCQD-R1 seems to be lower compared to MCQD-R2-1 and MCQD-R2-16, which may be related to its content in the hybrids.
Figure 2 also shows that the hybrid nanomaterials exhibit displacements to lower angles in 2θ of the reflection plane (001) associated with MMT. Using Bragg’s Law, the increase in the interlayer spacing was calculated to be 0.34 nm for MCQD-R1 and 0.36 nm for both MCQD-R2-1 and MCQD-R2-16. These results indicate that the expansion of MMT is not particular to a specific synthesis route; however, a higher increment is observed in the hybrid nanomaterials obtained from the in situ approach. In a previous work reported by the group, the average CQD diameter was determined to be 4.8 nm [34], indicating the increments observed in the hybrids are not sufficient to accommodate the CQD nanoparticles. In a previous work reported by the group, the average CQD diameter was determined to be approximately 4.8 nm [34], which is significantly larger than the basal spacing increase observed in the hybrids (0.34–0.36 nm). Therefore, the expansion of MMT cannot be ascribed to CQD intercalation. Instead, this minor shift may result from possible structural relaxation and reorientation of interlayer water molecules and/or the presence of ultrathin carbonaceous domains, such as a single graphene layer (thickness = 0.34 nm) generated during synthesis, as demonstrated by Chen et al. [35] in studies about the thermal treatment of crystal violet on MMT. Thus, these findings indicate that the CQDs primarily interact with montmorillonite through surface and edge-site anchoring rather than interlayer insertion.
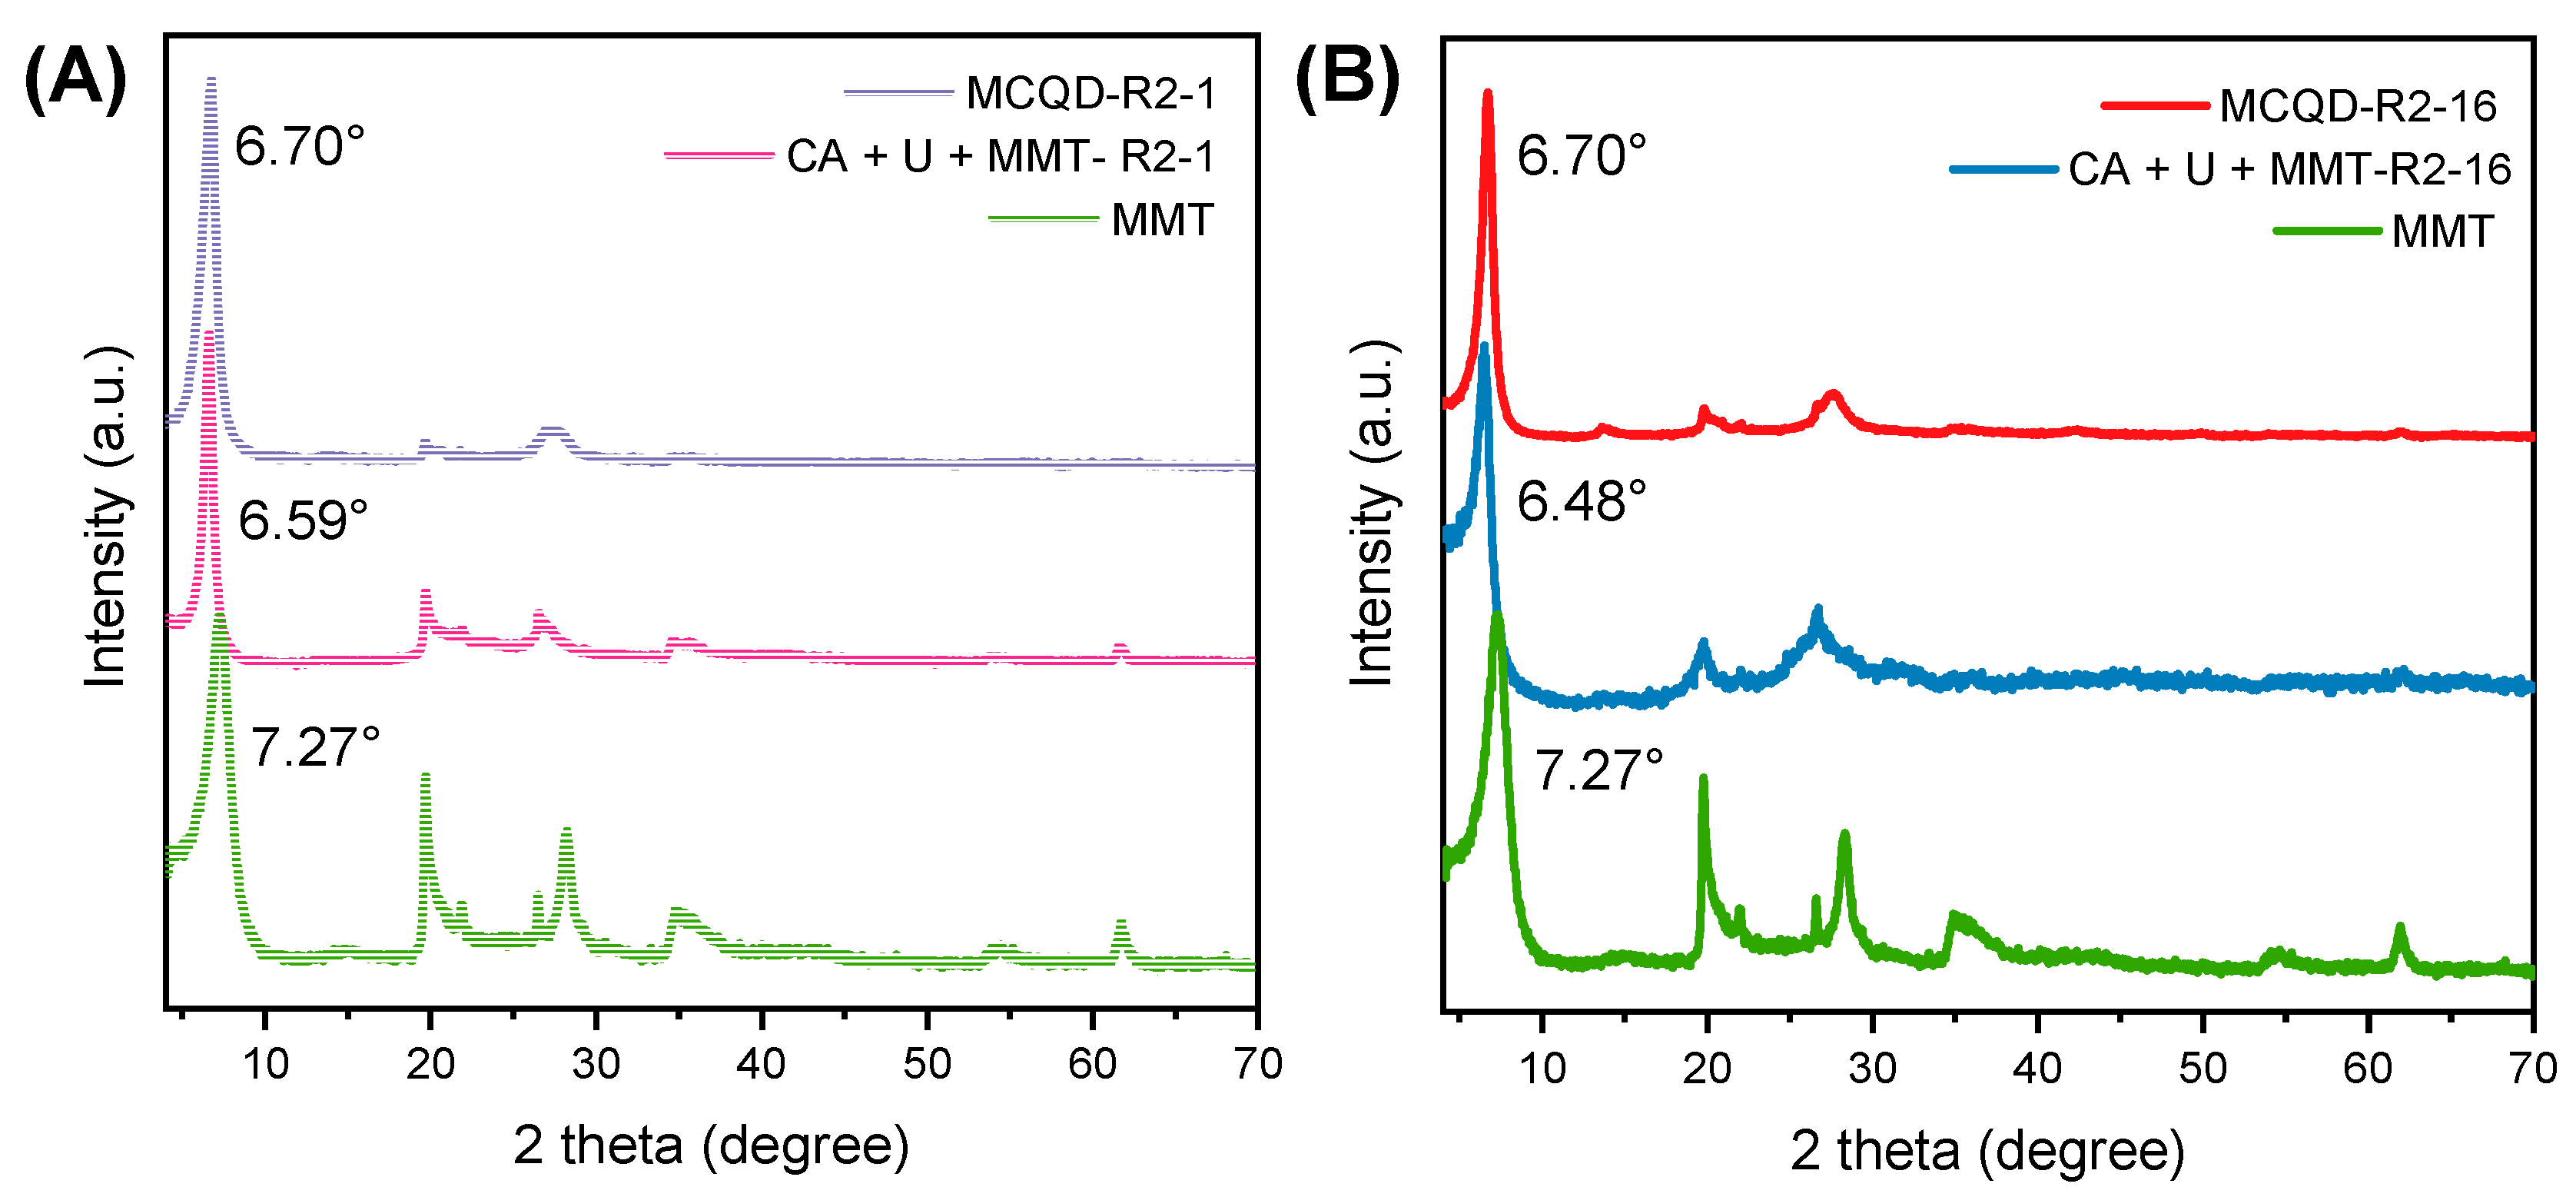
Moreover, XRD analysis was carried out to investigate whether the increment in the interlayer space occurs before or after the thermal treatment during the hybrid’s preparation. For this, CA and U were solubilized in DMF, and then MMT was added. The mixture was kept under stirring for 1 h (R2-1) or 16 h (R2-16) and then centrifuged. The resultant samples were analyzed, and from Figure 3, it is possible to see that a time of contact of 1 h was sufficient for the intercalation of species in MMT. The MCQD-R2-16 shows a slight displacement for lower angles (2θ = 6.48°), which could be the result of a longer contact time. However, after the thermal treatment, both hybrid nanomaterials presented the same value in 2θ = 6.70°.
Elemental analysis was used to obtain the composition of CQD as well as to determine their amount in the hybrid nanomaterials. From Table 1, it is possible to observe that MCQD-R1 possesses the lowest content of CQD, 9.63% in weight, compared to 89.32% and 34.00% for MCQD-R2-1 and MCQD-R2-16 hybrid nanomaterials, respectively. The lower content associated with route 1 might be associated with the possible leaching of highly soluble CQD nanoparticles during the synthesis process. Interestingly, the CQD content was markedly lower in MCQD-R2-16 (34.00 wt%) compared to MCQD-R2-1 (89.32 wt%). This counterintuitive result may be associated with the prolonged precursor–clay contact time. Extended stirring (16 h) could favor precursor aggregation or partial carbonization, leading to less efficient CQD formation and anchoring within the MMT structure. In addition, excessive precursor adsorption on the external surface of MMT might block interlayer sites, thus reducing the effective incorporation of CQDs during the hydrothermal step. Similar behaviors have been reported in related nanocomposite systems [36], where extended reaction times or excessive precursor concentration resulted in decreased nanoparticle incorporation and poorer dispersion due to overgrowth or aggregation phenomena. In our case, the comparison between R2-1 and R2-16 suggests that shorter contact time facilitates more effective precursor utilization and homogeneous CQD nucleation in the presence of montmorillonite, while prolonged contact time reduces incorporation efficiency.
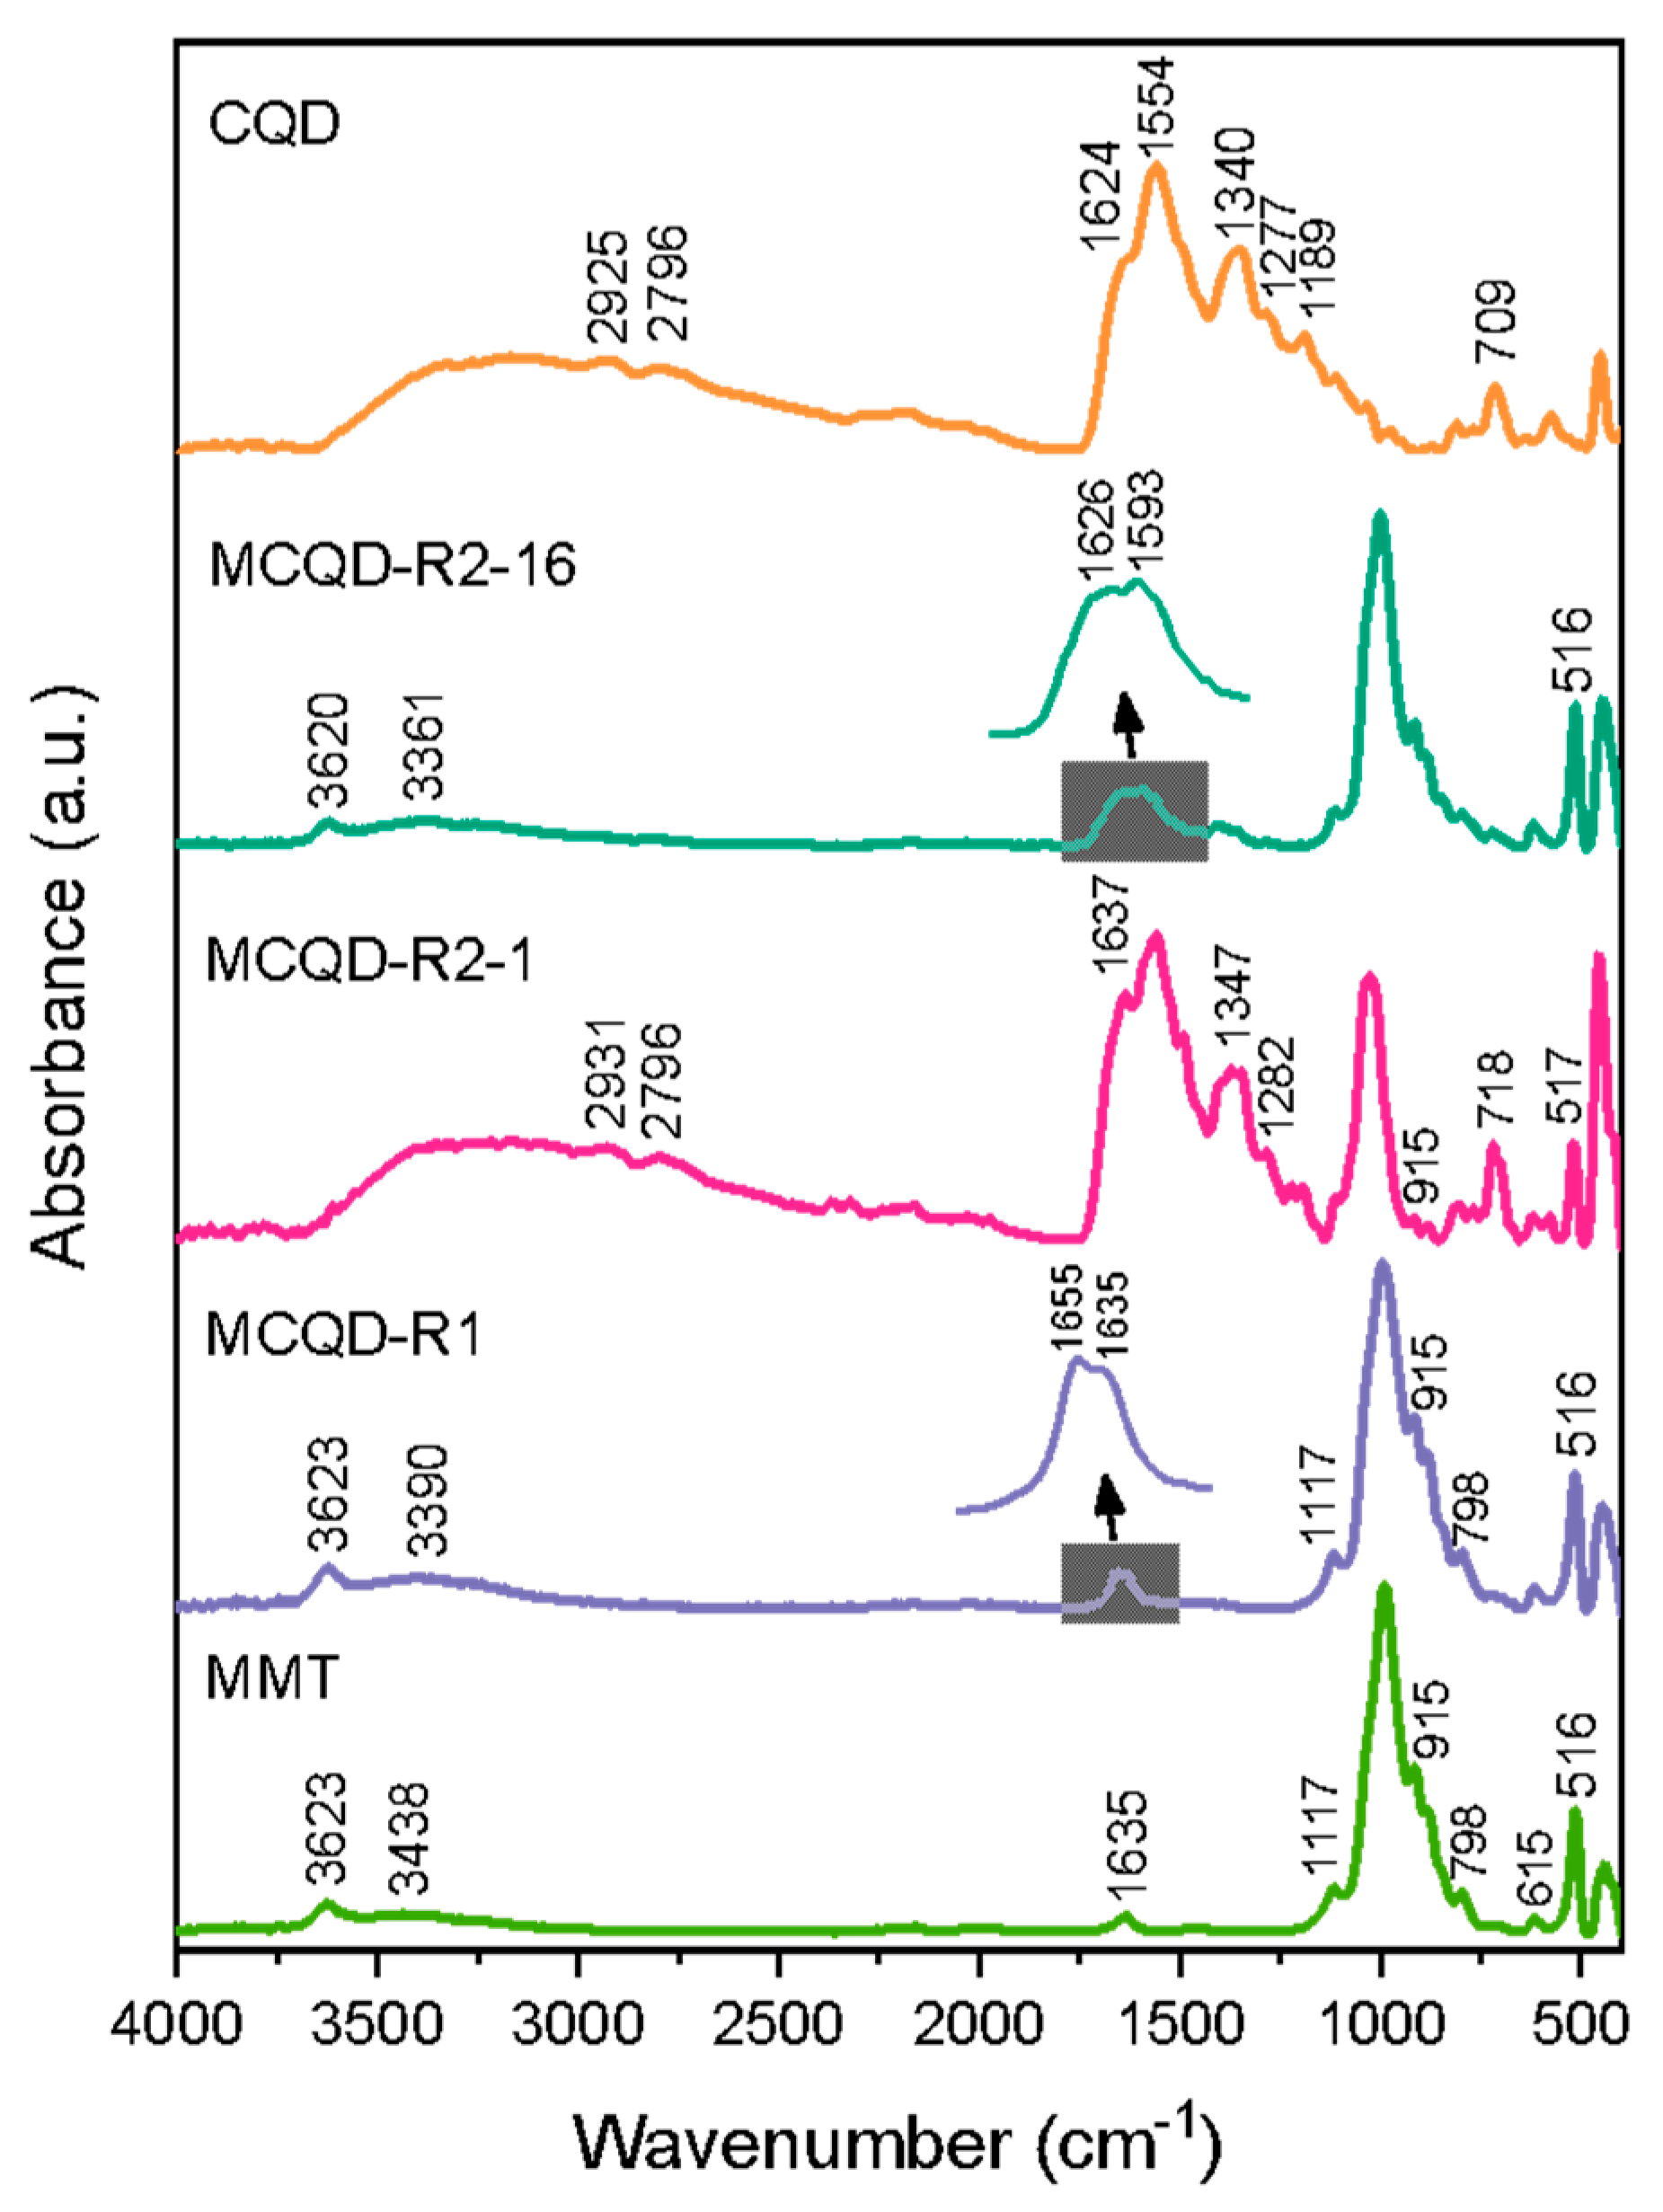
To understand the possible interactions between MMT and CQD in the hybrid nanomaterials, FT-IR analysis was conducted (Figure 4). The spectrum of pure CQD shows a broad band with maxima at 3318 cm−1 and 3093 cm−1 related to the stretching vibration of -OH and -NH groups, respectively [37]. The bands at 1624 cm−1, 1554 cm−1, and 1340 cm−1 can be associated with the stretching vibration of C=O and the asymmetric and symmetric stretching of the COO- group, respectively. At 1189 cm−1, a band associated with the bending vibration of the C-O bond in oxygen-containing groups can be observed. The presence of these groups is essential to the high solubility of the CQD nanoparticles. The bands at 2925 cm−1 and 2796 cm−1 represent the asymmetric and symmetric C-H stretching vibration. The shoulder appearing at 1491 cm−1 is attributed to the stretching vibration of C=C in aromatic structure, indicating the formation of the characteristic sp2 core in CQD. At 1277 cm−1, it is possible to see a band related to the -C-N that could indicate the successful nitrogen doping during the synthesis [38]. In wavenumbers below 1000 cm−1, it is common to observe modes attributed to O-H, C-H, and aromatic ring bending vibration. In general, the spectrum of carbon quantum dots demonstrates the presence of an aromatic structure doped with nitrogen and co-functionalized by both amino groups and oxygenated groups.
The FT-IR spectrum of pure montmorillonite exhibits a band located at 3623 cm−1 attributed to the OH stretch of structural Al-OH bonding, while the bands centered at 3438 cm−1 and 1635 cm−1 represent the -OH stretching and bending vibrations of the interlayer water molecules. Additionally, the vibration at 1117 cm−1 is related to the stretching of the Si-O out-of-plane [39,40]. The most intense bands in the MMT spectrum appear at 990 cm−1 and 516 cm−1, representing the in-plane stretching and bending vibrations in the Si-O bond, respectively. The bands at 915 cm−1 and 884 cm−1 originate from AlAlOH and AlFeOH bending vibrations, respectively. Moreover, the band at 798 cm−1 corresponds to the deformation vibration of the Si-O bond of quartz and/or silica, which is present as an associated phase. The band at 615 cm−1 is assigned to the coupling vibrations of the Al-O group of the MMT structure, and the band at 463 cm−1 corresponds to the deformation of the Si-O-Si groups [41,42,43].
The MCQD-R1 hybrid nanomaterial possessed a spectrum similar to MMT; however, it is possible to see displacements in the bands associated with CQD. The band related to the stretching of interlayer water is shifted from 3438 cm−1 in MMT to 3390 cm−1 in the MCQD-R1. In addition, the band observed at 1655 cm−1, as can be seen in detail, could be ascribed to the stretching vibration of the C=O bond, occurring at 1624 cm−1 in pure CQD. These displacements indicate the establishment of specific interactions between CQD functional groups, particularly C=O and OH, and the hydrated surface of MMT, suggesting local structural perturbations associated with these interfacial contacts.
The MCQD-R2-1 hybrid possesses a spectrum more similar to CQD due to a higher content of carbon quantum dots. A broad band between 3600 and 3000 cm−1 is observed, covering the stretching vibrations of -NH and -OH functional groups. The band associated with the C=O stretching vibration is shifted from 1624 cm−1 in CQD to 1637 cm−1. In addition, this band became sharper in the MCQD-R2-1 spectrum, which might be indicative of the formation of new bonds as reported by Fang et al. [44]. The bands associated with the asymmetric and symmetric stretching of the COO- group for pure CQD are located at 1558 cm−1 and 1347 cm−1 in the MCQD-R2-1. The displacements described previously suggest the involvement of these groups in interactions between MMT and CQD. The band at 1490 cm−1, ascribed to C=C stretching vibration in the sp2 core of CQD, became more intense, and the vibration of the C-N bond shifted from 1277 cm−1 in pure CQD to 1282 cm−1 in the hybrid. In addition, it is possible to observe the rise in a band of 718 cm−1 in the MCQD-R2-1 spectrum that is ascribed to vibrations associated with the aromatic ring, suggesting possible modifications in the structure of CQD.
For MCQD-R2-16, the band ascribed to the vibrations of interlayer water is located at 3361 cm−1. The bands related to the stretching vibrations of C=O bonds and with the asymmetric and symmetric stretching of the COO- group for CQD are exhibited at 1626 cm−1, 1593 cm−1, and 1362 cm−1, respectively. It is worth mentioning that the greater shift in the bands associated with the vibrations of the carboxyl group is found for MCQD-R2-16, which suggests that a longer synthesis time might affect the interactions between MMT and CQD. The band associated with vibrations of the aromatic ring shifts from 708 cm−1 to 722 cm−1, similar to what was observed for MCQD-R2-1. Notably, the Si-O in-plane stretching and bending vibrations observed at 990 cm−1 in pure MMT appear at 997 cm−1 in MCQD-R1, 1024 cm−1 in MCQD-R2-1, and 1000 cm−1 in MCQD-R2-16. These slight shifts suggest modifications in the local environment, likely arising from strong interactions between CQDs and the MMT layers. Overall, FT-IR corroborates that those interactions vary from weak water-mediated effects (R1) to stronger chemical bonding (R2), depending on synthesis time.
Beyond the descriptive evidence, a mechanistic understanding of the MMT–CQD interactions can be established based on the combined XRD, FTIR, Raman, and elemental data. Considering the CQD size (~4.8 nm) and the absence of a corresponding shift in the (001) basal reflection, interlayer intercalation can be ruled out. Thus, the dominant interactions occur at the external surfaces and edge sites of montmorillonite. In Route 1 (physical mixing), the association between the components is primarily mediated by weak, water-bridged hydrogen bonding, consistent with the lower CQD loading and limited spectral perturbations. In contrast, Route 2 (in situ synthesis) favors the nucleation and anchoring of CQDs directly on the clay surface, enabling multiple bonding modes: (i) electrostatic adsorption facilitated by exchangeable cations (e.g., Na+) acting as charge compensators in the diffuse layer, which reduces repulsion between the anionic CQD surface groups and the negatively charged clay planes [45]; (ii) hydrogen bonding with surface silanols and coordinated water molecules [46]; and (iii) acid–base or ligand–surface interactions at Al–OH and Mg–OH edge sites [47].
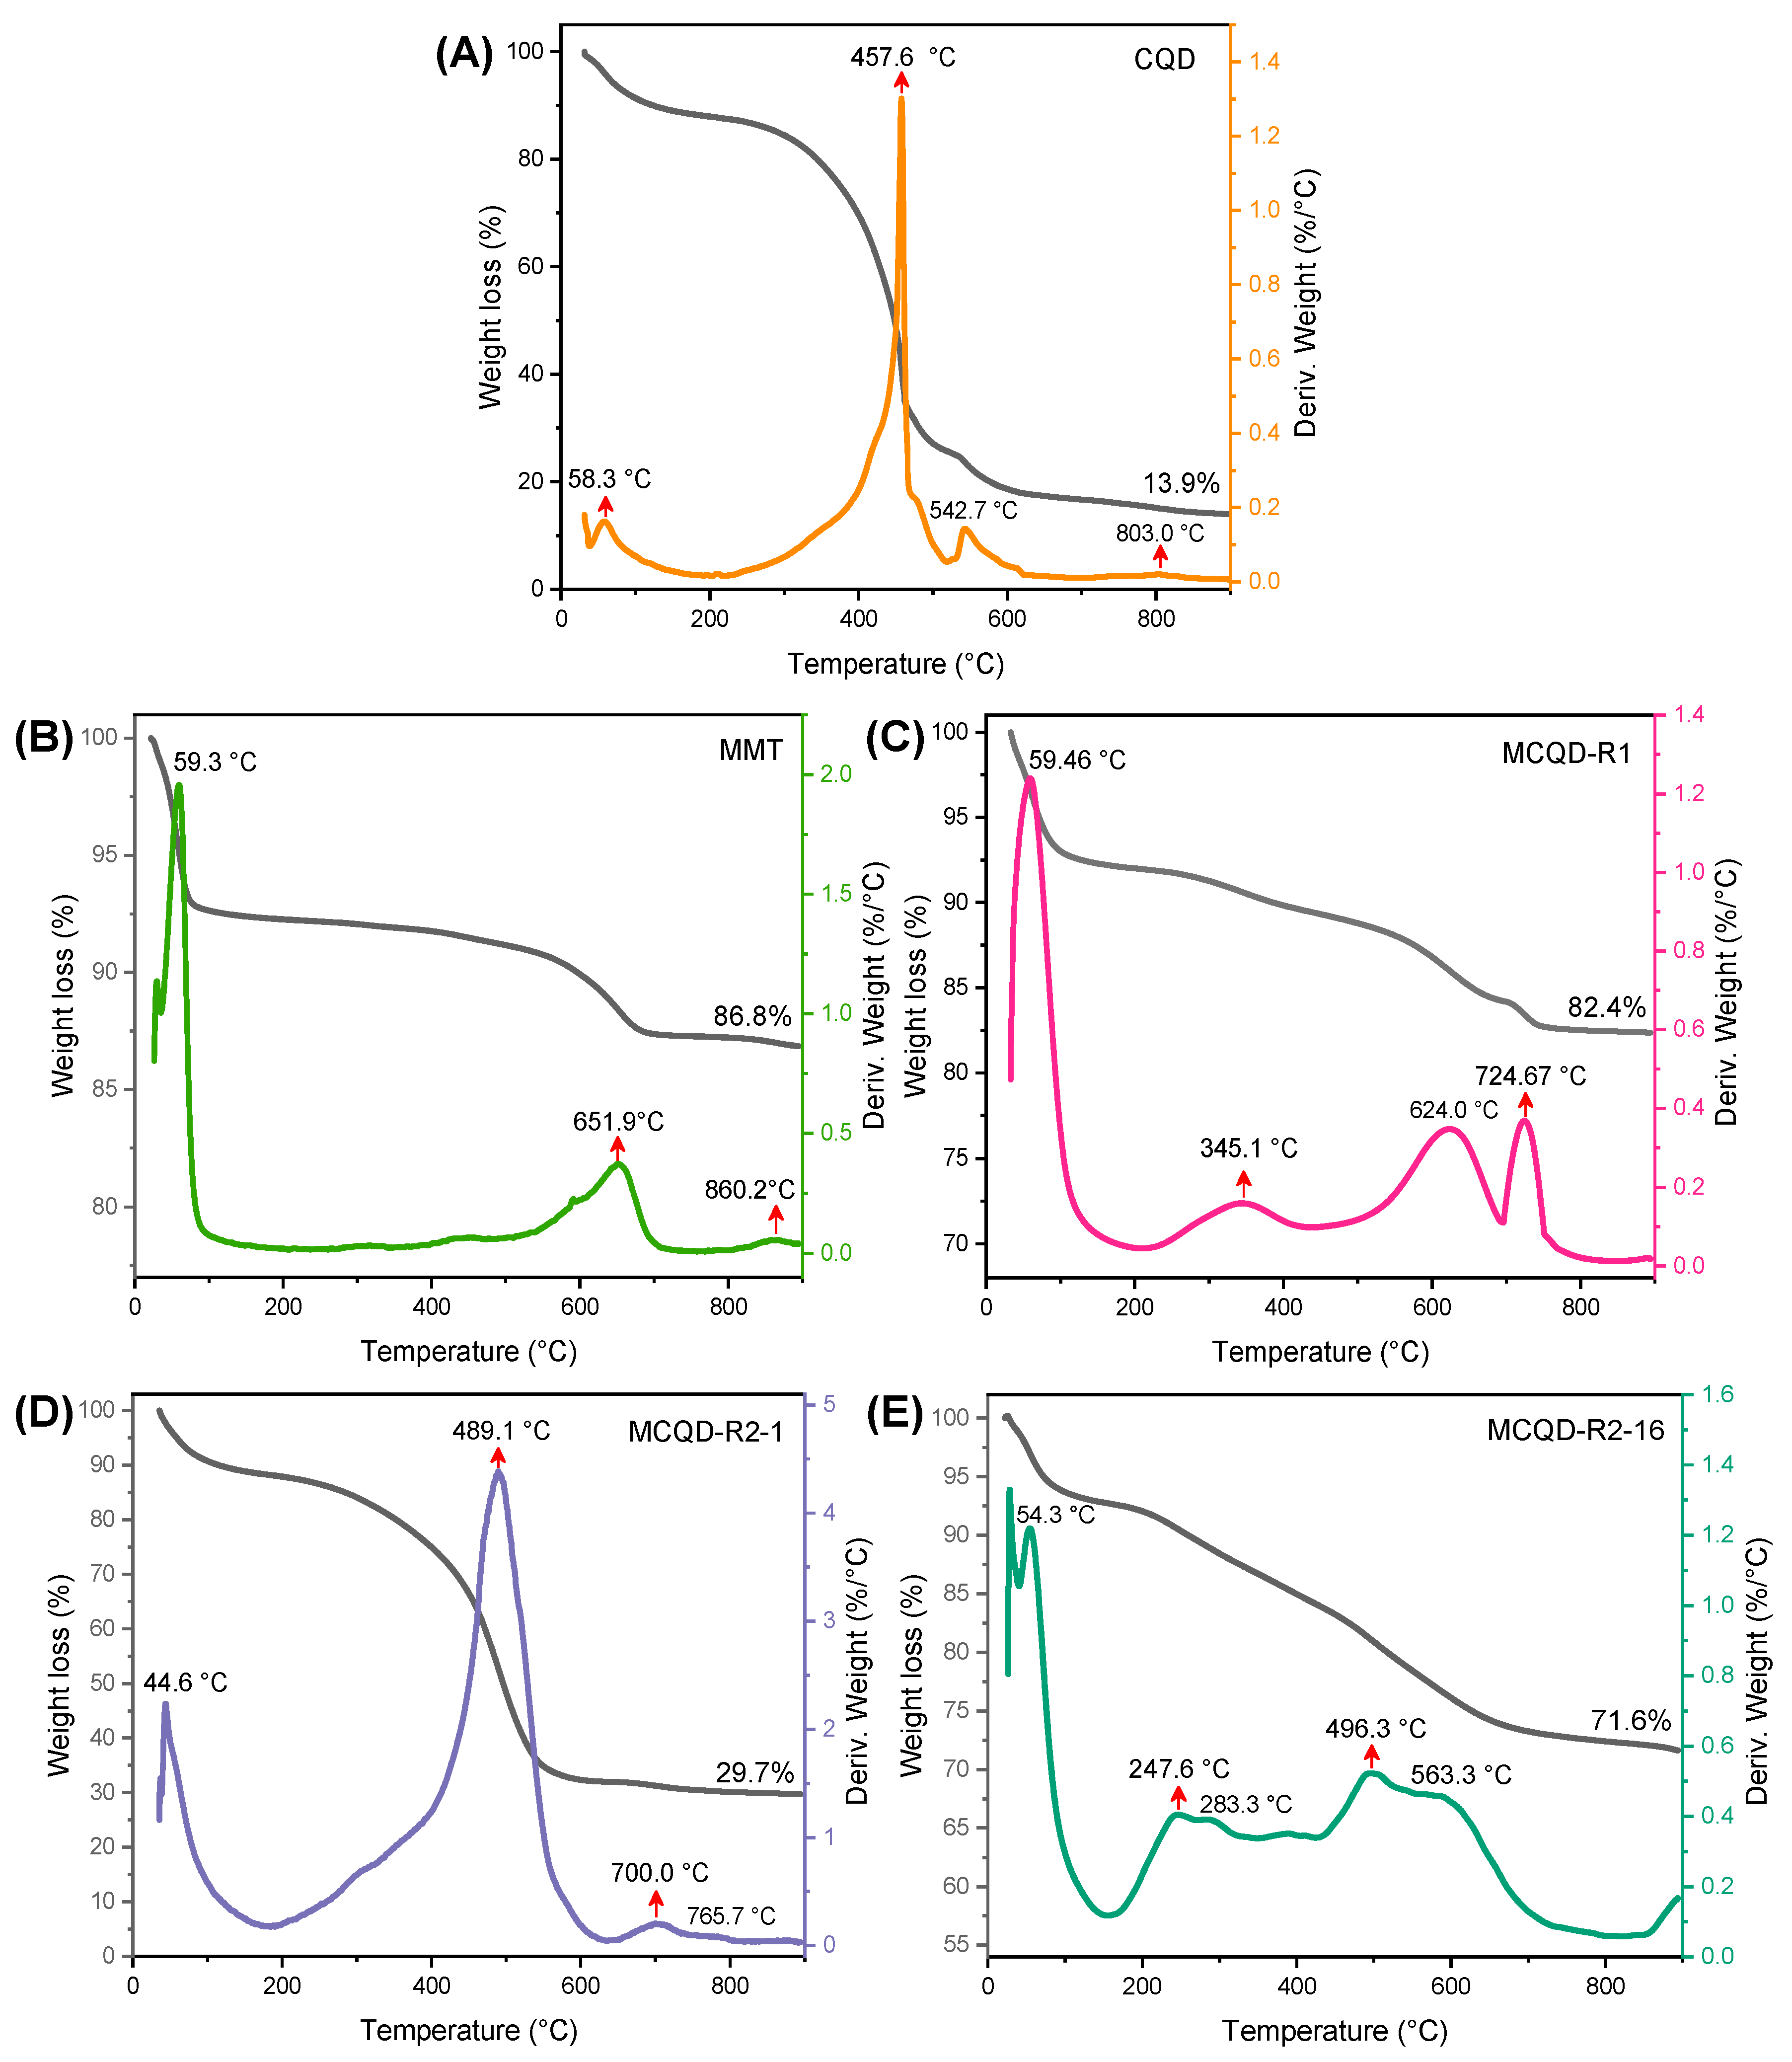
Thermal analysis was recorded in the range of 30–900 °C under a synthetic air atmosphere to evaluate the thermal stability of the nanomaterials, complementing the study of the clay-carbon quantum dots hybrid nanomaterials. CQD (Figure 5A) exhibits a fourth-step degradation process. From 30 °C to 100 °C, the material loses 11.2% in weight. This step is associated with the Tmax at 58.33 °C in the DTG curve and occurs due to the elimination of physically adsorbed water. The second step occurs in the range of 200–500 °C, where a gradual weight loss of 62.6% in correspondence to the intense peak at 457.59 °C is observed in the DTG curve, indicating the temperature where the maximum weight loss occurs. This step and the following weight loss with Tmax at 542.7 °C are related to complex chemical reactions, including chain scission, hydrolysis/alcoholysis of carbonate linkage, and branching and crosslinking reaction of the molecular chains of CQD [48]. The weight loss above 650 °C associated with the peak at 803.03 °C might be associated with polyaromatic carbonaceous residues with stability at high temperatures, justifying the subsequent slow weight loss for CQD. At 900 °C, a residue of 13.9% is observed, which is in agreement with the report by Zhu et al. (2019) that reported a residue of approximately 20% using a CQD obtained from citric acid as a precursor in a hydrothermal synthesis [49].
Neat montmorillonite showed a first weight loss of 7.1% occurring between 30 °C and 80 °C (Figure 5B), corresponding to the Tmax in the DTG curve at 59.3 °C, which represents the removal of free and interlayer water [50]. The literature reports these processes to occur up to 250 °C in MMT [51]. The following Tmax are observed in the DTG curve at 651.9 °C and 860.2 °C, corresponding to the dihydroxylation process that is related to the release of water originating from -OH groups structurally bound in the lattice [50,51]. In this step, MMT loses approximately 6.04% in weight, generating a residue of 86.84%. It is worth mentioning that the temperature intervals of dihydroxylation, as well as the amount of water released, depend on the nature of the adsorbed cations and surface hydration [52].
For MCQD-R1, the first weight loss possesses Tmax at 59.5 °C; however, the lowest rate of weight loss only occurs at approximately 200 °C, as can be seen in Figure 5C. This step can be attributed to the removal of free water (from both CQD and MTT) and interlayer water present in MMT. The following weight loss takes place from 200.0 °C to 440.0 °C, with Tmax in the DTG curve at 345.1 °C, which could be associated with the removal of functional groups of CQD. The next step occurs up to 692.5 °C in the DTG curve (Tmax at 624.0 °C) with a weight loss of 5.2% in correspondence with the dihydroxylation of the MMT, indicating that the association of CQD and the layered clay in the hybrid MCQD-R1 reduced the Tmax associated with this event. The Tmax at 724.7 °C in the DTG curve is associated with the weight loss of 1.8%; however, this step cannot be related directly to CQD or MMT. The hybrid nanomaterial generated a residue of 82.4%, resulting in a difference of only 4.4% from pure MMT due to the low content of CQD.
MCQD-R2-1 exhibited the thermal profile that is most similar to CQD among the three hybrids, probably due to its higher CQD content. The first step is observed in Figure 5D from 30 °C to 182 °C with a weight loss of 11.8%, which is related to the removal of free water from both CQD and MMT. This weight loss is related to the Tmax at 44.6 °C and another Tmax at approximately 300 °C, appearing as a shoulder that might be associated with the water release from the interlayer of MMT. In the following step, great weight loss occurs up to 635 °C, where the hybrid MCQD-R2-1 loses approximately 50.3% (Tmax at 489.1 °C), which could be associated with the degradation of the CQD structure. The shift of Tmax compared to pure CQD might suggest that the removal of functional groups takes place at a higher temperature, representing a gain of stability. The next step is related to the Tmax at 700.0 °C in the DTG curve, indicating the dehydroxylation process of MMT. At 900 °C, a residue of 29.7% in weight was generated, the lowest considering all three hybrid nanomaterials, which is related to the higher amount of the CQD in the MCQD-R2-1.
As can be observed in Figure 5E, the MCQD-R2-16 hybrid nanomaterial possesses the most complex thermal profile. From 30 °C to 155 °C occurs the first step related to removing physiosorbed water of both MMT and CQD, resulting in the weight loss of 7.3%. The following Tmax in the DTG curve takes place at 247.6 °C and 283.3 °C, representing the removal of interlayer water, which appears only as a Tmax at 59.3 °C for pure MMT. These temperature differences might be associated with interactions of the functional groups of CQD and the interlayer water of MMT, which the FT-IR results can also corroborate. The Tmax exhibited at 496.3 °C might be associated with the degradation process of CQD, and the Tmax at 563.3 °C corresponds to the dehydroxylation of MMT. A weight loss appears to start at approximately 830 °C; however, the maximum weight loss rate probably occurs at temperatures higher than 900 °C in accordance with the second weight loss related to the dihydroxylation that takes place at 860.2 °C to pure MMT. This indicates that the interaction of CQD and the MMT lattice might have dislocated the Tmax associated with this event to a high temperature.

3.2. Optical Properties

With the aim of exploring the optical properties, UV-Vis and photoluminescence spectroscopy analyses of CQD and the hybrid nanomaterials were carried out. As shown in Figure 6, an aqueous CQD dispersion exhibits three bands at 239 nm, 348 nm, and 547 nm. The first band is associated with π-π* transitions of the C=C bonds in the sp2 conjugated carbon core, whereas the second band represents n-π* transitions in C=O and C=N bonds [53]. The absorption band in the visible region can be ascribed to lower energy states of N-containing functional groups on the surface of CQD [54]. For all the hybrid nanomaterials, it is possible to observe a band in the visible region related to the presence of CQD. However, for MCQD-R1, the intensity of this band is low, even at a higher concentration, showing a shift to 528 nm. This shift is indicative that interactions of MMT with CQD take place at the surface level, which corroborates the FT-IR results. The band at 243 nm appears to be broader than for CQD, which could be related to a contribution of MMT that exhibits a band at 243 nm (Figure S1). MCQD-R2-1 possesses a band at 543 nm, exhibiting a slight blueshift compared to CQD, and the intensity of this band is a result of the high amount of CQD in this hybrid nanomaterial. Moreover, the band at 348 nm for CQD changes to 345 nm, and the band at 239 nm loses its definition, which suggests modification at the core of CQD. For MCQD-R2-16, the center of the visible band remains unaltered compared to CQD; however, in the UV region, a blue shift is observed for the band at 338 nm. These results indicate that the presence of MMT in the synthesis media results in small changes in the electronic states of the hybrid nanomaterials compared to CQD.
UV-Vis spectroscopy was also used to investigate the stability of CQD and the hybrid nanomaterials since alterations in the absorption spectra can indicate changes in size, aggregation, and overall stability. The investigation was conducted by monitoring the visible band maxima as a function of time. From the results observed in Figure 7, after a week, the absorbance of CQD is reduced from 1.0 to 0.44, which might be associated with the loss of stability related to the aggregation of these nanoparticles. MCQD-R1 exhibited a great stability profile with an absorbance value of 0.84 after 35 days, compared to 0.47 for CQD. For MCQD-R2-1 and MCQD-R2-16 hybrid nanomaterials, the reduction in the absorbance is more pronounced in the first week, especially in the first four days, a behavior similar to that observed for pure CQD. Moreover, these hybrid nanomaterials exhibited a similar profile for two weeks, reaching absorbance values of 0.69 and 0.68, respectively, which were higher than what was observed from CQD (Abs = 0.51). After that, the absorbance of MCQD-R2-1 slowly decreased, reaching a value of 0.52 after 56 days of experiment, demonstrating the higher stability of all samples. MCQD-R2-16, however, showed a destabilization trend after ~21 days, reaching absorbance values close to pure CQDs. This reduced stability may be related to the lower CQD content determined by elemental analysis, which suggests that prolonged precursor–clay contact time can hinder efficient CQD anchoring within the MMT layers. Additionally, stronger but less homogeneous interactions between CQD functional groups and MMT, as indicated by FTIR shifts, may favor localized aggregation, thereby reducing colloidal stability.
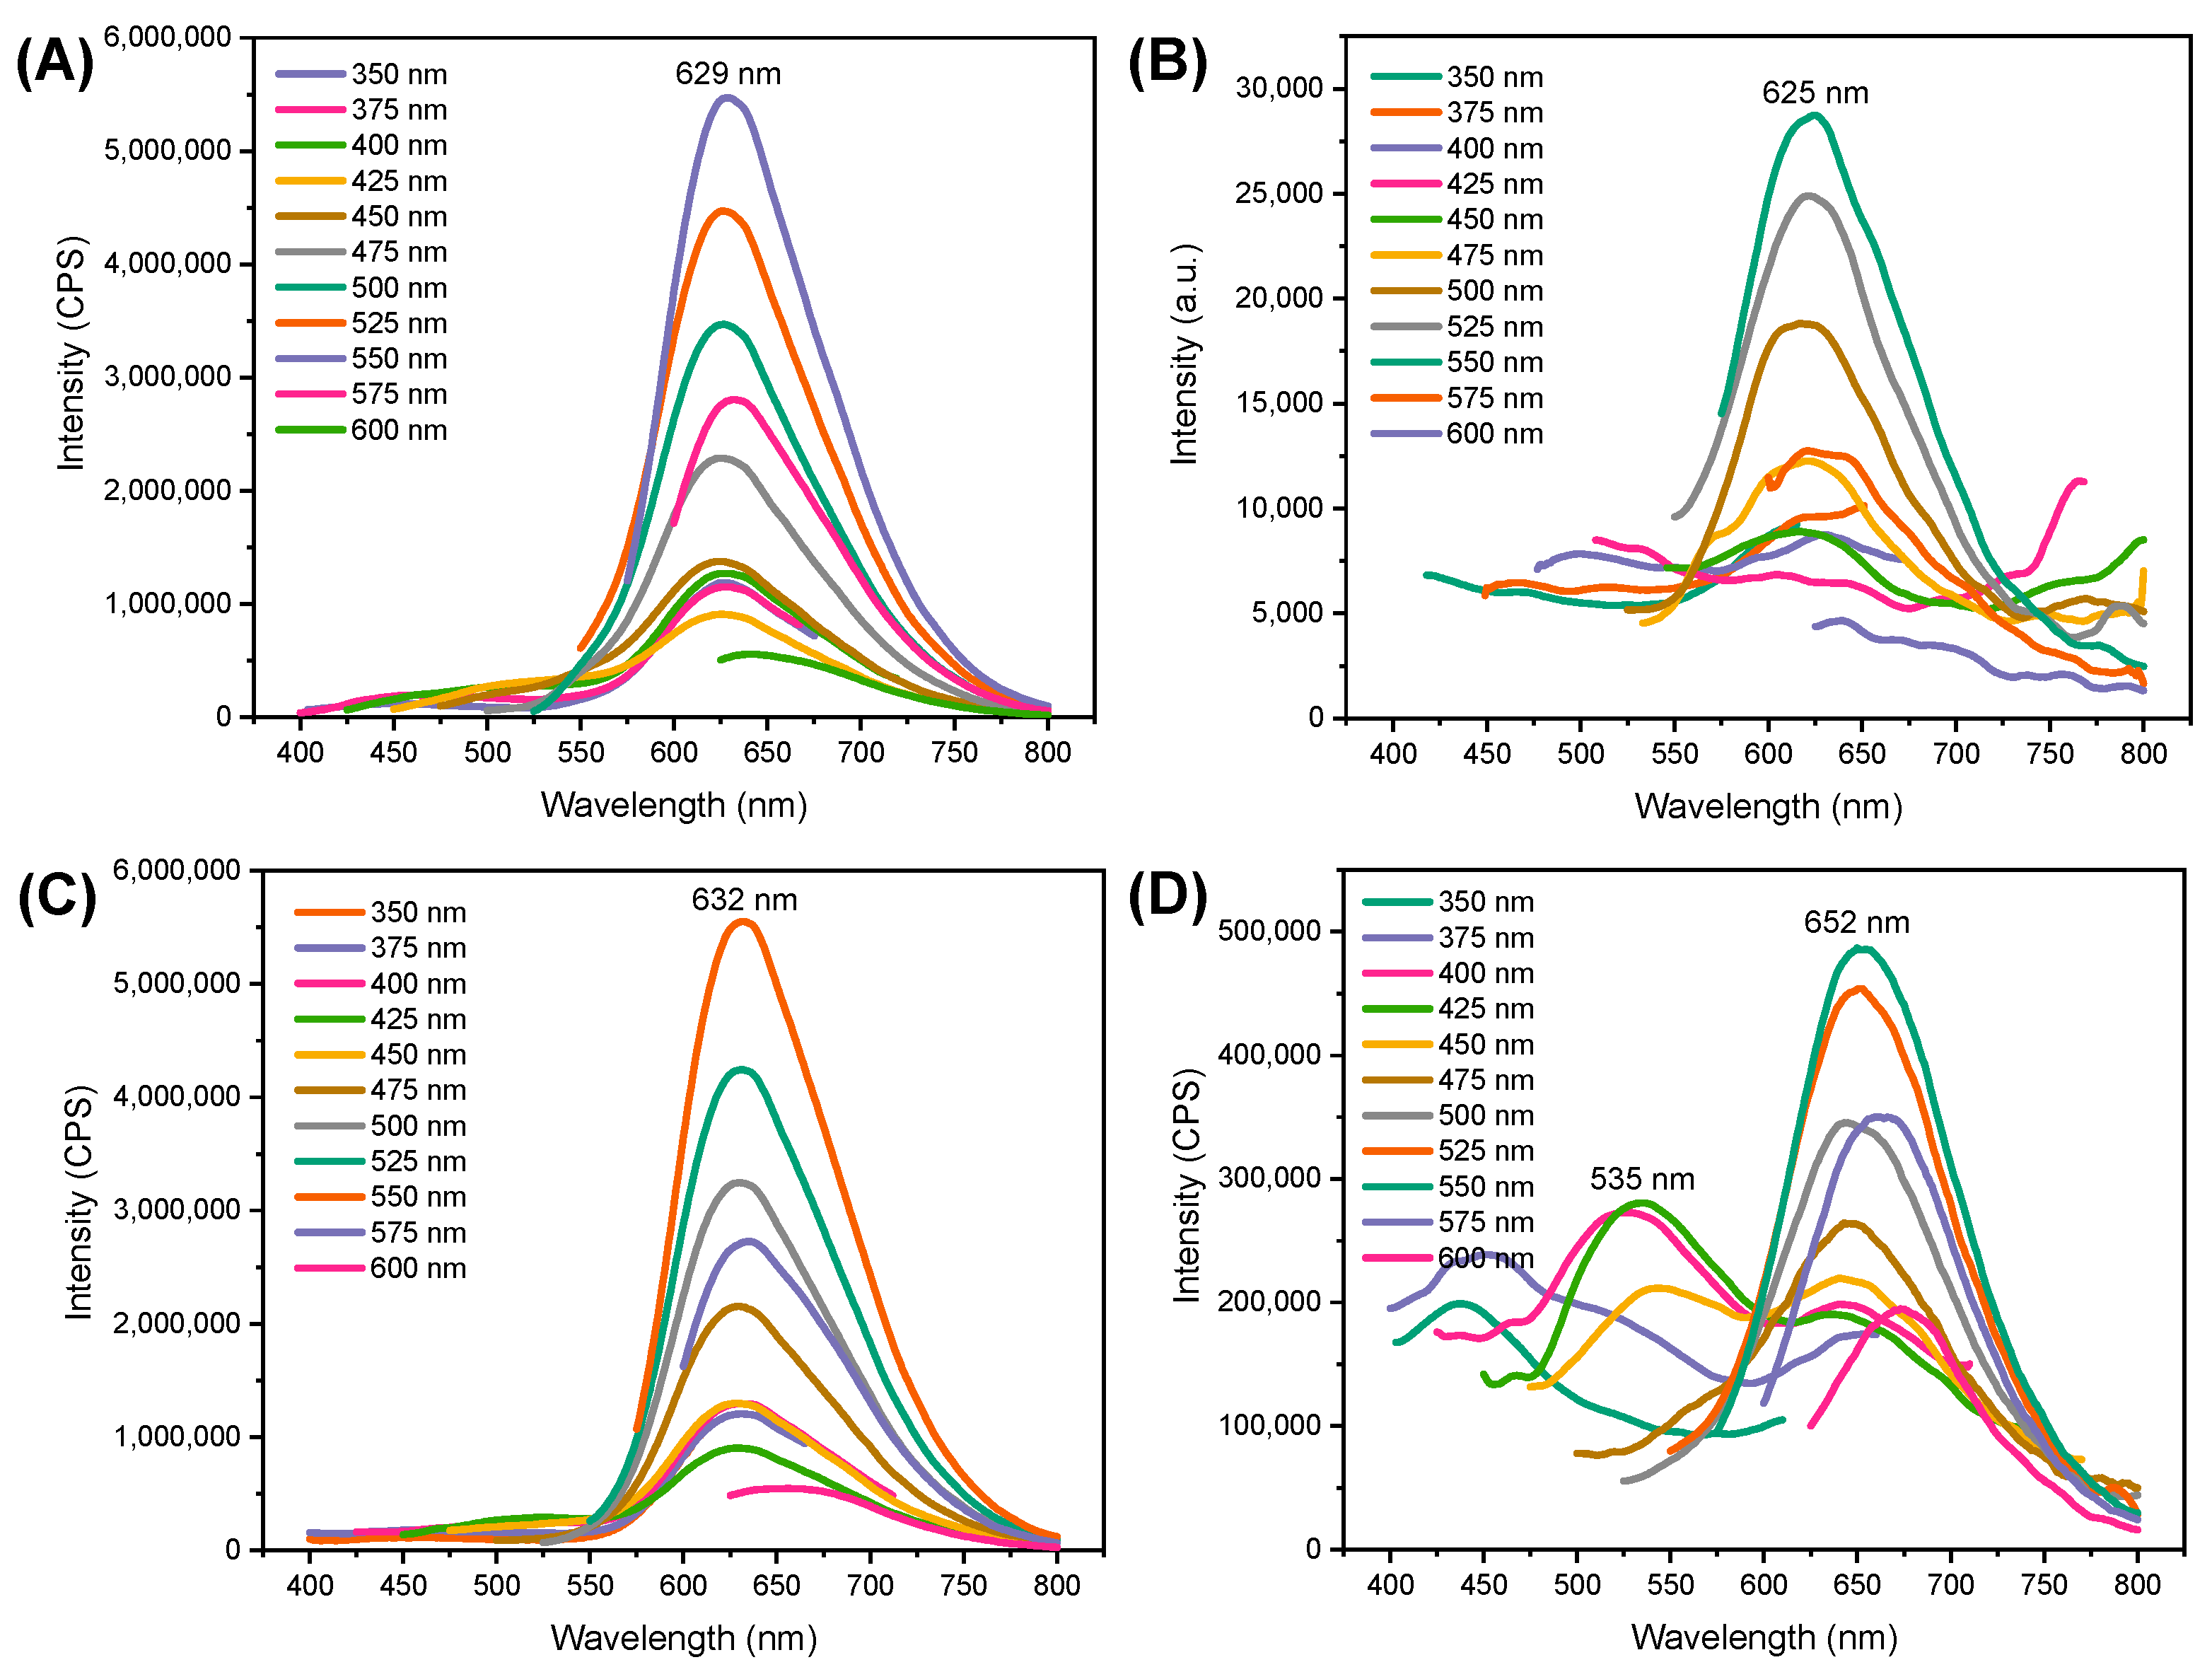
The photoluminescence (PL) spectra of CQD were evaluated at different wavelengths, as can be seen in Figure 8A. By increasing the excitation wavelengths, the emission intensity of the CQD gradually increases until it reaches its maximum at 629 nm when it is excited at 550 nm and then starts to decline. The red emission remains almost unchanged with the increase in wavelength excitation, pointing out an excitation-independent behavior that could be related to a narrow size distribution and uniformity of surface state [25]. Moreover, a second emission can be observed (Figure S2) at excitation wavelengths greater than 350 nm. The emission shifts from 450 nm to 525 nm when the excitation wavelength increases from 350 nm to 425 nm, and under excitation longer than 475 nm, the band can no longer be appreciable. In general, as the excitation changes, different contributions of the blue to green and red counterparts can be observed, indicating multiple fluorescence centers due to the involvement of different surface states of the CQD nanoparticles [26]. As can be observed in Figure 8, the hybrid nanomaterials possess emission behavior similar to that observed for CQD, but some differences need to be pointed out. For the MCQD-R1 hybrid nanomaterial, a minor shift is noted for the red emission; however, the blue-green emissions seem to have lost their definition and intensity. MCQD-R2-1 possesses an emission profile quite similar to that observed for CQD, with the emissions in the blue-green region more defined (Figure S2). The MCQD-R2-16 demonstrated the most significant alteration in the emission profile among the hybrid nanomaterials. For the blue-green emission, an excitation-dependent behavior is observed, which could be associated with modifications in the contributions of the core and surface states. Regarding the red emission, a red shift is noted for the maximum in both green and red emission, which changes from 522 nm and 629 nm in CQD to 535 nm and 656 nm in the hybrid nanomaterial, respectively. This result might be associated with the higher nitrogen incorporation (lower C/N ratio), which could influence surface states [37].
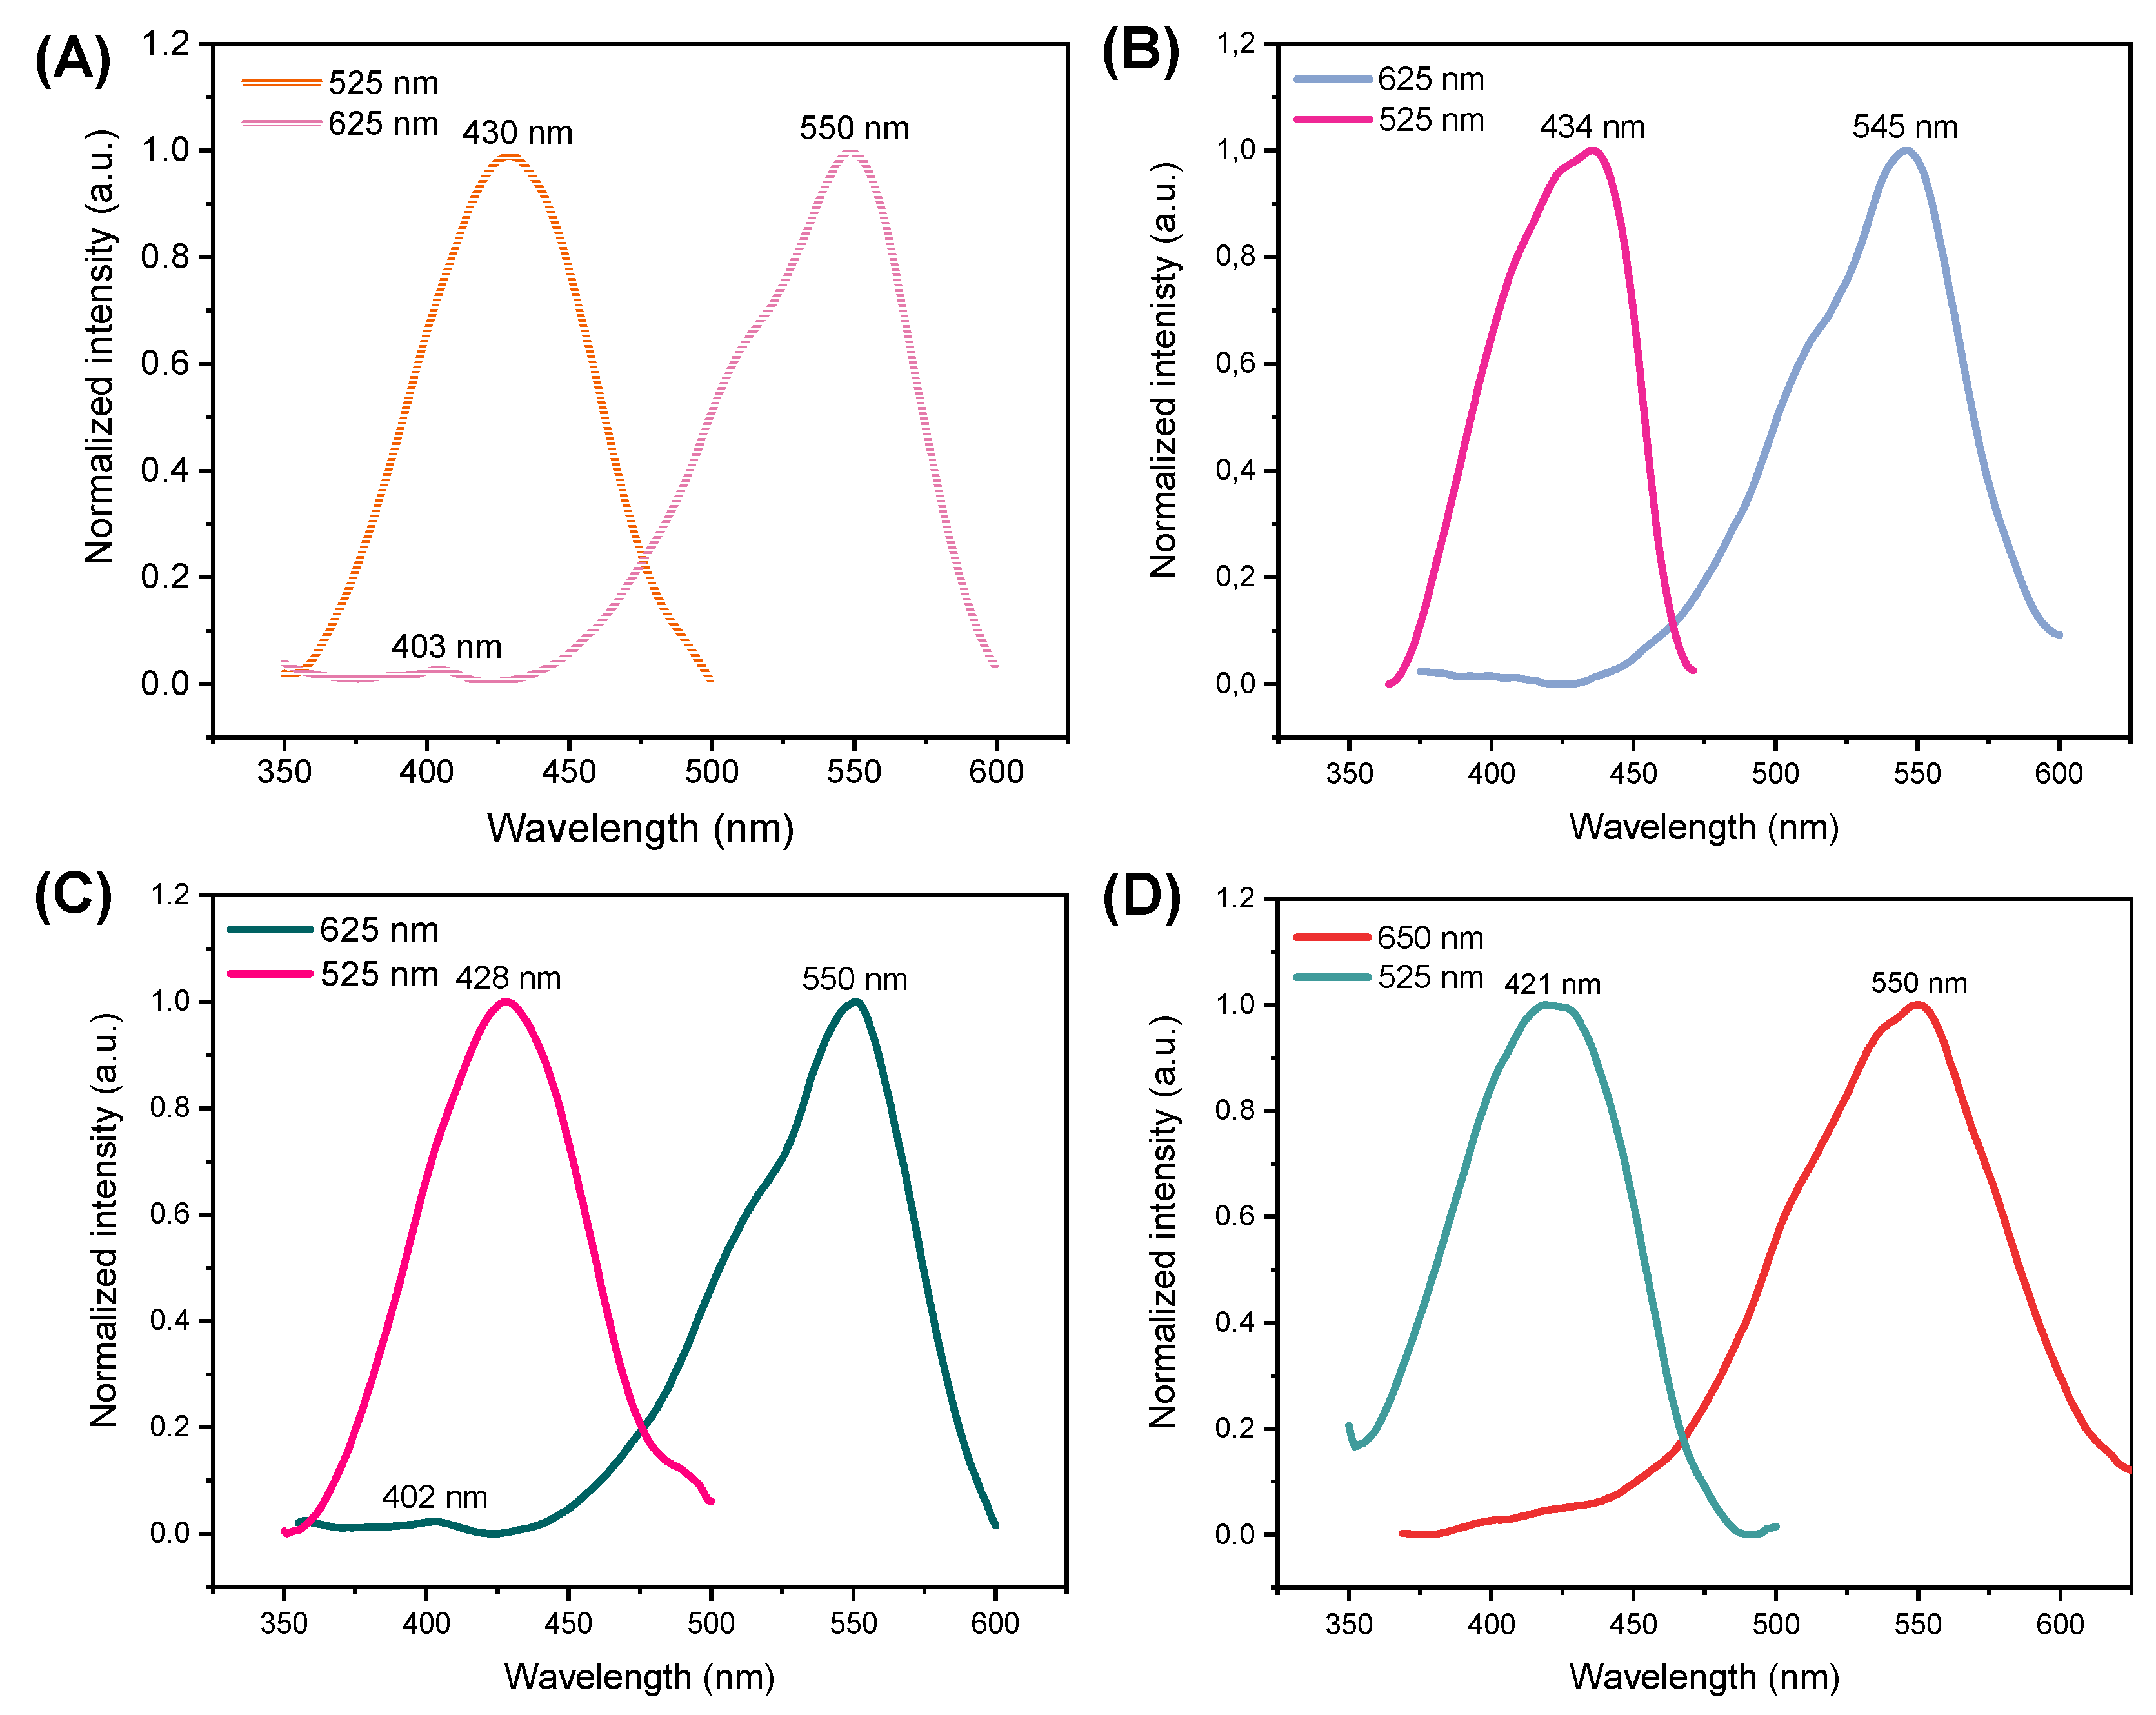
The photoluminescence excitation (PLE) spectra were recorded to unveil the excited states involved (Figure 9A). For CQD, the PLE of the shorter-wavelength emission was monitored at 525 nm, revealing a transition at 430 nm. PLE of the red emission was measured at 625 nm, showing transitions at 405 nm and 550 nm, and a shoulder around 495 nm. The excited states around 400 nm can be related to n-π* transitions in the aromatic center of CQD; however, this transition appears not to be efficient in the longer wavelength emission due to the larger Stokes shifts between the absorption and emission, indicating a nonradiative process during the transition to the lowest excited state [55]. Nevertheless, the transition at 550 nm is effective in leading to red emission, which is related to distinct O- and N-containing groups at the edge/surface of CQD. The PLE spectra of the hybrid nanomaterials (Figure 9A–D) reveal similar profiles compared to CQD; however, a new transition is observed for MCQD-R2-1 around 500 nm. For MCQD-R2-16, it is possible to observe an increase in the width of the PLE band, which suggests the arising of new transitions due to the presence of MMT in the hybrid.
Time-resolved PL was measured for the samples under 450 nm excitation to investigate the origin of the emission. All the decay profiles were fitted as bi-exponential functions on a timescale of nanoseconds (ns), confirming the presence of distinctive emissions for green and red emissions for all samples. Table 2 summarizes the lifetimes, calculating the decay times of individual components and their respective overall contributions. The average lifetime has a faster (τ1) and a slower (τ2) component associated with the radiative recombination process of the core and surface states, respectively [53,54]. The results indicate that the green emission has a longer average lifetime due to a greater contribution from the slower component τ1, compared to the red emission. On the other hand, the red emission is mostly governed by the fast-lifetime component (τ2), resulting in shorter average lifetimes. Considering CQD, the results demonstrate that as the average lifetime (τAV) decreases from 5.290 ns to 1.601 ns, the contribution of τ1 increases from 56.85% to 94.40%, suggesting that the core state plays an important role as the PL wavelength changes. A longer lifetime is observed for the red emission in hybrid nanomaterials compared to CQD, which is related to the increase in decay time of component τ2, indicating that the association with MMT results in greater involvement of functional groups in the emission. The green emission of MCQD-R2-1 shows a lower contribution of the surface state, 7.33% compared to 43.15% for CQD, resulting in the faster decay time. Considering the red emission, the contribution of the surface state cannot be appreciable; that is, the emission is uniquely governed by the component associated with the core state. In the MCQD-R2-16 exhibit the longer τAV for the red emission due to an increase in the contribution of the surface state, which increased from 5.60% in CQD to 11.93%. The association of CQD and MMT resulted in hybrid nanomaterials with longer red emission lifetimes, which could be interesting for applications that explore this property.
A comparative analysis of the two synthetic routes reveals complementary advantages and clear structure–property correlations. Route 1 preserves the crystalline integrity of montmorillonite and provides stable dispersions, but the interaction between the components is predominantly weak and water-mediated, resulting in lower CQD loading and moderate optical response. In contrast, route 2 enables direct CQD nucleation on the clay surface, strengthening interfacial coupling through electrostatic and hydrogen-bonding interactions, which leads to higher incorporation efficiency, enhanced photoluminescence, and improved colloidal stability. However, excessive precursor–clay contact time, as in MCQD-R2-16, promotes partial aggregation and limits anchoring efficiency. Overall, Route 2 offers superior control over interfacial chemistry and resulting functional properties, while Route 1 stands out for its simplicity and structural preservation.

3.3. Hemolysis Assay

Considering the comparative analyses, the MCQD-R2-1 hybrid was selected for further evaluations. This material exhibited the most favorable balance of properties, including a higher CQD content, homogeneous dispersion along the clay fibrils, and the absence of excessive agglomeration observed in MCQD-R2-16. These structural features resulted in enhanced stability and optical performance, making MCQD-R2-1 the most representative candidate for subsequent assays.
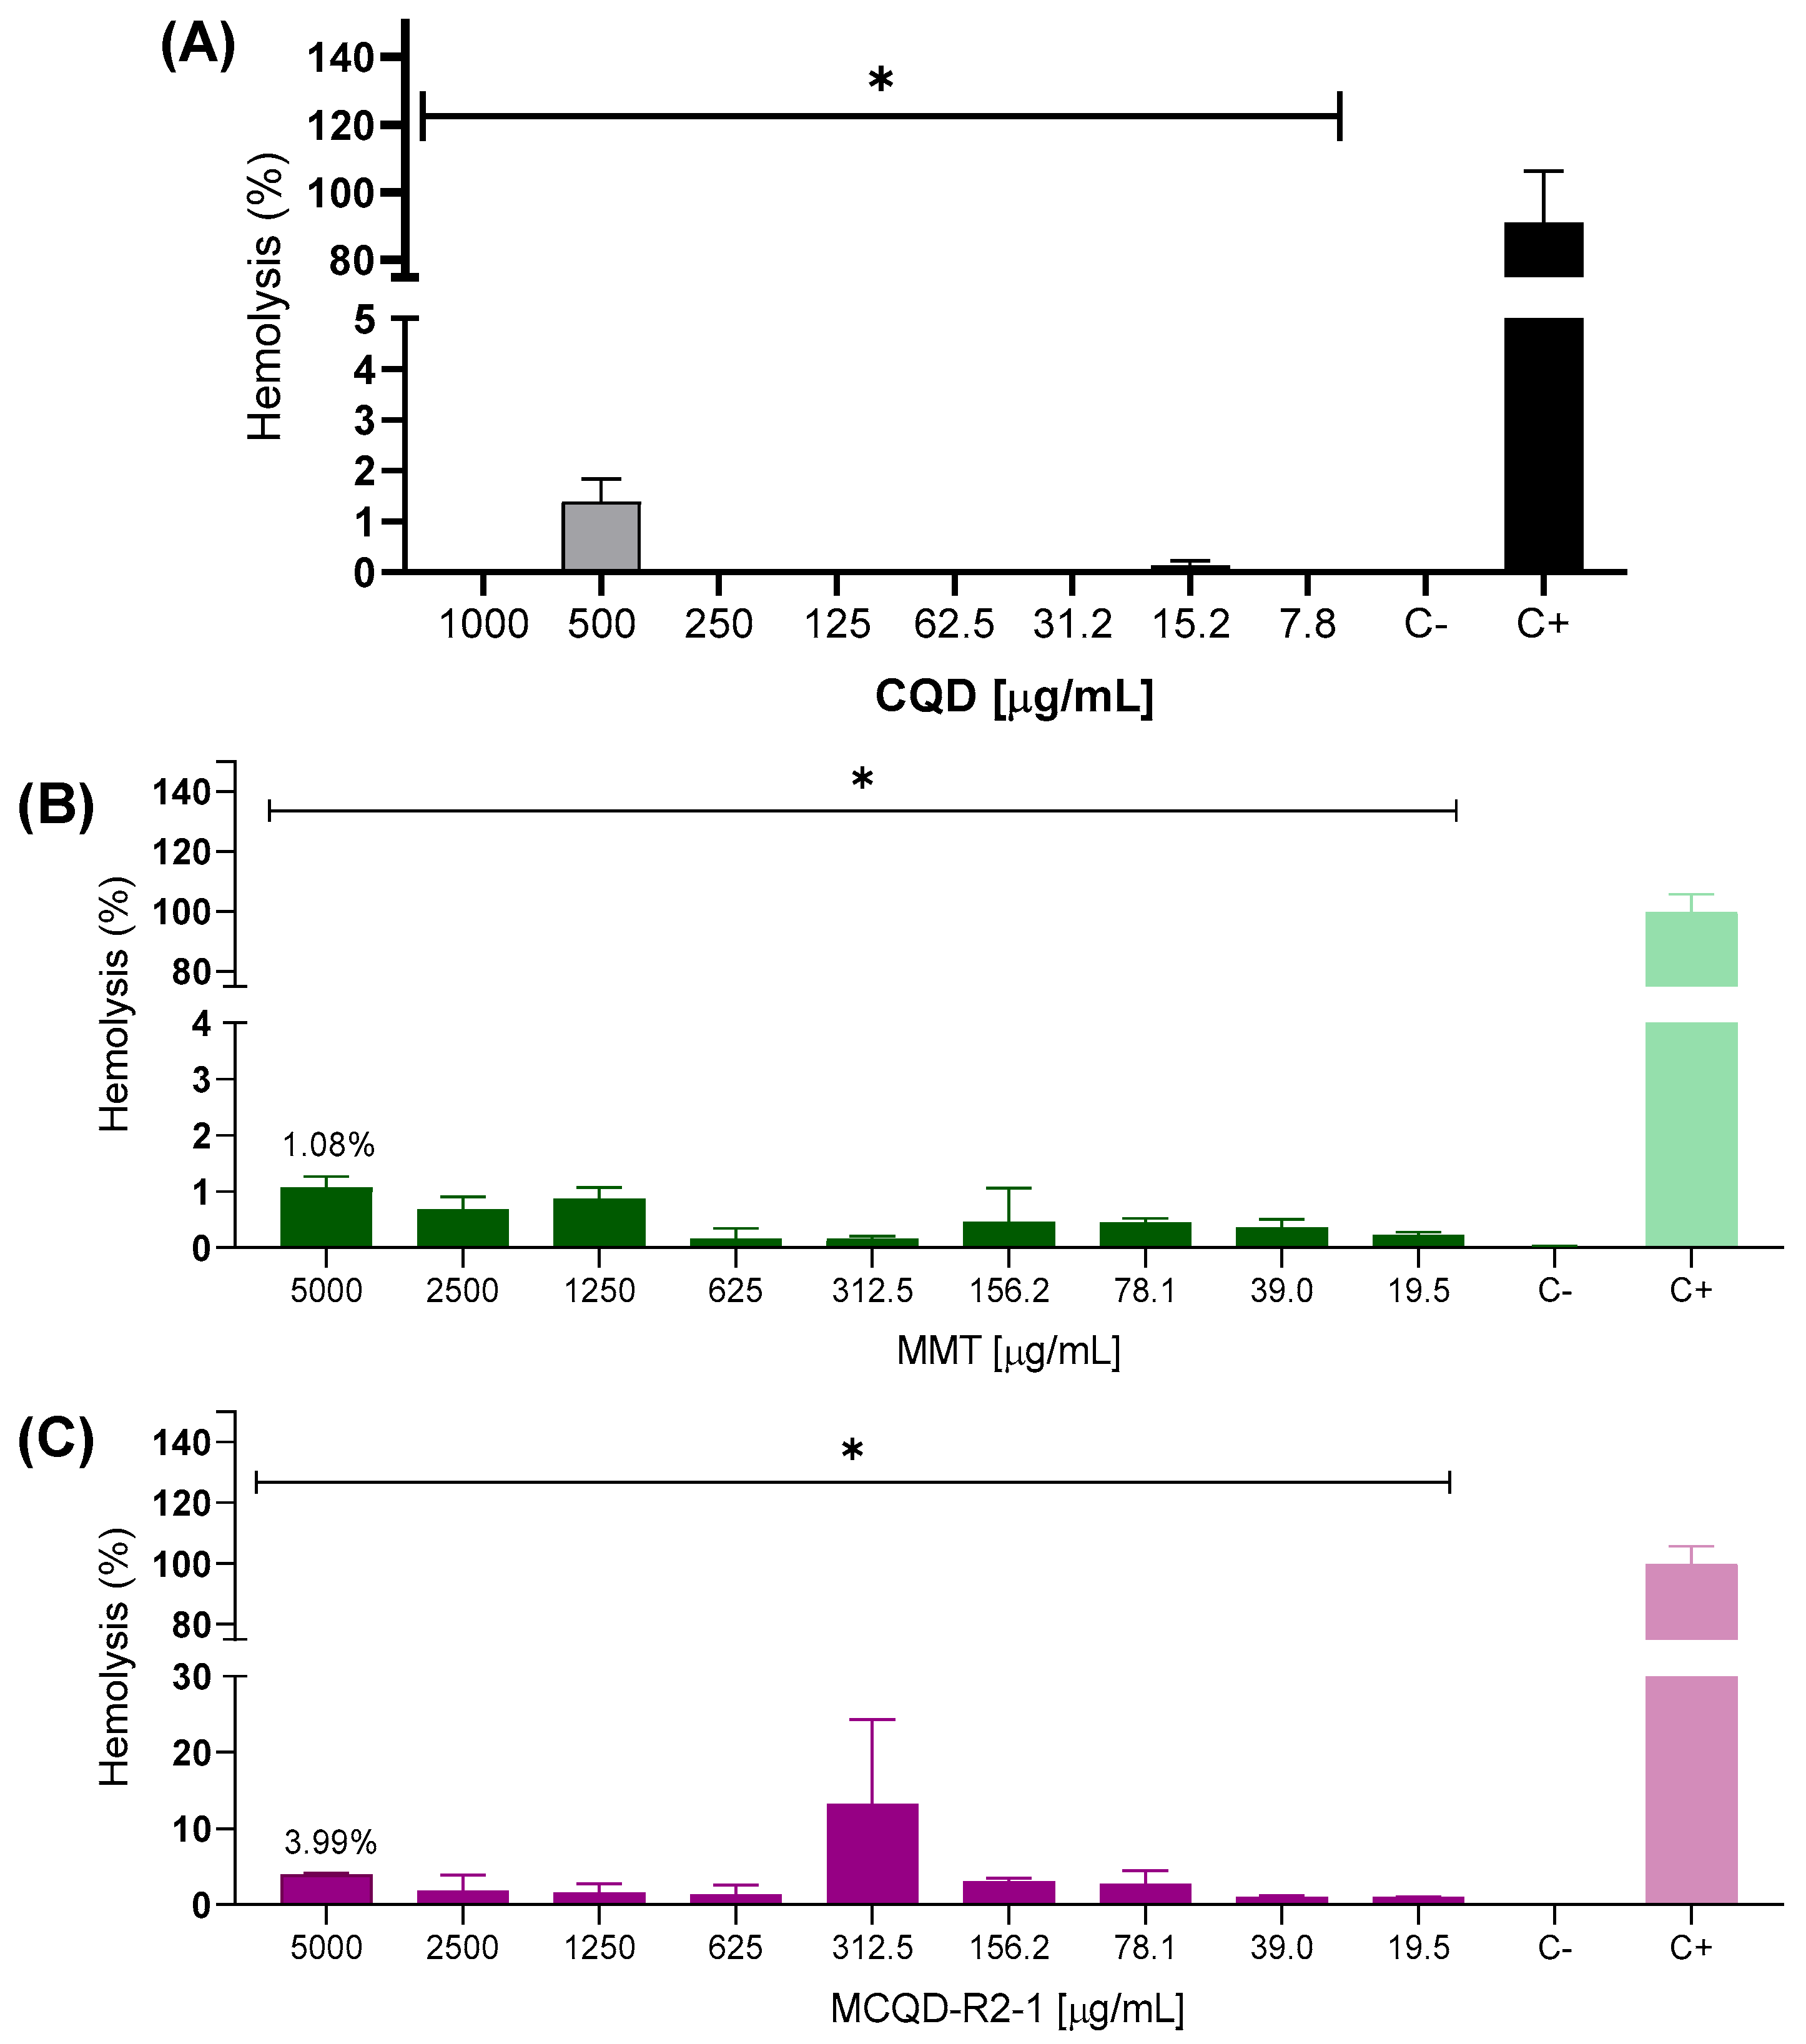
Hemocompatibility testing evaluates critical interactions between the materials and the different components of blood to determine if any toxic effects could originate from the exposure of these foreign materials to blood [56,57]. According to Figure 10, MMT presented a hemolysis rate of 1.08% even at a high concentration of 5000 mg·L−1. MCQD-R2-1 was the selected hybrid nanomaterial to perform this assay, and exhibited a hemolytic ratio of 3.99%, which is lower than the recommended value of 5% by the ISO 10993-4 standard [58]. The materials tested did not trigger a hemolytic reaction, suggesting their biocompatibility and significantly enhancing their potential applications in biological systems.

4. Conclusions

Based on the structural, optical, and hemocompatibility results obtained in this study, it can be concluded that the combination of montmorillonite and carbon quantum dots through distinct synthesis approaches leads to the formation of hybrid nanomaterials with preserved crystalline integrity of both components. XRD and FT-IR analyses revealed that while Route 1 primarily promotes interactions mediated by interlayer water molecules, the in situ synthesis (Route 2) induces stronger chemical interactions involving the carbonyl and carboxylate groups of CQDs, with slight variations depending on the contact time with the clay. Elemental analysis confirmed that Route 2 incorporated a higher amount of CQD, likely due to the CQDs that nucleate in close proximity to clay surfaces/edges, favoring multipoint anchoring (electrostatics + H-bonds + edge acid–base). Thermal analysis demonstrated that the hybrids exhibit modified degradation profiles and, in some cases, enhanced thermal stability compared to pristine CQDs, highlighting the influence of montmorillonite on the thermal behavior of the composites. Optical characterization indicated that the hybrids retained the independent emission features of CQDs, with subtle spectral shifts and variations in lifetime decay related to the interactions in the hybrids and nitrogen incorporation, particularly in MCQD-R2-16. Stability tests showed that the presence of montmorillonite mitigates CQD aggregation over time, especially in MCQD-R1 and MCQD-R2-1, enhancing their potential for long-term applications. Moreover, hemolysis assays confirmed that the selected hybrid, MCQD-R2-1, possesses a hemolysis ratio below 5%, confirming its hemocompatibility. It is worth highlighting that, despite its relatively low CQD loading, MCQD-R1 exhibited exceptional colloidal stability, which underscores the ability of montmorillonite to prevent nanoparticle aggregation even under less favorable incorporation conditions.

Supplementary Materials

The following supporting information can be downloaded at https://www.mdpi.com/article/10.3390/min15111146/s1. Figure S1: UV-Vis spectrum of montmorillonite an aqueous dispersion at a concentration of 25.0 mg·L−1; Figure S2: Emission spectra of CQD (A), MCQD-R1 (B), MCQD-R2-1 (C), and MCQD-R2-16 (D) hybrid nanomaterials as aqueous dispersion.

Author Contributions

Conceptualization, E.S.M.C. and A.C.S.A.; methodology, E.S.M.C., V.F.-M. and A.C.S.A.; validation, E.S.M.C. and A.S.F., formal analysis, E.S.M.C. and A.S.F.; investigation, E.S.M.C., V.F.-M. and A.C.S.A.; resources, L.A.S., V.F.-M. and A.C.S.A.; data curation, E.S.M.C. and A.S.F.; writing—original draft preparation, E.S.M.C. and A.C.S.A.; writing—review and editing, E.S.M.C., V.F.-M. and A.C.S.A.; visualization, V.F.-M. and A.C.S.A.; supervision, V.F.-M. and A.C.S.A.; project administration, V.F.-M. and A.C.S.A. All authors have read and agreed to the published version of the manuscript.

Funding

This work was supported by the financial support of Coordenação de Aperfeiçoamento de Pessoal de Nível Superior, CAPES (Finance code 001 and PROCAD-Amazonia), FAPEMA (UNIVERSAL-06741/22) and CNPq (315109/2021–1; 311112/2025-0). Project PID2022-137862NB-I00 was funded by MICIU/AEI/10.13039/501100011033 and project CNS2023-143600 was funded by MICIU/AEI/10.13039/501100011033 and European Union NextGenerationEU/PRTR.

Data Availability Statement

Data is available on request from the authors due to privacy.

Acknowledgments

ESMC thanks FAPEMA for her PhD fellowship.

Conflicts of Interest

The authors declare no conflicts of interest.

References

  1. Li, J.; Lu, W.; Yang, Y.; Xiang, R.; Ling, Y.; Yu, C.; Zhou, Y. Hybrid Nanomaterials for Cancer Immunotherapy. Adv. Sci. 2023, 10, 2204932. [Google Scholar] [CrossRef]
  2. Muhamad Azim, M.K.; Arifutzzaman, A.; Saidur, R.; Khandaker, M.U.; Bradley, D.A. Recent Progress in Emerging Hybrid Nanomaterials towards the Energy Storage and Heat Transfer Applications: A Review. J. Mol. Liq. 2022, 360, 119443. [Google Scholar] [CrossRef]
  3. Meroni, D.; Ardizzone, S. Preparation and Application of Hybrid Nanomaterials. Nanomaterials 2018, 8, 891. [Google Scholar] [CrossRef]
  4. Hayami, R.; Wada, K.; Nishikawa, I.; Sagawa, T.; Yamamoto, K.; Tsukada, S.; Gunji, T. Preparation and Properties of Organic-Inorganic Hybrid Materials Using Titanium Phosphonate Cluster. Polym. J. 2017, 49, 665–669. [Google Scholar] [CrossRef]
  5. Teixeira, M.M.; Santos, J.D.J.P.; Cutrim, E.S.M.; Campos, I.R.; Campos, V.N.S.; Farias, J.R.; Guerra, R.N.M.; de Lima, R.B.; da Silva, M.C.P.; Rojas, A.; et al. Ag3PO4/Clay-Based Heterostructures as Sustainable Devices for Efficient Water Disinfection and Contaminant Removal via Cooperative Processes of Adsorption and Visible Light-Driven Degradation. J. Water Process Eng. 2025, 75, 108055. [Google Scholar] [CrossRef]
  6. Xie, W.; Chen, Y.; Yang, H. Layered Clay Minerals in Cancer Therapy: Recent Progress and Prospects. Small 2023, 19, e2300842. [Google Scholar] [PubMed]
  7. Oliveira, A.S.; Alcântara, A.C.S.; Pergher, S.B.C. Bionanocomposite Systems Based on Montmorillonite and Biopolymers for the Controlled Release of Olanzapine. Mater. Sci. Eng. C 2017, 75, 1250–1258. [Google Scholar] [CrossRef]
  8. Rebitski, E.P.; Alcântara, A.C.S.; Darder, M.; Cansian, R.L.; Gómez-Hortigüela, L.; Pergher, S.B.C. Functional Carboxymethylcellulose/Zein Bionanocomposite Films Based on Neomycin Supported on Sepiolite or Montmorillonite Clays. ACS Omega 2018, 3, 13538–13550. [Google Scholar] [CrossRef]
  9. Rebitski, E.P.; Souza, G.P.; Santana, S.A.A.; Pergher, S.B.C.; Alcântara, A.C.S. Bionsanocomposites Based on Cationic and Anionic Layered Clays as Controlled Release Devices of Amoxicillin. Appl. Clay Sci. 2019, 173, 35–45. [Google Scholar] [CrossRef]
  10. Tipa, C.; Cidade, M.T.; Borges, J.P.; Costa, L.C.; Silva, J.C.; Soares, P.I.P. Clay-Based Nanocomposite Hydrogels for Biomedical Applications: A Review. Nanomaterials 2022, 12, 3308. [Google Scholar] [CrossRef]
  11. Xu, X.; Ray, R.; Gu, Y.; Ploehn, H.J.; Gearheart, L.; Raker, K.; Scrivens, W.A. Electrophoretic Analysis and Purification of Fluorescent Single-Walled Carbon Nanotube Fragments. J. Am. Chem. Soc. 2004, 126, 12736–12737. [Google Scholar] [CrossRef]
  12. Zhang, M.; Su, R.; Zhong, J.; Fei, L.; Cai, W.; Guan, Q.; Li, W.; Li, N.; Chen, Y.; Cai, L.; et al. Red/Orange Dual-Emissive Carbon Dots for PH Sensing and Cell Imaging. Nano Res. 2019, 12, 815–821. [Google Scholar] [CrossRef]
  13. Li, W.; Kaminski Schierle, G.S.; Lei, B.; Liu, Y.; Kaminski, C.F. Fluorescent Nanoparticles for Super-Resolution Imaging. Chem. Rev. 2022, 122, 12495–12543. [Google Scholar] [CrossRef]
  14. Ghosh, T.; Nandi, S.; Bhattacharyya, S.K.; Ghosh, S.K.; Mandal, M.; Banerji, P.; Das, N.C. Nitrogen and Sulphur Doped Carbon Dot: An Excellent Biocompatible Candidate for in-Vitro Cancer Cell Imaging and Beyond. Environ. Res. 2023, 217, 114922. [Google Scholar] [CrossRef]
  15. Carbonaro, C.M.; Thakkar, S.V.; Ludmerczki, R.; Olla, C.; Pinna, A.; Loche, D.; Malfatti, L.; Cesare Marincola, F.; Casula, M.F. How Porosity Affects the Emission of Fluorescent Carbon Dot-Silica Porous Composites. Microporous Mesoporous Mater 2020, 305, 110302. [Google Scholar] [CrossRef]
  16. Jlassi, K.; Al Ejji, M.; Ahmed, A.K.; Mutahir, H.; Sliem, M.H.; Abdullah, A.M.; Chehimi, M.M.; Krupa, I. A Carbon Dot-Based Clay Nanocomposite for Efficient Heavy Metal Removal. Nanoscale Adv. 2023, 5, 4224–4232. [Google Scholar] [CrossRef]
  17. Chuaicham, C.; Sekar, K.; Balakumar, V.; Uchida, J.; Katsurao, T.; Sakabe, H.; Ohtani, B.; Sasaki, K. Efficient Photocatalytic Degradation of Emerging Ciprofloxacin under Visible Light Irradiation Using BiOBr/Carbon Quantum Dot/Saponite Composite. Environ. Res. 2022, 212, 113635. [Google Scholar] [CrossRef]
  18. Massaro, M.; Barone, G.; Biddeci, G.; Cavallaro, G.; Di Blasi, F.; Lazzara, G.; Nicotra, G.; Spinella, C.; Spinelli, G.; Riela, S. Halloysite Nanotubes-Carbon Dots Hybrids Multifunctional Nanocarrier with Positive Cell Target Ability as a Potential Non-Viral Vector for Oral Gene Therapy. J. Colloid. Interface Sci. 2019, 552, 236–246. [Google Scholar] [CrossRef]
  19. Zhai, Y.; Shen, F.; Zhang, X.; Jing, P.; Li, D.; Yang, X.; Zhou, D.; Xu, X.; Qu, S. Synthesis of Green Emissive Carbon Dots@montmorillonite Composites and Their Application for Fabrication of Light-Emitting Diodes and Latent Fingerprints Markers. J. Colloid. Interface Sci. 2019, 554, 344–352. [Google Scholar] [CrossRef]
  20. Yu, Y.; Yan, L. Rapid Synthesis of C-Dots@PGV Nanocomposites Powders for Development of Latent Fingermarks. Bull. Chem. Soc. Jpn. 2017, 90, 1217–1223. [Google Scholar] [CrossRef]
  21. Arjona, J.C.; Samara, M.; Ulsen, C.; Diaz, F.R.V.; Demarquette, N.R. Isoniazid adsorption and release by Cloisite and Laponite: An effect of surface charge. Mater. Chem. Phys. 2025, 344, 131097. [Google Scholar] [CrossRef]
  22. Qu, S.; Zhou, D.; Li, D.; Ji, W.; Jing, P.; Han, D.; Liu, L.; Zeng, H.; Shen, D. Toward Efficient Orange Emissive Carbon Nanodots through Conjugated Sp2-Domain Controlling and Surface Charges Engineering. Adv. Mater. 2016, 28, 3516–3521. [Google Scholar] [CrossRef]
  23. ISO 10993-4; Part 4: Selection of Tests for Interactions with Blood—Biological Evaluation of Medical Devices; 3rd ed. International Standard Orgnaization: Geneva, Switzerland, 2017.
  24. Almaaytah, A.; Tarazi, S.; Alsheyab, F.; Al-balas, Q.; Ukattash, T. Antimicrobial and Antibiofilm Activity of Mauriporin, a Multifunctional Scorpion Venom Peptide. Int. J. Pept. Res. Ther. 2014, 20, 397–408. [Google Scholar] [CrossRef]
  25. Mintz, K.J.; Bartoli, M.; Rovere, M.; Zhou, Y.; Hettiarachchi, S.D.; Paudyal, S.; Chen, J.; Domena, J.B.; Liyanage, P.Y.; Sampson, R.; et al. A Deep Investigation into the Structure of Carbon Dots. Carbon. N. Y 2021, 173, 433–447. [Google Scholar] [CrossRef]
  26. Mandal, S.; Prasad, S.R.; Mandal, D.; Das, P. Bovine Serum Albumin Amplified Reactive Oxygen Species Generation from Anthrarufin-Derived Carbon Dot and Concomitant Nanoassembly for Combination Antibiotic-Photodynamic Therapy Application. ACS Appl. Mater. Interfaces 2019, 11, 33273–33284. [Google Scholar] [CrossRef]
  27. Bian, W.; Wang, X.; Wang, Y.; Yang, H.; Huang, J.; Cai, Z.; Choi, M.M.F. Boron and Nitrogen Co-Doped Carbon Dots as a Sensitive Fluorescent Probe for the Detection of Curcumin. Luminescence 2018, 33, 174–180. [Google Scholar] [CrossRef]
  28. Choppadandi, M.; Guduru, A.T.; Gondaliya, P.; Arya, N.; Kalia, K.; Kumar, H.; Kapusetti, G. Structural Features Regulated Photoluminescence Intensity and Cell Internalization of Carbon and Graphene Quantum Dots for Bioimaging. Mater. Sci. Eng. C 2021, 129, 112366. [Google Scholar] [CrossRef]
  29. Du, F.; Yuan, J.; Zhang, M.; Li, J.; Zhou, Z.; Li, Z.; Cao, M.; Chen, J.; Zhang, L.; Liu, X.; et al. Nitrogen-Doped Carbon Dots with Heterogeneous Multi-Layered Structures. RSC Adv. 2014, 4, 37536–37541. [Google Scholar] [CrossRef]
  30. Aslam, R.; Wang, Q.; Aslam, J.; Mobin, M.; Hussain, C.M.; Yan, Z. Effect of Temperature, and Immersion Time on the Inhibition Performance of Q235 Steel Using Spent Coffee Grounds Derived Carbon Quantum Dots: Electrochemical, Spectroscopic and Surface Studies. Biomass Bioenergy 2025, 200, 107961. [Google Scholar] [CrossRef]
  31. Corrêa, F.G.; Araujo, R.J.P.; Campos, V.N.S.; Silva, M.d.S.C.; Cutrim, E.S.M.; Rojas, A.; Teixeira, M.M.; Garcia, M.A.S.; Alcântara, A.C.S. Layered Double Hydroxides Modified with Carbon Quantum Dots as Promising Materials for Pharmaceutical Removal. Minerals 2025, 15, 899. [Google Scholar] [CrossRef]
  32. Farshi Azhar, F.; Olad, A. A Study on Sustained Release Formulations for Oral Delivery of 5-Fluorouracil Based on Alginate-Chitosan/Montmorillonite Nanocomposite Systems. Appl. Clay Sci. 2014, 101, 288–296. [Google Scholar] [CrossRef]
  33. Zhang, X.; Yi, H.; Bai, H.; Zhao, Y.; Min, F.; Song, S. Correlation of Montmorillonite Exfoliation with Interlayer Cations in the Preparation of Two-Dimensional Nanosheets. RSC Adv. 2017, 7, 41471–41478. [Google Scholar] [CrossRef]
  34. Cutrim, E.S.M.; Vale, A.A.M.; Manzani, D.; Barud, H.S.; Rodríguez-Castellón, E.; Santos, A.P.S.A.; Alcântara, A.C.S. Preparation, Characterization and in Vitro Anticancer Performance of Nanoconjugate Based on Carbon Quantum Dots and 5-Fluorouracil. Mater. Sci. Eng. C 2021, 120, 111781. [Google Scholar] [CrossRef]
  35. Chen, Q.; Zhu, R.; Deng, W.; Xu, Y.; Zhu, J.; Tao, Q.; He, H. From Used Montmorillonite to Carbon Monolayer-Montmorillonite Nanocomposites. Appl. Clay Sci. 2014, 100, 112–117. [Google Scholar] [CrossRef]
  36. Li, D.; Kaner, R.B. Shape and Aggregation Control of Nanoparticles: Not Shaken, Not Stirred. J. Am. Chem. Soc. 2006, 128, 968–975. [Google Scholar] [CrossRef]
  37. Kundu, A.; Lee, J.; Park, B.; Ray, C.; Sankar, K.V.; Kim, W.S.; Lee, S.H.; Cho, I.J.; Jun, S.C. Facile Approach to Synthesize Highly Fluorescent Multicolor Emissive Carbon Dots via Surface Functionalization for Cellular Imaging. J. Colloid. Interface Sci. 2018, 513, 505–514. [Google Scholar] [CrossRef]
  38. Perumal, S.; Atchudan, R.; Thirukumaran, P.; Yoon, D.H.; Lee, Y.R.; Cheong, I.W. Simultaneous Removal of Heavy Metal Ions Using Carbon Dots-Doped Hydrogel Particles. Chemosphere 2022, 286, 131760. [Google Scholar] [CrossRef]
  39. Caccamo, M.T.; Mavilia, G.; Mavilia, L.; Lombardo, D.; Magazù, S. Self-Assembly Processes in Hydrated Montmorillonite by FTIR Investigations. Materials 2020, 13, 1100. [Google Scholar] [CrossRef]
  40. Tyagi, B.; Chudasama, C.D.; Jasra, R.V. Determination of Structural Modification in Acid Activated Montmorillonite Clay by FT-IR Spectroscopy. Spectrochim. Acta A Mol. Biomol. Spectrosc. 2006, 64, 273–278. [Google Scholar] [CrossRef]
  41. Funes, I.G.A.; Peralta, M.E.; Pettinari, G.R.; Carlos, L.; Parolo, M.E. Facile Modification of Montmorillonite by Intercalation and Grafting: The Study of the Binding Mechanisms of a Quaternary Alkylammonium Surfactant. Appl. Clay Sci. 2020, 195, 105738. [Google Scholar] [CrossRef]
  42. Madejová, J. FTIR Techniques in Clay Mineral Studies. Vib. Spectrosc. 2003, 31, 1–10. [Google Scholar] [CrossRef]
  43. Wójcik-Bania, M.; Matusik, J. The Effect of Surfactant-Modified Montmorillonite on the Cross-Linking Efficiency of Polysiloxanes. Materials 2021, 14, 2623. [Google Scholar] [CrossRef]
  44. Fang, Y.; Zhou, A.; Yang, W.; Araya, T.; Huang, Y.; Zhao, P.; Johnson, D.; Wang, J.; Ren, Z.J. Complex Formation via Hydrogen Bonding between Rhodamine B and Montmorillonite in Aqueous Solution. Sci. Rep. 2018, 8, 229. [Google Scholar] [CrossRef]
  45. Sheng, X.; Qin, C.; Yang, B.; Hu, X.; Liu, C.; Waigi, M.G.; Li, X.; Ling, W. Metal cation saturation on montmorillonites facilitates the adsorption of DNA via cation bridging. Chemosphere 2019, 235, 670–678. [Google Scholar] [CrossRef]
  46. Wang, J.; Wilson, R.S.; Aristilde, L. Electrostatic coupling and water bridging in adsorption hierarchy of biomolecules at water–clay interfaces. Proc. Natl. Acad. Sci. USA 2024, 121, e2316569121. [Google Scholar] [CrossRef]
  47. Leite, M.S.; Sodré, W.C.; de Lima, L.R.; Constantino, V.R.L.; Alcântara, A.C.S. Bionanocomposite Beads Based on Montmorillonite and Biopolymers as Potential Systems for Oral Release of Ciprofloxacin. Clays Clay Miner. 2021, 69, 547–560. [Google Scholar] [CrossRef]
  48. Yang, F.; He, X.; Wang, C.; Cao, Y.; Li, Y.; Yan, L.; Liu, M.; Lv, M.; Yang, Y.; Zhao, X.; et al. Controllable and Eco-Friendly Synthesis of P-Riched Carbon Quantum Dots and Its Application for Copper (II) Ion Sensing. Appl. Surf. Sci. 2018, 448, 589–598. [Google Scholar] [CrossRef]
  49. Zhu, R.; Huang, W.; Ma, X.; Zhang, Y.; Yue, C.; Fang, W.; Hu, Y.; Wang, J.; Dang, J.; Zhao, H.; et al. Nitrogen-Doped Carbon Dots-V2O5 Nanobelts Sensing Platform for Sensitive Detection of Ascorbic Acid and Alkaline Phosphatase Activity. Anal. Chim. Acta 2019, 1089, 131–143. [Google Scholar] [CrossRef]
  50. Balek, V.; Beneš, M.; Málek, Z.; Matuschek, G.; Kettrup, A.; Yariv, S. Emanation Thermal Analysis Study of Na-Montmorillonite and Montmorillonite Saturated with Various Cations. J. Therm. Anal. Calorim. 2006, 83, 617–623. [Google Scholar] [CrossRef]
  51. Carazo, E.; Borrego-Sánchez, A.; Sánchez-Espejo, R.; García-Villén, F.; Cerezo, P.; Aguzzi, C.; Viseras, C. Kinetic and Thermodynamic Assessment on Isoniazid/Montmorillonite Adsorption. Appl. Clay Sci. 2018, 165, 82–90. [Google Scholar] [CrossRef]
  52. Derkowski, A.; Kuligiewicz, A. Thermal Analysis and Thermal Reactions of Smectites: A Review of Methodology, Mechanisms, and Kinetics. Clays Clay Miner. 2022, 70, 946–972. [Google Scholar] [CrossRef]
  53. Li, W.; Wu, S.; Zhang, H.; Zhang, X.; Zhuang, J.; Hu, C.; Liu, Y.; Lei, B.; Ma, L.; Wang, X. Enhanced Biological Photosynthetic Efficiency Using Light-Harvesting Engineering with Dual-Emissive Carbon Dots. Adv. Funct. Mater. 2018, 28, 1804004. [Google Scholar] [CrossRef]
  54. Deb, A.; Chowdhury, D. Unraveling the Origin of Photoluminescence in Dual Emissive Biogenic Carbon Dot. Mater. Today Commun. 2022, 31, 103777. [Google Scholar] [CrossRef]
  55. Zhang, B.; Wang, B.; Ushakova, E.V.; He, B.; Xing, G.; Tang, Z.; Rogach, A.L.; Qu, S. Assignment of Core and Surface States in Multicolor-Emissive Carbon Dots. Small 2022, 19, 2204158. [Google Scholar] [CrossRef]
  56. De La Harpe, K.M.; Kondiah, P.P.D.; Choonara, Y.E.; Marimuthu, T.; Du Toit, L.C.; Pillay, V. The Hemocompatibility of Nanoparticles: A Review of Cell-Nanoparticle Interactions and Hemostasis. Cells 2019, 8, 1209. [Google Scholar] [CrossRef]
  57. Sæbø, I.P.; Bjørås, M.; Franzyk, H.; Helgesen, E.; Booth, J.A. Optimization of the Hemolysis Assay for the Assessment of Cytotoxicity. Int. J. Mol. Sci. 2023, 24, 2914. [Google Scholar] [CrossRef]
  58. ISO 10993-5; Biological Evaluation of Medical Devices. Part 5: Tests for Cytotoxicity: In Vitro Methods”, 3st Ed. International Organization for Standardization: Geneva, Switzerland, 2009.
Figure 1. Schematic illustration of the synthesis procedure for CQD.
Minerals 15 01146 g001
Figure 2. Diffraction patterns of montmorillonite, MCQD-R1, MCQD-R2-1, and MCQD-R2-16 hybrid nanomaterials, and CQD.
Minerals 15 01146 g002
Figure 3. XRD patterns of pure montmorillonite, the synthesis mixtures before thermal treatment, and the hybrid nanomaterials (A) MCQD-R2-1 and (B) MCQD-R2-16.
Minerals 15 01146 g003
Figure 4. FT-IR spectra of pure montmorillonite, MCQD-R1, MCQD-R2-1, and MCQD-R2-16 hybrid nanomaterials, and CQD in the range of 4000 to 400 cm−1.
Minerals 15 01146 g004
Figure 5. TG and DTG of (A) CQD, (B) MMT, (C) MCQD-R1, (D) MCQD-R2-1, (E) MCQD-R2-16 hybrid nanomaterials with a heating rate of 10 °C·min−1 under a synthetic air atmosphere.
Minerals 15 01146 g005
Figure 6. UV-Vis spectra of CQD (25.0 mg·L−1), MCQD-R1 (100.0 mg·L−1), MCQD-R2-1 (50.0 mg·L−1), and MCQD-R2-16 (50.0 mg·L−1) hybrid nanomaterials in aqueous dispersions.
Minerals 15 01146 g006
Figure 7. Stability of CQD, MCQD-R1, MCQD-R2-1, and MCQD-R2-16 hybrid nanomaterials evaluated by UV-Vis spectroscopy over time.
Minerals 15 01146 g007
Figure 8. Emission spectra of CQD (A), MCQD-R1 (B), MCQD-R2-1 (C), and MCQD-R2-16 (D) hybrid nanomaterials as aqueous dispersion.
Minerals 15 01146 g008
Figure 9. PLE spectra of CQD (A), MCQD-R1 (B), MCQD-R2-1 (C), and MCQD-R2-16 (D) hybrid nanomaterials.
Minerals 15 01146 g009
Figure 10. Hemolysis percentage of (A) CQD, (B) MMT, and the (C) MCQD-R2-1 hybrid nanomaterial. The hemolysis percentage was evaluated at concentrations ranging from 5000 to 36.0625 μg/mL in the erythrocytes of sheep. The results correspond to averages ± of individual samples tested in triplicate. (*) p < 0.05, compared to the positive control (Triton X-100 at 1%). The CQD samples exhibited no detectable hemolytic activity (0%) in some concentrations, consistent across all replicates.
Minerals 15 01146 g010
Table 1. Elemental composition in weight of CQD and the MCQD-R1, MCQD-R2-1, and MCQD-R2-16 hybrid nanomaterials.
SampleC (%)H (%)N (%)Amount of CQD (%)
CQD71.574.8623.57100
MCQD-R14.333.351.959.63
MCQD-R2-162.935.4520.9489.32
MCQD-R2-1622.103.548.3634.00
Table 2. Lifetime measurements of CQD, MCQD-R1, MCQD-R2-1, and MCQD-R2-16 hybrid nanomaterial under excitation of 450 nm.
Samplesλem (nm)τ1 (ns)τ2 (ns)τAV (ns)
CQD5280.91
(56.85%)
6.14
(43.15%)
5.29
6260.88
(94.40%)
4.17
(5.60%)
1.60
MCQD-R15301.57
(40.17%)
5.66
(59.82%)
5.02
MCQD-R2-15601.58
(92.67%)
5.095
(7.33%)
2.29
5902.21
(100%)
-2.22
MCQD-R2-165511.09
(70.77%)
5.46
(29.23%)
4.04
6000.91
(88.07%)
4.46
(11.93%)
2.33
Disclaimer/Publisher’s Note: The statements, opinions and data contained in all publications are solely those of the individual author(s) and contributor(s) and not of MDPI and/or the editor(s). MDPI and/or the editor(s) disclaim responsibility for any injury to people or property resulting from any ideas, methods, instructions or products referred to in the content.