Abstract
Diamond traceability has been a major challenge for the gemological industry in recent decades. In this context, this paper presents new studies using UV-VIS-NIR spectroscopy to identify the traceability and geographical origin of diamonds. The aim of the work is to identify characteristic centers of fancy-color diamonds collected from Cullinan Mine, Democratic Republic of Congo (DRC), and the geographical regions with unknown origin. Depending on the origin of the diamonds, the UV-VIS-NIR spectra can be differentiated as follows: (i) the diamonds collected from Cullinan Mine show absorption bands assigned to N10, NV0, NV−, N3V0, N4V2, and N4V centers, which are accompanied by a vibronic structure localized between 415 and 394 nm (2.987–3.147 eV) and (ii) the diamonds from DRC show absorption bands attributed to N10, NV−, N3V0, N1+, and NVH centers. Using Raman spectroscopy, nitrogen concentration values of diamonds collected from the Cullinan mines and DRC between 41 and 185 ppm and 204–336 ppm, respectively, were reported. We prove that the simultaneous applicability of UV-VIS-NIR spectroscopy and Raman scattering as comparative tools for assessing diamond provenance can be a valuable strategy for an initial attribution of diamonds with unknown geographical origin, knowing the optical features of diamonds collected from Cullinan Mine and DRC.
1. Introduction
Interest in diamonds dates back to ancient times, when they were used in jewelry and religious objects. Diamonds have always been studied and valued due to their rarity and gem properties, classifying diamonds as minerals with higher gemmological properties, such as color, transparency, dispersion, saturation, hardness, and rarity, suitable for being polished and used in jewelry. Later, synthetic diamonds and ultrathin diamond coatings have allowed their use in various applications such as those of photovoltaics, biosensors, gas sensors, protective coatings, and optical devices [1].
Returning to the natural diamonds, they were reported to contain nitrogen impurities [2]. Depending on the nitrogen concentration, the classification of natural diamonds was reported to be of Type I and Type II. The first ones contain a concentration of nitrogen in the range of hundreds to thousands of parts per million (ppm), causing a visible coloration that can be quantified using IR spectroscopy [2]. The second type of diamonds contains nitrogen concentrations in the range of a few ppm (<1–2 ppm) [2]. The role of nitrogen-vacancy in diamond samples was studied by photoluminescence and Raman scattering [3]. Other methods used to characterize the natural diamonds were X-ray diffraction (XRD) [4], FTIR spectroscopy [2,4], UV-VIS-NIR spectroscopy [4,5], and scanning electron microscopy (SEM) [6].
As is well known, from a geological point of view, diamonds were formed in the Earth’s lithosphere at a depth of >120 km (>90 miles), at a temperature of about 1000–1400 °C [7] and at a pressure of ~5.0–7.0 GPa with a limited exposure time depending on the geological conditions of formation and the geographical area where they have been formed. Diamonds are classified in two well distinct categories from the point of view of their formation: (1) lithospheric diamonds, which form between 120 and 220 km depth, with a global mode at 175 ± 15 km depth and (2) sublithospheric or super-deep diamonds, which are formed much deeper, at depths from 300 km to up to 1000 km [8,9,10]. Morphologically and structurally, atoms of carbon connect in a tetrahedral shape (hybridization sp3) to form crystals with a unique geological structure at high pressure and temperature, transforming the carbon mineral into a diamond with gem properties and being classified as a precious gemstone. The age of diamonds is a subject under debate due to their geographical origin, which is estimated to be over 1 billion years old [7]. Most diamonds have reached the Earth’s surface through volcanic eruptions, tectonic activity, and groundwater activity. The diamond formation occurs relatively quickly; within a few hours, the carbon crystals move during formation at speeds of ~32–48 km/h (20–30 mph), followed by a geological solidification process of lava. The carbon crystals exposed to high pressure and temperature for a long time alter the carbon structure and transform it into graphite. As a result of this geological process, only 30% of diamonds have gem properties. As a result of the geological activity, the crystals that reached the surface were located in diamond ore, known as kimberlite [2,11] and lamproite [7,12]. From the gemological point of view, diamonds are classified as unique minerals with a hardness of 10 on the Mohs scale, transparency, and rarity that are exhibiting inclusions with specific chemical elements, depending on the geographical area in which they formed, the geological conditions, and the chemical elements specific to the kimberlite and lamproite rocks in the pegmatitic pipe in which they formed.
Since in this paper our attention will be focused on the traceability of diamonds harvested from the Cullinan mines and the Democratic Republic of Congo (DRC), by UV-VIS-NIR spectroscopy, a brief review of the information concerning the diamonds from these geographical ranges is necessary to be presented in the following. Regarding the geological framework of the Cullinan mine, the kimberlite at the Cullinan mine formed in the southern part of the Proterozoic Bushveld Magmatic Complex (~2.05 billion years ago) of the Kaapvaal Craton (Figure 1). The age of the Cullinan mine has been identified as ~1153 million years. Most researchers have reached a common conclusion that the enormous volume of mafic magma that formed the Bushveld Complex is the largest stratified continental intrusion in the world [13]. From a geological point of view, the Cullinan mine is composed of rocks from the Transvaal Group, as well as igneous rocks of the Bushveld Volcanic Complex. The kimberlite has been radiometrically dated to 1179 ± 36 million years using rubidium (Rb)–strontium (Sr) in clinopyroxene and 1202 ± 72 million years using uranium (U)–lead (Pb) in perovskite [13].
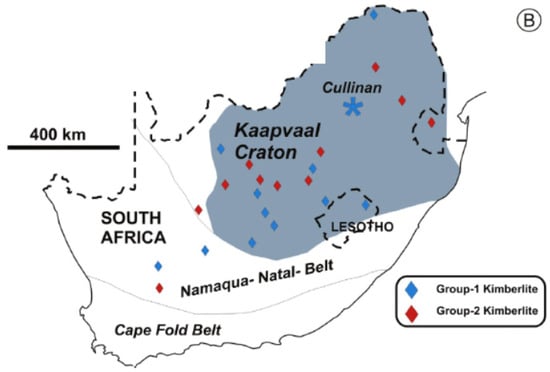
Figure 1.
Geological map of South Africa [13]. Figure reused with permission from [13]. Copyright 2025 Elsevier.
The mine area is traversed by a geological structure of granular igneous rock (gabbro) that is ~1150 million years old [14]. The internal geology of the mine was first described by the geologist Wagner in 1914, who noted the presence of a Waterberg quartzite pipe that formed in the middle of the mine. Subsequent geological work identified the presence of a number of kimberlite ores, including two major types of tuffaceous breccias, referred to as “brown” and “grey” kimberlites [15]. Depending on the nitrogen concentration, Cullinan diamonds with a concentration of nitrogen atoms equal to 1–22 ppm and 20–750 ppm were classified to be Type I and Type II, respectively [15].
Regarding the geological framework of the DRC diamonds, the first diamond in the Kasai region was discovered in 1907 by Narcisse Janot, in the branch of the Kasai River (Kiminina River), which became a part of the alluvial mines around Tshikapa, where over 100 million carats of diamonds were discovered over time [16]. By the year 1920, this pipe was already known as one of the largest alluvial diamond deposits in the world, whose production in the early 1950s represented ~75% of world production by volume [16]. The presence of kimberlite ore in the region was not officially attested until 1946 (by Magne’e 1946) [17]. In 1955, the Tshibua (Tshibwe) kimberlite pipes were discovered by MIBA. These were among the last kimberlite pipes reported in the country until the De Beers company began exploitation, between 1970 and 1982, and subsequently between 2004 and 2009. During the first period of exploitation, kimberlite ore in the Bas-Congo area was geographically identified south of Kinshasa, close to the Angolan border, in 1974, and in 2005, two more pipes were discovered near Kabinda, east of Mbuji May [16].
Given these geological features, the Bakwanga I kimberlite pipe is located in the Mbuji-Mayi area of the Congo-Kasaï Craton, in the central Democratic Republic of the Congo (DRC) (Figure 2) [16]. The exploration of diamantiferous rocks is mainly made within the kimberlite facies, which is characterized by the presence of various types of breccias consisting of variable proportions of kimberlite clasts, limestone, and sandstone from the Neoproterozoic Bushimay Supergroup and gneiss from the craton, all supported in a layer of sandy clay [16]. From a petrographic point of view, the kimberlite of the diatreme facies presents a porphyritic texture with phenocrysts of garnet, olivine [18,19], and biotite [16]. The mining area contains large quantities of ferrous minerals such as ilmenite, goethite, and hematite. Geological studies have discovered two main kimberlite pipes that are distinguished in the area as facies [15,16,17,18,19]. The first appears as blue, green, or red-green colors due to the abundance of chlorite and goethite, as well as hematite, during the water flooding of the host rock [15,16,17,18,19]. This facies is usually of pyroclastic origin and was deposited during volcanic eruption, containing from 1.14 to 2.38 carats of diamonds per m3 [15,16,17,18,19]. The second facies is an epiclastic kimberlite that comprises a resedimented volcaniclastic unit exposed within the pipe and around the pipe border that is not abundant in diamonds [15,16,17,18,19]. A part of the diamonds from the DRC is also delivered to Zambia through streams [15].
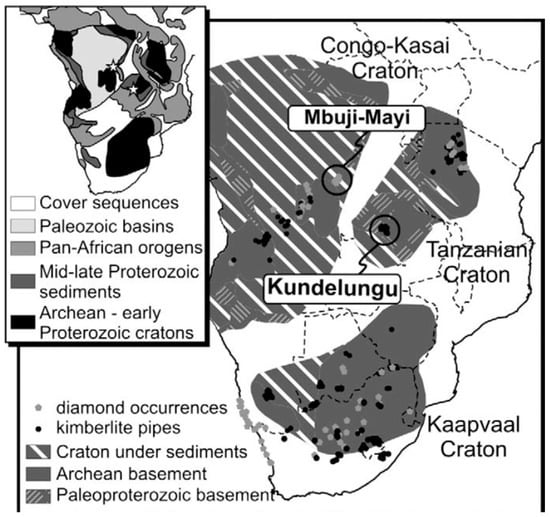
Figure 2.
The map of Democratic Republic of Congo [16]. Figure reused with permission from [16]. Copyright 2025 Elsevier.
Concerning the optical analysis of diamonds from the Cullinan mines and DRC region, the following progress was reported. Using SEM, kimberlite clusters were identified by quantitative mineralogical methods in 2009 [6]. The analysis by IR spectroscopy of the 530 ct Cullinan I and 317 ct Cullinan II has highlighted similar IR spectra with those of the Type IIa diamonds, namely samples that do not contain measurable impurities of nitrogen or boron in their crystal structure, which were accompanied by a slight hump at 1100 cm−1 in the case of the sample Cullinan II [20]. Using Raman scattering, 322 diamond inclusions were studied using 202 Cullinan diamonds in 2018 [21]. Subsequently, 4 years later, graphite-like inclusions, metal alloys, oxides, sulfides, and methane were reported to be in type IIb diamonds from the Cullinan mine [4]. Inclusions with the composition Ca–carbonatitic–silicic were highlighted by FTIR spectroscopy and Raman scattering in the case of the diamonds from DRC [22]. A recent study, reported by Shiyun Jin et al., highlights the potential of UV-VIS-NIR spectroscopy in understanding the role of light-absorbing defects as well as clusters in the case of the fancy-yellow diamonds and green diamonds [23]. Considering the impurities of nitrogen, the main defects in fancy-color diamond were assigned to the following: (i) isolated nitrogen defects characteristic of diamonds (known as C center); (ii) the H3 defects (labeled as N2V0, where two nitrogen atoms are surrounded of a neutral vacancy that show a band with maximum at 503.2 nm (2.46 eV)); (iii) the “cape” defects, which show bands at 415 nm (2.987 eV), 451 nm (2.749 eV) and 478 nm (2.594 eV) assigned to the N3 defects (labeled as N3V0, where three nitrogen atoms are around a single vacancy) [24,25]; (iv) the NV0 center, corresponding to the zero-phonon line (ZPL) transition, observed by the band at 575 nm (2.156 eV) [2]; and (v) NV− center, attributed to the band at 637 nm (1.945 eV), which correspond to a state with triplet spin [2]. Considering this progress, the identification of the main centers of the diamonds collected from the Cullinan mine and DRC by UV-VIS-NIR spectroscopy will be reported. Knowing the features of the UV-VIS-NIR spectra of the diamonds from the Cullinan mine and DRC as well as the nitrogen concentration assessed from Raman spectra, an identification of the diamonds from the unknown geographical region will be carried out.
The aim of this work is to highlight the main centers of diamonds collected from the Cullinan mine and RDC as well as the nitrogen concentration in these samples. Another objective of this work is, in the case of diamonds, collected from the unknown geographical region, whether the nitrogen concentration and centers are similar to diamonds from the Cullinan or DRC mines or another.
2. Materials and Methods
Three batches of diamond samples were used in this study as follows: (i) 44 diamonds were collected from the Cullinan mine, from which only one was polished; (ii) 9 diamonds were from the RDC; and (iii) 12 diamonds are of unknown geographical origin.
The microphotographs of the above diamond samples were made with a SOPTOP SZMN microscope with a photo/video camera and a microphotography tablet.
UV-VIS-NIR spectra of the above diamond samples were recorded in the spectral range 365–900 nm, with a UV-VIS-NIR spectrometer, GemmoSphere™ model, from Magi Labs., endowed with a 4” PTFE- integrating sphere for maximum signal strength, having a resolution of 1.3 nm, a scanning average equal to 50, and an integration time of 50 ms. A GemmoLab™ Software Suite is used.
Raman spectra of all samples were recorded with an FT Raman spectrophotometer, MultiRam model, from Bruker, which was endowed with a YAG:Nd laser (excitation wavelength of 1064 nm), with a resolution of 2 cm−1, the laser power being 25 mW.
3. Results and Discussion
3.1. Optical Properties of Diamonds from the Cullinan Mine
Figure 3 and Table 1 show the microphotographs, weight, and size (namely length × width (L × W)) of samples from Cullinan Mine. Of the 30 samples, only one is polished, while the other 29 samples are unpolished. According to Figure 3 and Table 1, we observe the following: (i) the dimension of the samples ranges between 1.4 and 7.85 mm; (ii) the weight of diamond samples varies from 0.042 ct to 3.20 ct; and (iii) the color of diamond samples varies from yellow–brown to pink, a fact that indicates the presence of some impurities. The yellow–brown color of these samples was assigned to the nitrogen atoms in the diamond lattice [26].
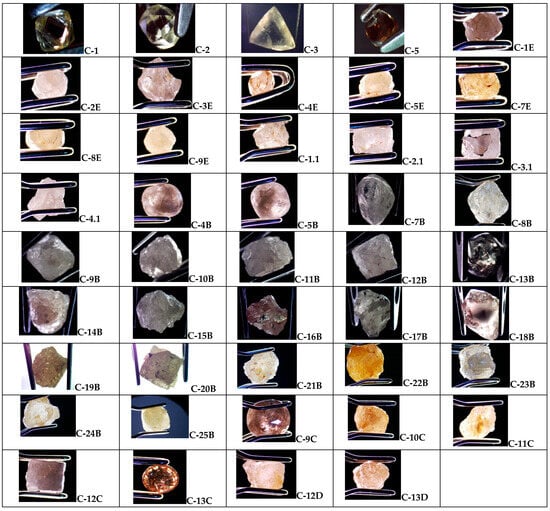
Figure 3.
Microphotographs of the diamond samples from the Cullinan mine labeled: C-1; C-2; C-3; C-5; C-1E; C-2E; C-3E; C-4E; C-5E; C-7E; C-8E; C-9E; C-1.1; C-2.1; C-3.1; C-4.1; C-4B; C-5B; C-7B; C-8B; C-9B; C-10B; C-11B; C-12B; C-13B; C-14B; C-15B; C-16B; C-17B; C-18B; C-19B; C-20B; C-21B; C-22B; C-23B; C-24B; C-25B; C-9C; C-10C; C-11C; C-12C; C-13C; C-12D; and C-13D.

Table 1.
Weight, size (length × width (L × W) in the case of parallelepiped samples, or diameter (D) in the case of spherical samples), and clarity grade of the diamond samples from the Cullinan mine.
In Table 1, clarity was assessed according to GIA (Gemological Institute of America) standard https://4cs.gia.edu/en-us/diamond-clarity/), and the abbreviations for: (i) VS2 is Very Slightly Included 2; (ii) SI2 is Slightly Included 2; (iii) SI1 is Slightly Included 1; and (iv) I1 is Included 1.
Before showing the UV-VIS-NIR spectra of the diamonds from Cullina Mine and DRC, we must note that the absorption spectrum of the following: (i) the pink diamond is characterized by a band with a maximum at 550 nm (2.25 eV), which was accompanied by other bands peaking at 592 nm (2.09 eV), 599 nm (2.07 eV), 607 nm (2.04 eV), 613 nm (2.02 eV), and 650 nm (1.90 eV) [5]. The band at 550 nm was reported to be due to charge or energy transfer processes and plastic deformation [5]. The bands situated in the 592–613 nm (2.09–2.02 eV) spectral range were assigned to NV centers modified by the crystalline state or structural changes. (ii) the brown diamond is characterized only by the band at 550 nm (2.25 eV) [5], which was associated with the structural defect caused by plastic deformation, induced by mechanical stress during the diamond genesis, it being specific to diamonds that do not contain chromophore impurities based on nitrogen (NV0) or hydrogen [27]; (iii) the Canary diamond shows a band with maximum at 476 nm (2.60 eV) [5] belonging to N3V0 defect characteristic for the natural diamonds with a high nitrogen weight, being accompanied of ZPL band at 415 nm (2.987 eV), vibronic bands in the spectral range 450–500 nm (2.75–2.48 eV) and a band at 503 nm (2.46 eV) assigned to H3 centrum; (iv) Cape-yellow type Ia diamond shows two bands peaked at 545 (2.27 eV) nm and 563 nm (2.20 eV) [5]; the first one is assigned to aggregated nitrogen centers of the type H4, which contains four nitrogen atoms and two vacancy (N4V2), this appearing in the diamond with high nitrogen weight such as IaB diamond. This H4 centrum shows a ZPL at 496 nm (2.5 eV) and vibronic bands in the spectral range 540–550 nm (2.296–2.3 eV) [5]. The band at 563 nm (2.202 eV) is assigned to H3 center (N2V), which shows a ZPL situated at 503 nm (2.46 eV), this being specific to Ia diamonds with nitrogen aggregates. A summarization of all these centers is shown in Table 2.

Table 2.
The main bands in the UV-VIS spectrum of the diamond and their assignments.
Figure 4 and Figure S1 show UV-VIS-NIR spectra of the diamond samples from Cullinan Mine as well as their deconvolution. All UV-VIS-NIR spectra have been deconvoluted using a Voigt function. The background was constant in all cases.
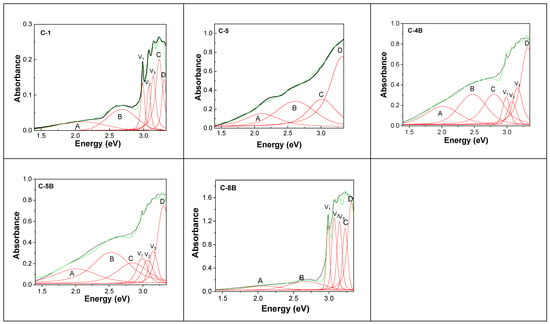
Figure 4.
UV-VIS-NIR spectra of diamonds from Cullinan Mine and their deconvolution: C-1; C-5, C-4B; C-5B; and C-8B. Black, green, and red curves correspond to the experimental spectrum, the total fit of each spectrum, and the individual components of the spectral deconvolution.
The deconvolution of the UV-VIS-NIR spectra of diamonds from Cullinan Mine highlights bands whose peaks are noted in Table 2. In addition, Figure 4 highlights the presence of a vibronic structure in the samples labeled as Samples C-1, C-5, C-4B, C-5B, C-7B, and C-8B. The presence of the vibronic structure only in the case of certain diamond samples can be explained by considering the electron–phonon interaction, i.e., the coupling between electronic excitations and local phonons [31]. The assignment of the bands in Table 2 was carried out considering nitrogen as the main impurity, for which centers of the following type: (i) isolated N10 = C, labeled as N10, were assigned to the absorption band situated around of 400–376 nm (3.1–3.3 eV), having two ZPLs at 443 nm (2.8 eV) and 365 nm (3.4 eV); (ii) N1+ was attributed to transition to the excited state, peaked at 496 nm (2.5 eV) and 354 nm (3.5 eV); (iii) N2+, whose the absorption band is peaked at 426–425 nm (2.91–2.916 eV); (iv) N3, which shows three ZPL transitions V1N30 was reported at 540 nm (2.297 eV), 463 nm (2.680 eV) and 415 nm (2.985 eV); (v) NV0, having a fundamental state of the type doublet (2E) with a ZPL band at 575 nm (2.156 eV); (vi) NV−, having a fundamental state of the type triplet (3A2) and an excitate state 3E, showing a ZPL band at 638–637 nm (1.945–1.947 eV); (vii) N2V0, attributed to the band at 504 nm (2.46 eV); (viii) N3V0, assigned to the bands at 415–416 nm (2.987–2.985 eV), 451 nm (2.749 eV), 463 nm (2.68 eV), 478 nm (2.594 eV), and 540 nm (2.297 eV); (ix) N4V1, which shows two ZPL transitions at 578 nm (2.145 eV) and 456 nm (2.721 eV); (x) N4V2, assigned to the bands at 546 nm (2.27 eV) and 564 nm (2.2 eV) [5,32]. A careful analysis of Table 2 highlights some shifts in the absorption bands labeled as C, B, and A. Some examples can be band shifts from: (i) 636 nm (1.95 eV) to 653 nm (1.9 eV); (ii) 578 nm (2.145 eV) to 620 nm (2.00 eV); (iii) 571 nm (2.17 eV) to 575 nm (2.156 eV); (iv) 558 nm (2.22 eV) to 563 nm (2.2 eV); etc. An explanation for these variations in the absorption bands can be given by taking into account the crystal deformation effect and the electron-phonon interaction, as reported by P. Kehayias et al. [2]. According to Ref. [2], the deformation of the crystal lattice in natural diamonds occurs as an effect of internal geological stresses and inclusions modifying the local symmetry of NV defects, leading to the splitting or displacement of the ZPL, thus modifying the position and absorbance of the UV-VIS-NIR bands. According to Table 3, the profile of the UV-VIS-NIR spectra of the diamonds collected from Cullinan Mine is dependent on the presence of the following centers: N10, N3V0, NV0, NV−, N4V0, and N4V2, observed around 371–385 nm, 463–496 nm, 585–602 nm, 611–636 nm, 406–415 nm, and 492–500 nm. Of the 44 samples, 39 diamonds show the N3V0 center, 37 diamonds contain the N4V0 center, 25 diamonds contain the NV− center, 18 diamonds contain the N10 center, and 7 diamonds shows the N4V2 center. A common feature for the 44 diamonds is the presence of the center N10.

Table 3.
The main bands of the UV-VIS-NIR spectra of diamonds from Cullinan Mine.
Figure S2 shows the UV-VIS-NIR spectra at room temperature (RT) and liquid nitrogen temperature (LNT) in the case of the three diamonds from the Cullinan mine. Figure S2 highlights that the decrease in temperature leads to an increase in the absorbance of the UV-VIS-NIR spectra in all cases of the three samples. An explanation for such behavior can be the reduction in electron-phonon interactions and the decrease in non-radiative channels, which determine that optical transitions are more efficient at LNT.
In order to calculate the nitrogen concentration in these samples, Figure 5 shows the Raman spectra of samples from the Cullinan mine.
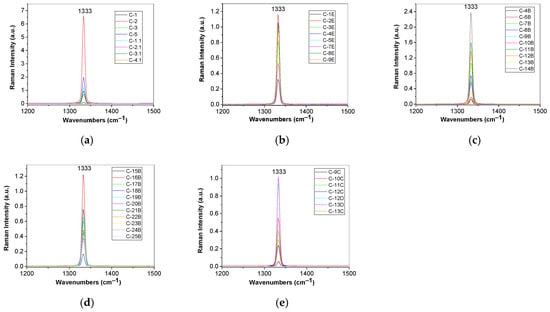
Figure 5.
Raman spectra of diamonds from Cullinan Mine recorded to the excitation wavelength of 1064 nm, labeled: (a) C-1; C-2; C-3; C-5; C-1.1; C-2.1; C-3.1; C-4.1; (b) C-1E; C-2E; C-3E; C-4E; C-5E; C-7E; (a) C-8E; C-9E; (c) C-4B; C-5B; C-7B; C-8B; C-9B; C-10B; C-11B; C-12B; C-13B; C-14B; (d) C-15B; C-16B; C-17B; C-18B; C-19B; C-20B; C-21B; C-22B; C-23B; C-24B; C-25B; (e) C-9C; C-10C; C-11C; C-12C; C-13C; C-12D; and C-13D.
According to Figure 5, in the spectral range 1200–1500 cm−1, Raman spectra of all samples are characterized by a Raman line peaked at ~1333 cm−1, assigned to the vibrational mode of the two interpenetrating cubic sublattices [33], that shows various intensities and full-width half-maximum (FWHM). According to Ref [15], diamonds from the Cullinan mine contain A and B centers, i.e., nitrogen is in the form of pairs of adjacent substitutional N atoms and, respectively, as complexes of four substitutional N atoms located tetrahedrally around a vacant site. By application of a fit with a Voigt function for each Raman spectrum shown in Figure 5, we have determined the FWHM of the Raman lines, considering the Lorentz component of the Voigt fit, which allows us to calculate the nitrogen concentration of A centers using the following Equation (1) [34]:
where N corresponds to the nitrogen concentration in ppm. Thus, Table 3 shows the values of FWHM and the wavenumber of the Raman line of the diamonds, and the nitrogen concentration in samples collected from the Cullinan mine. Deconvolution of the Raman line peaked at ~1333 cm−1 is shown in Figure 6.
FWHM = 1.57 + 0.97 × 10⁻³ N
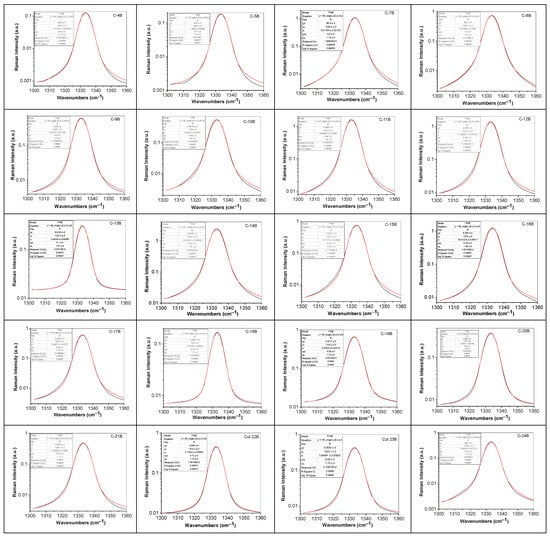
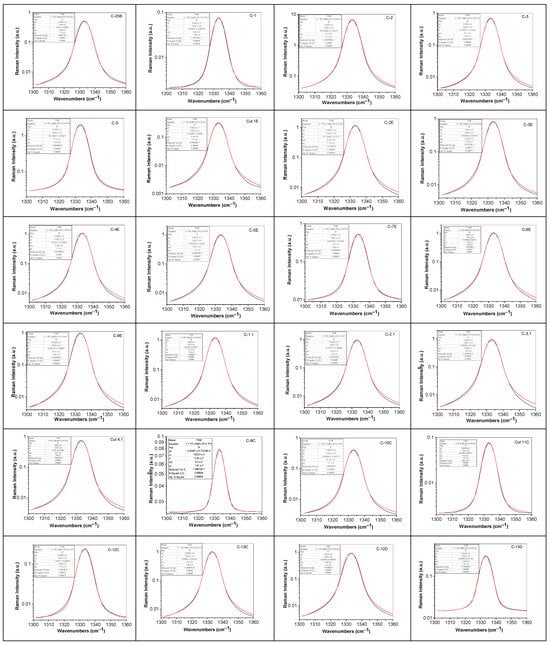
Figure 6.
Deconvolution of Raman line at ~1333 cm−1 of diamonds from Cullinan mine, labeled: C-4B; C-5B; C-7B; C-8B; C-9B; C-10B; C-11B; C-12B; C-13B; C-14B; C-15B; C-16B; C-17B; C-18B; C-19B; C-20B; C-21B; C-22B; C-23B; C-24B; C-25B; C-1; C-2; C-3; C-5; C-1.1; C-2.1; C-3.1; C-4.1; C-1E; C-2E; C-3E; C-4E; C-5E; C-7E; C-8E; C-9E; C-9C; C-10C; C-11C; C-12C; C-13C; C-12D; and C-13D. Black and red curves correspond to the experimental spectrum and the total fit.
According to Table 4, the concentration of nitrogen in diamond samples collected from the Cullinan mine varies from 41 to 185 ppm.

Table 4.
The FWHM and wavenumber of the Raman line of diamonds from Cullinan Mine, and the nitrogen concentration.
3.2. Optical Properties of Diamonds from DRC
Figure 7 and Table 5 show the main characteristics of the diamond samples from DRC. Out of the 9 samples from DRC, only two are polished, while the other 7 samples are unpolished. The dimension of the diamond samples from DRC varies between 3.7 and 8.8 mm, while the weight varies between 0.31 and 1.66 ct. The color of diamond samples from the DRC varies from yellow-brown to pink.

Figure 7.
Microphotographs of the diamond samples from the Cullinan mine labeled: (a) DRC-1D; (b) DRC-2C; (c) DRC-6D; (d) DRC-7D; (e) DRC-8D; (f) DRC-10; (g) DRC-11D; (h) DRC-15D; (i) DRC-16D.

Table 5.
Weight, size, and clarity grade of the diamond samples from DRC.
Table 4 shows the main characteristics of the diamond samples from the DRC. Out of the nine samples, only two are polished, while the other seven samples are unpolished. The dimension of the diamond samples from DRC varies between 3.7 and 8.8 mm, while the weight varies between 0.31 and 1.66 ct. The color of diamond samples from the DRC varies from yellow-brown to pink.
Figure 8 shows UV-VIS-NIR spectra of the diamond samples from RDC as well as their deconvolution.
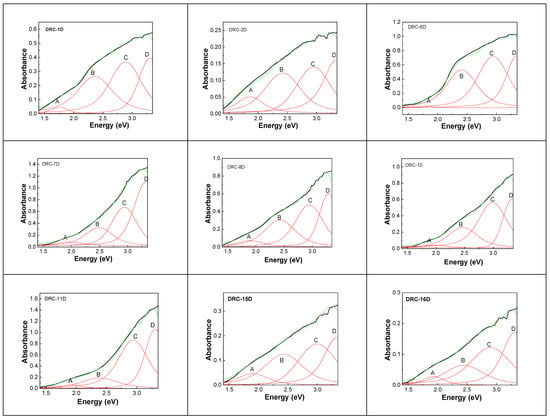
Figure 8.
UV-VIS-NIR spectra of diamonds from DRC and their deconvolution: DRC-1D; DRC-2C; DRC-6D; DRC-7D; DRC-8D; DRC-10; DRC-11D; DRC-15D; DRC-16D. Black, green, and red curves correspond to the experimental spectrum, total fit of each spectrum, and the four individual components of the deconvoluted spectra labelled as A, B, C, and D.
The deconvolution of the UV-VIS-NIR spectra of diamonds from the DRC highlights three bands labeled as C, B, and A, whose peaks are noted in Table 5, as shown in Figure 8. Similarly to the diamonds from Cullinan Mines, the deconvolution of the UV-VIS-NIR spectra of diamonds from DRC highlights four bands, which are situated in the spectral ranges 371–377 nm (3.34–3.29 eV), 413–429 nm (3–2.89 eV), 498–523 nm (2.49–2.37 eV), and 626–704 nm (1.98–1.76 eV), labeled as D, C, B, and A, whose peaks are noted in Table 6.

Table 6.
The bands A, B, C, and D of the UV-VIS-NIR spectra of diamonds from DRC.
According to Table 5, the profile of the UV-VIS-NIR spectra of the diamonds collected from DRC is dependent on the following types of centers: N10, N1+, NV−, N3V0, and NVH. Of the nine samples, nine diamonds show centers of the type N3V0 and N10, eight diamonds show NV− centers, two diamonds show NVH centers, and one diamond shows N1+.
To assess the nitrogen concentration in diamonds collected from the DRC, Figure 9 shows Raman spectra of the samples DRC-1, DRC-2, DRC-6, DRC-7, DRC-8, DRC-10, DRC-11, DRC-15, and DRC-16.
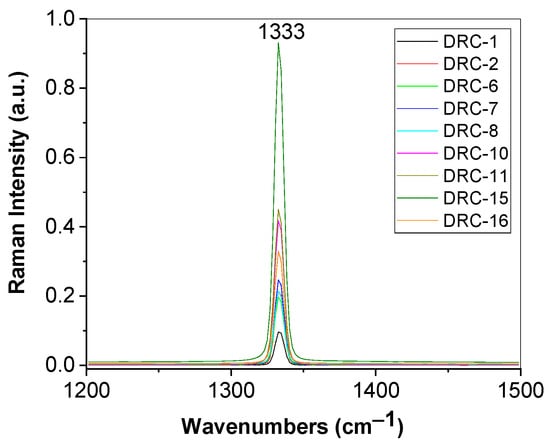
Figure 9.
Raman spectra of diamonds from DRC recorded to the excitation wavelength of 1064 nm, labeled as: DRC-1, DRC-2, DRC-6, DRC-7, DRC-8, DRC-10, DRC-11, DRC-15, and DRC-16.
Deconvolution of Raman spectra of diamonds from DRC is shown in Figure 10.
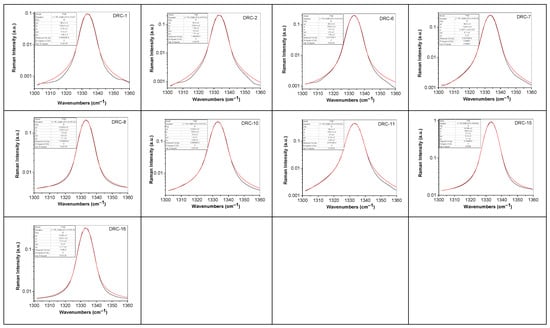
Figure 10.
Deconvolution of the Raman line of diamonds from DRC, labeled as: DRC-1, DRC-2, DRC-6, DRC-7, DRC-8, DRC-10, DRC-11, DRC-15, and DRC-16. Black and red curves correspond to the experimental Raman line and the total fit of the deconvolution of the Raman line.
Applying a Voigt fit for each Raman spectrum of diamonds from the DRC shown in Figure 9, we have determined the FWHM of the Raman lines, which allows us to calculate the nitrogen concentration of C centers, i.e., single substitutional N atoms, using Equation (2) [34]:
where N corresponds to the nitrogen concentration in ppm. Table 7 shows the values of FWHM and the wavenumber of the Raman line of diamond collected from the DRC, as well as the nitrogen concentration in these samples.
FWHM = 1.6 + 1.52 × 10⁻³ N

Table 7.
The FWHM and wavenumber of the Raman line of diamonds collected from DRC, and the nitrogen concentration.
According to Table 7, the concentration of nitrogen in diamond samples from DRC varies from 204 to 336 ppm.
3.3. Optical Properties of Diamonds with Unknown Geographical Origin
Figure 11 and Table 8 show the weight, size, and polish grade of the diamond samples with unknown geographical origin. Out of the 12 samples, only two are unpolished, while the other 10 samples are polished. The dimension of these samples varies between 1.84 and 10 mm, while the weight ranges between 0.042 and 0.82 ct. The color of these diamonds varies from yellow to green with different hues.

Figure 11.
Microphotographs of the diamond samples with unknown geographical origin labeled: (a) U-5; (b) U-6; (c) U-6R (d) U-7; (e) U-8; (f) U-14; (g) U-17; (h) U-18; (i) U-19; (j) U-20; (k) U-21; (l) U-24.

Table 8.
Weight, size, and clarity grade of the diamond samples with unknown geographical origin.
Figure 12 shows UV-VIS-NIR spectra of the diamond samples with unknown geographical origin, as well as their deconvolution.
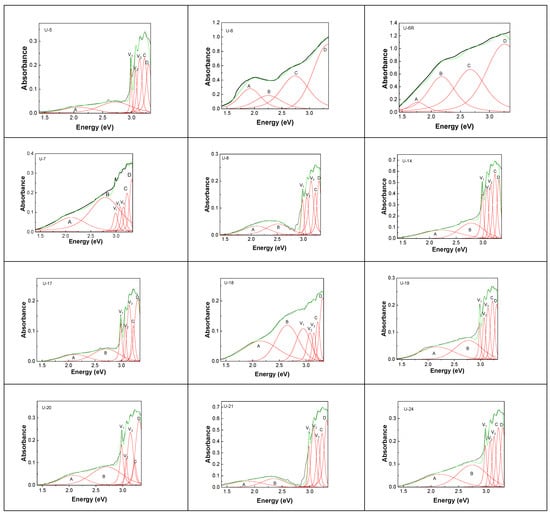
Figure 12.
UV-VIS-NIR spectra of diamonds with unknown geographical origin labeled: U-5; U-6; U-6R; U-7; U-8; U-14; U-17; U-18; U-19; U-20; U-21; and U-24. Black, green, and red curves correspond to the experimental spectra, total fit of each spectrum, and the individual components of the deconvolution of UV-VIS-NIR spectra, respectively.
The deconvolution of the UV-VIS-NIR spectra of diamonds with unknown geographical origin highlights bands, whose peaks are noted in Table 9.

Table 9.
Bands of the UV-VIS-NIR spectra of diamonds with unknown geographical origin.
Considering the spectral characteristics of diamonds from the Cullinan mine and RDG, in the case of UV-VIS-NIR spectra of diamonds of unknown geographical origin, we can remark that: (i) Samples U-5, U-7, U-8, U-17, U-18, U-19, U-20, U-21 and U24 show characteristics of diamonds collected from the Cullinan mine, such as the vibronic structure with peaks at 415 nm (2.987 eV), 402–403 nm (3.074–3.077 eV) and 395–393 nm (3.138–3.158 eV) and the presence of N4V2, N4V0, N3V0, N10, and NV0 centers, remarked by bands with peaks at 569 nm (2.18 eV), 579–599 nm (2.14–2.07 eV), 457–480 nm (2.71–2.58 eV), 411–378 nm (3.02–3.28 eV) and 490 nm (2.53 eV); (ii) Samples U-6, and U-6R show characteristics of diamonds from DRC, which show centers of the type N3V0, N10, NV−, NVH, and N4V2, peaked at 477–453 nm (2.6–2.74 eV), 411–378 nm (3.02–3.28 eV), 500 nm (2.48 eV), 700 nm (1.77 eV) and 569 nm (2.18 eV). These differences originate in the initial structure of nitrogen in the diamond lattice and the defect history, i.e., how vacancies combine with these structures by irradiation and annealing. Thus, in the case of diamonds from Cullinan mines, the substitutional nitrogen configuration corresponds to large aggregates (N4), which can easily generate the N4V2 and N4V0 centers, by the migrating vacancies and linking to N4 (diamond type Ia) [2]. In the case of the diamond from DRC, the substitutional nitrogen configuration corresponds to pairs of nitrogen (N2) and isolated substitutional nitrogen (N0), which, by the migration of vacancies and linking to N2 and N0 leads to the generation of the N4V2, and N4V0 centers (diamond type Ib) [2].
Figure 13 shows Raman spectra of these samples, while Table 9 shows the values of FWHM and the wavenumber of the Raman line of the samples with unknown geographical origin, and the nitrogen concentration.
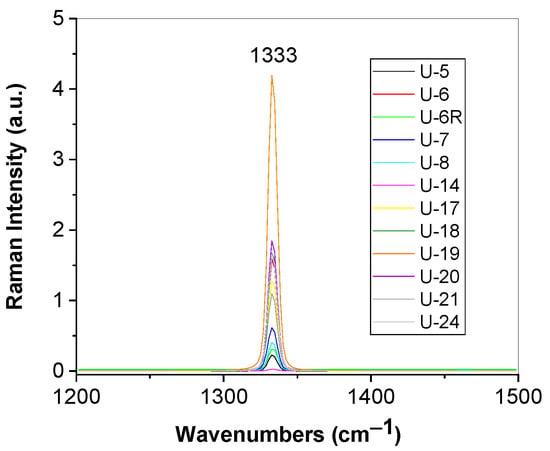
Figure 13.
Raman spectra of diamonds with unknown geographical origin labeled U-5, U-6; U-6R; U-7; U-8; U-14; U-17; U-18; U-19; U-20; U-21; and U-24.
Deconvolution of the Raman line of diamonds with unknown geographical origin is shown in Figure 14.
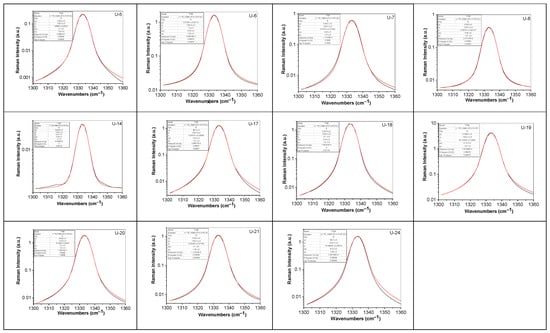
Figure 14.
Deconvolution of the Raman line of diamonds with unknown geographical origin labeled U-5, U-6; U-6R; U-7; U-8; U-14; U-17; U-18; U-19; U-20; U-21; and U-24. Black and red curves correspond to the experimental Raman line and the fit of the deconvolution of the Raman line.
According to Table 10, the concentration of nitrogen in diamond samples with unknown geographical origin varies between the following: (a) 41 and 175 ppm, values reported in the case of diamonds collected from the Cullinan mine and (b) 263 and 329 nm, values reported in the case of diamonds collected from the DRC.

Table 10.
The FWHM and wavenumber of the Raman line of diamonds with unknown geographical origin and the nitrogen concentration.
4. Conclusions
This work reports new results by UV-VIS-NIR spectroscopy and Raman scattering concerning the diamonds from Cullinan Mine and DRC. Thus, in this work, UV-VIS-NIR spectroscopy combined with Raman scattering was successfully applied to the traceability of natural diamonds from the Cullinan mine, DRC, and from deposits of unknown provenance.
Depending on the diamonds origin, the UV-VIS-NIR spectra can be differentiated as follows: (i) the diamonds from the Cullinan Mine show absorption bands assigned to N10, NV0, NV−, N3V0, N4V0, and N4V2, centers and (ii) the diamonds from the DRC show absorption bands attributed to N10, NV−, N3V0, N1+, and NVH centers. According to results reported in the case of diamonds with unknown geographical origin, knowing the optical features of diamonds from the Cullinan Mine and DRC, UV-VIS-NIR spectroscopy can be a valuable tool for the initial attribution of these to the two geographical regions. The Raman scattering studies have highlighted that all spectra show an intense line at ~1333 cm−1, having the nitrogen concentration between the following: (a) 41 and 185 ppm in the case of diamonds collected from the Cullinan mine and (b) 204 and 336 ppm in the case of diamonds collected from DRC. In the case of diamonds with unknown geographical origin, the studies by Raman spectroscopy confirm the origin of diamonds performed by UV-VIS-NIR spectroscopy. Comparing the 12 diamonds of unknown provenance with the reference spectra, 10 samples showed spectral profiles that, by deconvolution, have highlighted bands assigned to centers reported for the Cullinan diamonds, and 2 samples were similar to those from the DRC. A graphical representation (Figure 15) summarizes these coincidences.
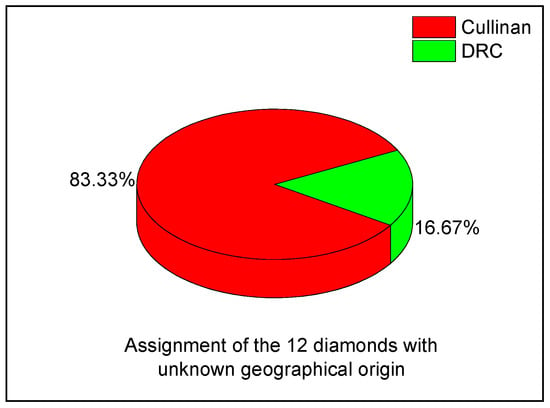
Figure 15.
Assignment of the 12 diamonds with an unknown geographical origin.
This distribution demonstrates the simultaneous applicability of UV-VIS-NIR spectroscopy and Raman scattering as comparative tools for provenance assessment. Such an analysis confirms that, although absolute provenance cannot be guaranteed, UV-VIS-NIR spectroscopy provides an objective method to narrow down possible sources and rule out inconsistencies.
Supplementary Materials
The following supporting information can be downloaded at: https://www.mdpi.com/article/10.3390/min15101091/s1, Figure S1: UV-VIS-NIR spectra of diamonds from Cullinan Mine and their deconvolution: C-2; C-3,; C-2E; C-3E; C-4E; C-5E; C-7E; C-8E; C-9E; C-1.1; C-2.1; C-3.1; C-4.1; ; C-7B, C-9B C-10B; C-11B; C-12B; C-13B; C-14B; C-15B; C-16B; C-17B; C-18B; C-19B; C-20B; C-21B; C-22B; C-23B; C-24B; C-25B; C-9C; C-10C; C-11C; C-12C; C-13C; C-12D; C-13D, and C-1E. Black, green, and red curves correspond to the experimental spectrum, the total fit of each spectrum, and the individual components of the spectral deconvolution; Figure S2: UV-VIS-NIR spectra at RT (red curve) and LNT (blue curve) of the samples labelled as C-1, C-2, and C-3.
Author Contributions
Conceptualization, M.B. and D.G.; methodology, M.B., D.G. and I.S.; validation, M.B.; investigation, D.G., M.B., I.S. and A.U.; writing—original draft preparation, M.B. and D.G.; writing—review and editing, M.B. and A.U.; visualization, M.B., D.G., I.S. and A.U.; supervision, M.B. All authors have read and agreed to the published version of the manuscript.
Funding
This work was funded by the Core Program of the National Institute of Materials Physics, granted by the Romanian Ministry of Research, Innovation and Digitization through the Project with ID: PC3-PN23080303.
Data Availability Statement
The original contributions presented in this study are included in the article. Further inquiries can be directed to the corresponding author.
Acknowledgments
The authors are extremely grateful to Gabriel Ovidiu Iancu from Alexandru Ioan Cuza University and to Dan Giurgiu, the president of the Romanian Gemological Center, for their comments on the topic of this work and the samples made available for this study, to which Branko Deljanin from the Canadian Gemological Laboratory has also contributed.
Conflicts of Interest
The authors declare no conflicts of interest.
References
- Handschuh-Wang, S.; Wang, T.; Tang, Y. Ultrathin diamond nanofilms—Development, challenges, and applications. Small 2021, 17, 2007529. [Google Scholar] [CrossRef]
- Ashfold, M.N.R.; Goss, J.P.; Green, B.L.; May, P.W.; Newton, M.E.; Peaker, C.V. Nitrogen in Diamond. Chem. Rev. 2020, 120, 5745–5794. [Google Scholar] [CrossRef]
- Jani, M.; Mrozek, M.; Nowakowska, A.M.; Leszczenko, P.; Gawlik, W.; Wojcierchowski, A.M. Role of high nitrogen-vacancy con-centration on the photoluminescence and Raman spectra of diamond. Phys. Status Solidi A Appl. Mater. Sci. 2023, 220, 2200299. [Google Scholar] [CrossRef]
- Daver, L.; Bureau, H.; Boulard, É.; Gaillou, É.; Cartigny, P.; Pinti, D.L.; Belhadj, O.; Guignot, N.; Foy, E.; Estève, I.; et al. From the lithosphere to the lower mantle: An aqueous-rich metal-bearing growth environment to form type IIb blue diamonds. Chem. Geol. 2022, 613, 121163. [Google Scholar] [CrossRef]
- De Weerdt, F.; Van Royen, J. Defects in coloured natural diamonds. Diam. Relat. Mater. 2001, 10, 474–479. [Google Scholar] [CrossRef]
- Hoal, K.O.; Appleby, S.K.; Stammer, J.G.; Palmer, C. SEM-based quantitative mineralogical analysis of peridotite, kimberlite, and concentrate. Lithos 2009, 112, 41–46. [Google Scholar] [CrossRef]
- Shirey, S.B.; Shigley, J.E. Recent advances in understanding the geology of diamonds. Gems Gemol. 2013, 49, 188–222. [Google Scholar] [CrossRef]
- Nestola, F.; Pamato, M.G.; Novella, D. Chapter 10: Going inside a diamond. In Celebrating the International Year of Mineralogy Progress and Landmark Discoveries of the Last Decades; Bindi, L., Cruciani, G., Eds.; Springer: Berlin/Heidelberg, Germany, 2023; pp. 249–263. [Google Scholar]
- Stachel, T.; Aulbach, S.; Harris, J.W. Mineral inclusions in lithospheric diamonds. Rev. Miner. Geochem. 2022, 88, 307–391. [Google Scholar] [CrossRef]
- Day, M.C.; Pamato, M.G.; Novella, D.; Nestola, F. Imperfections in natural diamond: The key to understanding diamond genesis and the mantle. Riv. Nuovo C. 2023, 46, 381–471. [Google Scholar] [CrossRef]
- Badzian, A. The displacement disorder of atoms in diamond crystals revealed by X-ray imaging plate detector. Diam. Relat. Mater. 2016, 69, 19–32. [Google Scholar] [CrossRef]
- Kozlov, A.V.; Vasilev, E.A.; Ivanov, A.S.; Bushuev, Y.Y.; Kolyadina, A.I. Genetic geological model of diamond-bearing fluid magmatic system. J. Min. Inst. 2024, 269, 708–720. [Google Scholar]
- Dongre, A.; Tappe, S. Kimberlite and carbonatite dykes within the Premier diatreme root (Cullinan Diamond Mine, South Africa): New insights to mineralogical-genetic classifications and magma CO2 degassing. Lithos 2019, 338–339, 155–173. [Google Scholar] [CrossRef]
- Riches, A.J.V.; Ickert, R.B.; Pearson, D.G.; Stern, R.A.; Jackson, S.E.; Ishikawa, A.; Kjarsgaard, B.A.; Gurney, J.J. In situ oxygen-isotope, major-, and trace-element constraints on the metasomatic modification and crustal origin of a diamondiferous eclogite from Roberts Victor, Kaapvaal Craton. Geochim. Cosmochim. Acta 2016, 174, 345–359. [Google Scholar] [CrossRef]
- Korolev, N.; Kopylova, M.; Gurney, J.J.; Moore, A.E.; Davidson, J. The origin of Type II diamonds as inferred from Cullinan mineral inclusions. Miner. Pet. 2018, 112, 275–289. [Google Scholar] [CrossRef]
- Pivin, M.; Féménias, O.; Demaiffe, D. Metasomatic mantle origin for Mbuji-Mayi and Kundelungu garnet and clinopyroxene megacrysts (Democratic Republic of Congo). Lithos 2009, 112, 951–960. [Google Scholar] [CrossRef]
- De Magneé Y, Présence de kimberlite dans la zone diamantifère de Bakwanga (Kasai, Congo Belge). Bull. Soc. Belge Geol. 1946, LVI, 127–132.
- Pokhilenko, L.; Pokhilenko, N.; Malkovets, V.; Alifirova, T. The earliest generation of diamond: The first find of a diamond inclusion in kimberlitic olivine. Minerals 2022, 13, 36. [Google Scholar] [CrossRef]
- Qin, L.; Shi, G.; Zhao, X.; Chen, Z. The study of olivine inclusions in diamonds from Liaoning, China and the evaluation of related thermometers. Minerals 2024, 14, 850. [Google Scholar] [CrossRef]
- Scarralt, K.; Shor, R. The Cullinan diamond centennial: A history and gemological analysis of Cullinan I and II. Gems Gemol. 2006, 42, 120–132. [Google Scholar] [CrossRef]
- Korolev, N.; Kopylova, M.; Bussweiler, Y.; Pearson, D.; Gurney, J.; Davidson, J. The uniquely high-temperature character of Cullinan diamonds: A signature of the Bushveld mantle plume? Lithos 2018, 304–307, 362–373. [Google Scholar] [CrossRef]
- Kopylova, M.; Navon, O.; Dubrovinsky, L.; Khachatryan, G. Carbonatitic mineralogy of natural diamond-forming fluids. Earth Planet. Sci. Lett. 2010, 291, 126–137. [Google Scholar] [CrossRef]
- Jin, S.; Renfro, N.D.; Palke, A.C.; Ardon, T.; Homkrajae, A. Application of UV-Vis-NIR spectroscopy to gemology. Gems Gemol. 2024, 60, 456–473. [Google Scholar] [CrossRef]
- Breeding, C.M.; Eaton-Magana, S.; Shigley, J.E. Natural-color green diamonds: A beautiful conundrum. Gems Gemol. 2018, 54, 2–27. [Google Scholar] [CrossRef]
- Breeding, C.M.; Eaton-Magana, S.; Shigley, J.E. Naturally colored yellow and orange gem diamonds: The nitrogen factor. Gems Gemol. 2020, 56, 194–219. [Google Scholar] [CrossRef]
- Manson, N.B.; Beha, K.; Batalov, A.; Rogers, L.J.; Doherty, M.W.; Bratschitsch, R.; Leitenstorfer, A. Assignment of the NV0 575-nm zero-phonon line in diamond to a 2E-2A2 transition. Phys. Rev. B 2013, 87, 155209. [Google Scholar] [CrossRef]
- Eaton-Magana, S.; Ardon, T.; Smit, K.V.; Breeding, C.M.; Shigley, J.E. Natural-color pink, purple, red and brown diamonds: Band of many colors. Gems Gemol. 2019, 54, 352–377. [Google Scholar] [CrossRef]
- Sischler, B. Impurity defects in diamond. In Handbook of Spectral lines in Diamond; Springer: Berlin/Heidelberg, Germany, 2012; pp. 303–367. [Google Scholar]
- Doherthy, M.V.; Manson, M.B.; Delaney, P.; Jelezko, F.; Wrachtrup, J.; Hollenberg, L.C.L. The nitrogen-vacancy colour center in diamond. Phys. Rep. 2013, 528, 1–45. [Google Scholar] [CrossRef]
- Davies, G.; Nazare, M.H. Uniaxial stress splitting of E to E transitions at trigonal centres in cubic crystals: The 594 nm band in diamond. J. Phys. C Solid State Phys. 1980, 13, 4127–4136. [Google Scholar] [CrossRef]
- King, J.M.; Shigley, J.E.; Gelb, T.H.; Guhin, S.S.; Hall, M.; Wang, W. Characterization and grading of natural-color yellow diamonds. Gems Gemol. 2005, 41, 88–115. [Google Scholar] [CrossRef]
- Kehayias, P.; Doherty, M.W.; English, D.; Fischer, R.; Jarmola, A.; Jensen, K.; Leefer, N.; Manson, J.N.B.; Budker, D. Infrared ab-sorption band and vibronic structure of the nitrogen-vacancy center in diamond. Phys. Rev. B 2013, 88, 165202-1–165202-5. [Google Scholar] [CrossRef]
- Parawer, S.; Nemanich, R.J. Raman spectroscopy of diamond and doped diamond. Philosoph. Transact. R Soc. A Math. Phys. Eng. Sci. 2004, 362, 2537–2565. [Google Scholar] [CrossRef] [PubMed]
- Surovtsev, N.V.; Kupriyanov, I.N.; Malinovsky, V.K.; Gusev, M.A.V.; Pal’Yanov, Y.N. Effect of nitrogen impurities on the Raman line width in diamonds. J. Phys. Condens. Matter 1999, 11, 4767–4774. [Google Scholar] [CrossRef]
Disclaimer/Publisher’s Note: The statements, opinions and data contained in all publications are solely those of the individual author(s) and contributor(s) and not of MDPI and/or the editor(s). MDPI and/or the editor(s) disclaim responsibility for any injury to people or property resulting from any ideas, methods, instructions or products referred to in the content. |
© 2025 by the authors. Licensee MDPI, Basel, Switzerland. This article is an open access article distributed under the terms and conditions of the Creative Commons Attribution (CC BY) license (https://creativecommons.org/licenses/by/4.0/).