1. Introduction
The gold grains in alluvial deposits are a comprehensive repository of valuable geological information about the placer deposit and the primary source of gold. For example, the morphology of alluvial gold grains in a placer deposit and their chemical composition offer hints to the transportation distance or proximity to the source and the type of mineralization that was the source of gold [
1,
2,
3,
4,
5,
6,
7,
8,
9]. The size and the morphology of the gold grains were considered to accurately reflect the extent of their transport in glacial environments [
10] and in river systems [
11]. The chemical composition of the alluvial gold grains may present significant variation from core to rim [
2,
12,
13,
14,
15]. Gold-rich rim occurs on alluvial gold, and two main genetic mechanisms were proposed, i.e., Ag leaching [
16] and colloidal-Au precipitation [
17]. The chemical homogeneity or heterogeneity of a gold grain population within a placer likely suggests a single source with a homogeneous composition or multiple sources, respectively [
1]. A single source with a variable chemical composition of the native gold may also be responsible for alluvial gold grains with a wide range of chemical composition [
1]. The composition of the gold grains also discerns between primary and secondary gold, as very high-purity (less than 0.4 to 0.7 wt% Ag), euhedral to irregular, delicately shaped gold grains with homogeneous composition, hosted by iron oxides, reported by Mann (1984) [
18] and Grant et al. (1991) [
1] from lateritic weathering profiles, were proved to be secondary in origin.
The chemical composition of alluvial gold grains is presently routinely measured using EPMA [
7,
12,
19]. This analysis allows us to establish the compositional range of Au and Ag in a given gold grain, to highlight the presence of other chemical elements, e.g., Cu [
20], and to outline the compositional range of grain populations.
Romania is endowed with significant gold resources [
21,
22], and numerous historical gold mining traces are known in the Apuseni Mountains and the Baia Mare region [
23]. However, there is no mention of Au mineralization in the eastern part of Romania, known as Moldova/Moldavia, and there is no available information about the presence of gold mining workings in that region. Recently, ancient alluvial mining traces together with native gold grains were found in the Bogata River catchment area, within Baia village territory, towards the eastern edge of the Eastern Carpathians, Romania. The Bogata River is located within the foreland of the Eastern Carpathians and flows from west to east towards the Moldova River.
In “The History of Romanian Gold”, Haiduc (1940) [
24] stated that a correlation should exist between the etymology of the Baia village, which means “mine” in the traditional Romanian language (originating from the Hungarian “bánya”), and an ancient gold mining activity in the region. In his unpublished PhD thesis, Tămaș-Bădescu (2010) [
25] mentions several occurrences of alluvial gold along the Moldova and the Siret River.
To our knowledge, there is no other published data on the alluvial gold from Moldova, and thus, we report for the first time the occurrence of alluvial gold in this part of the Eastern Carpathians, Romania. The present paper summarises the morphological analysis of the gold grains from this new alluvial gold occurrence obtained by observation under a binocular microscope, as well as the mineralogy of the related heavy mineral assemblage (magnetic separation, X-ray diffraction, and a binocular and reflected light microscope), and offers insights into the mineral assemblage of the primary gold ore source by ore microscopy. The Au and Ag composition range of the native gold grains in the studied alluvial deposits was determined by EPMA. This approach allowed for an accurate description of the typomorphic features of the alluvial gold grains, facilitated the mineralogical identification of the related heavy minerals in alluvial deposits, and offered a hint about the primary source.
2. Geological Setting
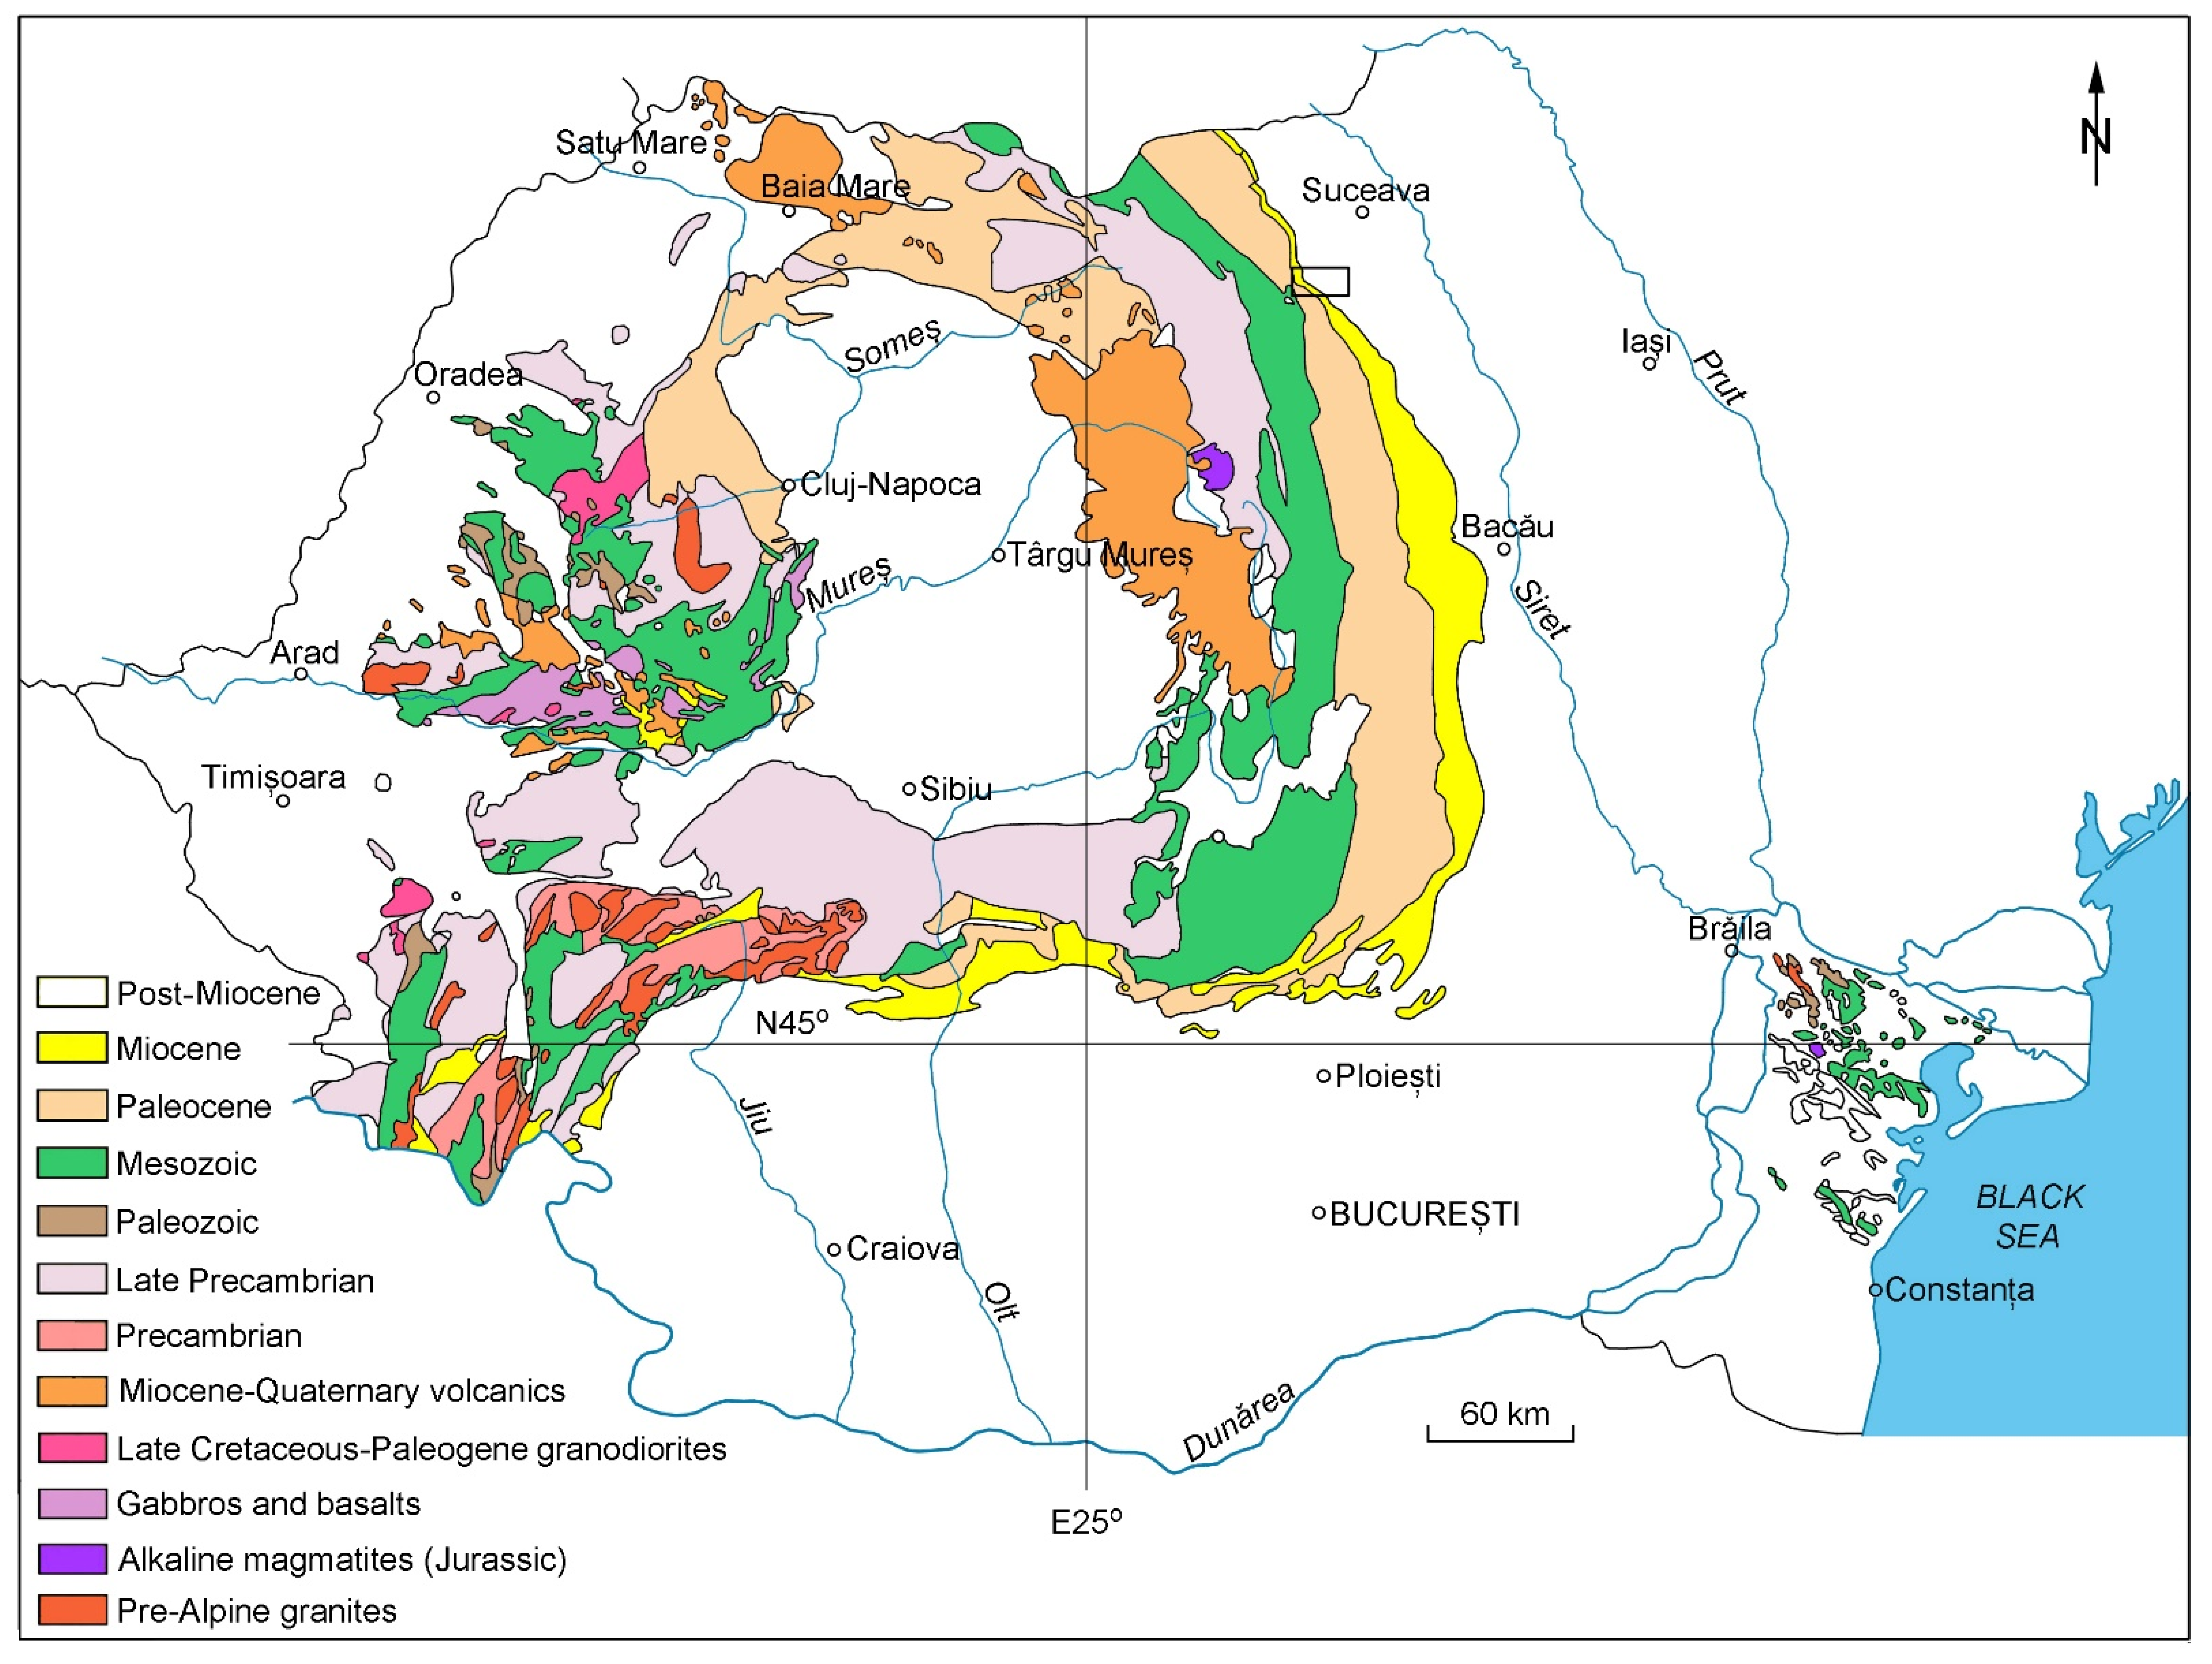
The studied area is located at the border between the foreland area of the Eastern Carpathians and the Moldavian Platform (
Figure 1). The Eastern Carpathians (
Figure 2) comprise three major units from west to east, juxtaposed during the Alpine orogeny [
26], i.e., Median Dacides, Outer Dacides, and Moldavides. The Median Dacides (
Figure 2), which are named Getides by Balintoni (1997) [
27], outcrop within the Eastern and Southern Carpathians and are derived from the Dacia mega-unit [
28]. They consist mostly of micaschists, gneisses, porphyroids, quartzites with and without graphite, and amphibolites. The Median Dacides in the Eastern Carpathians (
Figure 2) comprise three nappes formed of Ordovician metamorphic basement [
29] and Permian-Mesozoic sedimentary cover, thrusted from west to east [
26]. The top-to-bottom succession of the nappes (
Figure 2) is Bucovinian, Sub-Bucovinian, and Infra-Bucovinian [
26]. The Bucovinian nappe is locally overlayed by the Transylvanian Nappes, which contain Mesozoic ophiolites and sedimentary rocks that are also incorporated as olistoliths within the Barremian-Aptian wildflysch sequence of the Bucovinian nappe [
26].
The Median Dacides are thrust and folded on the Outer Dacides towards the east [
26]. The Outer Dacides (
Figure 2) (Severinides after Balintoni, 1997 [
27]) represent remnants of the Ceahlău-Severin Ocean [
30], another suture within the Carpathian area besides the Transylvanides [
26]. According to Schmid et al. [
28], the Ceahlău-Severin Ocean is the easternmost branch of the Alpine Tethys.
The Outer Dacides (
Figure 2) comprise the Ceahlău, Baraolt, and Black Flysch nappes [
26]. The Ceahlau Nappe (
Figure 2) is the main and largest unit and consists of Late Jurassic igneous rocks and radiolarites, Tithonian-Early Cretaceous calcareous turbidites (Sinaia Beds), Barremian-Aptian proximal turbidites (Comarnic Beds), and a thick sequence of Albian polymictic conglomerates (Ceahlău conglomerates) [
26,
28]. The Baraolt Nappe, which occurs only in the southern part of the Eastern Carpathians, is composed of Berriasian-Aptian turbidites and is considered the equivalent of the Black Flysch (
Figure 2) [
30]. The Black-Flysch Nappe consists of basaltic lava flows and dykes in the basement and a Kimmeridgian-Aptian sedimentary cover, which is intruded by younger basalt bodies [
26].
The Moldavides (
Figure 2) (Perimoldavides after Balintoni, 1997 [
27]) are the outermost units of the Eastern Carpathians [
26]. The Moldavides consist of three major flysch thrust systems [
26,
28], i.e., (i) the Subcarpathian Nappe, which is the most external tectonic unit, formed of Middle Eocene-Late Miocene deposits; (ii) the middle thrust system comprises the Marginal Folds and Tarcău Nappes, composed of Early Cretaceous-Early Miocene deposits; and (iii) the most internal thrust system, which is formed of Audia, Macla, and Convolut Flysch Nappes, formed of Late Cretaceous-Palaeogene sequences (
Figure 2).
Along the western side of the Eastern Carpathians, a Neogene volcanic chain intruded and covered the Median Dacides (
Figure 2) [
26]. The magmatic activity has a calc-alkaline affinity and took place in a post-collisional setting [
31].
The Moldavian Platform, which is part of the East European Craton [
29], borders the Eastern Carpathians towards the east (
Figure 2) [
26].
The geology of the studied perimeter is hidden by the forests and pasture lands. However, Saulea et al. [
32] noticed that Sarmatian clayey marls with interbedded sands, locally covered by Pleistocene gravels and sands, outcrop in the studied area (
Figure 2).
Figure 2.
Geological overview of the study area. (
A) The Alpine structure of the Eastern Carpathians, including the studied area, according to Săndulescu (1984) [
26] and Balintoni et al. (2014) [
33]; (
B) Simplified geological map following Saulea et al. (1966) [
32], with updates and the sampling locations; (
C) Geological cross-section along the black line in (
A) according to Ștefănescu et al. (1980) [
34].
3. Methods
The fieldwork took place in three locations near the Bogata River, labeled #1 to #3 (
Figure 2). Location #1 is on the left catc hment area of the Bogata River; location #2 is on an unnamed creek at its junction with the Bogata River; and location #3 is on Iacobel Creek, a seasonal creek that flows parallel to the Bogata River and joins directly with the Moldova River.
The equipment used for the fieldwork comprised a metal detector, gold pans, and a sluice box. Approximately 0.50 g of gold was used for this study, comprising 115 gold grains.
Three gold grains were recovered from location #1 using the metal detector. Heavy mineral concentrates were recovered by panning and by using a 100 × 30 cm dream mat sluice box from locations #2 and #3. The native gold grains were afterward separated from the concentrates in the laboratory using a binocular microscope ZEISS Stemi 2000-C (Germany).
The morphological analysis of the native gold grains and the measurement of particle dimensions were carried out on images acquired using the binocular microscope. The gold grains were pictured on a 500 µm grid, with the axis “c” (thickness) perpendicular to the surface and afterward, the length (axis “a”) and the width (axis “b”) were measured on the pictures. The “thickness” was measured only for a few native gold grains using tweezers and taking pictures of the grains with the axis “c” parallel to the grid.
The gold grains were mounted on 3 epoxy-cemented polished sections with the axis “c” perpendicular to the surface. The concentrate from locations #2 and #3 was screened in 7-grain size categories, and the magnetic fraction was separated using a neodymium magnet.
An optical microscopy study of the gold grains in plane-polarized and cross-polarized light was carried out using a NIKON Eclipse E200 (China) polarizing microscope equipped with a NIKON DS-FI3-NISD (NIS Elements) (Japon) digital camera. The abbreviations of the mineral name used in microphotographs are after Warr (2021) [
35].
One X-ray powder diffraction was made on a concentrate of garnet crystals using a Bruker D8 Advance (Germany) device from the Department of Geology, University Babeș-Bolyai, Cluj-Napoca (Romania), with Co Ka radiation (k = 1.78897 Å), Fe 0.01 mm filter, and a LynxEye one-dimensional detector.
Quantitative chemical analyses, organized in two datasets, were carried out on 16 native gold grains, cumulating 105 valid analytical points. One dataset was obtained at the UAR 3623-Centre de MicroCaractérisation Raimond Castaing, Toulouse, France, and a second at the Department of Geology, Babeș-Bolyai University, Romania, using a CAMECA SXfive (France) instrument equipped with WDS in both cases. The range of the total wt% of a valid point analysis was considered between 98.00 wt% and 102.00 wt%.
The analytical conditions (energy lines, accelerating voltage, and electron beam current) used to acquire the chemical composition of the native gold grains and the mean value of the detection limits are summarized in
Table 1. The counting time for peaks was 10 s, and 5 s for background on both datasets.
Chemical data on gold grains were acquired from all three locations, and
Table 2 summarizes the number of gold grains recovered from each location, the number of gold grains analyzed by EPMA, the number of EPMA valid analytical points, and indicates the distribution of acquired results by datasets.
4. Results
4.1. Morphology of Native Gold
The morphological analysis of the native gold grains was undertaken according to Barrios et al. (2015) [
11], who classified the gold grains based on sphericity (discoidal, subdiscoidal, spheroidal, and elongated) and roundness (rounded, intermediate, and angular). The summary of the morphological analysis is presented in
Table 3.
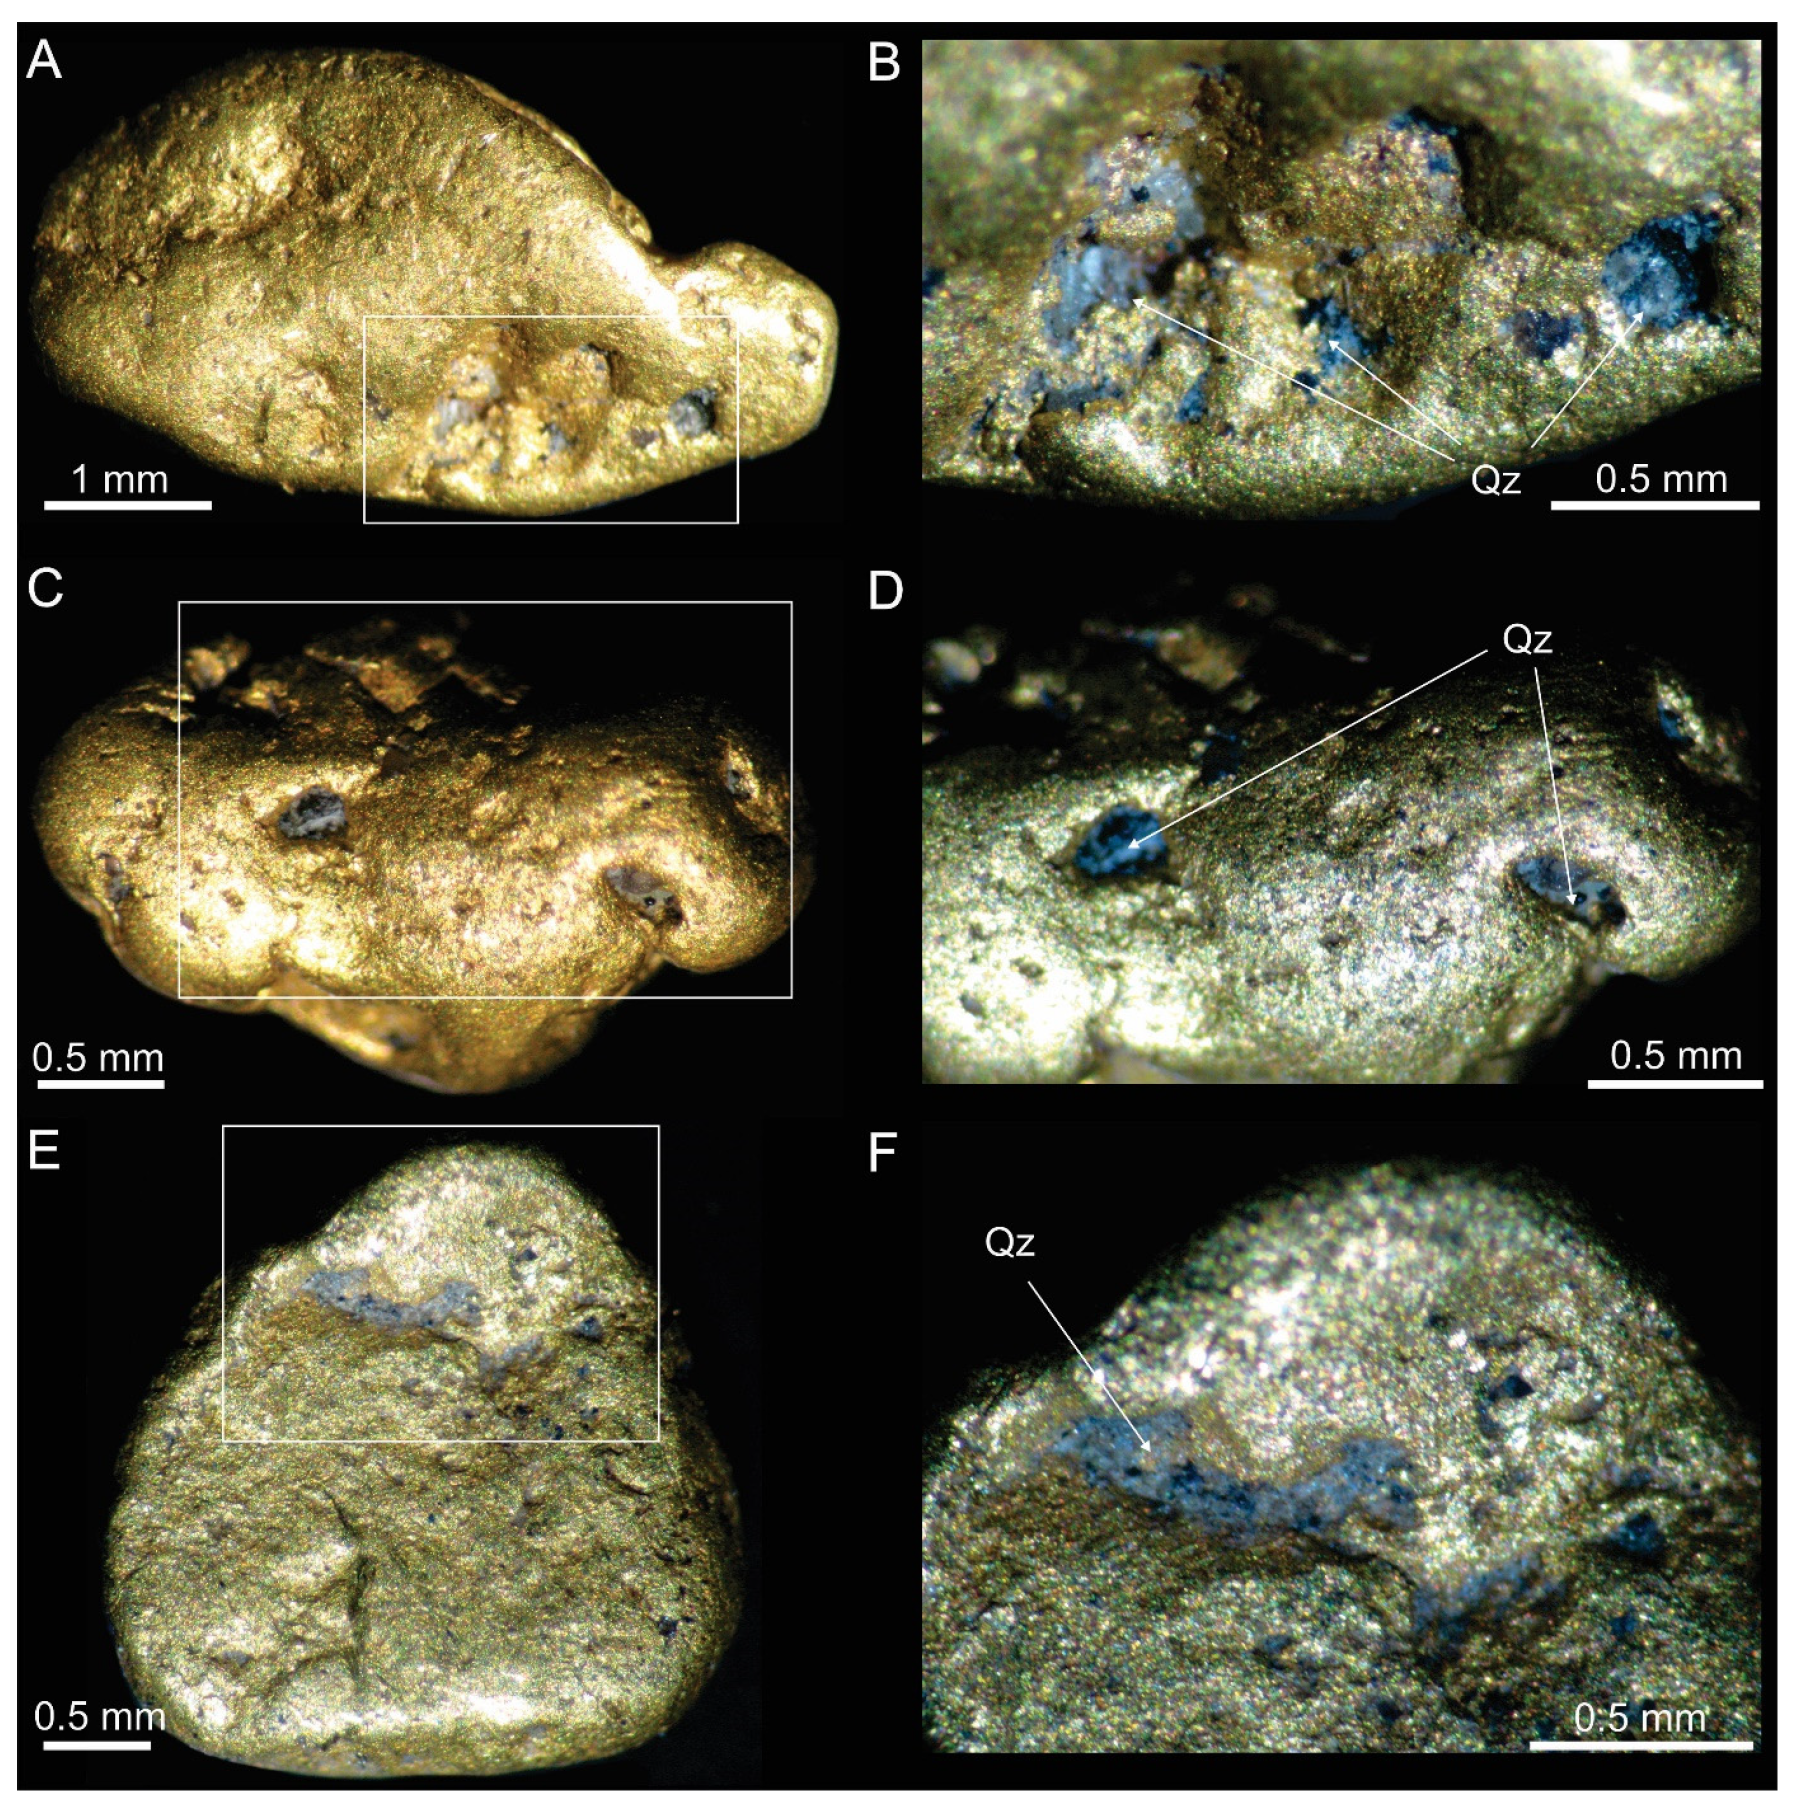
Accordingly, from the 3 gold grains recovered in the first location (
Figure 3), labeled G1 to G3, the gold grain G1 has a subdiscoidal shape (
Figure 3A), G2 a spheroidal shape (
Figure 3C), and G3 a discoidal shape (
Figure 3E). All three gold grains have a rounded appearance. The size of the grains is 5.00 × 2.80 mm for G1, 3.00 × 1.70 mm for G2, and 3.80 × 3.00 mm for G3.
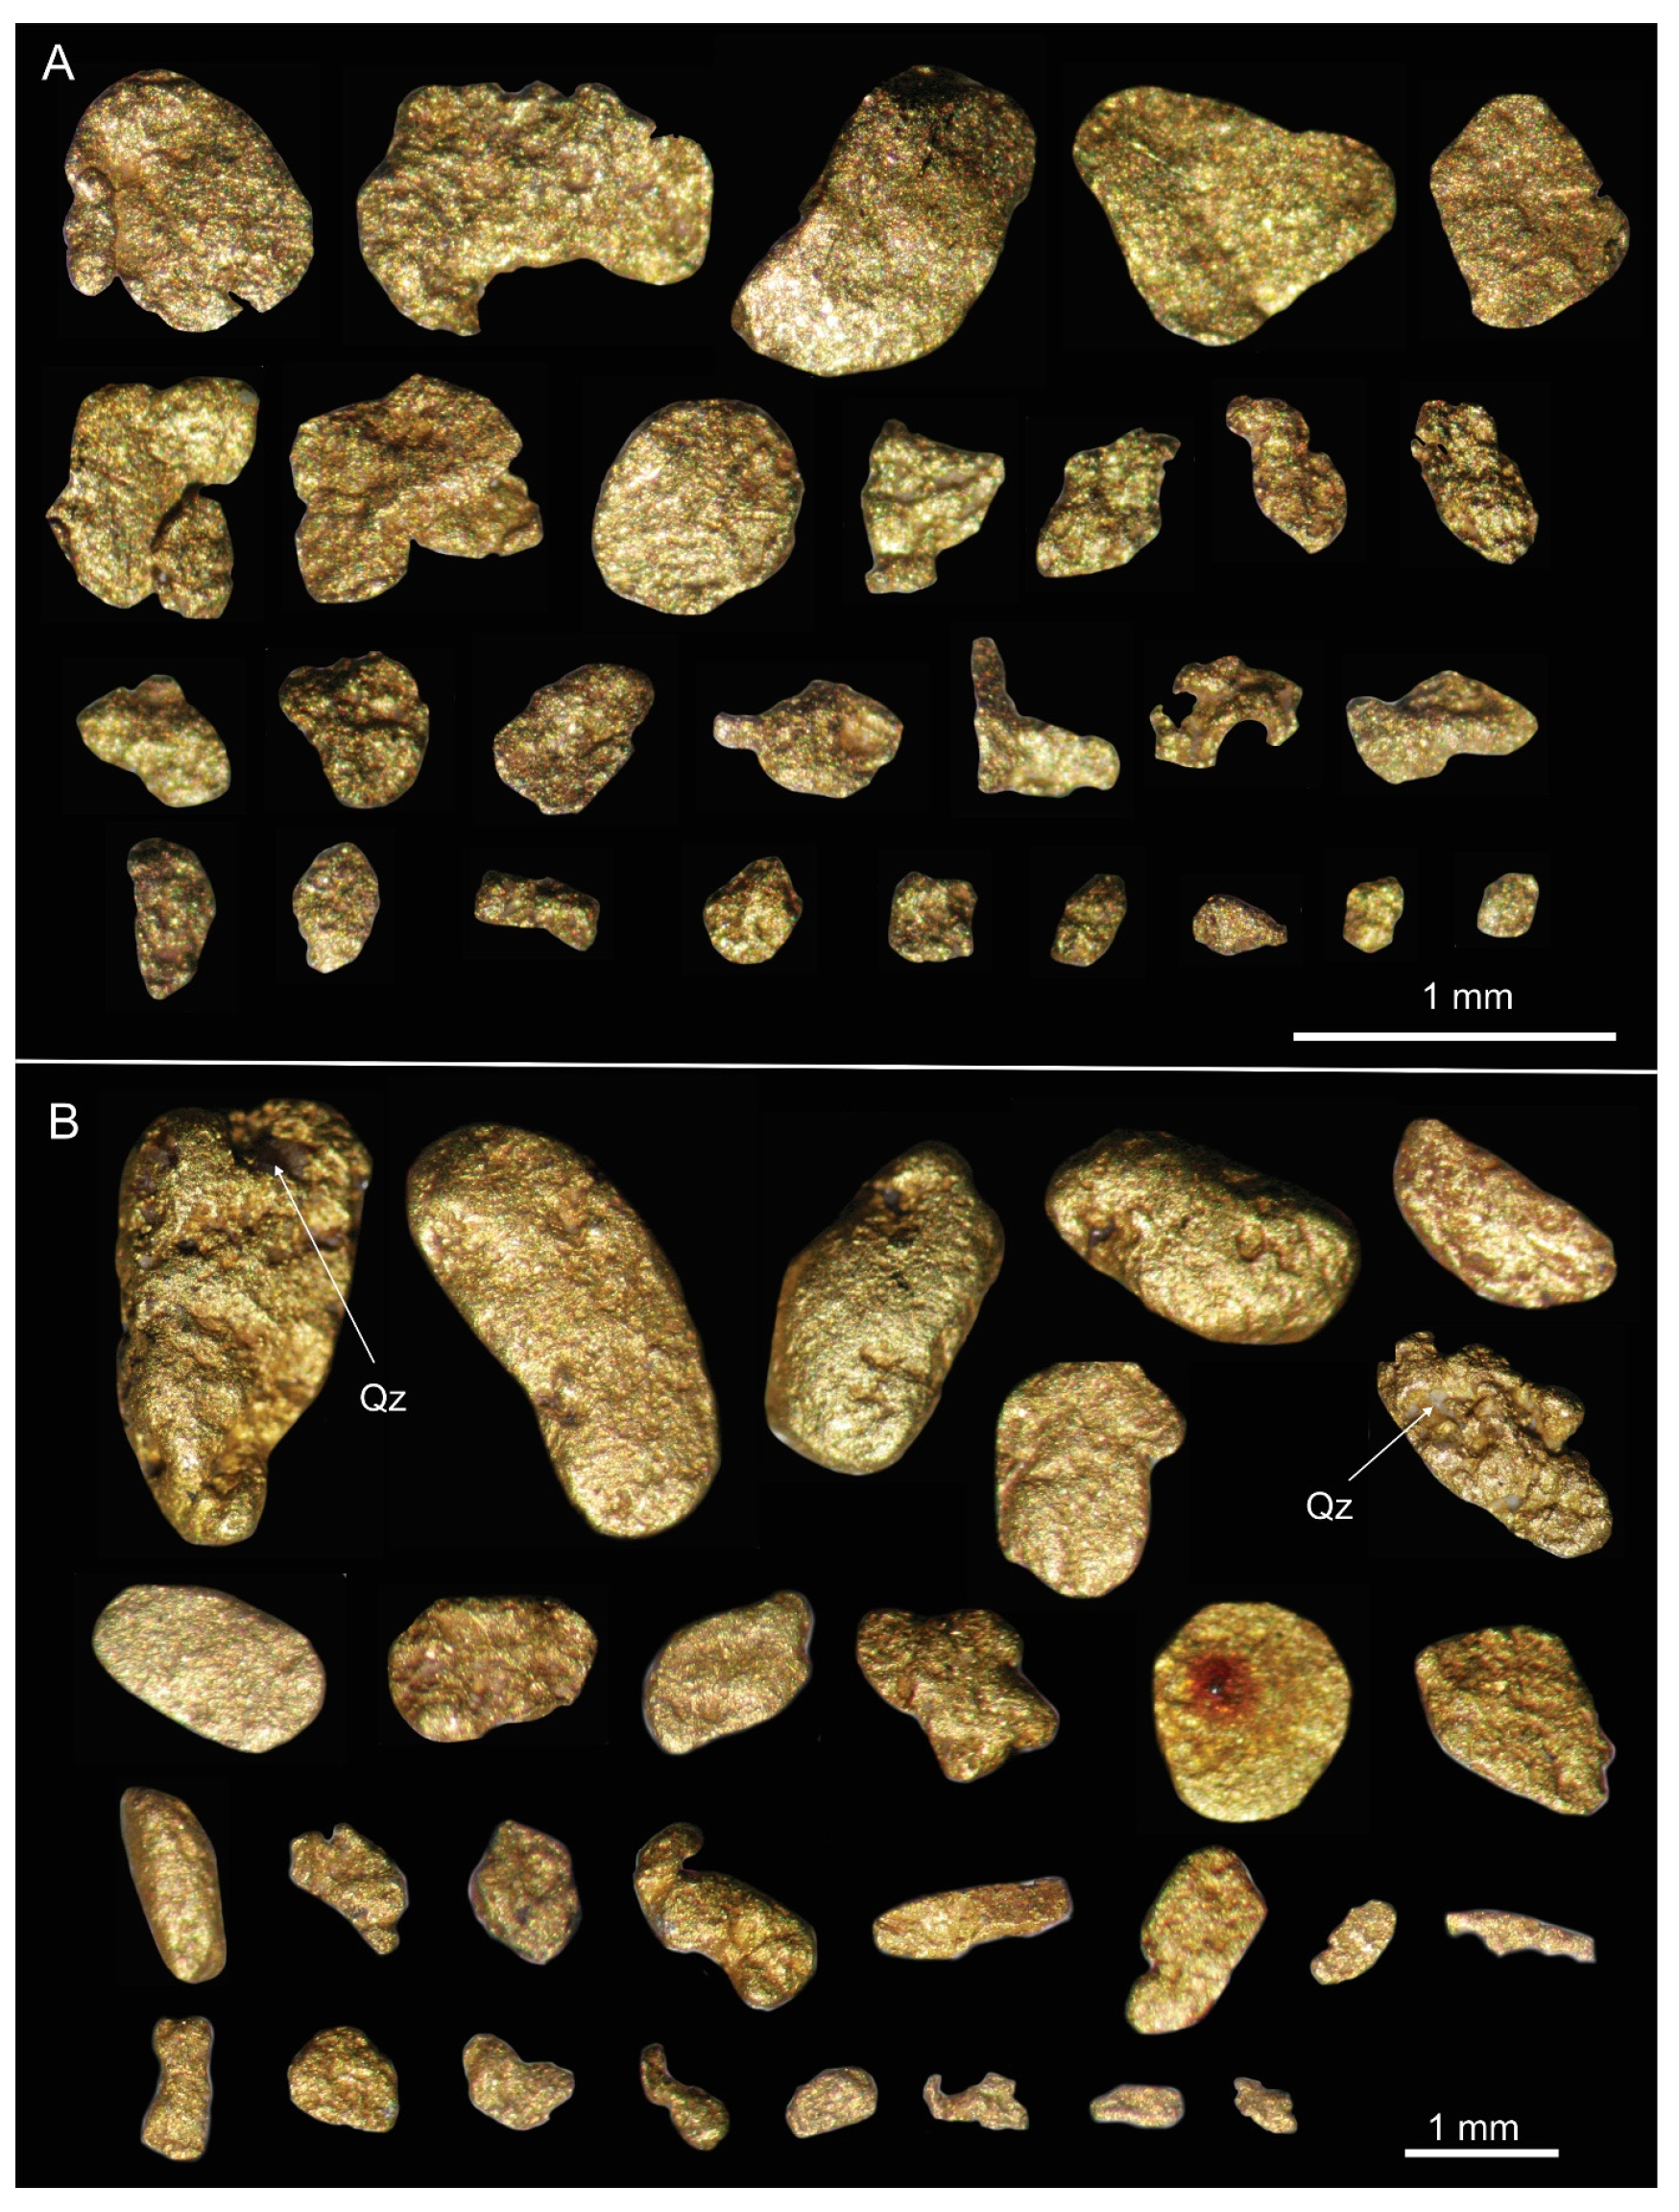
A total of 67 gold grains were recovered from the second location. The majority of the gold grains have a discoidal and subdiscoidal shape with a rounded to intermediate appearance (
Figure 4A). The smallest is 0.17 mm × 0.12 mm, and the largest is 1.04 × 0.60 mm. The mean value for length is 0.43 mm with a standard deviation of 0.18 mm, and for width, it is 0.30 mm with a standard deviation of 0.13 mm.
A number of 45 gold grains were recovered from the third location. The sphericity of the gold grains covers all the shapes defined by Barrios et al. (2015) [
11], from elongated to discoidal and the roundness appearance varies between rounded and intermediate (
Figure 4B). The smallest gold particle is 0.26 mm × 0.15 mm and the largest is 2.92 × 1.42 mm, with a mean value of 1.01 mm × 0.56 mm; the standard deviation is 0.58 mm (length) × 0.30 mm (width).
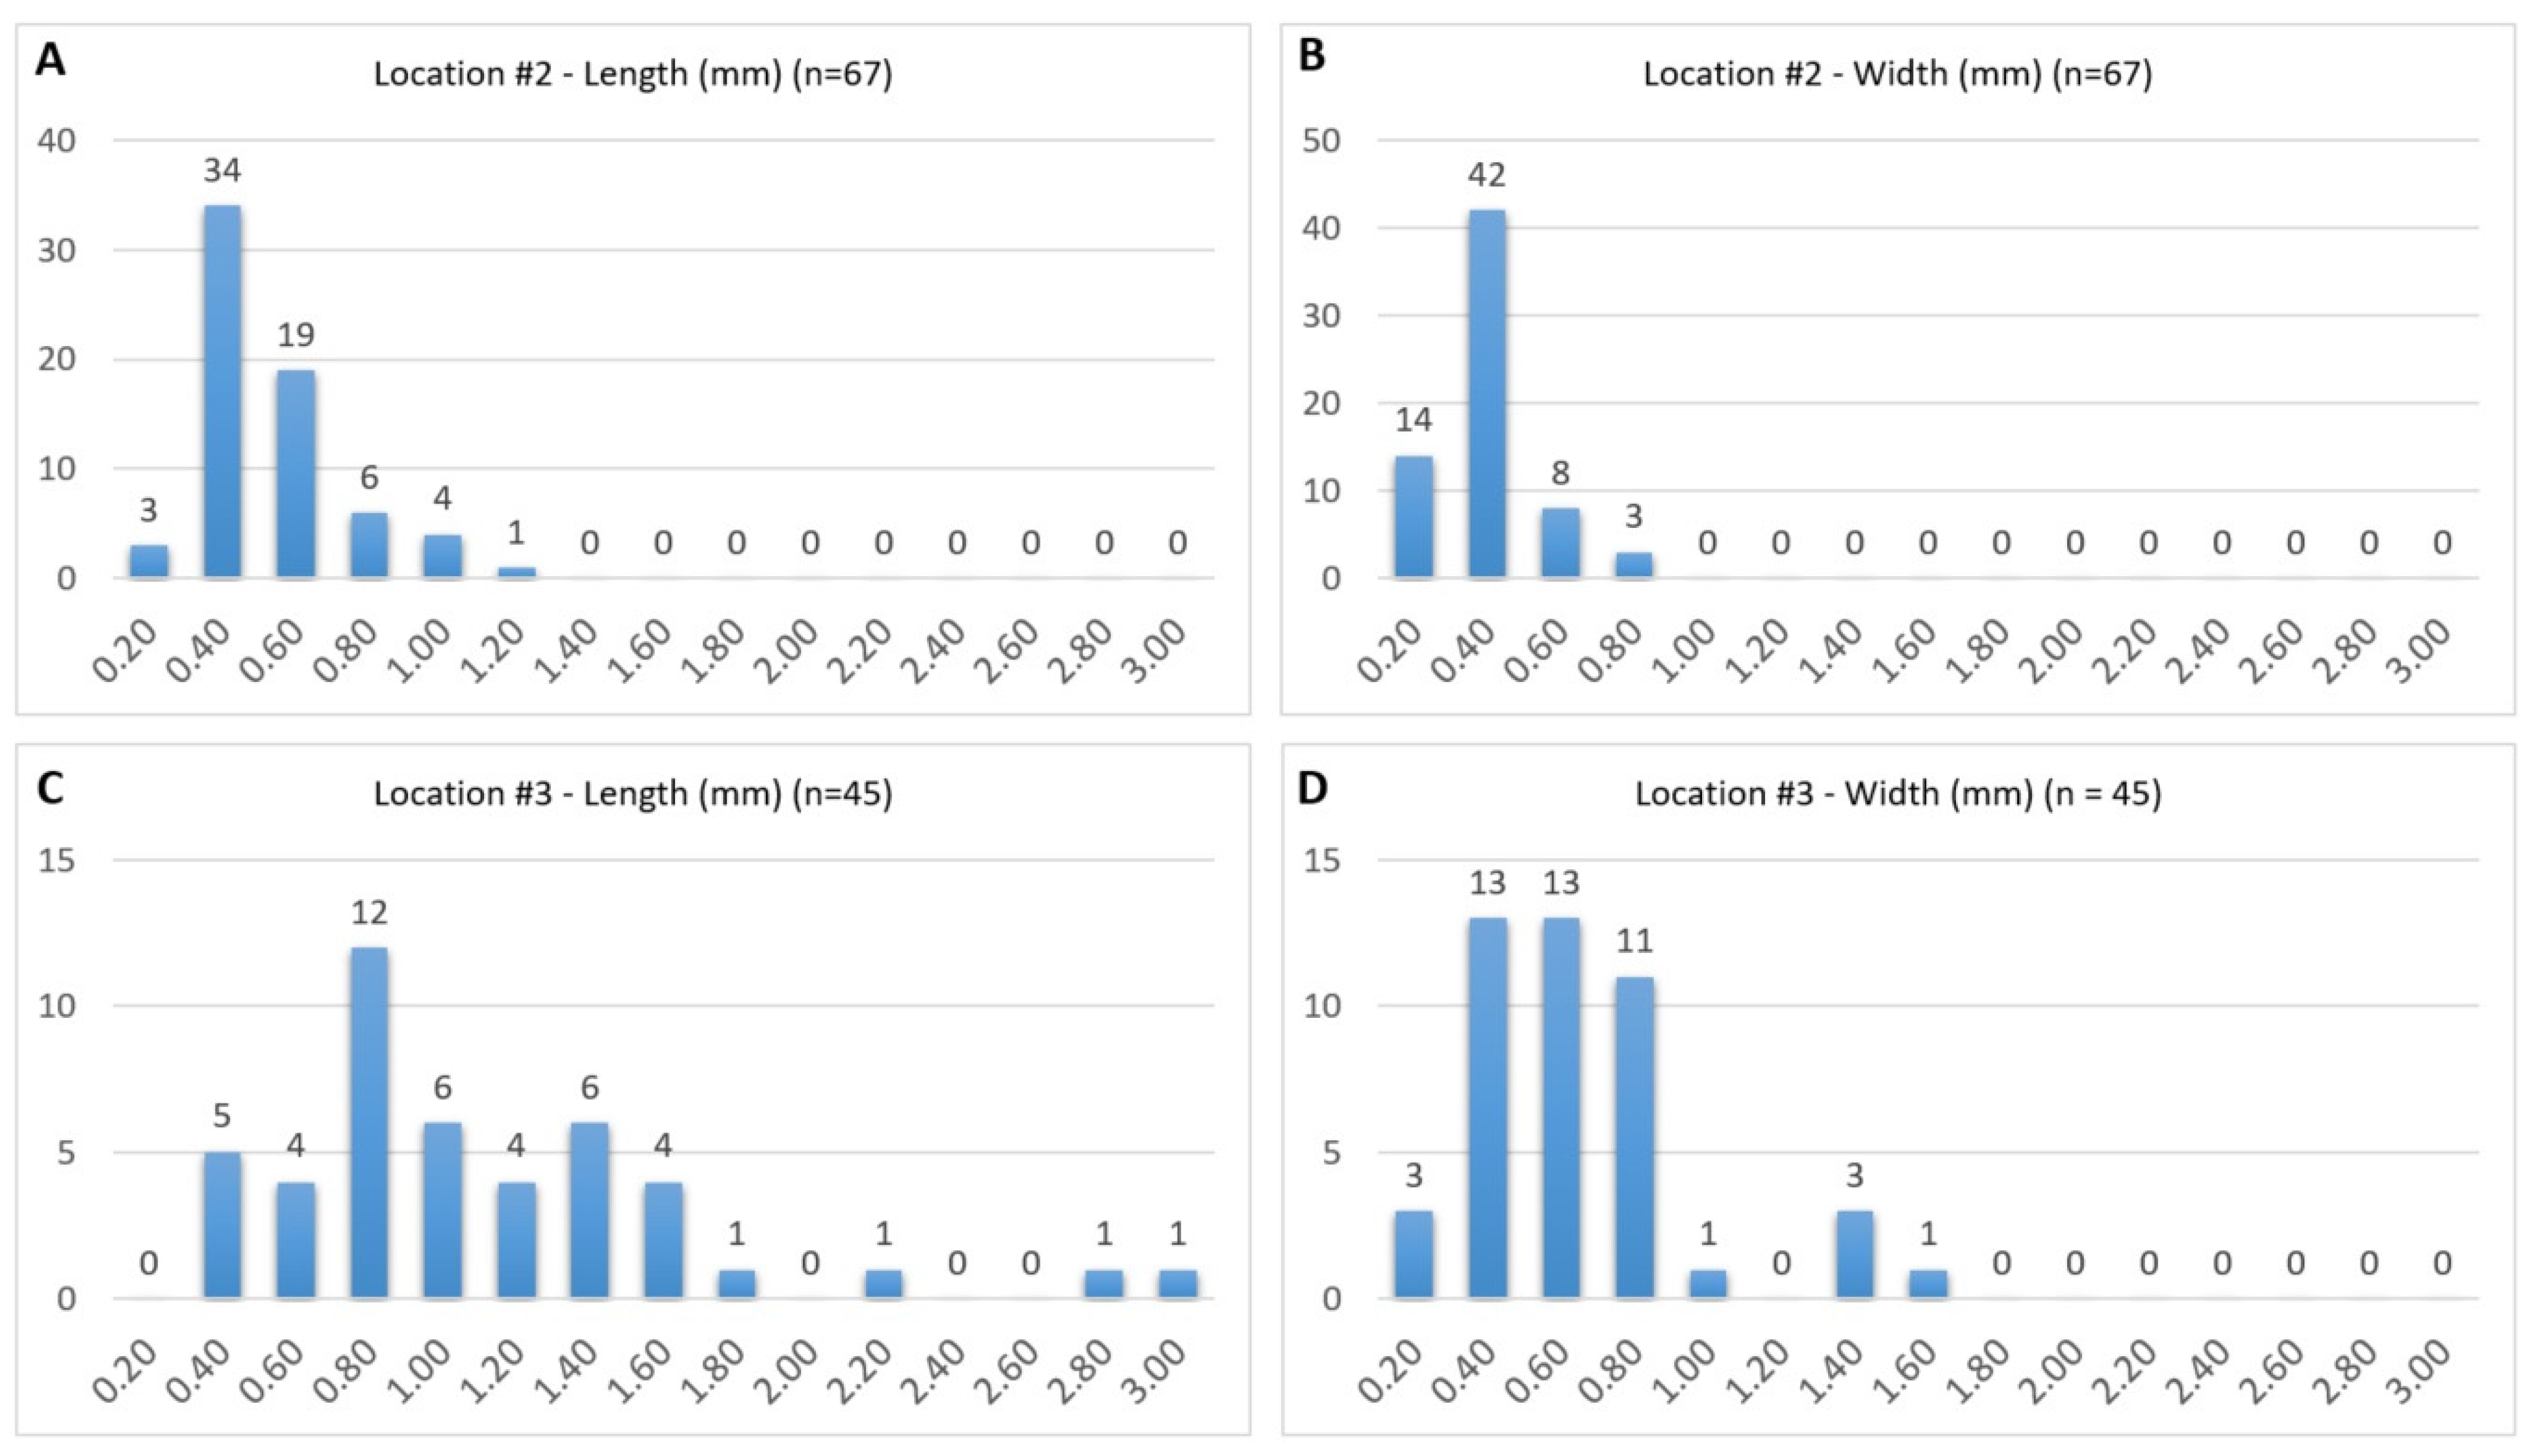
The size variation for locations #2 and #3 can be visualized in the histograms below (
Figure 5). The gold grains from location #2 tend to be smaller, concentrated primarily in the 0.20–0.60 mm range for both length and width. The gold grains from location #3 have a more dispersed size distribution, showing multiple peaks and a wider range of sizes. All four distributions are skewed to the right (
Figure 5).
The Cailleux’s flattening index, i.e., CFI = (L + W)/2 T (L = length, W = width, T = thickness), was calculated only on 5 gold grains with measurable thickness from location #3, and the values range from CFI = 1.71 to CFI = 3.34.
4.2. The Composition of Native Gold
The composition of the native gold grains was determined by chemical analysis made on two CAMECA SXFive instruments using WDS (
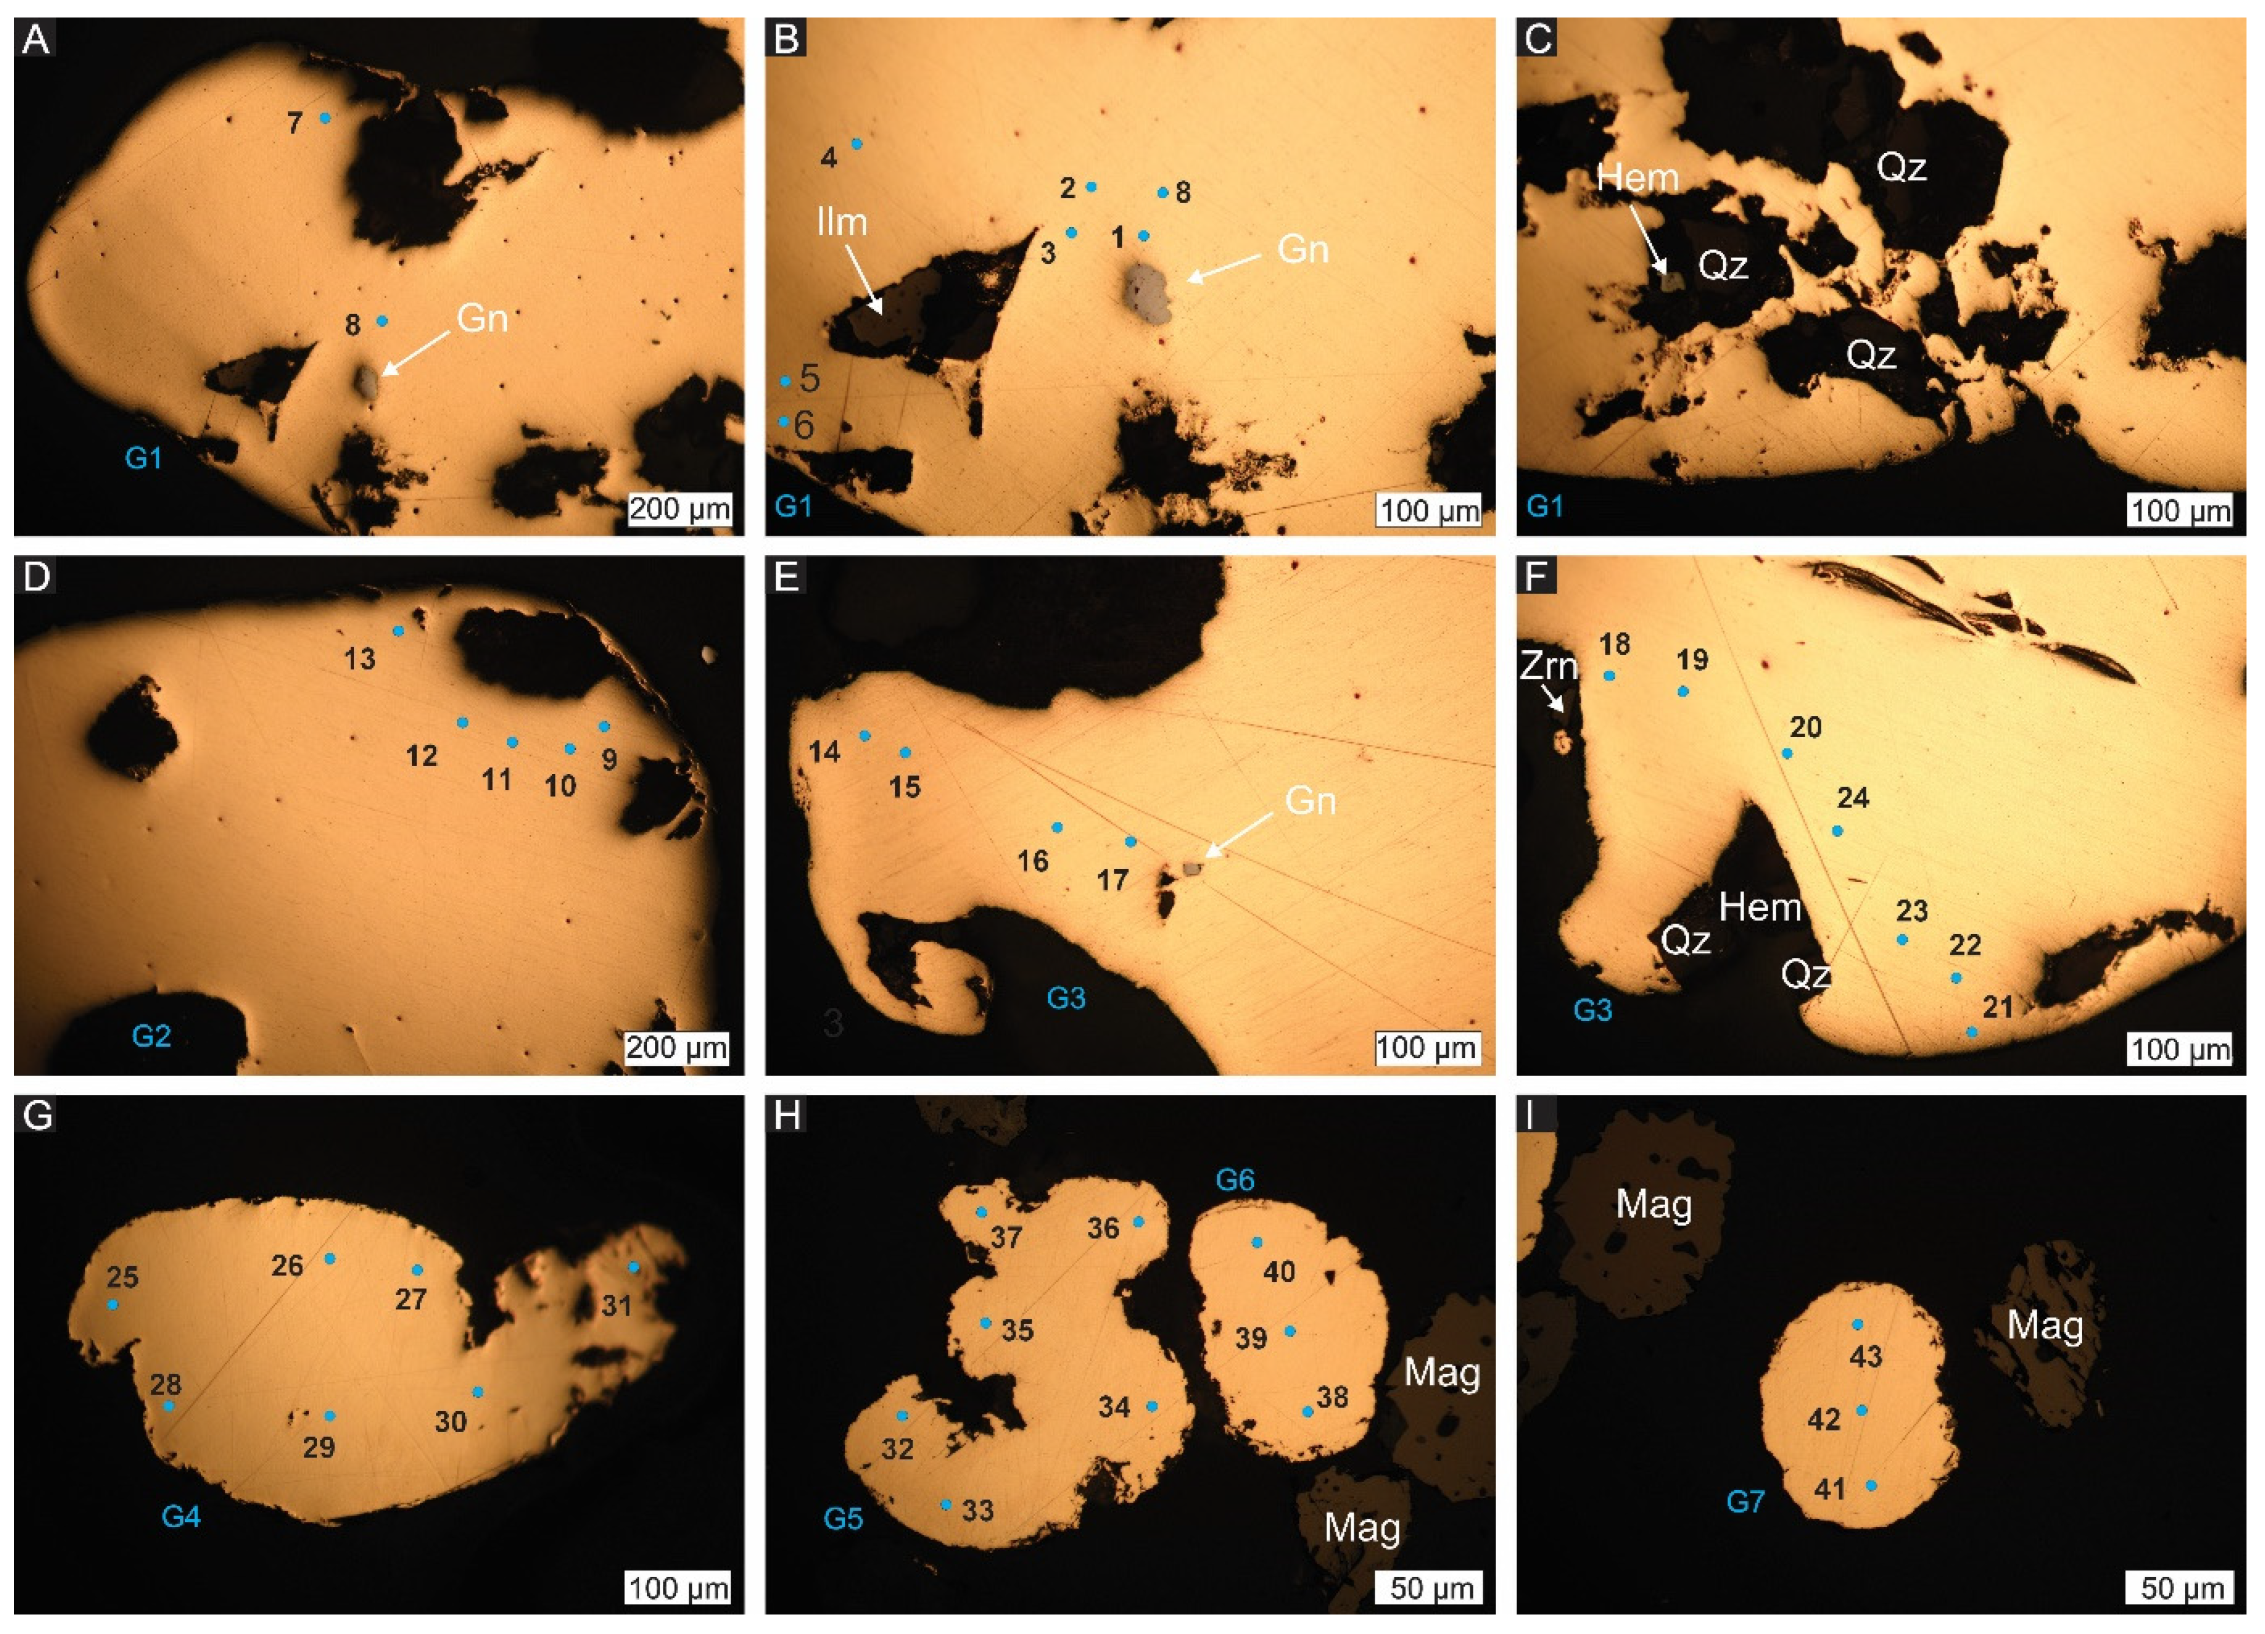
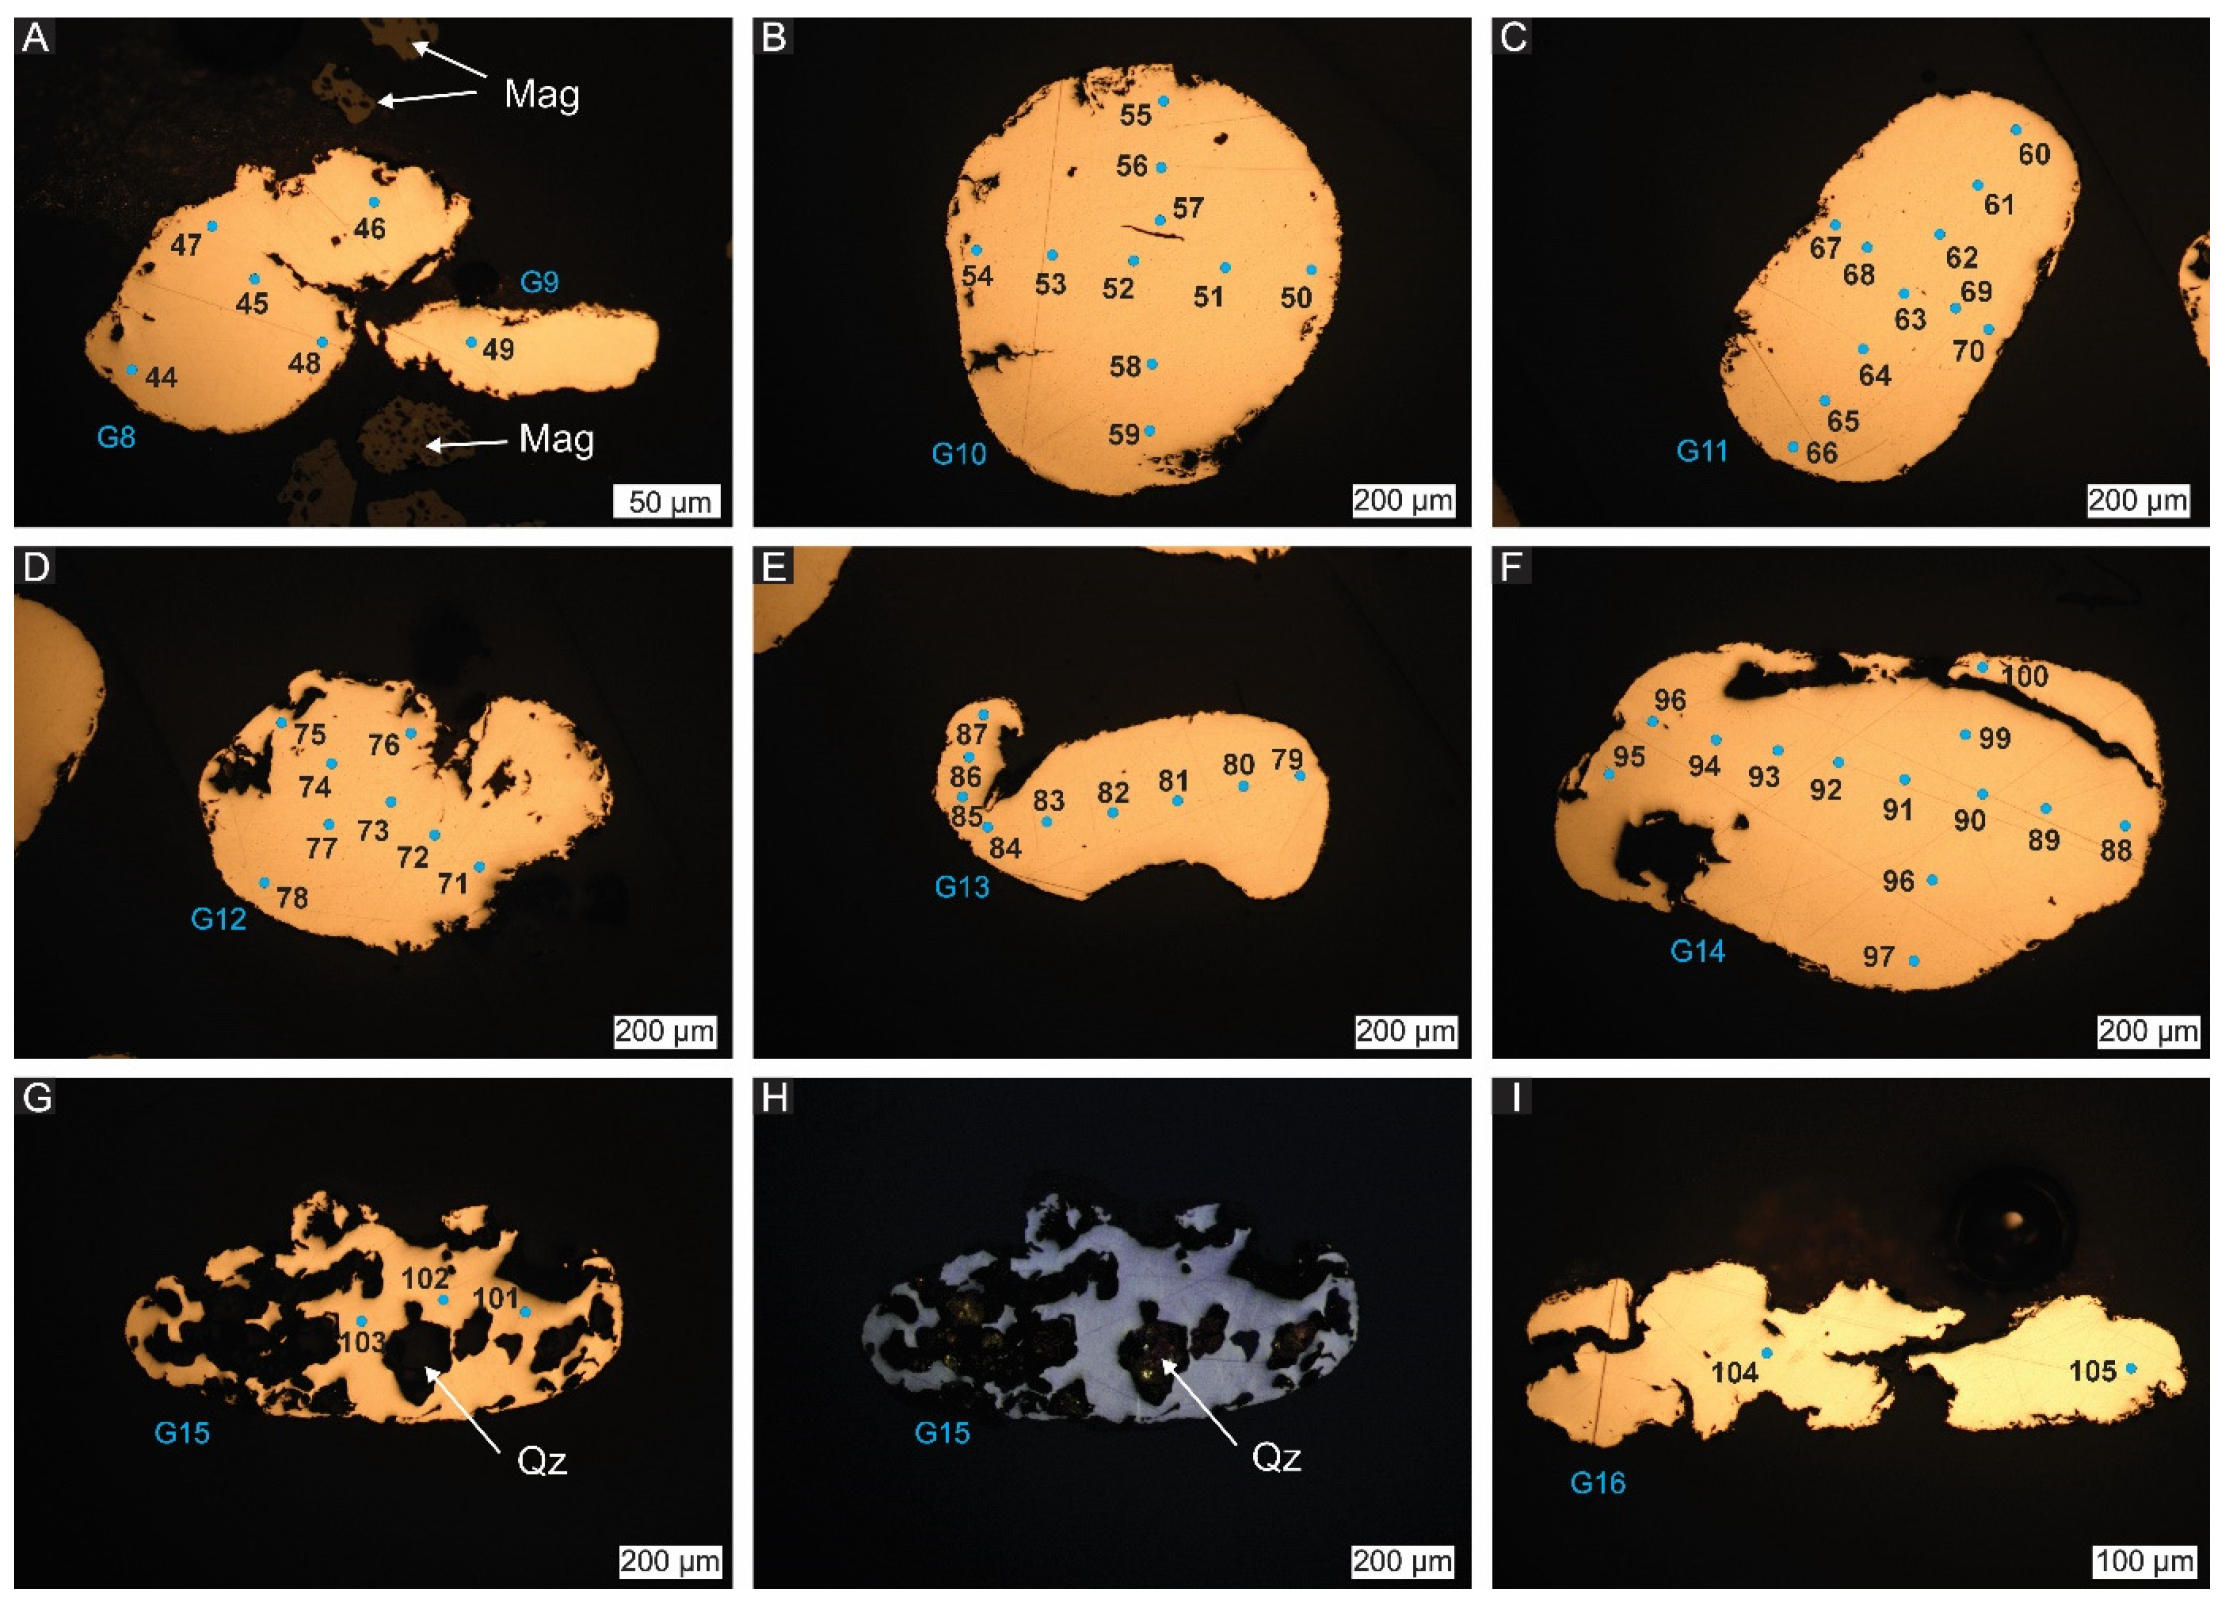
Table 1). The position of each validated EPMA point is marked on a plane-polarized reflected light microphotograph (selection in
Figure 6 and
Figure 7), and the results are summarized in the
Table S1.
The Au content of the native gold grains ranges between 96.74 and 98.89 wt% for location #1, 93.28 and 99.91 wt% for location #2, and 92.59 and 99.00 wt% for location #3 (
Table 4). The Ag content ranges between 1.04 and 2.61 wt% for location #1, 0.56 and 6.19 wt% for location #2, and 0.80 and 5.86 wt% for location #3 (
Table 4). The Cu content is up to 0.21 wt% for location #1, 0.38 wt% for location #2, and 0.60 wt% for location #3 (
Table 4).
The plot of Au and Ag content of all analyzed gold grains is shown in
Figure 8.
The mean Au content per grain at location #1 ranges from 97.19 to 98.01 wt% (
Table 5), indicating high and consistent purity levels. At location #2, the mean Au content per grain ranges from 93.28 to 97.13 wt% (
Table 5). The lowest Au content at location #2 was measured for G9 gold grain, with only one valid point of analysis, with 93.28 wt% Au, 6.19 wt% Ag, and 0.32 wt% Cu. At location #3, the mean Au content per gold grain is between 92.95 and 97.90 wt% (
Table 5).
The mean Ag content per gold grain ranges from 1.12 to 2.56 wt% at location #1, from 2.65 to 6.19 wt% at location #2, and from 2.26 to 5.81 wt% at location #3, respectively (
Table 5).
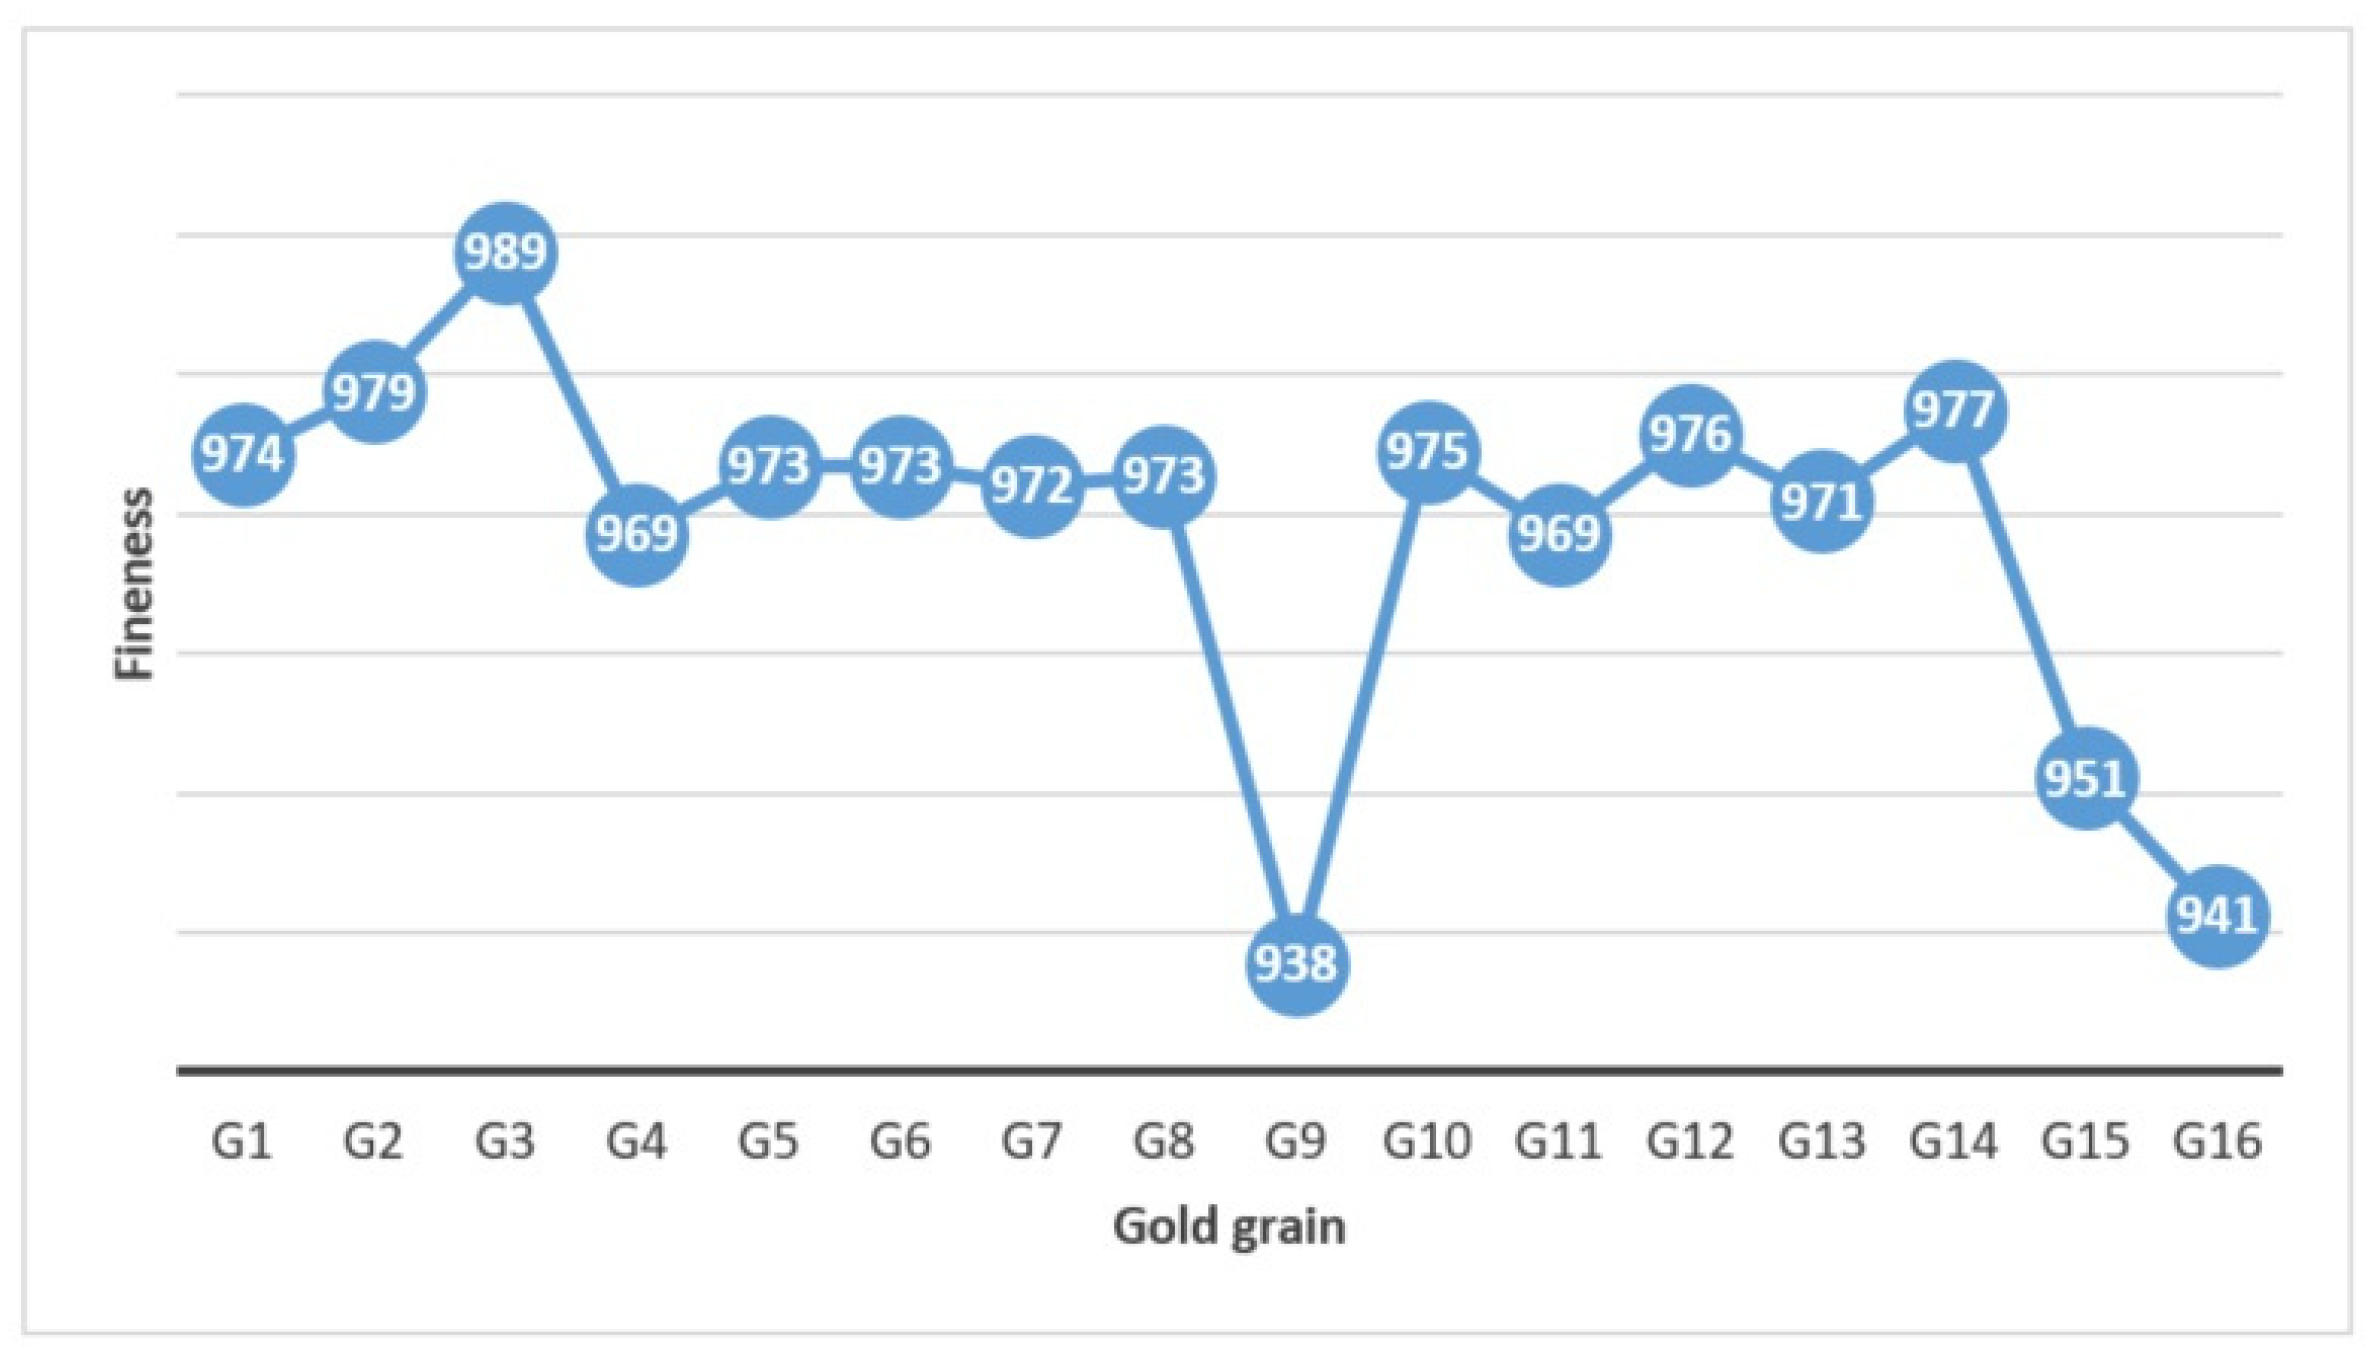
The mean values of Au and Ag content calculated for each analyzed gold grain were used to calculate the gold fineness (1000 × Au/Au + Ag) for each grain (
Table 5 and
Figure 9).
4.3. Minerals in Association with Native Gold
The binocular microscope study revealed that several gold grains recovered from all three locations still have attached quartz crystals, especially those from locations #1 and #3 (
Figure 3 and
Figure 4B). In location #2, only one grain of gold was found with attached quartz (
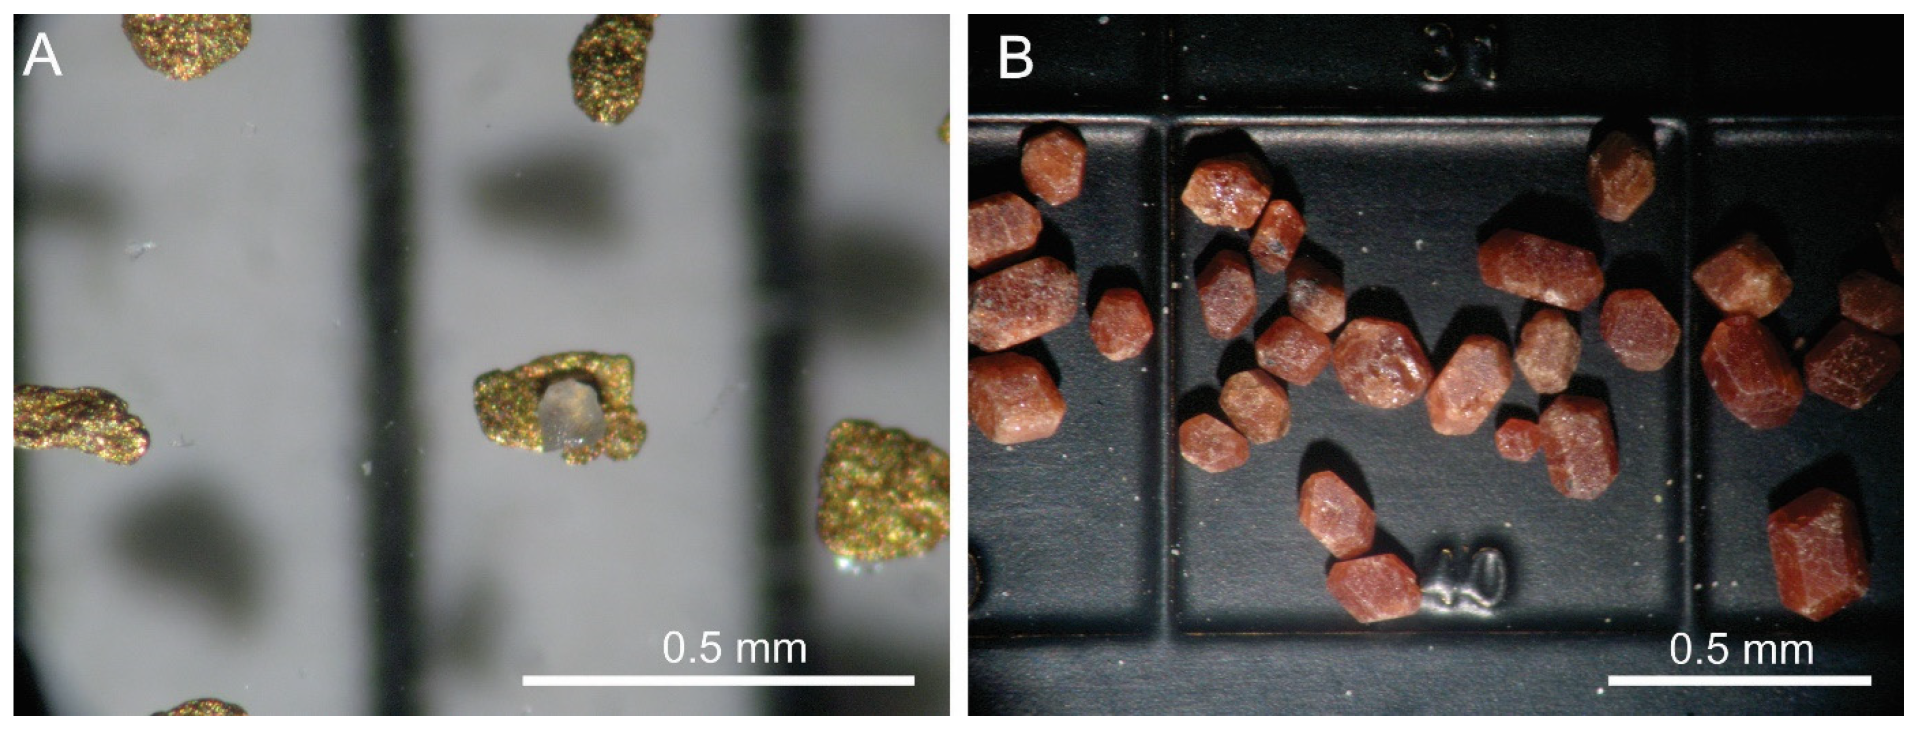
Figure 10A). The heavy mineral concentrates from locations #2 and #3 contain metamorphic and subordinate sedimentary rock fragments. Additionally, quartz and garnet (
Figure 10B) were identified within the concentrates. The X-ray diffraction of the garnet concentrate from locations #2 and #3 (
Figure S1) revealed that they consist of almandine.
The heavy mineral concentrates from locations #2 and #3 were screened into seven size categories: smaller than 0.063 mm; 0.063 mm–0.125 mm; 0.125 mm–0.250 mm; 0.250 mm–0.500 mm; 0.500 mm–1.00 mm; 1.00 mm–2.00 mm; and greater than 2.00 mm. Afterward, the magnetic fraction was manually separated from the non-magnetic fraction from all grain size categories for both locations #2 and #3. The magnetic fraction was found to be 15% and 17% out of the total weight of the heavy mineral concentrates for locations #2 and #3, respectively. In both locations, the highest percentage of magnetic fraction (in weight) occurs in the 0.125–0.250 mm grain size fraction, i.e., 25.14% in location #2 and 36.67% in location #3, respectively (
Figure 11 and
Figure 12).
The ore microscopy study revealed that the native gold grains G1 and G3 recovered from location #1 host galena inclusions (
Figure 6A,B). The nature of these inclusions was certified by both EDS and WDS analysis. The Pb content of these galena inclusions is 86.73 wt% and 88.00 wt%, respectively. Their sulfur content is almost identical, 13.33 and 13.26 wt%, respectively. The content of the other elements analyzed within galena is below the detection limit.
Additionally, the presence of magnetite (
Figure 6H,I and
Figure 7A) and hematite (
Figure 6C,F) was confirmed by an ore microscopy study (
Figure 6 and
Figure 7). The presence of zircon (
Figure 6F) and ilmenite (
Figure 6B) within the concentrate was confirmed by EDS analysis. The occurrence of the quartz grains as gangue mineral closely associated with gold grains (
Figure 6 and
Figure 7) was certified by EDS as well.
5. Discussion
5.1. Morphological Analysis
The range of the gold grain size is wider at location #3, while at location #2, it is smaller (
Table 3 and
Figure 5). The histograms of gold grain dimensions for locations #2 and #3 are skewed to the right (
Figure 5), suggesting that smaller grains are prevalent in both locations.
The size of the alluvial gold grains, ranging from tens of micrometers to 5 mm across the three locations, could indicate variations in the depositional processes, transport distances, or energy of the environments at each site [
36,
37,
38]. The significantly larger mean size (3.60 mm × 2.50 mm) at location #1 suggests shorter transport, as larger grains are typically found near the source due to their difficulty in being carried by water. However, only three gold grains have been collected in this location, and for this reason, it is not possible to propose a statistical analysis. With a mean size of 0.43 mm × 0.30 mm, the gold grains from location #2 are finer than at location #1. This suggests longer transport distances or a lower-energy environment. The mean size (1.01 mm × 0.56 mm) of the gold grains at location #3 is between those at locations #1 and #2, indicating a broader size distribution as compared to location #2. This variability may point to episodic high-energy events like flash floods, which could transport larger gold grains to this seasonal creek.
Cailleux’s flattening index (CFI) measures the redistribution of mass in a malleable particle, resulting from impacts and deformations experienced during its transport in fluvial settings [
39]. The CFI index, calculated for five gold grains from location #3, ranges from 1.71 to 3.34 and suggests a minimal hammering effect and a short transportation distance [
37]. According to Herail et al. (1990) [
40], a CFI value of 9 suggests a transport distance greater than 30 km, while a value over 15 indicates a distance exceeding 60 km. Based on the CFI obtained for the gold grains in Baia, it seems that the distance of transportation of the gold grains is less than 30 km.
The presence of quartz still attached to gold grains and the low CFI suggest a short transportation distance, in the range of kilometers to less than 30 km [
38,
40]. According to Ketchaya et al. (2022) [
38], the spherical to cylindrical shapes of the gold grains point towards a proximal position of the placer to the primary source, while more blade-like shapes form during longer transport distances. Accordingly, the prevalent discoidal–subdiscoidal alluvial gold grains in all three locations from Baia suggest a longer distance of transport from the primary source than that suggested by the presence of quartz attached to the gold grains and the low CFI. However, Knight et al. (1999) [
2] stated that 3 km away from the primary source, the gold grains transported in a fluvial setting are consistently deformed and become more rounded due to their malleable character.
5.2. Composition of Alluvial Gold
The chemical composition of the native gold grains exhibits slight variation across the three locations (
Table 4,
Figure 8).
The Au and Ag contents at the grain level are homogeneous for 10 grains (G1-G3, G6, G7, G9, G13-G16), while for the remaining 6 grains (G4, G5, G8, G10, G11, and G12) are slightly heterogeneous, showing a compositional variation of about 5 wt% for Au and 2 to 4 wt% for Ag (
Figure 8 and
Table S1). The chemical analysis carried out across the gold grains (
Figure 6 and
Figure 7) indicates minor variation in chemical composition between the core and the rim of the grains (
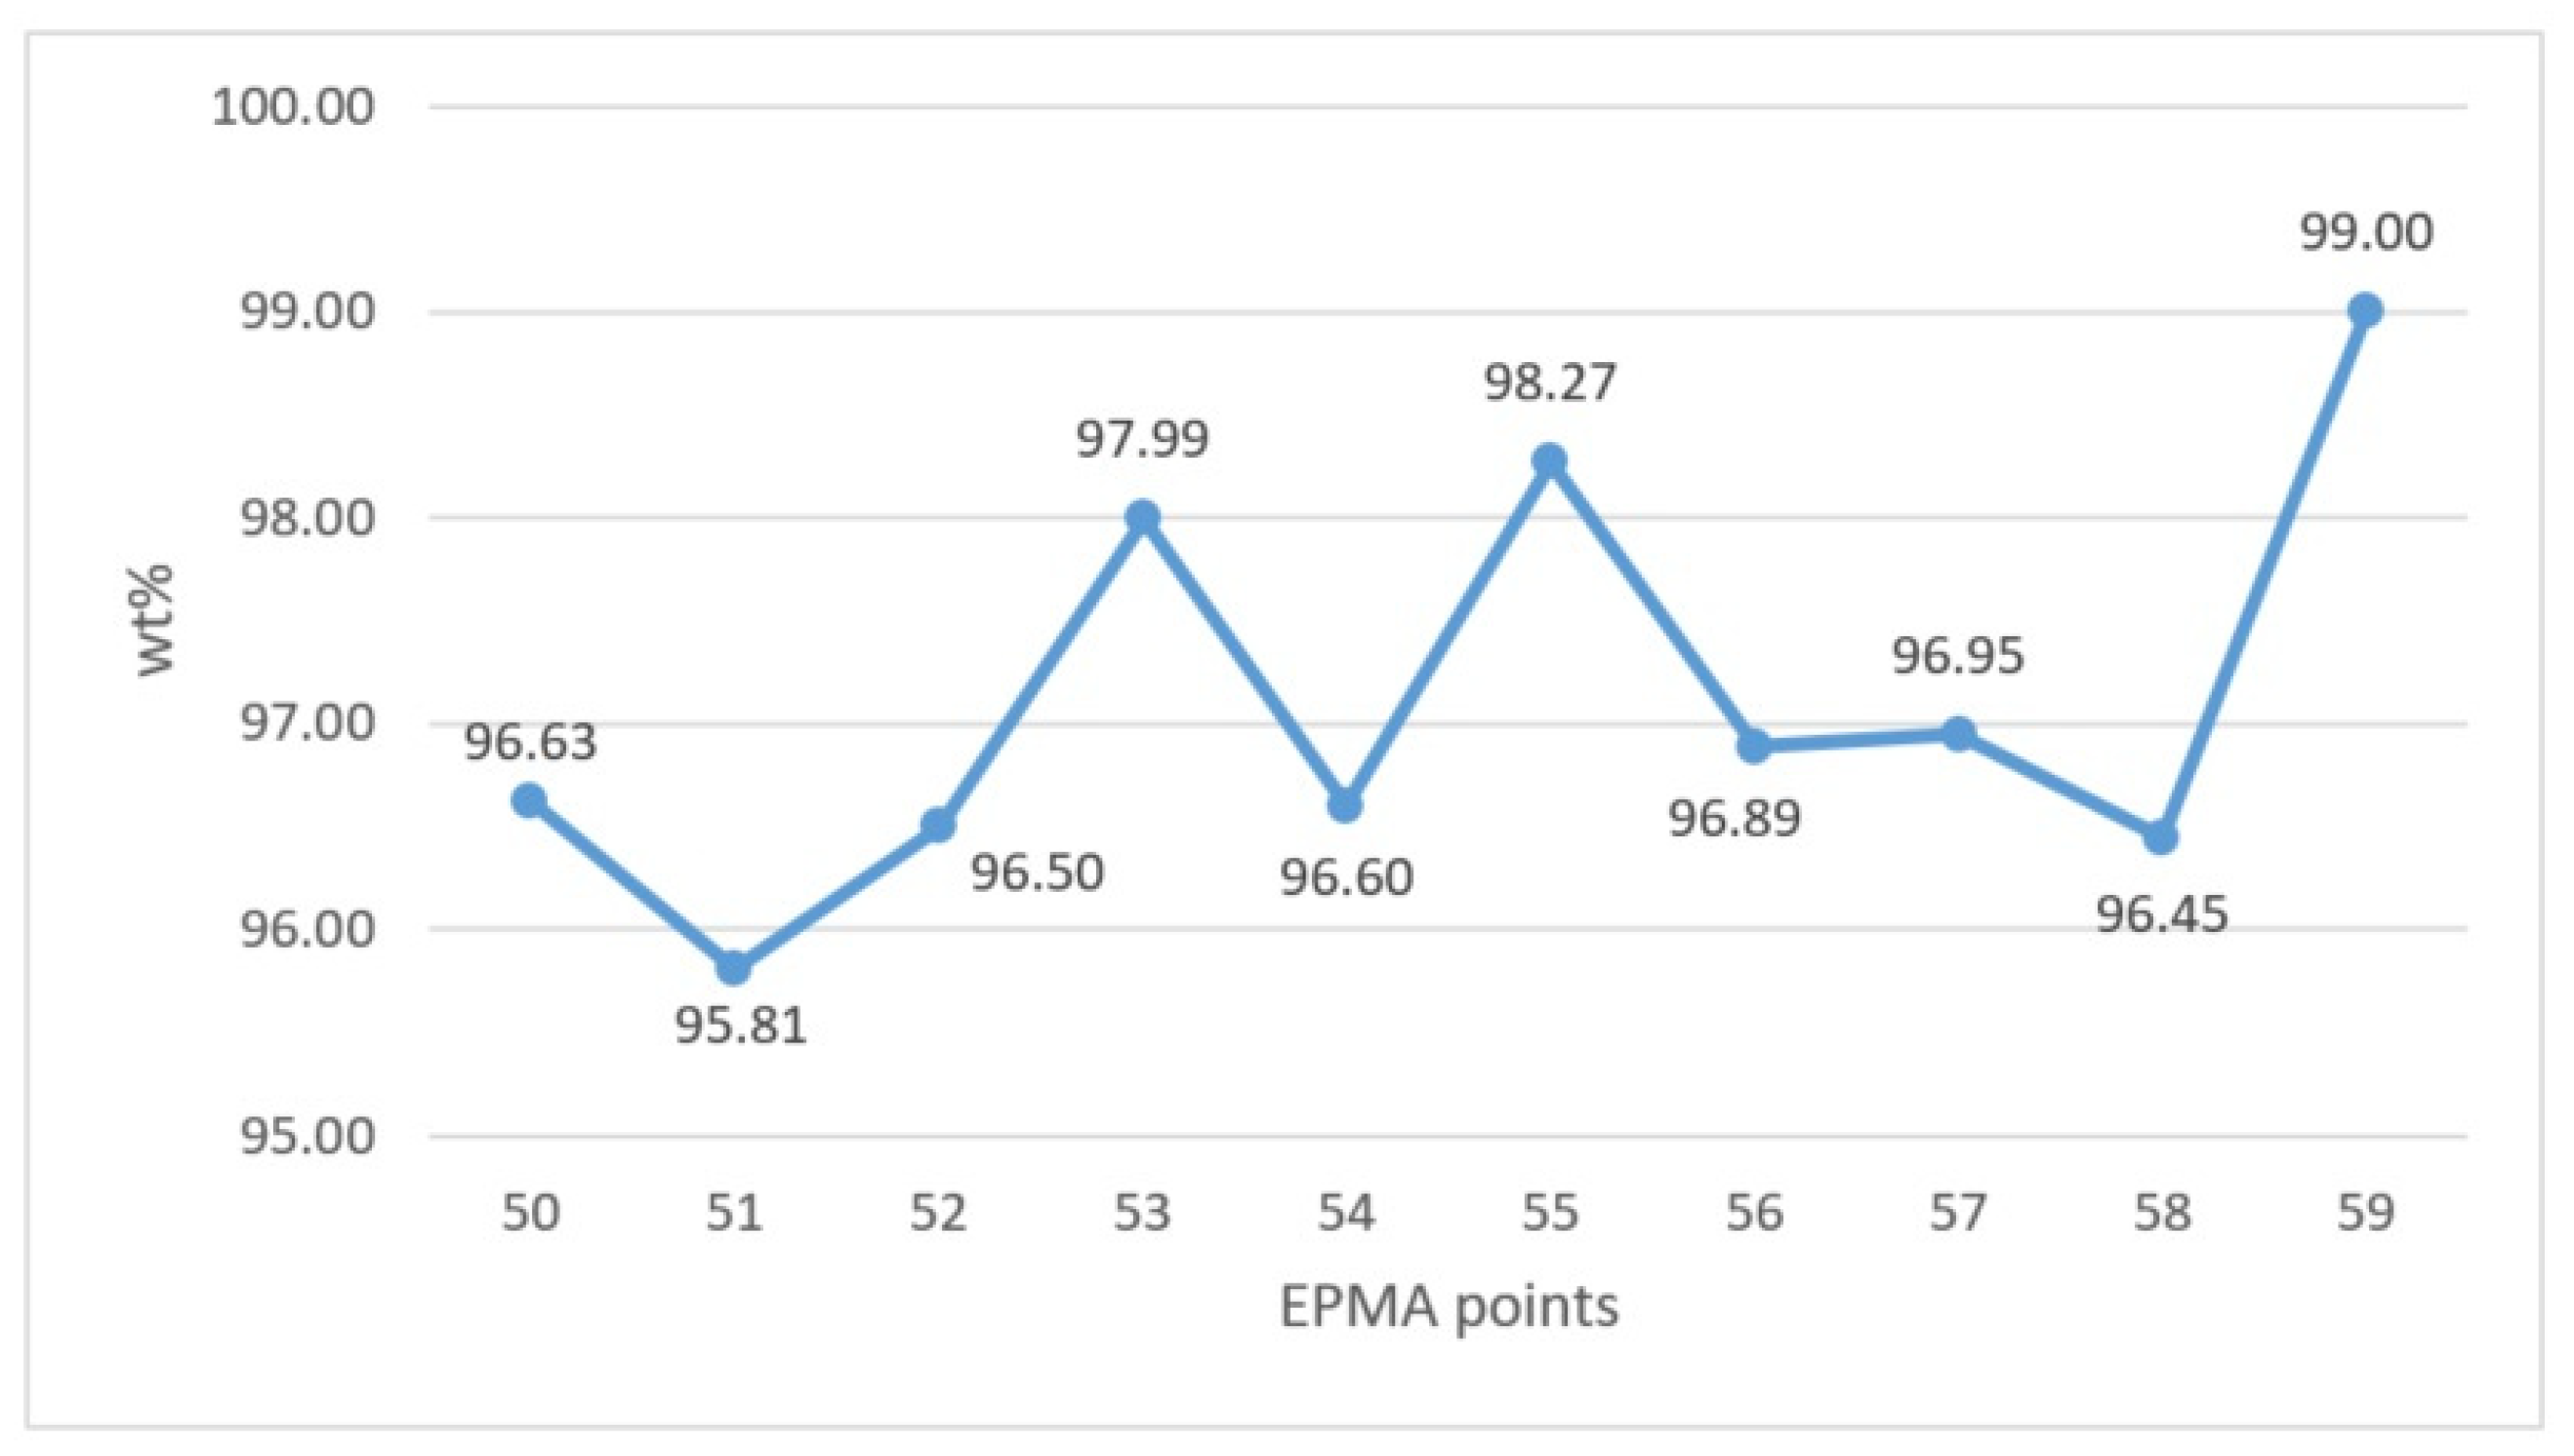
Table S1 and
Figure 8). For example, Au is heterogeneously distributed within the grains, irrespective of the position of the point analysis in the core or rim zones (
Figure 13). The ore microscopy study revealed a consistent reflectance and color across the gold grains and their edges, suggesting their rather homogeneous chemical composition. Additionally, the native gold grains show no visible rim or internal zoning (
Figure 6 and
Figure 7). The high-resolution BSE images of the gold grains did not reveal any Au-enrichment of the rims. These findings suggest that the chemical composition of the alluvial gold grains corresponds to the composition of the primary native gold grains.
At the location level, the smallest chemical variation in the gold and silver contents was evident for location #1, of about 2 wt% for Au (96.74–98.89) and 1.5 wt% for Ag (1.04–2.61). The chemical composition of the gold grains at locations #2 and #3 shares practically the same variation in the Au and Ag content from about 99 to 93 wt% Au and 1 to 6 wt% Ag (
Figure 8).
The Cu content of the gold grains is generally below the detection limit. Copper was detected in two gold grains (SM1), i.e., G9 (location #2) with 0.32 wt% (
Table 5), and G13 (location #3), with a mean value of 0.50 wt% (
Table 5).
Hydrothermal quartz is a common host mineral for native gold in many primary ore deposit types and the presence of quartz attached to the gold grains across all three locations is a significant clue, as it strongly suggests that the primary source of gold is nearby [
41].
The ore microscopy revealed the presence of galena inclusions hosted by the gold grains. The sulphide inclusions, found in placer gold grains, suggest the retention of the gold’s primary chemical composition, as unprotected sulfides are quickly altered or eliminated in the placer environment [
16].
The mineral assemblage of the gold concentrate in Baia, consisting of native gold with or without attached quartz and galena inclusions, silicates (quartz, garnet, zircon), and oxides (ilmenite, hematite, and magnetite), reflects the mineralogy of the primary ore bodies (gangue and ore minerals), the lithology of the host rock of the primary gold mineralization, and of the rocks outcropping along the river from its spring to the panning location. Garnet is an essential rock-forming mineral commonly occurring in large amounts in high- to ultrahigh-pressure metamorphic rocks within subduction zones [
42], acting as a reliable indicator of metamorphic pressure and temperature during orogenesis [
43]. It is also common in amphibolite facies of the metamorphosed pelitic and mafic rocks, in greenschist facies of the pelitic rocks [
44], and may occur in pegmatites.
The magnetic fraction in the gold concentrate, accounting for 15 to 17 weight percent, is primarily concentrated in the 0.250–0.125 mm grain size range. The abundance and the size of the magnetic mineral grains are systematically greater in location #3 as compared to location #2, and these likely correlate with the greater size of the gold grains in location #3 as compared to location #2.
5.3. Potential Genetic Type of Primary Mineralization
The chemical composition of the native gold varies among the genetic types of primary gold deposits. It is also a powerful tool for deciphering the ore deposit genetic type that is the source of gold grains within a placer deposit [
41]. Accordingly, the composition of the native gold grains from Baia was compared to the composition of the native gold from two different ore deposit types in Romania, i.e., orogenic-derived alluvial gold and epithermal (
Table S2 and
Figure 14).
The Olănești gold placer, located in the Southern Carpathians, formed through erosion, transportation, and deposition of native gold derived from orogenic gold ore bodies from the Valea lui Stan ore district [
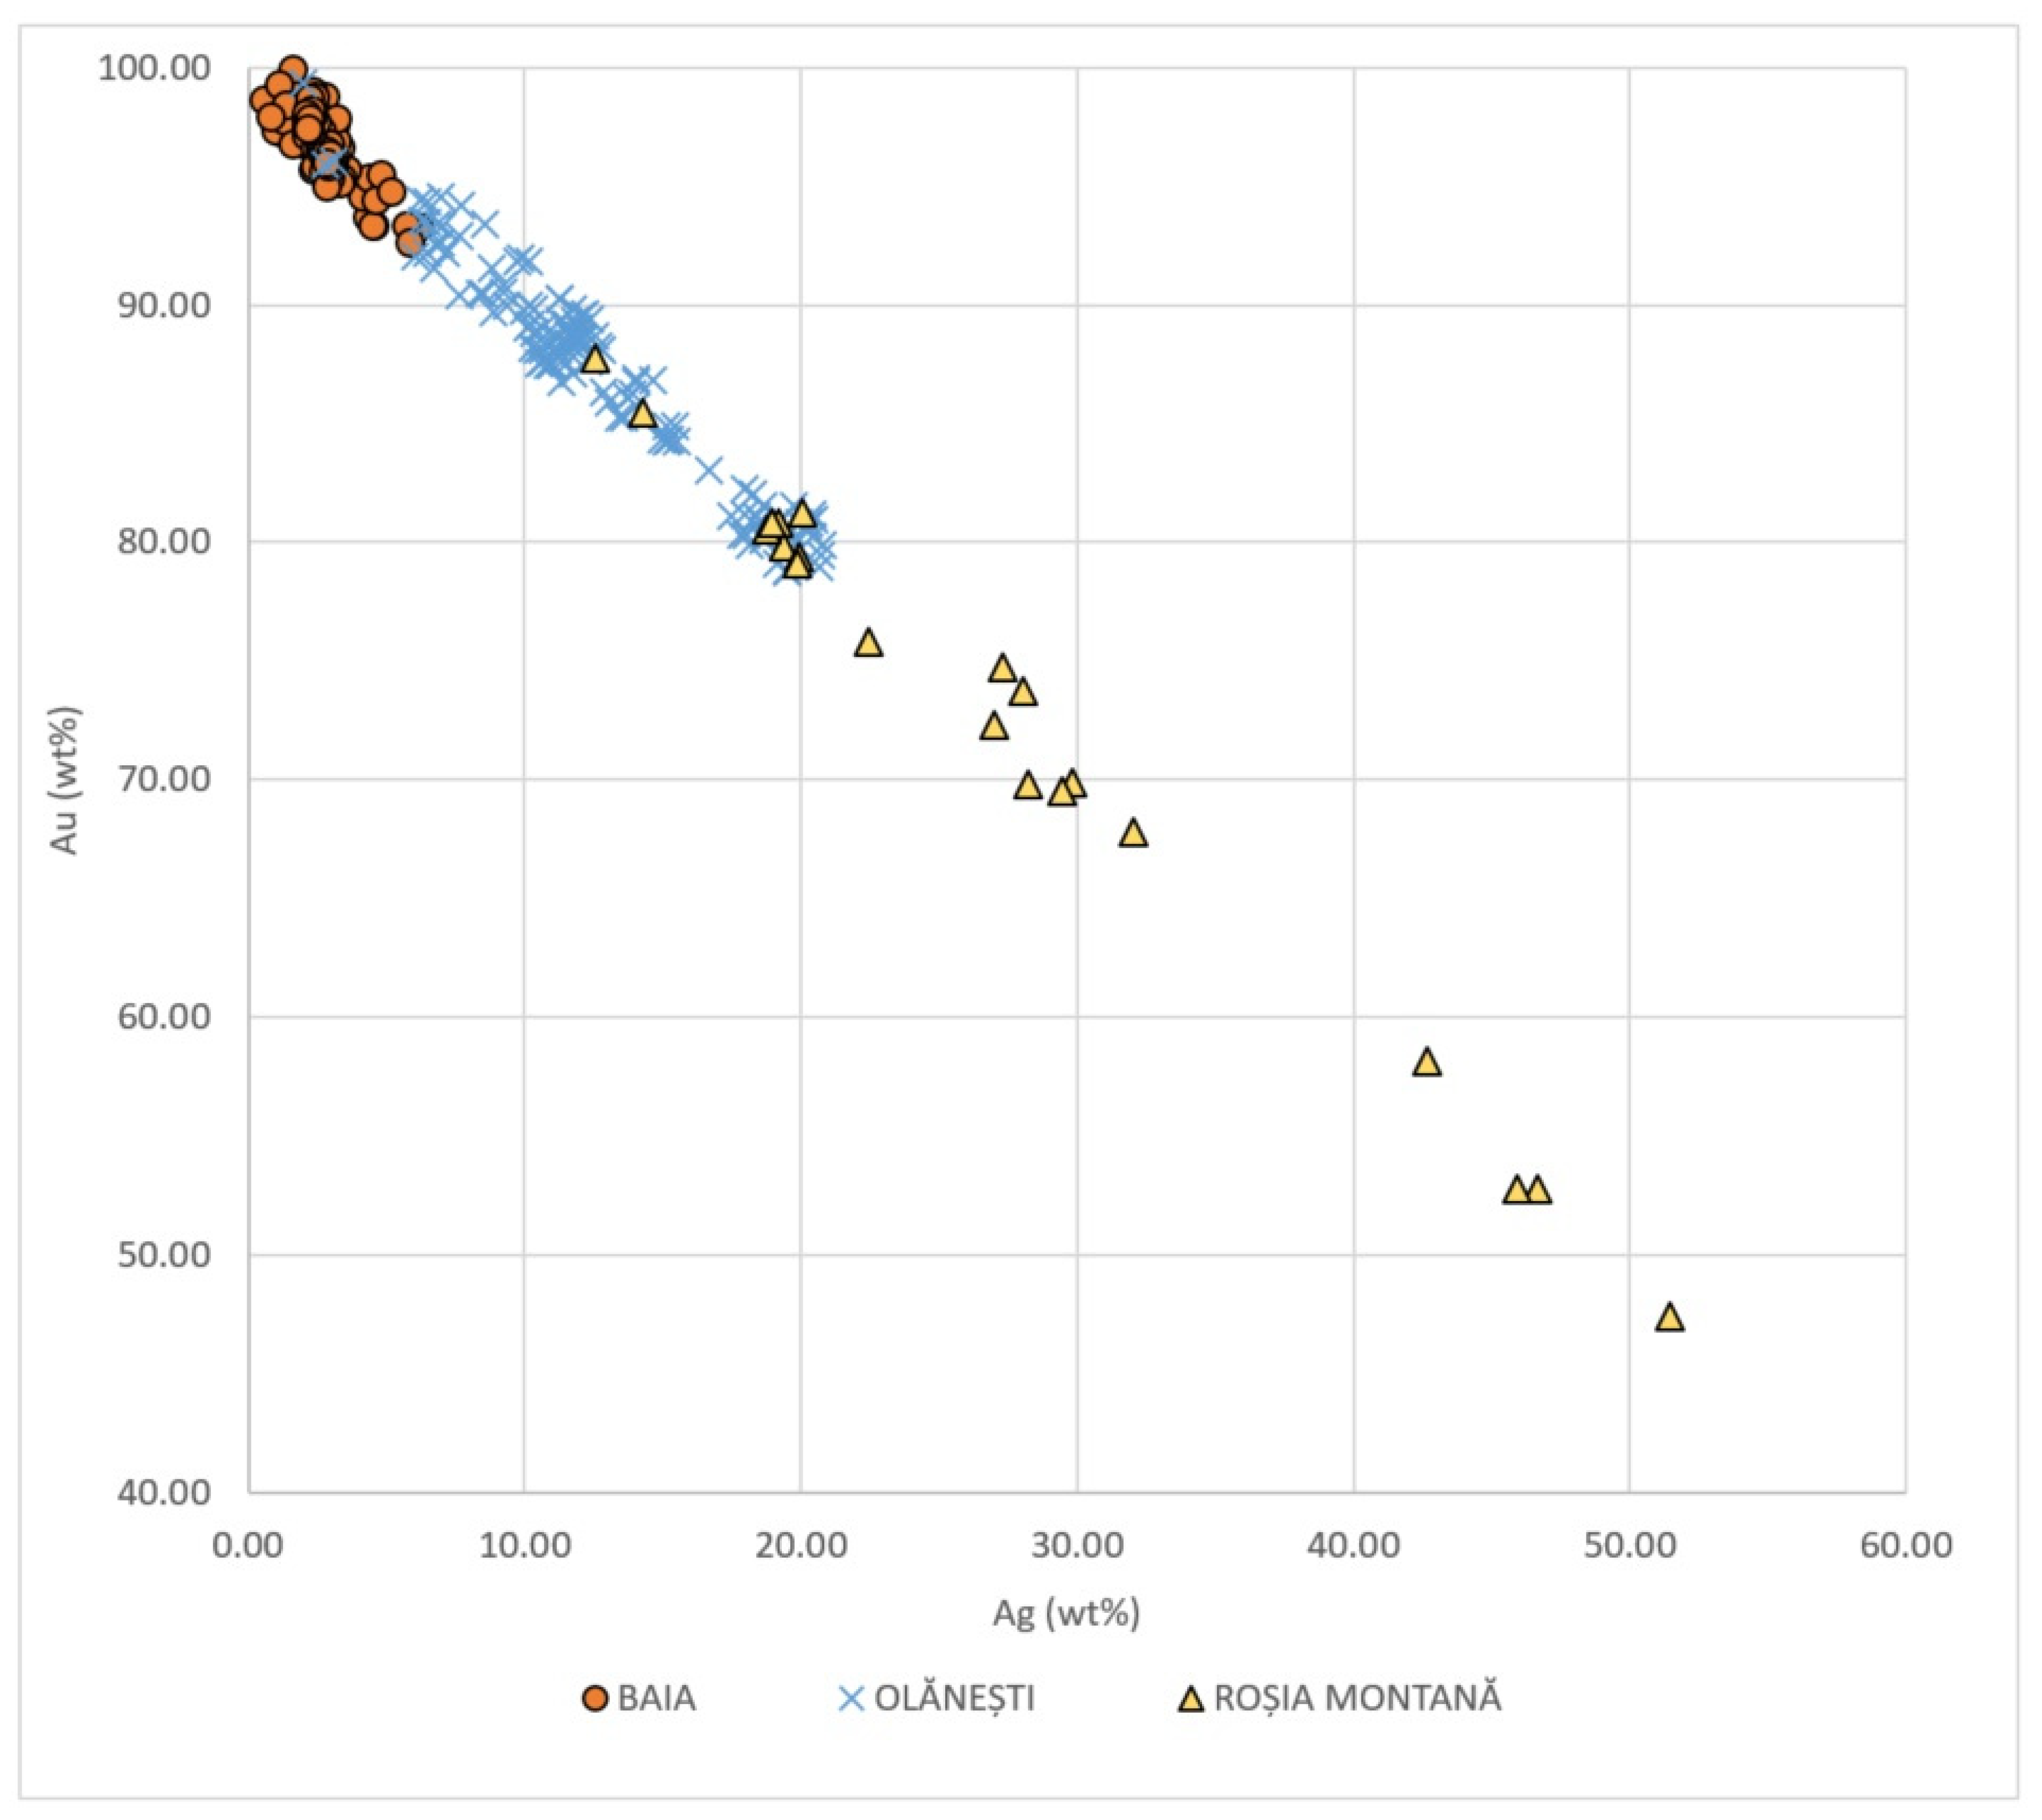
45]. The gold content of the alluvial gold from Olănești ranges from 78.74 to 99.30 wt%, being generally comparable with the results revealed by our study for the alluvial gold from Baia (
Table 6). In contrast, the composition of the native gold from the Roșia Montană ore deposit varies widely, ranging from 47.39 to 87.78 wt% (
Table 6). It hosts both low-sulfidation and intermediate-sulfidation high-grade Au-Ag ore bodies with native gold showing significant chemical heterogeneity [
46,
47,
48].
The chemical composition of the epithermal gold from the Roșia Montană ore deposit has a range of about 40 wt% for both Au and Ag (
Figure 14). The composition of the orogenic gold from the Olănești gold placer is less heterogeneous, with a variation of about 15% for both Au and Ag (
Figure 14). The native gold grains from Baia show an even more homogeneous chemical composition, with less than 10 wt% variation and an Au-rich character, i.e., over 90 wt% Au (
Figure 14).
SEM-EDS analysis of the alluvial gold from the Pianu area, located on the northern slope of the Southern Carpathians [
51], indicates a gold content ranging from 75.90 to 98.20 wt% and a silver content between 1.80 and 24.10 wt%, with an average value of 88.02 wt% for gold and 11.99 wt% for silver. These values closely align with those reported for the orogenic gold from Olănești by Drăgușanu et al. (2024) [
45] and are slightly dispersed from the results revealed by the present study, indicating an Au-richer and Ag-poorer composition of the native gold from Baia.
Figure 14.
Plot of Au and Ag content (in wt%) of the native gold from Baia, Olănești alluvial gold of orogenic nature [
45], and Roșia Montană epithermal deposit [
47,
49,
50].
Figure 14.
Plot of Au and Ag content (in wt%) of the native gold from Baia, Olănești alluvial gold of orogenic nature [
45], and Roșia Montană epithermal deposit [
47,
49,
50].
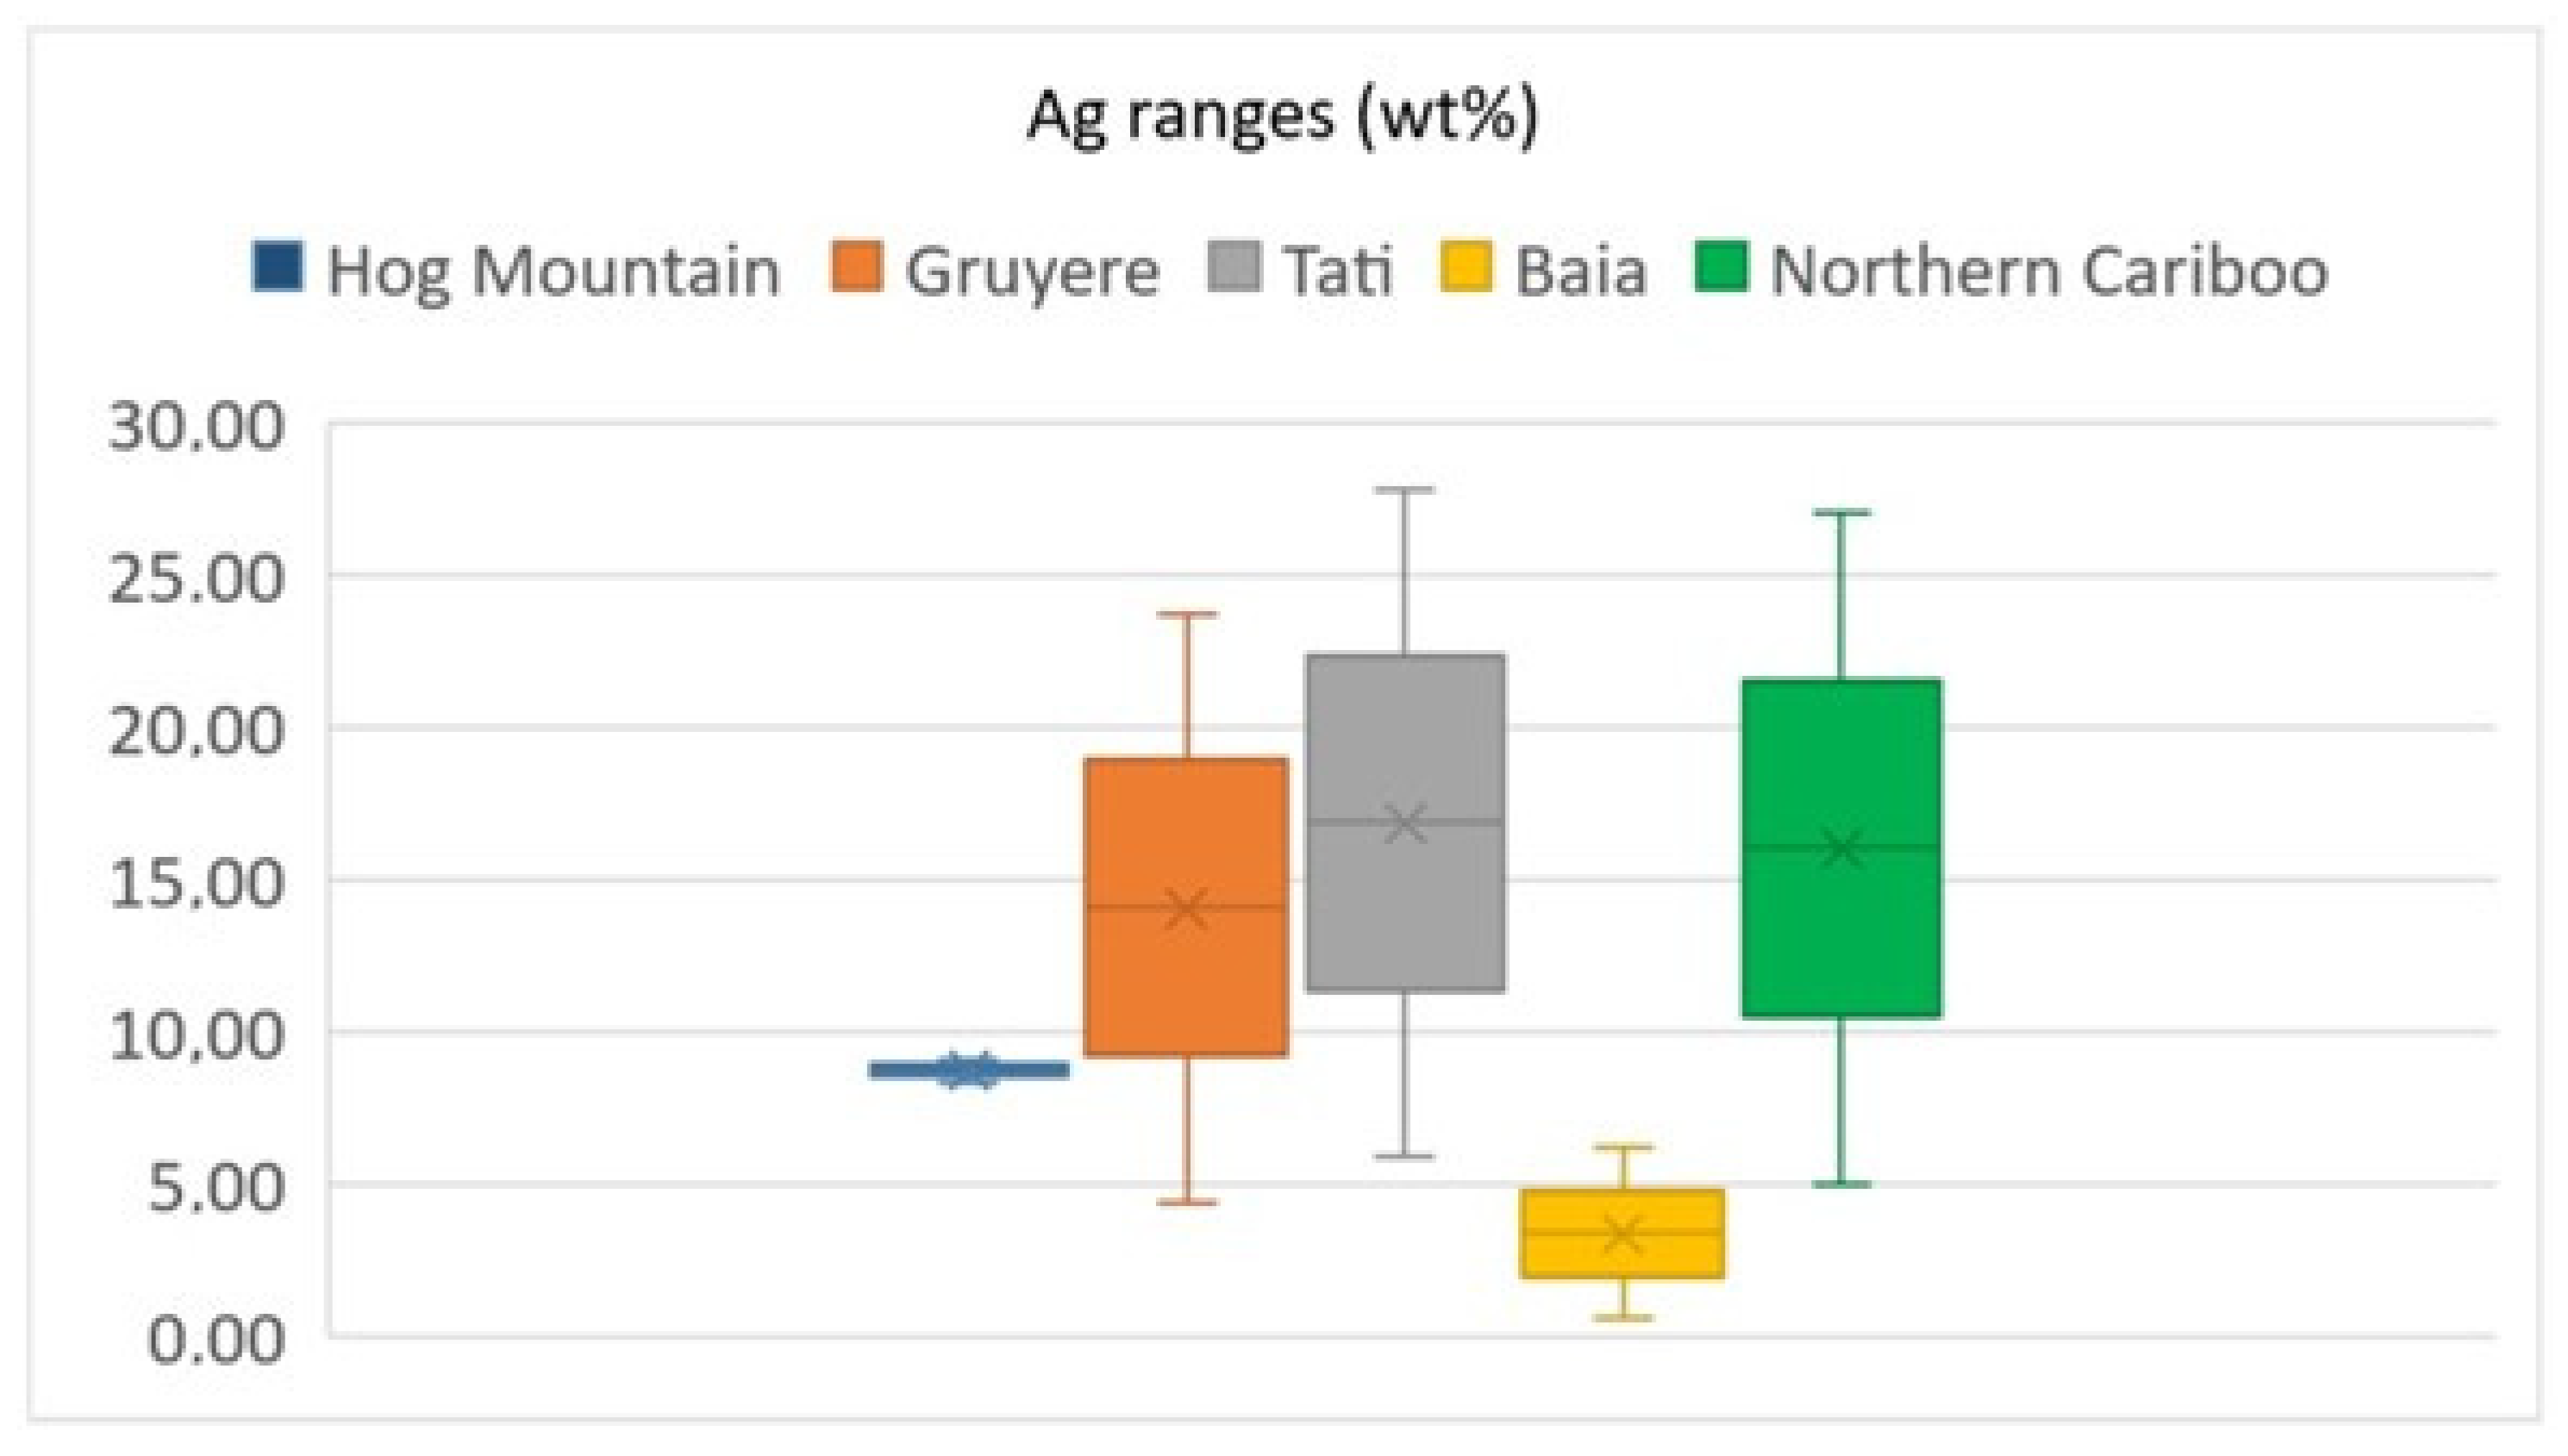
Apart from the orogenic gold in Romania, the chemical composition of the gold grains in Baia is generally comparable with the composition of the gold grains in other orogenic gold occurrences, such as the Hog Mountain in the Southern Appalachians, USA [
52], and the Northern Cariboo Gold District, British Columbia, Canada [
41]. The gold grains at the Hog Mountain exhibit a Au content ranging from 89.7 to 91.4 wt% and a Ag content from 8.31 to 9.10 wt% [
52], while the Ag content in the orogenic gold from the Northern Cariboo Gold District ranges from 5 to 27 wt% [
41]. From Western Australia, ref. [
53] shown that the composition of the native gold and electrum from the orogenic Gruyere Gold Deposit, Yilgarn Craton, ranges between 75.1 and 97.1 wt% Au and 4.4 to 23.7 wt% Ag. The chemical composition of the native gold in the Tati greenstone belt, Botswana (Mupane and Shashe ore deposits; [
54]), shows an Ag-rich character, with the Au content ranging from 71.70 to 92.80 wt%, and the Ag content ranging from 5.89 to 27.80 wt%. Comparatively, the gold grains gathered from Baia show an Au-richer composition compared to the orogenic gold mentioned above and a narrower compositional range-excepting Hog Mountain (
Figure 15). As enrichment in gold [
17] or silver depletion [
16] was not observed, the composition of the alluvial gold from Baia is close to the original chemical composition of the native gold and suggests a possible orogenic gold as the primary source. However, there are no orogenic gold occurrences mentioned so far in the Eastern Carpathians.
A similar case within the Carpathians is the alluvial gold from the Pianu area, Southern Carpathians. Presently, the primary orogenic gold mineralization, which was the source of the gold from the Pianu placers, is completely eroded [
25]. However, additional studies are needed to identify the primary source of the alluvial gold from Baia, Eastern Carpathians.
6. Conclusions
A batch of 115 gold particles, weighing 0.50 g in total, was collected from three sites within the Baia region, Eastern Carpathians, Romania, including the Bogata River catchment area and Iacobel Creek.
The average dimensions of the native gold grains are as follows: 3.93 mm by 2.50 mm at location #1, 0.43 mm by 0.30 mm at location #2, and 1.01 mm by 0.56 mm at location #3.
The analysis of the gold grain dimensions (length and width) in the heavy mineral concentrates indicates that the fraction up to 0.80 mm for location #2 and up to 1.60 mm for location #3, respectively, contains over 90% of the gold grains.
Most of the gold grains exhibit discoidal to subdiscoidal shapes, with their roundness varying from rounded to sub-rounded. Traces of the original quartz gangue are occasionally preserved on the gold grains.
Quantitative EPMA analyses performed on 16 gold grains revealed their composition, with silver (Ag) content ranging from 0.56 wt% to 6.19 wt%. Copper traces, i.e., 0.21 to 0.60 wt% (range), were measured in six gold grains.
The chemical composition of the native gold suggests an orogenic gold signature. However, such a mineralization style is unknown so far in the Eastern Carpathians.
Supplementary Materials
The following supporting information can be downloaded at:
https://www.mdpi.com/article/10.3390/min15101060/s1, Table S1: The chemical composition (in wt%) of the gold grains from Baia, Eastern Carpathians, Romania (EPMA results). FR results gathered at UMS 3623-Centre de MicroCaractérisation Raimond Castaing, Toulouse, France; RO results gathered at Department of Geology, Babeș-Bolyai University, Romania; Figure S1: The X-ray diffraction of the garnet concentrate from locations #2 and #3; Table S2: The chemical composition (EPMA results in wt%) on the gold grains from Olănești [
1] and Roșia Montană [
2,
3,
4].
Author Contributions
Conceptualization, C.G.T. and S.D.; methodology, S.D. and C.G.T.; software, S.D.; validation, S.D. and C.G.T.; formal analysis, S.D. and C.G.T.; investigation, S.D. and C.G.T.; resources, S.D. and C.G.T.; data curation, S.D. and C.G.T.; writing—original draft preparation, S.D. and C.G.T.; writing—review and editing, C.G.T. and S.D.; visualization, S.D. and C.G.T.; supervision, C.G.T. and S.D.; project administration, S.D.; funding acquisition, C.G.T. and S.D. All authors have read and agreed to the published version of the manuscript.
Funding
This research was founded by the Babeș-Bolyai University, Cluj-Napoca, Romania grant POCU/380/6/13/123886 “Antreprenoriat pentru inovare prin cercetare doctorală și postdoctorală” grant of (S.D.), the Babeș-Bolyai University, Cluj-Napoca, Romania contract 7422/27.05.2022 (C.G.T.), and the Babeș-Bolyai University, Cluj-Napoca, Romania grant GS-UBB-FBG-TAMASCALINGABRIEL 2022–2023 (C.G.T.).
Data Availability Statement
The original contributions presented in this study are included in the article/
Supplementary Material. Further inquiries can be directed at the corresponding author(s).
Acknowledgments
The support of Philippe de Parseval and Sophie Gouy (UAR 3623-Centre de MicroCaractérisation Raimond Castaing, Toulouse University, France) during EPMA data collection is highly appreciated.
Conflicts of Interest
The authors declare no conflict of interest.
References
- Grant, A.H.; Lavin, O.P.; Nichol, I. The morphology and chemistry of transported gold grains as an exploration tool. J. Geochem. Explor. 1991, 40, 73–94. [Google Scholar] [CrossRef]
- Knight, J.B.; Morison, S.R.; Mortensen, J.K. The relationship between placer gold particle shape, rimming, and distance of fluvial transport as exemplified by gold from the Klondike District, Yukon territory, Canada. Econ. Geol. 1999, 94, 635–648. [Google Scholar] [CrossRef]
- Youngson, J.H.; Craw, D. Variation in placer style, gold morphology and gold particle behavior down gravel bed-load rivers: An example from the Shotover/Arrow- Kawarau-Clutha River system Otago, New Zealand. Econ. Geol. 1999, 94, 615–634. [Google Scholar] [CrossRef]
- Nikiforova, Z. Criteria for determining the genesis of placers and their different sources based on the morphological features of placer gold. Minerals 2021, 11, 381. [Google Scholar] [CrossRef]
- Nikiforova, Z. Mineralogical Criteria for the Prediction of Gold Mineralization in the Structures of the Siberian Craton. Minerals 2022, 12, 694. [Google Scholar] [CrossRef]
- Chapman, R.J.; Moles, N.R.; Bluemel, B.; Walshaw, R.D. Detrital gold as an indicator mineral. In Recent Advances in Understanding Gold Deposits: From Orogeny to Alluvium; Torvela, T.M., Chapman, R.J., Lambert-Smith, J., Eds.; The Geological Society, Special Publication: London, UK, 2022; Volume 516, pp. 291–312. [Google Scholar]
- Townley, B.K.; Hérail, G.; Maksaev, V.; Palacios, C.; De Parseval, P.; Sepulveda, F.; Orellana, R.; Rivas, P.; Ulloa, C. Gold grain morphology and composition as an exploration tool: Application to gold exploration in covered areas. Geochem. Explor. Environ. Anal. 2003, 3, 29–38. [Google Scholar] [CrossRef]
- Gerasimov, B. The Use of Typomorphic Features of Placer Gold of the Anabar Region for Determining Its Sources. Minerals 2023, 13, 480. [Google Scholar] [CrossRef]
- Nikiforova, Z. Mineralogical Method as an Effective Way to Predict Gold Ore Types of Deposits in Platform Areas (East of the Siberian Platform). Minerals 2024, 14, 631. [Google Scholar] [CrossRef]
- Averill, S.A.; Zimmerman, J.R. The Riddle resolved: The discovery of the Partridge gold zone using sonic drilling in glacial overburden at Waddy Lake, Saskatchewan. Can. Geol. J. of Can. Inst. Min. 1986, 1, 14–20. [Google Scholar]
- Barrios, S.; Merinero, R.; Lozano, R.; Orea, I. Morphogenesis and grain size variation of alluvial gold recovered in auriferous sediments of the Tormes Basin (Iberian Peninsula) using a simple correspondence analysis. Mineral. Petrol. 2015, 109, 679–691. [Google Scholar] [CrossRef]
- Lalomov, A.V.; Chefranov, R.M.; Naumov, V.A.; Naumova, O.B.; Lebarge, W.; Dilly, R.A. Typomorphic features of placer gold of Vagran cluster (the Northern Urals) and search indicators for primary bedrock gold deposits. Ore Geol. Rev. 2017, 85, 321–335. [Google Scholar] [CrossRef]
- Becerra, P.; Sanchez-Alfaro, P.; Piquer, J.; Plissart, G.; Garroz, B.; Kunstmann, D. Gold Provenance in Placers from Pureo Area, Southern Chile Coastal Cordillera, and Their Relationship with Paleozoic Metamorphic Rocks. Minerals 2022, 12, 1147. [Google Scholar] [CrossRef]
- Lalomov, A.; Grigorieva, A.; Kotov, A.; Ivanova, L. Typomorphic Features and Source of Native Gold from the Sykhoi Log Area Placer Deposits, Bodaibo Gold-Bearing District, Siberia, Russia. Minerals 2023, 13, 707. [Google Scholar] [CrossRef]
- Chapman, R.; Mortensen, J.K.; Murphy, R. Compositional Signatures of Gold from Different Deposit Types in British Columbia, 243 Canada. Minerals 2023, 13, 1072. [Google Scholar] [CrossRef]
- Desborough, G.A. Silver depletion indicated by microanalysis of gold from placer occurrences, Western United States. Econ. Geol. 1970, 65, 304–311. [Google Scholar] [CrossRef]
- Groen, J.C.; Craig, J.R.; Rimstidt, J.D. Gold-rich rim formation on electrum grains in placers. Can. Mineral. 1990, 28, 207–228. [Google Scholar]
- Mann, A.W. Mobility of gold and silver in lateritic weathering profiles: Some observations from Western Australia. Econ. Geol. 1984, 70, 38–49. [Google Scholar] [CrossRef]
- Wierchowiec, J.; Mikulski, S.Z.; Zielinski, K. Supergene Gold Mineralization from Exploited Placer Deposits at Dziwiszów in the Sudetes (NE Bohemian Massif, SW Poland). Ore Geol. Rev. 2021, 131, 104049. [Google Scholar] [CrossRef]
- Palyanova, G.A.; Beliaeva, T.V.; Savelyev, D.P.; Seryotkin, Y.V. Minerals of the Au-Cu-Ag System in Grains from the Placers of the Olkhovaya-1 River (Eastern Kamchatka, Russia). Minerals 2024, 14, 448. [Google Scholar] [CrossRef]
- Tămaș, C.G.; Veres, D.; Chauvel, C. Lead isotopic compositions of Paleozoic to Miocene ore deposits in the Western Tethyan Belt. Ore Geol. Rev. 2024, 175, 106346. [Google Scholar] [CrossRef]
- Tămaș, C.G. Brecciation and epithermal mineralization in the Baia Mare ore district (Romania): The Wilhelm deposit. Geol. Soc. Am. Bull. 2025, 137, 1927–1944. [Google Scholar] [CrossRef]
- Borcoș, M.; Udubașa, G. Chronology and characterisation of mining development in Romania. Rom. J. Earth Sci. 2012, 86, 17–26. [Google Scholar]
- Haiduc, I. The History of Gold in Romania; Imprimeriile “Adevărul” S.A.: Bucharest, Romania, 1940; 390p. (In Romanian) [Google Scholar]
- Tămaş-Bădescu, S. Contributions to the Economic Geology of Gold in Romania. PhD. Thesis, University of Bucharest, Bucharest, Romania, 2010. (In Romanian). [Google Scholar]
- Săndulescu, M. The Geotectonics of Romania; Editura Tehnică: Bucharest, Romania, 1984; 336p. (In Romanian) [Google Scholar]
- Balintoni, I. Geotectonics of the Metamorphic Terrains of Romania. Editura Carpatica: Cluj-Napoca, Romania, 1997; 176p. (In Romanian) [Google Scholar]
- Schmid, S.M.; Bernoulli, D.; Fügenschuh, B.; Matenco, L.; Schefer, S.; Schuster, R.; Ischler, M.T.; Ustaszewski, K. The Alpine-Carpathian-Dinaridic orogenic system: Correlation and evolution of tectonic units. Swiss J. Geosci. 2008, 101, 139–183. [Google Scholar] [CrossRef]
- Balintoni, I. Geology of Romania. In Cave and Karst Systems of Romania; Ponta, G.M.L., Onac, B.P., Eds.; Springer International Publishing AG: Cham, Switzerland, 2019; pp. 9–20. [Google Scholar] [CrossRef]
- Ștefănescu, M. Baraolt Nappe. Rep. Inst. Geol. Geophys. 1970, LXII, 107–124. (In Romanian) [Google Scholar]
- Seghedi, I.; Balintoni, I.; Szakács, A. Interplay of tectonics and Neogene post-collisional magmatism in the intracarpathian region. Lithos 1998, 45, 483–497. [Google Scholar] [CrossRef]
- Saulea, E.; Popescu, I.; Mirăuță, E. Geological Map of Romania, Scale 1:200000, Suceava Sheet; Geological Institute of Romania: Bucharest, Romania, 1966. (In Romanian) [Google Scholar]
- Balintoni, I.; Balica, C.; Ducea, M.N.; Hann, H.P. Peri-Gondwanan terranes in the Romanian Carpathians: A review of their spatial distribution, origin, provenance, and evolution. Geosci. Front. 2014, 5, 395–411. [Google Scholar] [CrossRef]
- Stefanescu, M.; Ionescu, F.; Niculin, M.; Popescu-Bradet, L.; Teodorescu, V.; Polonic, P.; Balintoni, I.; Peltz, S.; Popescu, I. A10: Geological Cross-Section Tău Zăului—Rîpa de Jos—Panaci—Crucea—Păltinoasa—Suceava—Roma—Tudor Vladimirescu; Archive of the Institute of Geology and Geophysics: Bucharest, Romania, 1980. (In Romanian) [Google Scholar]
- Warr, L.N. IMA-CNMNC Approved Mineral Symbols. Mineral. Mag. 2021, 85, 291–320. [Google Scholar] [CrossRef]
- Chapman, R.J.; Mortensen, J.K.; LeBarge, W.P. Styles of lode gold mineralization contributing to the placers of the Indian River and Black Hills Creek, Yukon Territory, Canada as deduced from microchemical characterization of placer gold grains. Miner. Depos. 2011, 46, 881–903. [Google Scholar] [CrossRef]
- dos Santos Alves, K.; Barrios Sánchez, S.; Gómez Barreiro, J.; Merinero Palomares, R.; Compaña Prieto, J.M. Morphological and compositional analysis of alluvial gold: The Fresnedoso gold placer (Spain). Ore Geol. Rev. 2020, 121, 103489. [Google Scholar] [CrossRef]
- Ketchaya, B.Y.; Dong, G.; Santosh, M.; Lemdjou, Y.B. Microchemical signatures of placer gold grains from the Gamba district, northern Cameroon: Implications for possible bedrock sources. Ore Geol. Rev. 2022, 141, 104640. [Google Scholar] [CrossRef]
- Cailleux, A.; Tricart, J. Initiation à l’étude des Sables et des Galets; Centre de documentation Universitaire: Paris, France, 1959; Volume I Texte, 376p. [Google Scholar]
- Herail, G.; Fornari, M.; Viscarra, G.; Miranda, V. Morphological and chemical evolution of gold grains during the formation of a polygenic fluviatile placer: The Mio-Pleistocene Tipuani placer (Andes, Bolivie). Chron. Rech. Minière 1990, 500, 41–49. [Google Scholar]
- Chapman, R.J.; Mortensen, J.K. Characterization of gold mineralization in the Northern Cariboo Gold District, British Columbia, Canada, through integration of compositional studies of lode and detrital gold with historical placer production: A template for evaluation of orogenic gold districts. Econ. Geol. 2016, 111, 1321–1345. [Google Scholar] [CrossRef]
- Xia, Q.X.; Zhou, L.G. Different origins of garnet in high pressure to ultrahigh pressure metamorphic rocks. J. Asian Earth Sci. 2017, 145, 130–148. [Google Scholar] [CrossRef]
- Caddick, M.J.; Kohn, M.J. Garnet: Witness to the evolution of destructive plate boundaries. Elements 2013, 9, 427–432. [Google Scholar] [CrossRef]
- Winter, J.D. Principles of Igneous and Metamorphic Petrology, 2nd ed.; Pearson: Harlow, UK, 2014; 737p. [Google Scholar]
- Drăgușanu, S.; Tămaș, C.G.; Andrii, M.P. A first record of alluvial gold in the Olănești and Cheia rivers, Southern Carpathians, Romania. Geol. Q. 2024, 68, 4. [Google Scholar] [CrossRef]
- Bailly, L.; Tămaș, C.G.; Minuț, A. Te-rich argyrodite occurrence in Roșia Montană ore deposit, Apuseni Mountains, Romania. Comptes Rendus Geosci. 2005, 337, 755–762. [Google Scholar] [CrossRef]
- Tămaş, C.G.; Bailly, L.; Ghergari, L.; O’Connor, G.; Minuţ, A. New occurrence of tellurides and argyrodite at Rosia Montana, Apuseni Mountains, Romania and their metallogenetic significance. Can. Mineral. 2006, 44, 367–383. [Google Scholar] [CrossRef]
- Tămaș, C.G.; Andrii, M.P.; Kovács, R.; Drăgușanu, S.; Cauuet, B. Sphalerite composition in low- and intermediate-sulfidation epithermal ore bodies from the Roșia Montana Au-Ag ore deposit, Apuseni Mountains, Romania. Minerals 2021, 11, 634. [Google Scholar] [CrossRef]
- Tămaş, C.G. Endogenous Breccia Structures (Breccia Pipe—Breccia Dyke) and the Petrometallogeny of the Roşia Montană Deposit (Metaliferi Mountains, Romania); Editura Casa Cărţii de Ştiinţă: Cluj-Napoca, Romania, 2007; 230p. (In Romanian) [Google Scholar]
- Pop, D.; Ionescu, C.; Forray, F.; Tămaş, C.G.; Benea, M. “Transylvanian gold” of hydrothermal origin: An EMPA study in an archaeological provenancing perspective. Eur. J. Mineral. 2011, 23, 911–923. [Google Scholar] [CrossRef]
- Bedelean, H.; Bedelean, A. Contributions to the study of the alluvial gold from Valea Pianului Area (Alba District). Stud. Univ. Babeș Bolyai Geol. 2001, 46, 161–169. [Google Scholar] [CrossRef]
- Brueckner, S.M.; Kline, A.K.; Bilenker, L.D.; Poole, J.; Whitney, M.S. Mineral chemistry and sulfur isotope geochemistry from tonalite-hosted, gold-bearing quartz veins at Hog Mountain, Southwestern Appalachians: Implications for gold precipitation mechanism, sulfur source, and genesis. Econ. Geol. 2021, 116, 357–388. [Google Scholar] [CrossRef]
- Schreefel, R.; Steffen, G.H.; Davy’s, C.; Robinson, J.A.; Thébaud, N.; Fisher, C.M.; Roberts, M.P.; Martin, L.A.J.; Schoneveld, L.E.; Creaser, R.A. Granitoid-hosted orogenic gold mineralization: Genetic constraints on the 7.4 Moz Archean Gruyere gold deposit, Yilgarn Craton, Western Australia. Econ. Geol. 2025, 120, 171–203. [Google Scholar] [CrossRef]
- Phili, K.; Betsi, T.B.; Kelepile, T.; Takahashi, R.; Mokane, L. Mineralogy and geochemistry of the Mupane and Shashe gold deposits of the Tati Greenstone Belt (NE Botswana): Implications for mineral deposit models and exploration. Econ. Geol. 2024, 119, 551–571. [Google Scholar] [CrossRef]
Figure 1.
Simplified geology of Romania [21, with changes], with the major metallogenic districts, Baia Mare (north-west), Apuseni Mountains (west central) and Banat (western part of the Southern Carpathians); the black rectangle located south-south-west of Suceava town corresponds to the Baia perimeter.
Figure 3.
Binocular microscope images of the native gold grains from location #1: (A,C,E)–the gold grains G1 (subdiscoidal), G2 (spheroidal), and G3 (discoidal), with a rounded appearance; (B,D,F)–detail of (A,C,E) (focus on white rectangle) showing remains of quartz crystals attached to the native gold grain.
Figure 4.
Selected binocular microscope images of native gold grains from location #2 (A) and location #3 (B). Two native gold grains have attached quartz crystal fragments (Qz), as indicated by arrows. A stained spot is visible on another native gold grain.
Figure 4.
Selected binocular microscope images of native gold grains from location #2 (A) and location #3 (B). Two native gold grains have attached quartz crystal fragments (Qz), as indicated by arrows. A stained spot is visible on another native gold grain.
Figure 5.
Histograms of particle dimensions (length and width) of gold grains from locations #2 (A,B) and #3 (C,D).
Figure 5.
Histograms of particle dimensions (length and width) of gold grains from locations #2 (A,B) and #3 (C,D).
Figure 6.
Microphotographs in plane-polarized reflected light of gold grains with the EPMA point analysis indicated by blue dots. The label of each analyzed gold grain is indicated (G1 to G7); G1 to G3 are from location #1; G4 to G7 are from location #2; abbreviations: Gn—galena; Hem—hematite; Ilm—ilmenite; Mag—magnetite; Qz—quartz; Zrn—zircon. (A) Gold grain G1 hosting galena inclusion; (B) galena and ilmenite inclusions hosted by the gold grain G1; (C) quartz and hematite hosted by the gold grain G1; (D) partial view of the border of the gold grain G2; (E) irregular border of the gold grain G3, which hosts a galena inclusion; (F) quartz, hematite, and zircon related to the gold grain G3; (G) general view of the gold grain G4; (H) gold grains G5 and G6 and magnetite grains from the pan concentrate; (I) gold grain G7 and magnetite grains from the pan concentrate.
Figure 7.
Microphotographs in plane-polarized reflected light (and H in cross-polarized reflected light) of gold grains with the EPMA point analysis indicated by blue dots. The label of each analyzed gold grain is indicated (G8 to G16); G8 and G9 are from location #2; G10 to G16 are from location #3; abbreviations: Mag—magnetite; Qz—quartz. (A) Gold grains G8 and G9 and magnetite grains from the pan concentrate; (B) rounded gold grain G10; (C) elliptic shape of the gold grain G11; (D) gold grain G12 showing sinuous border; (E) gold grain 13 showing partial folded shape; (F) folded gold grain G14; (G) and (H) sponge-like gold grain G15 hosting quartz grain inclusion; (I) partly dismembered elongate gold grain G16.
Figure 8.
Plot of the Au and Ag content of the native gold grains (G1 to G16) from the Baia occurrence.
Figure 8.
Plot of the Au and Ag content of the native gold grains (G1 to G16) from the Baia occurrence.
Figure 9.
Plot of the fineness of each gold grain as determined using EPMA results.
Figure 9.
Plot of the fineness of each gold grain as determined using EPMA results.
Figure 10.
Selected binocular images of native gold grains (A) and garnets–almandine (B) from location #2. Note the quartz attached to the native gold grain in the center of image (A).
Figure 10.
Selected binocular images of native gold grains (A) and garnets–almandine (B) from location #2. Note the quartz attached to the native gold grain in the center of image (A).
Figure 11.
Plot of the magnetic and non-magnetic fraction within the concentrate (A) and for each screen size (B) for location #2.
Figure 11.
Plot of the magnetic and non-magnetic fraction within the concentrate (A) and for each screen size (B) for location #2.
Figure 12.
Plot of the magnetic and non-magnetic fraction within the concentrate (A) and for each screen size (B) for location #3.
Figure 12.
Plot of the magnetic and non-magnetic fraction within the concentrate (A) and for each screen size (B) for location #3.
Figure 13.
The variation in the Au content across the gold grain G10 from location #3. The number from the abscissa axis of the present figure corresponds to the number of the point analysis in
Figure 7B, i.e., rim–50, 54, 55, and 59; center–51, 52, 53, 56, 57, and 58.
Figure 13.
The variation in the Au content across the gold grain G10 from location #3. The number from the abscissa axis of the present figure corresponds to the number of the point analysis in
Figure 7B, i.e., rim–50, 54, 55, and 59; center–51, 52, 53, 56, 57, and 58.
Figure 15.
Silver content range (in wt%) of the native gold from Hog Mountain, USA [
52], Northern Cariboo Gold District, Canada [
41], Gruyere deposit, Australia [
53], Tati greenstone belt, Botswana [
54], and Baia.
Figure 15.
Silver content range (in wt%) of the native gold from Hog Mountain, USA [
52], Northern Cariboo Gold District, Canada [
41], Gruyere deposit, Australia [
53], Tati greenstone belt, Botswana [
54], and Baia.
Table 1.
The EPMA analytical conditions, i.e., energy lines, accelerating voltage (in kV), electron beam current (in nA), and the mean value of the detection limits.
Table 1.
The EPMA analytical conditions, i.e., energy lines, accelerating voltage (in kV), electron beam current (in nA), and the mean value of the detection limits.
| Dataset Toulouse (France) |
|---|
| Element | Energy Line | Standard | kV | nA | Detection Limit (wt%) |
|---|
| Au | Ma | gold metal | 15 | 20 | 0.39 |
| Cu | Ka | chalcopyrite | 15 | 20 | 0.16 |
| Ag | La | silver metal | 15 | 20 | 0.15 |
| As | La | arsenopyrite | 15 | 20 | 0.08 |
| Co | Ka | cobalt | 15 | 20 | 0.13 |
| Ni | Ka | nickel | 15 | 20 | 0.12 |
| Se | La | selenium | 15 | 20 | 0.09 |
| Mo | La | molybdenum | 15 | 20 | 0.11 |
| Te | La | HgTe | 15 | 20 | 0.21 |
| Bi | Ma | bismuth | 15 | 20 | 0.29 |
| Cd | La | cadmium | 15 | 20 | 0.11 |
| S | Ka | chalcopyrite | 15 | 20 | 0.08 |
| Pb | Ma | PbS | 15 | 20 | 0.51 |
| Sb | La | SbS | 15 | 20 | 0.09 |
| Fe | Ka | chalcopyrite | 15 | 20 | 0.12 |
| Zn | Ka | ZnS | 15 | 20 | 0.21 |
| Dataset Cluj-Napoca (Romania) |
| Element | Energy Line | Standard | kV | nA | Detection Limit (wt%) |
| Au | Ma | gold metal | 15 | 10 | 0.80 |
| Cu | Ka | copper metal | 15 | 10 | 0.32 |
| Ag | La | AgBr * | 15 | 10 | 0.25 |
Table 2.
Summary of the number of recovered gold grains per location, the number of gold grains analyzed by EPMA, and the number of EPMA valid point analyses.
Table 2.
Summary of the number of recovered gold grains per location, the number of gold grains analyzed by EPMA, and the number of EPMA valid point analyses.
| Location | Recovered
Gold Grains | Gold Grains Analyzed by EPMA | EPMA
Valid Points | EPMA
Dataset |
|---|
| #1 | 3 | 3 | 24 | Toulouse (France) |
| #2 | 67 | 6 | 25 | Cluj-Napoca (Romania) |
| #3 | 45 | 7 | 56 | Cluj-Napoca (Romania) |
| TOTAL | 115 | 16 | 105 | - |
Table 3.
The summary of the morphological analysis of the gold grains gathered in the Baia occurrence.
Table 3.
The summary of the morphological analysis of the gold grains gathered in the Baia occurrence.
| Location | Sphericity | Roundness | Smallest Size (mm) | Largest Size (mm) | Mean Size (mm) |
|---|
| #1 | discoidal, subdiscoidal, spheroidal | rounded | 3.00 × 1.70 | 5.00 × 2.80 | 3.93 × 2.50 |
| #2 | discoidal, subdiscoidal | rounded, intermediate | 0.17 × 0.12 | 1.04 × 0.60 | 0.43 × 0.30 |
| #3 | discoidal, subdiscoidal, spheroidal, elongated | rounded, intermediate | 0.26 × 0.15 | 2.92 × 1.42 | 1.01 × 0.56 |
Table 4.
The chemical composition range of the native gold grains (in wt%) from Baia; the significance of “BDL” is “below detection limit”.
Table 4.
The chemical composition range of the native gold grains (in wt%) from Baia; the significance of “BDL” is “below detection limit”.
| Location | Au Range (wt%) | Ag Range (wt%) | Cu Range (wt%) |
|---|
| #1 | 96.74–98.89 | 1.04–2.61 | BDL-0.21 |
| #2 | 93.28–99.91 | 0.56–6.19 | BDL-0.38 |
| #3 | 92.59–99.00 | 0.80–5.86 | BDL-0.60 |
Table 5.
Mean values (in wt%) for Au, Ag, and Cu, the chemical formula for each gold grain, and the equivalent calculated gold fineness. The figures corresponding to the G9 grain are not mean values, as only one valid analytical point was obtained for this grain. The results for each EPMA point are given in the SM1.
| Location | Gold Grain | Au | Ag | Cu | Total | Chemical Formula | Fineness |
|---|
| #1 | G1 | 97.32 | 2.56 | BDL | 99.98 | Au0.95Ag0.05 | 974 |
| G2 | 97.19 | 2.11 | BDL | 99.46 | Au0.96Ag0.04 | 979 |
| G3 | 98.01 | 1.12 | BDL | 99.28 | Au0.98Ag0.02 | 989 |
| #2 | G4 | 95.67 | 3.10 | BDL | 98.95 | Au0.94Ag0.06 | 969 |
| G5 | 97.10 | 2.65 | BDL | 99.85 | Au0.95Ag0.05 | 973 |
| G6 | 97.13 | 2.65 | BDL | 99.97 | Au0.95Ag0.05 | 973 |
| G7 | 96.50 | 2.77 | BDL | 99.40 | Au0.95Ag0.05 | 972 |
| G8 | 97.02 | 2.72 | BDL | 99.79 | Au0.95Ag0.05 | 973 |
| G9 | 93.28 | 6.19 | 0.32 | 99.79 | Au0.89Ag0.11 | 938 |
| #3 | G10 | 97.11 | 2.54 | BDL | 99.77 | Au0.95Ag0.05 | 975 |
| G11 | 96.42 | 3.13 | BDL | 99.67 | Au0.94Ag0.06 | 969 |
| G12 | 96.58 | 2.40 | BDL | 99.06 | Au0.96Ag0.04 | 976 |
| G13 | 96.07 | 2.88 | 0.50 | 99.44 | Au0.95Ag0.05 | 971 |
| G14 | 97.90 | 2.26 | BDL | 100.25 | Au0.96Ag0.04 | 977 |
| G15 | 94.86 | 4.88 | BDL | 99.88 | Au0.91Ag0.09 | 951 |
| G16 | 92.95 | 5.81 | BDL | 98.86 | Au0.90Ag0.10 | 941 |
Table 6.
The range of Au and Ag content (EPMA results in wt%) of the native gold grains from Baia (present study), Olănești alluvial gold [
45], and Roșia Montană primary gold [
47,
49,
50].
Table 6.
The range of Au and Ag content (EPMA results in wt%) of the native gold grains from Baia (present study), Olănești alluvial gold [
45], and Roșia Montană primary gold [
47,
49,
50].
| Occurence | Au Range | Ag Range |
|---|
| Baia | 92.59–99.91 | 0.56–6.19 |
| Olănești | 78.74–99.30 | 2.00–20.77 |
| Roșia Montană | 47.39–87.78 | 12.56–51.48 |
| Disclaimer/Publisher’s Note: The statements, opinions and data contained in all publications are solely those of the individual author(s) and contributor(s) and not of MDPI and/or the editor(s). MDPI and/or the editor(s) disclaim responsibility for any injury to people or property resulting from any ideas, methods, instructions or products referred to in the content. |
© 2025 by the authors. Licensee MDPI, Basel, Switzerland. This article is an open access article distributed under the terms and conditions of the Creative Commons Attribution (CC BY) license (https://creativecommons.org/licenses/by/4.0/).

