Article

Identifying New Copper Mineralization via Multispectral Remote Sensing (MSRS) and Short-Wave Infrared (SWIR) Spectral Analysis in Dingyang, Western Gangdese Belt, Xizang

1
School of Earth Sciences and Resources, China University of Geosciences, Beijing 100083, China
2
No. 2 Geological Party, Bureau of Geology and Mineral Exploration and Development, Lhasa 850000, China
3
Tibet Julong Copper Industry Limited Company, Lhasa 850000, China
*
Authors to whom correspondence should be addressed.
Minerals 2025, 15(10), 1045; https://doi.org/10.3390/min15101045
Submission received: 14 August 2025 / Revised: 10 September 2025 / Accepted: 28 September 2025 / Published: 1 October 2025

Abstract

The Gangdese metallogenic belt (GMB), spanning nearly 2000 km across central Tibet, represents the primary copper–polymetallic metallogenic belt in Tibet and a world-class porphyry copper province. However, extreme high-altitude conditions, ecological fragility, and limited accessibility in western GMB have significantly constrained the efficacy of conventional exploration methods. Identifying effective mineralogical indicators and rapidly delineating mineralization–hydrothermal centers within this metallogenic system remain critical challenges for exploration geologists. This study integrates multispectral remote sensing (MSRS; Sentinel-2) with short-wave infrared (SWIR) spectral analysis to establish mineral spectroscopic exploration indicators for the periphery of the Zhunuo porphyry copper ore-concentrated area. Principal Component Analysis (PCA) and band ratio techniques were employed to delineate remote sensing alteration anomalies, followed by SWIR spectral features to identify mineralization–hydrothermal centers. Hydrothermal alteration in the study area is dominated by sericite, chlorite, and epidote, with subordinate carbonate and sulfate minerals. Multispectral anomalies (Al-OH, ferric contamination, and carbonate alterations) in the Dingyang area exhibit intensity and compositional patterns comparable to those of the Cimabanshuo, Beimulang, and Zhigunong deposits, indicating high mineralization potential. SWIR analysis identified sericite-based exploration indicators (Pos2200 < 2203 nm, Dep2200 > 0.3, SWIR-IC > 1.6). A Spectral Feature-Based Geological Content Method (SFGCM) model was developed to delineate mineralization–hydrothermal centers, revealing new malachite and azurite mineralization in the Dingyang area. The MSRS-SWIR provides a novel perspective for applying spectroscopy to rapidly identify porphyry copper mineralized hydrothermal centers in high-altitude, ecologically fragile areas.

1. Introduction

The Gangdese copper–polymetallic belt exhibits a distinctive metallogenic setting where multistage magmatism linked to continental collision orogenesis facilitates enrichment of metals such as copper, molybdenum, and gold [1]. Significant exploration breakthroughs have been achieved in the east (e.g., Qulong, Jiama, Tinggong, Gangjiang, Jiru and Xiongcun); however, effective exploration methods in the west remain constrained by marked metallogenic disparities and high-altitude topography coupled with harsh environmental conditions [2,3]. Although the giant Zhunuo porphyry deposit has been identified in the western Gangdese belt, the exploration potential of surrounding and adjacent areas remains uncertain [3,4,5,6]. Therefore, developing novel, eco-friendly, and efficient integrated exploration approaches is urgently required.
Remote sensing technology has become an indispensable tool in mineral exploration for acquiring geological information and enabling regional-scale targeting, owing to its extensive spatial coverage and operational efficiency [7,8,9,10,11,12]. Multispectral remote sensing (MSRS) acquires surface reflectance data across the visible to short-wave infrared spectral range. It is widely applied in regional geological mapping, alteration anomaly extraction, and prospective mineralization targeting [13]. In multispectral remote sensing data sources, Sentinel 2 has unique advantages over other remote sensing data. Because it has key bands dedicated to iron staining and hydroxyl/carbonate mineral identification in the range of visible light to short-wave infrared, as well as having unique advantages of a 20 m spatial resolution, 5-day revisit period and free range across the world, it is an ideal data source for efficient alteration information extraction. While its spatial resolution (10 m, 20 m, and 60 m) limits pixel-level accuracy for fine-scale mineral mapping, the combination of visible, near-infrared (NIR), and SWIR bands supports detection of hydrothermal alteration zones through spectral pattern analysis [14]. Principal Component Analysis (PCA), a widely used remote sensing technique for alteration extraction, finds extensive application in mineral exploration [15,16]. In recent years, short-wave infrared (SWIR) spectroscopy has become the core means of mineral exploration. This technology achieves rapid and accurate identification and quantitative analysis of minerals by capturing the characteristic absorption bands of hydrothermal altered minerals in the range of 1300–2500 nm, which significantly improves the sensitivity of mineral identification and hydrothermal alteration evaluation. Combined with the spatial distribution of ore bodies and the alteration zoning model, the researchers constructed an alteration mineral assemblage exploration index system based on SWIR spectroscopy, which effectively improved the efficiency and accuracy of mineral exploration in deep and covered areas [17,18]. For example, Pos2200 and SWIR-IC indicators successfully delineated a high-grade gold mineralization zone [19]; Pos2250 can accurately indicate an ore body boundary [20]; and the combination of Pos2200, Dep2200 and SWIR-IC was established as a near-ore indicator [21]. Consequently, the MSRS-SWIR technological integration not only enhances prospecting efficiency for porphyry mineralization systems but also improves the identification accuracy of mineralization–hydrothermal centers in the western Gangdese belt.
To assess porphyry copper mineralization potential in the western Gangdese belt, we employ MSRS to delineate regional alteration anomalies, followed by SWIR spectroscopy to precisely identify altered mineral species. A Spectral Feature-Based Geological Connotation Method is established to construct spectral exploration indicators for porphyry copper deposits, enabling delineation of mineralization–hydrothermal centers.

2. Study Area

The study area is located in the western part of the Gangdise metallogenic belt in Tibet. The Gangdise metallogenic belt is located in the southern Lhasa terrane, with an east–west extension length of more than 1500 Km. The Gangdese belt on the southern margin of the Lhasa terrane experienced the subduction of the Neo-Tethys oceanic crust and triggered extensive magmatic activity. The Miocene is the main copper and molybdenum mineralization period. Many deposits have been formed in the Gangdese belt of the southern Lhasa terrane, including several world-class deposits, such as the three super-large deposits of Qulong, Jiama and Zhunuo–Beimulang, and several large and medium-sized copper deposits, such as Jiru, Xiongcun, Tinggong, Gangjiang, and Demingding [22,23,24,25,26,27,28,29,30,31] (Figure 1).
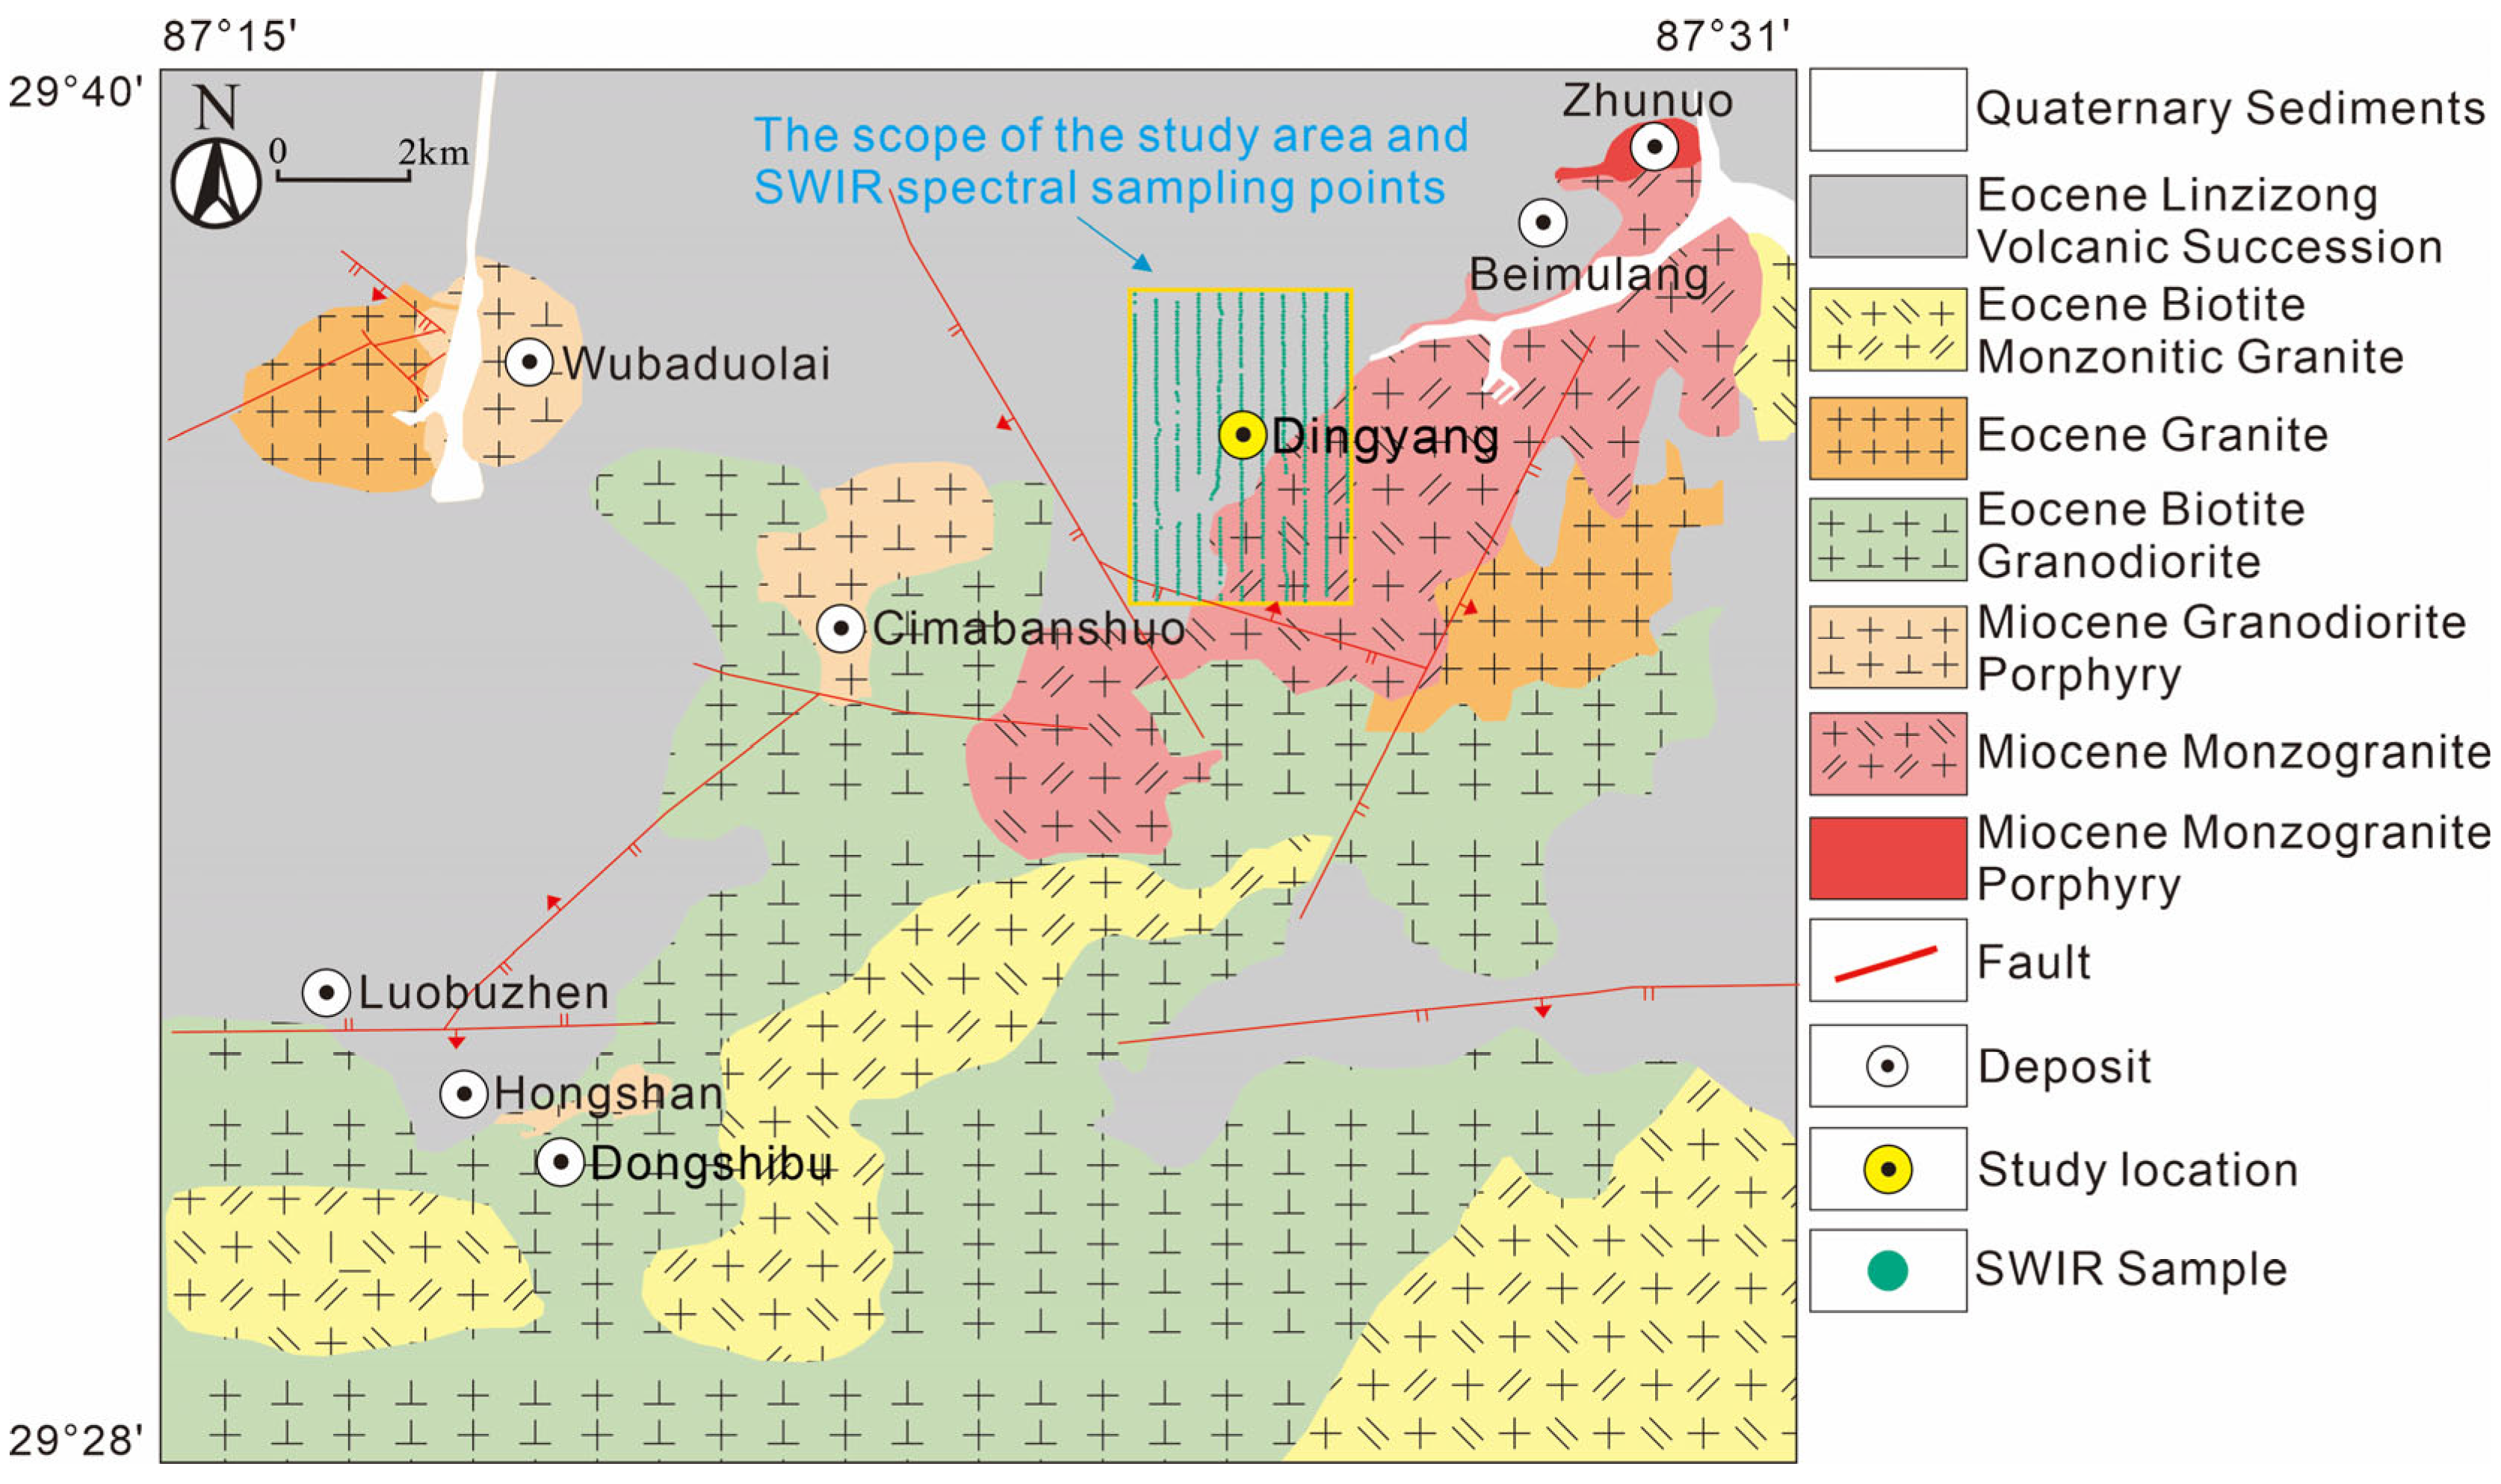
The study area (Dingyang) is located in the Zhunuo ore concentration area. The exposed strata are mainly volcanic rocks of the Linzizong Group, which are mainly exposed in the central and western parts of the study area. They are in intrusive contact with Eocene magmatic rocks in the southeast. Quaternary sediments only appear along valleys and ravines. The strata are generally inclined to the southwest, and the tectonic development is limited. The magmatic rock in the southeastern part is part of the Beimulang composite rock mass, which is biotite monzonitic granite porphyry.

3. Datasets and Methods

3.1. Data Acquisition and Preprocessing

3.1.1. Sentinel 2 Remote Sensing Image

The Sentinel-2 imagery utilized in this study was sourced from the European Space Agency (ESA) Copernicus Data Hub. The specific scene was acquired on 5 February 2025, with <2% cloud cover ensuring optimal feature discriminability and stable spectral response, thereby providing a high-quality dataset for hydrothermal alteration mapping.
The acquired Level-1C product had undergone orthorectification and subpixel-level geometric correction, representing top-of-atmosphere reflectance imagery. To obtain surface reflectance suitable for quantitative analysis, Level-1C data were batch-processed via the Sen2Cor plugin command line to generate atmospherically corrected Level-2A products, eliminating aerosol and water vapor effects. Subsequently, Level-2A imagery was spatially resampled to a uniform 10 m resolution using SNAP software (Version 10.0) and converted to ENVI (Version 5.6) format to facilitate subsequent mineralization alteration information extraction.

3.1.2. SWIR Spectrum

This study integrates detailed field geological surveys with SWIR spectral alteration mapping, including 11 spectral sampling lines. In key target areas, traverses were spaced at 250 m intervals with sampling points every 50 m, yielding 736 samples. Following the principles of typicality and systematic sampling design, comprehensive field investigations were conducted wherein alteration and mineralization characteristics were meticulously recorded at each sampling site, accompanied by the collection of one to three representative rock samples; all site-specific data—including sample ID, type, geographic coordinates, lithological descriptions, alteration assemblages, and mineralization features—were systematically documented using standardized sampling forms, ultimately achieving a high-resolution control point density of 82 points/km2 across the entire study area.
Hyperspectral reflectance data of rock samples were collected using a TerraSpec Halo field-portable hyperspectral spectrometer (ASD Inc., Falls Church, VA, USA), covering the 350–2500 nm spectral range (VNIR: 350–1300 nm; SWIR: 1300–2500 nm) (Table 1). Prior to analysis, samples were surface-cleaned with a brush and air-dried under direct sunlight to eliminate surface moisture. For each sample, three replicate measurements (1 min each) were acquired at spatially distinct, flat surfaces devoid of non-hydroxyl minerals (e.g., quartz) to ensure data accuracy [35]. Measurements were taken under identical illumination conditions, resulting in a total of 2210 high-quality spectral datasets across all samples.

3.2. Methods of Analysis

3.2.1. Multispectral Alteration Anomaly Extraction

In this study, the band ratio method combined with PCA was used to extract alteration information. Firstly, according to the spectral configuration of Sentinel-2 data, the key bands sensitive to altered minerals are selected. Based on the difference in the characteristic absorption and reflection of altered minerals in visible and short-wave infrared bands, Principal Component Analyses and band ratios of various alteration types were constructed, such as the following:
Al-OH alteration was analyzed by PCA using Band2, Band8, Band11 (1610 nm, high reflection region on the left side of Al-OH absorption peak) and Band12 (2190 nm, strong absorption valley covering Al-OH). The band combinations of Band3, Band4, Band8A (865 nm, located at the high reflection peak of Mg-OH) and Band12 (2190 nm, located in the sensitive band range of the absorption valley near 2300 nm of Mg-OH minerals, and reflecting the mixed characteristics of Mg-OH and Al-OH) were used to extract the change in Mg-OH. Given the limited surface vegetation coverage in the study area, vegetation interference is negligible. Consequently, Band3 (green) was selected over Band4 (red) for carbonate alteration analysis. Band12 (2190 nm) is pivotal, as it aligns with the strong absorption valley (~2300 nm) of carbonate minerals, enabling the identification of carbonates through low reflectance values. Band11 (1610 nm), situated near the reflection peak (~1600 nm) of carbonate minerals, forms a pronounced spectral contrast when combined with Band12. Principal Component Analysis (PCA) effectively amplifies this absorption–reflection contrast. Therefore, Bands 3, 8, 11, and 12 were utilized for PCA to enhance carbonate alteration detection. In the ferric contamination anomaly, since Band4 (665 nm) corresponds to the strong absorption valley of Fe3+ and Band2 (492 nm) is at the reflection peak, the Band4/Band2 ratio method is employed to enhance and extract anomaly information, thereby improving the recognition accuracy of ferric contamination anomaly minerals.
Secondly, the constructed ratio image is combined with key bands to implement PCA. Through the feature vector load analysis, the bands or ratios that contribute the most to the alteration information in different principal components are identified, so as to realize the separation of background noise and alteration anomalies.
Finally, by comprehensively discriminating and comparing PCA results with ratio images, we adopted a threshold criterion of ‘μ + 1.5σ’ (where μ denotes the mean value of the relevant principal component image and σ represents the standard deviation). Pixels meeting this criterion were identified as true anomalies containing alteration information. Subsequently, various types of alteration anomaly information were extracted, and the alteration anomaly zones were delineated through spatial superposition analysis.

3.2.2. SWIR Spectral Analysis

The SWIR spectral data were processed using the Spectral Geologist Version 8 (TSG 8) software. The software uses the spectral band position matching algorithm to identify altered minerals and quantifies their relative abundance and other spectral indicators by cross-correlation with the internally verified mineral spectral library. Thus, it can robustly describe the spatial variation of altered mineral assemblages and derive vector indicators for mineral exploration. In this paper, the maps of spectral parameters were made by the ArcGIS10.8 software. The spectral three-dimensional map is based on the Kriging interpolation method and superimposed ASTER GDEM 30M resolution digital elevation data.

4. Result

4.1. Alteration Anomaly Extraction

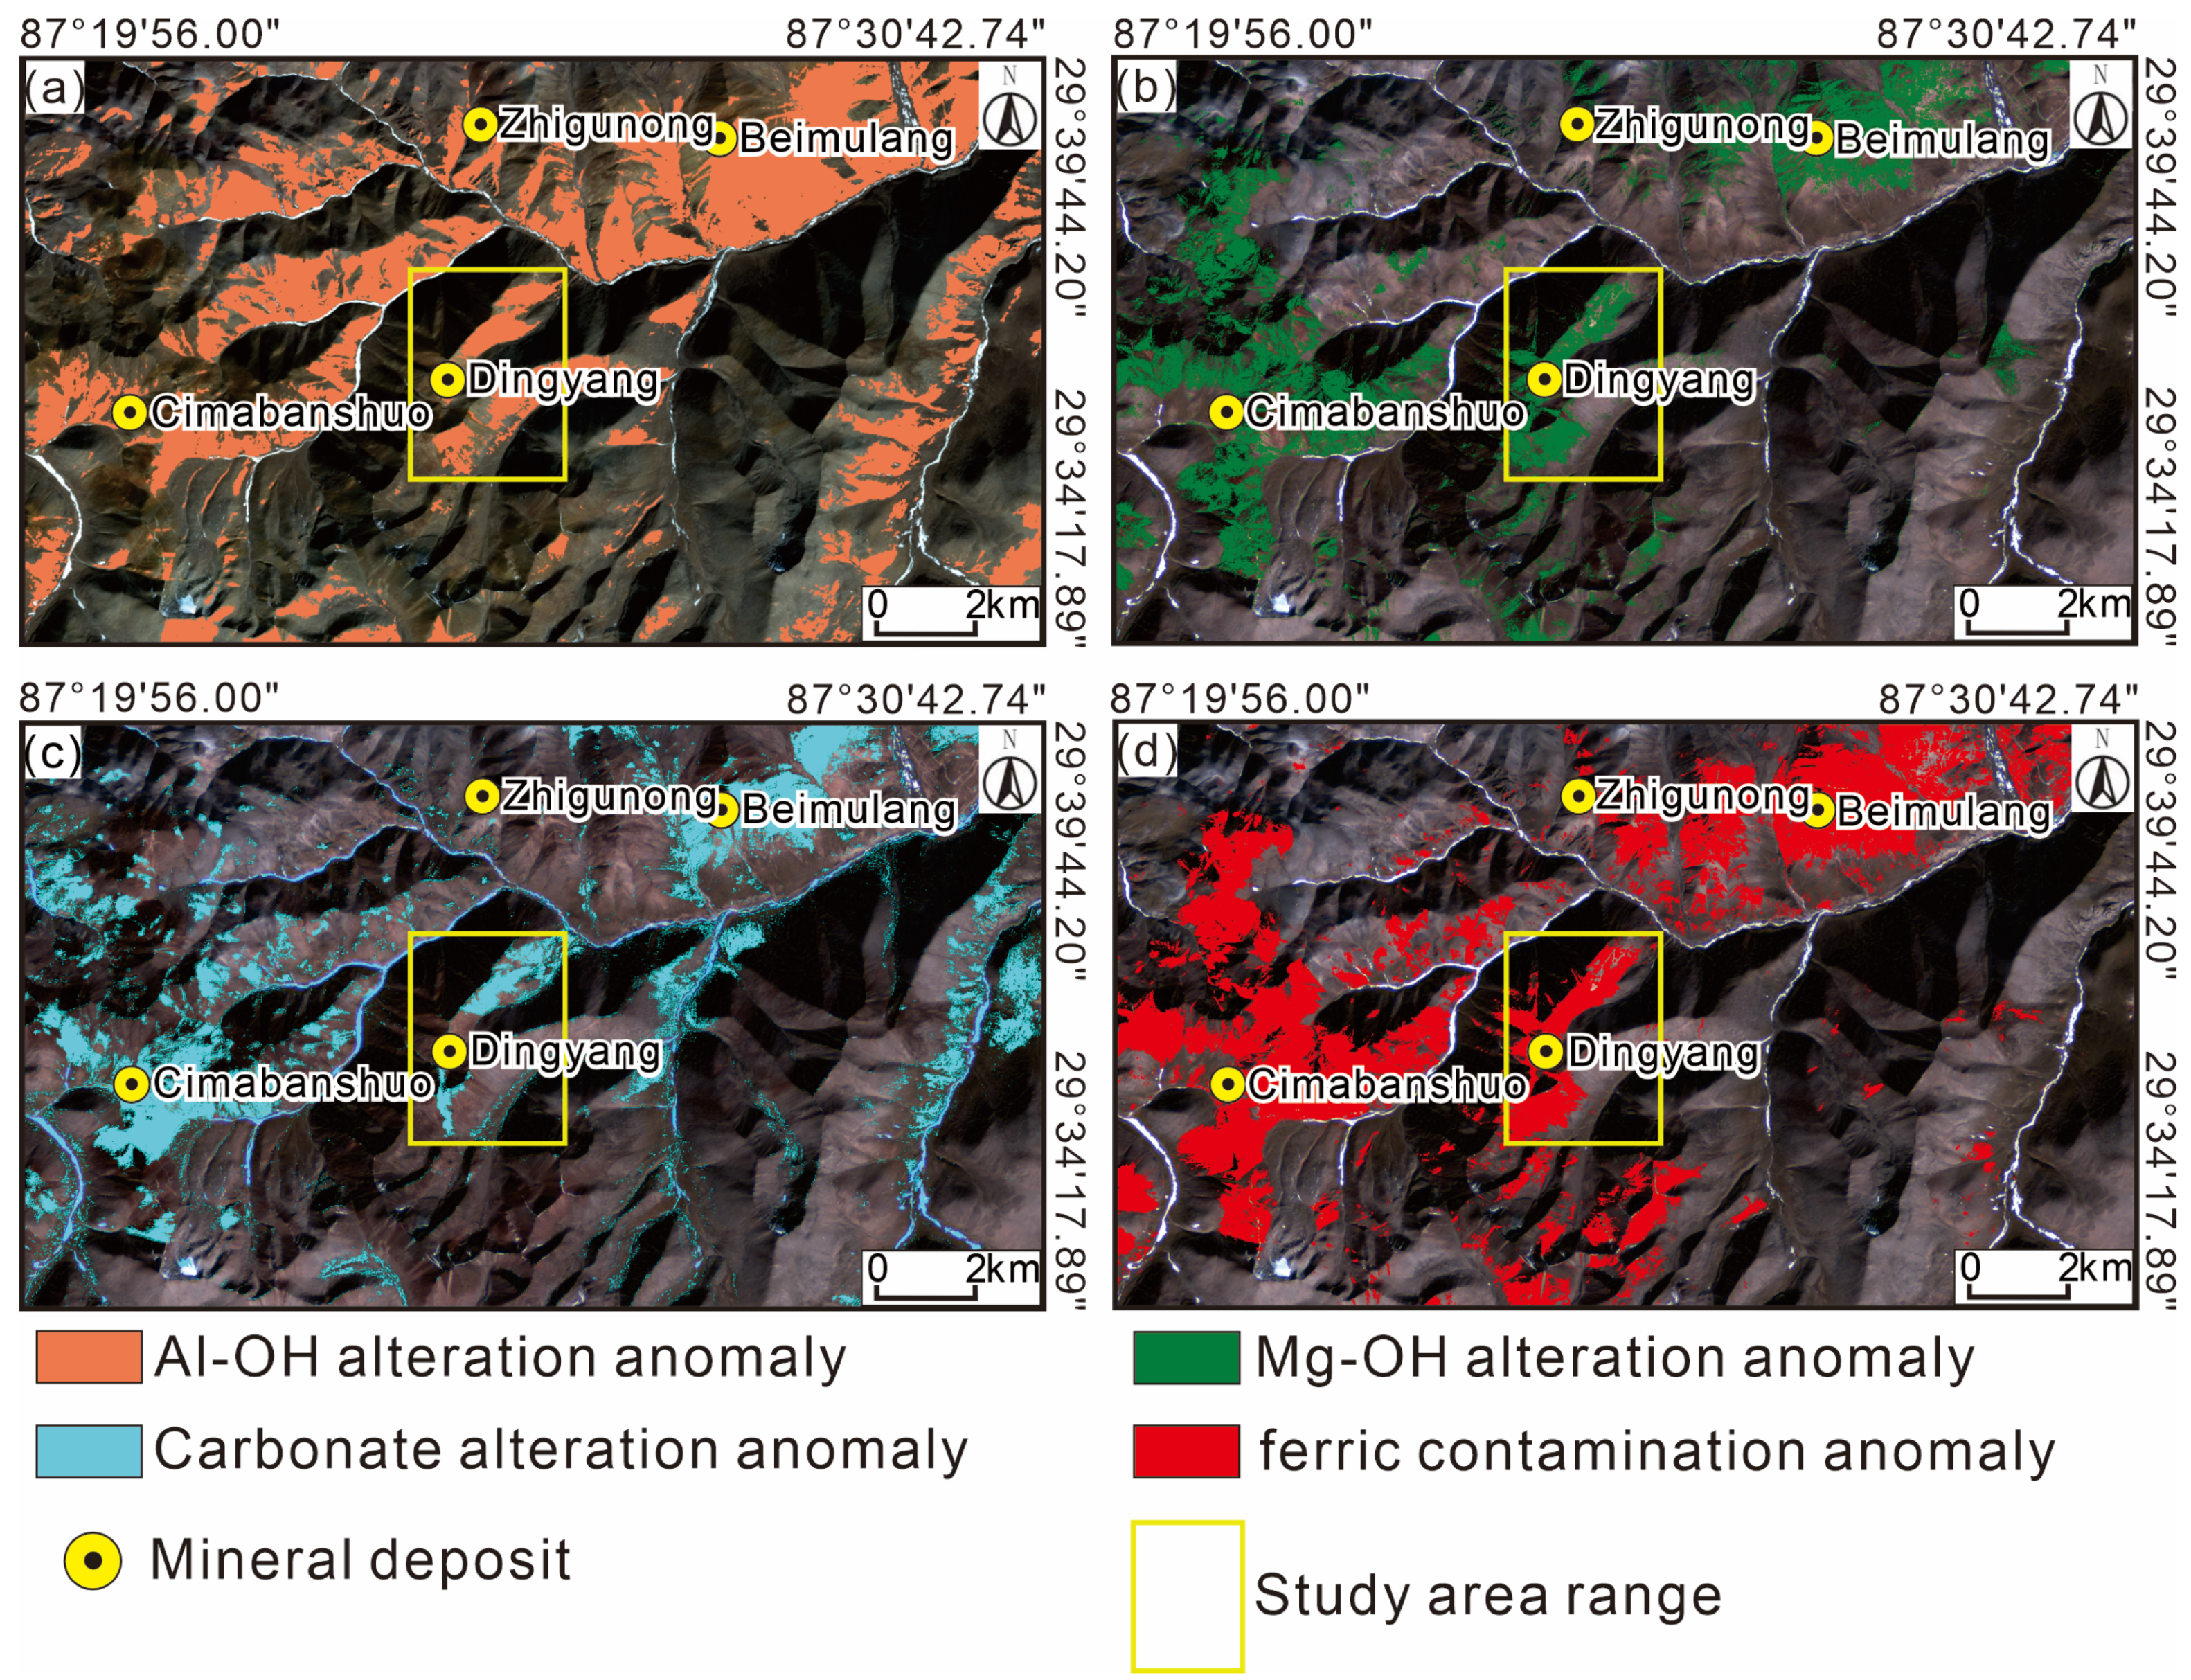
In the extraction of alteration information, the principal component results of Al-OH alteration information show that the band11 load in PC1 is positive and the band12 is negative. The alteration information is concentrated in PCA1 (Table 2), and the threshold 2697 is set to divide its alteration anomaly (Figure 2a). When extracting the Mg-OH alteration information, the band8 A load in PC4 is positive, band12 is negative, the alteration information is concentrated in PCA4 (Table 3), and threshold 123 is set to divide the anomaly (Figure 2b). When extracting carbonate minerals, the band11 load in PC4 is positive and the band12 load is negative, the alteration information is concentrated in PCA4 (Table 4), and the threshold value 210 is set to divide its distribution area (Figure 2c). The results of extracting the band ratio of ferric contamination anomalies were compared and verified by multiple sets of experiments. The threshold was determined to be 1.85, and the pixel ratio reached or exceeded the value, which was determined as the real anomaly information (Figure 2d).
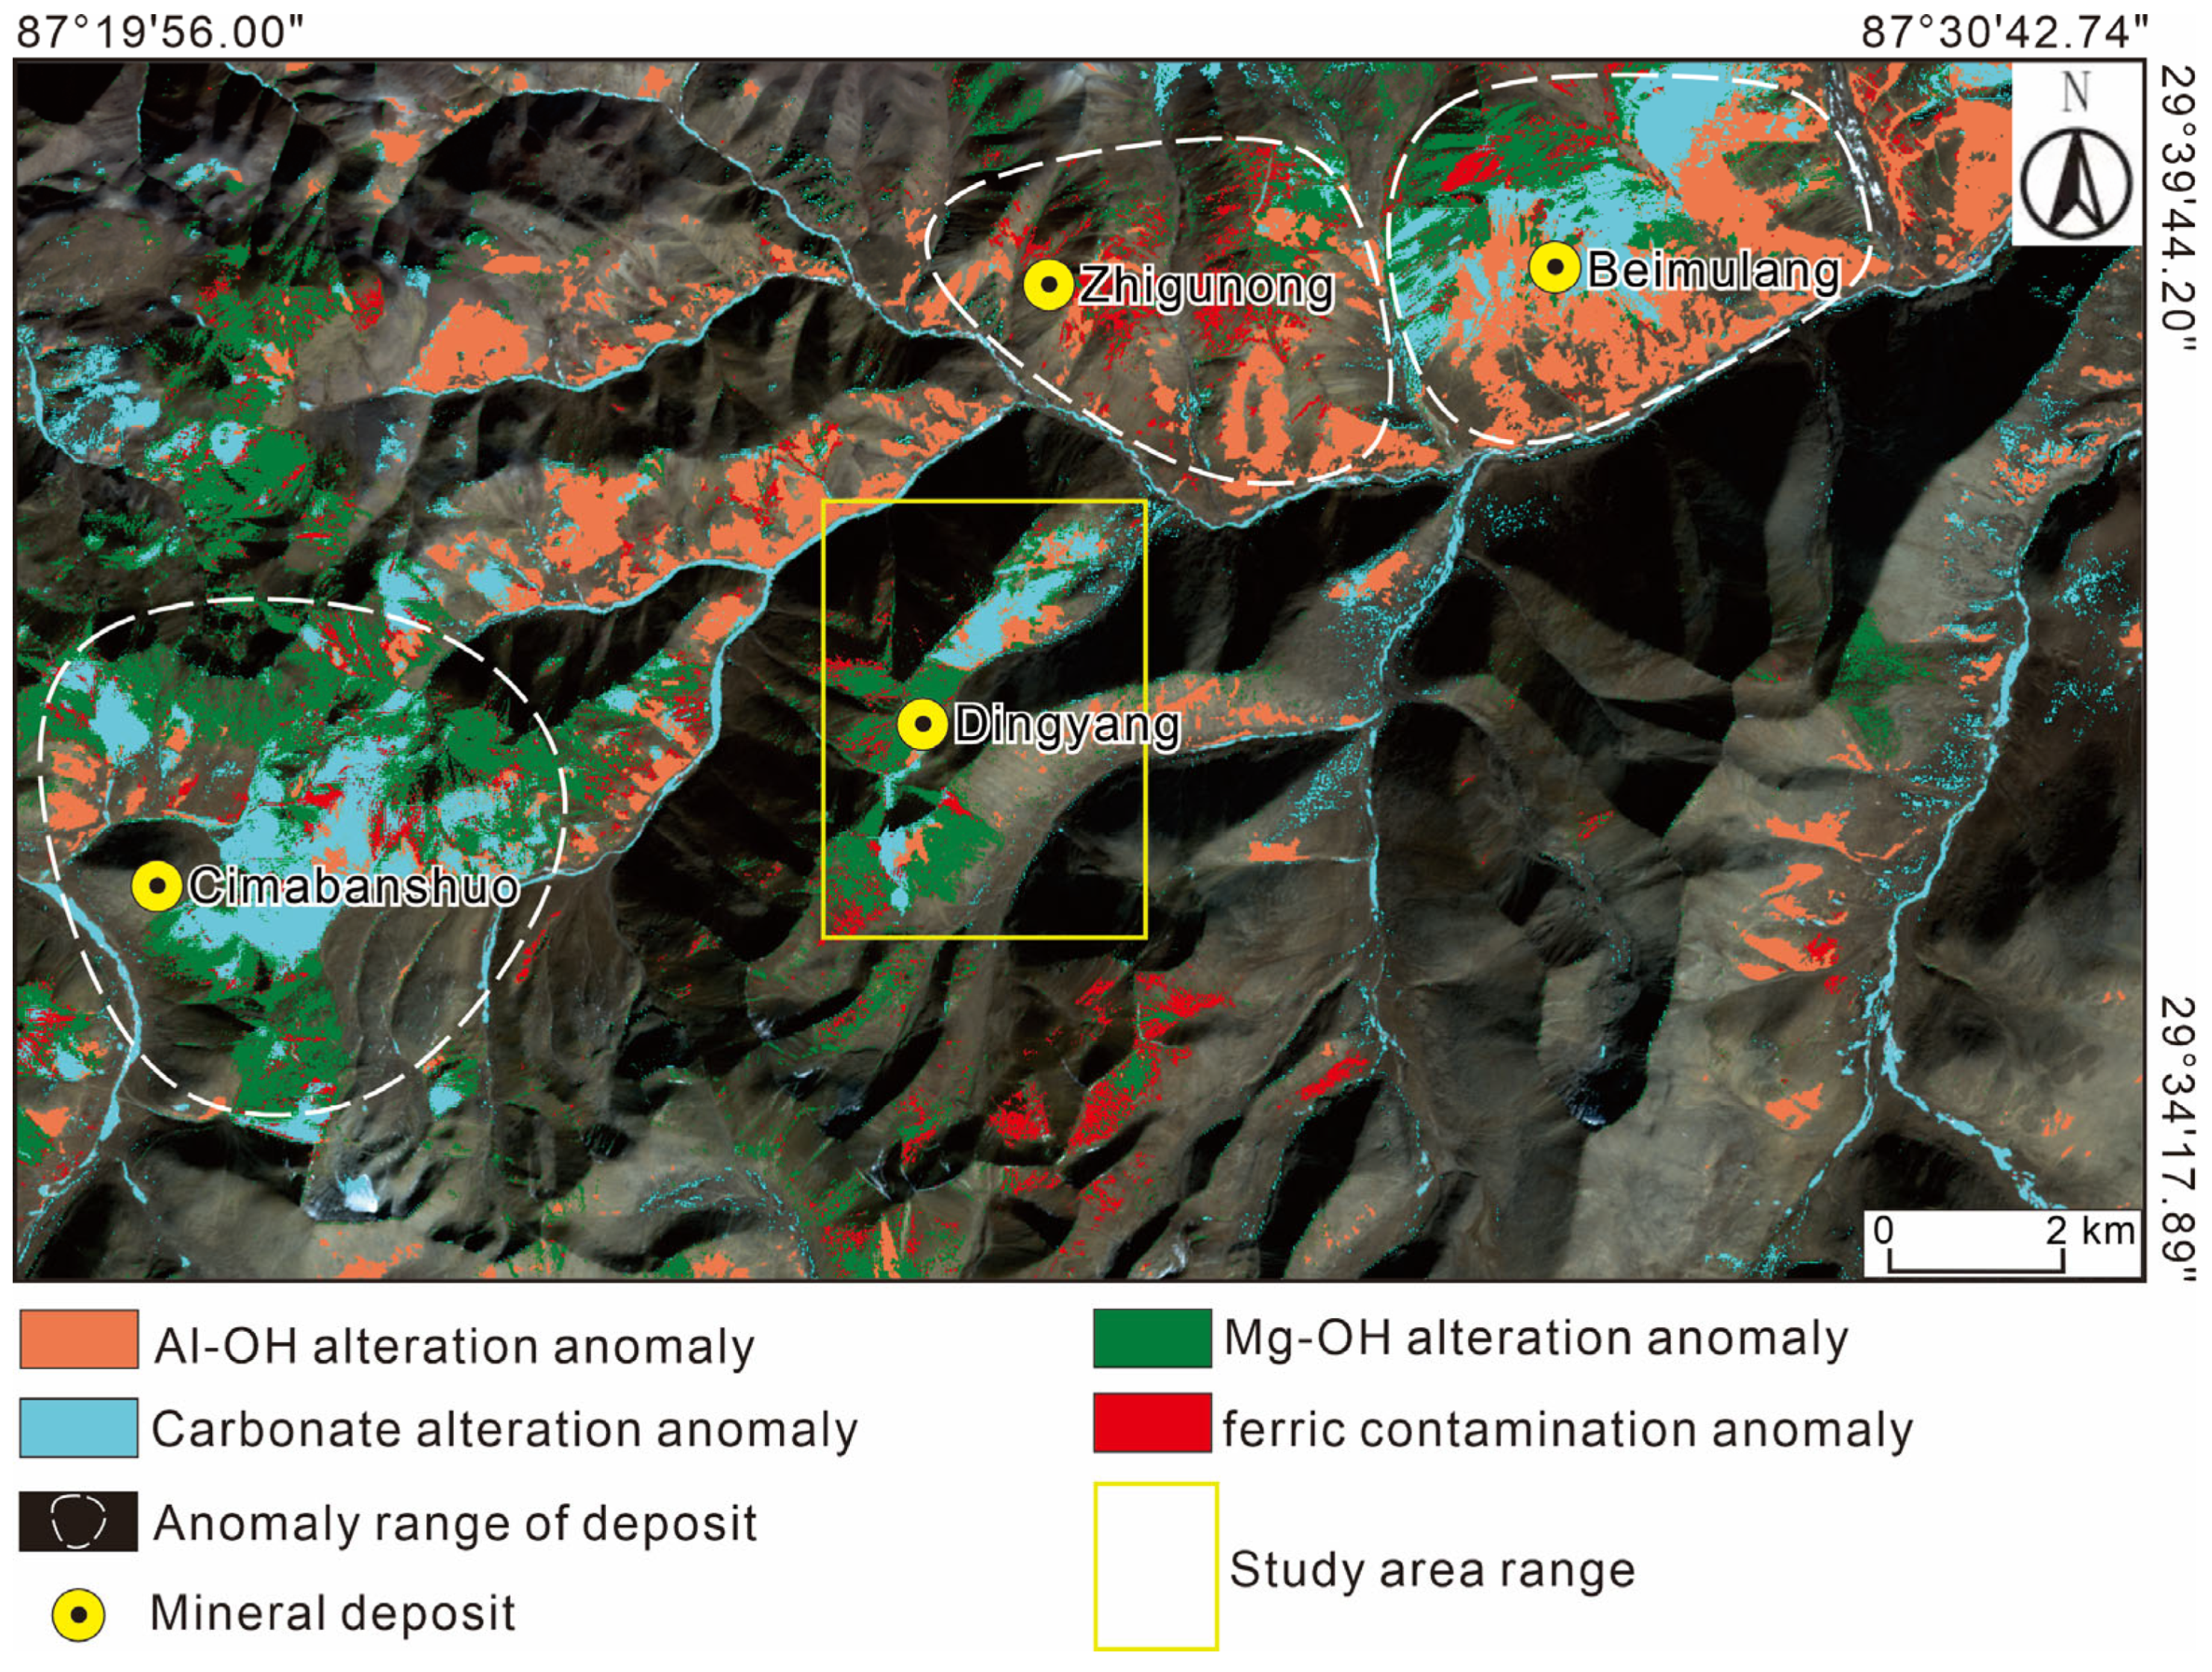
By integrating anomalies of key alteration types—including Al–OH minerals, Mg–OH minerals, carbonate alterations, and ferric contamination anomalies—this study demonstrates that, in addition to well-defined alteration associated with known deposits such as Beimulang, Zhigunong, and Cimabanshuo, the Dingyang area also exhibits significant surface alteration (Figure 3).

4.2. Identification and Distribution of Altered Minerals

A handheld SWIR spectrometer was employed in the Dingyang area to map hydrothermal alteration minerals. A large number of field samples were systematically collected and analyzed through laboratory spectral measurements. The acquired SWIR data were processed using TSG software, resulting in the identification of nineteen alteration minerals, including illite, kaolinite, sericite, paragonite, phengite, montmorillonite, gibbsite, chlorite-group minerals, biotite, phlogopite, amphibole, epidote, tourmaline, ankerite, siderite, magnesite, and jarosite. Relative mineral abundances were estimated based on the absorption depth spectral absorption features. Spatial distribution patterns and alteration intensity variations of key minerals were subsequently delineated across the study area.
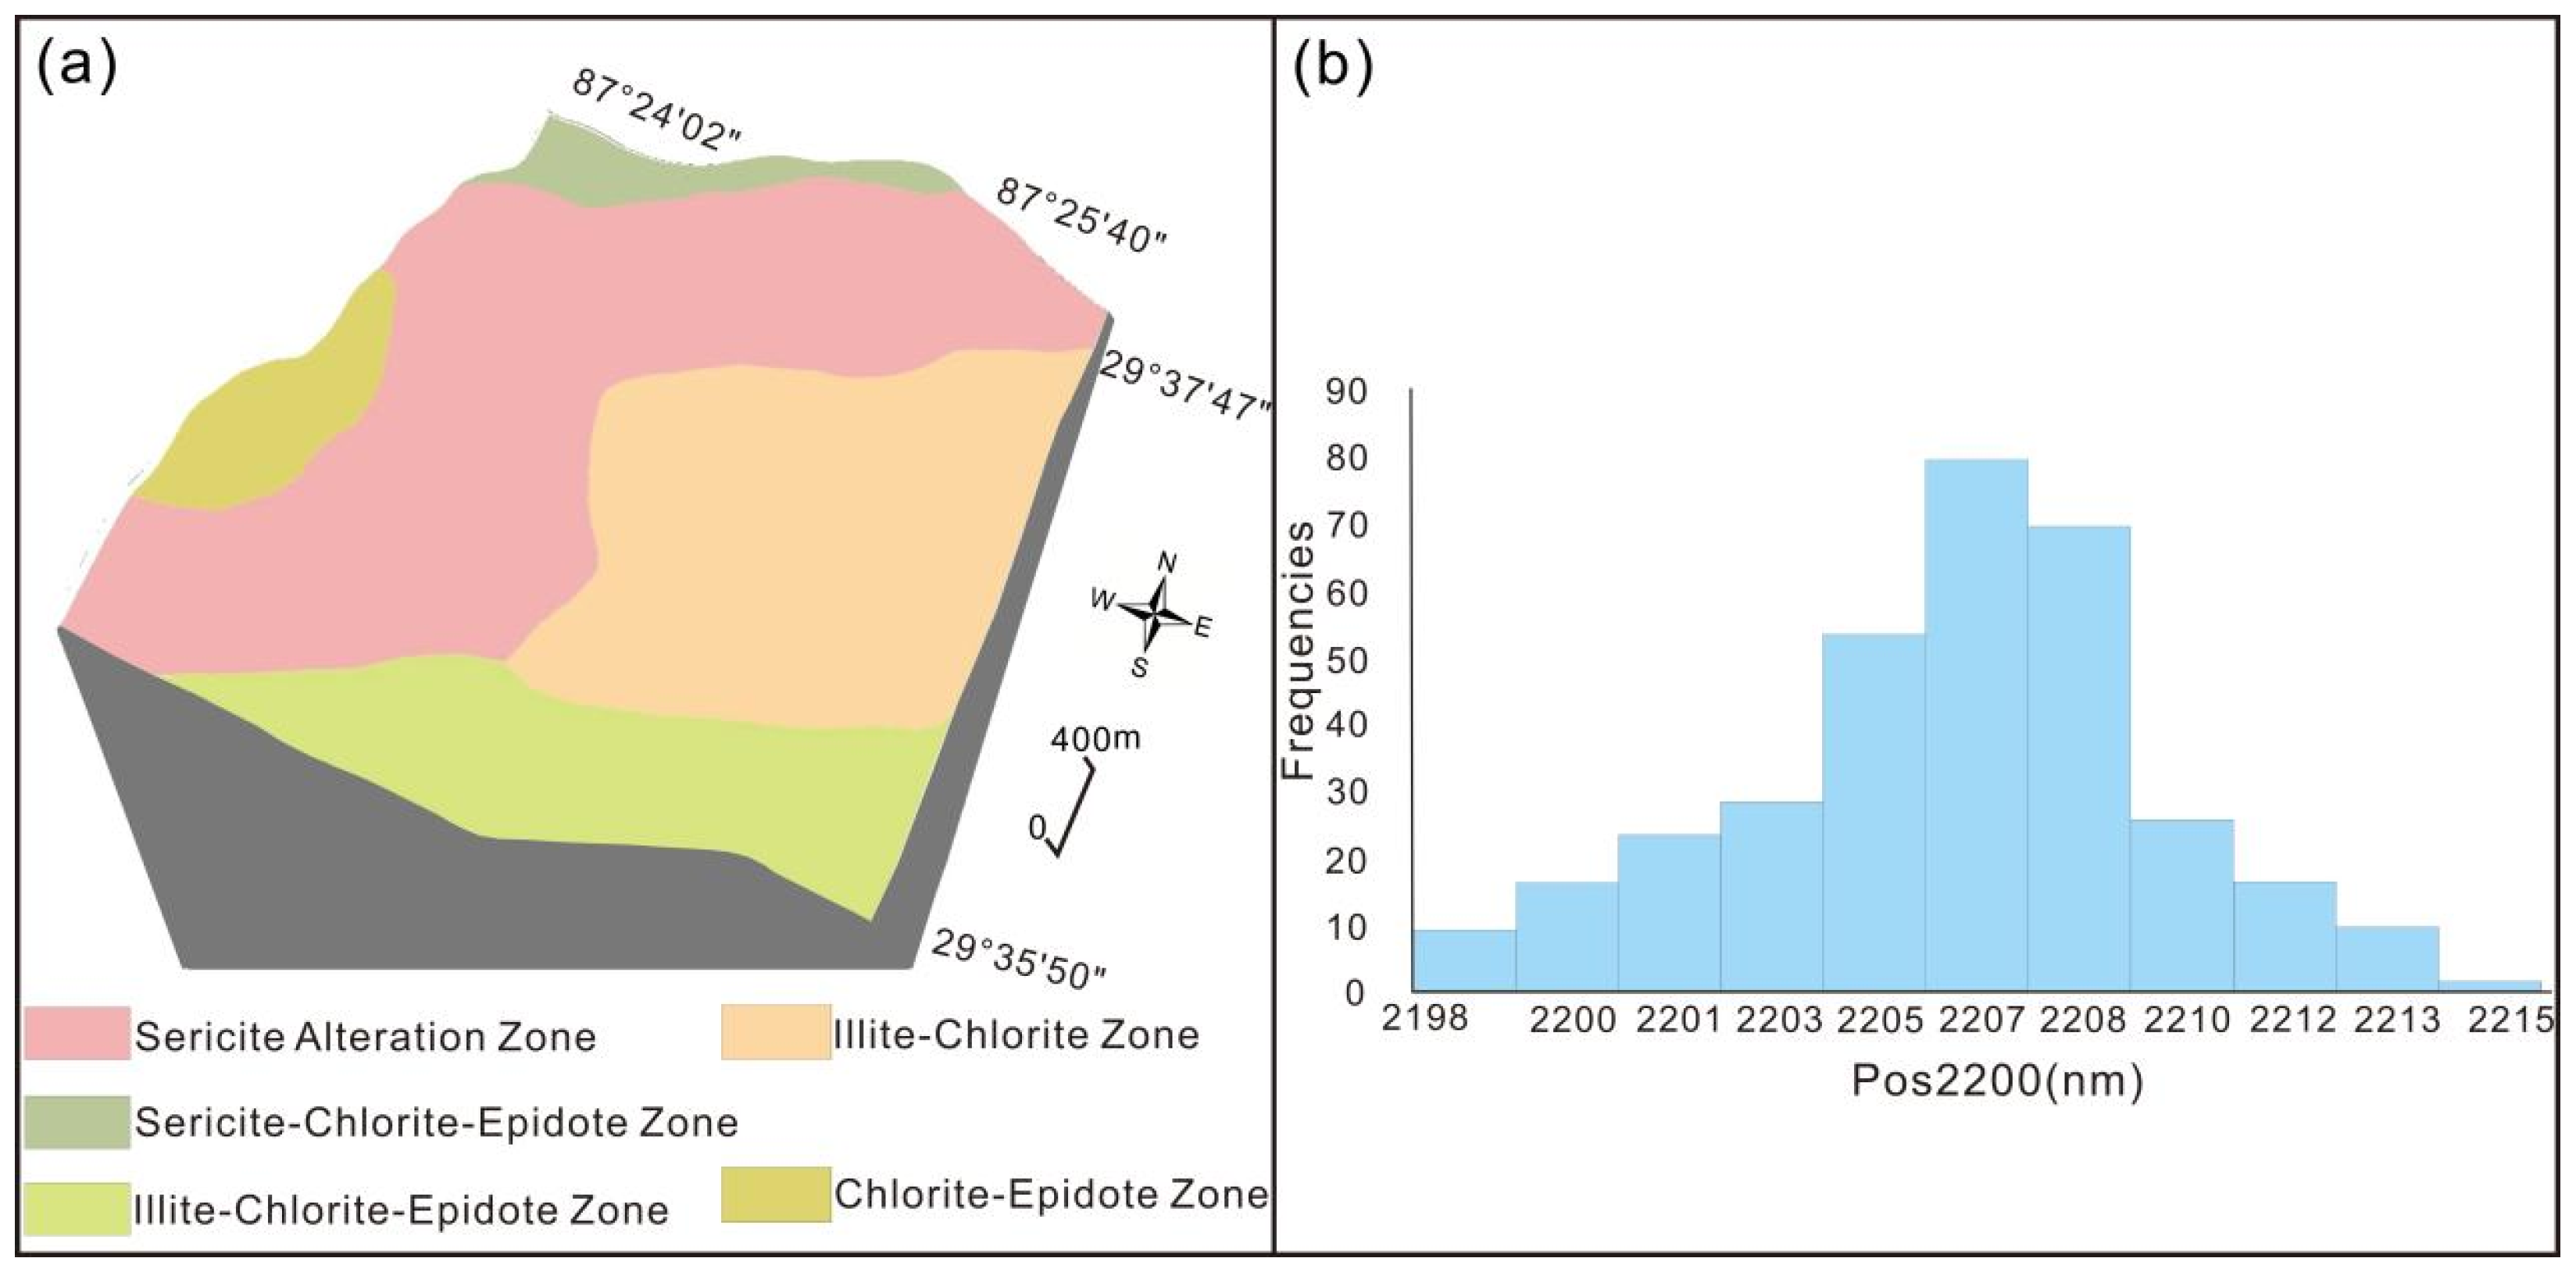
The integration of SWIR spectral data and alteration characteristics facilitated the analysis of relative mineral abundances, allowing for the delineation of distinct hydrothermal alteration zones (Figure 4a).
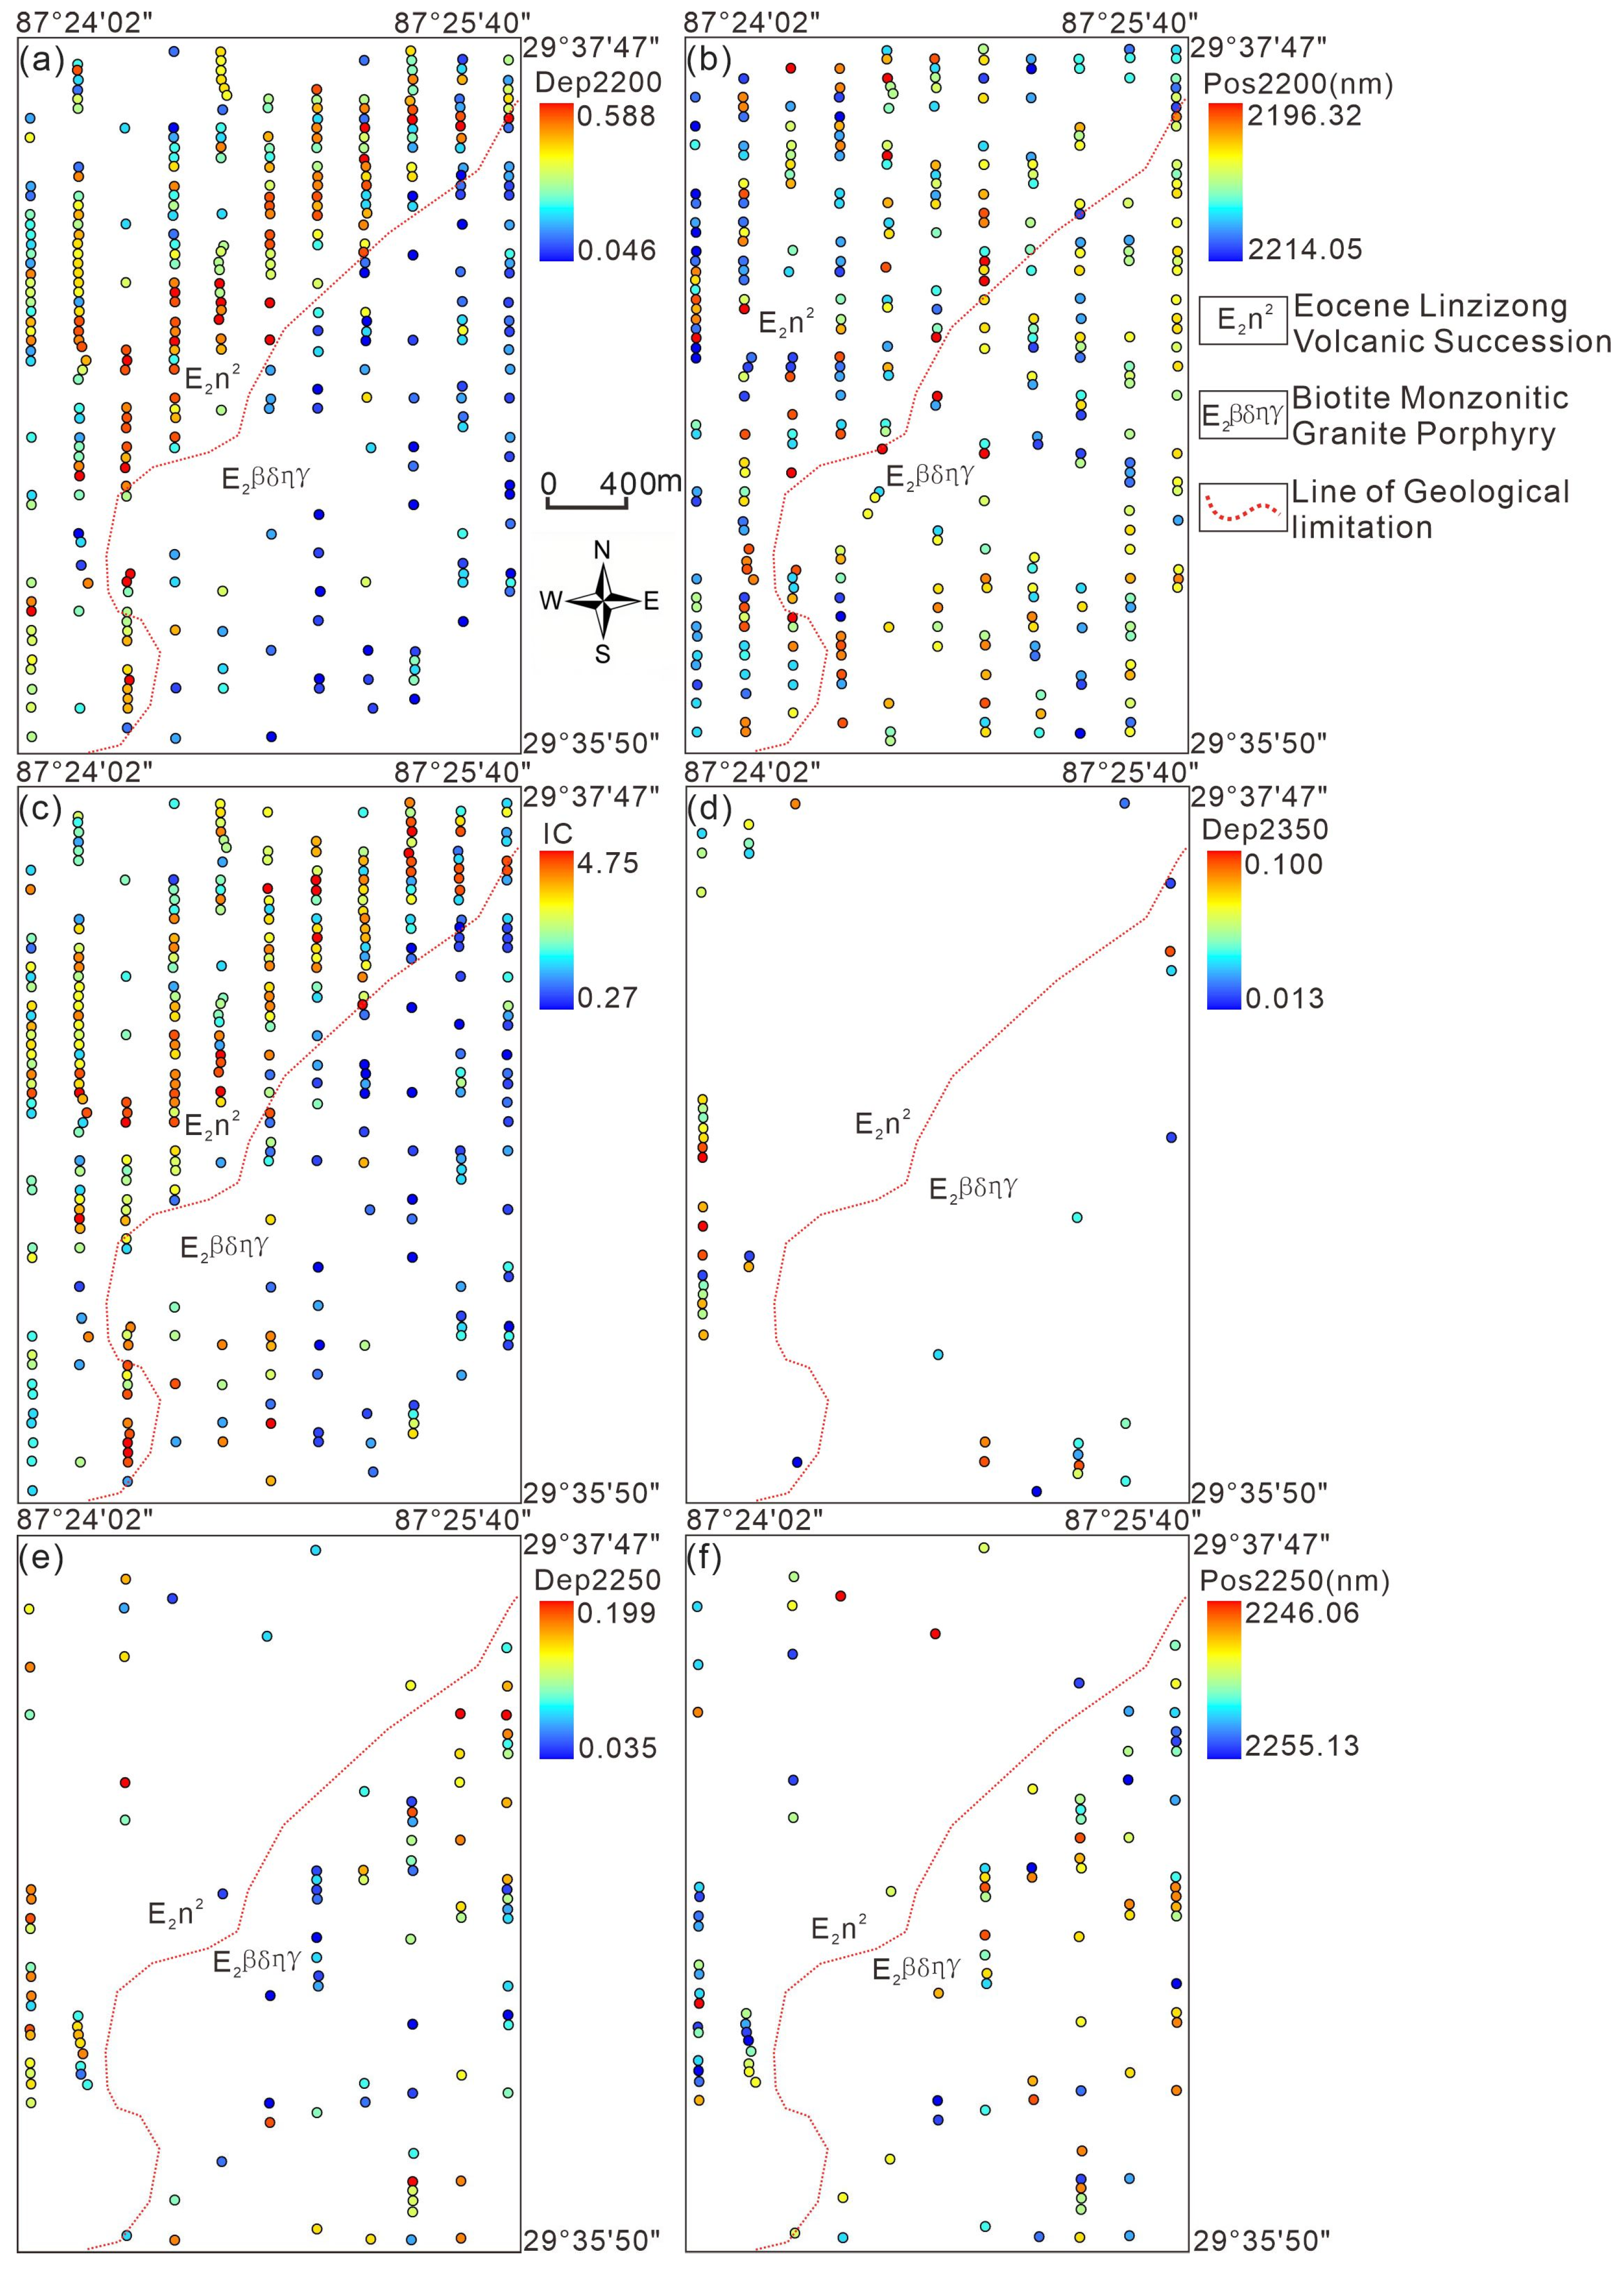
Sericite Alteration Zone: Centrally located and trending NE–SW, this zone is spatially extensive and exhibits the highest abundance of sericite (Figure 5a). Sericite-group minerals here display crystallinity values generally exceeding 2 (Figure 5c), indicative of proximity to the hydrothermal fluid source. This zone exhibits the strongest spatial and spectral correlation with mineralization.
Sericite–Chlorite–Epidote Zone: This zone occurs north of the Sericite Zone, trending approximately east–west. Chlorite and epidote show elevated abundances (Figure 5d,e), while sericite content is notably reduced. Sericite crystallinity (SWIR-IC) decreases significantly (SWIR-IC < 2), suggesting a more distal position relative to the hydrothermal center. Chlorite is predominantly of the short-wavelength type, with an Fe–OH absorption peak wavelength position (Pos2250) typically < 2250 nm (Figure 5f).
Illite–Chlorite Zone: Located in the central–eastern portion of the study area and surrounding medium- to coarse-grained monzogranite, this semi-elliptical zone is extensive. Sericite is scarce, whereas chlorite is relatively abundant. Illite crystallinity ranges between 0 and 2, and chlorite is mainly of the short-wavelength type, with Pos2250 < 2250 nm. This zone likely represents the outer boundary of hydrothermal influence.
Illite–Chlorite–Epidote Zone: This zone occupies a small area in the southeastern corner of the study region. Alteration is characterized by illite and chlorite with minor development of epidote, suggesting weak hydrothermal overprint.
Chlorite–Epidote Zone: Situated on the southwestern margin of the study area, this narrow, N–S-trending zone shows strong development of chlorite and epidote, with negligible sericite presence. Chlorite here is predominantly of the long-wavelength type, with Pos2250 > 2250 nm, reflecting its distal nature relative to hydrothermal upflow zones.

4.3. SWIR Spectral Features of Sericite

Sericite-group minerals are common hydrothermal alteration indicators widely distributed in magmatic–hydrothermal systems. Their composition and structure record changes in physicochemical conditions (P-T-X). Consequently, they provide critical constraints on ore-forming fluid migration pathways and hydrothermal evolution [36,37,38]. Sericite stands out as a predominant and pervasive alteration mineral across the entire Dingyang area, playing a pivotal role in the hydrothermal alteration system.
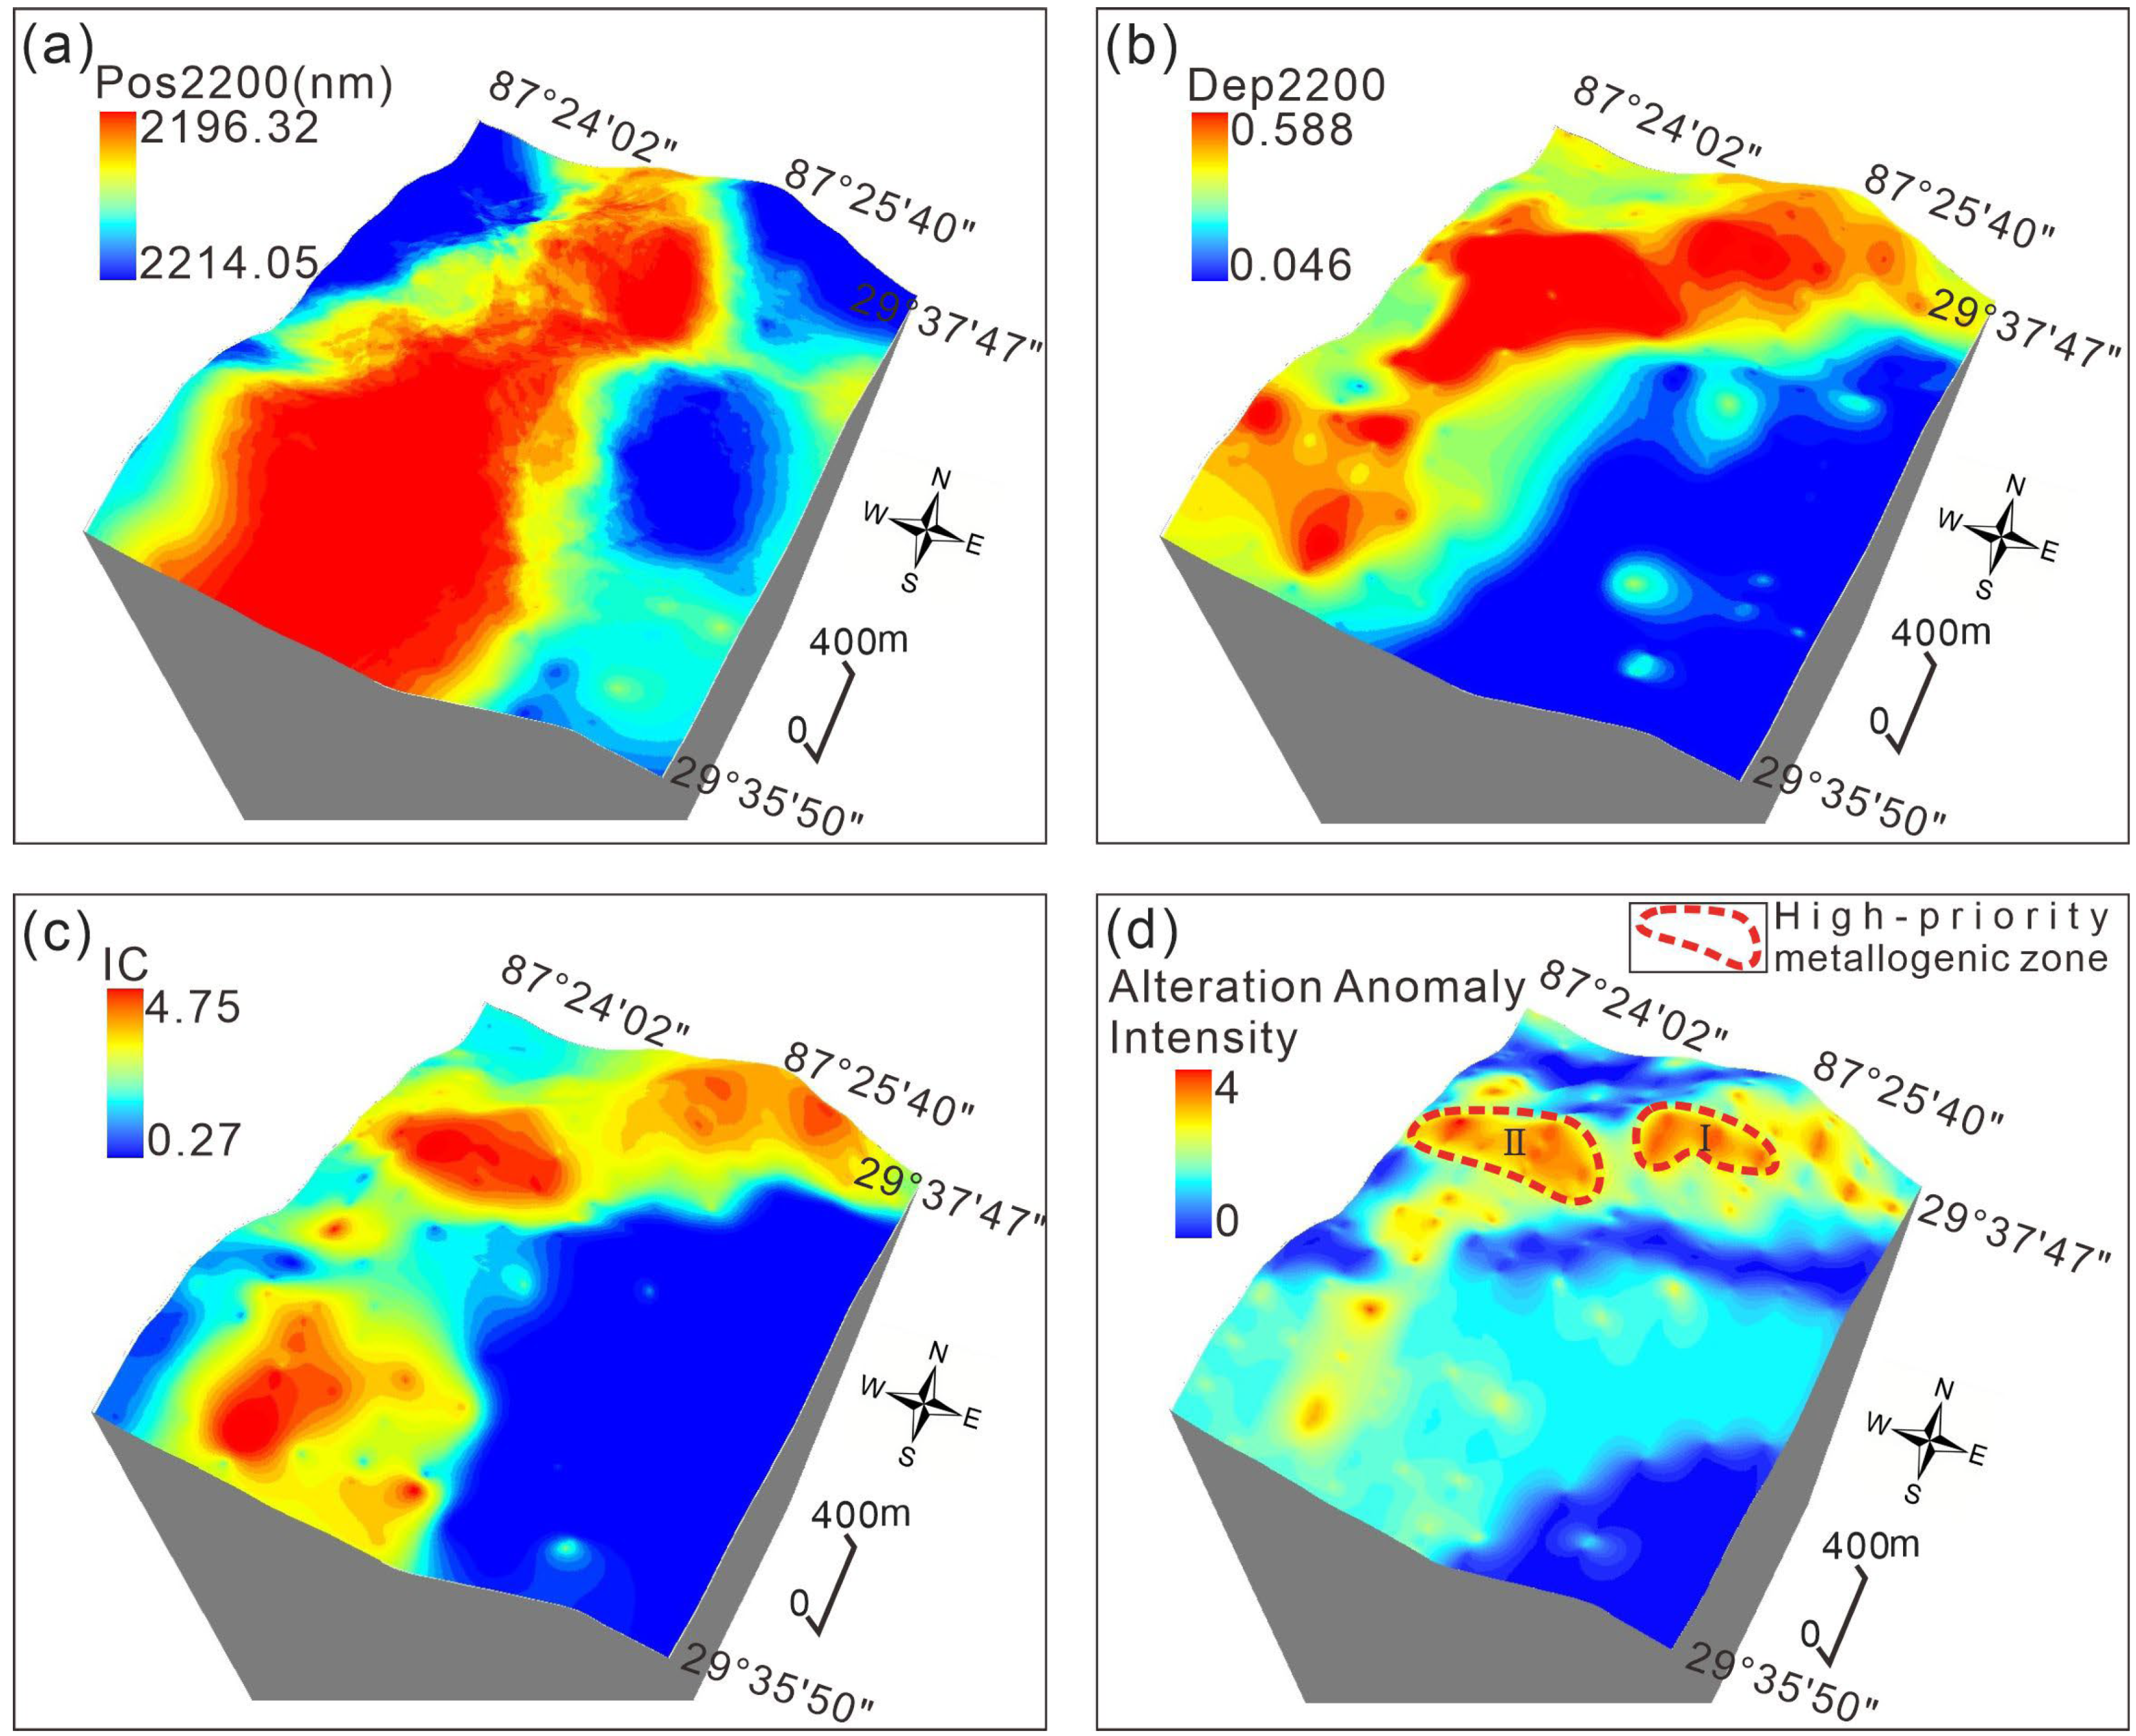
Integration of TSG software and manual spectral analyses identified all sericite-bearing spectra. The quantification of sericite abundance via Al-OH absorption peak depth (Dep2200) reveals that higher Al-OH absorption peak depth (Dep2200 > 0.3) is present in the NE, central, and SW sectors, predominantly within the Linzizong Group volcanic rocks (Figure 6b). Lower absorption depths occur in the SE sector, primarily within biotite monzonitic granite porphyry (Figure 5b). Sericite at the Dingyang surface exhibits Pos2200 ranging from 2198 nm to 2215 nm (Figure 4b), with most being phengitic [Si, Mg, Fe] and characterized by Pos2200 > 2210 nm. Two short-wavelength anomaly centers located in the northern and SW sectors show a systematic outward increase in Pos2200, reflecting crystal–chemical variation (Figure 6a). Furthermore, areas predominantly distributed in the northeastern, northern, and southwestern sectors of the study area are characterized by higher sericite crystallinity values, displaying prominent SWIR-IC anomalies (SWIR-IC > 2) with values decreasing systematically outward (Figure 6c). This diagnostic pattern of high-temperature hydrothermal environments, characterized by the described zoning, delineates core loci of deep hydrothermal activity and guides mineral exploration targeting.

5. Discussion

5.1. Sericite SWIR Spectral Indicators for Mineral Exploration

An SWIR-based exploration framework centered on sericite-group minerals has been developed. This approach has significant diagnostic value and field applicability for mineral targeting [39,40,41,42]. At the Zhule mineralization occurrence in Tibet, a diagnostic exploration indicator utilizing sericite crystallinity (SWIR-IC > 2.4) has been defined for delineating the hydrothermal center [43]. Research at the Demingding Cu-Mo deposit demonstrates that under acidic hydrothermal conditions, a combination of key spectral parameters—namely, the shorter wavelength of sericite (Pos2200 < 2201 nm), the higher crystallinity (SWIR-IC > 1.2), and the deeper absorption depth (Dep2200 > 0.4)—effectively characterizes the hydrothermal center [41]. Sericite’s Pos2000 is controlled by octahedral AlVI content. Higher temperatures promote AlVI substitution, systematically decreasing Pos2200 values [44,45,46,47]. Pos2200 values systematically increase outward from anomaly centers. This zoning records waning hydrothermal intensity from core to periphery, supporting a deep magmatic heat source. Hydrothermal fluid pH also controls Pos2200: during ascent in porphyry systems, cooling and SO2 disproportionation generate acidic fluids that stabilize Al-rich sericite [48]. Al-rich sericite typically occurs along shallow-level fluid pathways and displays characteristically lower Pos2200 values [49].
SWIR-IC values in sericite track hydrothermal fluid temperatures [50]. At elevated temperatures, sericite approaches ideal stoichiometry with minimal interlayer water. During cooling, interlayer water adsorption generates a characteristic ~1900 nm absorption feature, depressing SWIR-IC values [51]. Higher SWIR-IC values, which indicate elevated temperatures [52,53], render SWIR-IC a key proxy for reconstructing hydrothermal temperature gradients. Three prominent sericite SWIR-IC anomalies in the study area, where values decrease systematically outward from each center, delineate high-temperature hydrothermal cores and zones of focused fluid upflow above deep heat sources.
Spatial patterns of sericite spectral parameters, showing markedly elevated fluid temperatures and pressures in the NE, N, and SW sectors relative to peripheral zones and signifying intense magmatic–hydrothermal activity, imply a concealed magmatic–hydrothermal center at depth. Based on the SWIR spectral indicators from the Zhunuo deposit, where sericite with a shorter wavelength (Pos2200 < 2203 nm), deeper absorption depth (Dep2200 > 0.2), and higher crystallinity (SWIR-IC > 2.0) correlates with proximity to ore bodies and enhanced mineralization, combined with the Al-OH alteration information extracted by remote sensing, the parameter threshold is optimized and exploration criteria for sericite in the Dingyang district can be established, with the sericite there having a shorter wavelength (Pos2200 < 2203 nm), deeper absorption depth (Dep2200 > 0.3), and higher crystallinity (SWIR-IC > 1.6), indicating proximity to hydrothermal/mineralization centers. This provides a critical geological foundation for subsequent mineral exploration targeting.

5.2. Spectral Feature-Based Geological Connotation Method (SFGCM)

Contemporary geochemical exploration methodologies integrate statistical modeling (mean-standard deviation, Q-Q plots, PCA), fractal theory (S-A, C-A), spatial scanning (Yang-Chizhong scan statistics), machine learning (autoencoders, Transformer, GAUGE graph networks), geostatistics (kriging), and modern analytical techniques (ICP-MS, isotope tracing), significantly enhancing anomaly detection and resource assessment capabilities [54,55,56,57]. Consequently, achieving quantitative and accurate assessment of anomalies within field geological contexts remains a critical challenge in geochemical data processing.
The Geological Connotation Method (GCM) is a geochemical data processing approach rooted in regional metallogenic patterns and geological settings. Its core objective involves quantifying correlations between ore-controlling geological factors and geochemical responses to identify mineralization-related anomalies [58,59]. The GCM excels in scenarios requiring robust geological constraints, weak-signal enhancement, resolution of episodic mineralization events, and cost-effective exploration. Its core capability lies in constraining solution-space ambiguity through metallogenic principles, achieving synergistic integration of data-driven and geology-driven approaches.
The GCM calculates an ore-concentration coefficient (Ca) for each element a by normalizing its concentration (xa) against the subregional threshold (Ta):
C a = x a T a
The metallogenic anomaly value (At) for deposit type t is then
A t = Σ i C i
where i ∈ {1, …, n} denotes the indicator elements diagnostic for deposit type t.
This study integrates remote sensing alteration anomalies with SWIR spectral exploration indicators, introducing the Spectral Feature-Based Geological Connotation Method (SFGCM). The alteration anomaly intensity index is computed by integrating SWIR spectral parameters with remote sensing alteration data through the following workflow: First, spectral parameter quantification is applied to exploration indicator mineral samples: a value of 1 is assigned where Pos2200 < 2203 nm, Dep2200 > 0.3, and SWIR-IC > 1.6; otherwise, 0 is assigned. Second, samples within multispectral remote sensing alteration anomalies receive a value of 1; otherwise, 0 is assigned. Third, per-point summation of both assigned values generates a spatial dataset quantifying alteration intensity. Finally, kriging interpolation produces alteration intensity contour maps (Figure 6d), with thresholds delineating hydrothermal architecture (e.g., >3 = strong anomaly; 0–1 = weak anomaly).
I a = i = 1 n   V S W I R + V R S
where Ia denotes the alteration anomaly intensity index, with VSWIR and VRS representing the quantified spectral and remote sensing scores, respectively.
Alteration anomaly intensity peaks in zones I and II, with strong anomalies both localized along regional fault intersections and superimposed on dacitic crystal tuff units. The high-degree spatial correlation between peak alteration intensity and predicted mineralization centers demonstrates dominant control by hydrothermal foci on significant ore–metal enrichment. Kriging interpolation reveals northeast–southwest (NE-SW) trending anomaly axes concordant with subsurface magmatic–hydrothermal conduits, corroborating the porphyry mineralization model in the Zhunuo ore concentration area.

5.3. Discovery of New Mineralisation

This study integrates remote sensing alteration anomalies with SWIR spectral data, utilizing Sentinel-2 data to extract hydroxyl and iron-oxide anomalies and combining them with the SWIR analysis results of 736 field samples, aiming to overcome traditional exploration limitations in complex terrains. SFGCM delineated alteration intensity zones in the Dingyang area, defining two high-priority exploration targets with mineralization potential (Figure 6d). Sentinel-2 multispectral bands effectively map regional hydroxyl-mineral distributions, enabling efficient large-scale reconnaissance. In the Dingyang surface area, Al-OH-bearing alteration minerals (e.g., sericite) dominate, with minor Mg-OH-bearing phases (e.g., chlorite, epidote) identified through SWIR spectrometer analysis. The spectral data confirm sericite as the primary alteration mineral, aligning with remote sensing interpretations. However, field observations reveal discrepancies: chlorite and epidote occurrences are limited, yet their proportions in remote sensing extractions are overestimated, likely due to band selection constraints in capturing specific mineral signatures.
The presence of carbonate minerals was confirmed by field sampling of malachite, while ferric contamination anomalies reflect hematite-limonite enrichment, indicating a widespread red-brown iron oxidation zone. The observed surface limonite mineralization further validates the remote sensing interpretation of these iron-stained anomalies.
Where remote sensing alone struggles to distinguish mineral species, SWIR spectral analysis plays a critical role. Diagnostic Pos2200 absorption features confirm sericitization as the dominant process underlying target-zone hydroxyl anomalies, thereby reducing non-mineralizing alteration “noise” and refining exploration targets to high-probability mineralization zones.
Mineralization potential in new targets is confirmed via integrated remote sensing and diagnostic sericite SWIR criteria, as these signatures correlate with intense hydrothermal activity and coincide with hematite-limonite reflectance anomalies. The targets form an NE-SW linear cluster adjacent to the Zhunuo–Beimulang deposit, consistent with regional metallogenic models. During the field survey in the high-probability metallogenic zone I (Figure 7), new mineralization has been discovered, where disseminated malachite and azurite overprint hypogene bornite on monzogranite. The discovery of two new mineralization sites has expanded the known mineralization range of the Zhunuo ore concentration area (Figure 8).

6. Conclusions

(1)
Sentinel-2 data identified Al-OH, Mg-OH, carbonate alterations, and ferric contamination anomalies. Diagnostic exploration criteria were defined based on the SWIR spectral characteristics of targets: Pos2200 < 2203 nm, Dep2200 > 0.3, SWIR − IC > 1.6.
(2)
The Spectral Feature-Based Geological Connotation Method (SFGCM) integrates remote sensing anomalies with SWIR spectral parameters to quantify alteration intensity and delineate ore-related anomalies.
(3)
SFGCM refines alteration anomalies, delineates mineralization centers, and discovers new prospects, providing a validated approach for targeting ore-forming cores in spectral-based exploration.
(4)
This study discovers new mineralized areas, expands the mineral resource potential of the Zhunuo ore concentration area, and demonstrates a replicable workflow for regional resource exploration.

Author Contributions

Conceptualization, Z.L. and X.J.; methodology, Z.L. and X.J.; software, Z.L. and X.J.; validation, Z.L., X.J. and Z.P.; formal analysis, Z.L.; investigation, Z.L., X.C., G.C., J.W., D.P.; resources, Z.P., X.C., G.C., J.W., D.P.; data curation, Z.L. and X.J.; writing—original draft preparation, Z.L. and X.J.; writing—review and editing, Z.L. and X.J.; visualization, Z.L.; supervision, X.J.; project administration, X.J.; funding acquisition, X.J. All authors have read and agreed to the published version of the manuscript.

Funding

This work is supported by the National Key R&D Program of Xizang (XZ202401ZY0026), Deep Earth Probe and Mineral Resources Exploration–National Science and Technology Major Project 2025ZD1008004 and National Natural Science Foundation of China (NSFC) (42403061).

Data Availability Statement

Data are contained within the article.

Acknowledgments

We extend our sincere appreciation to the Editor-in-Chief and Editorial team for their efficient handling of the manuscript, as well as to the three anonymous reviewers for their constructive comments. As well as thanks to Tibet Julong Copper Industry Limited Company and No. 2 Geological Party, Bureau of Geology and Mineral Exploration and Development of the staff of the field investigation assistance. We are also deeply grateful to our research team members for their dedicated efforts in field sampling and laboratory spectral analyses.

Conflicts of Interest

Zhaxi PuBu is employee of No. 2 Geological Party, Bureau of Geology and Mineral Exploration and Development. Xian Che, Gen Chen, Jiangang Wei, Deng Pan are employees of Tibet Julong Copper Industry Limited Company. The paper reflects the views of the scientists and not the company. The paper reflects the views of the scientists and not the company.

References

  1. Hou, Z.Q.; Zheng, Y.C.; Yang, Z.M.; Yang, Z.S. Metallogenesis of continental collision setting: Part I. Gangdese Cenozoic porphyry Cu-Mo systems in Tibet. Miner. Depos. 2012, 31, 647–670. (In Chinese) [Google Scholar] [CrossRef]
  2. Tang, J.X.; Liu, H.F.; Lang, X.H.; Zhang, J.S.; Zheng, W.B.; Ying, L.J. Minerogenetic series of ore deposits in the east part of the Gangdise metallogenic belt. Acta Geosci. Sin. 2012, 33, 393–410. (In Chinese) [Google Scholar]
  3. Zheng, Y.Y.; Wu, S.; Ci, Q.; Chen, S.Y.; Shi, S.D.; Chen, X.; Liu, P.; Li, J.Z. Metallogenic series and exploration breakthroughs of Zhunuo ore district in Xizang. Miner. Depos. 2024, 43, 1295–1315. (In Chinese) [Google Scholar] [CrossRef]
  4. Zheng, Y.Y. The discovery of Zhunuo porphyry copper deposit in Tibet and its significance. Earth Sci. Front. 2006, 13, 233–239. (In Chinese) [Google Scholar]
  5. Li, J.Z.; Wu, S.; Lin, Y.B.; Jiang, Z.Y.; Yi, J.Z.; Jiang, G.W.; Zhao, Y.Y. Alteration-mineralization style and prospecting potential of Cimabanshuo porphyry copper deposit in Tibet. J. Earth Sci. 2022, 47, 2219–2244. (In Chinese) [Google Scholar] [CrossRef]
  6. Ci, Q.; Zheng, Y.Y.; Wu, S.; Liu, P.; Zhao, Y.Y.; Gong, F.Z.; Du, Z.Z.; Hou, Y.T. Discovery and Significance of Beimulang Porphyry Cu-Mo Deposit, Xizang. J. Earth Sci. 2025, 50, 1305–1318. (In Chinese) [Google Scholar] [CrossRef]
  7. Tagwai, M.G.; Jimoh, O.A.; Shehu, S.A.; Zabidi, H. Application of GIS and remote sensing in mineral exploration: Current and future perspectives. World J. Eng. 2024, 21, 487–502. [Google Scholar] [CrossRef]
  8. Liu, L.; Yin, C.T.; Khalil, Y.S.; Hong, J.; Feng, J.L.; Zhang, H.S. Alteration mapping for porphyry Cu targeting in the western Chagai belt, Pakistan, using ZY1-02D spaceborne hyperspectral data. Econ. Geol. 2024, 119, 331–353. [Google Scholar] [CrossRef]
  9. Rani, K. Mineral exploration using remote sensing. In Remote Sensing for Geophysicists; CRC Press: Boca Raton, FL, USA, 2025; pp. 79–94. [Google Scholar] [CrossRef]
  10. Habashi, J.; Moghadam, H.J.; Oskouei, M.M.; Pour, A.B.; Hashim, M. PRISMA hyperspectral remote sensing data for mapping alteration minerals in sar-e-châh-e-shur region, birjand, Iran. Remote Sens. 2024, 16, 1277. [Google Scholar] [CrossRef]
  11. Chen, Q.; Cai, D.; Zhao, Z.; Yang, X.; Wang, Y.; Jiang, X.; Xu, T. Alteration Information Extraction and Mineral Prospectivity Mapping in the Laozhaiwan Area Using Multisource Remote Sensing Data. Remote Sens. 2025, 17, 2178. [Google Scholar] [CrossRef]
  12. Zhao, Z.F.; Zhang, G.; Chen, Q.; Cai, D.Y.; Meng, F.J.; Long, X.Y.; Zhang, T.; Wang, Y.Y.; Xu, T.; Yang, H.Y.; et al. Gold exploration using multi-source remote sensing data in the northern part of the Wa State, Myanmar. Ore Geol. Rev. 2025, 183, 106703. [Google Scholar] [CrossRef]
  13. Yang, D.Y.; Shao, H.X.; Chang, H.L.; Zhang, R.X.; Ding, B.Z. Landsat 8 and ASTER remote sensing data for ore prospecting in the postmasburg manganese ore field, South Africa. Earth Sci. Inform. 2025, 18, 102. [Google Scholar] [CrossRef]
  14. Hu, B.; Xu, Y.Y.; Wan, B.; Wu, X.C.; Yi, G.H. Hydrothermally altered mineral mapping using synthetic application of Sentinel-2A MSI, ASTER and Hyperion data in the Duolong area, Tibetan Plateau, China. Ore Geol. Rev. 2018, 101, 384–397. [Google Scholar] [CrossRef]
  15. Zhu, Y.; Wu, Z. A synergistic PCA and CA fractal approach for high-precision extraction of mineral alteration anomalies from ASTER remote sensing data. Geocarto Int. 2025, 40, 2476599. [Google Scholar] [CrossRef]
  16. Zhang, G.; Zhao, Z.; Zhang, X.; Wu, X.; Zheng, Y.; Feng, L.; Huang, Z. Comprehensive Multi-Source remote sensing data integration for enhanced mineralization alteration extraction and geological structure interpretation in the Lala region of Sichuan Province. Ore Geol. Rev. 2024, 168, 106032. [Google Scholar] [CrossRef]
  17. Yang, Z.M.; Hou, Z.Q.; Yang, Z.S.; Qu, H.C.; Li, Z.Q.; Liu, Y.F. Application of short wavelength infrared (SWIR) technique in exploration of poorly eroded porphyry Cu district: A case study of Niancun ore district, Tibet. Miner. Depos. 2012, 31, 699–717. (In Chinese) [Google Scholar] [CrossRef]
  18. Bi, R.; Wang, F.Y.; Zhao, J.K.; Zhang, K.X.; Wu, J.Q.; Liu, Y.S.; Guo, Y.H. Study of short-wave infrared spectroscopy (SWIR) on hydrothermal chlorite in the Tongshan porphyry Cu-Mo deposit, Heilongjiang. Ore Geol. Rev. 2025, 186, 106775. [Google Scholar] [CrossRef]
  19. Wang, Y.X.; Xiao, B.; Wang, Y.; Wang, Y.; Fu, X.R.; Zhao, J.X.; Wang, H.; Cao, G.S. Hydrothermal alteration and shortwave infrared (SWIR) spectroscopy exploration of the Jinwozi gold deposit in the Beishan Orogenic Belt, NW China. Ore Geol. Rev. 2025, 185, 106820. [Google Scholar] [CrossRef]
  20. Zhou, T.J.; Xu, L.G.; Liu, K.; Zhang, W.; Fu, X.R.; Yuan, P. Alteration mineralogy of the Xiajiadian Au deposit in southern Qinling, China: Application of Short Wavelength Infra-Red (SWIR) spectroscopy for vein-type Au exploration. Ore Geol. Rev. 2025, 184, 106753. [Google Scholar] [CrossRef]
  21. Wu, Z.Z.; Chen, G.; Jiang, Z.Y.; Zheng, Y.Y.; Chen, X.; Gao, S.B. Diagnostic implications of shortwave-thermal infrared characteristics of typical alteration minerals for mineral exploration in continental volcanic arcs: A case study of the Zhalong Cu-Sn polymetallic deposit, Tibet. Ore Geol. Rev. 2025, 106760. [Google Scholar] [CrossRef]
  22. Hou, Z.Q.; Gao, Y.F.; Qu, X.M.; Rui, Z.Y.; Mo, X.X. Origin of adakitic intrusives generated during mid-Miocene east–west extension in southern Tibet. Earth Planet. Sci. Lett. 2004, 220, 139–155. [Google Scholar] [CrossRef]
  23. Zheng, Y. Finding and significances of Chongjiang porphyry copper (molybdenum, aurum) deposit, Tibet. Earth Sci. J. China Univ. Geosci. 2004, 29, 333–339. [Google Scholar]
  24. Zheng, Y.Y.; Zhang, G.Y.; Xu, R.K.; Gao, S.B.; Pang, Y.C.; Gao, L.; Du, A.D.; Shi, Y.R. Geochronologic constraints on magmatic intrusions and mineralization of the Zhunuo porphyry copper deposit in Gangdese, Tibet. Chin. Sci. Bull. 2007, 52, 3139–3147. [Google Scholar] [CrossRef]
  25. Zheng, Y.Y.; Sun, X.; Gao, S.B.; Wu, S.; Xu, J.; Jiang, J.S.; Chen, X.; Zhao, Z.Y.; Liu, Y. Metallogenesis and the minerogenetic series in the Gangdese polymetallic copper belt. J. Asian Earth Sci. 2015, 103, 23–39. [Google Scholar] [CrossRef]
  26. Yang, Z.M.; Goldfarb, R.; Chang, Z.S. Generation of postcollisional porphyry copper deposits in southern Tibet triggered by subduction of the Indian continental plate. Soc. Econ. Geol. Spec. Publ. 2016, 19, 279–300. [Google Scholar]
  27. Sun, X.; Zheng, Y.Y.; Li, M.; Ouyang, H.T.; Liu, Q.Q.; Jing, X.K.; Sun, G.P.; Song, Q.J. Genesis of Luobuzhen Pb–Zn veins: Implications for porphyry Cu systems and exploration targeting at Luobuzhen-Dongshibu in western Gangdese belt, southern Tibet. Ore Geol. Rev. 2017, 82, 252–267. [Google Scholar] [CrossRef]
  28. Sun, X.; Zheng, Y.Y.; Xu, J.; Huang, L.H.; Guo, F.; Gao, S.B. Metallogenesis and ore controls of Cenozoic porphyry Mo deposits in the Gangdese belt of southern Tibet. Ore Geol. Rev. 2017, 81, 996–1014. [Google Scholar] [CrossRef]
  29. Liu, P.; Wu, S.; Zheng, Y.Y.; Wang, X.Y.; Kang, Y.M.; Yan, J.; Gu, Y.; Liu, X.F.; Gong, F.Z.; Zhao, Y.Y.; et al. Geology and factors controlling the formation of the newly discovered Beimulang porphyry Cu deposit in the western Gangdese, southern Tibet. Ore Geol. Rev. 2022, 144, 104823. [Google Scholar] [CrossRef]
  30. Shi, S.D.; Chen, S.Y.; Luo, S.J.C.; Ren, H.; Jiang, X.J. Petrogenesis and Metallogenic Significance of the Demingding Mo-Cu Porphyry Deposit in the Gangdese Belt, Xizang: Insights from U-Pb and Re-Os Geochronology and Geochemistry. Minerals 2024, 14, 1232. [Google Scholar] [CrossRef]
  31. Wu, S.; Zheng, Y.Y.; Xu, B.; Jiang, G.W.; Yi, J.Z.; Liu, X.F.; Zheng, S.L.; Li, L. Heterogeneous mantle associated with asthenosphere and Indian slab metasomatism: Constraints on fertilization of porphyry Cu mineralization in Tibetan orogen. Ore Geol. Rev. 2022, 140, 104601. [Google Scholar] [CrossRef]
  32. Zheng, Y.Y.; Sun, X.; Gao, S.B.; Wang, C.M.; Zhao, Z.Y.; Wu, S.; Li, J.D.; Wu, X. Analysis of stream sediment data for exploring the Zhunuo porphyry Cu deposit, southern Tibet. J. Geochem. Explor. 2014, 143, 19–30. [Google Scholar] [CrossRef]
  33. Wu, S.; Zheng, Y.Y.; Sun, X.; Liu, S.A.; Geng, R.R.; You, Z.M. Origin of the Miocene porphyries and their mafic microgranular enclaves from Dabu porphyry Cu–Mo deposit, southern Tibet: Implications for magma mixing/mingling and mineralization. Int. Geol. Rev. 2014, 56, 571–595. [Google Scholar] [CrossRef]
  34. Wu, S.; Zheng, Y.Y.; Sun, X. Subduction metasomatism and collision-related metamorphic dehydration controls on the fertility of porphyry copper ore-forming high Sr/Y magma in Tibet. Ore Geol. Rev. 2016, 73, 83–103. [Google Scholar] [CrossRef]
  35. Wang, L.F.; Wu, S.; Lai, X.D.; Yang, W.L.; Sun, R.L.; Liu, P.; Yang, Y.D.; Ren, Y.X. The Short-Wave Infrared (SWIR) Spectral Exploration Identification and Indicative Significance of the Yixingzhai Gold Deposit, Shanxi Province. Minerals 2025, 15, 83. [Google Scholar] [CrossRef]
  36. Han, J.S.; Chu, G.B.; Chen, H.Y.; Hollings, P.; Sun, S.Q.; Chen, M. Hydrothermal alteration and short wavelength infrared (SWIR) characteristics of the Tongshankou porphyry-skarn Cu-Mo deposit, Yangtze craton, Eastern China. Ore Geol. Rev. 2018, 101, 143–164. [Google Scholar] [CrossRef]
  37. Chen, H.Y.; Zhang, S.T.; Chu, G.B.; Zhang, Y.; Cheng, J.M.; Tian, J.; Han, J.S. The short wave infrared (SWIR) spectral characteristics of alteration minerals and applications for ore exploration in the typical skarn-porphyry deposits, Edong ore district, eastern China. Acta Petrol. Sin. 2019, 35, 3629–3643. [Google Scholar] [CrossRef]
  38. Feng, Y.Z.; Xiao, B.; Li, R.C.; Deng, C.Z.; Han, J.S.; Wu, C.; Li, G.H.; Shi, H.L.; Lai, C.K. Alteration mapping with short wavelength infrared (SWIR) spectroscopy on Xiaokelehe porphyry Cu-Mo deposit in the Great Xing’an Range, NE China: Metallogenic and exploration implications. Ore Geol. Rev. 2019, 112, 103062. [Google Scholar] [CrossRef]
  39. Liu, L.; Chen, J.; Li, X.; Zhao, T.; Li, S.; Sun, L.; Chen, J. Short wavelength infrared (SWIR) reflectance spectroscopy of alteration minerals of Qibaoshan ore district, Shandong Province, China. Ore Geol. Rev. 2024, 165, 105868. [Google Scholar] [CrossRef]
  40. Leng, C.B.; Wang, D.Z.; Yu, H.J.; Tian, F.; Zhang, X.C. Mapping hydrothermal alteration zones with short wavelength infrared (SWIR) spectra and magnetic susceptibility at the Pulang porphyry Cu-Au deposit, Yunnan, SW China. Miner. Depos. 2024, 59, 699–716. [Google Scholar] [CrossRef]
  41. Ren, H.; Zheng, Y.Y.; Wu, S.; Wang, D.; Zuo, L.; Chen, L.; Gao, F.; Wei, J.G.; Wang, S.C.; Shu, D.F.; et al. Short-wavelength infrared characteristics and composition of white mica in the Demingding porphyry Cu-Mo deposit, Gangdese belt, Tibet: Implications for mineral exploration. Ore Geol. Rev. 2024, 164, 105833. [Google Scholar] [CrossRef]
  42. Zheng, S.L.; Wu, S.; Zheng, Y.Y.; Chen, L.; Wei, C.; Huang, P.C.; Jing, X.K.; Yu, Z.Y.; He, C.T.; Ren, H. Identifying potential porphyry copper mineralization at the Zhu’nuo ore-cluster district in western Gangdese, southern Tibet: Insights from shortwave infrared (SWIR) spectrometry and geochemical anomalies. Ore Geol. Rev. 2022, 151, 105202. [Google Scholar] [CrossRef]
  43. Bai, L.Y.; Dai, J.J.; Liu, Z.B.; Song, Y.; Wang, N.; Chen, W. Discovery and prospecting of the Zhule mineralization spot in Xizang: Evidence from short-wave infrared alteration mineral mapping. Geol. Explor. 2025, 61, 0221–0229. [Google Scholar] [CrossRef]
  44. Duke, E.F. Near infrared spectra of muscovite, Tschermak substitution, and metamorphic reaction progress: Implications for remote sensing. Geology 1994, 22, 621–624. [Google Scholar] [CrossRef]
  45. Herrmann, W.; Blake, M.; Doyle, M.; Huston, D.; Kamprad, J.; Merry, N.; Pontual, S. Short wavelength infrared (SWIR) spectral analysis of hydrothermal alteration zones associated with base metal sulfide deposits at Rosebery and Western Tharsis, Tasmania, and Highway-Reward, Queensland. Econ. Geol. 2001, 96, 939–955. [Google Scholar] [CrossRef]
  46. Jones, S.; Herrmann, W.; Gemmell, J.B. Short Wavelength Infrared Spectral Characteristics of the HW Horizon: Implications for Exploration in the Myra Falls Volcanic-Hosted Massive Sulfide Camp, Vancouver Island, British Columbia, Canada. Econ. Geol. 2005, 2, 273–294. [Google Scholar] [CrossRef]
  47. Zhang, S.T.; Chu, G.B.; Cheng, J.M.; Zhang, Y.; Tian, J.; Li, J.P.; Sun, S.Q.; Wei, K.T. Short wavelength infrared (SWIR) spectroscopy of phyllosilicate minerals from the Tonglushan Cu-Au-Fe deposit, Eastern China: New exploration indicators for concealed skarn orebodies. Ore Geol. Rev. 2020, 122, 103516. [Google Scholar] [CrossRef]
  48. Zhang, Z.X.; Dai, J.J.; Wang, X.G.; Hu, Z.H.; Wan, X.; Peng, B.; Zhao, L.X. Shortwave infrared characteristics of muscovite from giant Shimensi tungsten deposit in northern Jiangxi Province and implication to exploration. Miner. Depos. 2023, 42, 116–127. (In Chinese) [Google Scholar]
  49. Guo, N.; Thomas, C.; Tang, J.X.; Tong, Q.X. Mapping white mica alteration associated with the Jiama porphyry-skarn Cu deposit, central Tibet using field SWIR spectrometry. Ore Geol. Rev. 2019, 108, 147–157. [Google Scholar] [CrossRef]
  50. Wang, L.; Percival, J.B.; Hedenquist, J.W.; Hattori, K.; Qin, K.Z. Alteration mineralogy of the Zhengguang epithermal Au-Zn deposit, northeast China: Interpretation of shortwave infrared analyses during mineral exploration and assessment. Econ. Geol. 2021, 116, 389–406. [Google Scholar] [CrossRef]
  51. Duba, D.; Williams-Jones, A.E. The application of illite crystallinity, organic matter reflectance, and isotopic techniques to mineral exploration; a case study in southwestern Gaspe, Quebec. Econ. Geol. 1983, 78, 1350–1363. [Google Scholar] [CrossRef]
  52. Li, X.X.; Zhou, T.F.; White, N.C.; Fan, Y.; Zhang, L.J.; Xie, J.; Liu, Y.N.; Xiao, X. Formation of the Fanshan lithocap and implications for exploration in the Luzong Basin, Anhui Province, China. Ore Geol. Rev. 2020, 118, 103314. [Google Scholar] [CrossRef]
  53. Xiao, B.; Chu, G.B.; Feng, Y.Z. Short-wave infrared (SWIR) spectral and geochemical characteristics of hydrothermal alteration minerals in the Laowangou Au deposit: Implications for ore genesis and vectoring. Ore Geol. Rev. 2021, 139, 104463. [Google Scholar] [CrossRef]
  54. Balaram, V. New Frontiers in analytical techniques—Opportunities and challenges in geochemical research. J. Geol. Soc. India 2021, 97, 331–334. [Google Scholar] [CrossRef]
  55. Liu, Q.L.; Yang, J.; Mao, X.C.; Liu, Z.K.; Deng, M.; Chen, Y.X.; Liu, W.K. Identifying geochemical anomalies using a new method of Yang Chizhong-spatial scan statistic. Comput. Geosci. 2023, 178, 105392. [Google Scholar] [CrossRef]
  56. Guan, Q.F.; Ren, S.L.; Chen, L.R.; Yao, Y.; Hu, Y.; Wang, R.F.; Feng, B.; Gu, L.D.; Chen, W.H. Recognizing multivariate geochemical anomalies related to mineralization by using deep unsupervised graph learning. Nat. Resour. Res. 2022, 31, 2225–2245. [Google Scholar] [CrossRef]
  57. Yu, S.Y.; Deng, H.; Liu, Z.K.; Chen, J.; Xiao, K.Y.; Mao, X.C. Identification of geochemical anomalies using an end-to-end transformer. Nat. Resour. Res. 2024, 33, 973–994. [Google Scholar] [CrossRef]
  58. Pang, B.; Wu, S.; Yu, Z.Z.; Liu, Y.; Li, J.B.; Zheng, L.; Chen, H.; Li, X.X.; Shi, G.W. Rapid Exploration Using pXRF Combined with Geological Connotation Method (GCM): A Case Study of the Nuocang Cu Polymetallic District, Tibet. Minerals 2022, 12, 514. [Google Scholar] [CrossRef]
  59. Zheng, Y.; Gao, S.; Xue, Z.; Sun, X.; Zheng, H.; Ke, Z.; Liu, M. A Method for Identifying and Evaluating Anomalies in Geochemical Exploration Based on Geological Connotation. CN Patent 103345566A, 9 October 2013. (In Chinese). [Google Scholar]
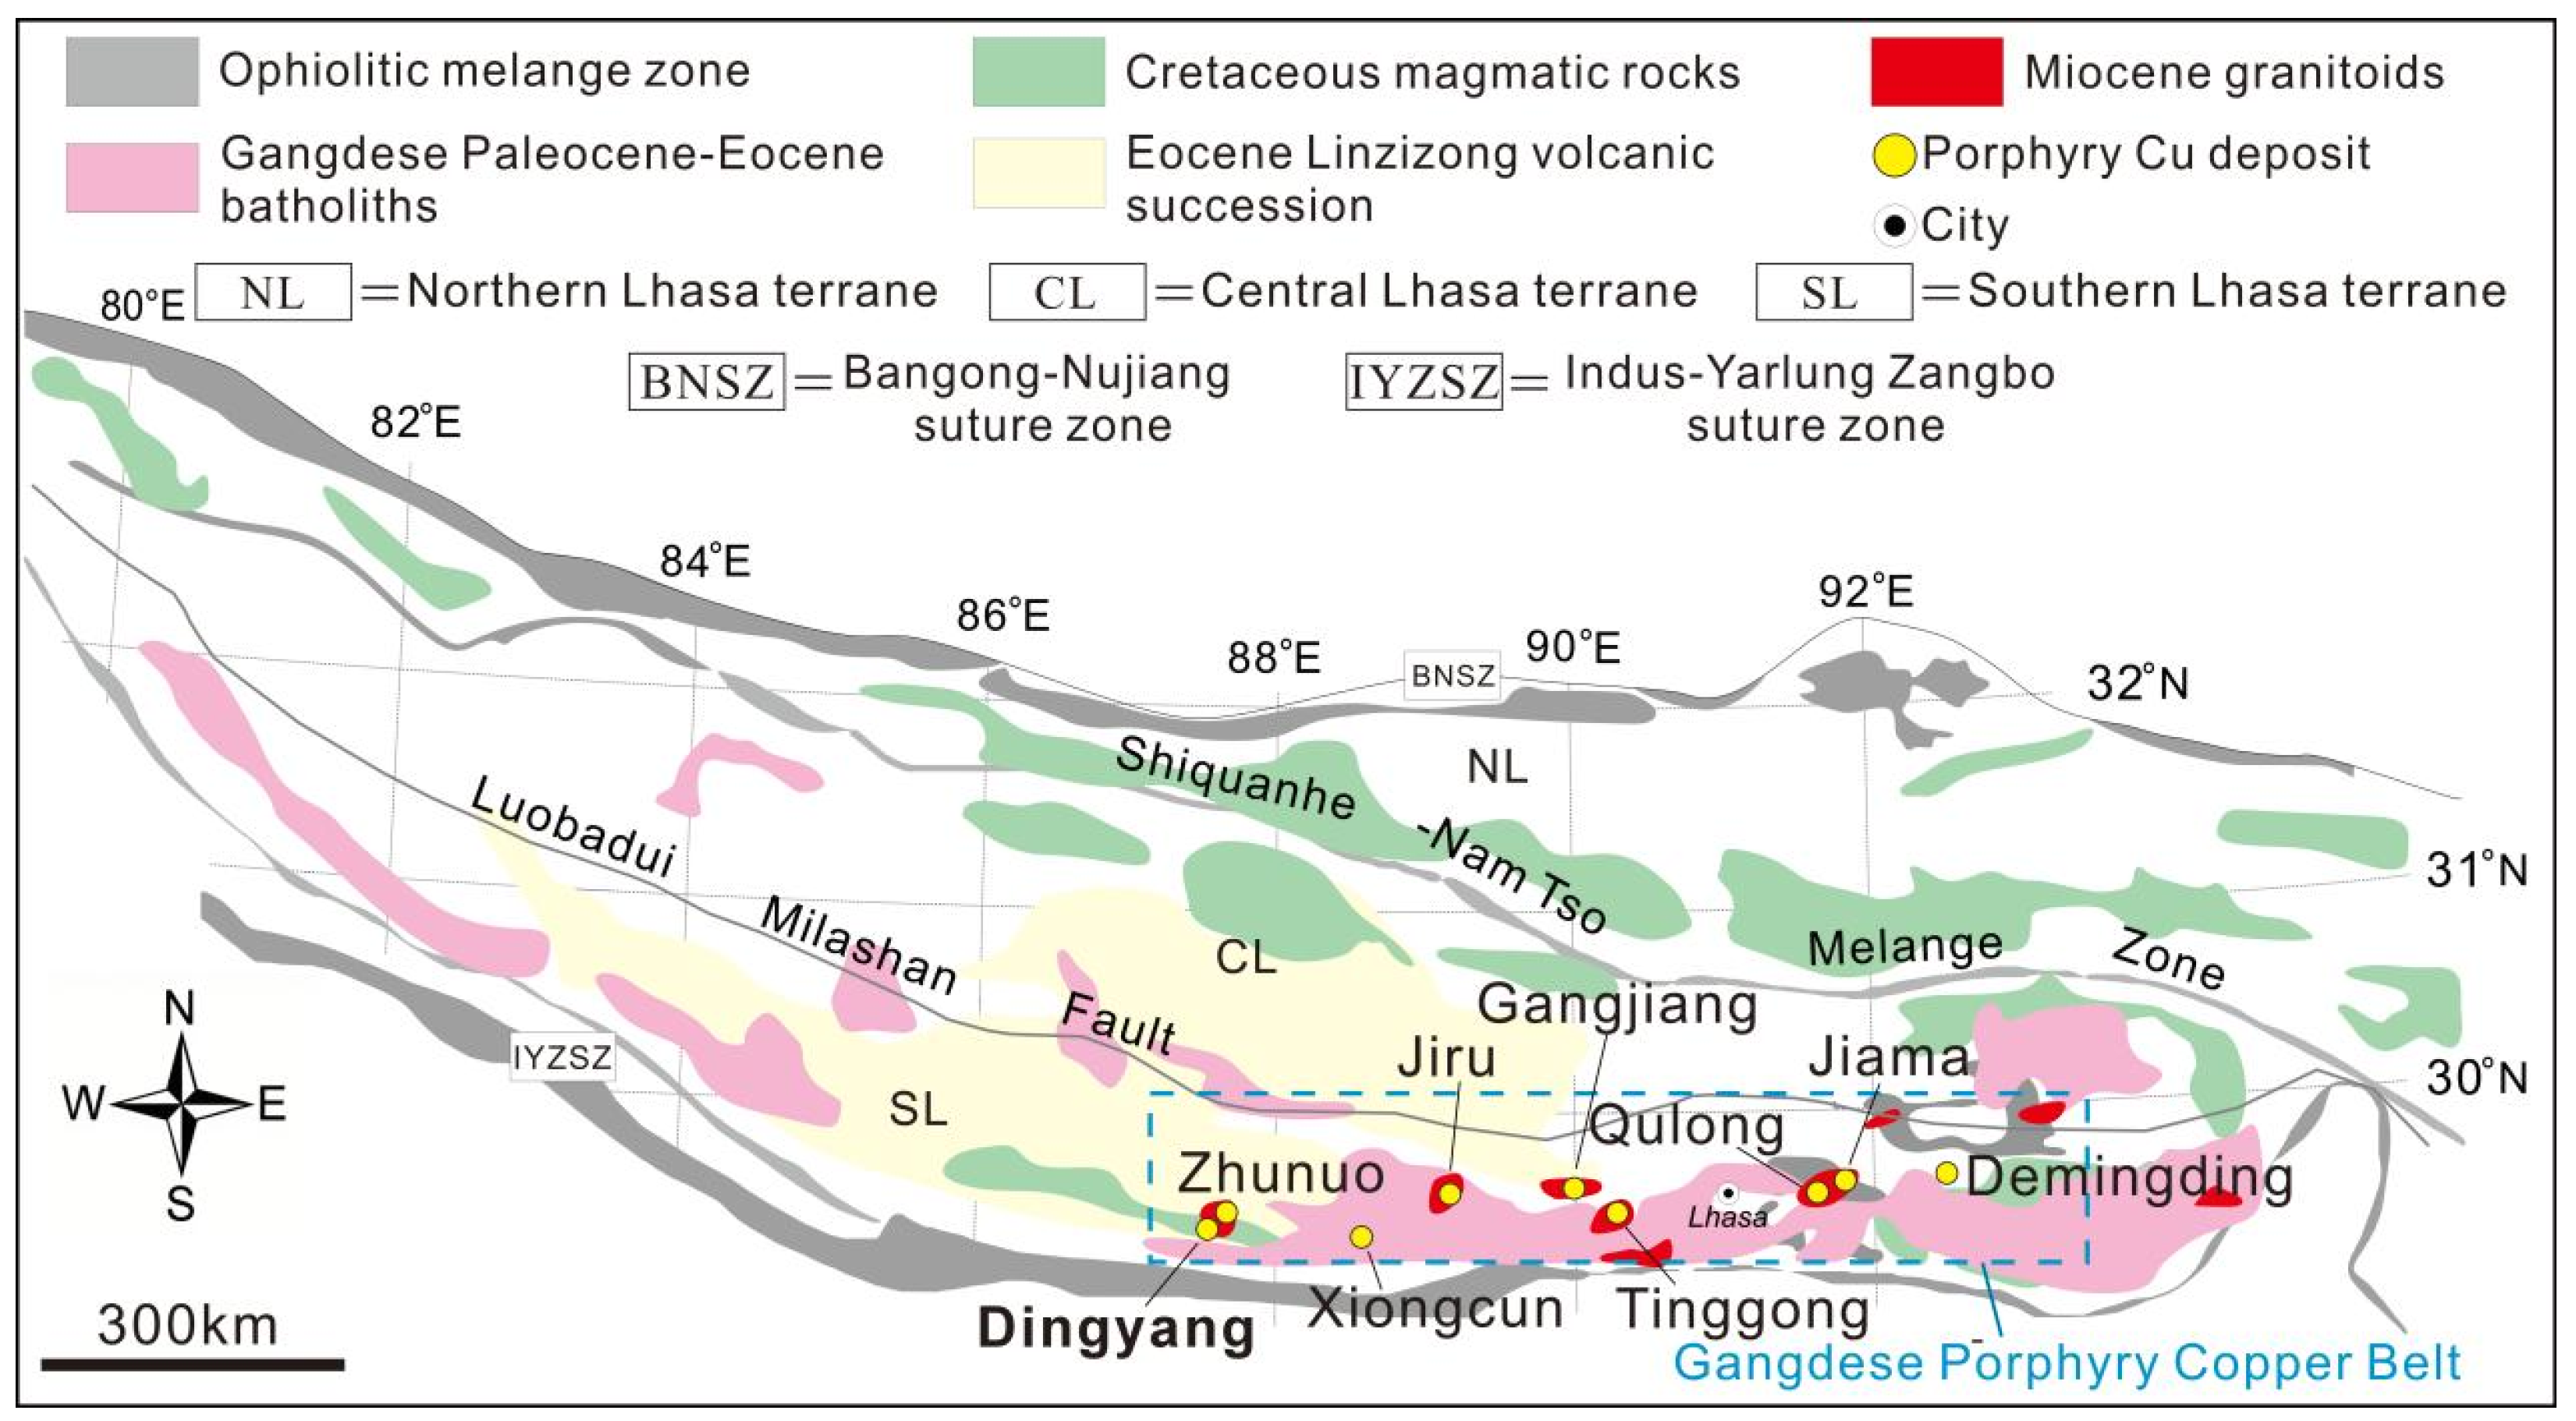
Figure 1. Distribution of porphyry Cu deposits in the Gangdese metallogenic belt and location of the study area (modified from [32,33,34]).
Minerals 15 01045 g001
Figure 2. (a) Al-OH alteration anomaly; (b) Mg-OH alteration anomaly; (c) carbonatization anomaly; (d) ferric contamination anomaly.
Minerals 15 01045 g002
Figure 3. Superimposition of remote sensing alteration anomalies.
Minerals 15 01045 g003
Figure 4. (a) Alteration zoning in the Dingyang study area; (b) histogram of sericite Al-OH absorption peak wavelength position (Pos2200).
Minerals 15 01045 g004
Figure 5. (a) Spatial distribution of sericite Dep2200 values; (b) spatial distribution of sericite Pos2200 values; (c) spatial distribution of sericite SWIR-IC values; (d) spatial distribution of epidote absorption depth (Dep2350) values; (e) spatial distribution of chlorite absorption depth (Dep2250) values; (f) spatial distribution of chlorite absorption position (Pos2250) values.
Minerals 15 01045 g005
Figure 6. (a) A 3D distribution model of sericite Pos2200 values; (b) a 3D distribution model of sericite Dep2200 values; (c) a 3D distribution model of sericite SWIR-IC values; (d) a map of hydrothermal alteration anomaly intensity at the Dingyang surface.
Minerals 15 01045 g006
Figure 7. Mineralization within the target areas of the high-probability metallogenic zone I. (ad) Copper mineralization. Abbreviations: Mal = malachite, Az = azurite.
Minerals 15 01045 g007
Figure 8. Distribution of porphyry deposits (points) in the Zhunuo ore concentration area.
Minerals 15 01045 g008
Table 1. Sentinel-2 satellite remote sensing data and hyperspectral data introduction.
Data SourceSubsystemBand NumberSpectral Range (nm)Spatial Resolution (m)Spectral Resolution (nm)
Sentinel-2VNIR1433–45360 m
2458–52310 m
3543–57810 m
4650–68010 m
5698–71320 m
6733–74820 m
7773–79320 m
8785–90010 m
8 A855–87520 m
9935–95560 m
SWIR101360–139060 m
111565–165520 m
122100–228020 m
ASD TerraSpec HaloVNIR 350–1300 3
SWIR 1300–2500 8.1
Table 2. Principal Component Analysis (PCA) of Sentinel-2 bands for Al-OH mineral mapping: Band2, Band8, Band11, and Band12.
Principal ComponentBand2Band8Band11Band12
PC10.200.500.66−0.52
PC20.800.41−0.37−0.24
PC30.49−0.68−0.050.54
PC4−0.290.33−0.660.61
Table 3. Principal Component Analysis (PCA) of Sentinel-2 bands for Mg-OH mineral mapping: Band3, Band4, Band8A, and Band12.
Principal ComponentBand3Band4Band8ABand12
PC10.380.490.550.56
PC20.580.45−0.10−0.68
PC30.46−0.06−0.750.47
PC40.56−0.750.36−0.07
Table 4. Principal Component Analysis (PCA) of Sentinel-2 bands for carbonate mineral mapping: Band3, Band8, Band11, and Band12.
Principal ComponentBand3Band8Band11Band12
PC10.290.500.640.50
PC20.770.38−0.41−0.29
PC30.29−0.43−0.390.76
PC40.49−0.650.51−0.28
Disclaimer/Publisher’s Note: The statements, opinions and data contained in all publications are solely those of the individual author(s) and contributor(s) and not of MDPI and/or the editor(s). MDPI and/or the editor(s) disclaim responsibility for any injury to people or property resulting from any ideas, methods, instructions or products referred to in the content.