Article

Predictive Modeling of Reservoir Quality Associated with the Dissolution of K-Feldspar During Diagenesis: Lower Cretaceous, Scotian Basin, Canada

by
Christopher Sangster
1,
Georgia Pe-Piper
1,*,
Francky Saint-Ange
2,
David J. W. Piper
3 and
Nicolas Hawie
2
1
Department of Earth Sciences, Saint Mary’s University, 923 Robie Street, Halifax, CO B3H 3C3, Canada
2
Beicip-Franlab, 232 Avenue Napoleon Bonaparte, 92500 Rueil-Malmaison, France
3
Natural Resources Canada, Geological Survey of Canada (Atlantic), Bedford Institute of Oceanography, 1 Challenger Drive, P.O. Box 1006, Dartmouth, NS B2Y 4A2, Canada
*
Author to whom correspondence should be addressed.
Minerals 2025, 15(10), 1008; https://doi.org/10.3390/min15101008
Submission received: 12 August 2025 / Revised: 11 September 2025 / Accepted: 18 September 2025 / Published: 24 September 2025
(This article belongs to the Section Mineral Exploration Methods and Applications)

Abstract

The distribution and quality of the Lower Cretaceous reservoir sandstone units of the Mesozoic–Cenozoic Scotian Basin, offshore eastern Canada, is well known in producing fields but difficult to extrapolate to less-explored areas of the deep-basin floor. Prediction of reservoir risk is complicated by salt tectonism and the strong influence of diagenesis on reservoir quality. This study investigates the burial diagenetic dissolution of detrital K-feldspar in the subarkosic sandstones and the preservation of the resulting secondary porosity. K-feldspar abundance declines with increasing depth, creating secondary porosity, which in open systems is preserved but in closed systems is clogged by carbonates and clays. The distribution of detrital K-feldspar has been simulated using forward stratigraphic modeling and is compared to thermal modeling, fault mapping, and sand distribution to determine the risk due to the reservoir quality, illustrated as common risk segment maps. Sand deposits have the lowest risk of poor reservoir quality along the shelf edge and upper slope of the central and western basin, where growth faulting created an open diagenetic system. This novel combination of petrographic study and forward modeling has applications to other regions where diagenesis has a strong influence on the reservoir quality, such as the Gulf of Mexico.

1. Introduction

Porosity and permeability are important factors in determining reservoir quality. However, these properties are susceptible to alteration as a result of both diagenesis and compaction during burial. Furthermore, in deepwater settings, wildcat wells are sparse, and most potential reservoirs are not sampled. It is therefore important to understand the factors that promote high reservoir quality and, if possible, attempt to predict where these reservoirs are likely to occur. This study aims to provide a novel framework for predicting reservoir quality by applying stratigraphic modeling techniques and petrographic studies in order to evaluate the influence of the dissolution of detrital K-feldspar on the subarkosic Cretaceous sandstones of the Scotian Basin. Our postulate is that because the sandstones have 10%–15% K-feldspar as framework grains, the dissolution of these grains at depth is a principal source of secondary porosity in the basin.
While compaction invariably reduces both porosity and permeability [1,2,3], diagenesis is capable of both reducing and enhancing these properties. The presence of high-quality reservoirs, which deviate from predicted porosity–depth trends, is often attributed to limited compaction, limited cementation, or well-preserved secondary porosity [4]. The interaction of sandstones with basinal fluids, and increasing temperature and pressure, ordinarily results in decreased porosity and pore throat size via the formation of authigenic quartz overgrowths, clays, and carbonate cements. However, the breakdown of unstable minerals during burial and diagenesis can also produce secondary porosity [4,5,6].
Minerals that break down during diagenesis include garnet [7], carbonates, alkali feldspars [8], and, to a lesser extent, plagioclase feldspars. K-feldspar is a common detrital mineral in many sandstones, and its breakdown therefore can contribute greatly to porosity enhancement [8,9,10,11,12]. With increasing depth and temperature [13], K-feldspar breaks down and produces numerous authigenic phases, including authigenic K-feldspar, albite, kaolinite, and illite. The impact that such byproducts have on secondary porosity is dependent on the degree to which they are retained within the system, such that open systems allow for the retention of porosity [14,15], and closed systems result in any newly generated porosity being filled [10,16,17]. Open systems typically contain abundant faults and fractures or beds with high permeability, which allow for fluids to circulate easily. This allows for the supply of basinal fluids, which break down the K-feldspar, and also the removal of byproducts, which are carried away to deposit elsewhere in the basin [8].
Numerical forward stratigraphic modeling software has been widely and successfully used to predict the distributions of sandstones in underexplored basins [18,19,20,21,22]. The distribution of K-feldspar, as a component of quartz sandstones, can likewise be simulated. The proportion of K-feldspar in sandstones is linked to sediment provenance [23] and can be determined from wells at shallow burial depths, where K-feldspar proportions are unaffected by dissolution. Thus, numerical modeling software can be used to predict the initial distribution of the K-feldspar within the basin. This distribution can then be compared to regional maps of depth, thickness, temperature, and structure to determine the risk of K-feldspar dissolution and the preservation of the resulting secondary porosity.
Petroleum exploration in the Mesozoic Scotian Basin, began in the 1960s and, since 1992, has produced a modest amount of gas and lesser oil [24]. Recent exploration has focused on salt structures in the deepwater part of the basin, where there are few wells, and relatively few sands have been penetrated. In the shallower-water part of the basin, there has been extensive work on stratigraphy, structure, and petroleum geology, particularly in the Upper Jurassic to Lower Cretaceous part of the section [25]. Sandstone provenance, depositional environments, diagenetic processes, and their relationships to reservoir quality are all well studied. The sources of K-feldspar in sandstone are known from Pb isotopes [23], and the petrographic style of feldspar diagenesis and its relationship to salt tectonics have been documented [26]. However, the systematic variations of K-feldspar dissolution with both increasing depth and geography are not well defined by previous work. Furthermore, the predictions of relatively low reservoir quality risk in deep water, made in 2011 [25], were not substantiated by later wildcat drilling [27].
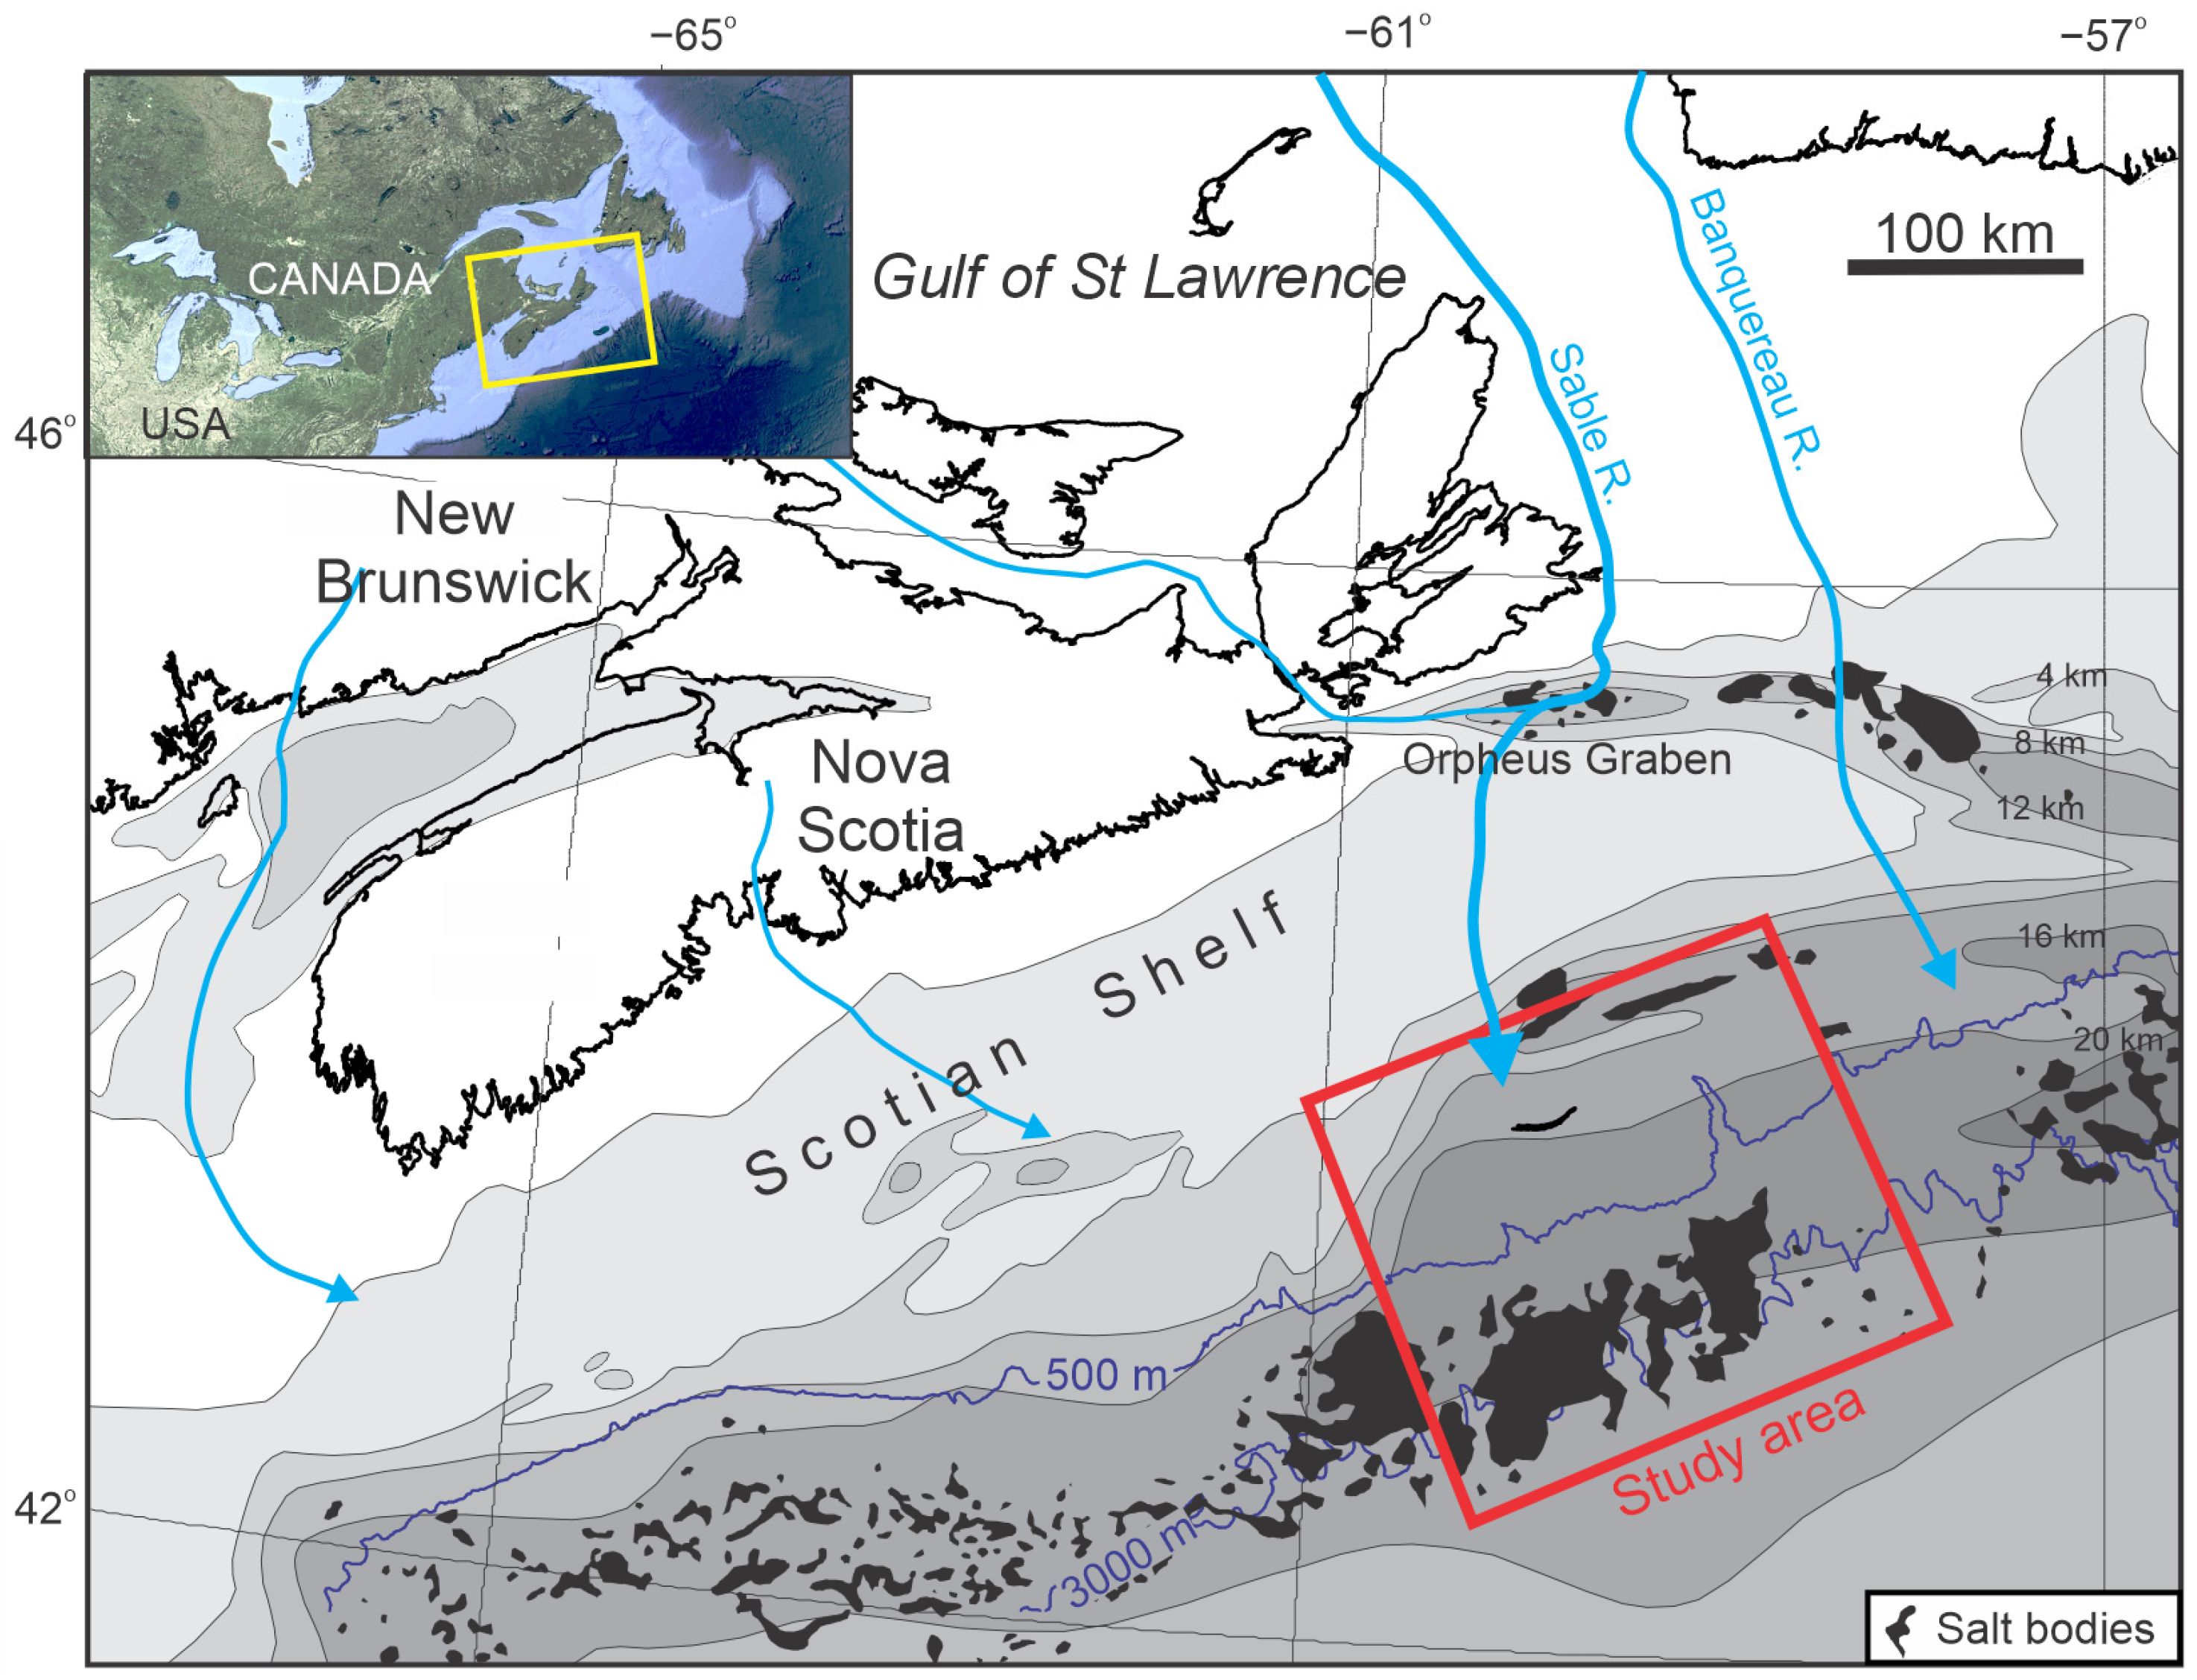
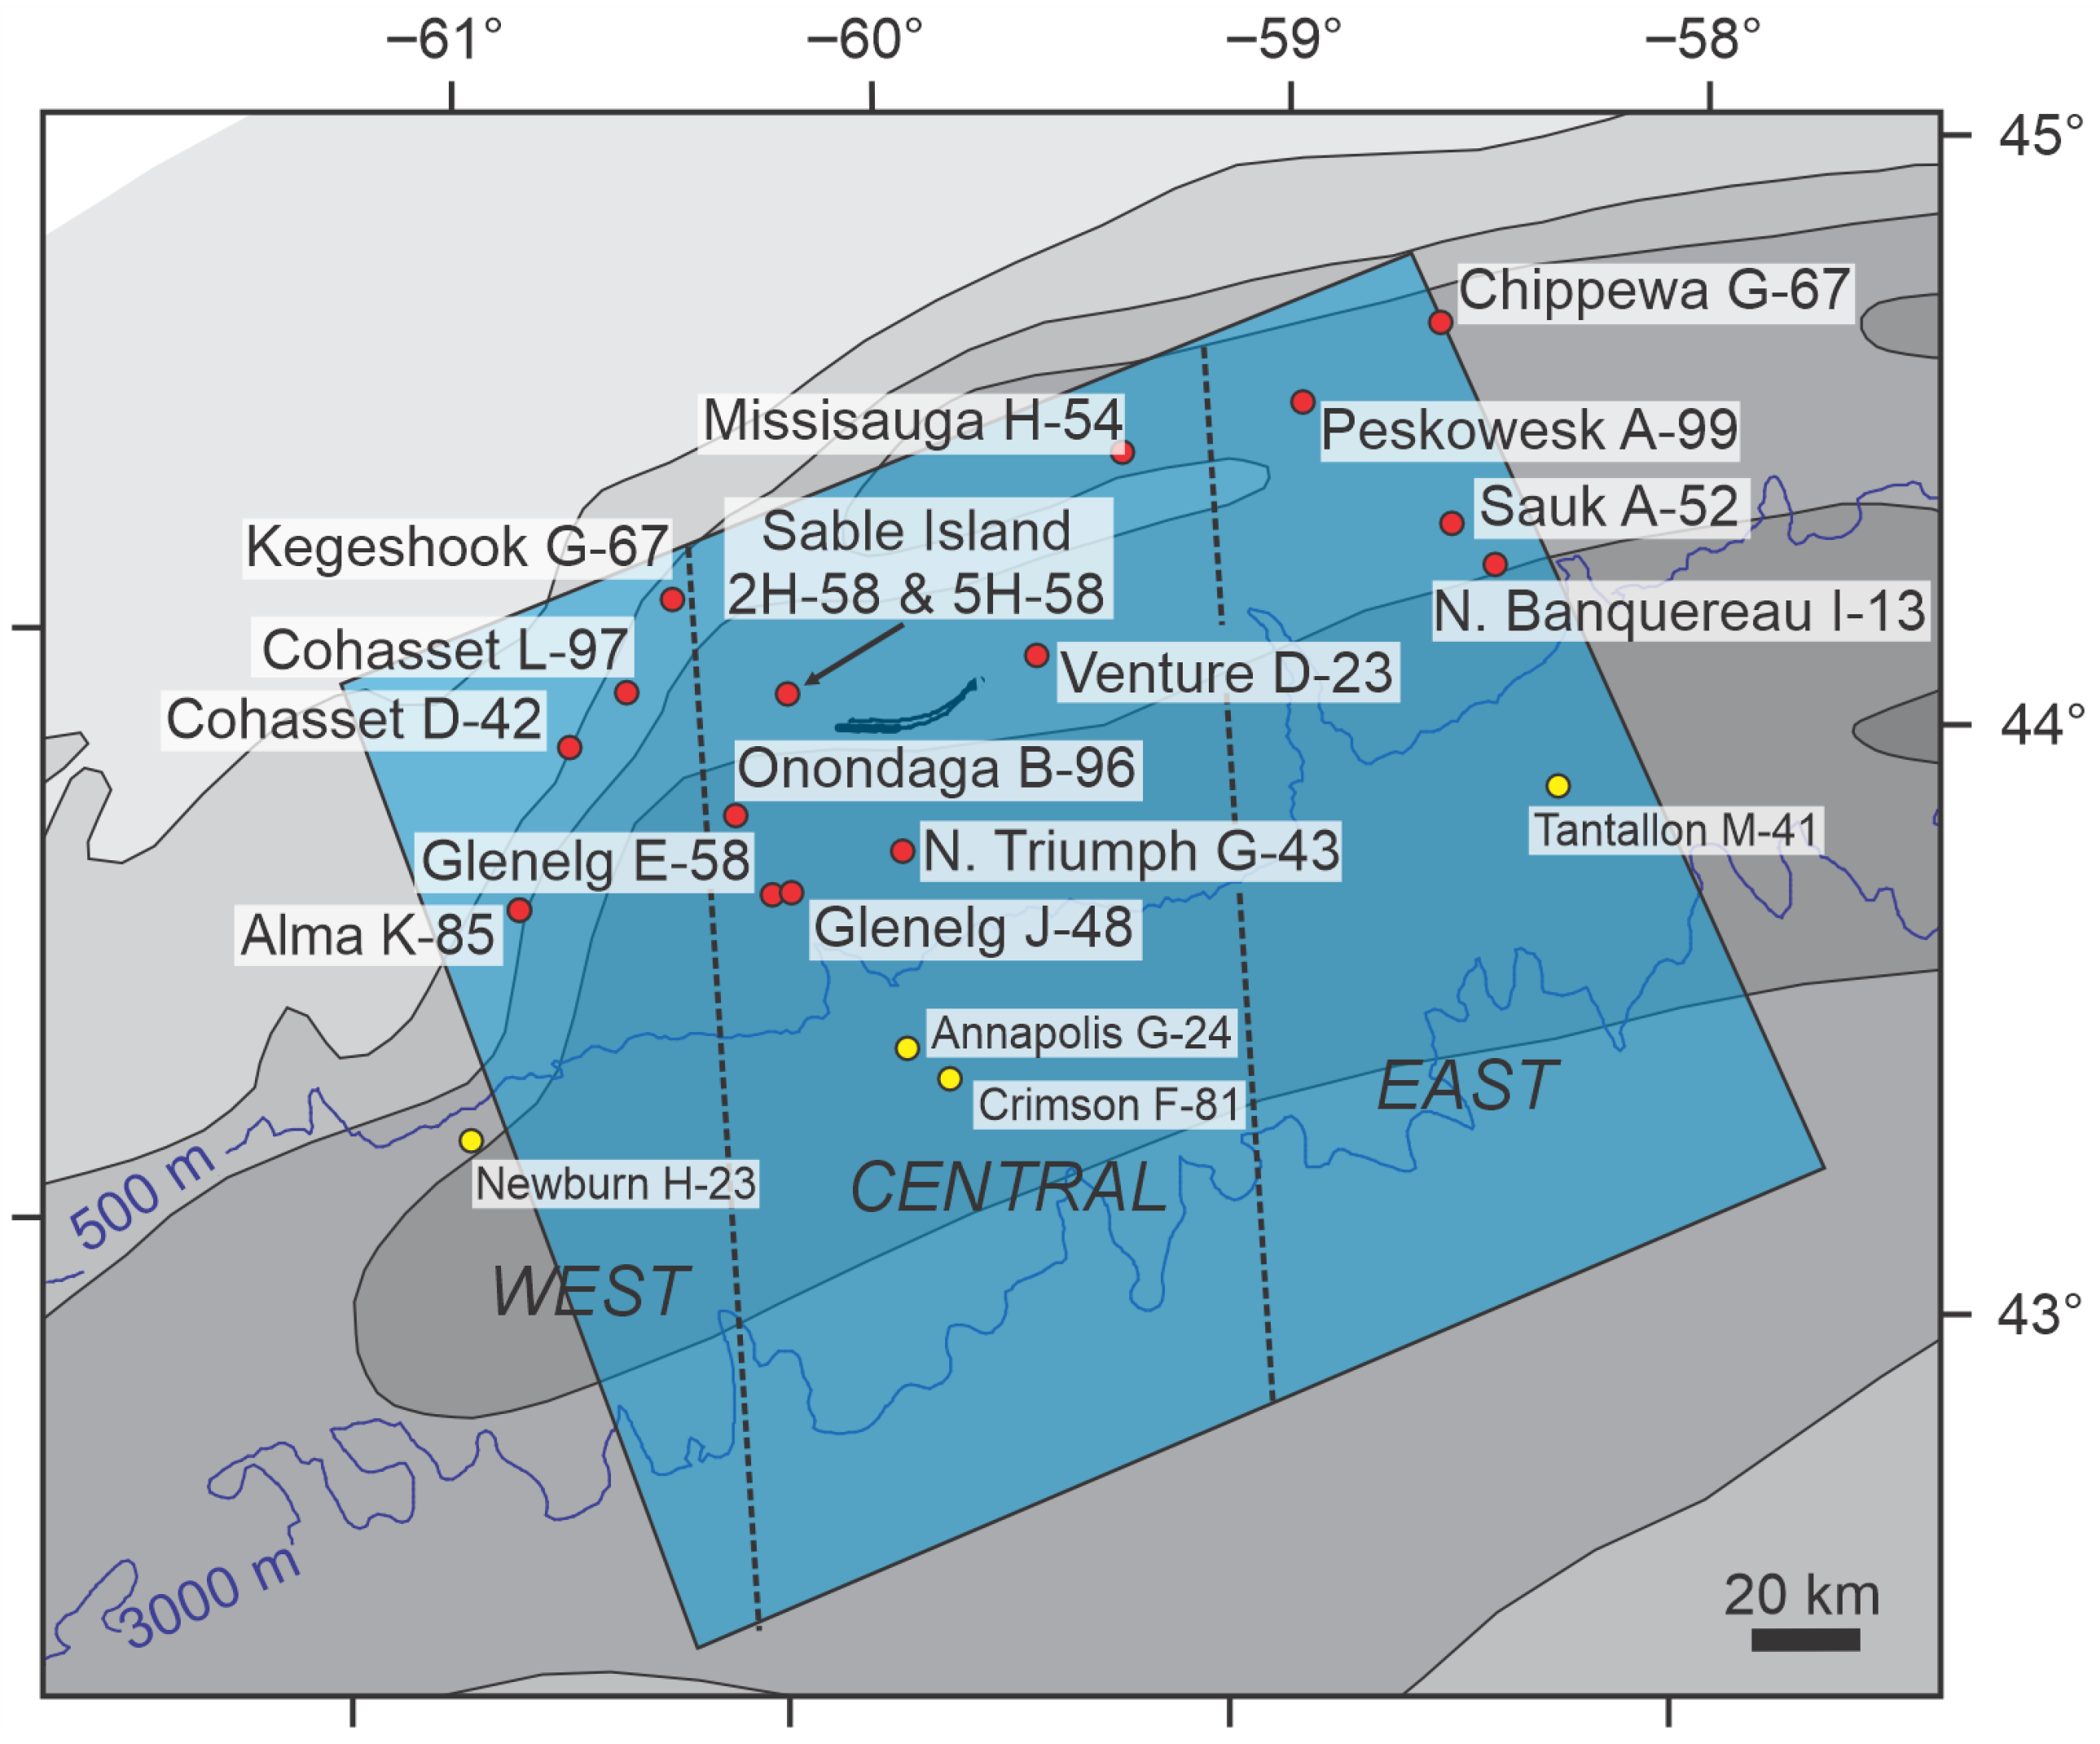
This study attempts to remedy these two deficiencies. It builds upon previous stratigraphic modeling conducted in the Scotian Basin [28] and focuses on the Lower Cretaceous reservoir sandstone from the base of the Barremian (130 Ma) to the top of the Albian (101 Ma). This age span, which includes the Upper Missisauga Formation and the Naskapi and Cree members of the Logan Canyon Formation (Figure 1), is an interval of producing reservoirs within the Scotian Basin, which has been the focus of many studies on sediment provenance (summarized by [23,29]) and on diagenetic processes [26,30,31,32,33]. The study area is a 185 × 215 km region in the central Scotian Basin, including both the well-studied shelf and the deeper-water part of the basin with complex salt tectonics (Figure 2).
The K-feldspar distribution was modeled using DionisosFlowTM [37], diffusion-based, deterministic 4D multi-lithology forward stratigraphic modeling software, which simulates basin infilling over geological timescales [38]. Calibrated “reference case” models, generated in a previous study [28], are used as the basis for these simulations. This study aims to determine: (1) if there is spatial variation in original feldspar proportion within the Scotian Basin, (2) the extent to which the Scotian Basin is influenced by the dissolution of K-feldspars, (3) whether the feldspar distribution can be modeled, and (4) if the reservoir quality can be predicted by generating common risk segment (CRS) maps, which take into account the breakdown of simulated K-feldspar, preservation of the resulting secondary porosity, and sand distribution from previous modeling.

2. Geological Setting

2.1. Stratigraphy

The Scotian Basin is located offshore Nova Scotia (Figure 2) and initially formed in the breakup of Pangea during the Mid-Triassic. It is a collection of depocenters, which have accommodated more than 12 km (to a maximum of 18 km) of Mesozoic–Cenozoic sediments [36]. These thick sediments were accommodated as a result of the remobilization of salt-rich evaporite successions of the Upper Triassic to Lower Jurassic Argo Formation. Mobilization resulted from loading by overlying Jurassic and Cretaceous deltaic-sediments, which generated a detached salt sheet in some areas and causing widespread listric faulting in the basin [39,40,41]. The thick siliciclastic Upper Jurassic–Lower Cretaceous Missisauga and Logan Canyon formations formed as a result of enhanced sediment supply from the rising Labrador rift shoulder [23,29].
The Upper Missisauga Formation is a sand-rich interval, which formed in the Late Hauterivian to Barremian. This unit is overlain by the Logan Canyon Formation, which is composed of four members that alternate between shale and sand-dominated units: the Aptian Naskapi Member, Albian Cree Member, and Cenomanian Sable and Marmora members [36] (Figure 1). On the Scotian Shelf, these units were deposited in estuarine, deltaic, and open-shelf environments. On the basin slope and floor, deposits include prodeltaic shales, turbidite sandstones and shales, and mass-transport deposits [27,42]. The Naskapi Member is exceptional in having only thin and sparse sands and represents a period when the distant river supply was diverted away from the basin [43].

2.2. Sediment Facies and Architecture

The Upper Missisauga and Cree members have a cumulative thickness of 0.5–1.3 km and are sedimentologically similar, with the estuarine, deltaic, and shoreface sands on the shelf commonly forming upward-coarsening progradational parasequences 10–40 m thick [44]. At times of maximum delta progradation, sand was transported to deep water through delta-front canyons and accumulated in channel-floor, overbank, and minibasin-fan settings [45]. Thick estuarine and river-mouth sands are important reservoir rocks [46]. Linked estuarine and deepwater channels are inferred to be major fairways for deep-basinal fluids [47].

2.3. Provenance of Detrital Sediment

Provenance studies conducted in the Scotian Basin were based on detrital mineral chronology, chemical fingerprinting of detrital minerals, and bulk rock geochemistry. These data suggest that the Missisauga and Logan Canyon Formations were deposited by sediment from three main river systems that supplied different parts of the basin (Figure 2): local rivers from the Meguma Terrane, the Sable River, and the Banquereau River [23,29]. The sediments of the western basin were deposited predominantly by the minor rivers draining the Meguma Terrane of mainland Nova Scotia, which also had a minor contribution to the central basin [48]. The central Scotian Basin contains sediments that were transported by the Sable River from a variety of sources, including the Grenville Province of southern Labrador and eastern Quebec, the Makkovik Province of central Labrador, the Long Range Inlier of western Newfoundland, the crystalline basement of the Appalachian orogen, and polycyclic sedimentary rocks from the Carboniferous Maritime Basin [23,49,50]. Sediments in the eastern basin were supplied by the Banquereau River from western Newfoundland, including the Cabot fault zone [49], with minor sediments sourced from the Makkovik Province in the Labrador Rift [51] and by local rivers from central Newfoundland [52]. While several of these rivers transport sediments from catchment areas that contain feldspars, Pb isotope data show that the majority of the K-feldspar supplied to the Scotian Basin since the Hauterivian originated from the Grenville Province of Labrador and eastern Quebec [23]. Although some variation in the supply of K-feldspar in the Hauterivian-to-Albian interval cannot be excluded, due to changes in the hinterland climate or the extent of the drainage basin, the detrital petrology record is remarkably consistent between the Upper Missisauga and Cree members in detrital zircon geochronology [50] and detrital monazite geochronology [51]. All the petrographic indicators suggest a higher proportion of Appalachian sources to the western and eastern parts of the basin.
Sandstone framework minerals consist predominantly of monocrystalline quartz (Figure 1b). Feldspars are most abundant in sandstones buried less than 3 km deep, corresponding to the Cree Member in this study, but decrease in abundance in more deeply buried sandstones [26]. Lithic clasts include polycrystalline quartz of metamorphic origin [52] and volcanic and hypabyssal trachyte and rhyolite from contemporary volcanism in the hinterland [26]. Most sandstones classify as subarkose, but more deeply buried sandstones with K-feldspar dissolution may fall in the sublitharenite field (Figure 1b).

2.4. Overview of Diagenesis

The Scotian Basin shows a variation in the influences of diagenetic processes with increasing depth. Seafloor diagenetic processes resulted in the formation of Fe-rich clays, phosphate, and carbonate cements [53]. The Fe-rich clays recrystallized as berthierine rims on quartz grains in thick delta-front sandstone beds [30]. These berthierine rims later converted to chlorite, inhibiting the formation of silica cements and preserving porosity [30]. Sea-level lowstands produced kaolinite cements as a result of fluxes of meteoric water. With increasing depth of burial, formation waters precipitated quartz overgrowths followed by Fe–calcite and ankerite cements [31]. Secondary porosity formed by the dissolution of feldspars and dissolution and fracturing of quartz and carbonate cements [26,33,54]. During late-stage diagenesis, some of this secondary porosity has been filled by illite, chlorite, kaolinite, siderite, barite, and sphalerite [47], as well as by authigenic albite [26].
The high-temperature diagenetic mineral assemblages present in the Scotian Basin are related to a widespread thermal event, which occurred in the Aptian–Albian [55]. This event is recorded by volcanism in the Orpheus Graben, enhanced heat flow in terrestrial basins, high entrapment temperatures in primary fluid inclusions in quartz overgrowths and carbonate cements [54], strongly negative δ13C values in carbonate cements [54], apatite fission track modeling [56], and the presence of diagenetic zircon outgrowths [57]. Based on these factors, a geothermal gradient of 50 °C/km is interpreted for the Aptian–Albian [47,57]. This increased thermal gradient is thought to have heated underlying autochthonous salt and continental basement rocks to temperatures greater than 400 °C, which, in turn, heated circulating brines.

2.5. Diagenesis of Feldspars

A detailed petrographic study of feldspar diagenesis in the Scotian Basin has been published recently by Pe-Piper and Piper (2022) [26]. The study illustrates the textural evidence for K-feldspar dissolution with increasing depth and the replacement of detrital plagioclase and K-feldspar by authigenic albite. K-feldspar diagenesis occurs below 1.9 km, initially with the formation of authigenic K-feldspar as overgrowths on detrital K-feldspar and diagenetic albite following fractures and planes of weakness in K-feldspar grains. With increasing depth, grains are dissolved or replaced by ferroan calcite and ankerite, and grains ultimately disappear between 3.8 km and 4.5 km sub-bottom. Dissolution has been interpreted to be controlled by burial depth and appears to be most significant in permeable sandstone units that were fairways for saline basinal fluids. The study was based on conventional cores and, thus, had less stratigraphic and geographic coverage than is required for our modeling study.

2.6. The Origins of Secondary Porosity

A regional study of the impact of diagenesis on the regional reservoir quality in the Scotian Basin, by Zhang et al. (2015) [33], quantitatively determined the abundance of diagenetic minerals in 35 reservoir sandstone samples and measured total porosity, with estimates of what proportion was due to primary porosity and what proportion to secondary porosity. The study concluded that local factors, including depositional lithofacies and sequence stratigraphy, salt tectonics, the creation of secondary porosity, overpressure, and hydraulic fracturing around the top of the overpressure, rather than regional factors, are the dominant controlling influence on the reservoir quality. About half the studied samples appear to have formed under closed-system conditions, with secondary porosity largely filled by carbonate and clay cements. The remaining samples appear to represent open-system conditions, with the dissolution of K-feldspar and preservation of substantial porosity. The creation of secondary porosity is related to the circulation of hot and corrosive saline basinal fluids through thick permeable sandstones [26]. Analysis of the salinity from fluid inclusions shows that the most saline formation waters were generated at times of salt tectonic deformation ([26], their Figure 18). However, pore throats associated with secondary porosity are commonly small, resulting in a minor contribution to permeability [33].

3. Materials and Methods

3.1. Modeling Strategy and Principles of Forward Stratigraphic Modeling by DionisosFlowTM

The purpose of the forward stratigraphic modeling in this study is to reconstruct the depositional spatial distribution of K-feldspar, which is the source material for subsequent dissolution and the creation of secondary porosity. Geographic variability in K-feldspar inputs to the basin is estimated from the K-feldspar contents of samples buried <2 km and, thus, little affected by dissolution. Then the modeled initial distribution of K-feldspar is integrated with post-depositional factors, particularly, thermal history, fault mapping, and fluid flow pathways, to predict the degrees of dissolution and the preservation of that porosity. This latter step is achieved using common-risk-segment (CRS) methodology [58].
DionisosFlowTM forward stratigraphic modeling software simulates basin infill by reproducing the net sediment supply, transport, and accommodation that result from uplift, subsidence, and sea-level fluctuation over geological timescales [59]. Sediment transport is simulated using empirical water- and gravity-driven diffusion equations in a sequence of time steps. Two types of scenarios are considered by these equations: (1) low-energy long-term transport, which is the permanent flow determining the sediment transport from typical fluvial sources and oceanographic processes, such as longshore drift, and (2) high-energy short-term transport, which is related to high-energy events, such as major fluvial floods and turbidites [19,60]. The diffusion equations represent the ratio between the sediment discharge and basin slope [18] and can be expressed using the following simplified formula: (average sediment thickness × basin length (km))/(time span (Ma) × basin slope (m/km)). Different diffusion coefficients are assigned to each sediment class simulated, such that smaller grain sizes have higher coefficients than larger grain sizes. Diffusion coefficients and river inputs were derived iteratively in “reference case” models that were calibrated to lithofacies in wells and the total sediment thickness [28]. The modeling in both studies used a 5 × 5 km grid size and a 0.25 Ma time step.

3.2. Sampling Strategy

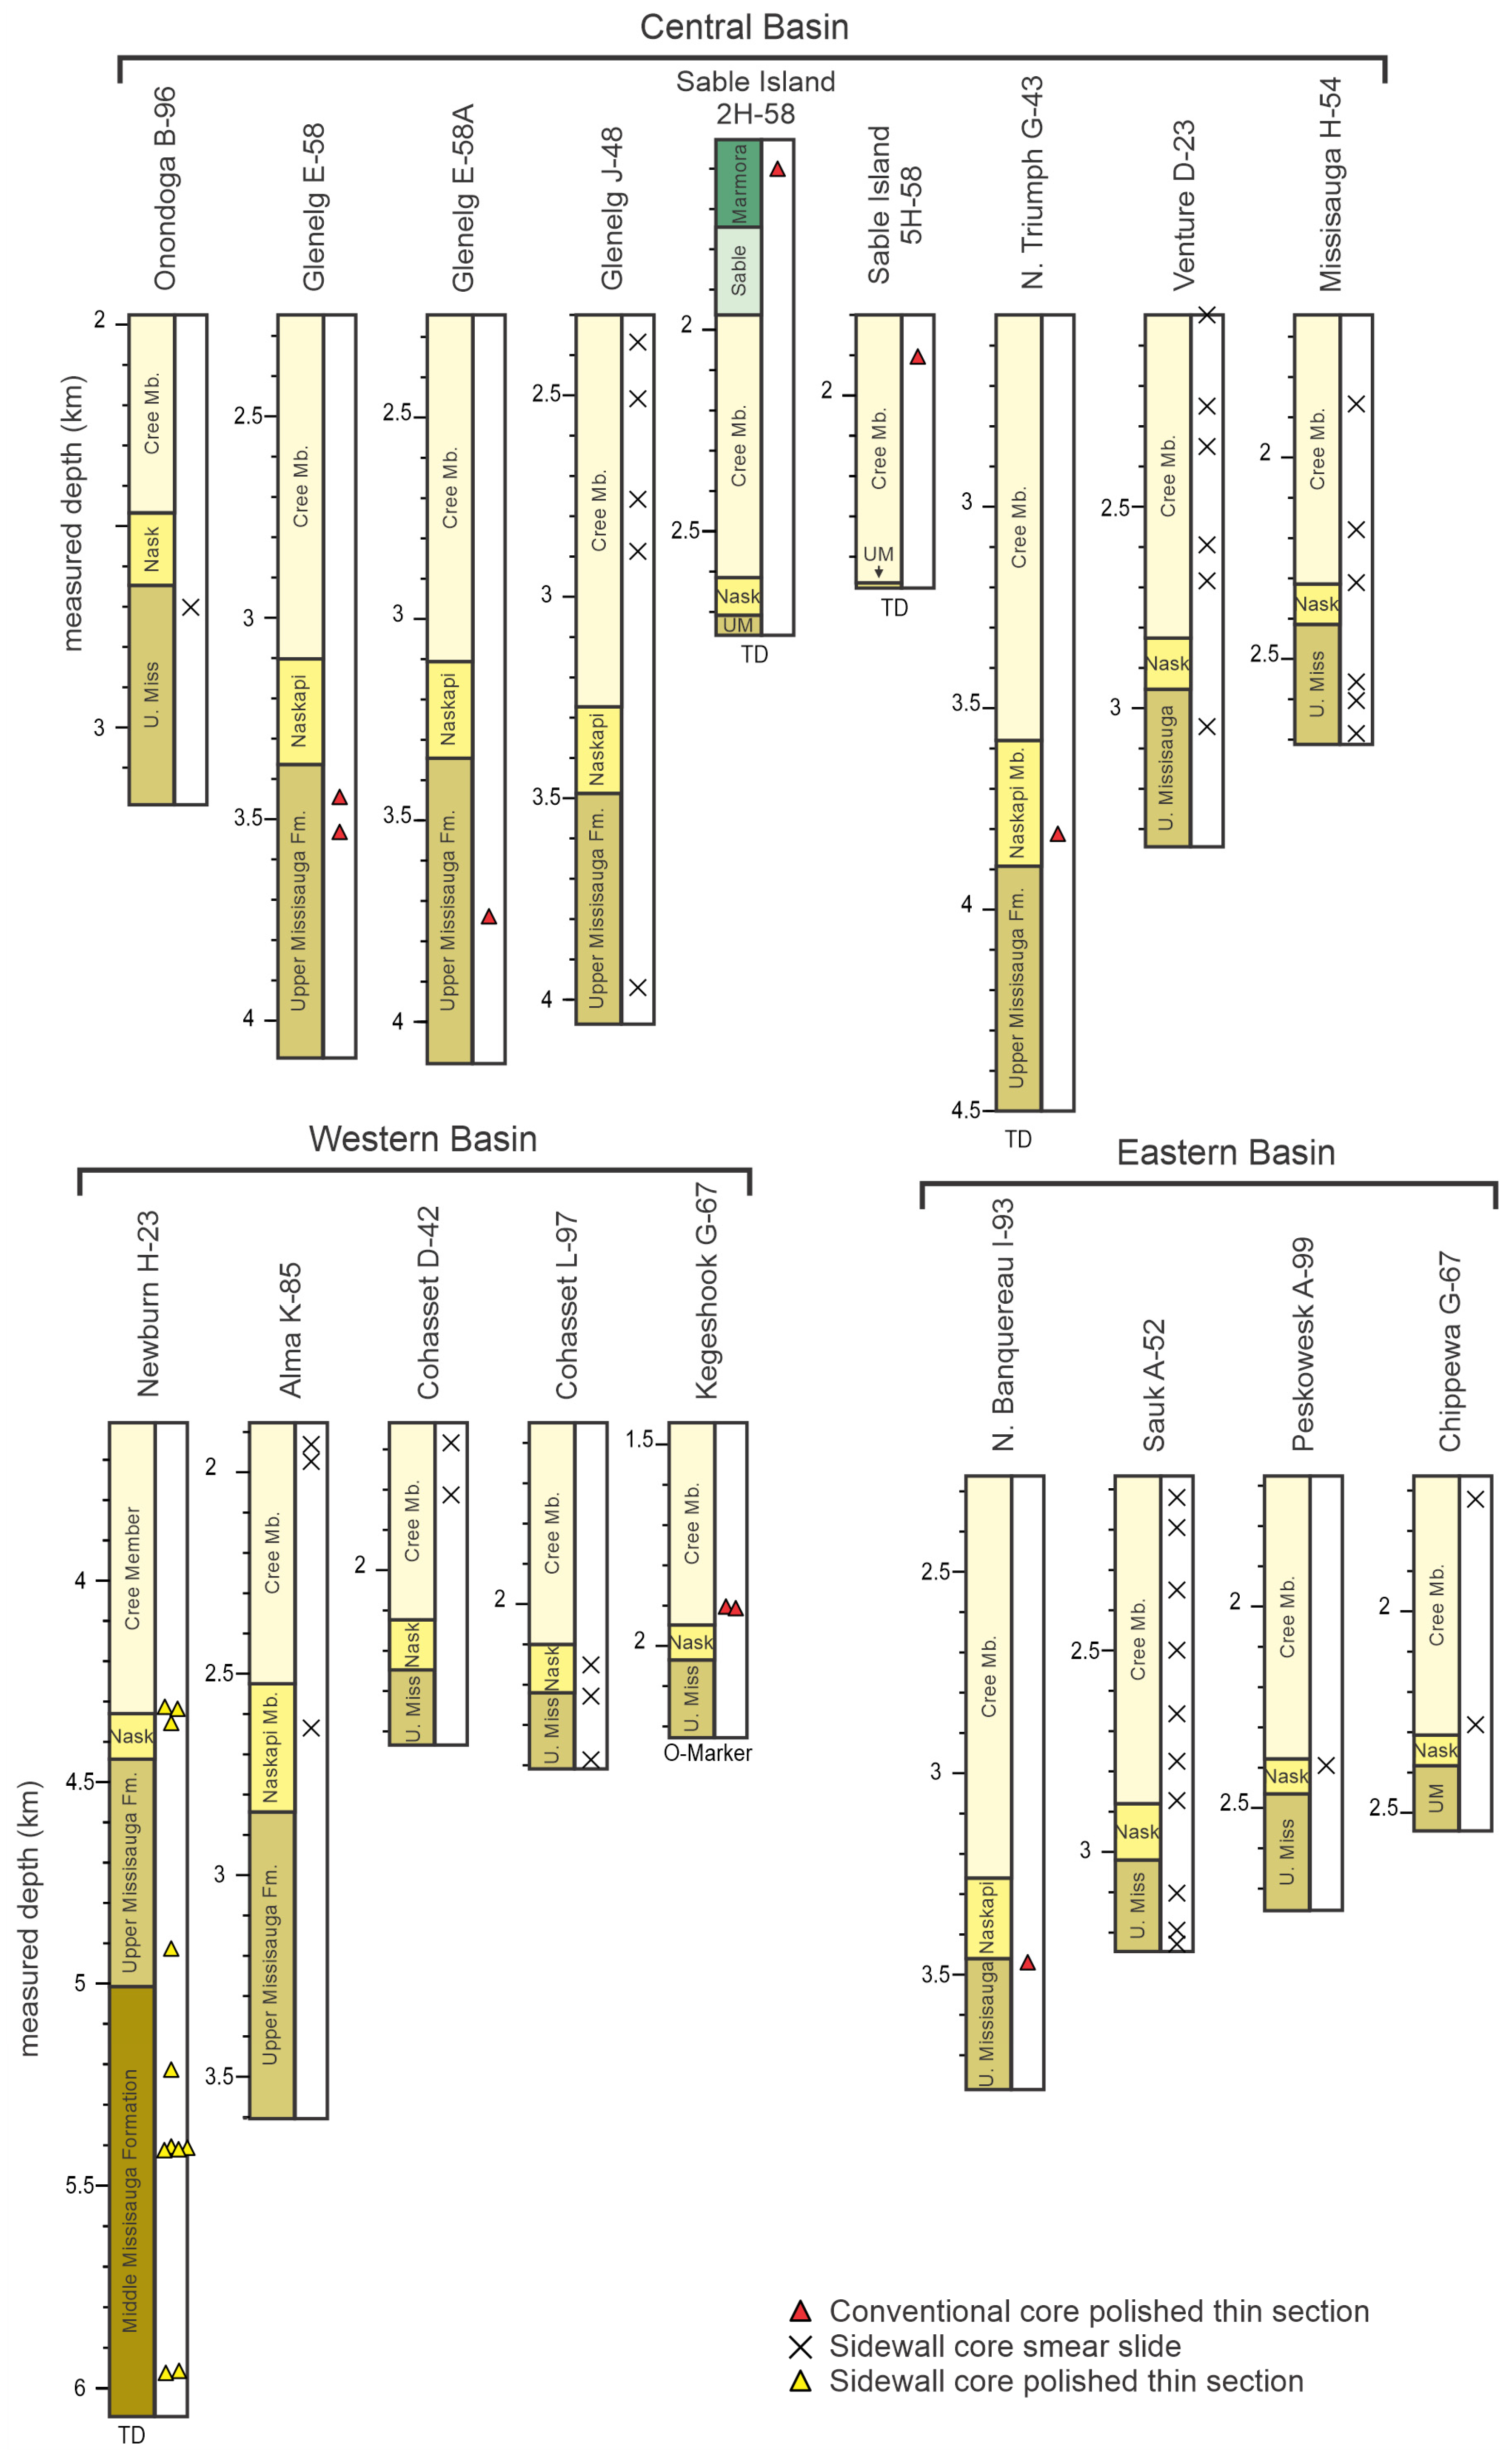
The distribution of conventional cores in the Scotian Basin is stratigraphically quite limited. To adequately sample the temporal and spatial variability of K-feldspar, it was necessary to use mostly sidewall core samples. To determine the proportion of feldspar throughout the study area and through time, 48 samples have been analyzed from sand-rich intervals in a total of 15 wells throughout the basin (Figure 3), representing an area of 20,000 km2 on the shelf. An equal area of the basin slope and floor had no sample availability from the deepwater wells in the area.
All the samples were obtained from the Canada Nova Scotia Offshore Petroleum Board (CNSOPB). Due to sampling regulations, traditional sidewall core samples were unavailable. Instead, sidewall core rubble was permitted for sampling. This rubble had accumulated in the plastic vials in which the sidewall cores were stored by the breakup and abrasion of the cores over the decades. It may have included some drilling mud. This rubble was sent to Vancouver Petrographics (Langley, BC, Canada) to produce 39 polished, smear slide thin sections (Table 1). Nine additional polished thin sections were prepared from conventional cores. Of the analyzed samples, 15 are from the Upper Missisauga Formation, five are from the Naskapi Member, 27 are from the Cree Member, and one is from the Marmora Member (Table 1; Figure 4). The central Scotian Basin is represented by 24 samples, with 14 samples taken from the eastern Scotian Basin and the remaining 10 from the western Scotian Basin (Figure 4).

3.3. Feldspar Analysis

To determine the modal compositions of these sandstones, point-counting of quartz and feldspar was conducted on an initial group of 16 samples using backscattered electron (BSE) images from a scanning electron microscope (SEM), replicating the method used in [33]. Minerals are differentiated on the basis of their grayscale brightness, which is controlled by their mean atomic numbers [62] and confirmed by numerous energy-dispersive spectroscopy (EDS) analyses. Quartz and albite, which have similar BSE brightness values, were distinguished by EDS analysis and petrographic texture.
The remaining 32 samples were point-counted from X-ray mapping analysis for Si, Na, and K, supplemented as necessary by EDS analyses and using petrographic texture to separate feldspars from micas. No attempt was made to quantify other mineral species, as the sidewall core rubble did not systematically preserve finer-grained diagenetic minerals. Detrital mineral assemblages in the Scotian Basin are dominated by quartz and feldspar species; therefore, the compositional data from these samples are represented as the normalized percentages of quartz, plagioclase, and K-feldspar (Table 1).
SEM analysis was completed at the Regional Analytical Centre of Saint Mary’s University, using a TESCAN MIRA 3 LMU variable-pressure Schottky-field-emission scanning electron microscope (Tescan, Brno, Czechia), acquiring the backscattered electron (BSE) images and energy-dispersive spectroscopy (EDS) chemical analyses of minerals. This SEM has a maximum resolution of up to 1.2 nm at 30 kV. It is equipped with an INCA X-max 80 mm2 silicon-drift detector EDS system (Oxford Instruments, Abingdon, UK) that has a detection limit >0.1% for elements with atomic numbers above that of F. A tungsten filament produces a beam with a diameter of <10 nm and has an X-ray production volume of ~10 μm3. A cobalt plate serves as a calibration standard.
A minimum of 600 detrital mineral grains were counted in each sample, yielding a 1.7% estimated probable error at 95% confidence for a component present with 5% abundance. X-ray maps and large numbers of EDS analyses were taken at each site to identify the various detrital mineral species. BSE and X-ray map images were processed using the PowerTrace™ tool in CorelDrawTM X3 and X7 software [63] and colored according to their composition. The images were then analyzed using MultiSpecTM, version 2025.03.06 [64] to determine the area percentages of all the grains of quartz and feldspar. The sizes of the quartz and K-feldspar grains were measured using ImageJTM v.1.51 image-processing software [65], with a minimum of 300 total grains measured for each sample (Table 1). A minimum grain size cutoff threshold was determined based on the size of the finest quartz grain present (Table 1).
Three other datasets have informed this study. A set of 51 thin sections from conventional cores analyzed by point-counting framework grains using a petrographic microscope [35]; a set of 15 thin sections from sidewall cores in Newburn H-23, also analyzed by petrographic microscopy and reported by [61]; and a set of 35 samples from conventional cores, point-counted from BSE images, focusing on diagenetic minerals and porosity, as published in [33].

4. Results

4.1. Feldspar Analysis

4.1.1. K-Feldspar Proportion

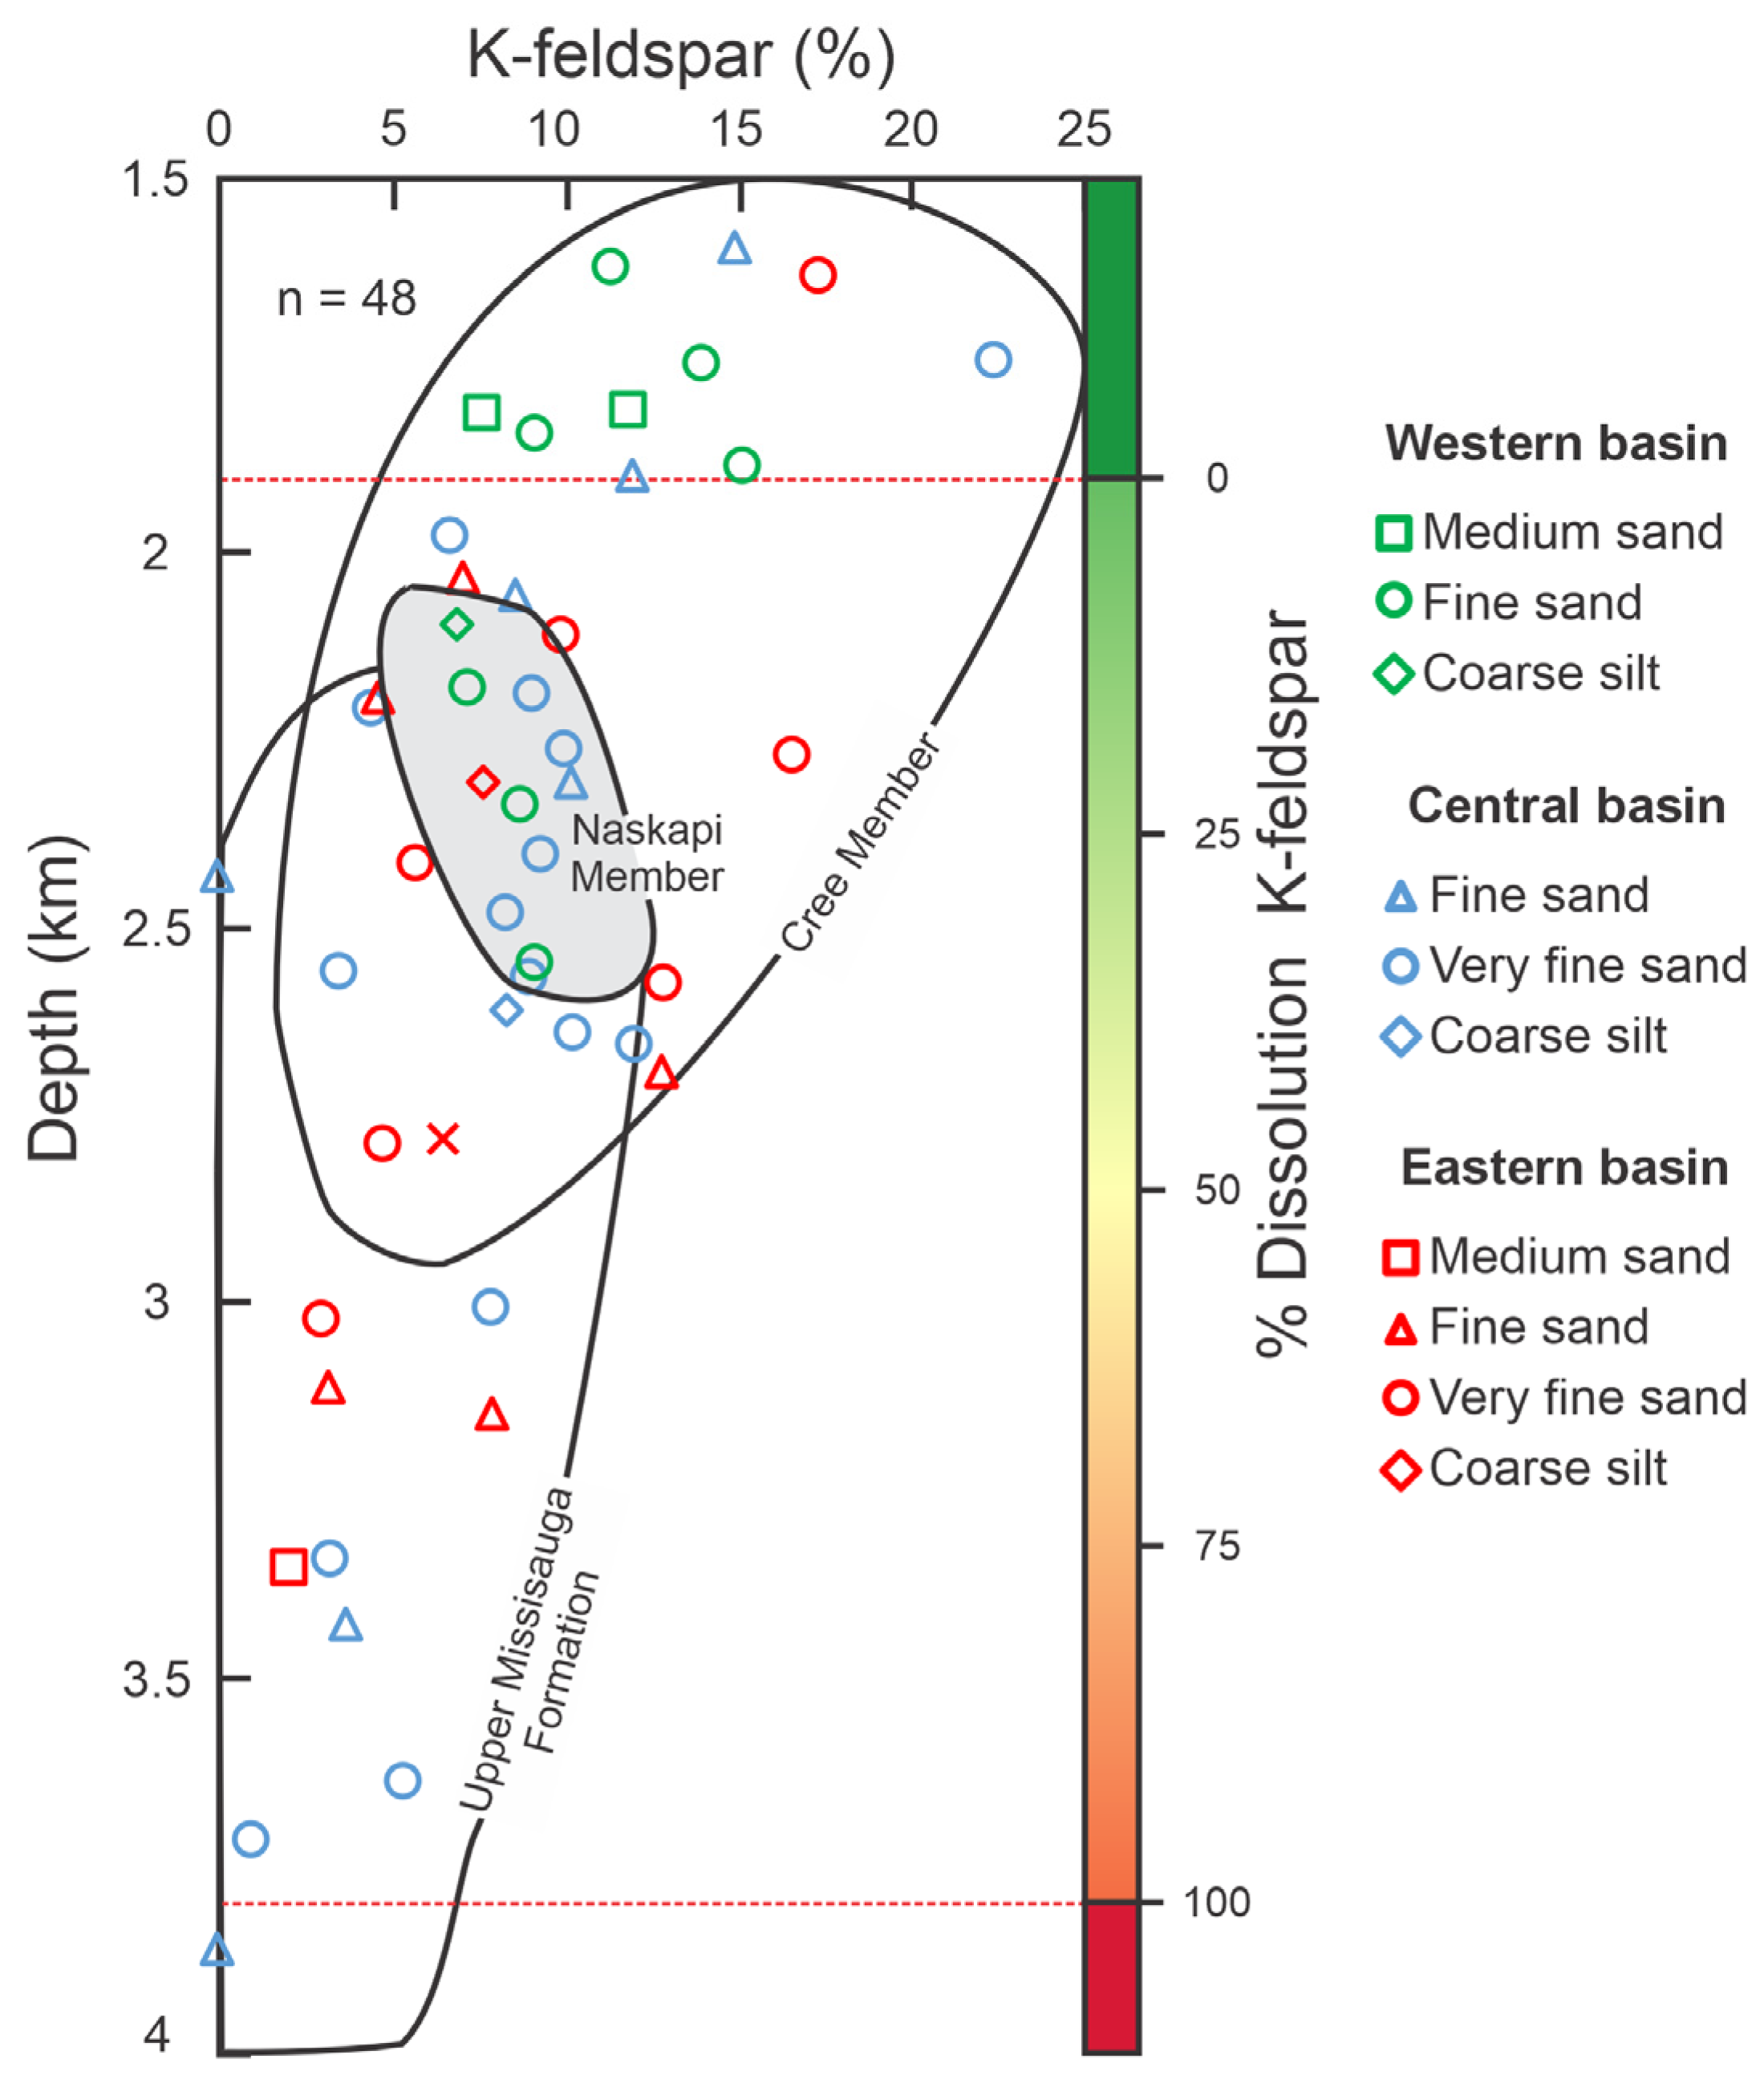
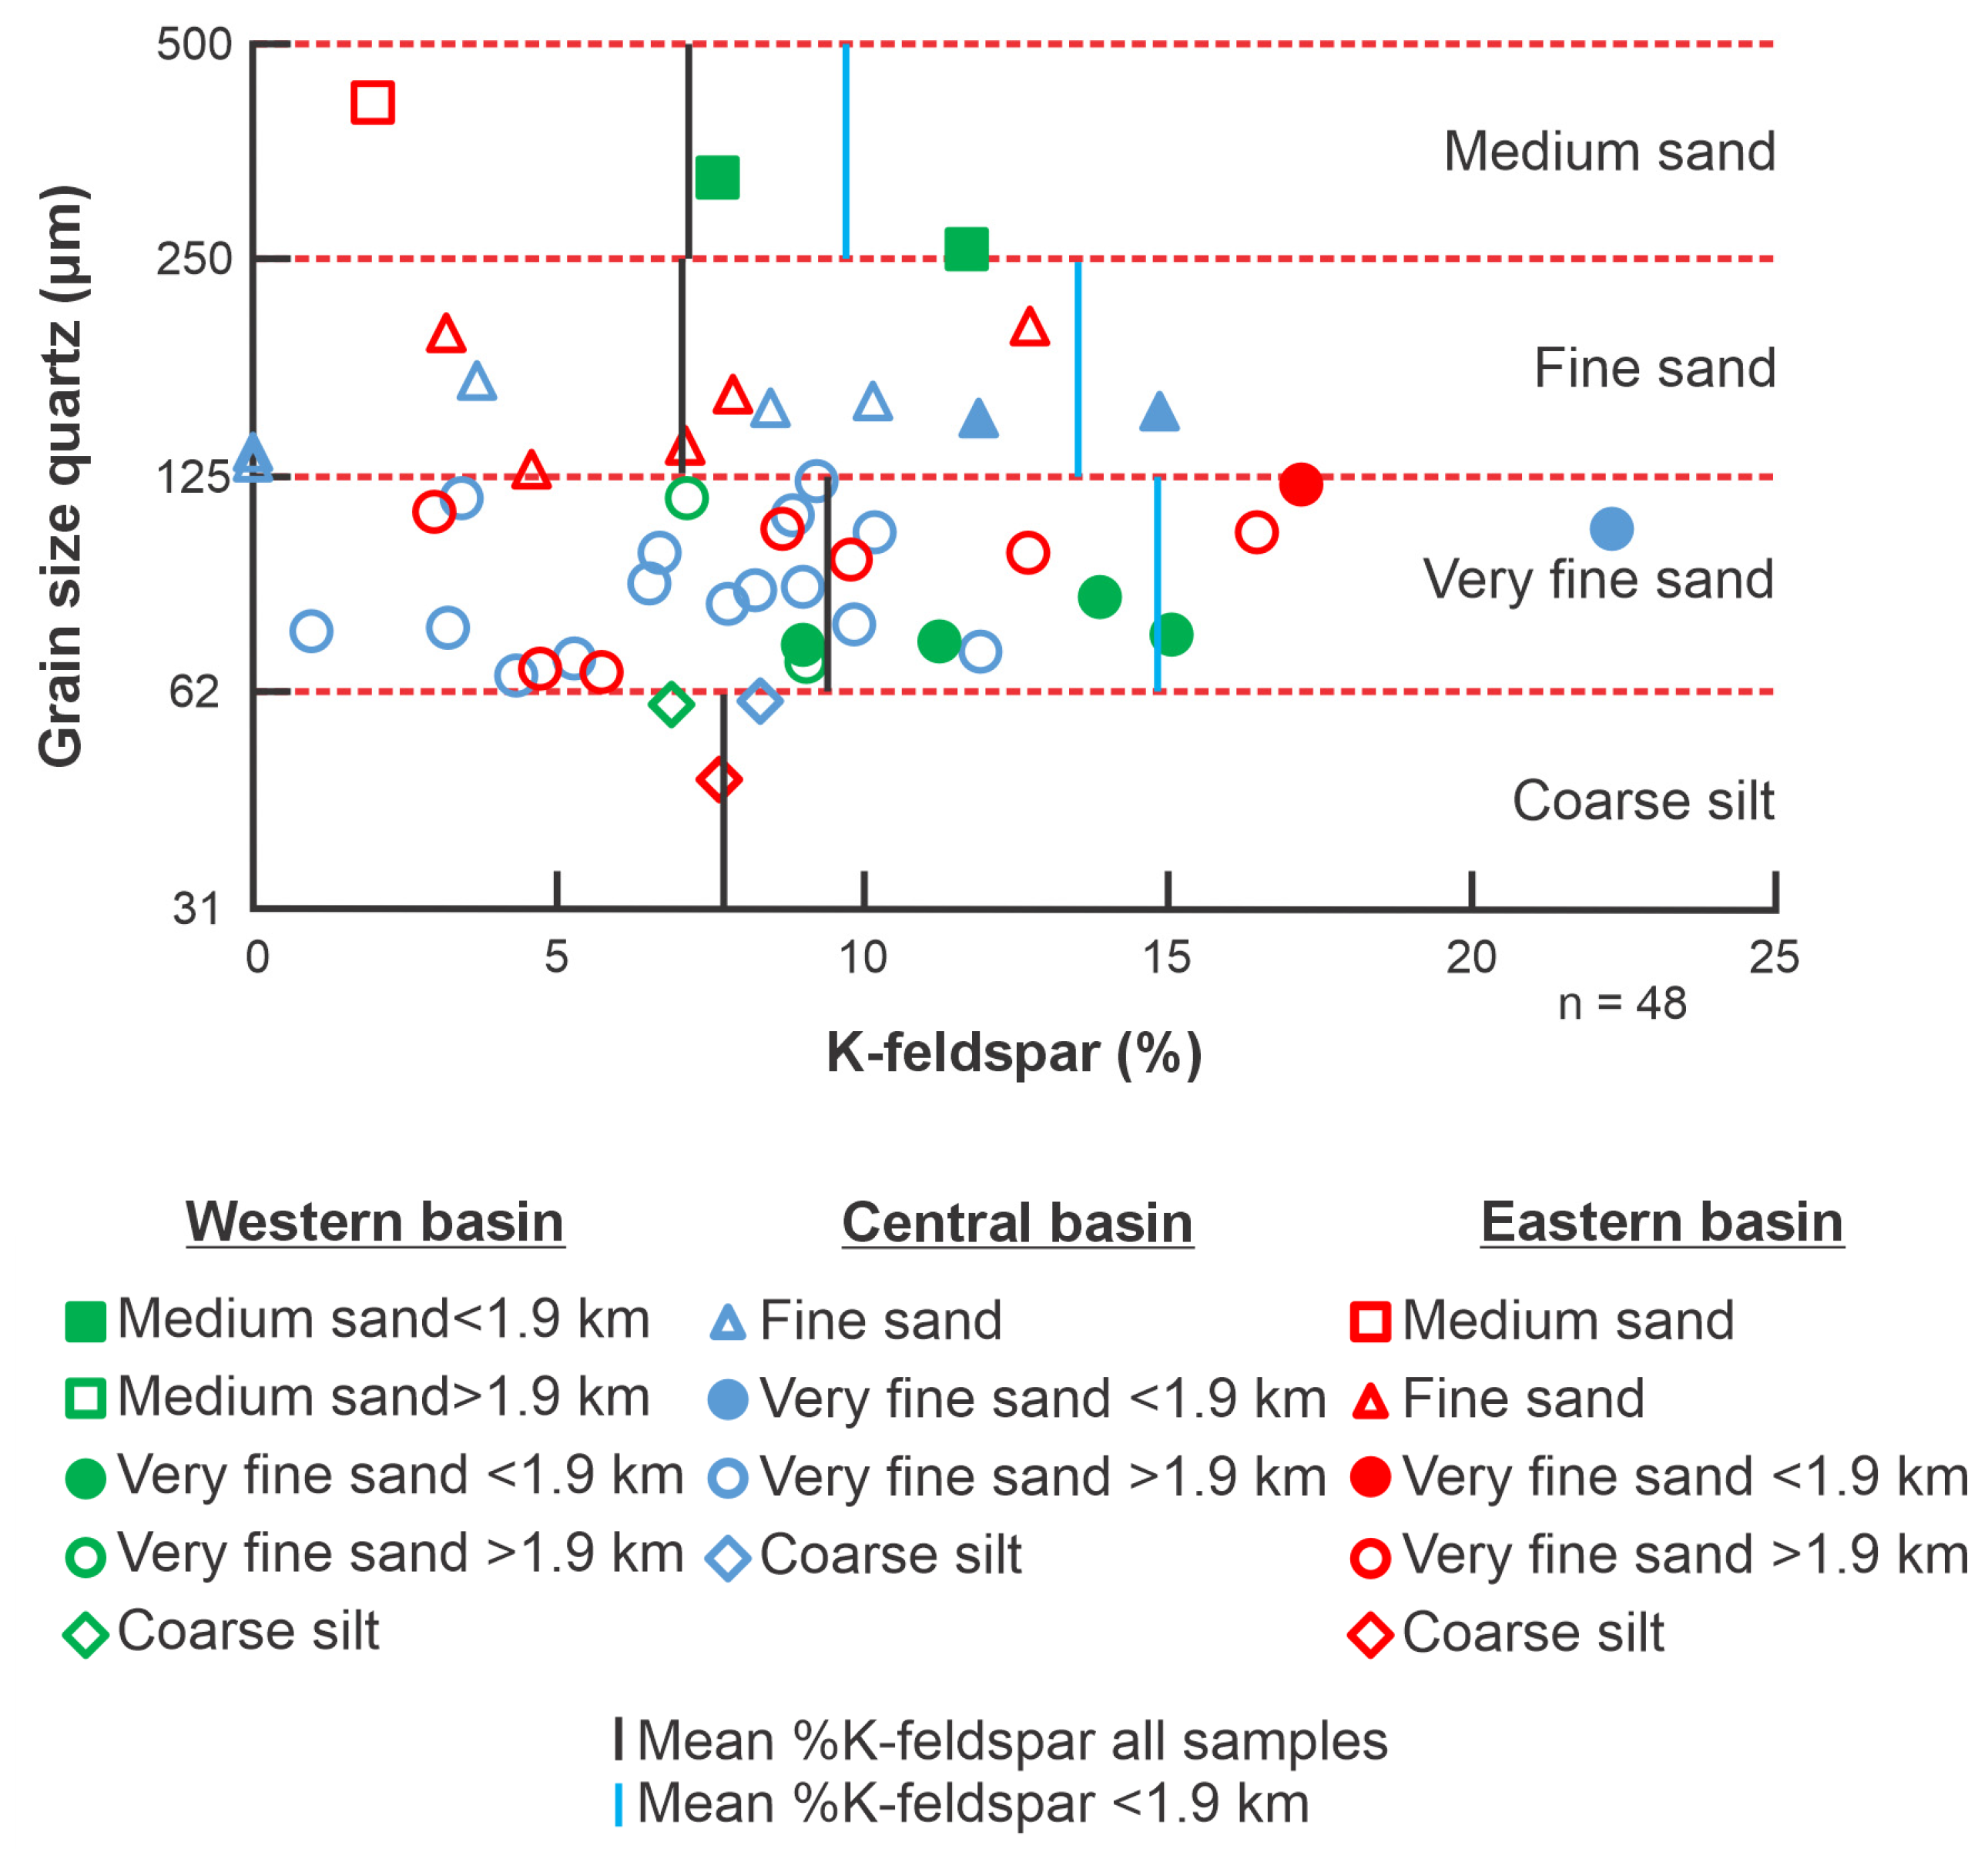
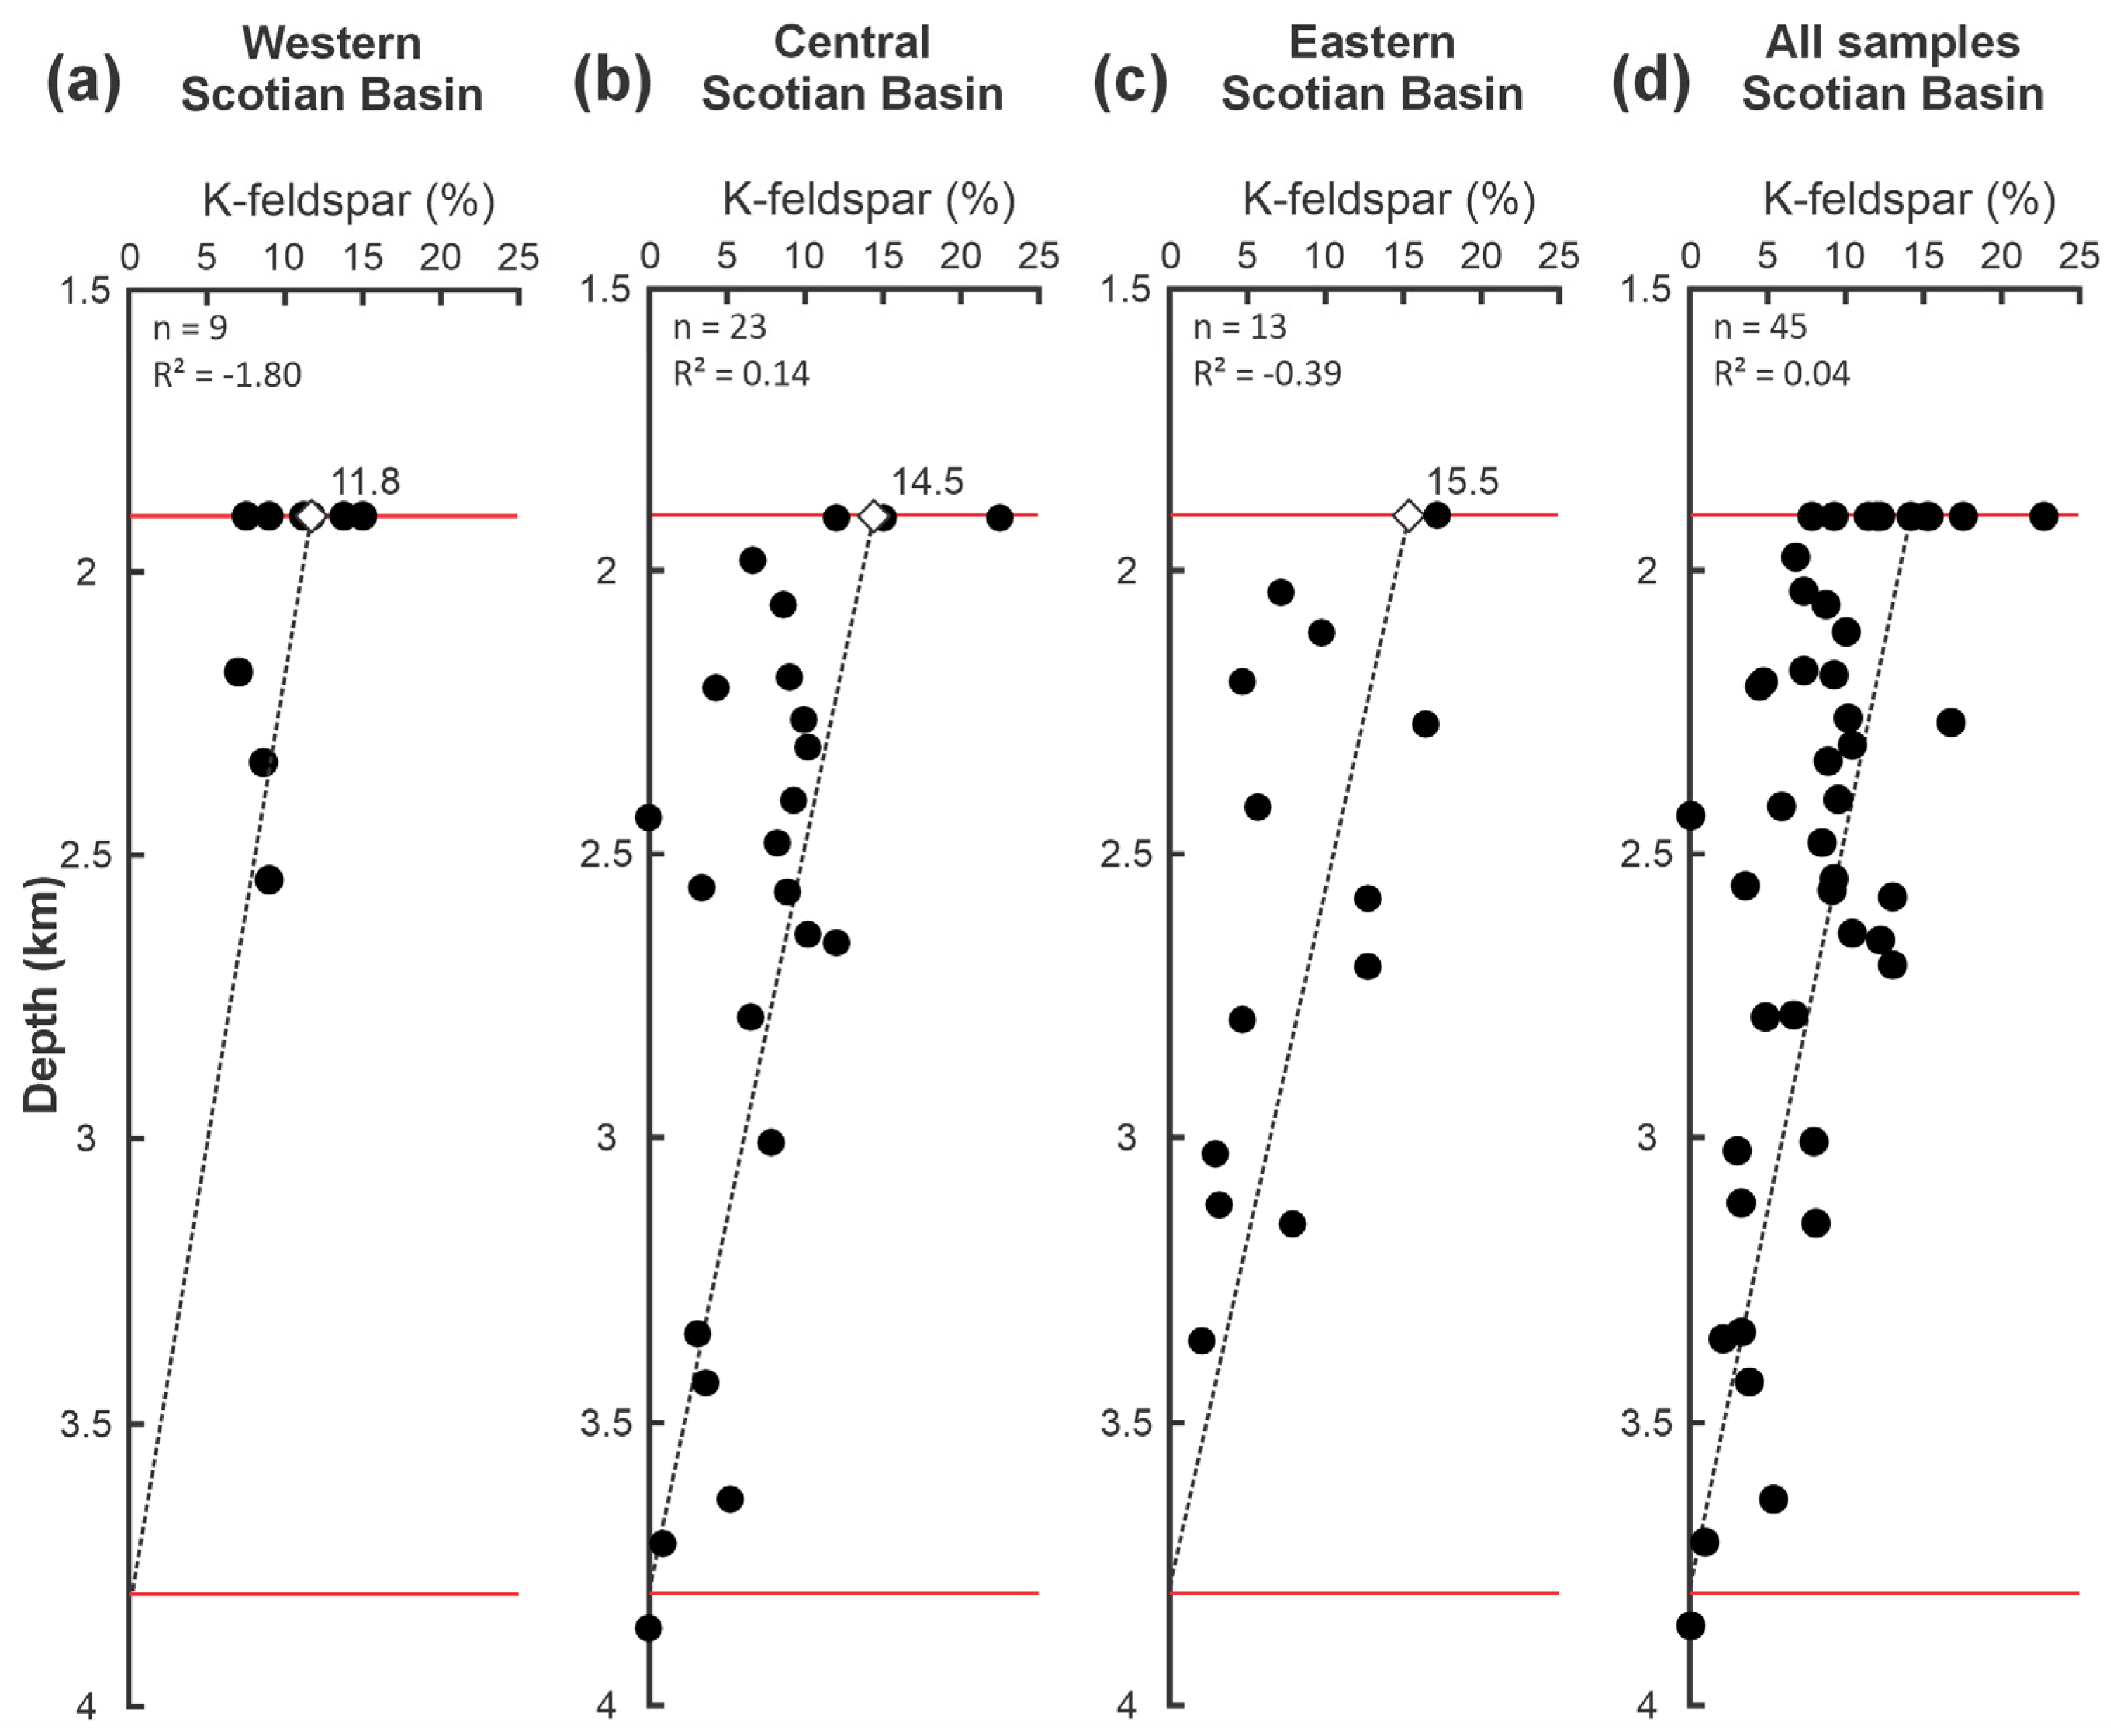
The analyzed samples show a wide range in K-feldspar proportions, from 0%–22%, with an average of approximately 8% (Table 1). The samples taken from less than a 2 km burial depth all belong to the Cree Member, while the samples from depths below 3 km are all from the Upper Missisauga Formation. Between a 2 and 3 km burial depth, samples from all three units are present at overlapping depths (Figure 5). The proportion of K-feldspar decreases with increasing depth, with samples shallower than 1.9 km showing an average K-feldspar proportion of 14%, decreasing to 8% from 1.9 to 3 km, and to 4% at burial depths of greater than 3 km (Figure 5). When the K-feldspar proportion is compared to the mean grain size, the widest ranges in the proportion are observed in the fine and very fine sand fractions (Figure 6). The highest mean K-feldspar proportions are observed in the very fine sand fraction at 9%, followed by coarse silt at approximately 8% and the medium and fine sand fractions, sharing a value of 7% (Table 1). All the samples with >15% K-feldspar are very fine-grained sandstone (Figure 6), although these samples are largely from shallow burial depths of less than 1.9 km (Table 1).

4.1.2. Grain Size Analysis

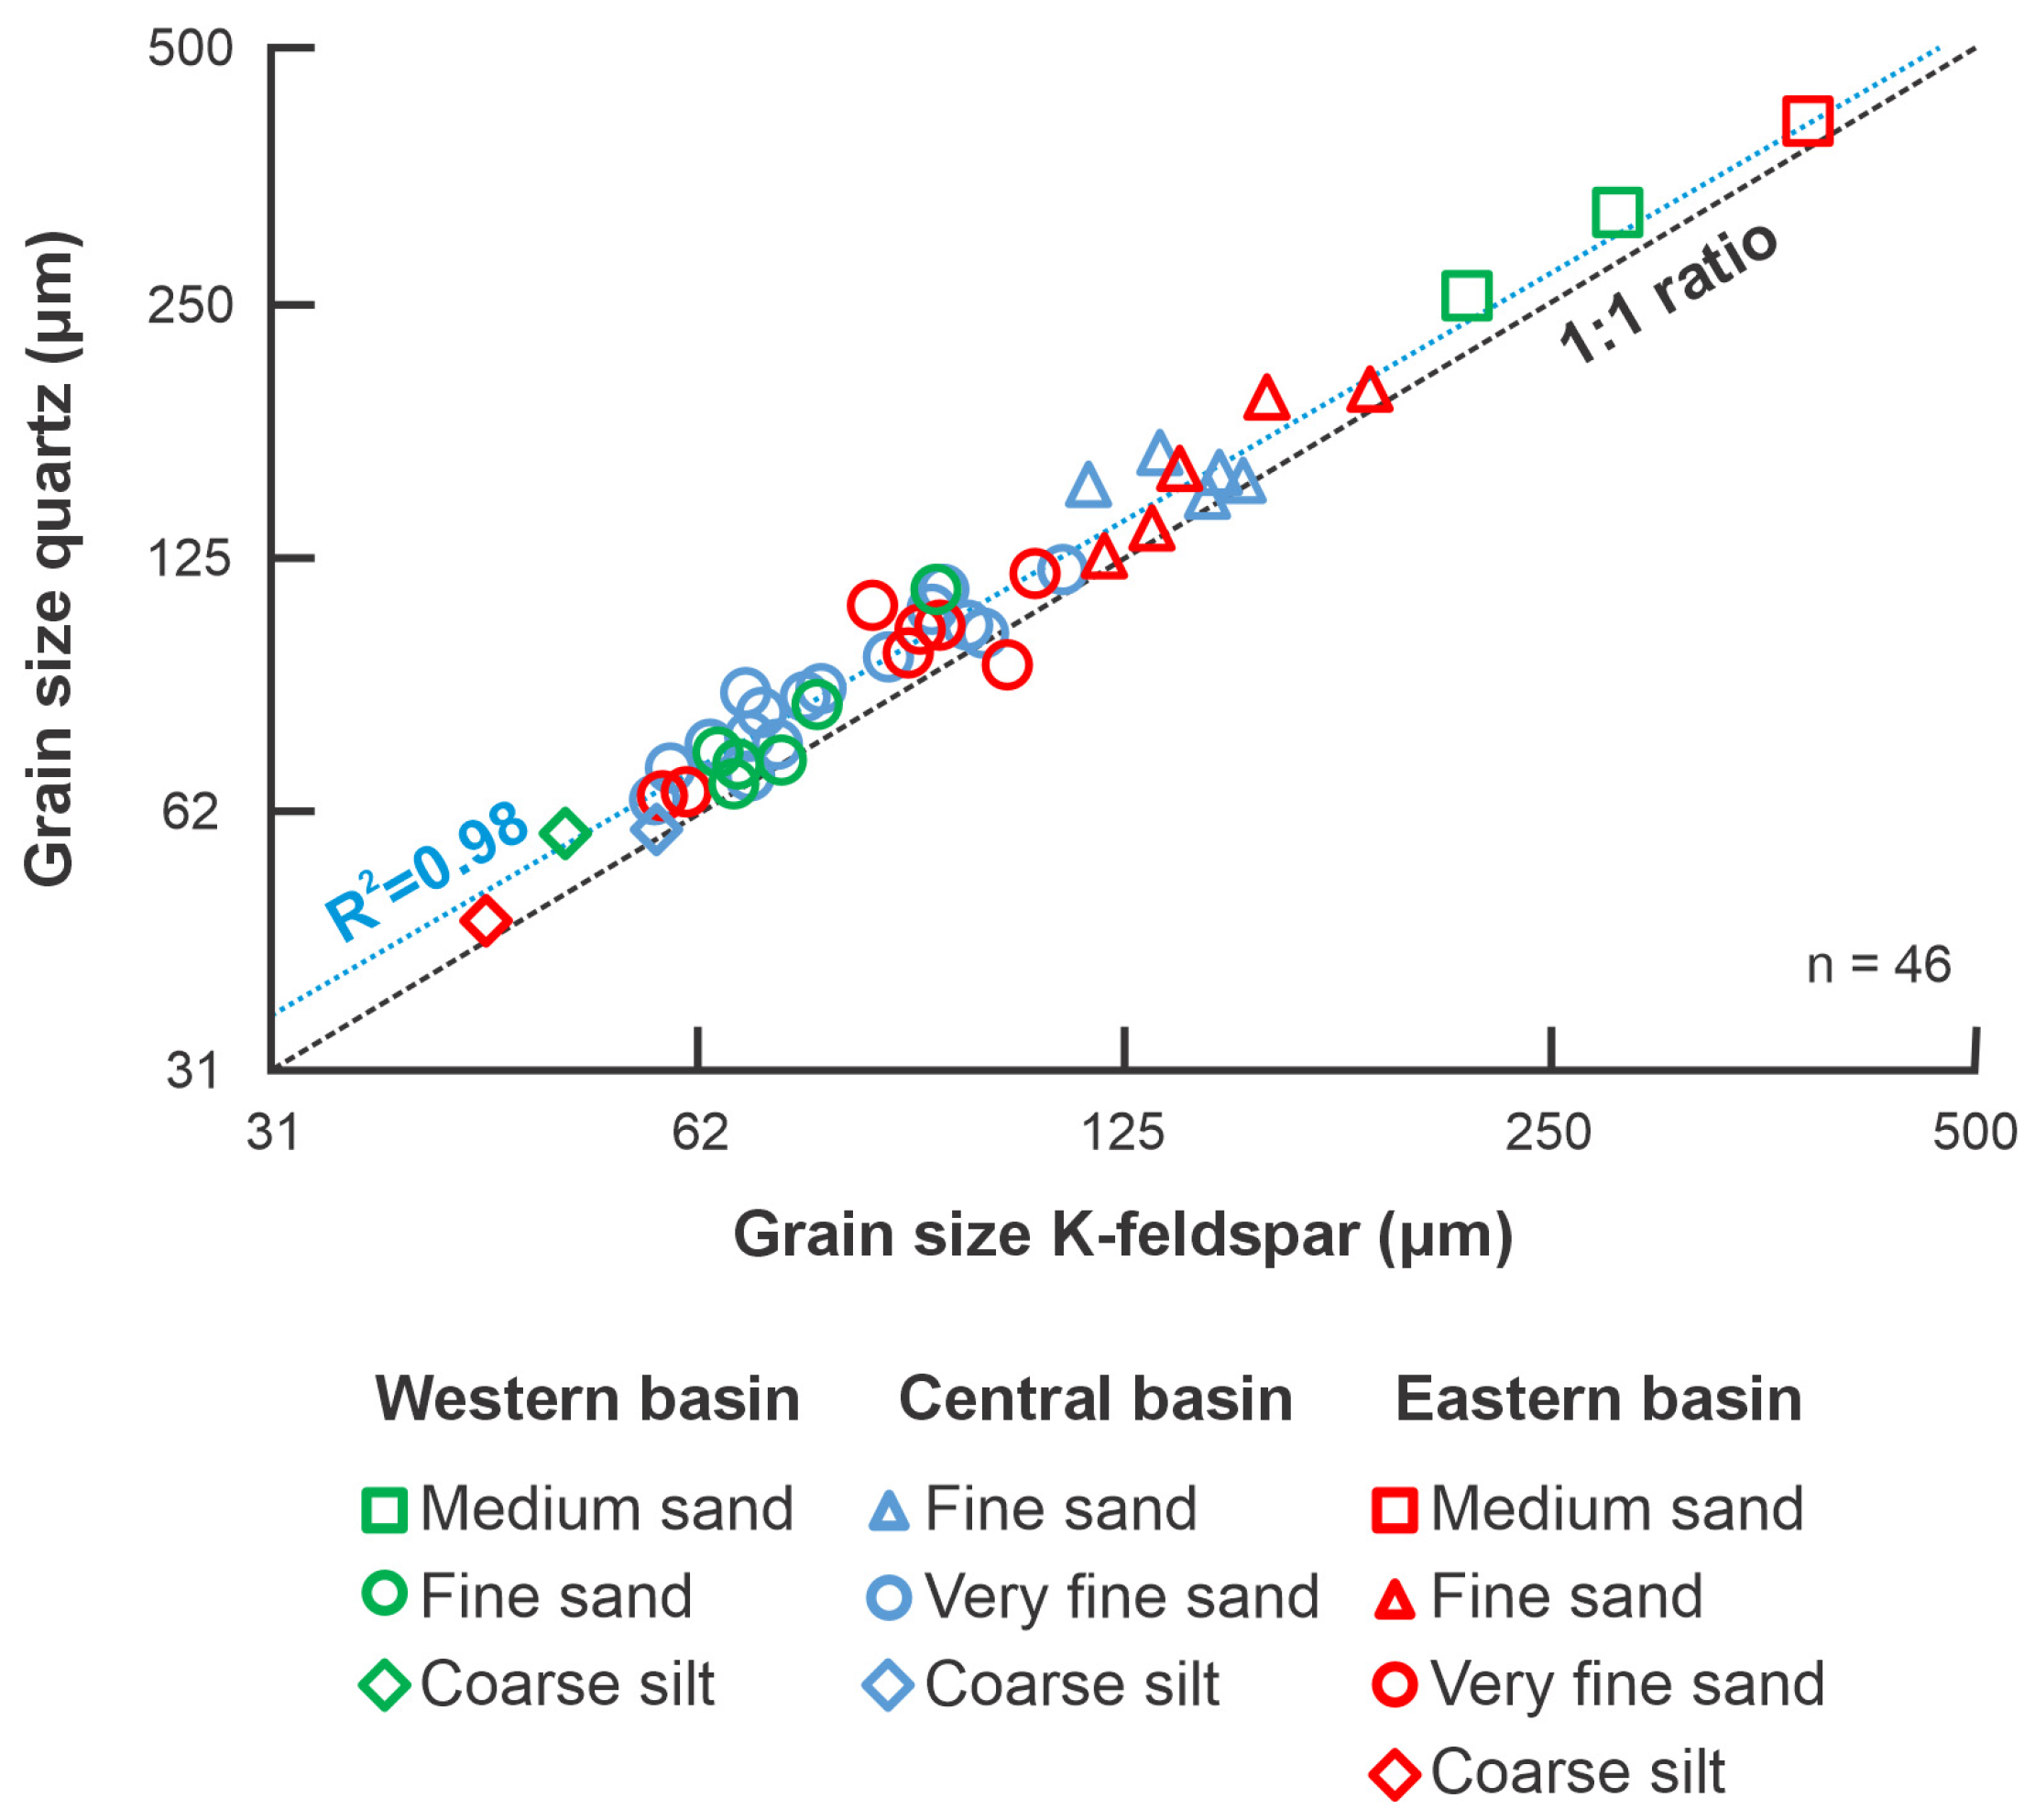
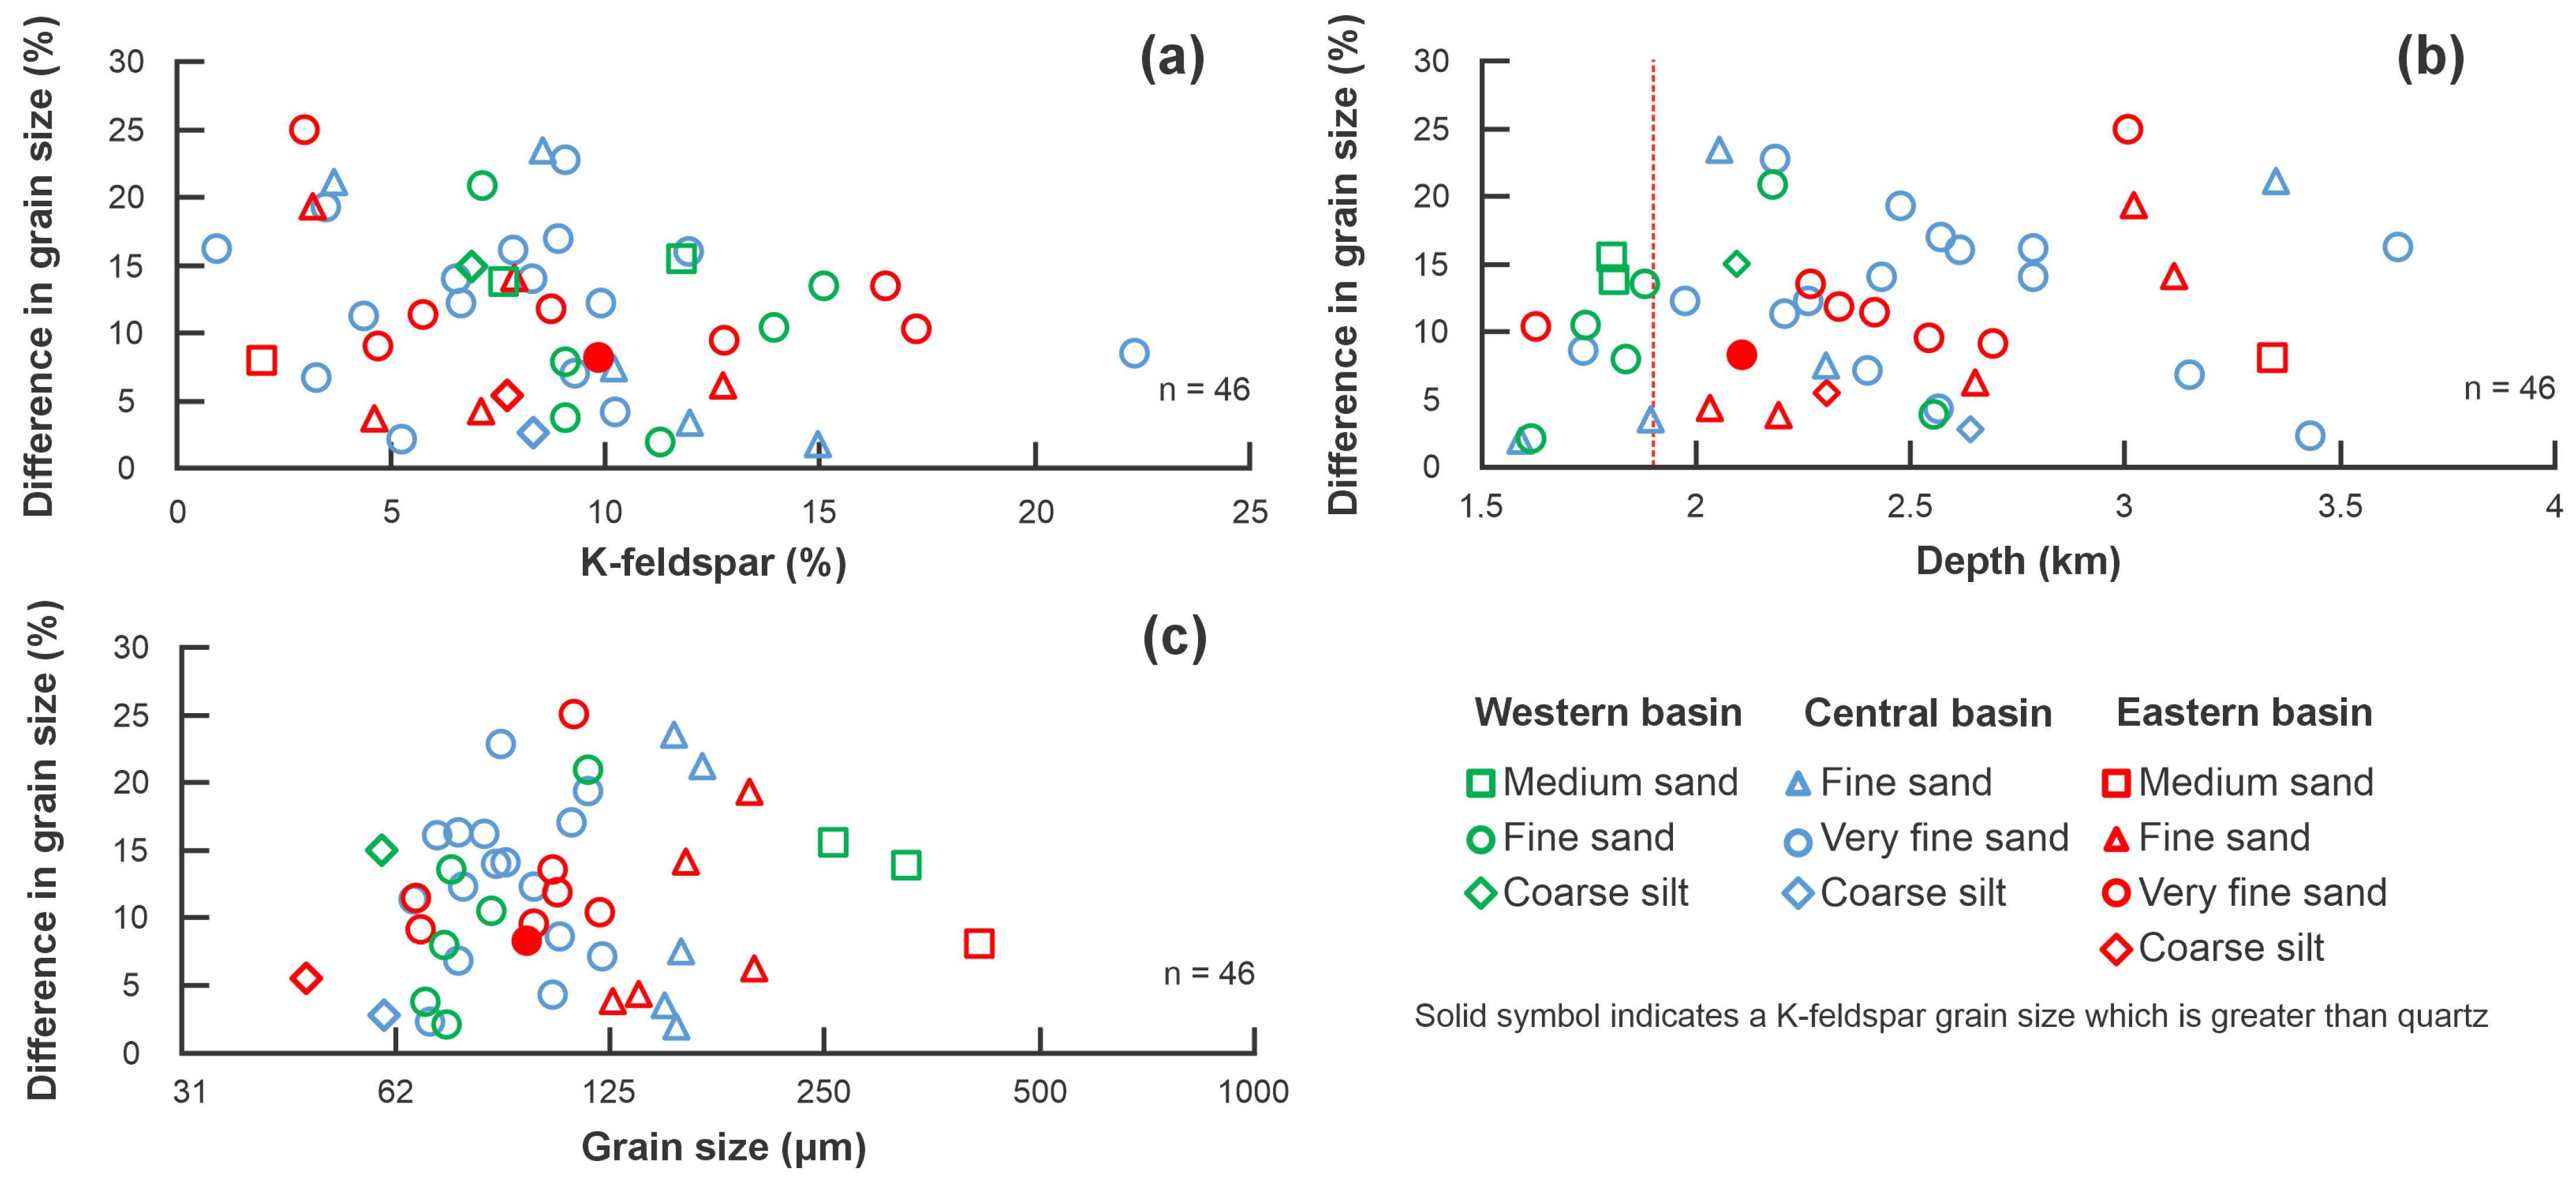
Most of the samples analyzed, 30 out of 48 samples, have a modal composition of very fine sand, with the next most frequent grain size being fine sand (Table 1). Measured K-feldspar grains within these samples are, on average, smaller than the measured quartz grains (Figure 7). The difference between grain sizes ranges from 2% to as high as 25%, with only one sample having a mean grain size of K-feldspar larger than that of quartz (Table 1). When the difference is compared to the proportion of K-feldspar in each sample (Figure 8a), a greater difference is observed in samples with lower K-feldspar proportions. Samples containing less than 10% K-feldspar show a maximum difference of 25% and an average of 12% compared to a maximum of 16% and an average of 9% difference in samples with greater than 10% K-feldspar (Figure 8a). Likewise, samples shallower than 2 km show an average difference of 9% and a maximum of 16%, whereas samples below 3 km have proportionally smaller K-feldspar grains, with an average difference of 14% and a maximum of 25% (Figure 8b). Samples with a mean grain size of fine or very fine sand show the greatest range of differences; however, average differences are similar for all the grain sizes (Figure 8c).

4.2. Model Methodology and Results

To predict areas where secondary porosity is most likely to occur as a result of the breakdown of K-feldspar, the distribution of the feldspar within the study area has been modeled using DionisosFlowTM. The resulting distribution is then compared to temperature and structural maps of the basin to predict the distribution of secondary porosity produced and preserved as a result of the breakdown of K-feldspar.
The feldspar distribution has been modeled using the calibrated “reference case” models in [28], which simulated the distribution of sand in the Scotian Basin. These “reference case” models have been modified to include sediment classes that represent feldspar grains. The observed K-feldspar abundances have been interpreted to estimate the original feldspar proportion prior to burial dissolution. Lines of best fit for the K-feldspar proportion have been generated for all three areas of the basin, considering the compositions of all the sand-sized samples (Figure 9). Burial depths of less than 1.9 km are considered to have largely unaltered feldspar [26]; therefore, all the sample depths above this depth have been translated to a 1.9 km depth. A forced intercept of 3.8 km has been used to represent the point of 0% K-feldspar, reported as the depth of the total K-feldspar dissolution in [26]. The intercept of the trendlines at 1.9 km was used to estimate the initial K-feldspar input for each of the three areas of the basin. The western basin intercepts at 11.8%, the central basin at 14.5%, and the eastern basin at 15.5% (Figure 9).
The sediment grain sizes in the “reference case” models range from clay to coarse sand sizes. The size distribution of the K-feldspar that is used is based on the relationship between quartz and K-feldspar grain sizes observed in samples shallower than 1.9 km (Table 2). No coarse-grained sands have been analyzed in this study. In order to determine the appropriate grain size to simulate for this sediment fraction, a line of best fit for all the samples has been used (Figure 7). Only sand-rich samples have been analyzed as a part of this study; as a result, feldspar proportions must be normalized to the sand proportion used in the “reference case” models, such that an input of 10% coarse sand with a predicted value of 11.8% K-feldspar should have a coarse K-feldspar model input of 1.18%. The operational workaround in the “reference case” models was to subtract the K-feldspar input from the clay-sized sediment fraction to maintain a 100% total for all the sediment classes.
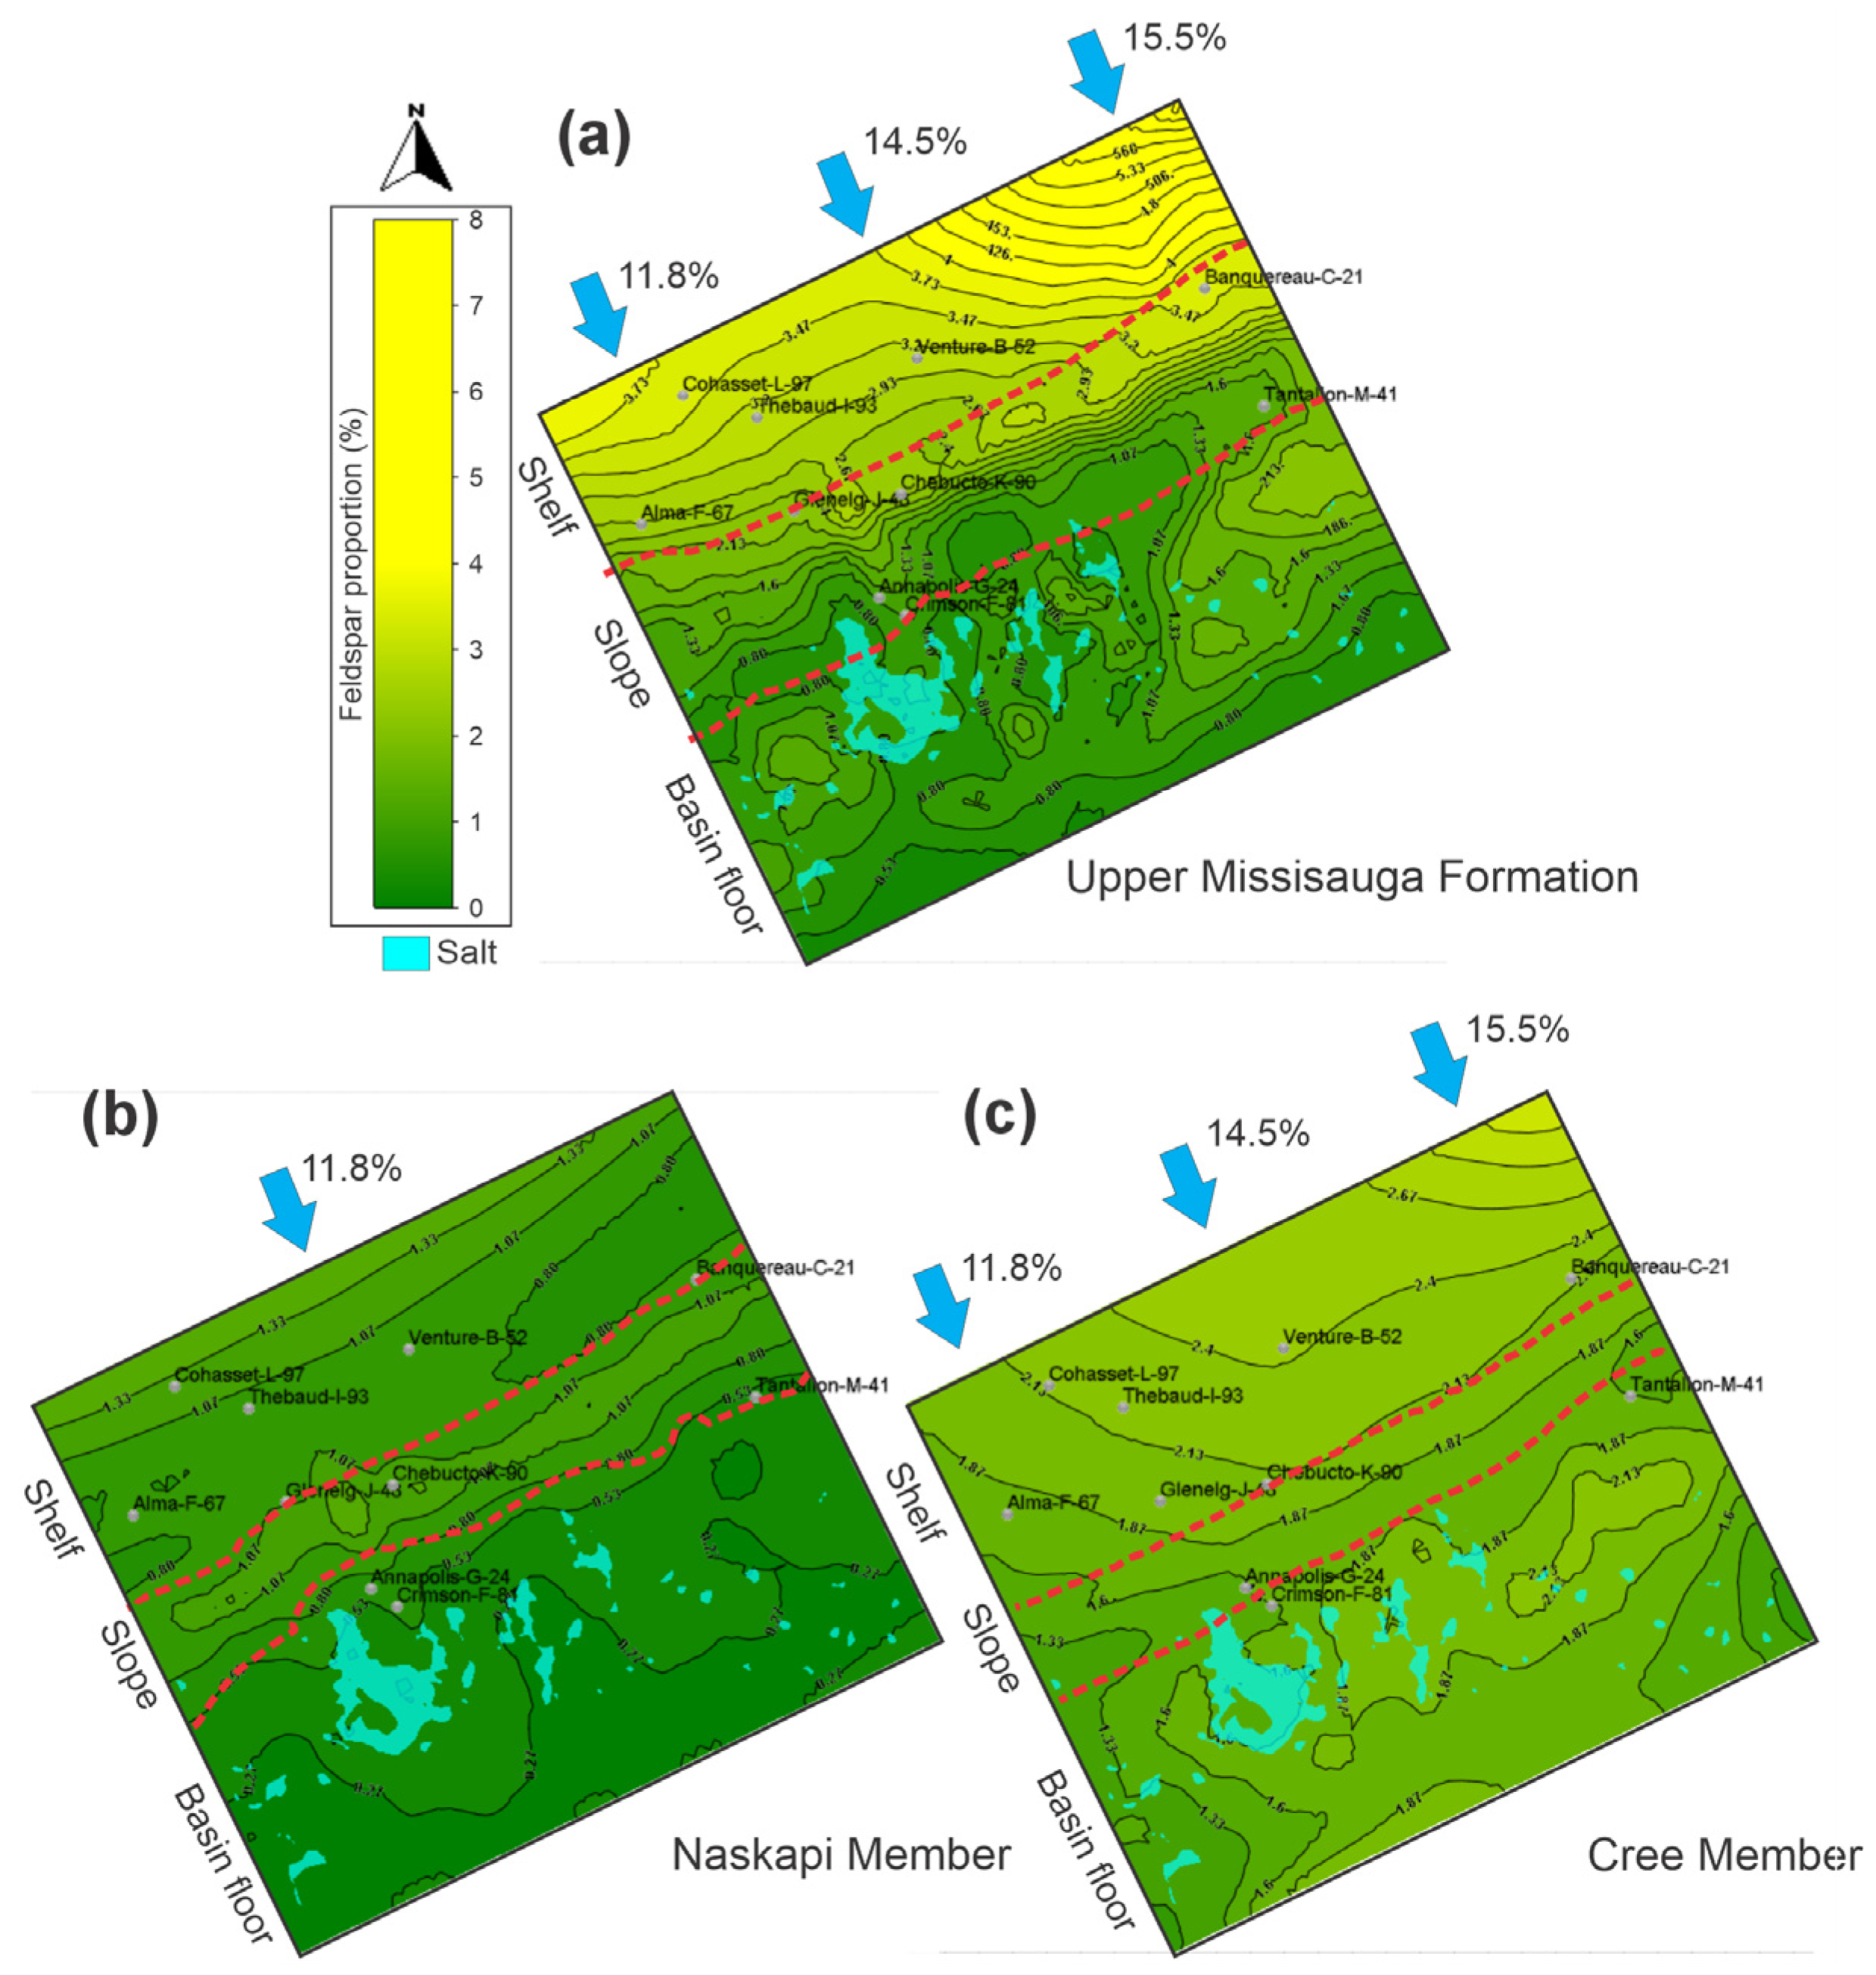
The simulation results are presented in terms of the (paleo) shelf, slope, and basin floor (Figure 10). The shelf is the region proximal to the sediment input with a gradient of less than 1°, terminating at the shelf break. The slope has a simulated angle of greater than 1° and passes seaward to the basin floor, which is the area with a less than 1° gradient extending to the downslope limit of the study area. The results of the simulations of the K-feldspar distributions are displayed in two types of maps. The total K-feldspar proportion (Figure 10), relative to all the simulated sediments, shows the trends of the K-feldspar distribution in the study area, which must be considered as semi-quantitative since the abundance of the K-feldspar in shales has not been determined.
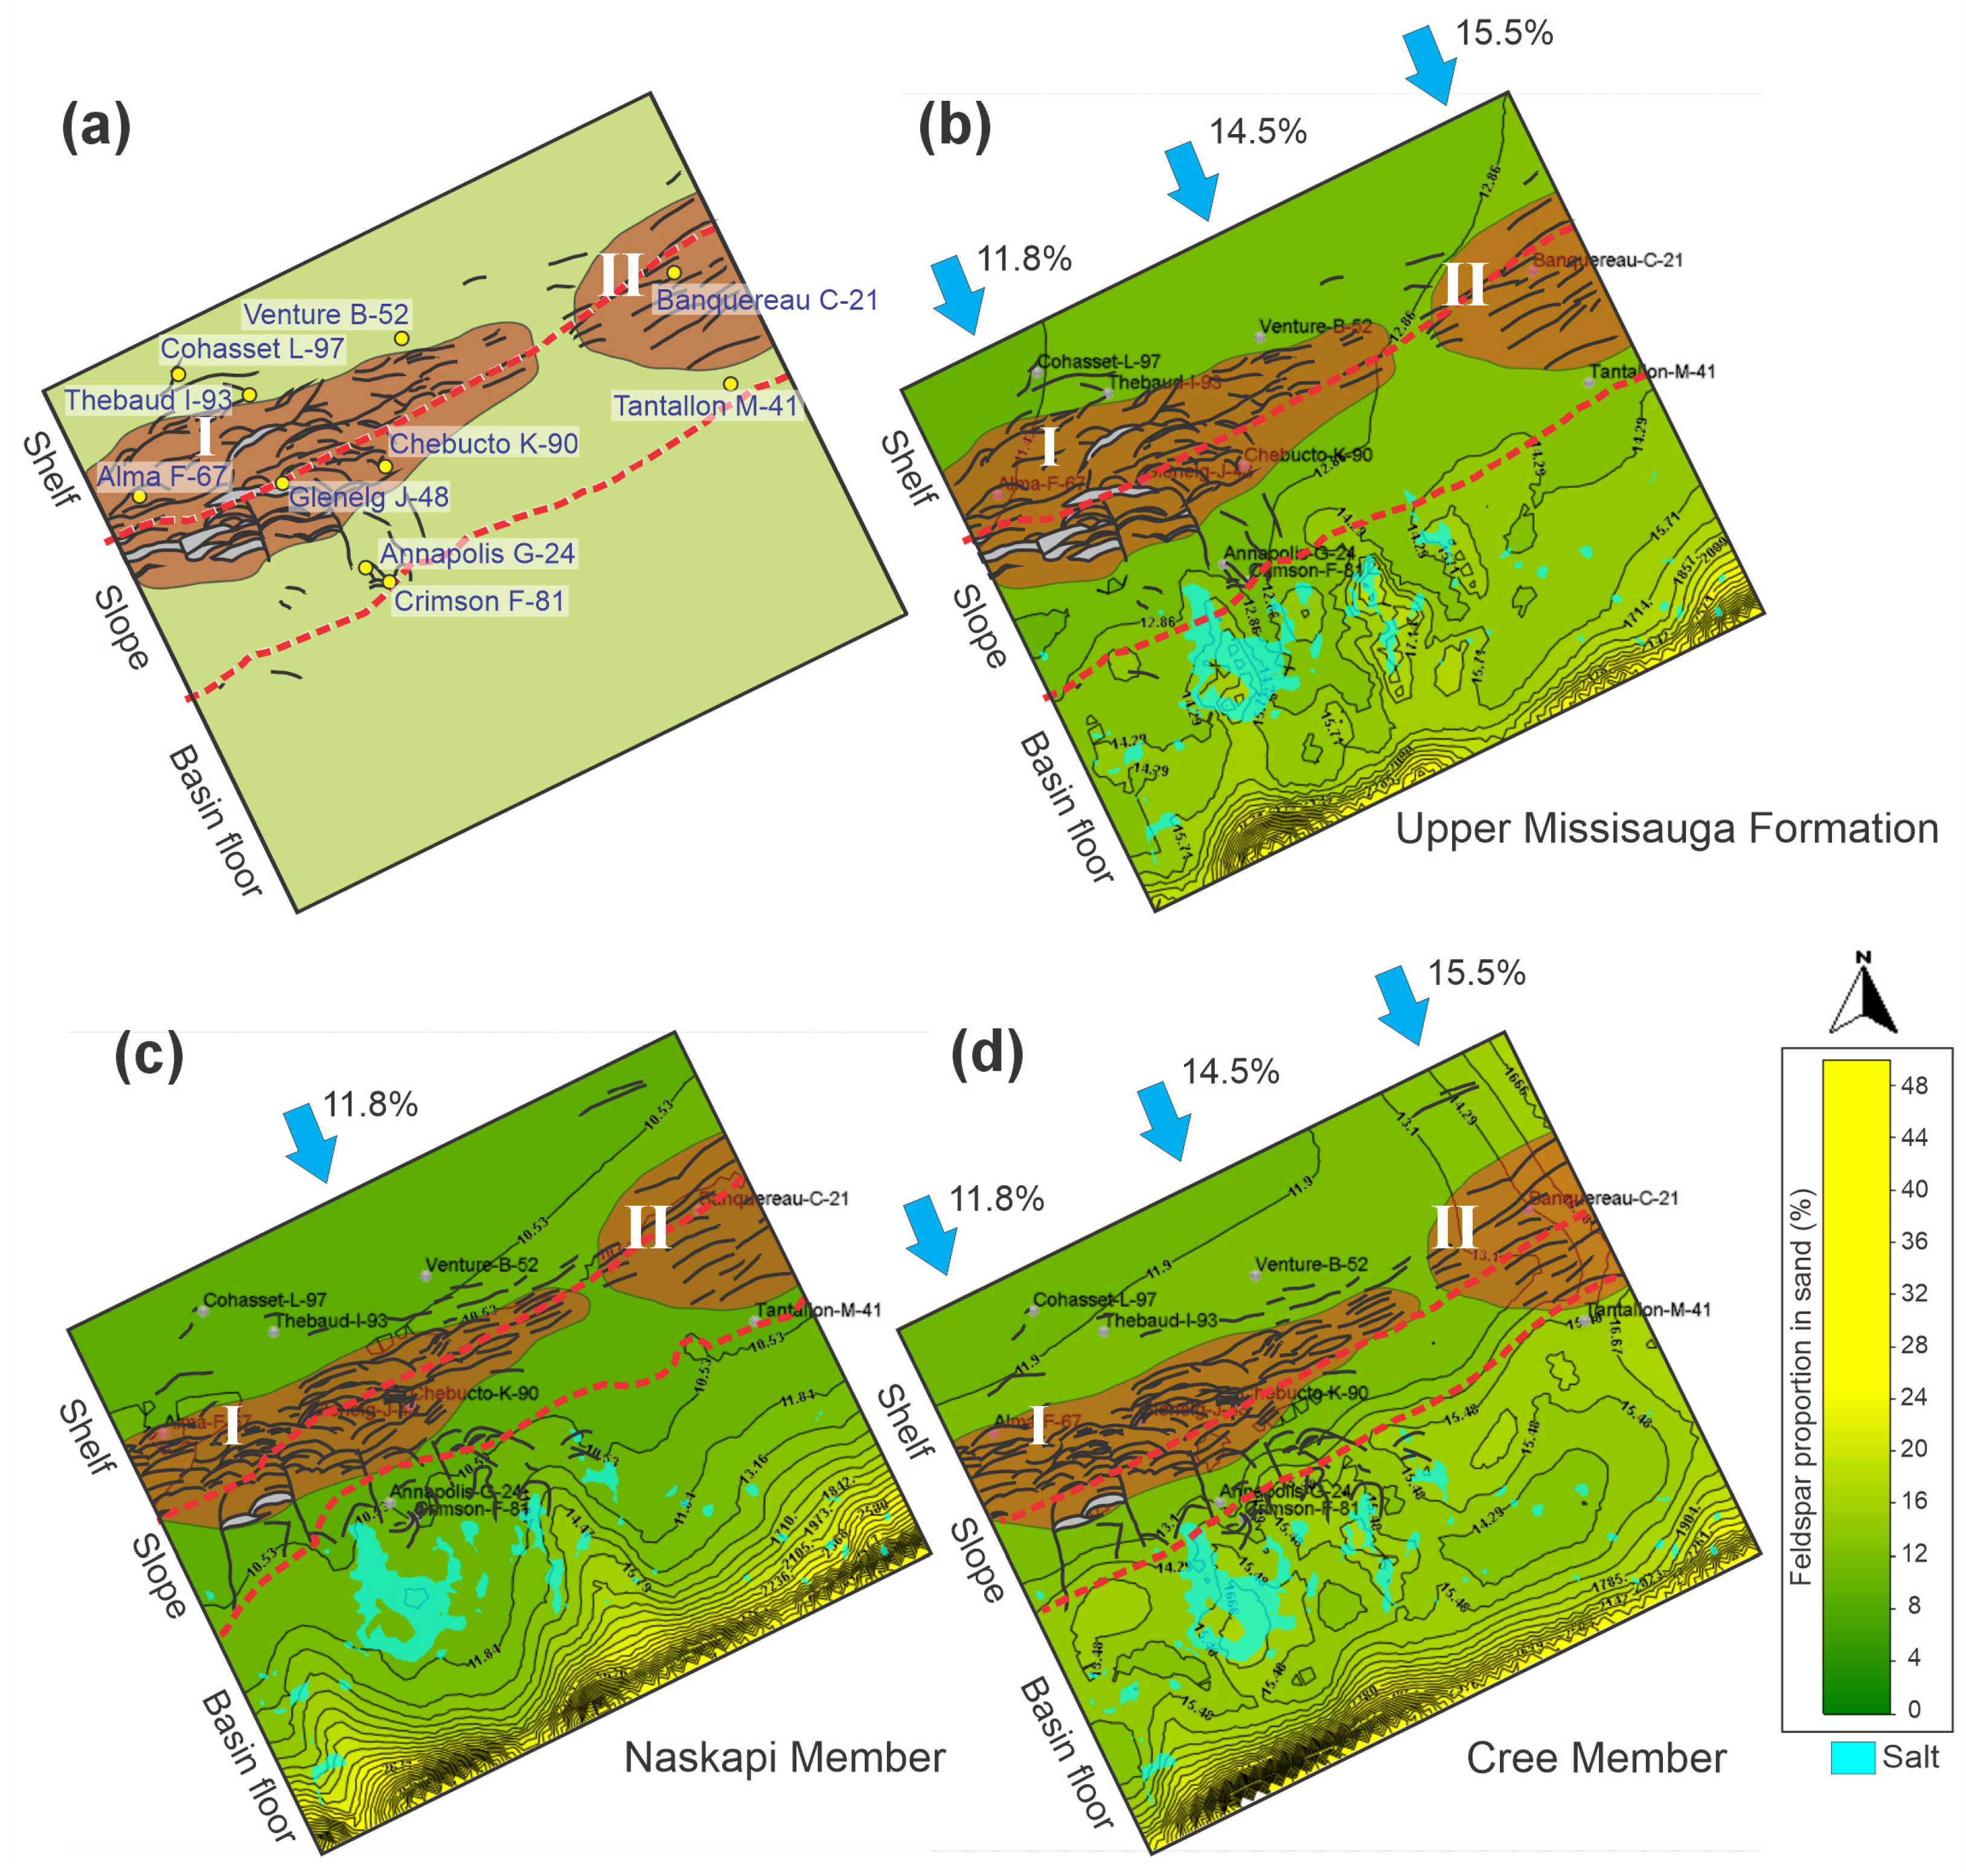
The maps of the percentages of K-feldspar in sands (Figure 11) were derived by normalizing the K-feldspar proportion maps to the sand proportion maps in [28]. As the mean grain size and specific gravity of feldspar grains are a little less than those of quartz, modeling shows that feldspar is concentrated in more distal and finer-grained sediments in the deepwater basins. Sands at the downslope edge of the simulated area show K-feldspar concentrations of greater than 20% (Figure 11), which are artifacts of the closed system that is modeled.

4.2.1. Upper Missisauga Formation

K-feldspar is most abundant on the shelf, ranging from 2% to 6%, with concentrations generally decreasing from east to west (Figure 10a). The basin floor contains K-feldspar proportions ranging from 0% to 2%, with the highest accumulations occurring in corridors basinward of the Annapolis G-24 and Crimson F-81 wells, small minibasins in the western basin, and in high accumulation basinward of the Tantallon M-41 well, all of which are areas of sand accumulation. When these proportions are considered as ratios between sand and K-feldspar, an inverse relationship is observed. Simulations suggest that on the shelf, where sands are abundant, they show a feldspar proportion of 10%–13%, which increases to 12%–20% on the basin floor, where sands are less common (Figure 11b). Sands in the east of the study area are generally more K-feldspar rich by 2%–3% than those in the central and western areas.

4.2.2. Naskapi Member

Feldspar concentrations in the Naskapi Member are the lowest of the three units observed in this study, reflecting the low amount of sand in this unit [43]. Concentrations range from 1% to 2% on the shelf, diminishing to 0%–1% on the basin floor (Figure 10b). The highest accumulations are observed on the slope, where K-feldspar proportions are as high as 2%. K-feldspar proportions in sand range from 10% to 11% on the shelf to 10% to 20% on the basin floor (Figure 11c).

4.2.3. Cree Member

K-feldspar proportions in the Cree Member follow a similar trend as those in the Upper Missisauga Formation, although the proportions are generally lower (Figure 10c). Proportions decrease from east to west on the shelf, ranging from 2% to 3%. On the basin floor, K-feldspar proportions range from 1% to 2%. Sands on the shelf show K-feldspar proportions ranging from 11% to 13%, except in the far eastern part of the study area, where it is 13%–17% (Figure 11d). The K-feldspar content generally increases on the basin floor, with proportions generally ranging from 14% to 17%.

5. Discussion

5.1. Controls on the K-Feldspar Proportion

5.1.1. Influence of Provenance

Provenance studies conducted in the region [29,50,51] suggest that catchment areas remained largely unchanged throughout the Early Cretaceous, except during the Naskapi Member deposition, when the Sable and Banquereau rivers were diverted to western Canada as a result of volcanism and uplift along their flow paths [23,43,55]. At that time, the Meguma Terrane was the source of new sediment to the entire Scotian Basin [43]. Pb isotope analysis of K-feldspar [23] shows that feldspars in our study area were predominantly (>80%) from the Grenville terrain in the Cree Member and the Upper Missisauga Formation. The eastward increase in the total K-feldspar proportion (Figure 10) may be a consequence of differences in provenance, feldspar fertility in the hinterland, and transport distance, as other provenance indicators, such as heavy mineral chemistry and detrital mineral geochronology, also show differences from west to east [29,49].

5.1.2. Influence of Climate

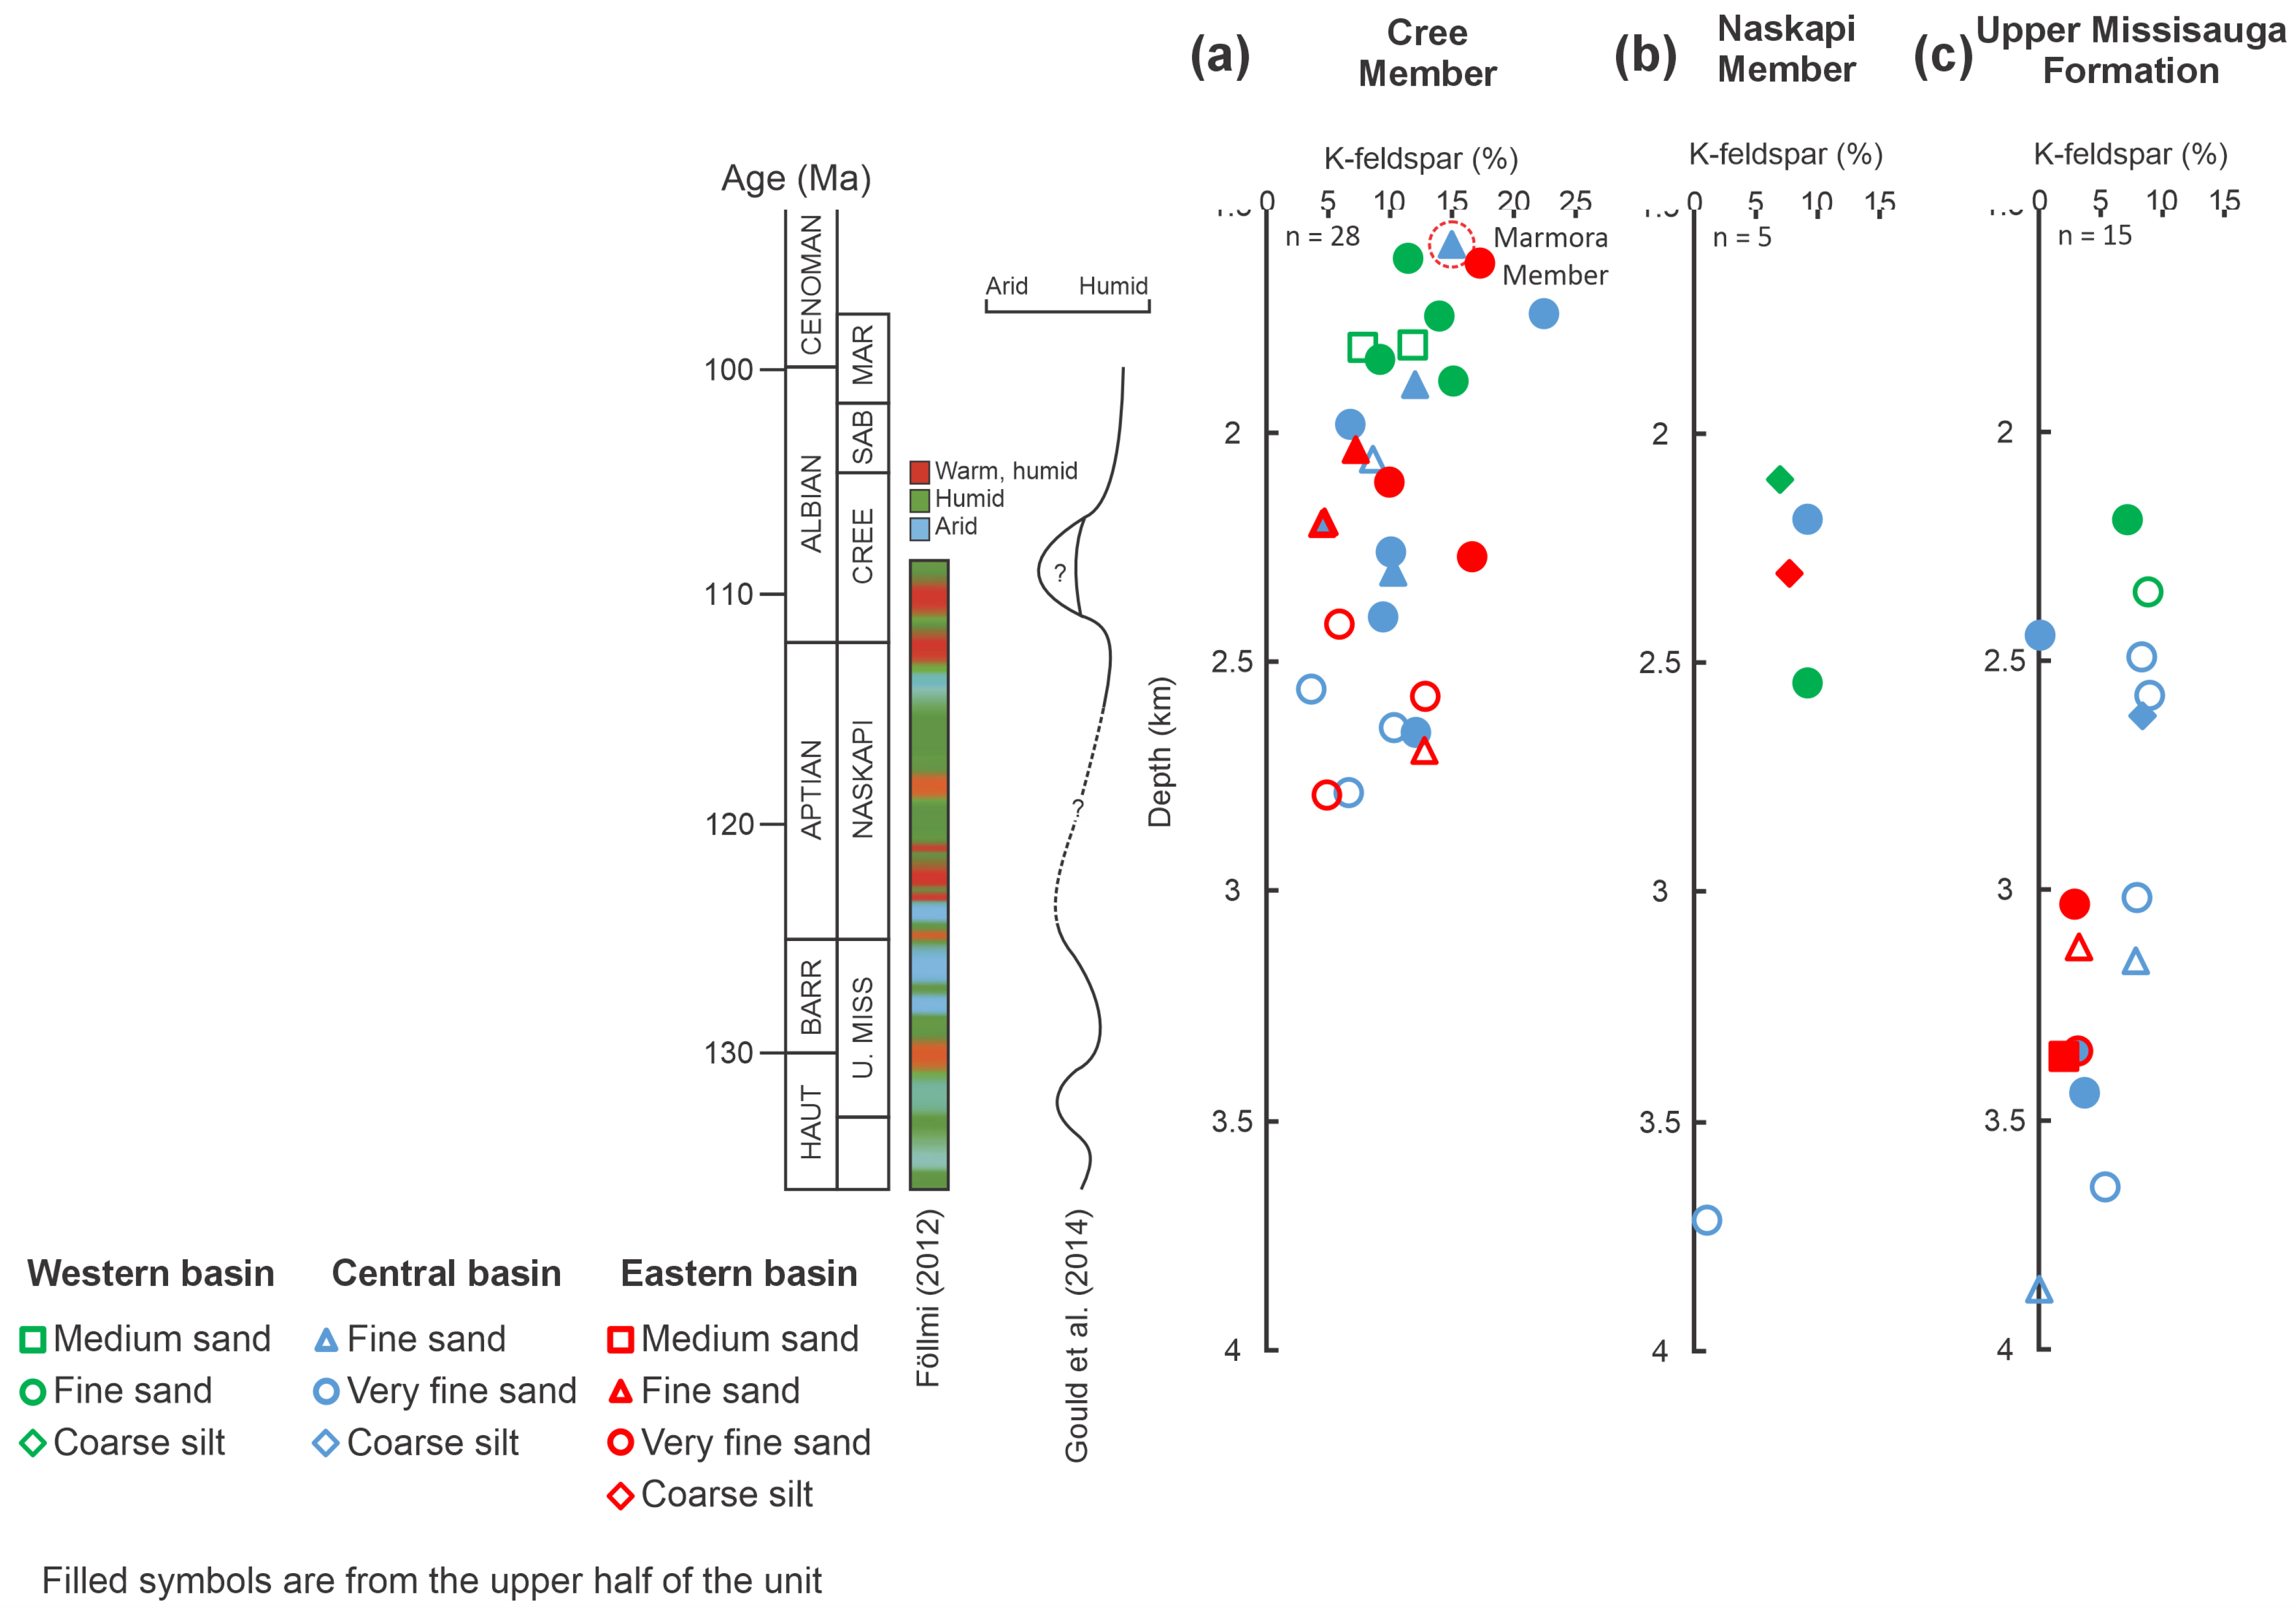
Climate is an important factor in determining the types of sediment that are supplied to a region, with more humid climates associated with an increased supply of clays as a result of increased chemical weathering. As a result of its chemical composition, K-feldspar is highly susceptible to chemical weathering, and, as a result, it should be present in lower quantities in sediments derived from catchment areas with more humid climates [66,67,68] if other effects, such as the rate of sediment transport, are equal. Paleoclimate studies on the Scotian Basin, based on illite/kaolinite ratios, suggest that the climate fluctuated over a variety of timescales from arid to humid in the Early Cretaceous [68,69]. During the Barremian, the climate was initially humid, becoming arid by the Aptian and returning to a humid climate by the late Albian and Cenomanian [68,69]. Samples have been assigned to either the upper or lower half of each stratigraphic unit to observe if there is a correlation between the climate and sediment composition (Figure 12). Samples from the lower half of the Cree Member show a lower mean K-feldspar content than that in the upper half (Figure 12a); however, the upper half of this unit is interpreted to have a more humid climate than the lower half [68]. The same inverse relation is observed in the Upper Missisauga Formation (Figure 12c). Only a single sample was sourced from the arid interval of the Naskapi Member; however, the same inverse relationship is observed (Figure 12b). These results suggest that if the climate influences the proportion of K-feldspar, its influence is masked by other factors.

5.1.3. Influence of Burial and Diagenesis

The major processes responsible for the breakdown of K-feldspars during burial are related to the interactions of grains with organic acids and carbon dioxide and to water–rock interactions [4]. The production of acids and carbon dioxide are related to the maturation of organic material during burial. Carbon dioxide in fluid inclusions from the Venture field [71] implies an up-dip supply of carbon dioxide from deeper parts of the basin. However, given the large scale at which feldspar dissolution is observed [26], it is unlikely that sufficient acids could be produced in a natural system to generate all the observed dissolution [4]. Studies conducted on the breakdowns of K-feldspar and other aluminosilicate minerals suggest that while decomposition is the greatest under strongly acidic and strongly alkaline conditions, such extremes are not required to decompose these minerals [16]. Rather, the reactions are controlled by the temperature, which increases with increasing burial depth, such that the rate of K-feldspar breakdown increases exponentially with increased heat [16]. The onset of K-feldspar dissolution has been reported to occur from temperatures as low as 57 °C to as high as 125 °C based on modern geothermal gradients [13]. In the Scotian Basin, the modern geothermal gradient is 25 °C/km [72]. However, a geothermal gradient as high as 55 °C/km, based on homogenization temperatures in primary fluid inclusions in quartz overgrowths and strongly negative δ13C values in carbonate cements, was present during the Aptian–Albian time [54]. This elevated geothermal gradient was related to enhanced heat flow to the basin [54,55].
Dissolution of K-feldspar can be expressed by the following reaction [16]:
KAlSi3O8 + 4H+ → Al3+ + 3SiO2 (aq) + K+ + 2H2O
when porewaters become saturated with Al3+ and SiO2 (aq), normally, kaolinite and quartz precipitate [16,73]. Illite precipitates under conditions of high temperatures (>125 °C) and high K/H activity ratios (aK+/aH+) [74,75,76]. The formation of these clay mineral byproducts can be reduced or prevented if dissolution occurs in an open system in which porewaters are removed from the system [12].
K-feldspar grains commonly undergo albitization, in which grains are replaced by albite via a 1:1 exchange of Na+ for K+ [9]. This process has been shown to be highly dependent on the removal of K+ from porewaters in addition to a supply of Na+ [77]. The most effective means of K+ removal from solutions is related to the illitization of clays, such as smectite, at temperatures between 70 and 80 °C [77], and kaolinite, from 100–130 °C [78]. In these cases, Na+ is thought to have been supplied from the illitization of smectite [78], the dissolution of intraformational sodium-rich plagioclase [9], or circulating saline brines [11]. In the Scotian Basin, smectite-to-illite conversion begins at 1.5–2 km and is complete by 4 km [26], and circulating saline brines, derived from the Argo salt formation, are the predominant source of Na+ in the Scotian Basin [26,47,54]. At temperatures below 145 °C, the speed at which albite forms is slower than the rate of dissolution of K-feldspar [78], and, as a result, minor secondary porosity is produced.
The breakdown of K-feldspar grains has been shown to occur at a variety of depths, and three general styles have been reported in the literature: (1) Systems that generate predominantly clay minerals, such kaolinite and illite, have been shown to form at depths as shallow as 1.7 km in the Miocene sandstones of Borneo [16], 1.5–4.5 km in Bohai Bay, China [12], and 3.6–3.7 km in the Haltenbanken area of Norway [10]. (2) Systems with clay minerals and substantial secondary porosity form at 2.5–4 km in Bohai Bay, China [12], and from 3 to 4.5 km in the central graben of the North Sea [8]. (3) Albitization of K-feldspar has been shown to occur at depths of between 2.1 and 3.2 km in the Cameros Basin, Spain [11]; offshore Norway, initially along planes of weakness from 2.2 to 3 km and the complete pseudomorphing of K-feldspar grains below 3.5 km [78]; and at depths of greater than 3.3 km in the Fountain Formation of Colorado, USA [9]. The wide range of depths that are present in these systems suggest that there is no systematic method, based on burial depth, that can be used to predict the breakdown products of feldspar dissolution. The presence of clay minerals, albite, and secondary porosity are the result of local variables, such as porewater chemistry, and mechanisms for fluid removal related to regional geological processes.
In the Scotian Basin, detailed petrographic observations [26] show that K-feldspar grains above a 1.9 km burial depth have experienced minimal alteration and dissolution. Substantial albitization of K-feldspar is first found at ~1.9 km, with strong albitization below 3.1 km. Complete dissolution of K-feldspar occurs at 3.8–4.5 km [26]. K-feldspar proportions in the present study decrease from burial depths of less than 1.9 km, trending toward 0% K-feldspar below 3.8 km (Figure 5).
That pressure plays little or no role in K-feldspar dissolution is illustrated by the Newburn H-23 well (Figure 4), drilled at a water depth of 977 m (Figure 3). K-feldspar proportions, based on conventional point-counting [61], show that ~3% of the K-feldspar is present at depths (measured from the rotary table just above sea level) of 4.3–4.4 km but is absent in samples at 4.9 km and deeper. The corresponding burial depths below the seafloor show that K-feldspar completely disappears between samples at 3.4 and 3.9 km burial depths, consistent with results elsewhere in the Scotian Basin (Figure 10).

5.1.4. Variations in Grain Size

Feldspars tend to comminute more rapidly than quartz during transport, both as a result of physical properties, such as relatively lesser hardness and abundant cleavage, and chemical properties, namely, greater susceptibility to chemical weathering. Thus, there is the potential for K-feldspar to concentrate in finer sediment fractions [79]. Plots of the mean grain sizes and mineral proportions determined in [80] suggest that the relative abundance of feldspar is the greatest in the fine sand fraction. Additional research has shown that sediments deposited in highly agitated environments, or that have been derived from pre-existing sedimentary sources, tend to have a grain-size-dependent feldspar proportion [79]. However, other authors, such as those in [81], have found that the grain size has little impact on the feldspar proportion.
A comparison of the mean grain size of quartz and the proportion of K-feldspar (Figure 6) suggests that in samples from depths of less than 1.9 km, above which depth, minimal dissolution or alteration has occurred in the K-feldspar grains [26], the mean proportions are similar in all the sediment classes (Figure 6). This suggests that the K-feldspar proportion is not strongly influenced by the mean grain size of the host sediment in the study area.

5.1.5. Grain Size Shift

Grain size measurements of the samples collected as a part of this study show that all but one sample have a larger mean quartz grain size than K-feldspar (Figure 7), with K-feldspar grains being, on average, 11% smaller than the quartz grain size (Figure 8a). Settling equivalency analysis based on Stokes law, considering grain size, shape, and density, suggests that minerals of lesser density tend to be associated with smaller grains of higher-density minerals [82]. Discrepancies may be related to the limited availability of grain sizes (due to recycling or abrasion due to cleavage). Sandstones elsewhere have been documented to have feldspar grain sizes that are smaller than their associated quartz grain sizes, with silt-sized feldspar grains in samples containing fine–medium-grained quartz [79]. This process is thought to be related to initially fine-grained feldspar in the source area in combination with continued abrasion during transport.
K-feldspar grains were sourced largely from the Grenville Province [23], located over 600 km from the Scotian Basin. This long transport distance may have provided sufficient mechanical abrasion during transport to comminute feldspar grains. Additionally, while the grain size difference does not show a strong trend with depth (Figure 8b), a trend of increased grain size difference with decreasing feldspar proportion is observed (Figure 8a). This increase suggests that the K-feldspar grain size has been modified by diagenesis during burial. However, samples from burial depths of less than 1.9 km still show a mean grain size shift of ~10%, suggesting that transport processes were likely at play as well.

5.2. K-Feldspar Distribution Model

5.2.1. K-Feldspar Distribution

Spatial trends in K-feldspar proportions predicted by model simulations (Figure 10) generally follow previously observed trends in the total sand abundance predicted in the calibrated “reference case” models in [28]. In the Upper Missisauga Formation and Cree Member, feldspar is trapped mostly on the shelf and decreases from east to west. In the Naskapi Member, feldspar is trapped predominantly along the slope. Feldspar is transported to the basin floor along salt-tectonic-related corridors and deposited in minibasins along the slope and basin floor. However, as a result of the smaller grain size and lower density of the K-feldspar, these grains are transported further across the basin floor than their coarser quartz sand equivalents. As a result, while the total sediments are enriched in K-feldspar on the shelf compared to the basin floor (Figure 10), K-feldspar proportions relative to the total sand fraction are greater in sands in the basin floor, typically by 2%–3%, but locally by up to 10% greater (Figure 11) compared to those in sands on the shelf. This suggests that sand-rich intervals at greater paleodepths in the basin floor have the greatest potential contribution to the reservoir quality through the formation of secondary porosity. However, the highest modeled concentrations of K-feldspar in the study area are in distal regions with lower sand contents, such as around salt withdrawal corridors, basinward of sand-rich minibasins, and between salt bodies. As a result, while the basin floor sands are associated with generally higher K-feldspar proportions, they form smaller reservoir intervals overall than those on the shelf.
The presence of high concentrations of feldspar relative to sand (Figure 11) at the edge of the simulated area suggests that much like the total sands in the basin floor [28], feldspar has a high potential to bypass the modeled area to deeper parts of the basin floor. Sands transported to water depths of >3000 m seaward of the modeled area may, thus, also have feasible secondary porosity.

5.2.2. Evaluation of the Risks Due to Reservoir Quality

Risk maps indicate the regions of a basin that are the most likely to have high-quality petroleum play elements: reservoir, source, maturity, and seal [58]. The risk of each element is evaluated individually using common-risk-segment (CRS) maps. This study evaluates the risks due to the reservoir quality based on the dissolution of K-feldspar during diagenesis and the distribution of sand-rich intervals that form reservoir intervals. Areas of low risk indicate the highest probability of encountering a high-quality reservoir.

5.2.3. Predicting the Generation of Secondary Porosity from Feldspar Dissolution

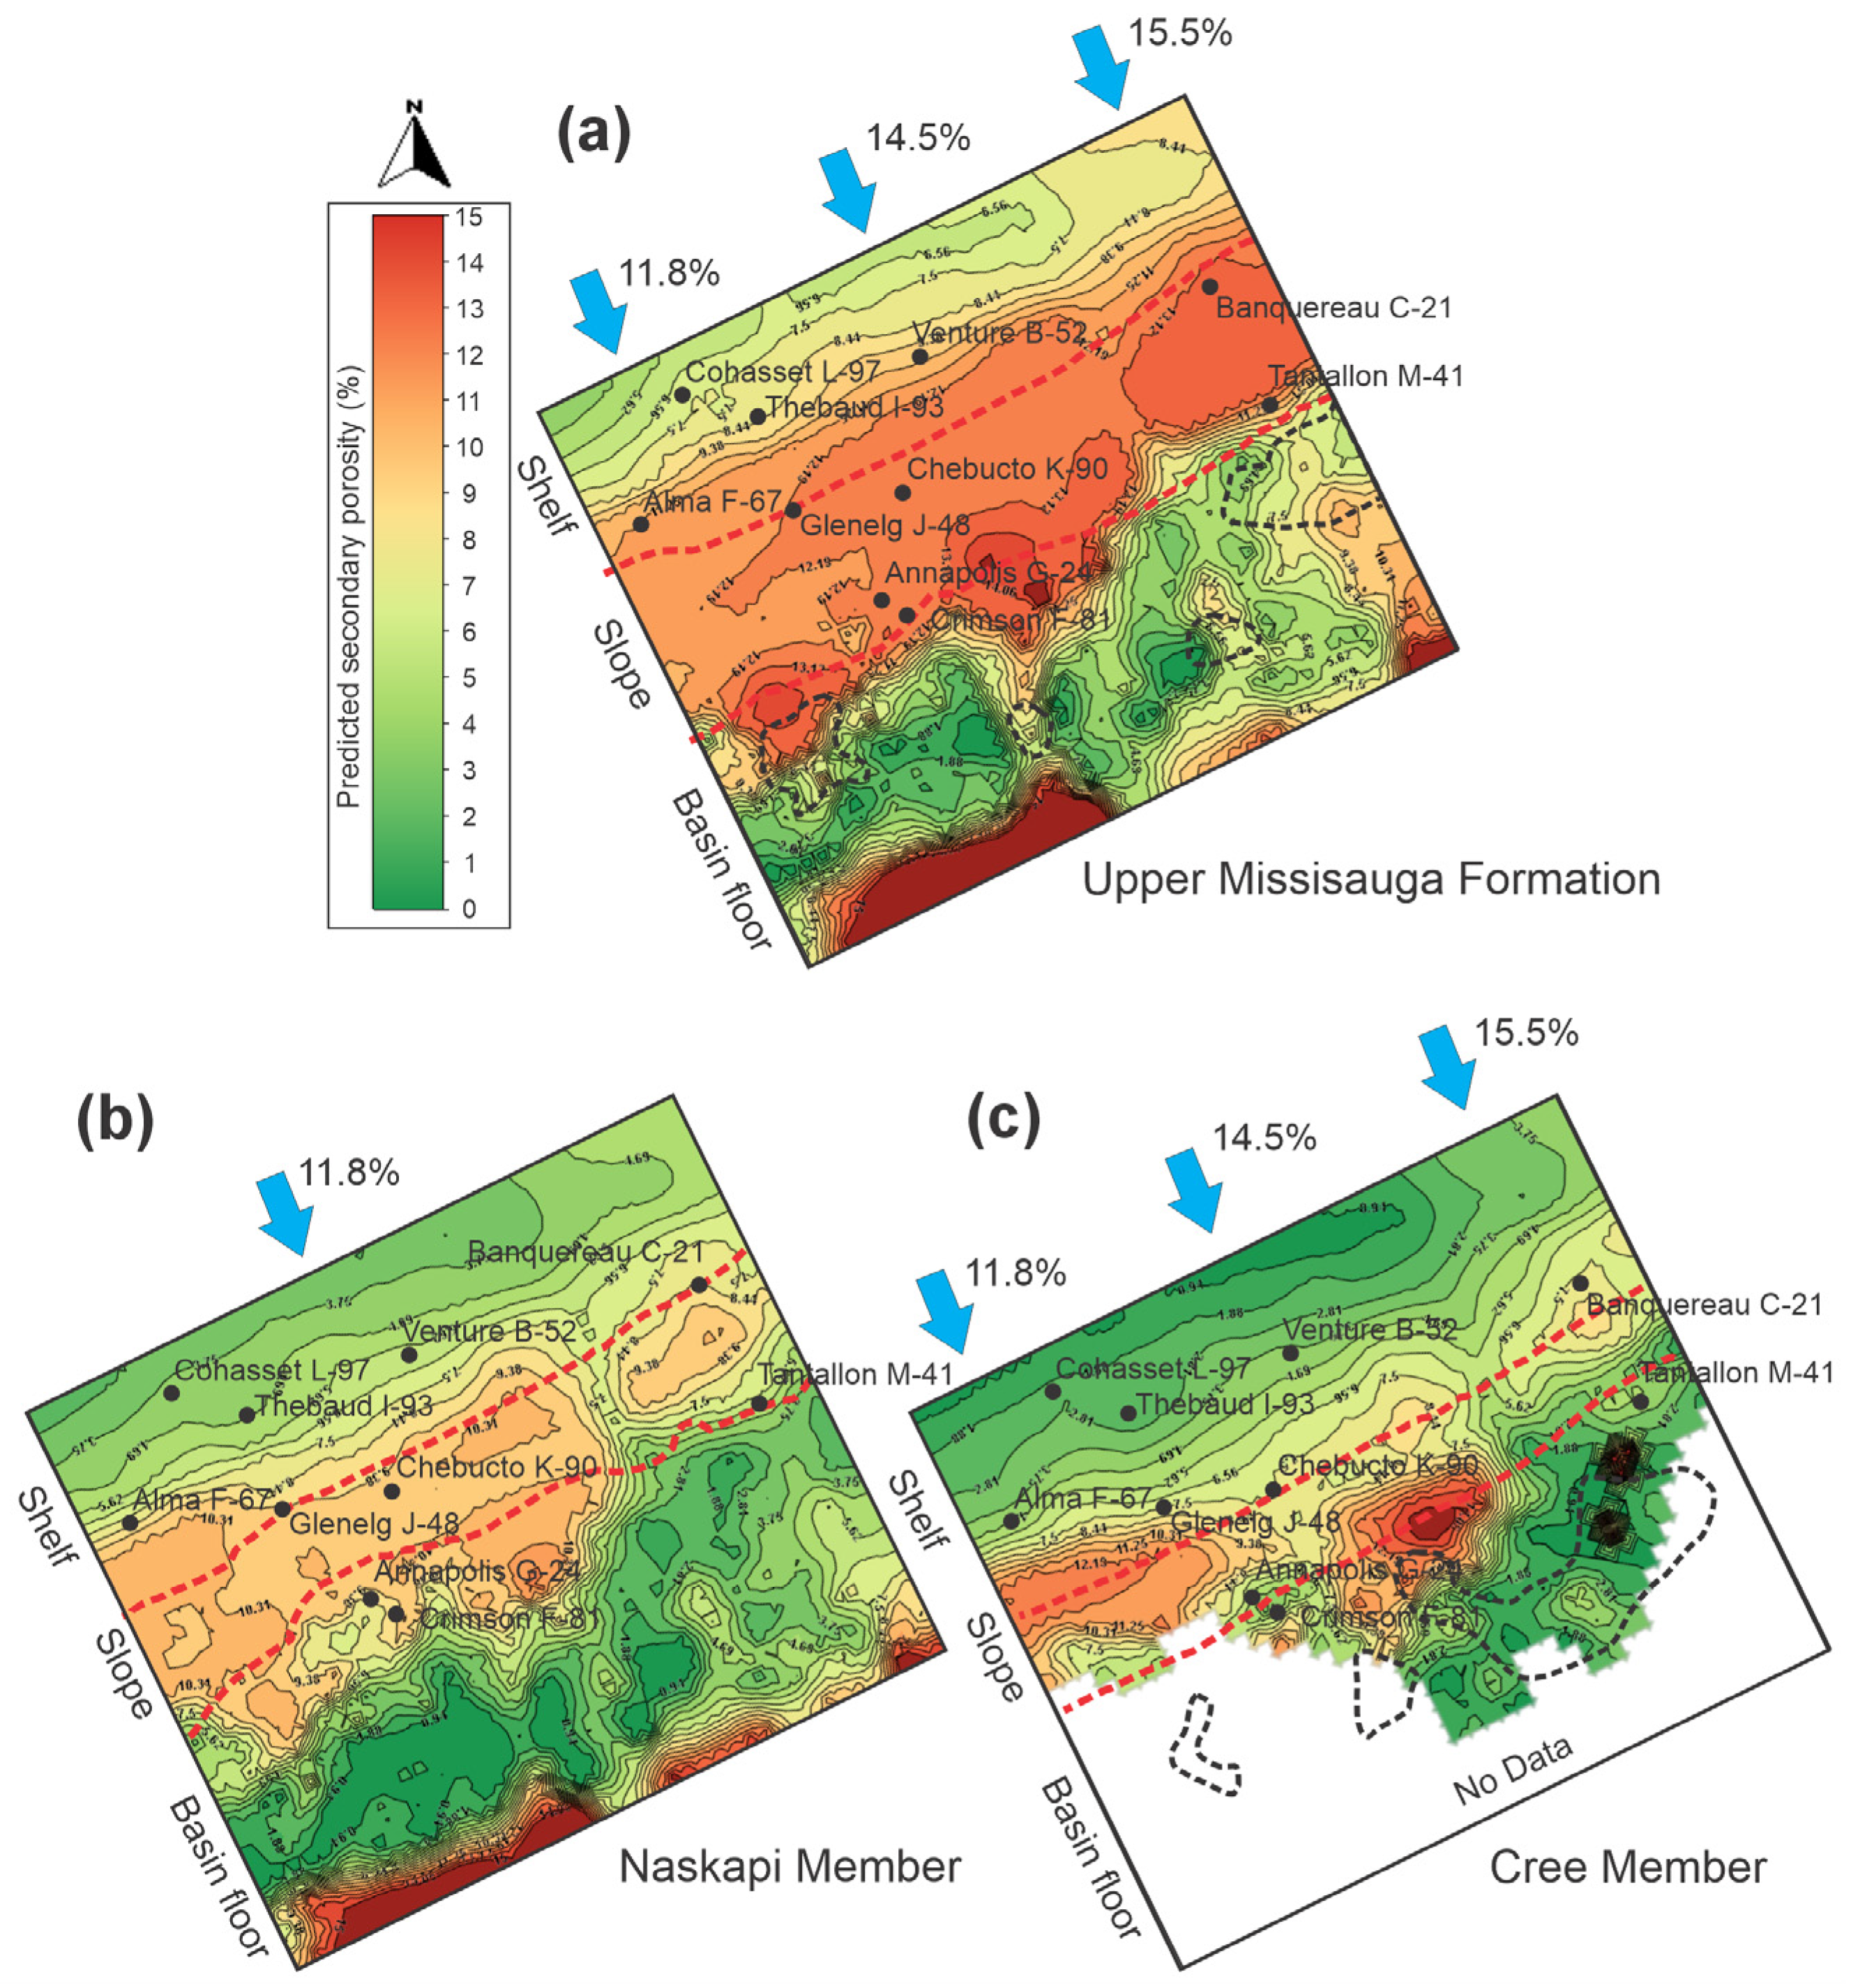
K-feldspar in the central Scotian Basin has been shown to break down with increased depth (Figure 5). Due to the strong association of depth with temperature, the burial depths of the samples collected in this study have been converted to temperatures on the basis of a modern geothermal gradient of 26.6 °C per kilometer of burial depth, with a sea bottom temperature of 11.8 °C [72]. This conversion suggests that K-feldspar dissolution begins at a temperature of 62.3 °C and is complete at greater than 112.9 °C. This process occurs at a rate of approximately 2% of the total volume of K-feldspar per degree Celsius. In order to quantify the breakdown of K-feldspar in sand-rich intervals, this rate is applied to feldspar distribution maps (Figure 11) using thermal modeling conducted in the study area [83]. The modeling results are reported in terms of the percentage of secondary porosity in sandstone generated by K-feldspar dissolution, assuming an open system from which alteration products were removed.
The generation of secondary porosity from K-feldspar dissolution increases with age (Figure 13) and is most prevalent along the slope of the study area. In the Upper Missisauga Formation (Figure 13a), values on the range from 5% to 13% secondary porosity, increasing toward the slope, with large regions of secondary porosity located on the eastern and central slopes (>12%) and at the toe of the slope leading to the basin floor along salt withdrawal corridors. The large region of secondary porosity at the downslope edge of the study area is a simulation artifact of the predominant transport of feldspar into deep water (Figure 11). In the basin floor, where sand bodies are predicted for the Upper Missisauga Formation, sand bodies in the eastern and central study area are modeled as showing 5%–10% secondary porosity, and the sand body with the highest secondary porosity is located in the western basin, with values of greater than 13% in the shelfward half of the body (Figure 13a). In the Naskapi Member, where sand is much less abundant, secondary porosity is correspondingly much lower, but it follows a similar trend as that of the Upper Missisauga Formation (Figure 13b). In the Cree Member, secondary porosity generation on the shelf ranges from 1% to 12% with the highest values occurring in the western shelf at the transition to the slope (Figure 13c). The trends of the slope and basin floor are similar to those of the Upper Missisauga Formation, with values ranging from 2% to 13% and 1% to 13%, respectively. Sand bodies predicted in the basin floor show generally lower secondary porosity where thermal modeling is available, with the greatest secondary porosity predicted in the large body located in the eastern–central basin at <12%.

5.2.4. Open vs. Closed System

While the breakdown of K-feldspar is largely related to burial depth, the preservation of the generated secondary porosity is controlled by the ability of breakdown products to be removed from the system. Closed systems, in which fluids are unable to circulate, quickly become saturated with K+ and Al3+, resulting in the authigenesis of clays and limited formation of secondary porosity. Conversely, open systems allow for the removal of these products and the preservation of secondary porosity and permeability, as demonstrated in [12] in the Bohai Basin, China.
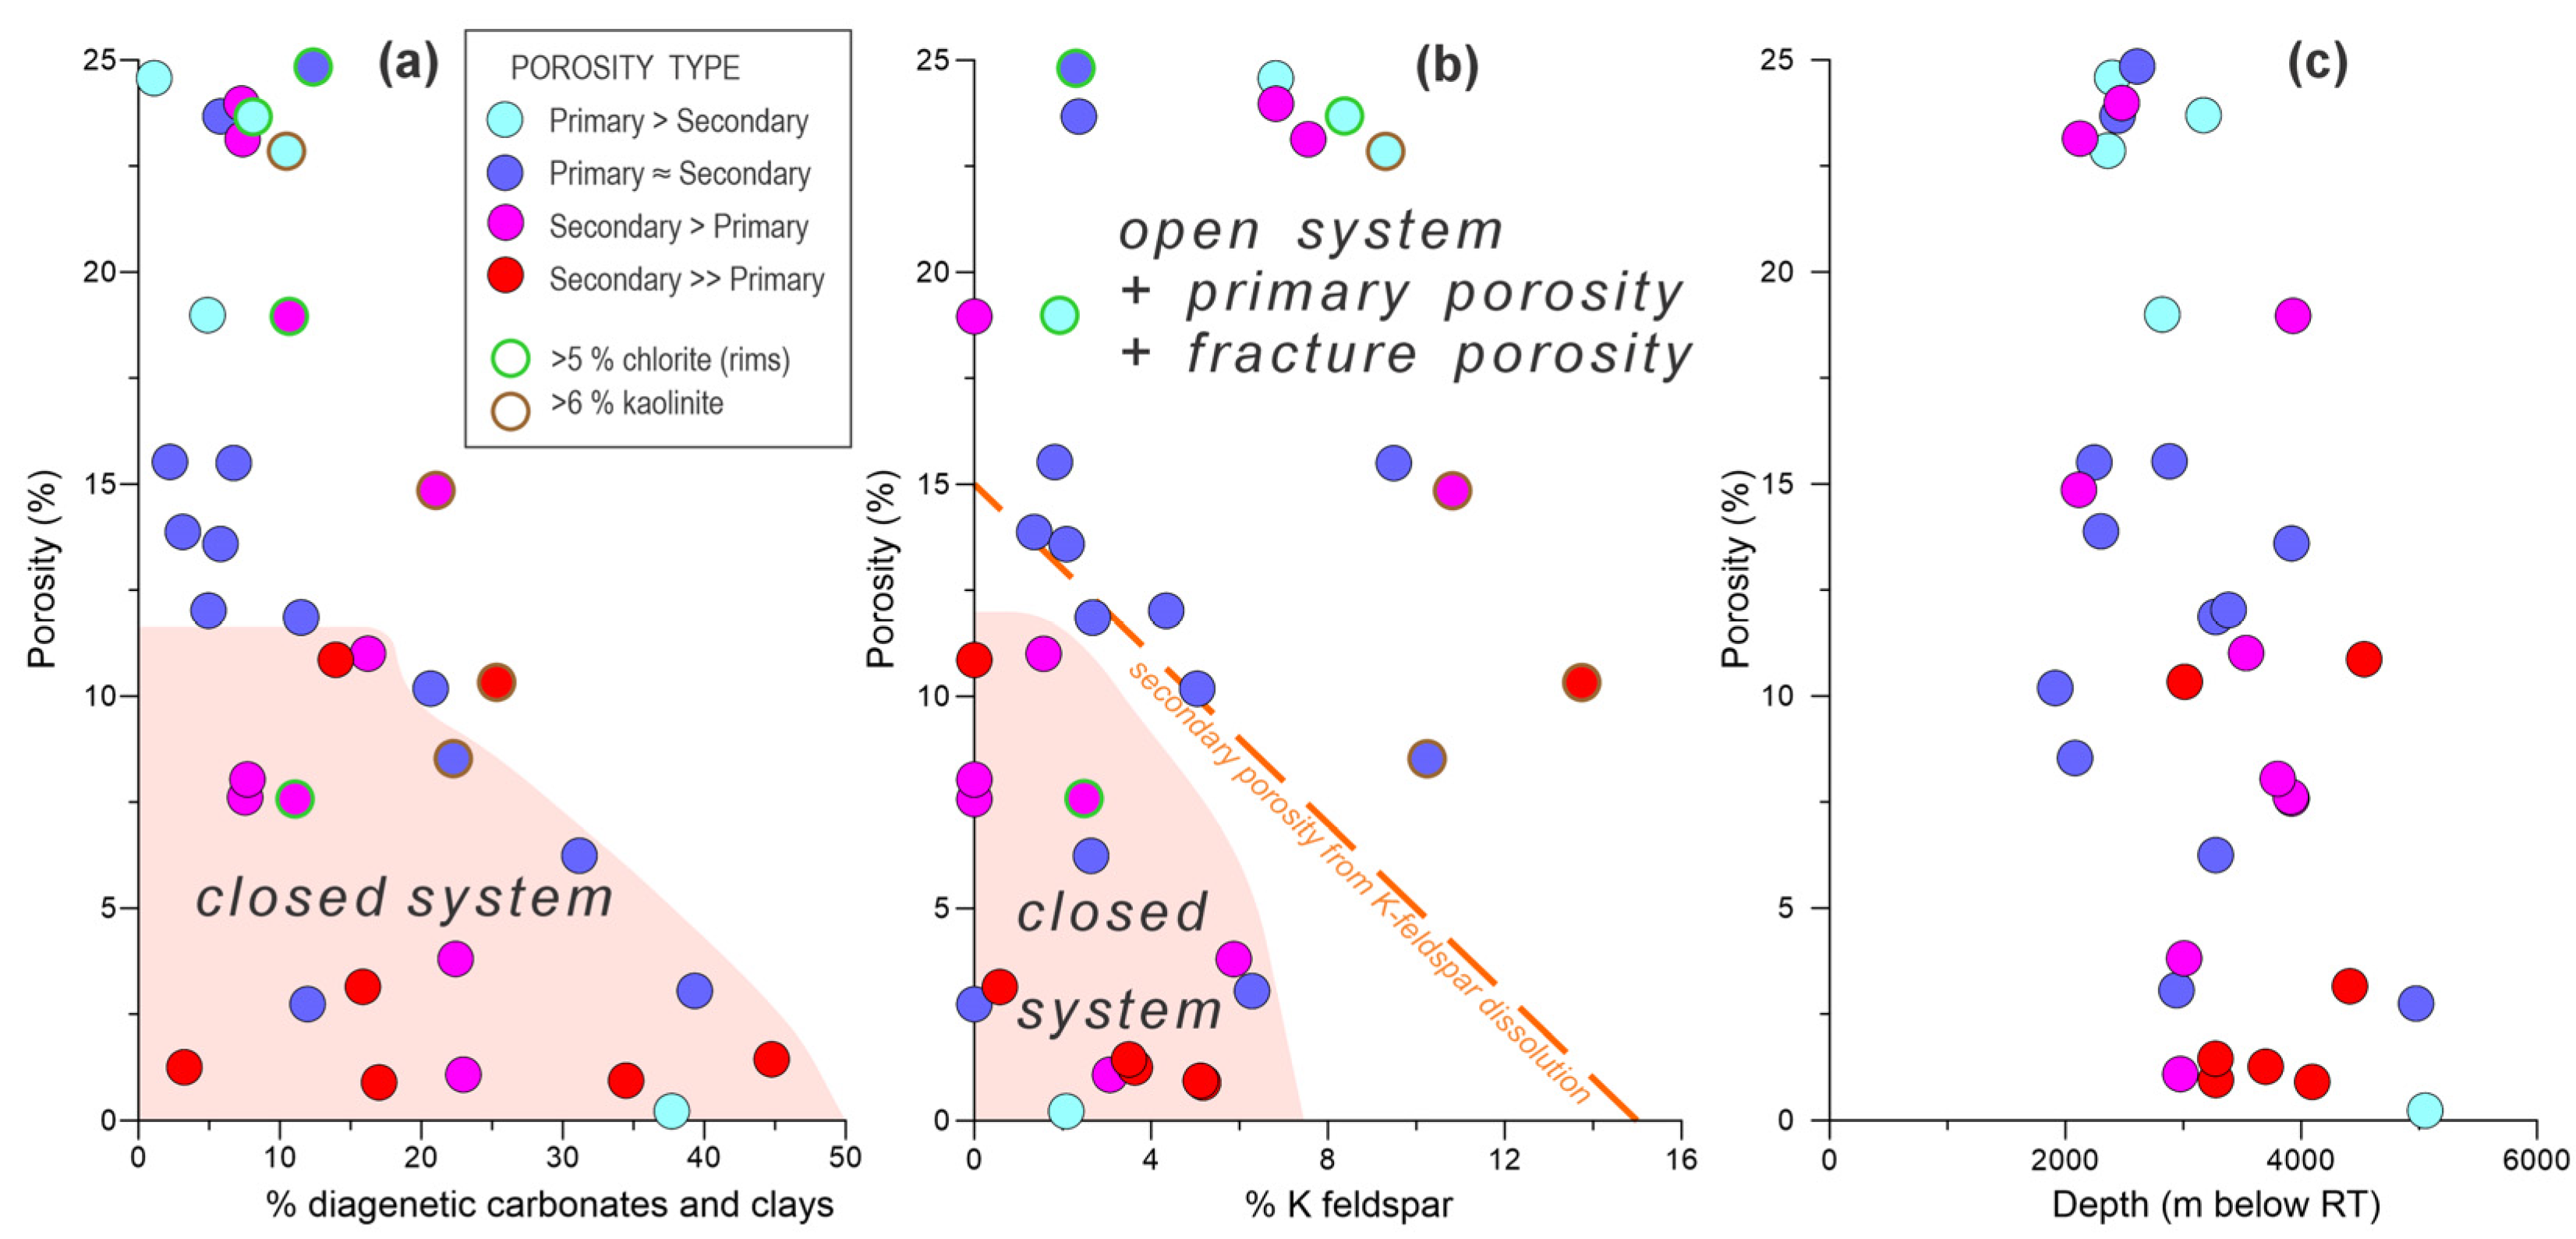
Fault mapping of the study area [25] has been used to predict areas of the basin that likely acted as an open system, allowing for circulating basinal fluids to preserve secondary porosity (Figure 11). The mobilization of the Upper Triassic–Lower Jurassic Argo salt formation resulted in abundant faulting in the central Scotian Basin [40,84], which allowed for saline formation waters to be transported along detachment faults, down-to-basin listric faults and permeable sandstones [47]. The peak times of mobility on salt welds and detachment faults correspond to times of feldspar dissolution in permeable sandstone fairways ([26], their Figure 18). As a result, faulting within the basin has a high potential to remove the byproducts of K-feldspar dissolution and, thus, to preserve secondary porosity. Faults in the study area generally cut through the K101 and K130 surfaces of the early Cretaceous age and down to the underlying salt or salt welds [25]. Additionally, studies on the lithofacies of the Scotian Basin have concluded that lithofacies associated with fluvial–estuarine channels and river-mouth turbidites showed the greatest permeability [33] and served as pathways for fluid circulation on the shelf. This is demonstrated by a suite of 35 samples from porosity–permeability plug samples from potential reservoir rocks distributed across the basin and SEM analysis of the modal mineralogy in [33] (Figure 14). Some 40% of the samples have less porosity than would be created by the dissolution of 15% of the K-feldspar. All but 10% of the remaining samples have <12% of diagenetic clays and carbonates and represent open-system conditions. The open-system samples with subequal primary and secondary porosities (dark blue in Figure 14) have secondary porosities ranging from 5 to 12%, comparable with modeled abundances of K-feldspar (Figure 13).
Faults in the central basin are more abundant than those in the eastern basin [25] (Figure 11) and lithofacies associated with high-permeability reservoirs are also generally thicker in the central basin than in the eastern basin [85]. Additionally, samples with high permeability are more common in the central basin for both the Cree Member and Upper Missisauga Formation [33]. The Naskapi Member has only thin and sparse sands [43] and is not considered further.
On the basis of the presence of faulting, lithofacies, and measured permeabilities, all of which contribute to the formation of an open system, the region of high-level faulting present in the central basin (I in Figure 11) is more likely to preserve secondary porosity, and is, therefore, the area with the lowest risk in the study area for this factor. Preserved secondary porosity in the region is predicted to range from 7% to 13% in the Upper Missisauga Formation and from 5% to 12% in the Cree Member (Figure 13a,c), consistent with the range estimated for the samples in [33] (Figure 14). The next lowest risk is associated with the faulted region of the eastern basin (II in Figure 11). In this area, faulting is less dense than that in the central basin, and thinner high-permeability reservoir units are also present, limiting additional removal of the breakdown products of feldspar dissolution. A moderate risk is, therefore, assigned to this zone. Secondary porosity in this region is predicted to range from 10% to 13% in the Upper Missisauga Formation and from 5 to 10% in the Cree Member (Figure 13a,c), with the potential for approximately 13% secondary porosity preservation as a result of enhanced heat flow related to circulating fluids along faults. The remainder of the study area, where closed-system conditions prevail, except in channel–sandstone fairways, is considered to be a high-risk area for the preservation of secondary porosity generated from feldspar dissolution.

5.2.5. Common-Risk-Segment Maps Based on the Distributions of Sand, K-Feldspar, and Secondary Porosity

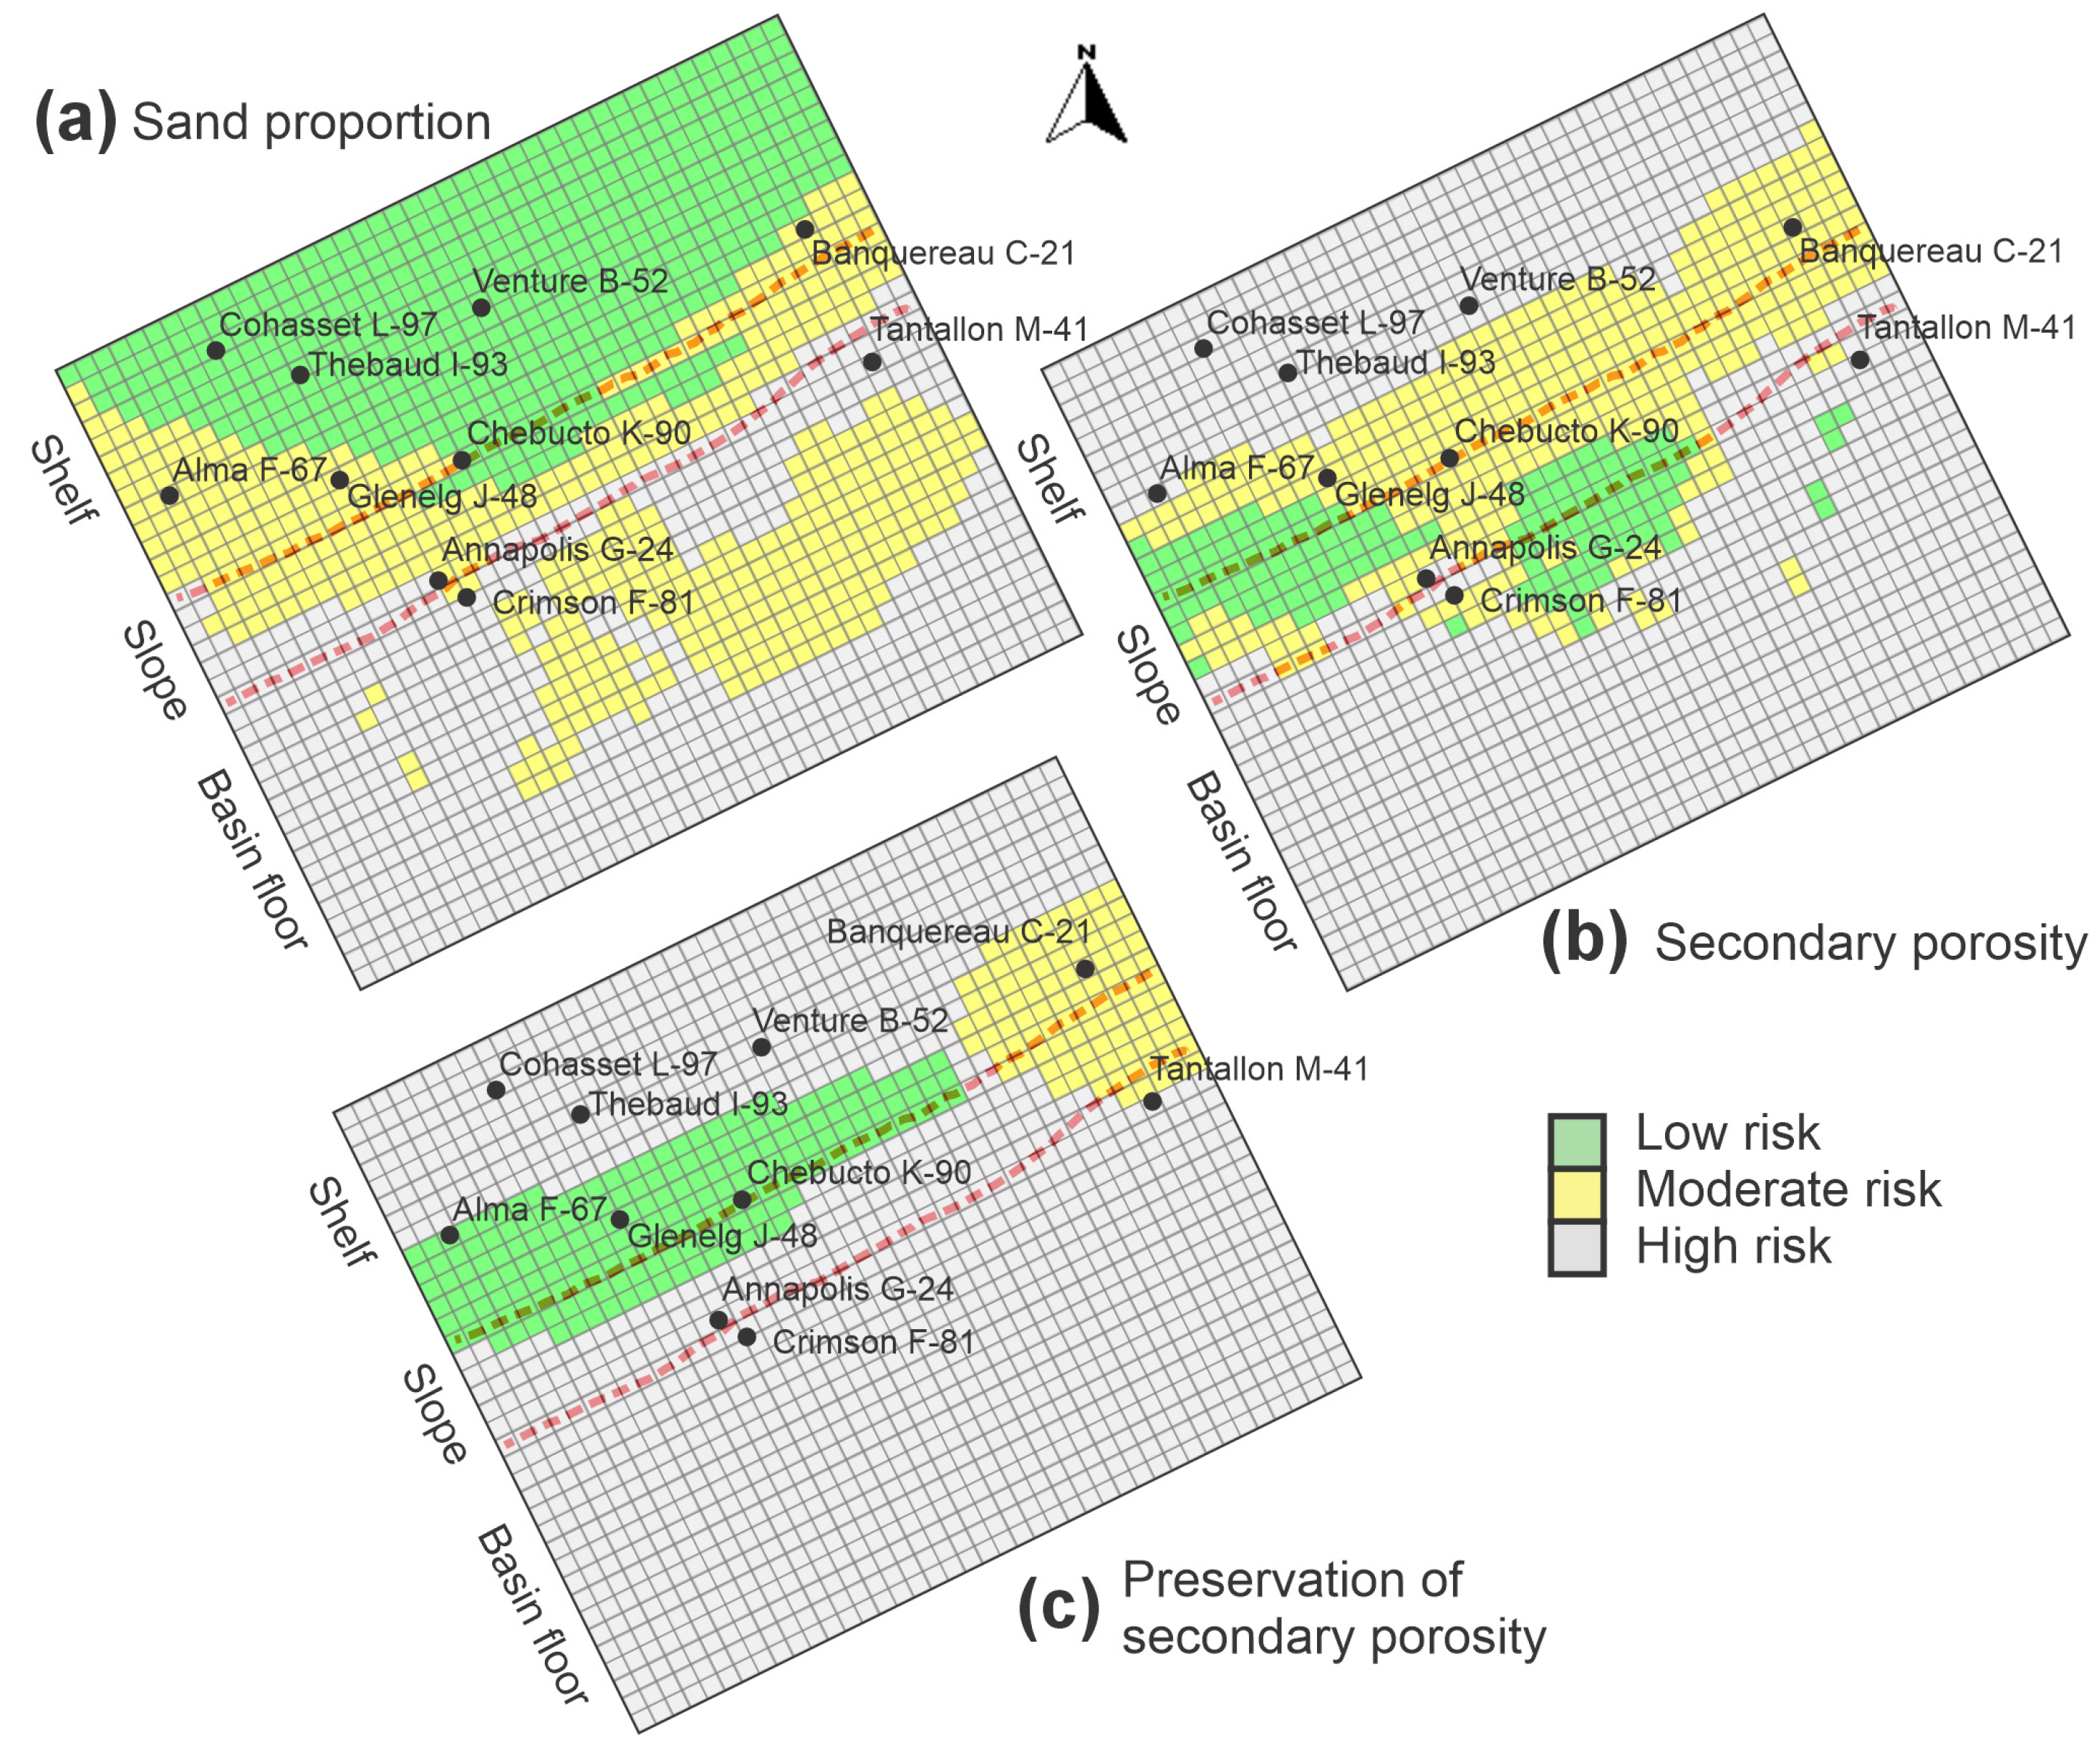
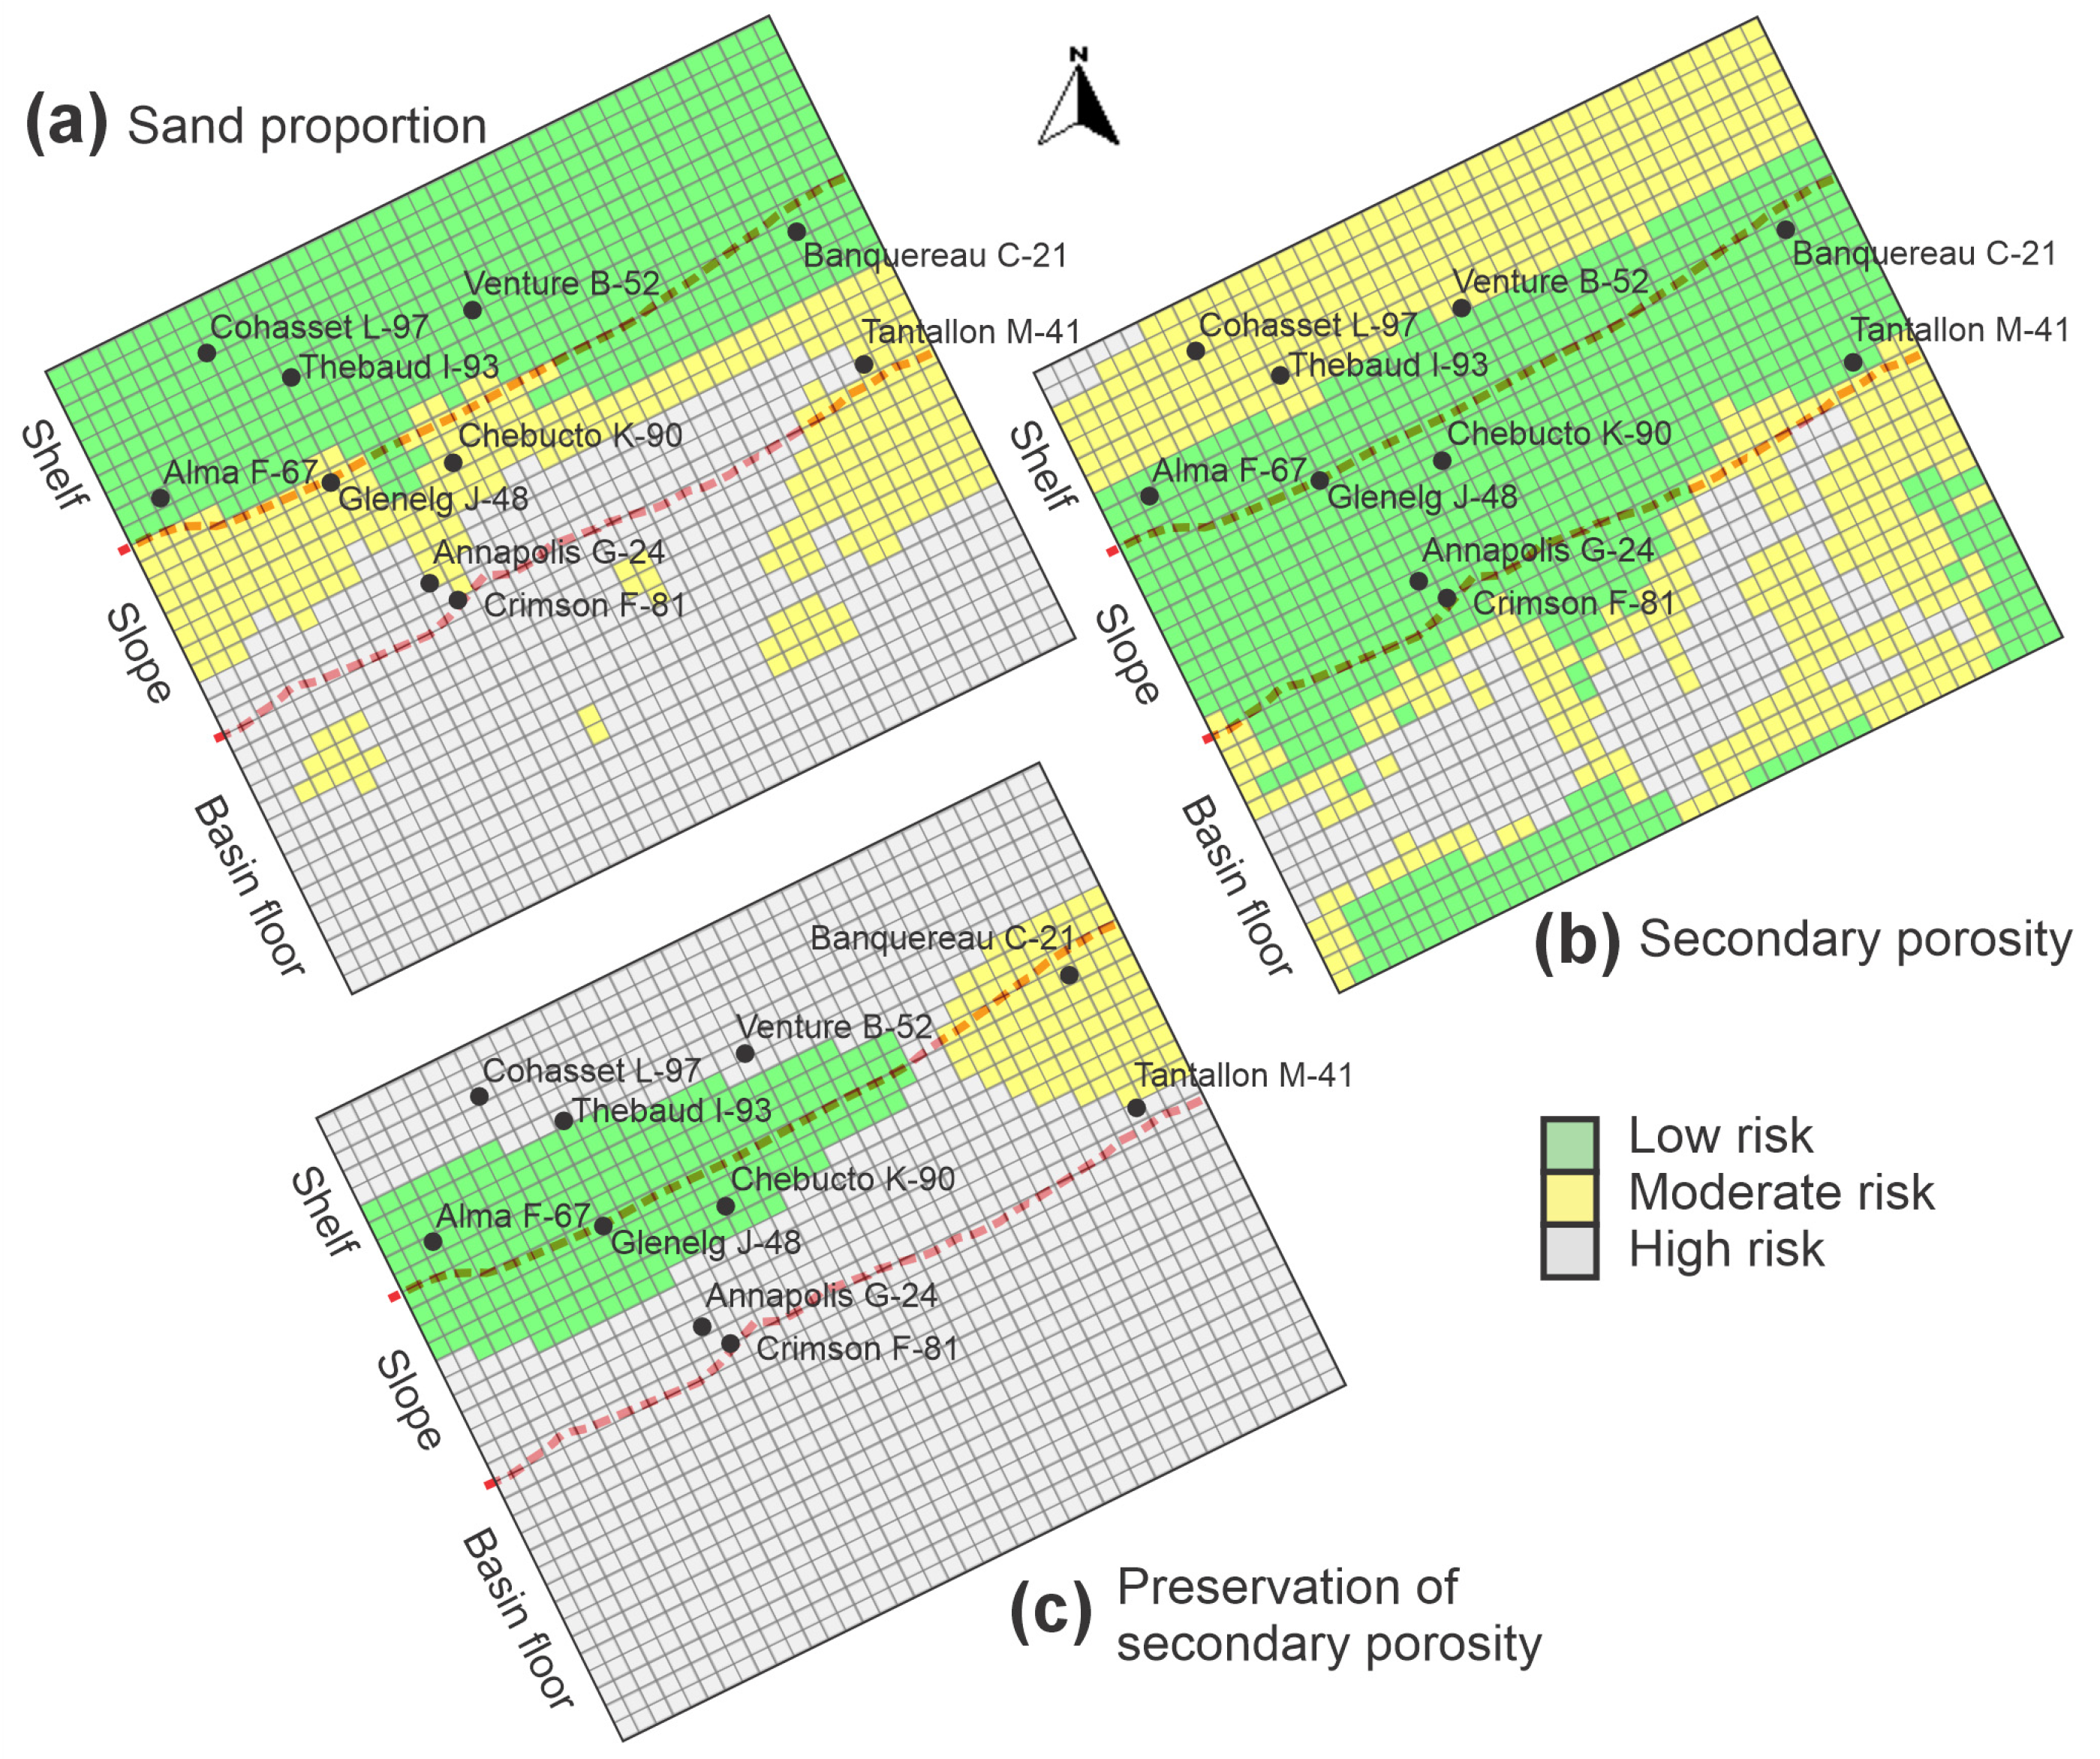
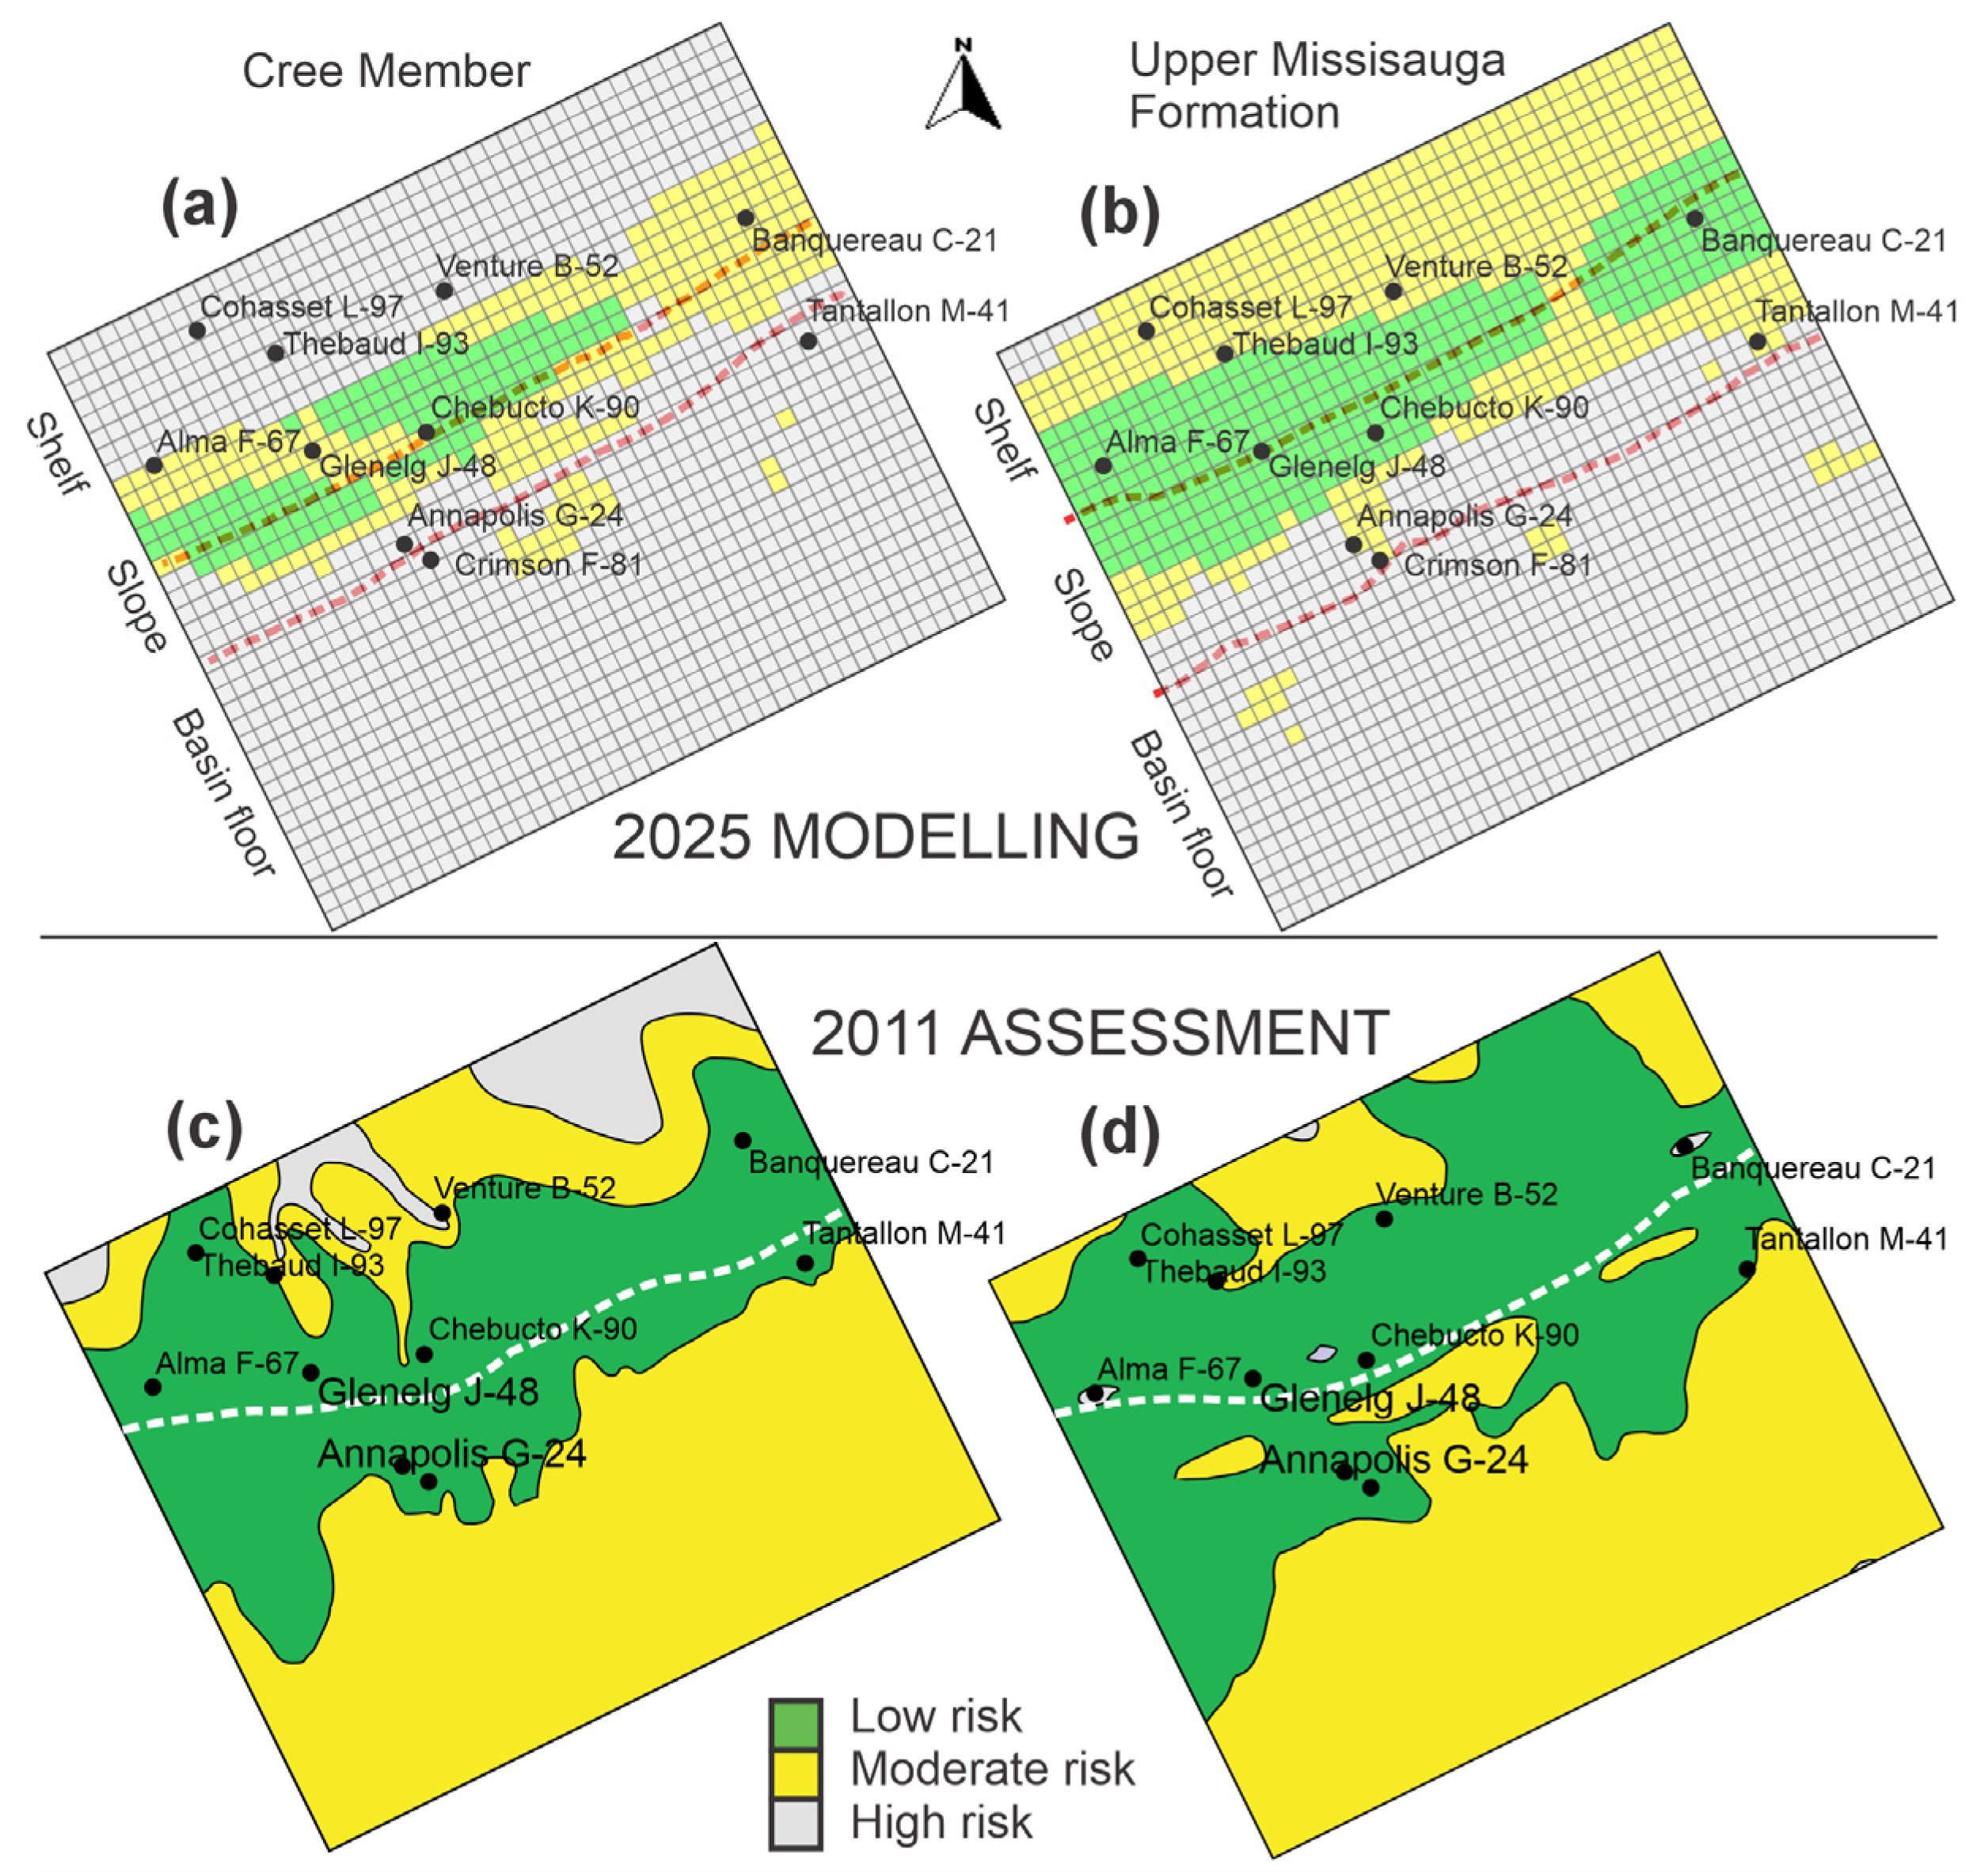
To determine zones of the study area that present a reduced risk to exploration, common-risk-segment (CRS) maps are produced by assigning risk to each of three component maps on the basis of the criteria presented in Table 3. The component maps used are the sand distribution from previous modeling [28], predicted secondary porosity generation from the dissolution of feldspar (Figure 13), and likely secondary porosity preservation (Figure 11). These component maps are presented in Figure 15 (for the Cree Member) and Figure 16 (for the Upper Missisauga Formation). The sand-poor Naskapi Member is not illustrated. A point value of three is assigned to regions of low risk, two points to moderate-risk regions, and one point to high-risk regions. The CRS map is generated by adding together the point values of all the maps and assigning risk on the basis of the totals, with low risk assigned to values of 8 and 9, moderate risk to 6–8, and high risk to 3–6 (Figure 17a,b).
Sand deposits on the shelf and slope have a lower risk than those on the basin floor, with regions of low-risk present in the central and western study area along the shelf edge and slope (Figure 17a,b). Moderate risk is associated with the shelf edge and upper slope, extending from east to west. On the basin floor, the lowest predicted risk is at the toe of the slope in the central study area, and it is of moderate risk. The Upper Missisauga Formation shows greater areas of low risk compared to those in the Cree Member, largely as a result of increased generation of secondary porosity due to greater temperatures during this time (Figure 15b and Figure 16b). Although sands that are rich in K-feldspar have been transported to the deep basin floor, they are likely poor in preserved secondary porosity as a result of lacking a system capable of removing the breakdown products from the dissolution of K-feldspar. The deep-basin floor, therefore, presents a high risk to exploration due to poor reservoir quality.
CRS maps previously produced for the central Scotian Basin by OETR (2011) [25] considered the reservoir presence and effectiveness, seal presence and effectiveness, and petroleum charge. Those CRS maps (Figure 17c,d) show a similar distribution of risk to the CRS maps produced in this study within the same area, with a generally lower risk in the Upper Missisauga Formation than in the Cree Member and low risk predominantly located at the shelf edge and slope. However, the previous CRS maps predicted a moderate risk throughout the deep-basin floor for both intervals, with low risk only present at the landward edge of the study area of the Cree Member. Additionally, the areas of low risk in the previous CRS maps are larger than the low-risk area predicted by this study and extend deeper into the basin floor (Figure 17). However, the lack of a mechanism for preserving secondary porosity beyond the shelf-to-slope transition (Figure 15c and Figure 16c) suggests that the risk due to reservoir quality is much higher than previously predicted, particularly along the toe of the slope and in the deep-basin floor.
The present study presents a rapid and simple method for assessing the risks due to reservoir properties. Largely automated analyses of thin sections in reference wells are combined with stratigraphic modeling to transfer understanding of reservoirs from studies of single wells to a regional-scale assessment of reservoir properties. Petrographic properties other than feldspar abundance can be used in such analyses, as suggested in [86] for the Gulf of Mexico. For example, it may be possible to predict the distribution of chlorite coats on sand grains [87] by modeling the inputs and dispersion of precursor-coated grains.

6. Conclusions

K-feldspar proportions in Cretaceous subarkosic sandstones of the Scotian Basin decrease with increasing depth due to dissolution resulting from increased temperatures and diagenetic interactions with basinal fluids. The dissolution of K-feldspar begins at 1.9 km sub-seafloor and is completed below 3.8 km. The detrital supply of K-feldspar is a little higher in the eastern basin (15.5%) than in the west (11.8%). K-feldspar grains are generally 5%–20% smaller than the mean quartz grain size in any given sample as a result of density sorting, ease of fragmentation, and dissolution at depth.
Model simulations of the K-feldspar distribution show a similar trend to those observed in previous modeling of the sand distribution. However, the highest concentrations of K-feldspar in the study area are on the deep-basin floor, where the sand content is lower, and some feldspar can bypass the modeled area to the deeper parts of the basin floor. Dissolution of the modeled K-feldspar distribution in sandstones has the potential to create <13% secondary porosity in the Upper Missisauga Formation and <12% in the Cree Member on the outer shelf, consistent with measured secondary porosity in some wells.
Abundant faults and thick permeable sands provide an open system in which the breakdown products from K-feldspar dissolution are removed, allowing for the preservation of secondary porosity. The central basin has most abundant faulting and thick sand beds that allow the removal of such breakdown products. These conditions do not exist in the deep-basin floor, where secondary porosity is likely clogged by diagenetic carbonates and clays. The reservoir quality in the deep-basin floor is, therefore, likely low.
The approach used in this study is directly applicable to other basins with subarkosic sandstone reservoirs. More generally, it demonstrates the power of combining laboratory petrographic studies with basin-scale modeling to assess reservoir risk in complex basins, applicable to petroleum exploitation, carbon dioxide storage, and geothermal energy.

Author Contributions

Conceptualization, C.S.; methodology, C.S., F.S.-A. and N.H.; software, F.S.-A. and N.H.; validation, G.P.-P. and D.J.W.P.; investigation, C.S.; resources, G.P.-P. and F.S.-A.; data curation, C.S. and G.P.-P.; writing—original draft preparation, C.S.; writing—review and editing, D.J.W.P. and G.P.-P.; visualization, C.S.; supervision, G.P.-P.; project administration, G.P.-P. and F.S.-A.; funding acquisition, G.P.-P. and F.S.-A. All authors have read and agreed to the published version of the manuscript.

Funding

This research was conducted as a part of a collaboration between Beicip-Franlab and Saint Mary’s University. Funding was provided by the Nova Scotia Offshore Energy Research Association (grant number 300-201) to GPP; a Natural Sciences and Engineering Research Council of Canada (NSERC) Discovery Grant (2016-04310) to GPP; Beicip-Franlab; and Saint Mary’s University.

Data Availability Statement

Research data are available in Sangster (2019) (M.Sc. thesis) [88].

Acknowledgments

We would like to thank Xiang Yang for his help with SEM analysis and the CNSOPB for providing the samples analyzed as a part of this study, as well as the technical support team at Beicip-Franlab for their help with the OpenFlow suite. We also thank Andrew MacRae and Alexandre Normandeau for their contributions to this project. David Piper’s work was carried out under the Geoscience for New Energy Supply program. No GenAI has been used.

Conflicts of Interest

The authors declare no conflicts of interest. The funders had no role in the design of the study; in the collection, analyses, or interpretation of the data; in the writing of the manuscript; or in the decision to publish the results.

Abbreviations

The following abbreviation is used in this manuscript:
CRSCommon risk segment

References

  1. Schmoker, J.W.; Gautier, D.L. Sandstone porosity as a function of thermal maturity. Geology 1988, 16, 1007–1010. [Google Scholar] [CrossRef]
  2. Schmoker, J.W.; Schenk, C.J. Regional porosity trends of the Upper Jurassic Norphlet Formation in southwestern Alabama and vicinity, with comparisons to formations of other basins. AAPG Bull. 1994, 78, 166–180. [Google Scholar] [CrossRef]
  3. Ehrenberg, S.N.; Nadeau, P.H.; Steen, Ø. A megascale view of reservoir quality in producing sandstones from the offshore Gulf of Mexico. AAPG Bull. 2008, 92, 145–164. [Google Scholar] [CrossRef]
  4. Taylor, T.R.; Giles, M.R.; Hathon, L.A.; Diggs, T.N.; Braunsdorf, N.R.; Birbiglia, G.V.; Kittridge, M.G.; Macaulay, C.I.; Espejo, I.S. Sandstone diagenesis and reservoir quality prediction: Models, myths, and reality. AAPG Bull. 2010, 94, 1093–1132. [Google Scholar] [CrossRef]
  5. Taylor, T.R. Association of allochthonous waters and reservoir enhancement in deeply buried Miocene sandstones: Picaroon field, Corsair trend, offshore Texas. In Siliciclastic Diagenesis and Fluid Flow: Concepts and Applications; Crossey, L.J., Loucks, R., Totten, M.W., Eds.; SEPM Special Publication; Society for Sedimentary Geology (SEPM): Claremore, OK, USA, 1996; Volume 55, pp. 37–48. [Google Scholar]
  6. Zhu, S.; Zhu, X.; Wang, X.; Liu, Z. Zeolite diagenesis and its control on petroleum reservoir quality of Permian in northwestern margin of Junggar Basin, China. Sci. China Earth Sci. 2012, 55, 386–396. [Google Scholar] [CrossRef]
  7. Morad, S.; Al-Ramadan, K.; Ketzer, J.M.; De Ros, L.F. The impact of diagenesis on the heterogeneity of sandstone reservoirs: A review of the role of depositional facies and sequence stratigraphy. AAPG Bull. 2010, 94, 1267–1309. [Google Scholar] [CrossRef]
  8. Haszeldine, R.S.; Wilkinson, M.; Darby, D.; Macaulay, C.I.; Couples, G.D.; Fallick, A.E.; Fleming, C.G.; Stewart, R.N.; McAulay, G. Diagenetic porosity creation in an overpressured graben. Geol. Soc. Lond. Pet. Geol. Conf. Ser. 1999, 5, 1339–1350. [Google Scholar] [CrossRef]
  9. Walker, T.R. SEPM presidential address; Diagenetic albitization of potassium feldspar in arkosic sandstones. J. Sedim. Res. 1984, 54, 3–16. [Google Scholar]
  10. Chuhan, F.A.; Bjørlykke, K.; Lowrey, C.J. Closed-system burial diagenesis in reservoir sandstones: Examples from the Garn Formation at Haltenbanken area, offshore mid-Norway. J. Sedim. Res. 2001, 71, 15–26. [Google Scholar] [CrossRef]
  11. González-Acebrón, L.; Arribas, J.; Mas, R. Role of sandstone provenance in the diagenetic albitization of feldspars: A case study of the Jurassic Tera Group sandstones (Cameros Basin, NE Spain). Sedim. Geol. 2010, 229, 53–63. [Google Scholar] [CrossRef]
  12. Yuan, G.; Cao, Y.; Gluyas, J.; Li, X.; Xi, K.; Wang, Y.; Jia, Z.; Sun, P.; Oxtoby, N.H. Feldspar dissolution, authigenic clays, and quartz cements in open and closed sandstone geochemical systems during diagenesis: Typical examples from two sags in Bohai Bay Basin, East China. AAPG Bull. 2015, 99, 2121–2154. [Google Scholar] [CrossRef]
  13. Wilkinson, M.; Milliken, K.L.; Haszeldine, R.S. Systematic destruction of K-feldspar in deeply buried rift and passive margin sandstones. J. Geol. Soc. 2001, 158, 675–683. [Google Scholar] [CrossRef]
  14. Wilkinson, M.; Darby, D.; Haszeldine, R.S.; Couples, G.D. Secondary porosity generation during deep burial associated with overpressure leak-off: Fulmar Formation, United Kingdom Central Graben. AAPG Bull. 1997, 81, 803–813. [Google Scholar] [CrossRef]
  15. Zhu, X.M.; Zhong, D.K.; Zhang, Q.; Zhang, L. Sandstone diagenesis and porosity evolution of Paleogene in Huimin depression. Petrol. Sci. 2004, 3, 23–29. [Google Scholar]
  16. Giles, M.R.; De Boer, R.B. Origin and significance of redistributional secondary porosity. Mar. Petrol. Geol. 1990, 7, 378–397. [Google Scholar] [CrossRef]
  17. Higgs, K.E.; Zwingmann, H.; Reyes, A.G.; Funnell, R.H. Diagenesis, porosity evolution, and petroleum emplacement in tight gas reservoirs, Taranaki Basin, New Zealand. J. Sedim. Res. 2007, 77, 1003–1025. [Google Scholar] [CrossRef]
  18. Hawie, N.; Deschamps, R.; Granjeon, D.; Nader, F.H.; Gorini, C.; Müller, C.; Montadert, L.; Baudin, F. Multi-scale constraints of sediment source to sink systems in frontier basins: A forward stratigraphic modelling case study of the Levant region. Basin Res. 2017, 29, 418–445. [Google Scholar] [CrossRef]
  19. Hawie, N.; Covault, J.A.; Dunlap, D.; Sylvester, Z. Slope-fan depositional architecture from high-resolution forward stratigraphic models. Mar. Petrol. Geol. 2018, 91, 576–585. [Google Scholar] [CrossRef]
  20. Hawie, N.; Marfisi, E.; Saint-Ange, F.; MacDonald, A.W.A. Statistical analysis of forward stratigraphic models in complex salt provinces: The central Scotian Basin case study. AAPG Bull. 2019, 103, 433–467. [Google Scholar] [CrossRef]
  21. Grohmann, S.; Fietz, W.S.; Nader, F.H.; Romero-Sarmiento, M.F.; Baudin, F.; Littke, R. Characterization of Late Cretaceous to Miocene source rocks in the Eastern Mediterranean Sea: An integrated numerical approach of stratigraphic forward modelling and petroleum system modelling. Basin Res. 2021, 33, 846–874. [Google Scholar] [CrossRef]
  22. Sheldon, H.A.; Crombez, V.; Poulet, T.; Kelka, U.; Kunzmann, M.; Kerrison, E. Realistic permeability distributions in faults and sediments: The key to predicting fluid flow in sedimentary basins. Basin Res. 2023, 35, 2118–2139. [Google Scholar] [CrossRef]
  23. Blowick, A.; Pe-Piper, G.; Piper, D.J.W.; Zhang, Y.; Tyrrell, S. First-cycle sand supply and the evolution of the eastern Canadian continental margin: Insights from Pb isotopes in the Mesozoic Scotian Basin. GSA Bull. 2021, 133, 1301–1319. [Google Scholar] [CrossRef]
  24. Wach, G.D.; Brown, D.E. Petroleum exploration on the Scotian Margin. In Proceedings of the GeoConvention, Virtual, 13–15 September 2021; Available online: https://geoconvention.com/wp-content/uploads/abstracts/2021/67693-petroleum-exploration-on-the-scotian-margin.pdf (accessed on 17 September 2025).
  25. OETR (Offshore Energy Technical Research Association). Play Fairway Analysis Atlas–Offshore Nova Scotia: Nova Scotia Department of Energy, 88-11-0004-01. 2011. 349p. Available online: https://energy.novascotia.ca/oil-and-gas/offshore/play-fairway-analysis (accessed on 9 September 2025).
  26. Pe-Piper, G.; Piper, D.J.W. Temperature and basinal fluid controls on feldspar diagenesis, Lower Cretaceous sandstones, Scotian Basin, Canada. Mar. Petrol. Geol. 2022, 141, 105704. [Google Scholar] [CrossRef]
  27. Kidston, A.G.; Smith, B.; Brown, D.E.; Makrides, C.; Altheim, B. Nova Scotia Deep Water Offshore Post-Drill Analysis 1982–2004; Canada-Nova Scotia Offshore Petroleum Board: Halifax, NS, Canada, 2007; 181p. [Google Scholar]
  28. Sangster, C.; Piper, D.J.W.; Hawie, N.; Pe-Piper, G.; Saint-Ange, F. Forward stratigraphic modelling of sediment pathways and depocentres in salt-influenced passive-margin basins: Lower Cretaceous, central Scotian Basin. Basin Res. 2019, 31, 728–753. [Google Scholar] [CrossRef]
  29. Zhang, Y.; Pe-Piper, G.; Piper, D.J.W. Sediment geochemistry as a provenance indicator: Unravelling the cryptic signatures of polycyclic sources, climate change, tectonism and volcanism. Sedimentology 2014, 61, 383–410. [Google Scholar] [CrossRef]
  30. Gould, K.; Pe-Piper, G.; Piper, D.J.W. Relationship of diagenetic chlorite rims to depositional facies in Lower Cretaceous reservoir sandstones of the Scotian Basin. Sedimentology 2010, 57, 587–610. [Google Scholar] [CrossRef]
  31. Karim, A.; Pe-Piper, G.; Piper, D.J.W. Controls on diagenesis of Lower Cretaceous reservoir sandstones in the western Sable Subbasin, offshore Nova Scotia. Sedim. Geol. 2010, 224, 65–83. [Google Scholar] [CrossRef]
  32. Pe-Piper, G.; Piper, D.J.W. Significance of the chemistry and morphology of diagenetic siderite in clastic rocks of the Mesozoic Scotian Basin. Sedimentology 2019, 67, 782–809. [Google Scholar] [CrossRef]
  33. Zhang, Y.; Pe-Piper, G.; Piper, D.J.W. How sandstone porosity and permeability vary with diagenetic minerals in the Scotian Basin, offshore eastern Canada: Implications for reservoir quality. Mar. Petrol. Geol. 2015, 63, 28–45. [Google Scholar] [CrossRef]
  34. Weston, J.F.; MacRae, R.A.; Ascoli, P.; Cooper, M.K.E.; Fensome, R.A.; Shaw, D.; Williams, G.L. A revised biostratigraphic and well-log sequence-stratigraphic framework for the Scotian Margin, offshore eastern Canada. Can. J. Earth Sci. 2012, 49, 1417–1462. [Google Scholar] [CrossRef]
  35. Pe-Piper, G. Reservoir Quality and Sediment Delivery, Mesosoic Scotian Basin. Unpublished report; Encana, NSERC and OERA: Calgary, AB, Canada, 2016; 125p. [Google Scholar]
  36. Wade, J.; MacLean, B. The geology of the southeastern margin of Canada. In Geology of the Continental Margin of Eastern Canada; Keen, M.J., Williams, G.L., Eds.; Geology of Canada; Geological Survey of Canada: Ottawa, ON, Canada, 1990; Volume 2, pp. 167–238. [Google Scholar]
  37. IFP Energies Nouvelles. BeicipFranlab, DionisosFlow Software. 2016. Available online: http://www.beicip.com/stratigraphic-modelling-0 (accessed on 9 September 2025).
  38. Granjeon, D. 3D forward modelling of the impact of sediment transport and base level cycles on continental margins and incised valleys. In From Depositional Systems to Sedimentary Successions on the Norwegian Continental Margin; Martinius, A.W., Ravnås, R., Howell, J.A., Steel, R.J., Wonham, J.P., Eds.; International Association of Sedimentology Special Publication; Wiley: Hoboken, NJ, USA, 2014; Volume 46, pp. 453–472. [Google Scholar] [CrossRef]
  39. Ings, S.J.; Shimeld, J.W. A new conceptual model for the structural evolution of a regional salt detachment on the northeast Scotian margin, offshore eastern Canada. AAPG Bull. 2006, 90, 1407–1423. [Google Scholar] [CrossRef]
  40. Kendell, K.L. Variations in salt expulsion style within the Sable canopy complex, central Scotian margin. Can. J. Earth Sci. 2012, 49, 1504–1522. [Google Scholar]
  41. Deptuck, M.E.; Kendell, K.L. A review of Mesozoic-Cenozoic salt tectonics along the Scotian margin, eastern Canada. In Permo-Triassic Salt Provinces of Europe, North Africa and the Atlantic Margins; Soto, J.I., Flinch, J.F., Tari, G., Eds.; Elsevier: Amsterdam, The Netherlands, 2017; pp. 287–312. [Google Scholar] [CrossRef]
  42. Piper, D.J.W.; Noftall, R.; Pe-Piper, G. Allochthonous prodeltaic sediment facies in the Lower Cretaceous at the Tantallon M-41 well: Implications for the deep-water Scotian Basin. AAPG Bull. 2010, 94, 87–104. [Google Scholar] [CrossRef]
  43. Chavez, I.; Piper, D.J.W.; Pe-Piper, G. Correlation of the Aptian Naskapi Member of the Scotian Basin and its regional implications. Can. J. Earth Sci. 2018, 55, 514–535. [Google Scholar] [CrossRef]
  44. Cummings, D.I.; Arnott, R.W.C. Growth-faulted shelf-margin deltas: A new (but old) play type, offshore Nova Scotia. Bull. Can. Petrol. Geol. 2005, 53, 211–236. [Google Scholar] [CrossRef]
  45. Deptuck, M.E.; Kendell, K.; Brown, D.E.; Smith, B.M. Seismic Stratigraphic Framework and Structural Evolution of the Eastern Scotian Slope: Geological Context for the NS14-1 Call for Bids Area, Offshore Nova Scotia; Geoscience Open File Report; Canada-Nova Scotia Offshore Petroleum Board: Halifax, NS, Canada, 2014. [Google Scholar]
  46. CNSOPB. Technical Summaries of Scotian Shelf Significant and Commercial Discoveries. 2000. Available online: https://callforbids.cnsopb.ns.ca/2008/02/Publications/Geoscience/Technical%20Summaries.pdf (accessed on 17 September 2025).
  47. Pe-Piper, G.; Piper, D.J.W.; Zhang, Y.; Chavez, I. Diagenetic barite and sphalerite in middle Mesozoic sandstones, Scotian Basin, as tracers for basin hydrology. AAPG Bull. 2015, 99, 1281–1313. [Google Scholar] [CrossRef]
  48. Reynolds, P.H.; Pe-Piper, G.; Piper, D.J.W. Detrital muscovite geochronology and the Cretaceous tectonics of the inner Scotian Shelf, southeastern Canada. Can. J. Earth Sci. 2012, 49, 1558–1566. [Google Scholar] [CrossRef]
  49. Tsikouras, B.; Pe-Piper, G.; Piper, D.J.W.; Schaffer, M. Varietal heavy mineral analysis of sediment provenance, Lower Cretaceous Scotian Basin, eastern Canada. Sedim. Geol. 2011, 237, 150–165. [Google Scholar] [CrossRef]
  50. Piper, D.J.W.; Pe-Piper, G.; Tubrett, M.; Triantafyllidis, S.; Strathdee, G. Detrital zircon geochronology and polycyclic sediment sources, Upper Jurassic-Lower Cretaceous of the Scotian Basin, southeastern Canada. Can. J. Earth Sci. 2012, 49, 1540–1557. [Google Scholar] [CrossRef]
  51. Pe-Piper, G.; Piper, D.J.W.; Triantafyllidis, S. Detrital monazite geochronology, Upper Jurassic-Lower Cretaceous of the Scotian Basin: Significance for tracking first-cycle sources. Geol. Soc. Lond. Spec. Publ. 2014, 386, 293–311. [Google Scholar] [CrossRef]
  52. Sales de Oliveira, C.E.; Pe-Piper, G.; Piper, D.J.W.; Zhang, Y.; Corney, R. Integrated methodology for determining provenance of detrital quartz using optical petrographic microscopy and cathodoluminescence (CL) properties. Mar. Petrol. Geol. 2017, 88, 41–53. [Google Scholar]
  53. Okwese, A.C.; Pe-Piper, G.; Piper, D.J.W. Controls on regional variability in marine pore-water diagenesis below the seafloor in Upper Jurassic–Lower Cretaceous prodeltaic sandstone and shales, Scotian Basin, Eastern Canada. Mar. Petrol. Geol. 2012, 29, 175–191. [Google Scholar]
  54. Karim, A.; Hanley, J.J.; Pe-Piper, G.; Piper, D.J.W. Paleohydrogeological and thermal events recorded by fluid inclusions and stable isotopes of diagenetic minerals in Lower Cretaceous sandstones, offshore Nova Scotia, Canada. AAPG Bull. 2012, 96, 1147–1169. [Google Scholar] [CrossRef]
  55. Bowman, S.J.; Pe-Piper, G.; Piper, D.J.W.; Fensome, R.A.; King, E.L. Early Cretaceous volcanism in the Scotian Basin. Can. J. Earth Sci. 2012, 49, 1523–1539. [Google Scholar] [CrossRef]
  56. Grist, A.; Reynolds, P.H.; Zentilli, M.; Beaumont, C. The Scotian Basin offshore Nova Scotia: Thermal history and provenance of sandstones from apatite fission track and 40Ar/39Ar data. Can. J. Earth Sci. 1992, 29, 909–924. [Google Scholar] [CrossRef]
  57. Pe-Piper, G.; Sangster, C.; Zhang, Y. Diagenetic F-rich ferroan calcite and zircon in the offshore Scotian Basin, eastern Canada: Significance for understanding thermal evolution of the basin. Am. Mineral. 2017, 102, 1542–1555. [Google Scholar]
  58. Grant, S.; Milton, N.; Thompson, M. Play fairway analysis and risk mapping: An example using the Middle Jurassic Brent group in the northern North Sea. Nor. Pet. Soc. Spec. Publ. 1996, 6, 167–181. [Google Scholar]
  59. Granjeon, D. Modelisation Stratigraphique Deterministe—Conception et Applications d’un Modele Diffusif 3D Multi-Lithologique. Ph.D. Thesis, Université de Rennes 1, Rennes, France, 1996. [Google Scholar]
  60. Deville, E.; Mascle, A.; Callec, Y.; Huyghe, P.; Lallemant, S.; Lerat, O.; Mathieu, X.; De Carillo, C.P.; Patriat, M.; Pichot, T. Tectonics and sedimentation interactions in the east Caribbean subduction zone: An overview from the Orinoco delta and the Barbados accretionary prism. Mar. Petrol. Geol. 2015, 64, 76–103. [Google Scholar] [CrossRef]
  61. Sangster, C. Provenance and Diagenesis of the Lower Cretaceous to Middle Jurassic Sandstones in the Slope Well Newburn H-23, Scotian Slope. B.Sc. Honours Thesis, Saint Mary’s University, Halifax, NS, Canada, 2016. Available online: https://library2.smu.ca/handle/01/26523 (accessed on 17 September 2025).
  62. Tovey, N.K.; Krinsley, D.H. Mapping of the orientation of fine-grained minerals in soils and sediments. Bull. Internat. Assoc. Engin. Geol. 1992, 46, 93–101. [Google Scholar]
  63. Corel. CorelDraw X7 and X3. 2016. Available online: https://www.coreldraw.com/en/ (accessed on 13 July 2019).
  64. PRF (Purdue Research Foundation). MultiSpec Image Data Analysis System. 2016. Available online: https://engineering.purdue.edu/~biehl/MultiSpec/ (accessed on 9 September 2025).
  65. NIH (National Institutes of Health). ImageJ Image Analysis Software. 2019. Available online: https://imagej.net/ij/disclaimer.html (accessed on 9 September 2025).
  66. Ruffell, A.H.; Batten, D.J. The Barremian-Aptian arid phase in western Europe. Palaeogeog. Palaeoclim. Palaeoecol. 1990, 80, 197–212. [Google Scholar]
  67. Ruffell, A.; Worden, R. Paleoclimate analysis using spectral gamma-ray data from the Aptian (Cretaceous) of southern England and southern France. Palaeogeog. Palaeoclim. Palaeoecol. 2000, 155, 265–283. [Google Scholar] [CrossRef]
  68. Gould, K.M.; Piper, D.J.W.; Pe-Piper, G.; MacRae, R.A. Facies, provenance and paleoclimate interpretation using spectral gamma logs: Application to the Lower Cretaceous of the Scotian Basin. Mar. Petrol. Geol. 2014, 57, 445–454. [Google Scholar] [CrossRef]
  69. Chavez, I.; Piper, D.J.W.; Pe-Piper, G.; Zhang, Y. North Atlantic climatic events recorded in Aptian Naskapi Member cores, Scotian Basin. Cret. Res. 2016, 60, 297–307. [Google Scholar] [CrossRef]
  70. Föllmi, K.B. Early Cretaceous life, climate and anoxia. Cret. Res. 2012, 35, 230–257. [Google Scholar] [CrossRef]
  71. Karim, A.; Pe-Piper, G.; Piper, D.J.W.; Hanley, J.J. Thermal and hydrocarbon-charge history and the relationship between diagenesis and reservoir connectivity: Venture field, offshore Nova Scotia, eastern Canada. Can. J. Earth Sci. 2011, 48, 1293–1306. [Google Scholar] [CrossRef]
  72. Issler, D.R. Calculation of organic maturation levels for offshore eastern Canada—Implications for general application of Lopatin’s method. Can. J. Earth Sci. 1984, 21, 477–488. [Google Scholar] [CrossRef]
  73. Bjørlykke, K.; Jahren, J. Open or closed geochemical systems during diagenesis in sedimentary basins: Constraints on mass transfer during diagenesis and the prediction of porosity in sandstone and carbonate reservoirs. AAPG Bull. 2012, 96, 2193–2214. [Google Scholar] [CrossRef]
  74. Bjørlykke, K. Clay mineral diagenesis in sedimentary basins—A key to the prediction of rock properties, Examples from the North Sea Basin. Clay Miner. 1998, 33, 15–34. [Google Scholar] [CrossRef]
  75. Lanson, B.; Beaufort, D.; Berger, G.; Bauer, A.; Cassagnabère, A.; Meunier, A. Authigenic kaolin and illitic minerals during burial diagenesis of sandstones: A review. Clay Miner. 2002, 37, 1–22. [Google Scholar] [CrossRef]
  76. Franks, S.G.; Zwingmann, H. Origin and timing of late diagenetic illite in the Permian–Carboniferous Unayzah sandstone reservoirs of Saudi Arabia. AAPG Bull. 2010, 94, 1133–1159. [Google Scholar] [CrossRef]
  77. Aagaard, P.; Egeberg, P.K.; Saigal, G.C.; Morad, S.; Bjorlykke, K. Diagenetic albitization of detrital K-feldspars in Jurassic, Lower Cretaceous and Tertiary clastic reservoir rocks from offshore Norway; II, Formation water chemistry and kinetic considerations. J. Sedim. Res. 1990, 60, 575–581. [Google Scholar] [CrossRef]
  78. Saigal, G.C.; Morad, S.; Bjorlykke, K.; Egeberg, P.K.; Aagaard, P. Diagenetic albitization of detrital K-feldspar in Jurassic, Lower Cretaceous, and Tertiary clastic reservoir rocks from offshore Norway; I, Textures and origin. J. Sedim. Res. 1988, 58, 1003–1013. [Google Scholar]
  79. Odom, I.E.; Doe, T.W.; Dott, R.H. Nature of feldspar-grain size relations in some quartz-rich sandstones. J. Sedim. Res. 1976, 46, 862–870. [Google Scholar]
  80. Blatt, H.; Middleton, G.; Murray, R. Origin of Sedimentary Rocks; Prentice-Hall: Englewood Cliffs, NJ, USA, 1972; 576p. [Google Scholar]
  81. Nesbitt, H.W.; Young, G.M. Petrogenesis of sediments in the absence of chemical weathering: Effects of abrasion and sorting on bulk composition and mineralogy. Sedimentology 1996, 43, 341–358. [Google Scholar] [CrossRef]
  82. Garzanti, E.; Andò, S.; Vezzoli, G. Settling equivalence of detrital minerals and grain-size dependence of sediment composition. Earth Planet. Sci. Lett. 2008, 273, 138–151. [Google Scholar] [CrossRef]
  83. OERA (Offshore Energy Research Association). Central Scotian Slope Atlas. 2016. Available online: https://oera.ca/research/central-scotian-slope-atlas-2016 (accessed on 9 September 2025).
  84. Deptuck, M.E.; Kendell, K.; Smith, B. Complex deepwater fold belts in the SW Sable Subbasin, offshore Nova Scotia (abs.). In Proceedings of the Canadian Society of Petroleum Geologists/Canadian Society of Exploration Geophysicists/Canadian Well Logging Society Convention, Calgary, AB, Canada, 4–8 May 2009. [Google Scholar]
  85. Gould, K.M.; Karim, A.; Piper, D.J.W.; Pe-Piper, G. Lithofacies and Diagenesis of Selected Conventional Core from Jurassic and Early Cretaceous Terrigenous Clastic Rocks, Scotian Basin; Geological Survey of Canada Open File 6945; Natural Resources Canada: Ottawa, ON, Canada, 2011; 272p. [Google Scholar] [CrossRef]
  86. Tobin, R.C.; Schwarzer, D. Effects of sandstone provenance on reservoir quality preservation in the deep subsurface: Experimental modelling of deep-water sand in the Gulf of Mexico. Geol. Soc. Lond. Spec. Publ. 2014, 386, 27–47. [Google Scholar] [CrossRef]
  87. Ajdukiewicz, J.M.; Nicholson, P.H.; Esch, W.L. Prediction of deep reservoir quality using early diagenetic process models in the Jurassic Norphlet Formation, Gulf of Mexico. AAPG Bull. 2010, 94, 1189–1227. [Google Scholar] [CrossRef]
  88. Sangster, C. Application of Predictive Modeling to the Lower Cretaceous Sedimentary Sequences of the Central Scotian Basin. Master’s Thesis, Saint Mary’s University, Halifax, NS, Canada, 2019. Available online: https://library2.smu.ca/handle/01/29128 (accessed on 17 September 2025).
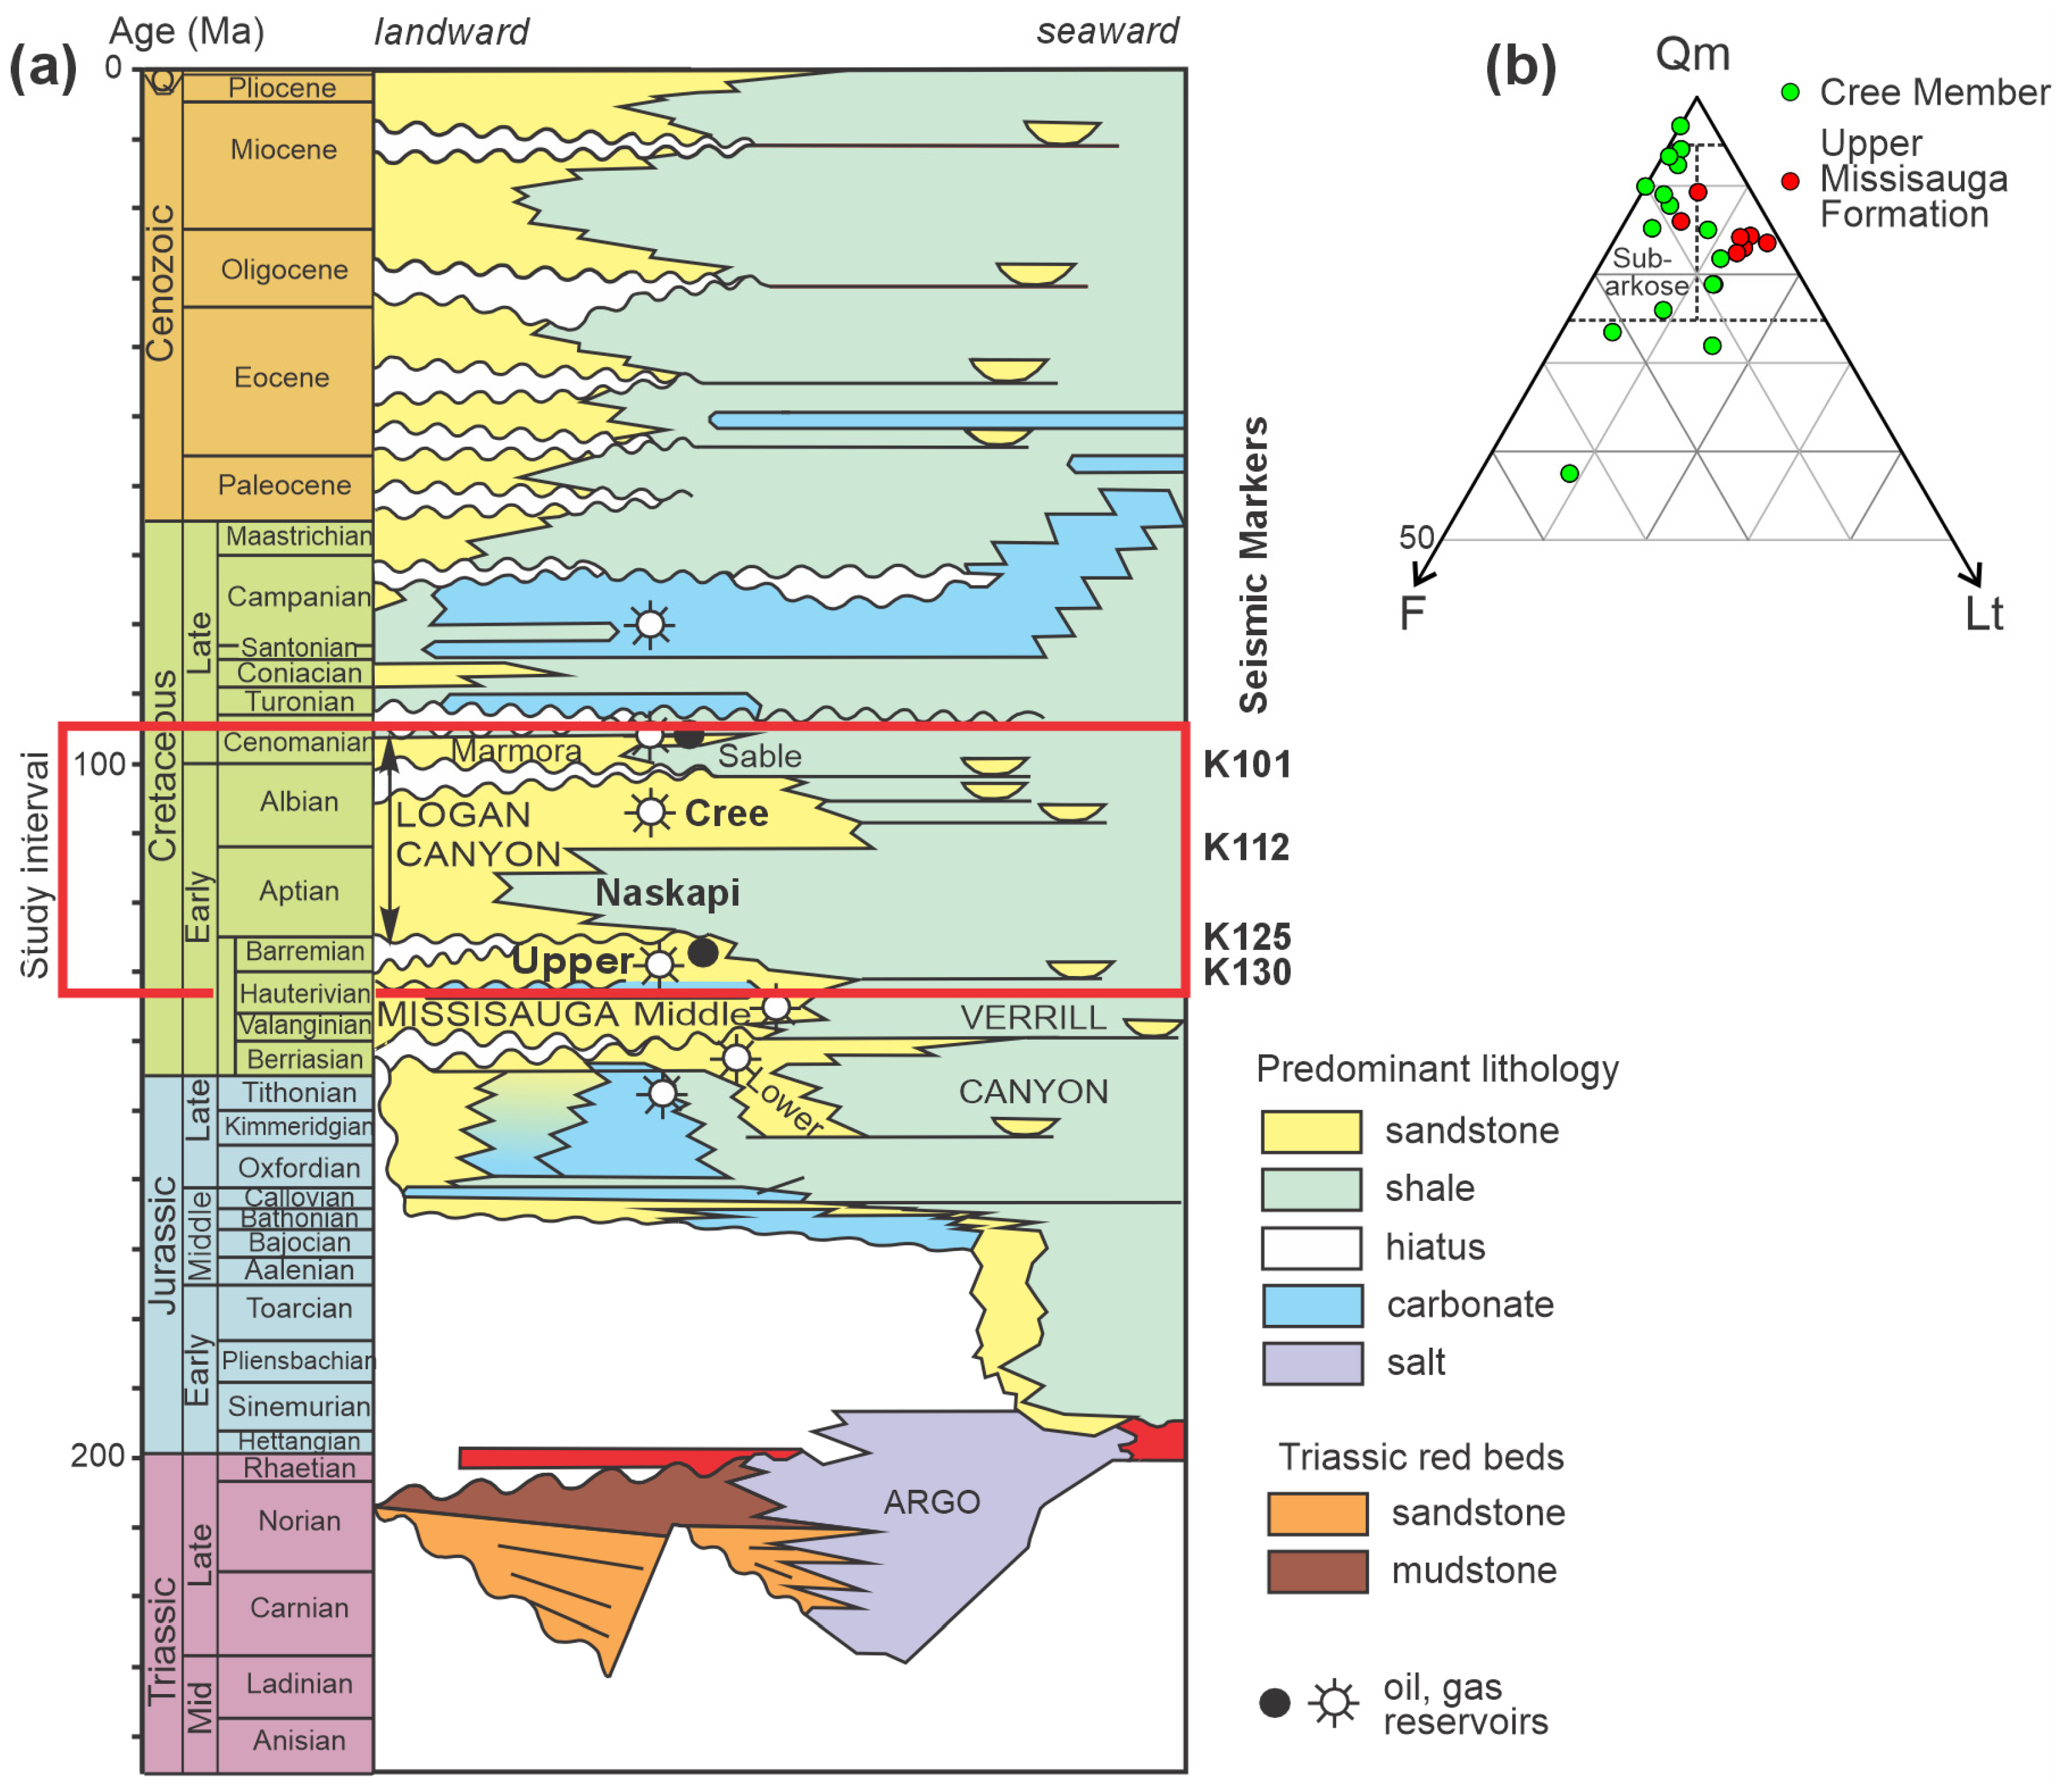
Figure 1. (a) Stratigraphic column for the central Scotian Basin (modified from [34]), showing the study interval (red box). Seismic markers after [25]. (b) Qm-F-Lt plot for sandstones from the Cree Member and Upper Missisauga Formation (raw data from [35]).
Minerals 15 01008 g001
Figure 2. Map showing the location of the study area in the Scotian Basin (red box). Gray tones show basin isopachs (in km from [36]). Present 500 m and 3000 m isobaths are shown. Salt bodies are after [27]. Rivers from [29].
Minerals 15 01008 g002
Figure 3. Division of the study area into east, central, and west regions; location of wells with analyzed samples (red); location of deepwater wells mentioned in the text (yellow). Location of this figure shown as a red box on Figure 2.
Minerals 15 01008 g003
Figure 4. Summary of the stratigraphy of the wells and sample depths for the analyzed samples. Datum = top of Cree Member. Data for Newburn H-23 from [61].
Minerals 15 01008 g004
Figure 5. Plot of modal K-feldspar composition vs. depth. Fields outline the stratigraphic units.
Minerals 15 01008 g005
Figure 6. Plot of mean grain size of quartz vs. modal percentage of K-feldspar.
Minerals 15 01008 g006
Figure 7. Plot of the mean grain size of the quartz vs. the mean grain size of the K-feldspar. The dashed black trendline represents a 1:1 ratio of the quartz and K-feldspar grain sizes, while the blue trendline represents the linear regression correlation of the quartz and K-feldspar grain sizes.
Minerals 15 01008 g007
Figure 8. Plots of the difference between the quartz and K-feldspar grain sizes vs. (a) the modal percentage of K-feldspar, (b) sample depth (km), and (c) mean grain size.
Minerals 15 01008 g008
Figure 9. Plots of K-feldspar modal percentages (%) and sample depth (km). Samples are subdivided according to their location in the basin: (a) western Scotian Basin, (b) central Scotian Basin, (c) eastern Scotian Basin, and (d) all the samples. Samples from depths of less than 1.9 km have been translated to a depth of 1.9 km. The dashed lines represent trendlines forced through 0% at 3.8 km and have been generated and extended to a 1.9 km depth to recreate the initial K-feldspar content of each part of the basin.
Minerals 15 01008 g009
Figure 10. Maps of weighted-average simulated K-feldspar proportions for the (a) Upper Missisauga Formation, (b) Naskapi Member, and (c) Cree Member. Blue shows the outline of the main salt canopies (defined as areas with a less than 200 m sediment thickness) and other structures in the distal areas; blue arrows with percentages (%) refer to input proportions of feldspar, and red dashed lines indicate the boundaries of the slope.
Minerals 15 01008 g010
Figure 11. Maps of distribution of the zones I and II of intense faulting (brown fields) [25] superimposed on maps of simulated K-feldspar proportions normalized to the total sand proportions. (a) Key figure showing location of wells and distribution of faults cutting the Upper Missisauga Formation; (b) Upper Missisauga Formation; (c) Naskapi Member; and (d) Cree Member. Faults cutting the particular stratigraphic unit are shown as black lines and areas of abundant faults are highlighted in brown. Blue shows the main salt canopies (defined as areas with a less than 200 m sediment thickness) and other salt structures in the distal areas. Blue arrows with percentages (%) refer to input proportions of K-feldspar, and red dashed lines indicate the boundaries of the slope.
Minerals 15 01008 g011
Figure 12. Plot of the K-feldspar proportion (%) and sample depth (km). Samples are subdivided by unit into the (a) Cree Member, (b) Naskapi Member, and (c) Upper Missisauga Formation. Samples have been further subdivided by position within each unit, such that samples from the upper half of each unit are represented by a filled symbol. Timescale shows paleoclimatic estimates of aridity from Föllmi (2012) [70] for the southern European Tethys and Gould et al. (2014) [68] for the Scotian Basin hinterland.
Minerals 15 01008 g012
Figure 13. Predictive maps of the component of secondary porosity derived from the temperature-dependent dissolution of K-feldspar, based on a comparison of feldspar distributions (Figure 11) and thermal modeling [83] for the (a) Upper Missisauga Formation, (b) Naskapi Member, and (c) Cree Member. Dashed black lines indicate sand-rich bodies predicted in [28]; blue arrows with percentages (%) refer to input proportions of feldspar, and red dashed lines indicate the boundaries of the slope. No thermal modeling data are available for the outboard area of the Cree Member.
Minerals 15 01008 g013
Figure 14. Plots of measured porosity vs. (a) diagenetic cements, (b) percentage of K-feldspar, and (c) depth, from modal analyses of 35 Scotian Basin sandstones in [33]. Colors of the data points show estimated proportions of the primary and secondary porosities. The identification of a “closed system” is based on the abundance of late-diagenetic products and a relatively low porosity.
Minerals 15 01008 g014
Figure 15. Risk maps for the Cree Member, showing component maps for the (a) sand distribution [28], (b) secondary porosity, and (c) preservation of secondary porosity. Red dashed lines indicate slope boundaries.
Minerals 15 01008 g015
Figure 16. Risk maps for the Upper Missisauga Formation, showing component maps for the (a) sand distribution [28], (b) secondary porosity, and (c) preservation of secondary porosity. Red dashed lines indicate slope boundaries.
Minerals 15 01008 g016
Figure 17. Common-risk-segment (CRS) maps of the (a) Cree Member, (b) Upper Missisauga Formation, (c) Albian sand play (based on an Upper Jurassic–Early Cretaceous source-rock petroleum system in [25]), and (d) Barremian sand play (based on an Upper Jurassic–Early Cretaceous source-rock petroleum system in [25]). Red dashed lines indicate slope boundaries, and white dashed lines indicate shelf breaks [25].
Minerals 15 01008 g017
Table 1. Locations, grain sizes, and feldspar compositions of investigated samples.
SampleGrain sizeComposition (Vol%)
WellWell No.Type 1Depth (m)2Strati-Graphic UnitReg-ionMean Grain Size (µm)Cut-off 3Difference (Qz–Kfs)Number of Grains CountedQzKfsPlagTotal Feld-Spar
QzKfsµm%QzKfsTotal
AlmaK-85S1928CreeWest736730684347450888.49.12.611.6
AlmaK-85S1971.9CreeWest75653010142526231480.715.14.219.3
AlmaK-85S2633NaskapiWest696630343666543184.89.16.215.2
ChippewaG-67S1718.8CreeEast1211086313102457231781.217.21.618.8
ChippewaG-67S2283.6CreeEast12712263544002542594. 94.60.55.1
CohassetD-42S1684.02CreeWest737230222734932286.511.32.213.5
CohassetD-42S1813.26CreeWest8576309112506031082. 513.93.717.6
CohassetL-97S2150.1NaskapiWest6051309152822730991.66.91.58.5
CohassetL-97S2228.7U. MissWest117925025212802130189.37.13.510.7
CohassetL-97S2386.9U. MissWest106935013122814532690.68.70.79. 5
GlenelgE-58P3443.86U. MissCentral767130572665031690.53.26.39.5
GlenelgE-58P3532.08U. MissCentral1681333036212724631892. 93.73.47.1
GlenelgE-58AP3737.9U. MissCentral706830222913933089.65.35.110.4
GlenelgJ-48S2365CreeCentral78683010122654130682.49.97.717.6
GlenelgJ-48S2507CreeCentral12211350972744531987.49.33.412.6
GlenelgJ-48S2758CreeCentral72604012162565731385.311.92. 814.7
GlenelgJ-48S2890CreeCentral89763013142625832087.46.56.112.6
GlenelgJ-48S3970U. MissCentral130-30--306030697.30.02. 72. 7
KegeshookG-67P1902.3CreeWest2582183040162748736188.211.83.615.4
KegeshookG-67P1906.36CreeWest3252803045142448532990.27.62.29.8
MissisaugaH-54S1864.46CreeCentral1069730992209031074. 722.43.025.3
MissisaugaH-54S2182.34CreeCentral1541185036232566432090.28.61.39.8
MissisaugaH-54S2310.07NaskapiCentral88683020232725232489.69.11.410.4
MissisaugaH-54S2557.27U. MissCentral134-30--304030499.90.00.10.1
MissisaugaH-54S2603.29U. MissCentral87743012142816034190.68.31.29.4
MissisaugaH-54S2689.25U. MissCentral110923019172495430389.68.91.510.4
N. BanquereauI-93P3469.27U. MissEast4133801003482972832596.62.01.43.4
N. TriumphG-43P3811.53NaskapiCentral76643013163401235296.30.92.83.7
OnondagaB-96S2700.53U. MissCentral605930232804232289.28.42.510.8
PeskoweskA-99S2395NaskapiEast474420362683930790.77.71.69.3
Sable Island2H-58P1600.27MarmoraCentral15515230322517032184.814.90.315.2
Sable Island5H-58P1903.66CreeCentral14914430542665732387.012.01.113.0
SaukA-52S2118.97CreeEast13713150642657133691.07.11.99.0
SaukA-52S2189.99CreeEast9510330™8™92297830785.69.84.614.4
SaukA-52S2350.01CreeEast1049030141420110630779.916.53.620.1
SaukA-52S2498.14CreeEast6759308122497432389.95.74.310.1
SaukA-52S2656.94CreeEast9788309102488833686.412.80.913.7
SaukA-52S2776.73CreeEast200187301362637834186.412. 80.913.7
SaukA-52S2871.52CreeEast676130692693530493.54.71.86.5
SaukA-52S3107.13U. MissEast111833028252904233295.12.91.94.9
SaukA-52S3199.79U. MissEast1961585038192733230596.03.20.74.0
SaukA-52S3233.01U. MissEast1601385023142763130791.17.90.98.9
VentureD-23S2026CreeCentral97853012122455730292.36.71.17.7
VentureD-23S2254CreeCentral6658308112554830392.04.43.68.0
VentureD-23S2357CreeCentral158146501282853031586. 910.22. 913.1
VentureD-23S2606CreeCentral116933023192734832194.73. 51.85.3
VentureD-23S2690CreeCentral1049950542487131986. 910.22. 913.1
VentureD-23S3055U. MissCentral83703013162684631488.77.83.411.3
1 S = sidewall core rubble; P = conventional core. 2 Depth below the rotary table (RT); the depth of the seafloor for all the wells is <100 m below RT. 3 Lower size threshold (µm).
Table 2. Summary of simulated sediment classes used in modeling and corresponding K-feldspar grain size values based on grain size analysis.
Grain Size FractionMean Grain Size
Difference (%)
Mean Grain Size (μm)
QzKfs
Clay-40-
Silt-60-
Very fine sand97568
Fine sand3200195
Medium sand15400341
Coarse sand-650576
Table 3. Criteria for risk levels of component maps.
Risk TypeRisk Level
HighModerateLow
* Sand distribution (Cree Member)<10%10–16%>16%
Sand distribution (Upper Missisauga Formation)<9%9–18%>18%
Secondary porosity<5%5–10%>10%
Preservation of secondary porosityotherIII
Total risk3–6 points6–8 points8 or 9 points
* Sand distribution from [28]; secondary porosity values from Figure 13; preservation of secondary porosities from Figure 12. Results are shown in Figure 15 and Figure 16.
Disclaimer/Publisher’s Note: The statements, opinions and data contained in all publications are solely those of the individual author(s) and contributor(s) and not of MDPI and/or the editor(s). MDPI and/or the editor(s) disclaim responsibility for any injury to people or property resulting from any ideas, methods, instructions or products referred to in the content.