

Application of Machine Learning to Characterize Metallogenic Potential Based on Trace Elements of Zircon: A Case Study of the Tethyan Domain


Abstract
1. Introduction
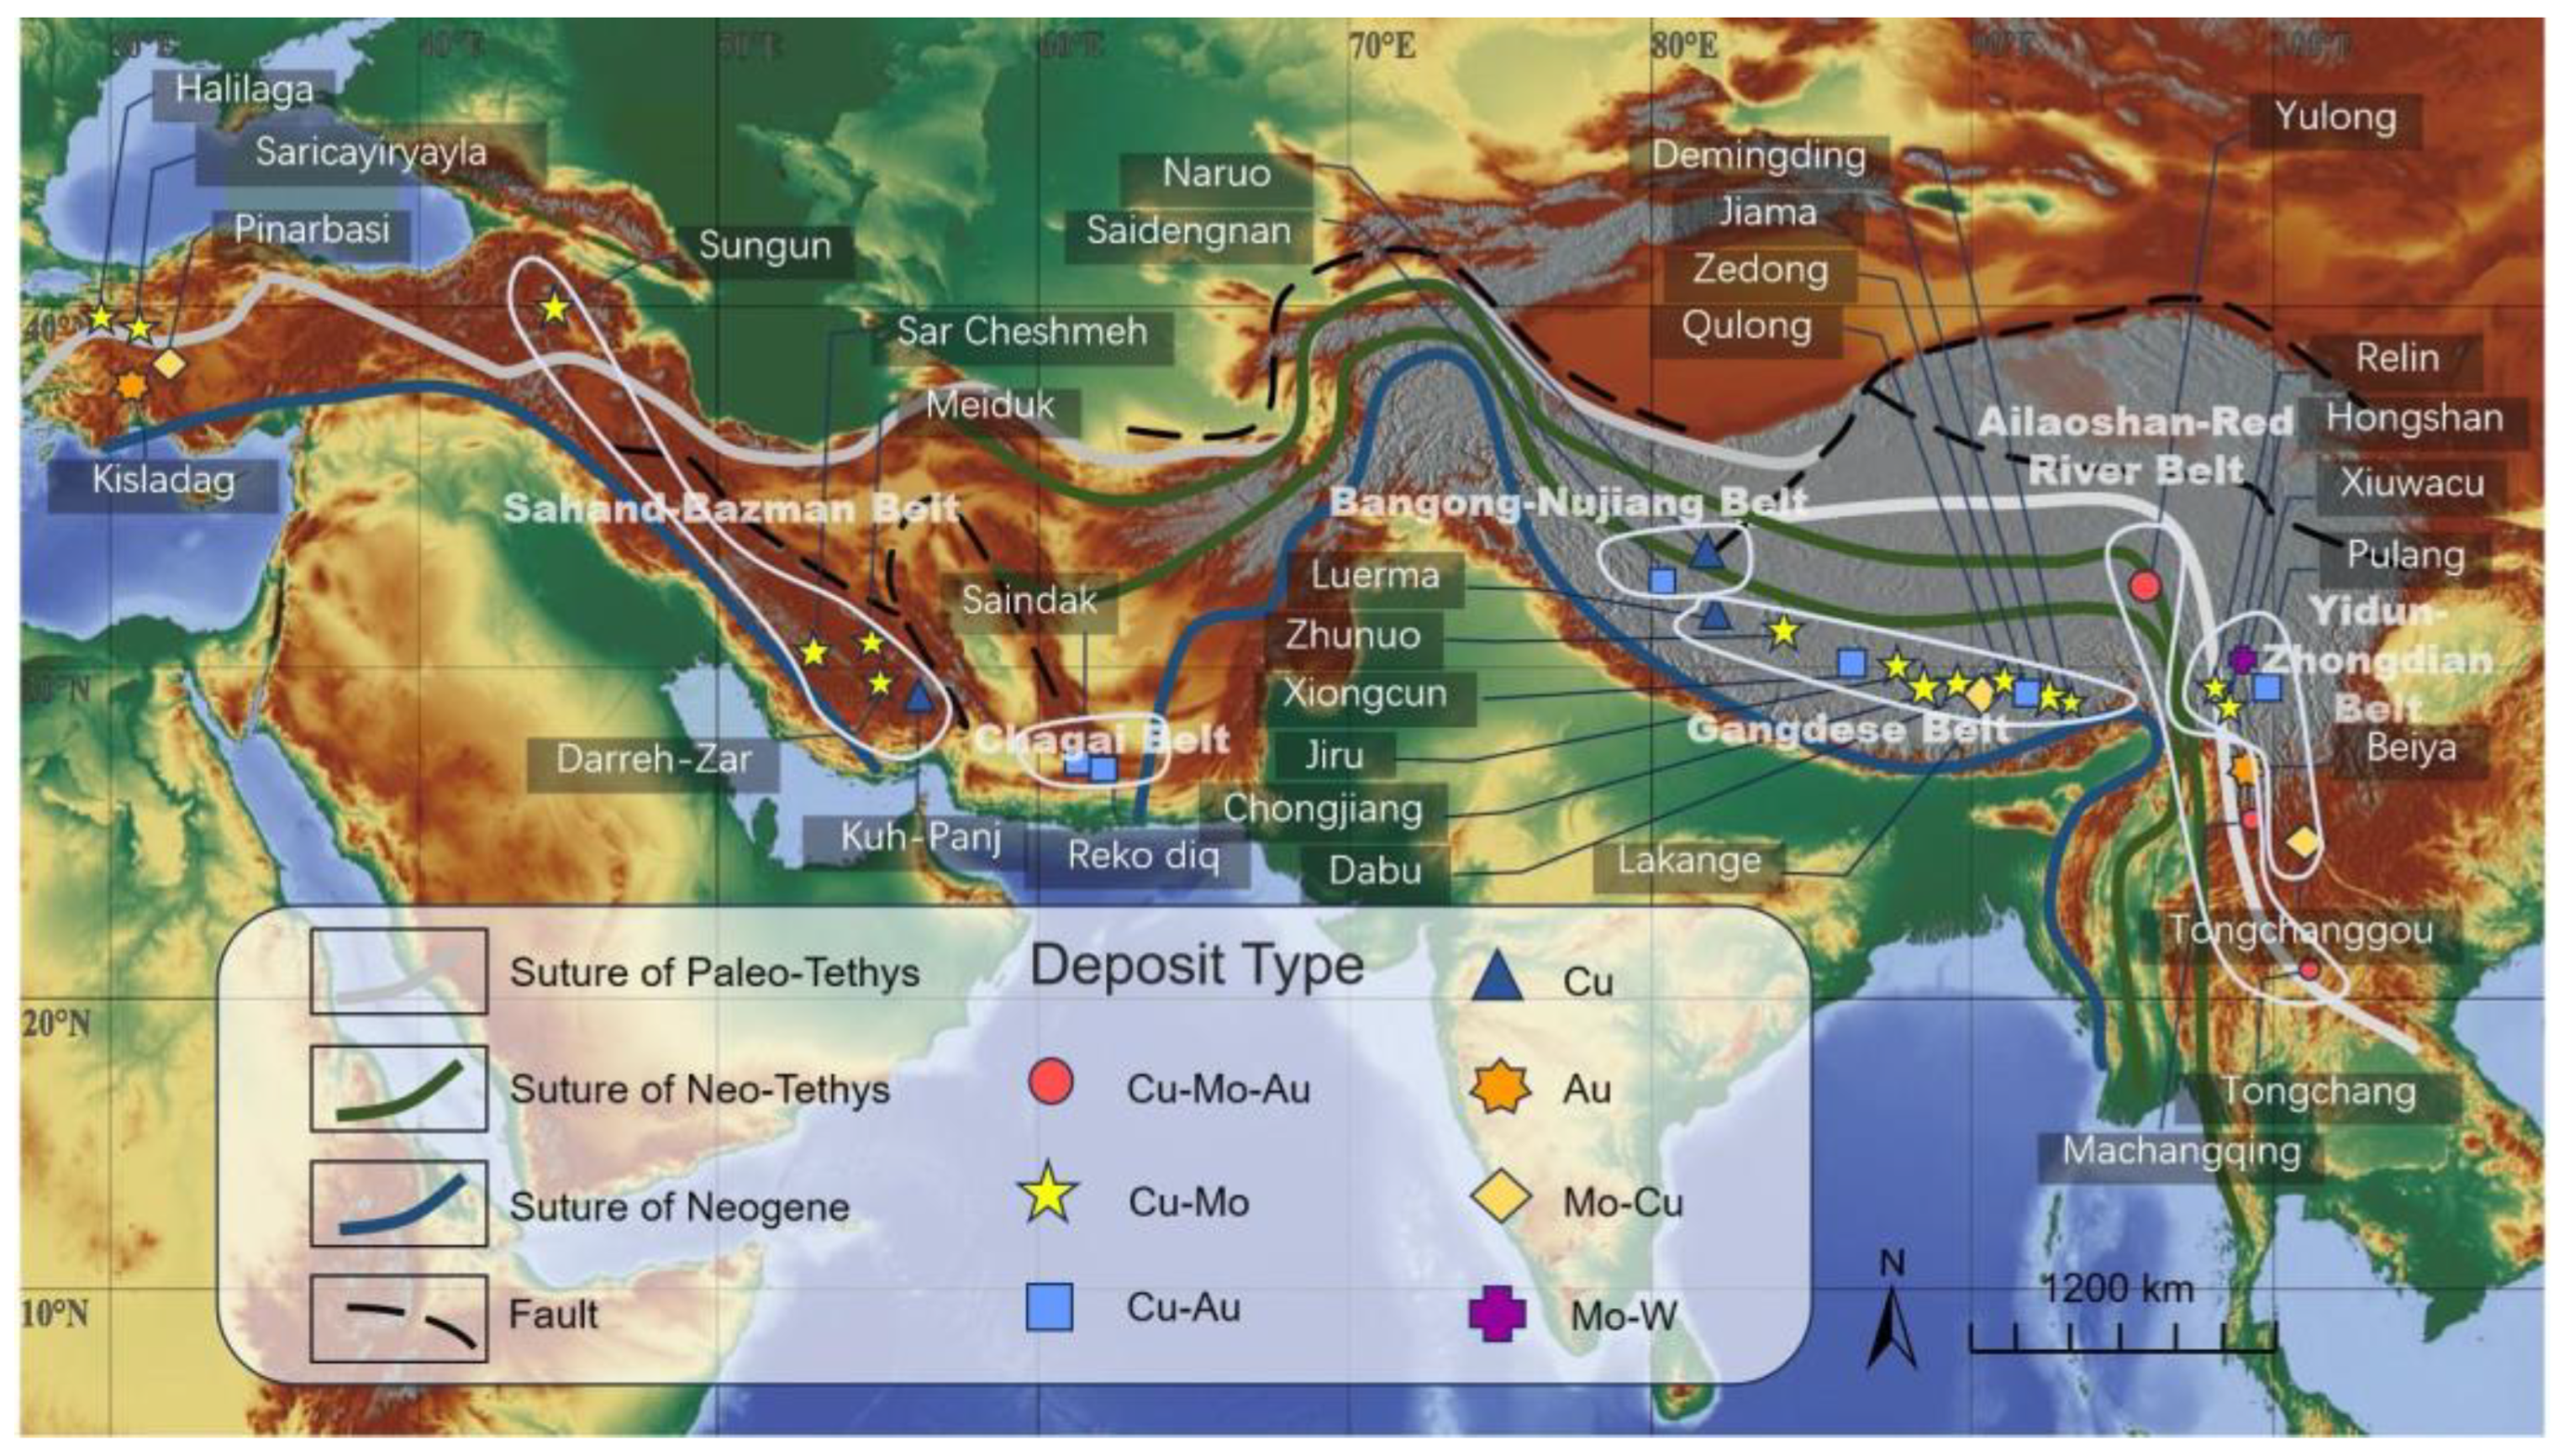
2. Geological Setting
3. Methods
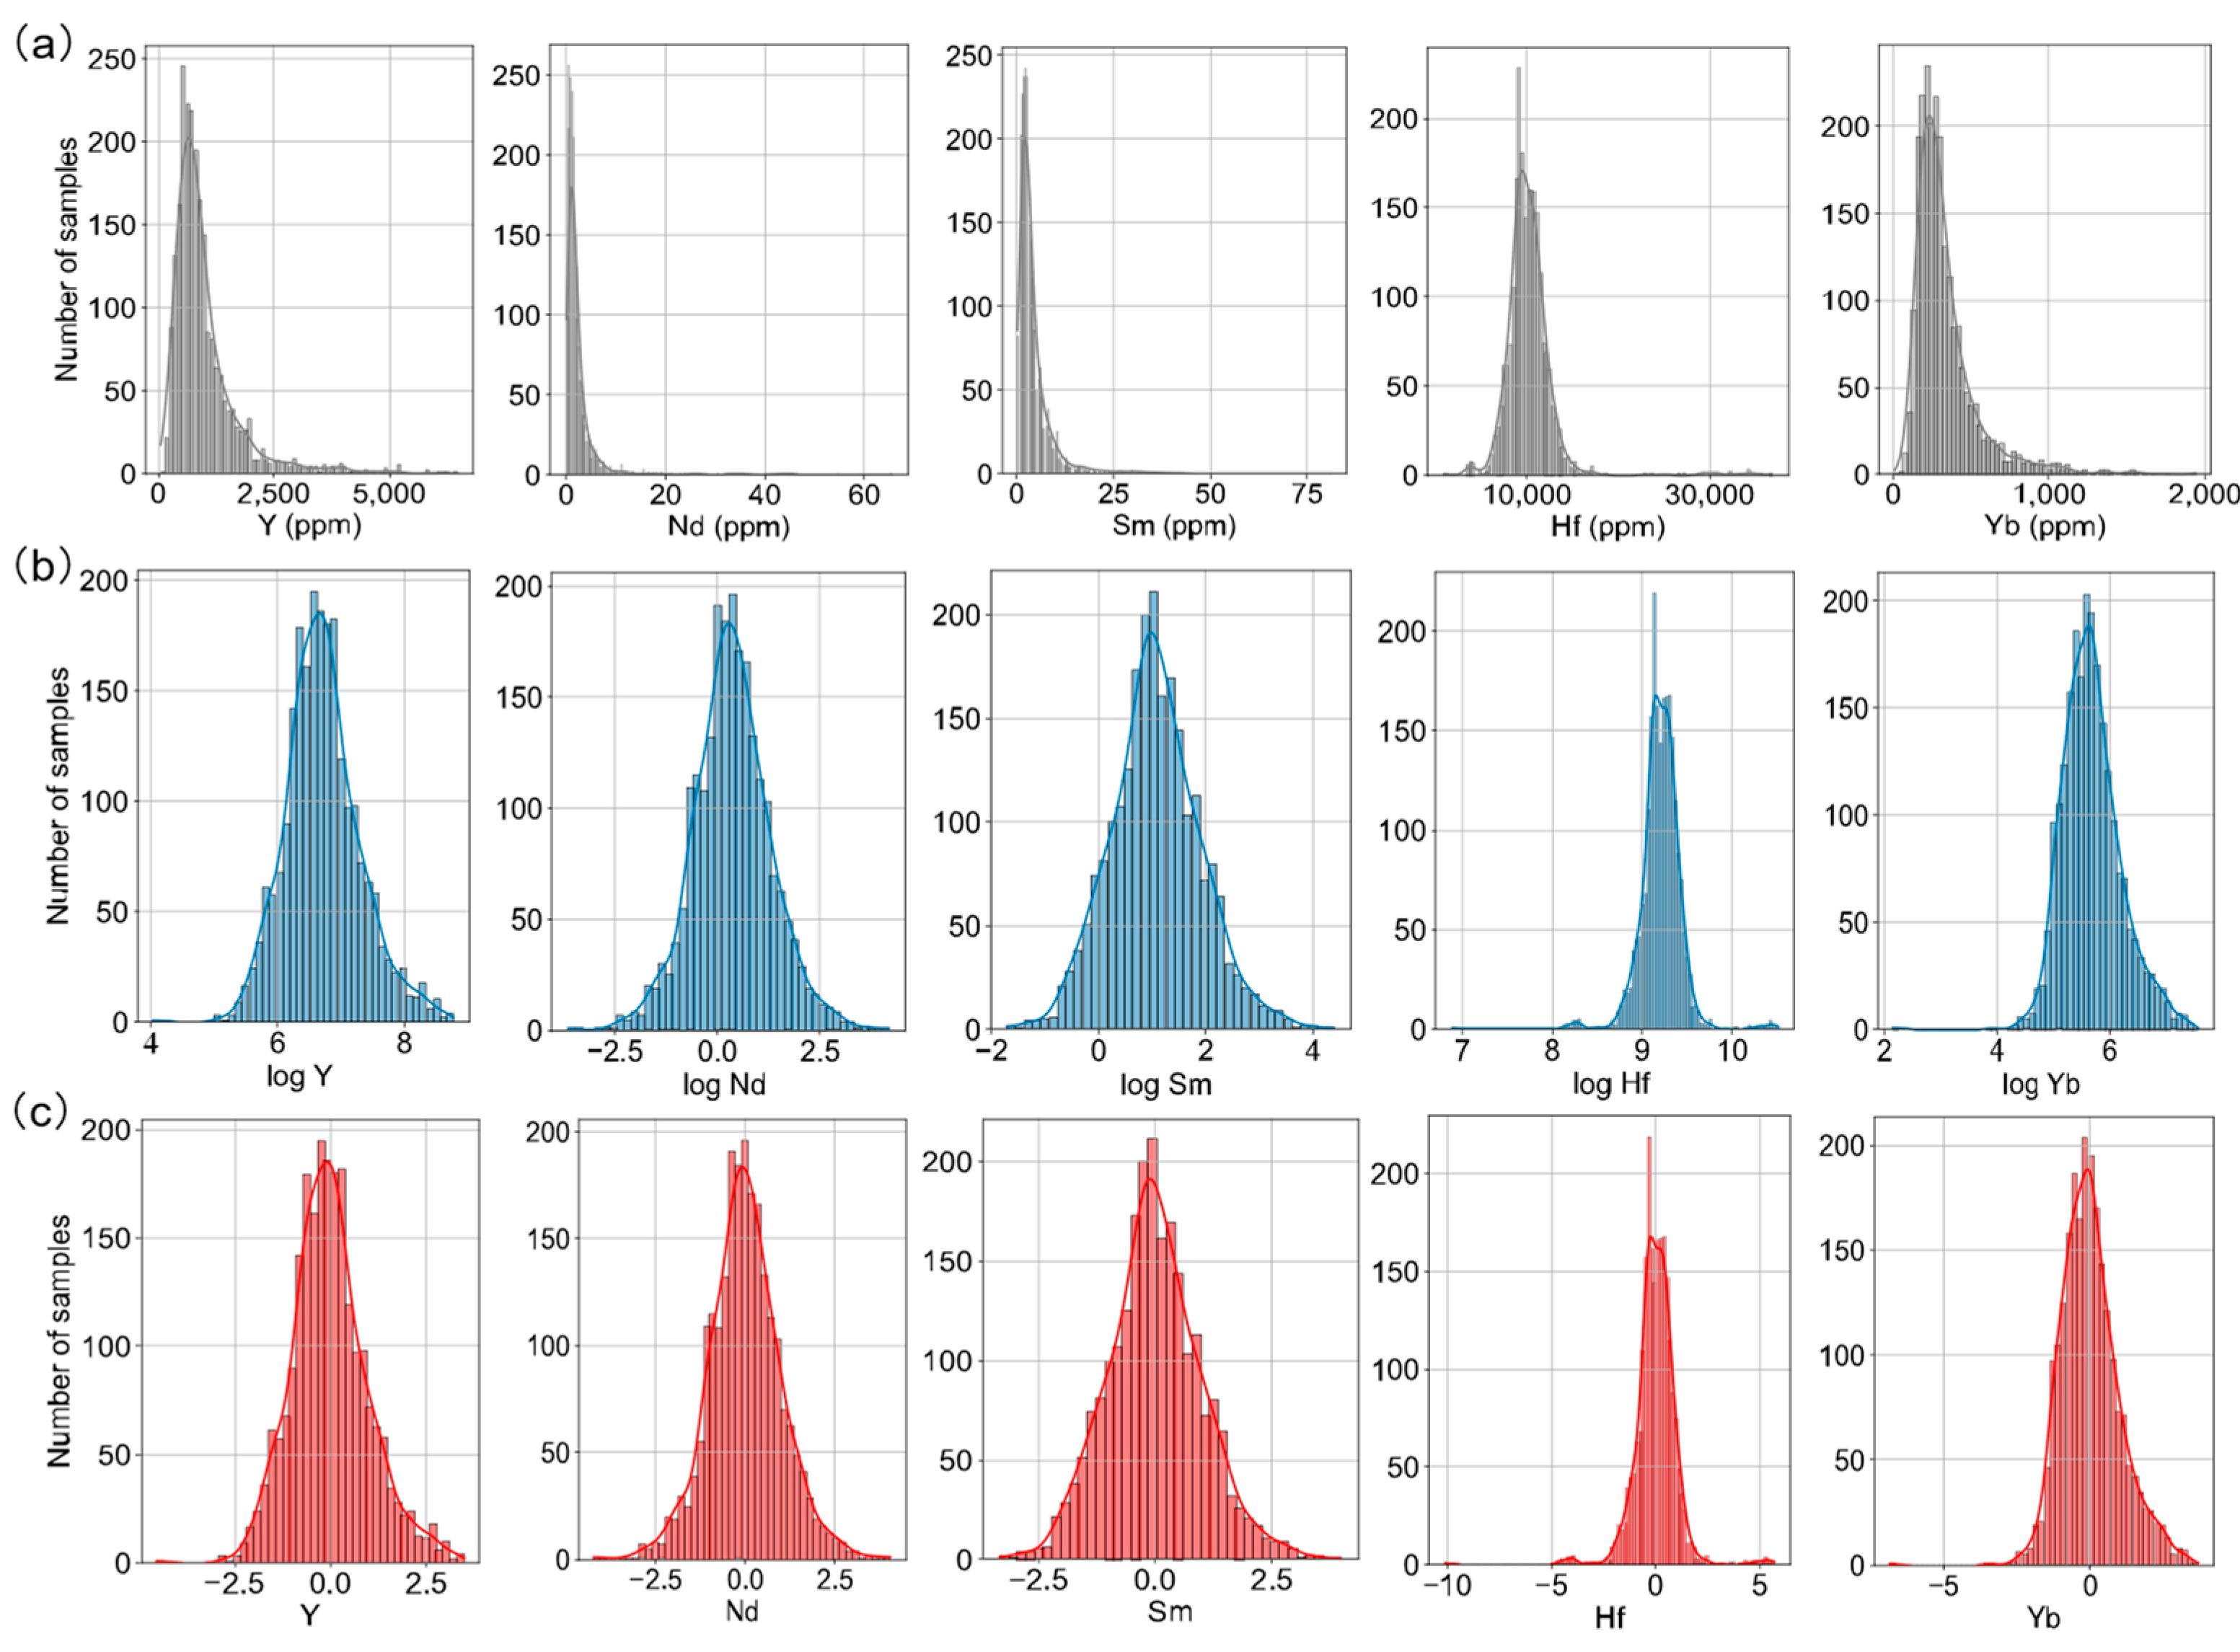
3.1. Data Resources and Preprocessing
3.2. Machine Learning Algorithm
3.3. Model Performance Evaluation
3.4. t-SNE Visualization
4. Results and Discussion
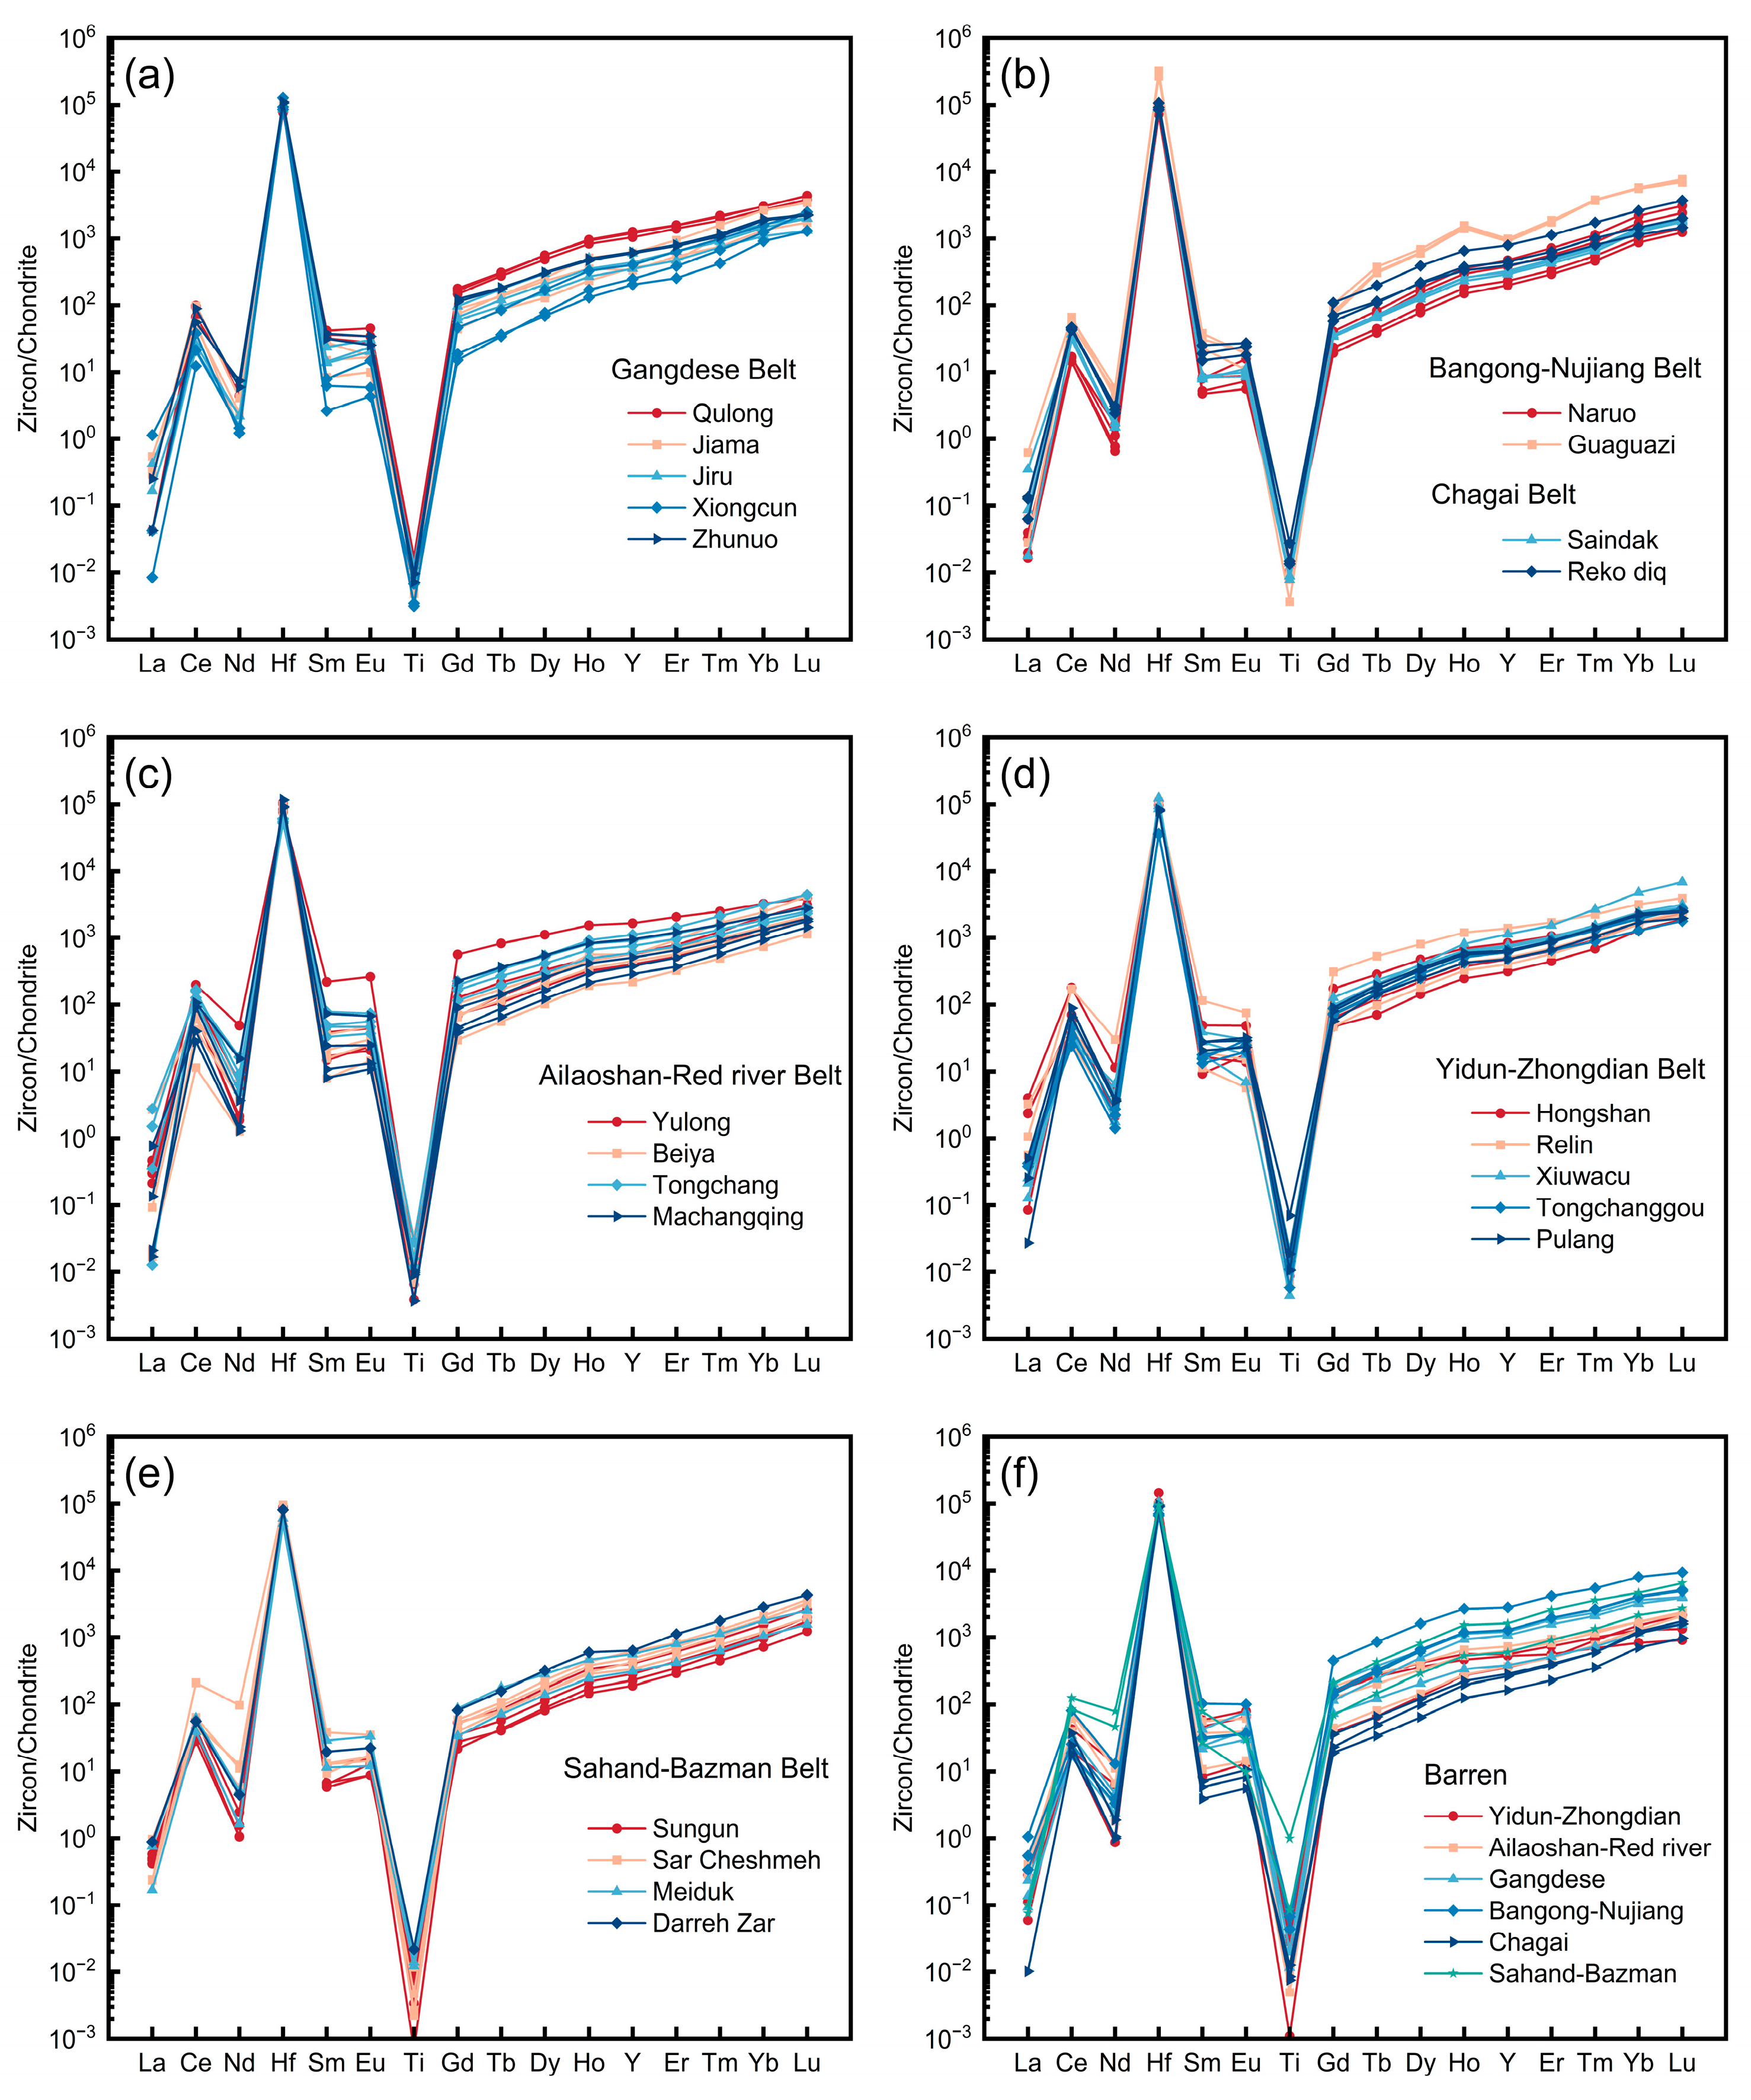
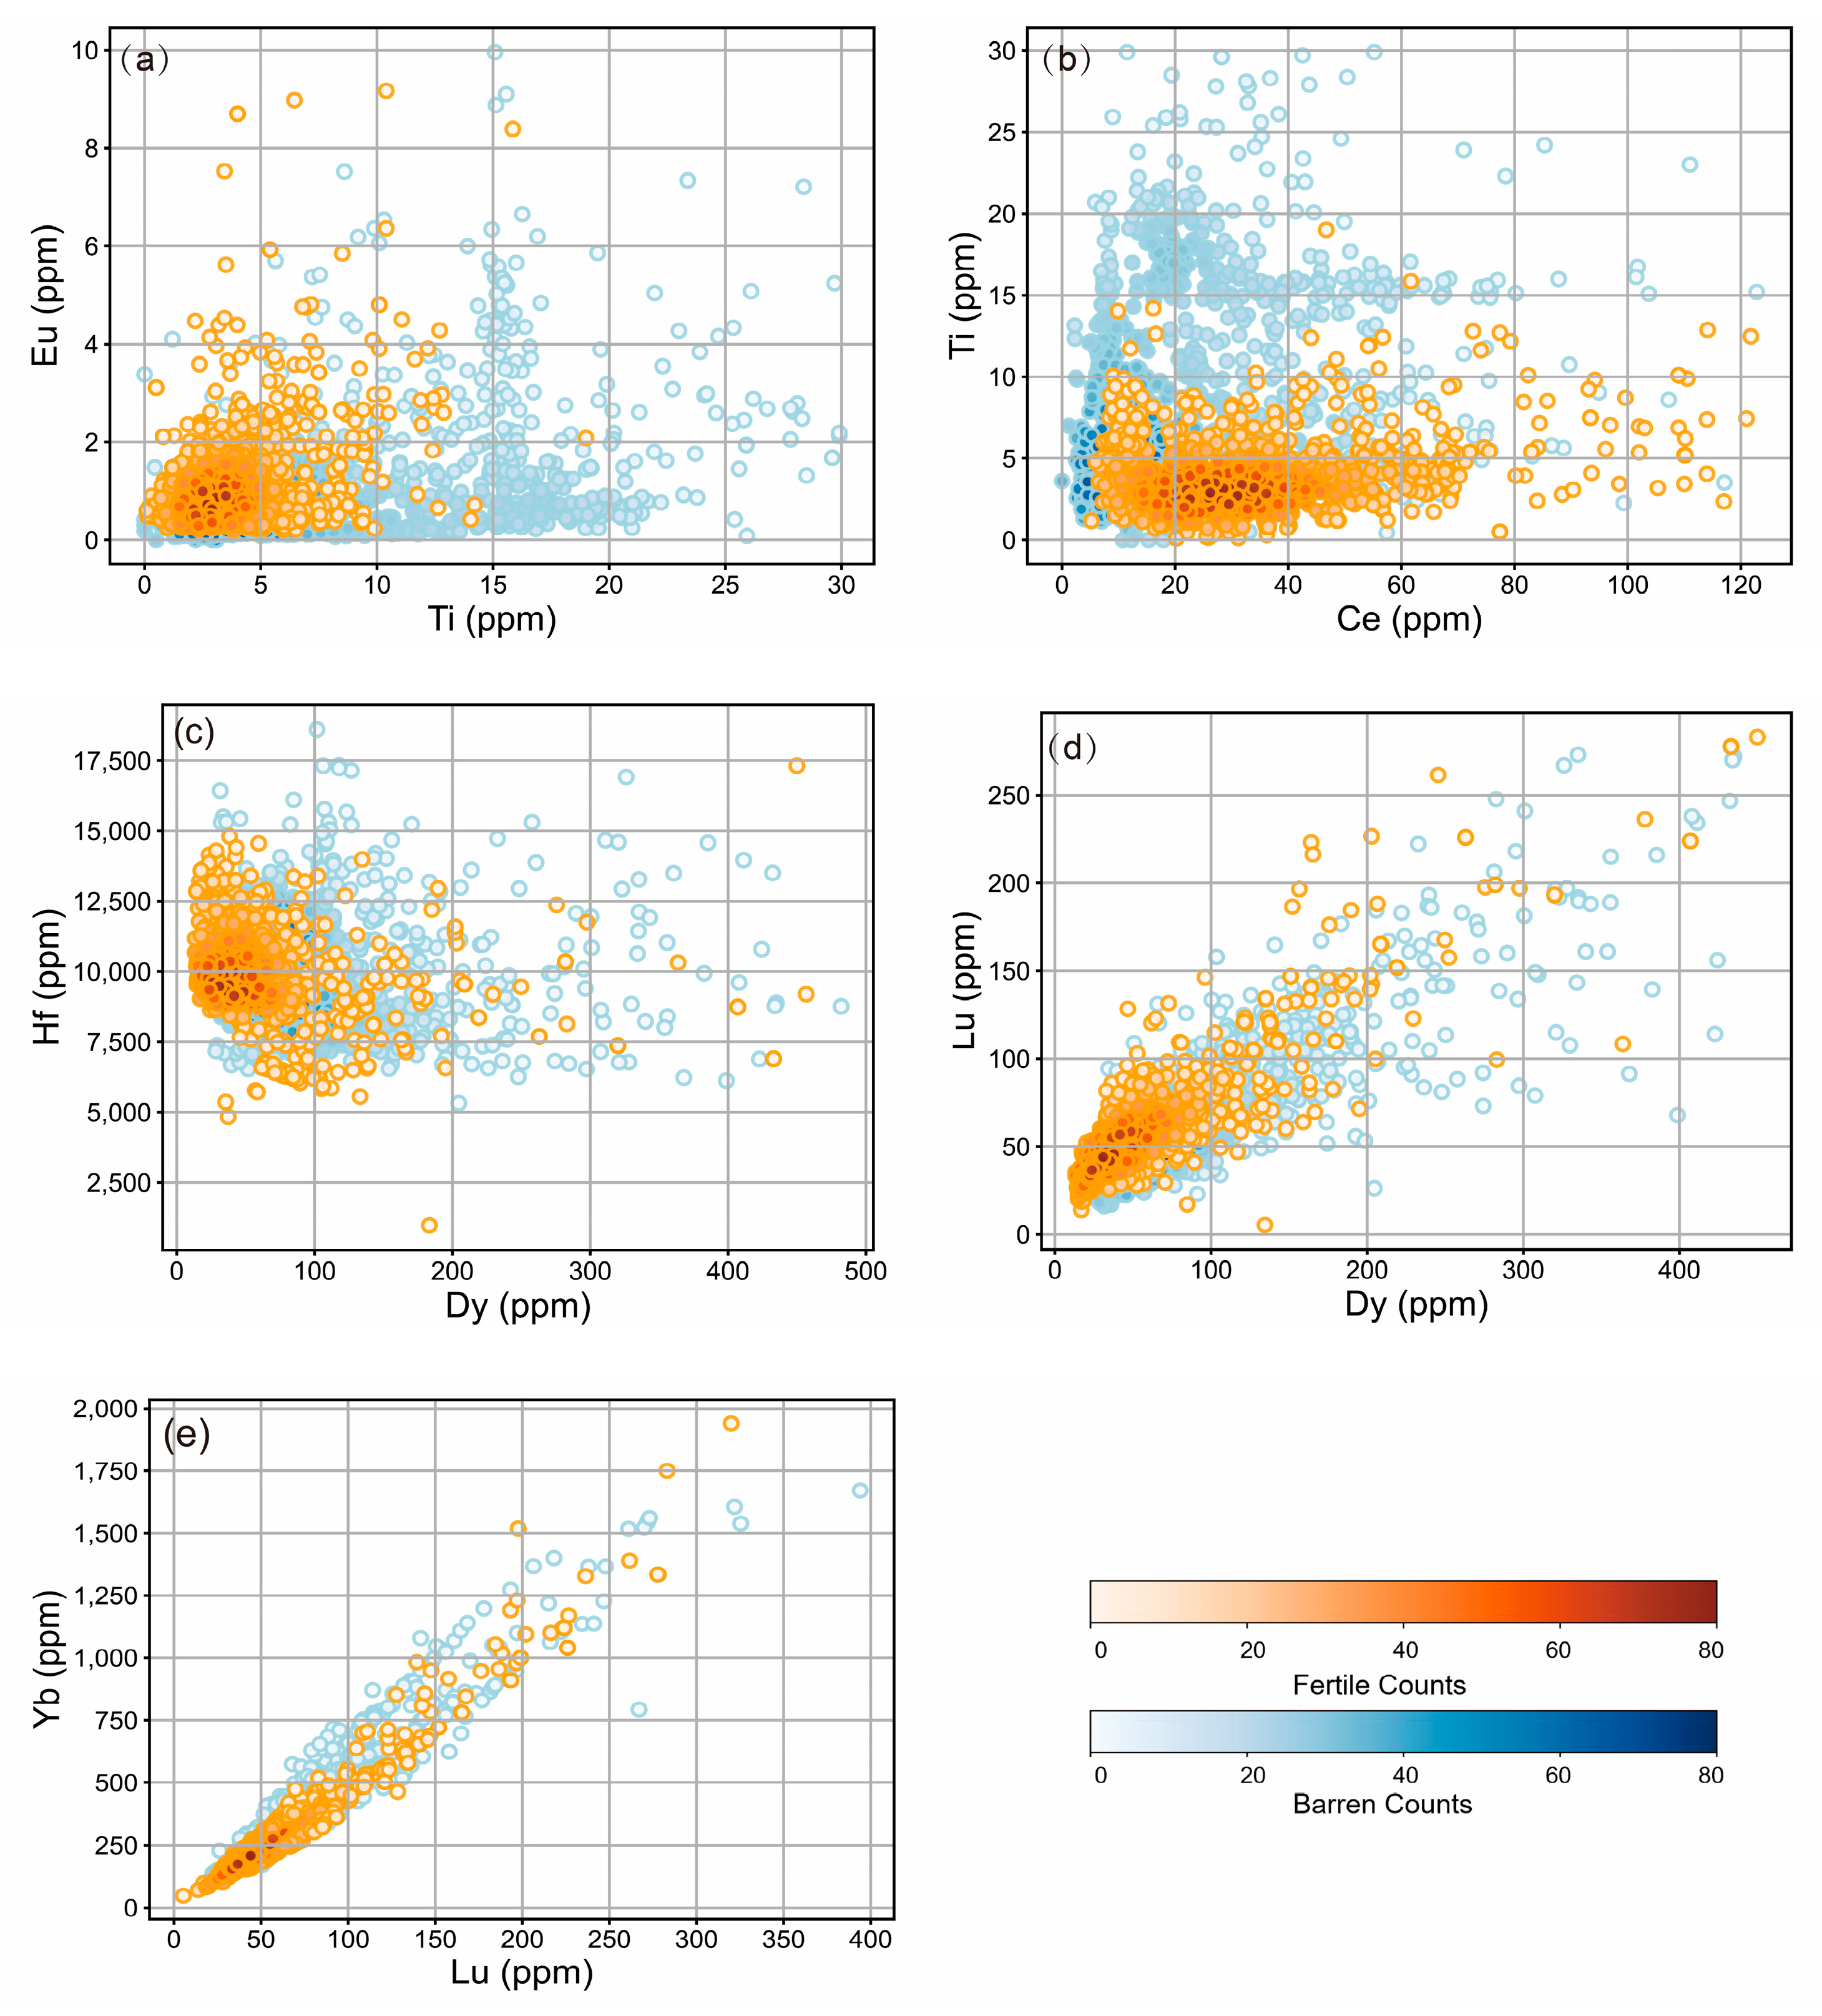
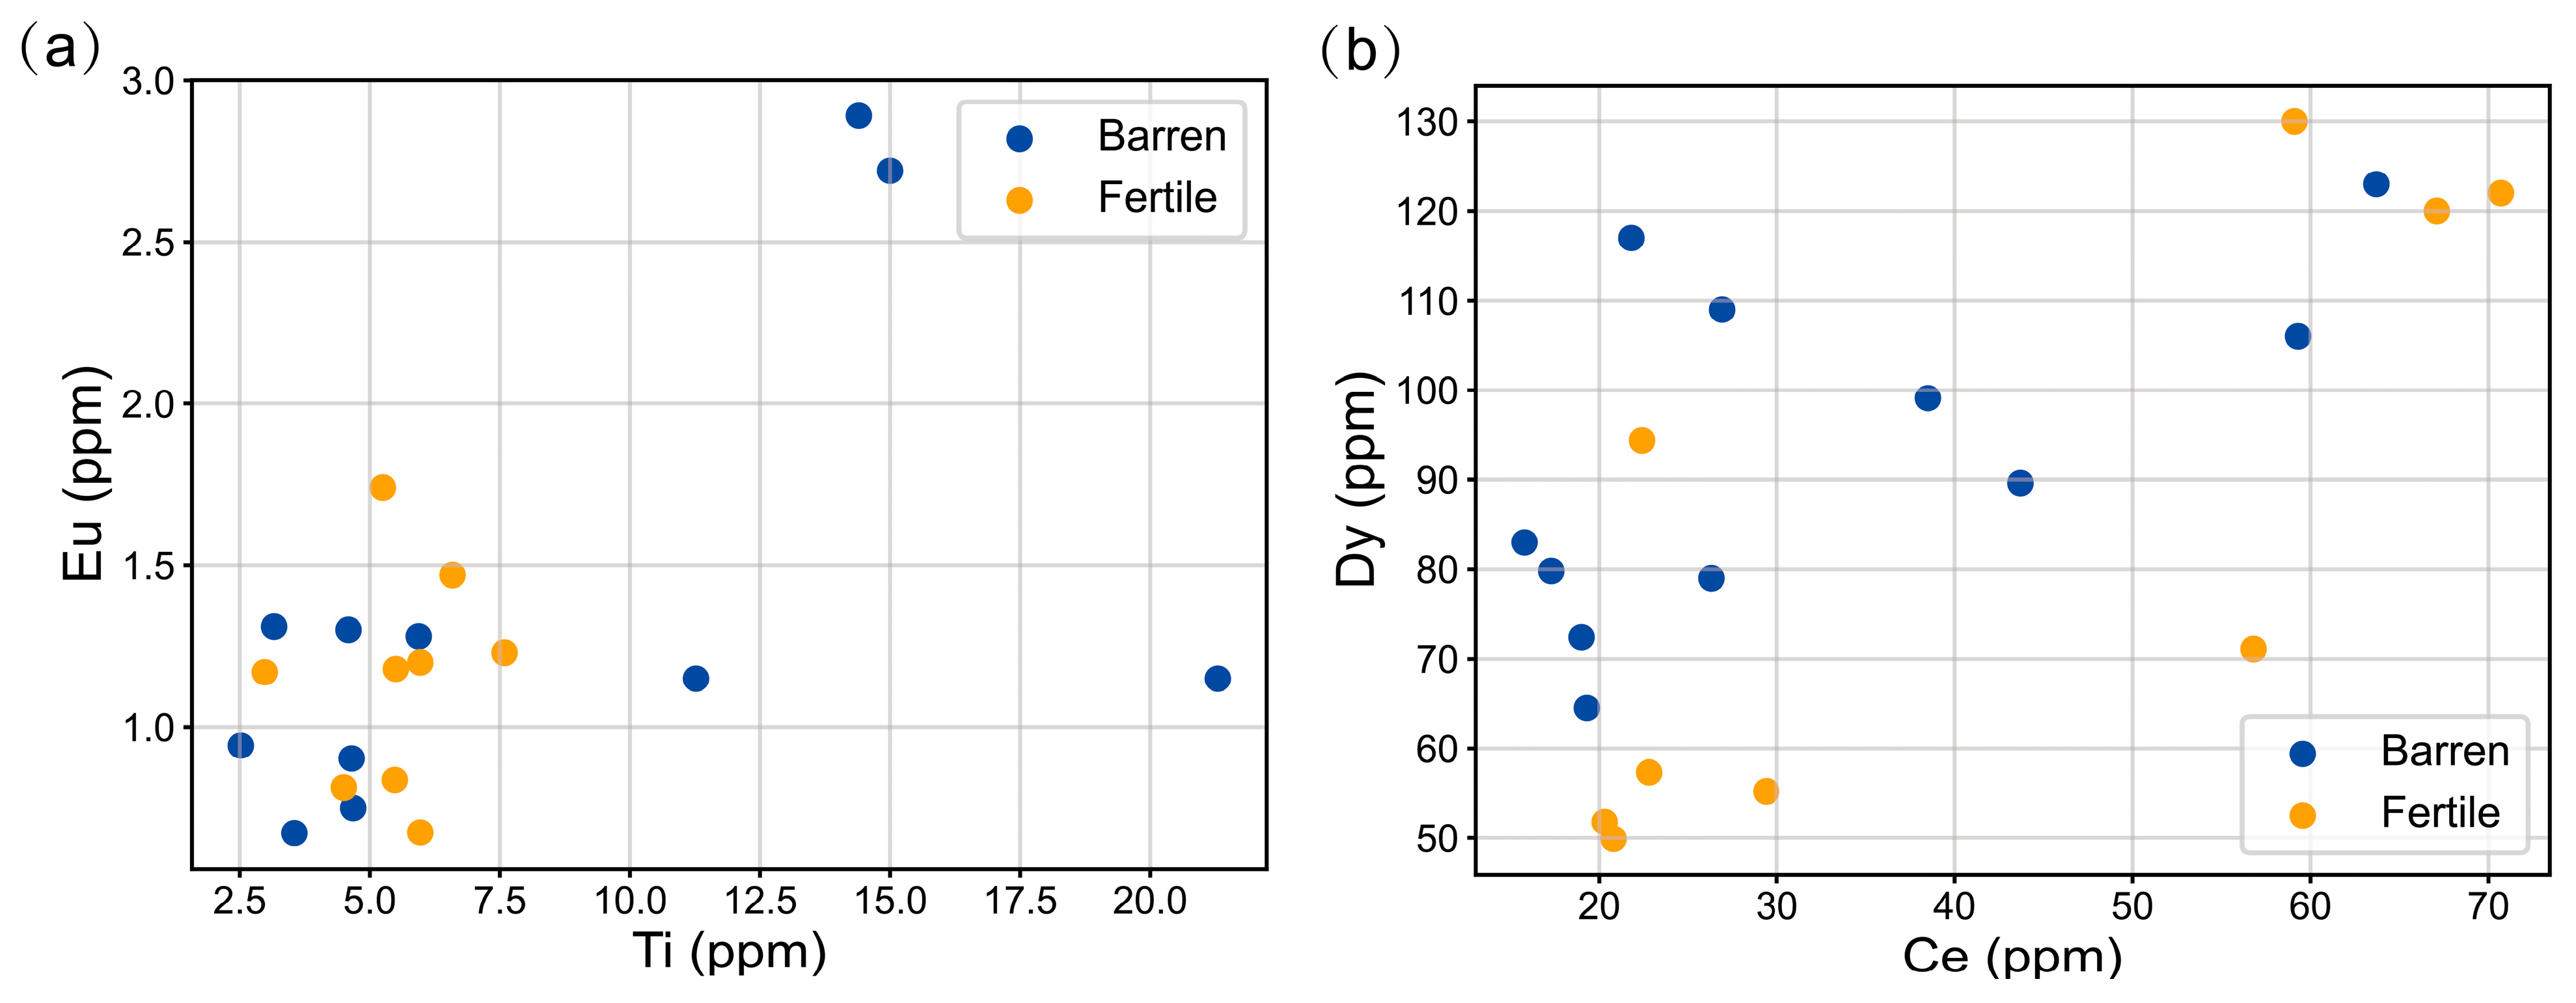
4.1. Conventional Geochemical Indicators
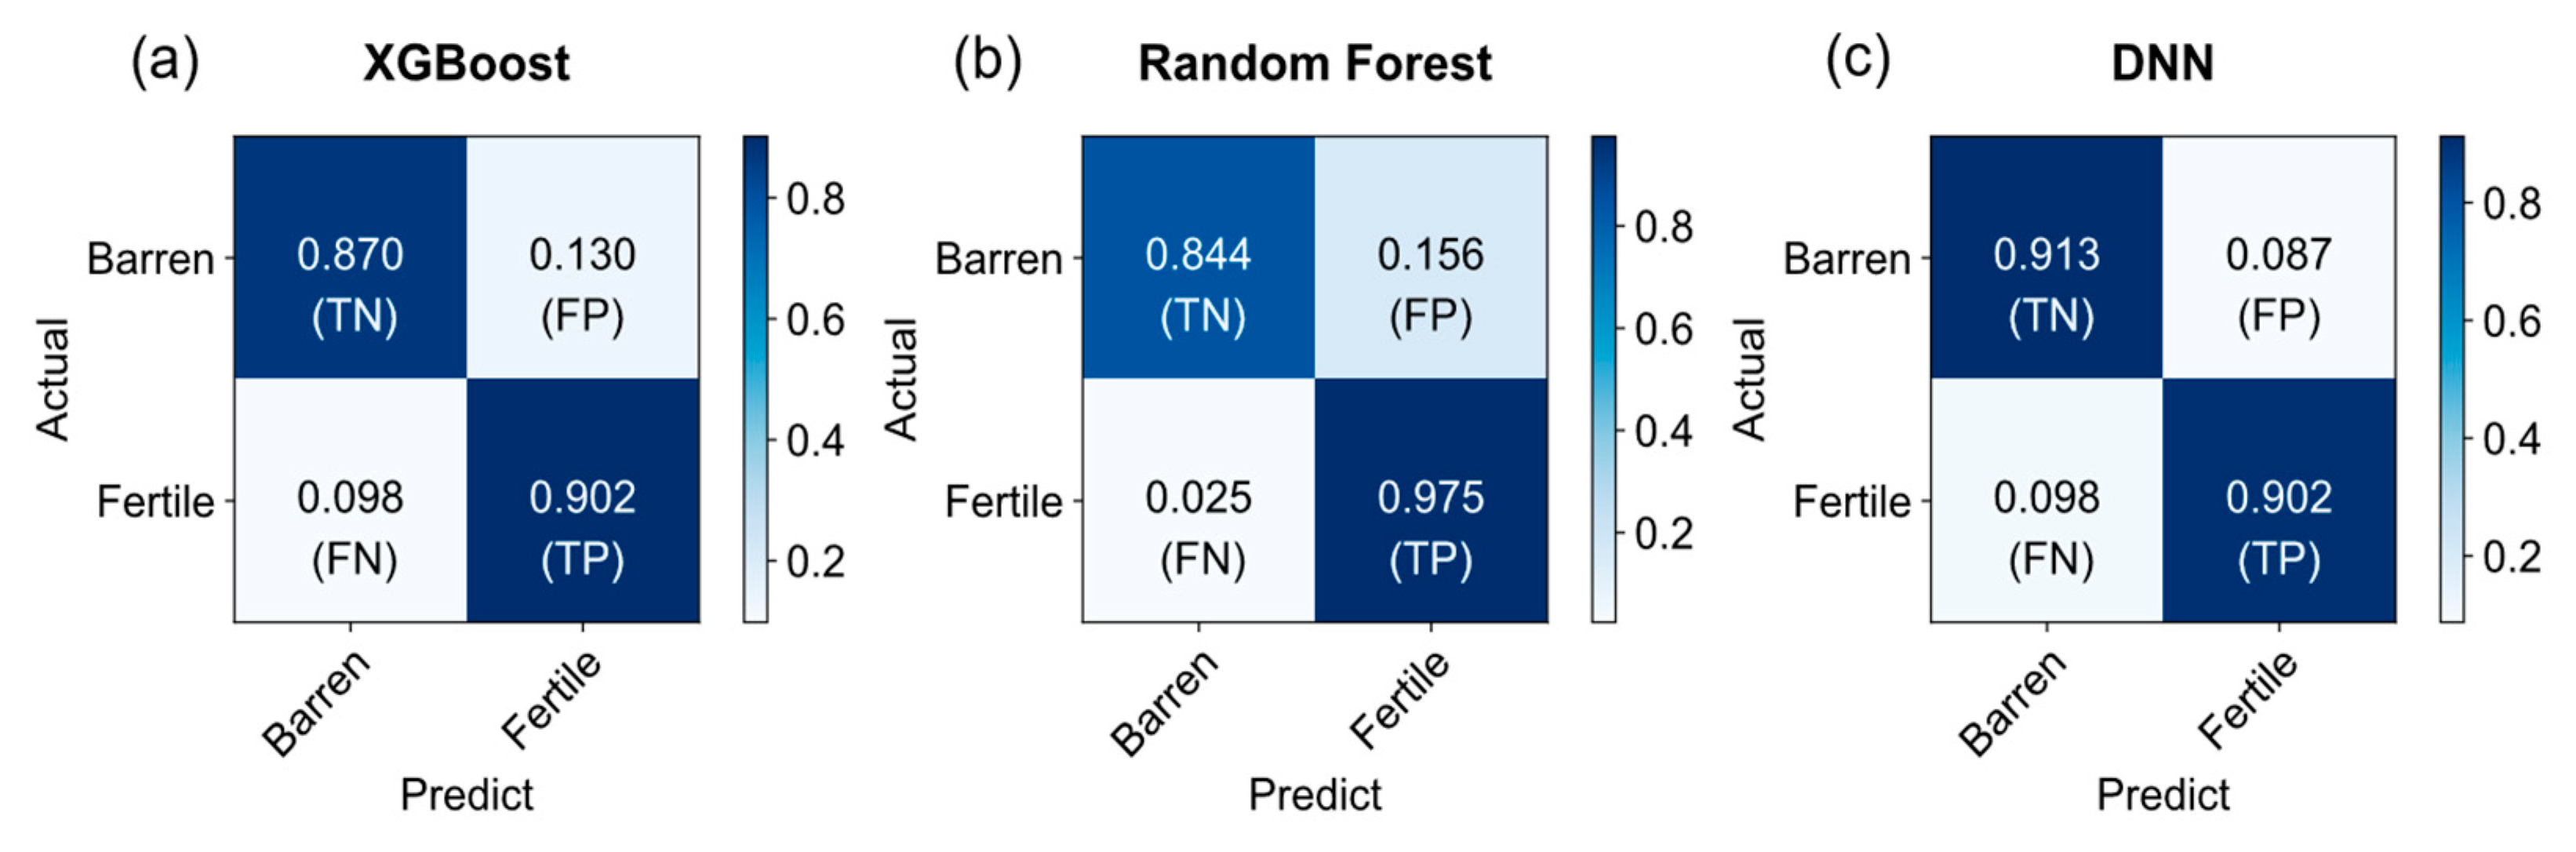
4.2. Results from Machine Learning Models
4.3. Application on Porphyry Deposits in Turkey
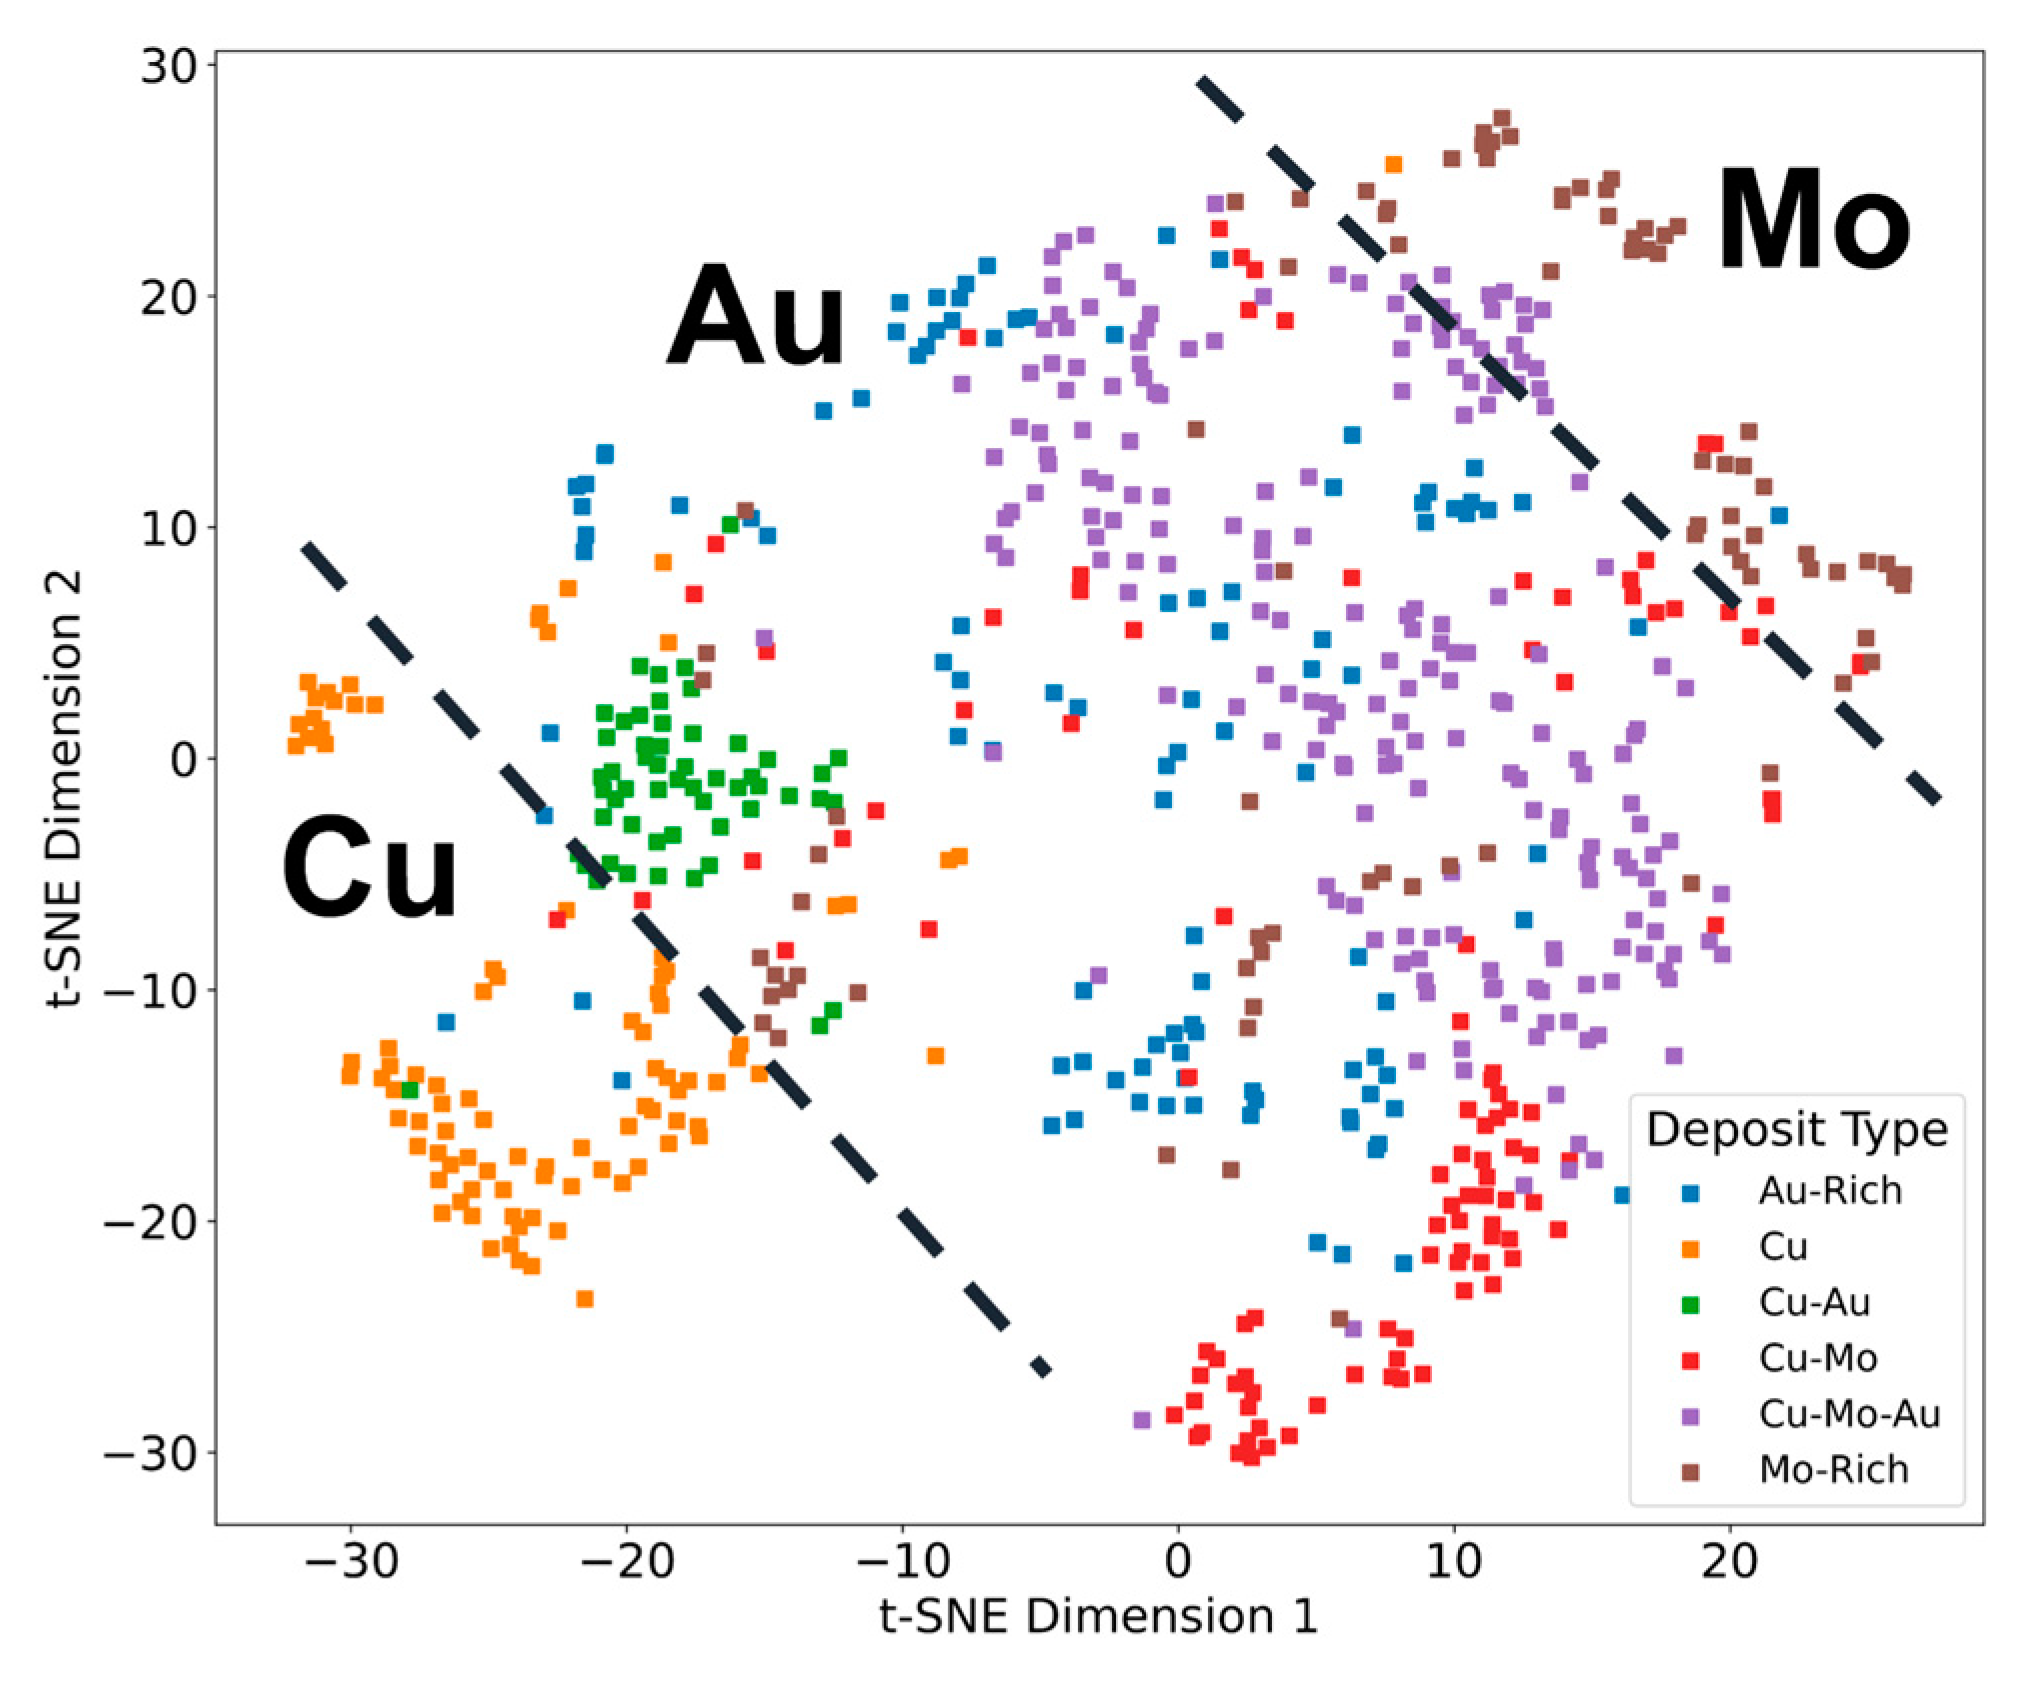
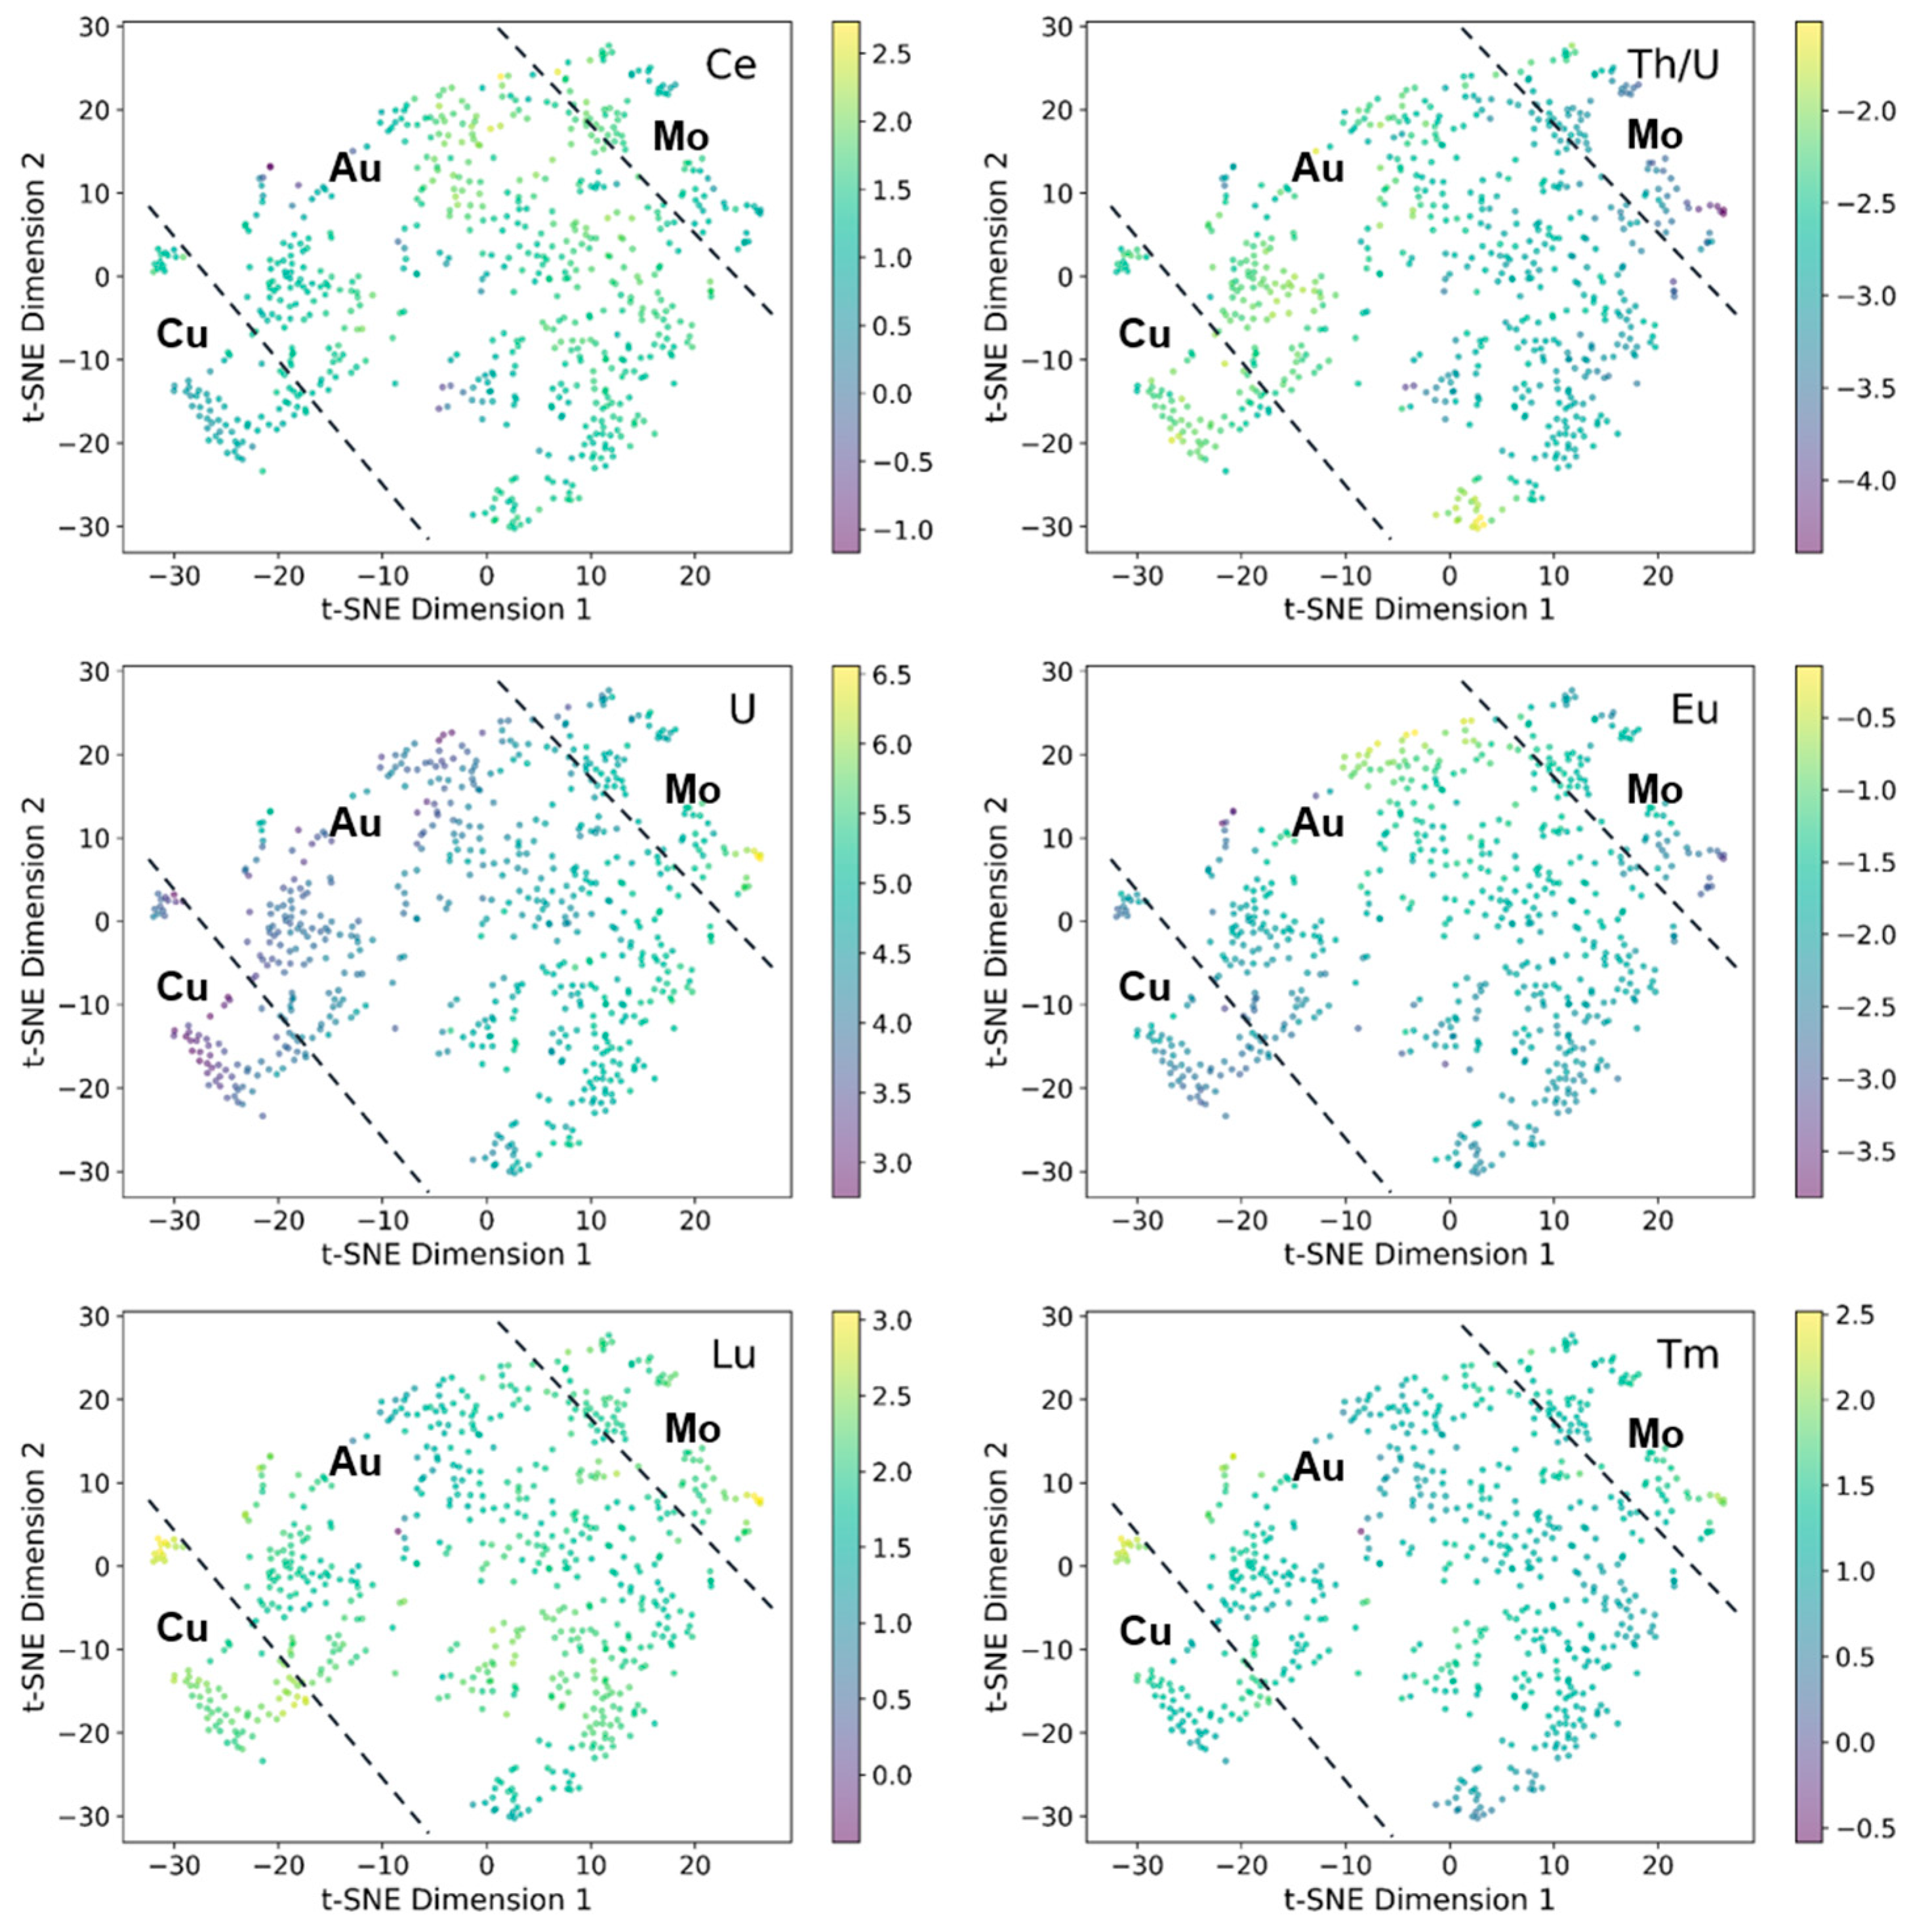
4.4. Classification of Porphyry Deposits of Different Metallogenic Types
4.5. Discussion
5. Conclusions
- Machine learning models can effectively distinguish magmatic zircons from porphyry deposits in the Tethyan domain, and the accuracy of random forest, XGBoost, and DNN are 91%, 88.6%, and 90.8%, respectively.
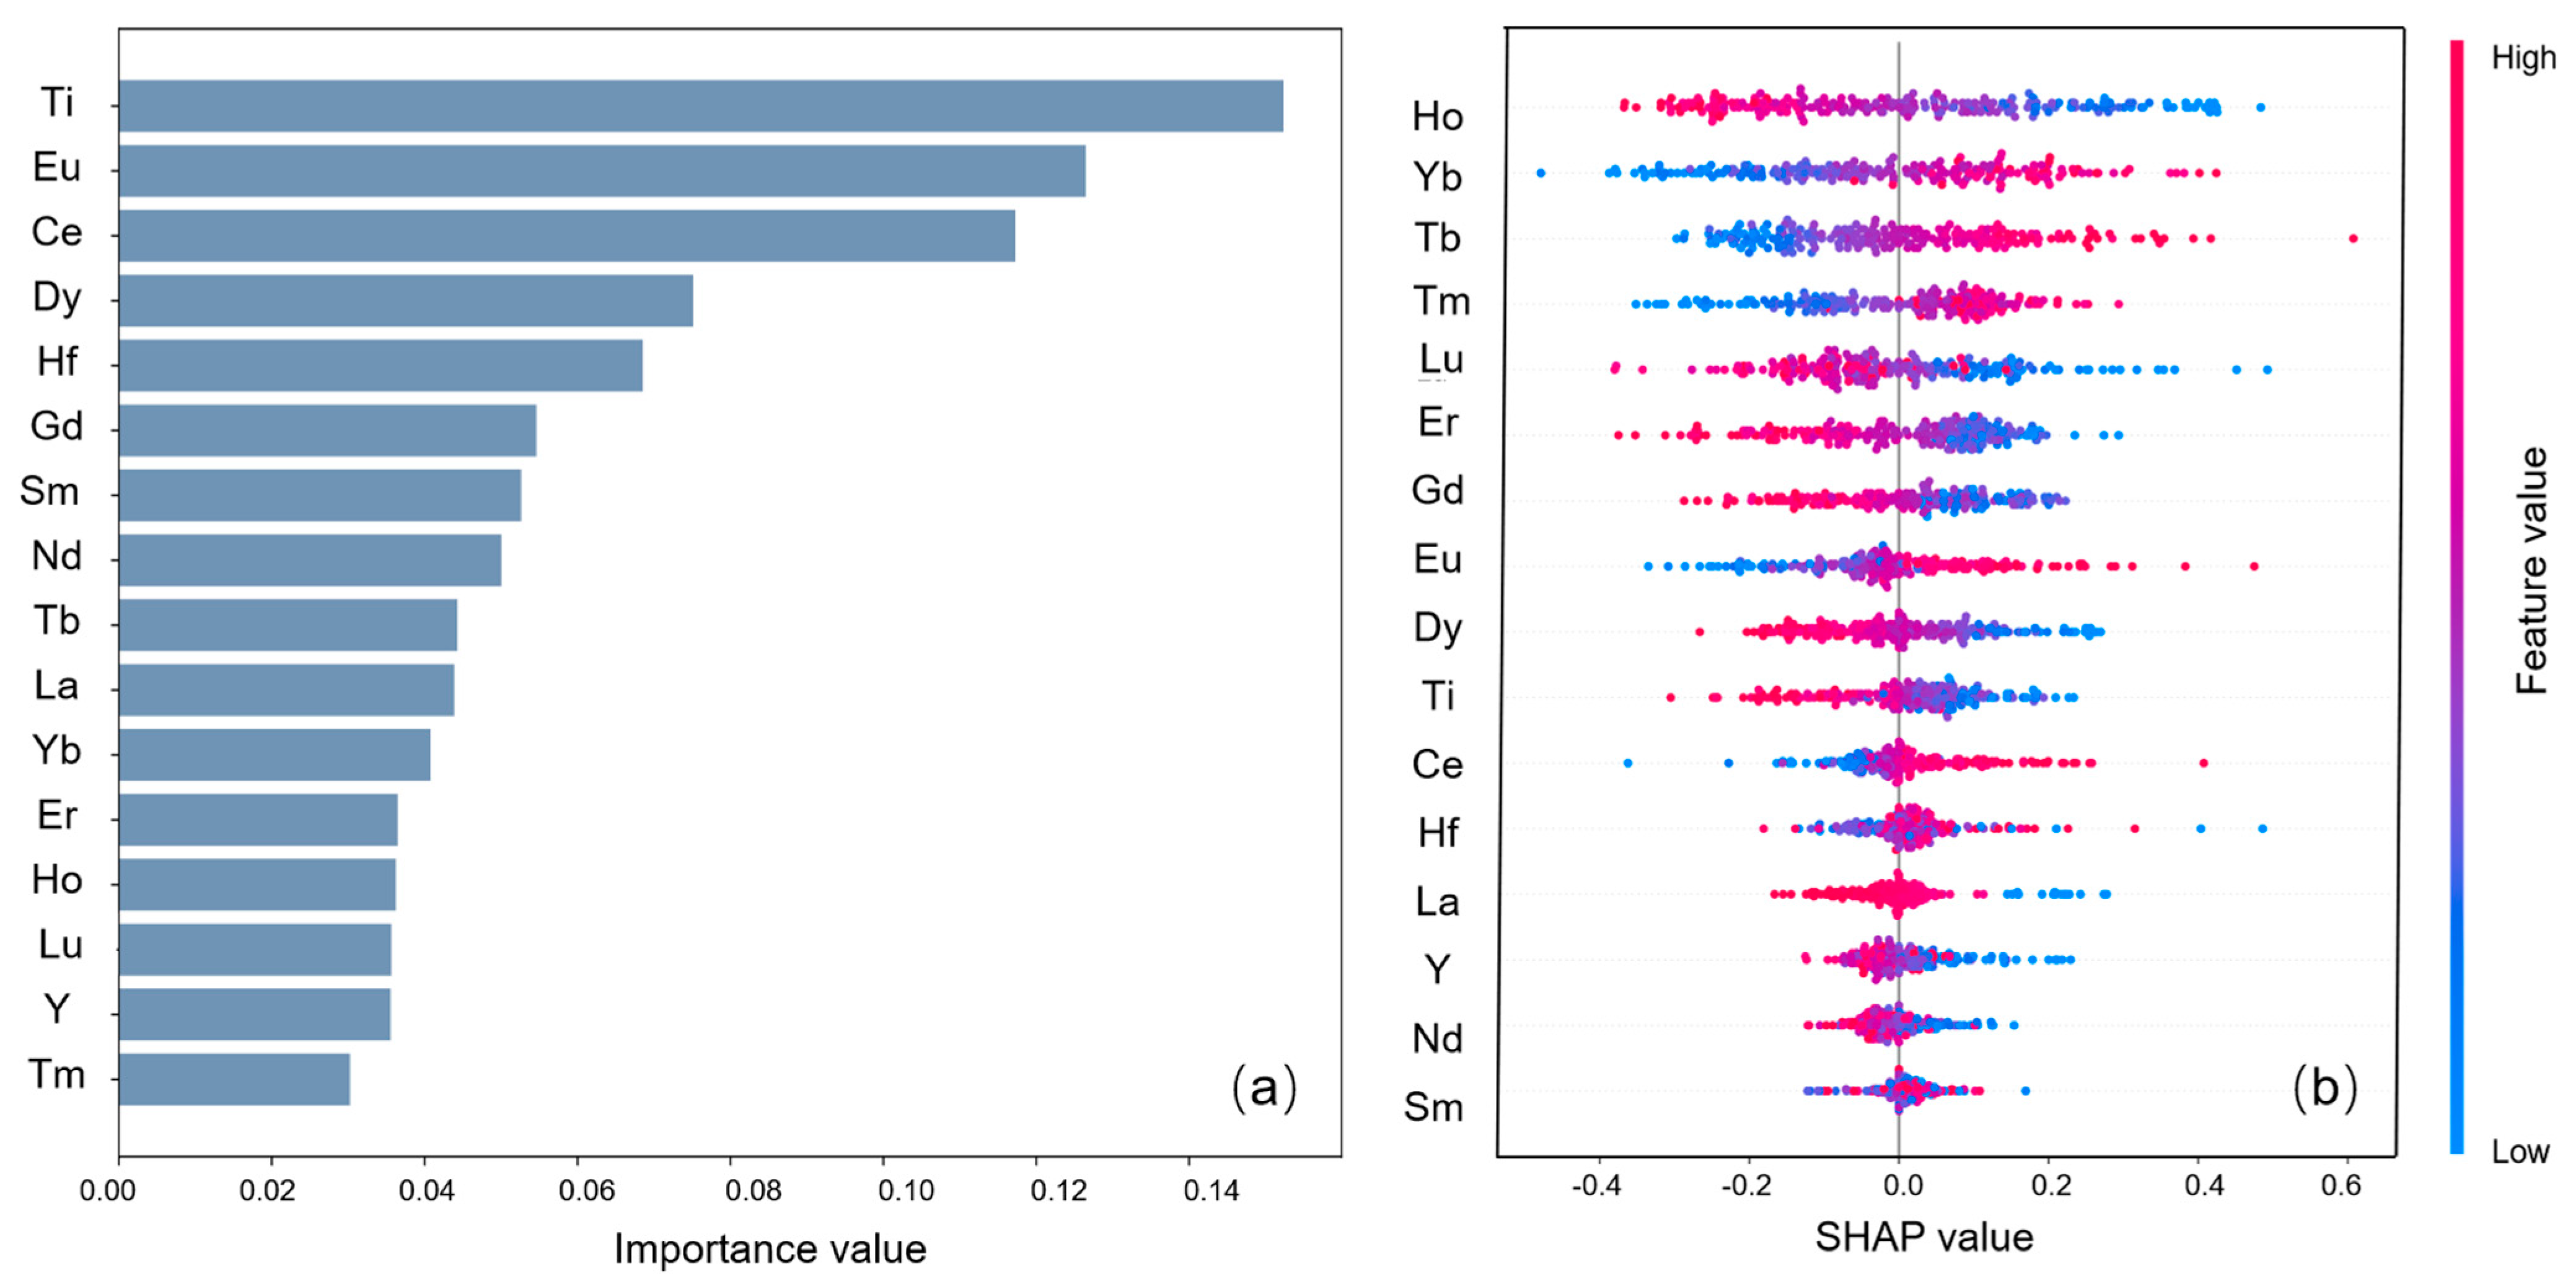
- Feature ranking results indicate that Ce, Eu, Dy, and Yb have significant impacts on distinguishing the fertility of zircons. In addition to the elements previously confirmed in prior studies, this research found that Ti, Lu, Hf, Ho, and Tb also play important roles in distinguishing zircons. The specific mechanisms of their effects require further exploration.
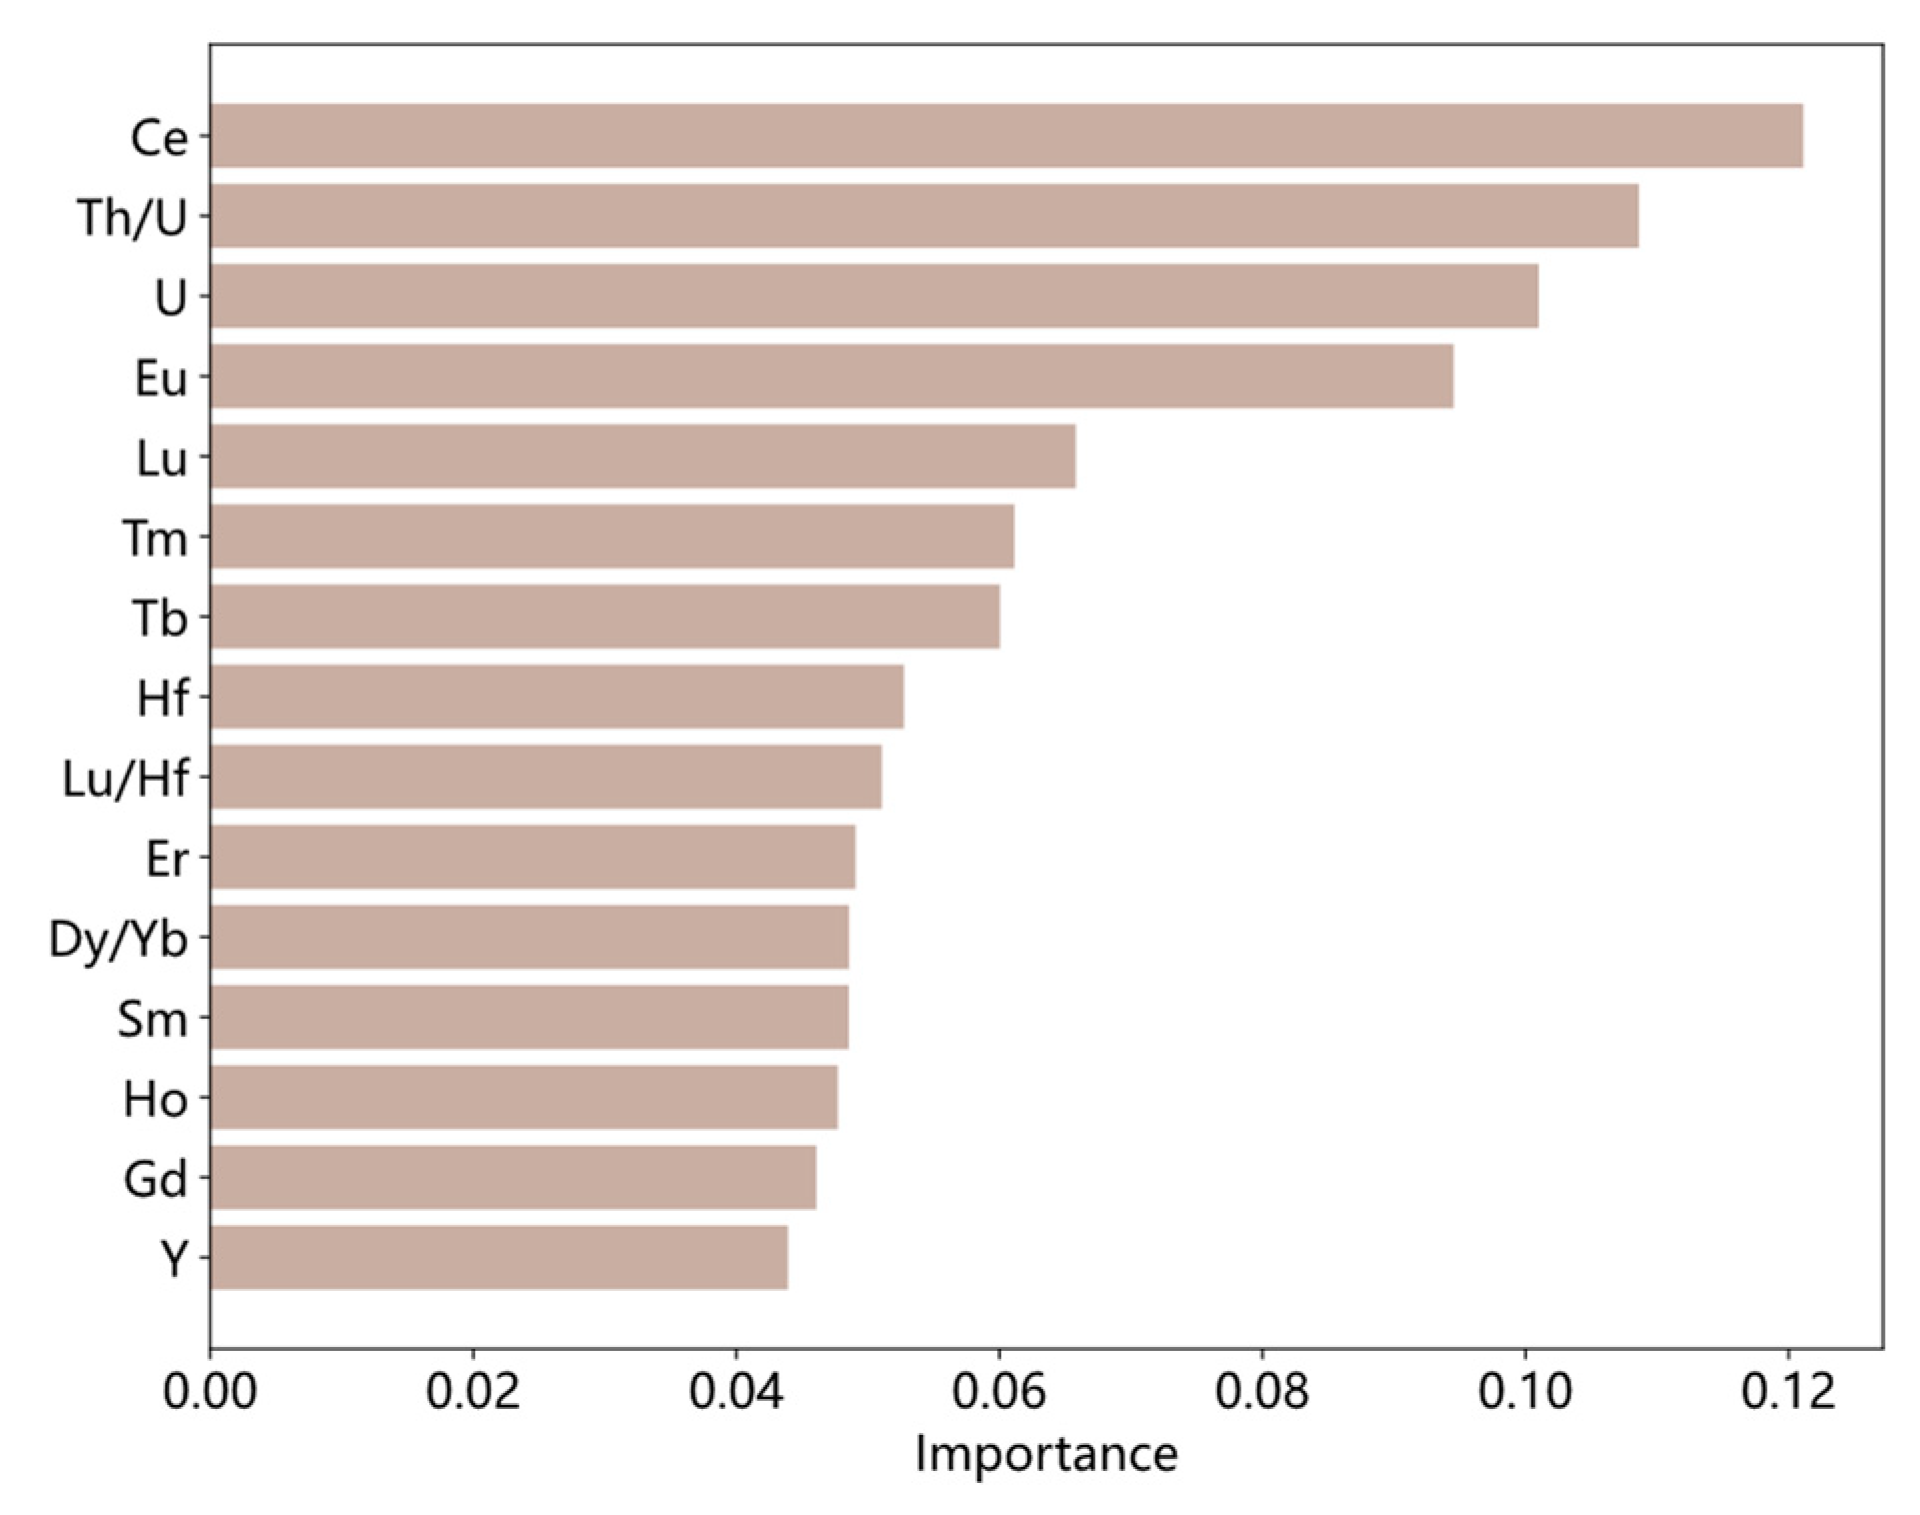
- The t-SNE visualization provides a feasible method for exploring the differences in element characteristics among the porphyry deposits of the different mineralization types. The study found that in the Cu, Mo-rich, and mixed mineralization deposits, the Ce and Eu values are relatively lower compared to the Au-rich deposits, while the Lu values are higher. The Th/U ratios decrease sequentially in the Cu, Au-rich, and Mo-rich deposits.
Supplementary Materials
Author Contributions
Funding
Data Availability Statement
Conflicts of Interest
References
- Kirkham, R.; Sinclair, W. Porphyry copper, gold, molybdenum, tungsten, tin, silver. In Geology of Canadian Mineral Deposit Types; Geological Society of America, Inc.: Boulder, CO, USA, 1995. [Google Scholar]
- Sinclair, W. Porphyry deposits. In Mineral Deposits of Canada: A Synthesis of Major Deposit-Types, District Metallogeny, the Evolution of Geological Provinces, and Exploration Methods: Geological Association of Canada, Mineral Deposits Division, Special Publication; Geological Association of Canada, Mineral Deposits Division: St. John’s, NL, Canada, 2007; Volume 5, pp. 223–243. [Google Scholar]
- Sillitoe, R.H. Porphyry copper systems. Econ. Geol. 2010, 105, 3–41. [Google Scholar] [CrossRef]
- Richards, J.P. Tectonic, magmatic, and metallogenic evolution of the Tethyan orogen: From subduction to collision. Ore Geol. Rev. 2015, 70, 323–345. [Google Scholar] [CrossRef]
- Baldwin, J.; Pearce, J.A. Discrimination of productive and nonproductive porphyritic intrusions in the Chilean Andes. Econ. Geol. 1982, 77, 664–674. [Google Scholar] [CrossRef]
- Lang, J.R.; Titley, S.R. Isotopic and geochemical characteristics of Laramide magmatic systems in Arizona and implications for the genesis of porphyry copper deposits. Econ. Geol. 1998, 93, 138–170. [Google Scholar] [CrossRef]
- Loucks, R. Distinctive composition of copper-ore-forming arcmagmas. Aust. J. Earth Sci. 2014, 61, 5–16. [Google Scholar] [CrossRef]
- Richards, J.P. Magmatic to hydrothermal metal fluxes in convergent and collided margins. Ore Geol. Rev. 2011, 40, 1–26. [Google Scholar] [CrossRef]
- Wang, R.; Tafti, R.; Hou, Z.-Q.; Shen, Z.-C.; Guo, N.; Evans, N.J.; Jeon, H.; Li, Q.-Y.; Li, W.-K. Across-arc geochemical variation in the Jurassic magmatic zone, Southern Tibet: Implication for continental arc-related porphyry CuAu mineralization. Chem. Geol. 2017, 451, 116–134. [Google Scholar] [CrossRef]
- Chen, X.; Richards, J.P.; Liang, H.; Zou, Y.; Zhang, J.; Huang, W.; Ren, L.; Wang, F. Contrasting arc magma fertilities in the Gangdese belt, Southern Tibet: Evidence from geochemical variations of Jurassic volcanic rocks. Lithos 2019, 324, 789–802. [Google Scholar] [CrossRef]
- Lu, Y.-J.; Loucks, R.R.; Fiorentini, M.; McCuaig, T.C.; Evans, N.J.; Yang, Z.-M.; Hou, Z.-Q.; Kirkland, C.L.; Parra-Avila, L.A.; Kobussen, A. Zircon compositions as a pathfinder for porphyry Cu±Mo±Au deposits. In Tectonics and Metallogeny of the Tethyan Orogenic Belt; Society of Economic Geologists: Littleton, CO, USA, 2016. [Google Scholar]
- Kemp, A.; Hawkesworth, C.J.; Foster, G.; Paterson, B.; Woodhead, J.; Hergt, J.; Gray, C.; Whitehouse, M. Magmatic and crustal differentiation history of granitic rocks from Hf-O isotopes in zircon. Science 2007, 315, 980–983. [Google Scholar] [CrossRef]
- Van Kranendonk, M.J.; Kirkland, C.L. Orogenic climax of Earth: The 1.2–1.1 Ga Grenvillian superevent. Geology 2013, 41, 735–738. [Google Scholar] [CrossRef]
- Lee, J.K.; Williams, I.S.; Ellis, D.J. Pb, U and Th diffusion in natural zircon. Nature 1997, 390, 159–162. [Google Scholar] [CrossRef]
- Rubatto, D. Zircon trace element geochemistry: Partitioning with garnet and the link between U–Pb ages and metamorphism. Chem. Geol. 2002, 184, 123–138. [Google Scholar] [CrossRef]
- Ballard, J.R.; Palin, J.M.; Campbell, I.H. Relative oxidation states of magmas inferred from Ce (IV)/Ce (III) in zircon: Application to porphyry copper deposits of northern Chile. Contrib. Mineral. Petrol. 2002, 144, 347–364. [Google Scholar] [CrossRef]
- Dilles, J.H.; Kent, A.J.; Wooden, J.L.; Tosdal, R.M.; Koleszar, A.; Lee, R.G.; Farmer, L.P. Zircon compositional evidence for sulfur-degassing from ore-forming arc magmas. Econ. Geol. 2015, 110, 241–251. [Google Scholar] [CrossRef]
- Lee, R.G.; Dilles, J.H.; Tosdal, R.M.; Wooden, J.L.; Mazdab, F.K. Magmatic evolution of granodiorite intrusions at the El Salvador porphyry copper deposit, Chile, based on trace element composition and U/Pb age of zircons. Econ. Geol. 2017, 112, 245–273. [Google Scholar] [CrossRef]
- Loader, M.A.; Wilkinson, J.J.; Armstrong, R.N. The effect of titanite crystallisation on Eu and Ce anomalies in zircon and its implications for the assessment of porphyry Cu deposit fertility. Earth Planet. Sci. Lett. 2017, 472, 107–119. [Google Scholar] [CrossRef]
- Pizarro, H.; Campos, E.; Bouzari, F.; Rousse, S.; Bissig, T.; Gregoire, M.; Riquelme, R. Porphyry indicator zircons (PIZs): Application to exploration of porphyry copper deposits. Ore Geol. Rev. 2020, 126, 103771. [Google Scholar] [CrossRef]
- Zhong, S.; Li, S.; Feng, C.; Liu, Y.; Santosh, M.; He, S.; Qu, H.; Liu, G.; Seltmann, R.; Lai, Z. Porphyry copper and skarn fertility of the northern Qinghai-Tibet Plateau collisional granitoids. Earth-Sci. Rev. 2021, 214, 103524. [Google Scholar] [CrossRef]
- Alpaydin, E. Introduction to Machine Learning; MIT Press: Cambridge, MA, USA, 2020. [Google Scholar]
- Hastie, T.; Tibshirani, R.; Friedman, J.; Hastie, T.; Tibshirani, R.; Friedman, J. Unsupervised learning. In The Elements of Statistical Learning: Data Mining, Inference, and Prediction; Springer: New York, NY, USA, 2009; pp. 485–585. [Google Scholar]
- Kubat, M. S; Springer: Berlin/Heidelberg, Germany, 2017. [Google Scholar]
- Keykhay-Hosseinpoor, M.; Kohsary, A.-H.; Hossein-Morshedy, A.; Porwal, A. A machine learning-based approach to exploration targeting of porphyry Cu-Au deposits in the Dehsalm district, eastern Iran. Ore Geol. Rev. 2020, 116, 103234. [Google Scholar] [CrossRef]
- Ford, A. Practical implementation of random forest-based mineral potential mapping for porphyry Cu–Au mineralization in the Eastern Lachlan Orogen, NSW, Australia. Nat. Resour. Res. 2020, 29, 267–283. [Google Scholar] [CrossRef]
- Abbaszadeh, M.; Hezarkhani, A.; Soltani-Mohammadi, S. An SVM-based machine learning method for the separation of alteration zones in Sungun porphyry copper deposit. Geochemistry 2013, 73, 545–554. [Google Scholar] [CrossRef]
- Zou, S.; Chen, X.; Brzozowski, M.J.; Leng, C.B.; Xu, D. Application of machine learning to characterizing magma fertility in porphyry Cu deposits. J. Geophys. Res. Solid Earth 2022, 127, e2022JB024584. [Google Scholar] [CrossRef]
- Nathwani, C.L.; Wilkinson, J.J.; Fry, G.; Armstrong, R.N.; Smith, D.J.; Ihlenfeld, C. Machine learning for geochemical exploration: Classifying metallogenic fertility in arc magmas and insights into porphyry copper deposit formation. Miner. Depos. 2022, 57, 1143–1166. [Google Scholar] [CrossRef]
- Hou, Z.Q.; Zheng, Y.C.; Yang, Z.M.; Yang, Z.S. Metallogesis of continental collision setting: Part I. Gangdese Cenozoic porphyry Cu-Mo systems in Tibet. Miner. Depos. 2012, 31, 647–670. [Google Scholar]
- Zhang, H.R.; Hou, Z.Q.; Song, Y.C.; Li, Z.; Yang, Z.M.; Wang, Z.L.; Wang, X.H.; Wang, S.X. The Temporal and spatial distribution of porphyry copper deposits in the eastern tethyan metallogenic domain: A review. Acta Geol. Sin. 2009, 83, 1818–1837. [Google Scholar]
- Wang, R.; Zhu, D.C.; Wang, Q.; Hou, Z.Q.; Yang, Z.M.; Zhao, Z.D.; Mo, X.X. Porphyry mineralization in the tethyan orogen. Sci. China Ser. D Earth Sci. 2020, 30, 38. [Google Scholar] [CrossRef]
- Chen, J.-L.; Xu, J.-F.; Ren, J.-B.; Huang, X.-X.; Wang, B.-D. Geochronology and geochemical characteristics of Late Triassic porphyritic rocks from the Zhongdian arc, eastern Tibet, and their tectonic and metallogenic implications. Gondwana Res. 2014, 26, 492–504. [Google Scholar] [CrossRef]
- Hou, Z. Tectono-magmatic evolution of the Yidunisland-arc and geodynamic setting of Kuroko-type sulfide deposits in Sanjiang Region, China. Resour. Geol. Spec. Issue 1993, 17, 336–350. [Google Scholar]
- Zeng, P.S.; Wang, H.P.; Mo, X.X.; Yu, X.H.; Li, W.C.; Li, T.G.; Li, H.; Yang, C.Z. Tectonic setting and prospects of orphyry copper deposits in Zhongdian island arc belt. Acta Geosci. Sin. 2004, 05, 535–540. [Google Scholar]
- Wei, S.-g.; Tang, J.-x.; Song, Y.; Liu, Z.-b.; Feng, J.; Li, Y.-b. Early Cretaceous bimodal volcanism in the Duolong Cu mining district, western Tibet: Record of slab breakoff that triggered ca. 108–113 Ma magmatism in the western Qiangtang terrane. J. Asian Earth Sci. 2017, 138, 588–607. [Google Scholar] [CrossRef]
- Hou, Z.; Yang, Z.; Qu, X.; Meng, X.; Li, Z.; Beaudoin, G.; Rui, Z.; Gao, Y.; Zaw, K. The Miocene Gangdese porphyry copper belt generated during post-collisional extension in the Tibetan Orogen. Ore Geol. Rev. 2009, 36, 25–51. [Google Scholar] [CrossRef]
- Yang, Z.; Cooke, D.R. Porphyry copper deposits in China. In Mineral Deposits of China; Society of Economic Geologists: Littleton, CO, USA, 2019. [Google Scholar]
- Sadigh, S.; Mirmohammadi, M.; Asghari, O.; Porwal, A. Spatial distribution of porphyry copper deposits in Kerman Belt, Iran. Ore Geol. Rev. 2023, 153, 105251. [Google Scholar] [CrossRef]
- He, W.-Y.; Mo, X.-X.; He, Z.-H.; White, N.C.; Chen, J.-B.; Yang, K.-H.; Wang, R.; Yu, X.-H.; Dong, G.-C.; Huang, X.-F. The geology and mineralogy of the Beiya skarn gold deposit in Yunnan, southwest China. Econ. Geol. 2015, 110, 1625–1641. [Google Scholar] [CrossRef]
- Hu, R.; Burnard, P.; Turner, G.; Bi, X. Helium and Argon isotope systematics in fluid inclusions of Machangqing copper deposit in west Yunnan province, China. Chem. Geol. 1998, 146, 55–63. [Google Scholar] [CrossRef]
- Liang, H.-Y.; Sun, W.; Su, W.-C.; Zartman, R.E. Porphyry copper-gold mineralization at Yulong, China, promoted by decreasing redox potential during magnetite alteration. Econ. Geol. 2009, 104, 587–596. [Google Scholar] [CrossRef]
- Zhang, H.R.; Hou, Z.Q.; Yang, Z.M. Metallogenesis and geodynamics of tethyan metallogenic domain: A review. Miner. Depos. 2010, 29, 113–133. [Google Scholar]
- Ren, H.; Zheng, Y.; Wu, S.; Wang, D.; Zuo, L.; Chen, L.; Gao, F.; Wei, J.; Wang, S.; Shu, D. Short-wavelength infrared characteristics and composition of white mica in the Demingding porphyry Cu-Mo deposit, Gangdese belt, Tibet: Implications for mineral exploration. Ore Geol. Rev. 2023, 164, 105833. [Google Scholar] [CrossRef]
- Sun, X.; Zheng, Y.; Xu, J.; Huang, L.; Guo, F.; Gao, S. Metallogenesis and ore controls of Cenozoic porphyry Mo deposits in the Gangdese belt of southern Tibet. Ore Geol. Rev. 2017, 81, 996–1014. [Google Scholar] [CrossRef]
- Chen, X.; Zheng, Y.; Gao, S.; Wu, S.; Jiang, X.; Jiang, J.; Cai, P.; Lin, C. Ages and petrogenesis of the late Triassic andesitic rocks at the Luerma porphyry Cu deposit, western Gangdese, and implications for regional metallogeny. Gondwana Res. 2020, 85, 103–123. [Google Scholar] [CrossRef]
- Xie, Z.; Xue, C.; Yang, T.; Xiang, K.; Xin, D. Petrogenesis and geodynamic implications of Early Cretaceous highly fractionated leucogranites in the northern Lanping–Simao terrane, Eastern Tibetan Plateau. J. Asian Earth Sci. 2020, 197, 104340. [Google Scholar] [CrossRef]
- Gao, T.; Tang, J.; Wang, L.; Li, B.; Wang, Y.; Lei, C. The first intra-oceanic island-arc porphyry Cu (Au) deposit in the western Bangong-Nujiang suture zone: Evidence from the Saidengnan Cu (Au) deposit. Gondwana Res. 2022, 104, 92–111. [Google Scholar] [CrossRef]
- Zengqian, H.; Hongwen, M.; Zaw, K.; Yuquan, Z.; Mingjie, W.; Zeng, W.; Guitang, P.; Renli, T. The Himalayan Yulong porphyry copper belt: Product of large-scale strike-slip faulting in eastern Tibet. Econ. Geol. 2003, 98, 125–145. [Google Scholar] [CrossRef]
- Zhou, H.; Sun, X.; Cook, N.J.; Lin, H.; Fu, Y.; Zhong, R.; Brugger, J. Nano-to micron-scale particulate gold hosted by magnetite: A product of gold scavenging by bismuth melts. Econ. Geol. 2017, 112, 993–1010. [Google Scholar] [CrossRef]
- Xu, L.; Bi, X.; Hu, R.; Zhang, X.; Su, W.; Qu, W.; Hu, Z.; Tang, Y. Relationships between porphyry Cu–Mo mineralization in the Jinshajiang–Red River metallogenic belt and tectonic activity: Constraints from zircon U–Pb and molybdenite Re–Os geochronology. Ore Geol. Rev. 2012, 48, 460–473. [Google Scholar] [CrossRef]
- Yang, L.-Q.; Deng, J.; Gao, X.; He, W.-Y.; Meng, J.-Y.; Santosh, M.; Yu, H.-J.; Yang, Z.; Wang, D. Timing of formation and origin of the Tongchanggou porphyry–skarn deposit: Implications for Late Cretaceous Mo–Cu metallogenesis in the southern Yidun Terrane, SE Tibetan Plateau. Ore Geol. Rev. 2017, 81, 1015–1032. [Google Scholar] [CrossRef]
- Moore, F.; Esmaeili, K.; Keshavarzi, B. Assessment of heavy metals contamination in stream water and sediments affected by the Sungun porphyry copper deposit, East Azerbaijan Province, Northwest Iran. Water Qual. Expo. Health 2011, 3, 37–49. [Google Scholar] [CrossRef]
- Amirihanza, H.; Shafieibafti, S.; Derakhshani, R.; Khojastehfar, S. Controls on Cu mineralization in central part of the Kerman porphyry copper belt, SE Iran: Constraints from structural and spatial pattern analysis. J. Struct. Geol. 2018, 116, 159–177. [Google Scholar] [CrossRef]
- Allahbakhshipoor, A.; Alipour-Asll, M.; Lentz, D.R. Genesis of the Kuh-Panj porphyry copper deposit, Kerman, Iran: Constraints from mineralization, geochemistry, fluid inclusion, and zircon UPb isotope systematics. J. Geochem. Explor. 2023, 253, 107276. [Google Scholar] [CrossRef]
- Parsapoor, A.; Khalili, M.; Tepley, F.; Maghami, M. Mineral chemistry and isotopic composition of magmatic, re-equilibrated and hydrothermal biotites from Darreh-Zar porphyry copper deposit, Kerman (Southeast of Iran). Ore Geol. Rev. 2015, 66, 200–218. [Google Scholar] [CrossRef]
- Aghazadeh, M.; Hou, Z.; Badrzadeh, Z.; Zhou, L. Temporal–spatial distribution and tectonic setting of porphyry copper deposits in Iran: Constraints from zircon U–Pb and molybdenite Re–Os geochronology. Ore Geol. Rev. 2015, 70, 385–406. [Google Scholar] [CrossRef]
- Seijo-Pardo, B.; Alonso-Betanzos, A.; Bennett, K.P.; Bolón-Canedo, V.; Josse, J.; Saeed, M.; Guyon, I. Biases in feature selection with missing data. Neurocomputing 2019, 342, 97–112. [Google Scholar] [CrossRef]
- Breiman, L. Random forests. Mach. Learn. 2001, 45, 5–32. [Google Scholar] [CrossRef]
- Ho, T.K. The random subspace method for constructing decision forests. IEEE Trans. Pattern Anal. Mach. Intell. 1998, 20, 832–844. [Google Scholar]
- Kwok, S.W.; Carter, C. Multiple decision trees. In Machine Intelligence and Pattern Recognition; Elsevier: Amsterdam, The Netherlands, 1990; Volume 9, pp. 327–335. [Google Scholar]
- Lee, T.-H.; Ullah, A.; Wang, R. Bootstrap aggregating and random forest. In Macroeconomic Forecasting in the Era of Big Data: Theory and Practice; Springer: Cham, Switzerland, 2020; pp. 389–429. [Google Scholar]
- Chen, T.; Guestrin, C. Xgboost: A scalable tree boosting system. In Proceedings of the 22nd ACM SIGKDD International Conference on Knowledge Discovery and Data Mining, San Francisco, CA, USA, 13–17 August 2016; pp. 785–794. [Google Scholar]
- Li, Z.S.; Liu, Z.G. Feature Selection Algorithm Based on XGBoost. J. Commun./Tongxin Xuebao 2019, 40, 2019154-1–2019154-8. [Google Scholar]
- Agatonovic-Kustrin, S.; Beresford, R. Basic concepts of artificial neural network (ANN) modeling and its application in pharmaceutical research. J. Pharm. Biomed. Anal. 2000, 22, 717–727. [Google Scholar] [CrossRef]
- Popescu, M.-C.; Balas, V.E.; Perescu-Popescu, L.; Mastorakis, N. Multilayer perceptron and neural networks. WSEAS Trans. Circuits Syst. 2009, 8, 579–588. [Google Scholar]
- LeCun, Y.; Bengio, Y.; Hinton, G. Deep learning. Nature 2015, 521, 436–444. [Google Scholar] [CrossRef]
- Sze, V.; Chen, Y.-H.; Yang, T.-J.; Emer, J.S. Efficient processing of deep neural networks: A tutorial and survey. Proc. IEEE 2017, 105, 2295–2329. [Google Scholar] [CrossRef]
- Mangalathu, S.; Hwang, S.-H.; Jeon, J.-S. Failure mode and effects analysis of RC members based on machine-learning-based SHapley Additive exPlanations (SHAP) approach. Eng. Struct. 2020, 219, 110927. [Google Scholar] [CrossRef]
- Yacouby, R.; Axman, D. Probabilistic extension of precision, recall, and f1 score for more thorough evaluation of classification models. In Proceedings of the First Workshop on Evaluation and Comparison of NLP Systems, Online, 20 November 2020; pp. 79–91. [Google Scholar]
- Van der Maaten, L.; Hinton, G. Visualizing data using t-SNE. J. Mach. Learn. Res. 2008, 9, 2579–2605. [Google Scholar]
- Van Der Maaten, L. Accelerating t-SNE using tree-based algorithms. J. Mach. Learn. Res. 2014, 15, 3221–3245. [Google Scholar]
- Sun, S.S.; McDonough, W.F. Chemical and isotopic systematics of oceanic basalts: Implications for mantle composition and processes. Geol. Soc. Lond. Spec. Publ. 1989, 42, 313–345. [Google Scholar] [CrossRef]
- Bergstra, J.; Bengio, Y. Random search for hyper-parameter optimization. J. Mach. Learn. Res. 2012, 13, 281–305. [Google Scholar]
- Metz, C.E. Basic principles of ROC analysis. Semin. Nucl. Med. 1978, 8, 283–298. [Google Scholar] [CrossRef] [PubMed]
- Candela, P.A. Controls on ore metal ratios in granite-related ore systems: An experimental and computational approach. Earth Environ. Sci. Trans. R. Soc. Edinb. 1992, 83, 317–326. [Google Scholar]
- Davidson, J.; Turner, S.; Handley, H.; Macpherson, C.; Dosseto, A. Amphibole “sponge” in arc crust? Geology 2007, 35, 787–790. [Google Scholar] [CrossRef]
- Yigit, O. Gold in Turkey—A missing link in Tethyan metallogeny. Ore Geol. Rev. 2006, 28, 147–179. [Google Scholar] [CrossRef]
- Yigit, O. Mineral deposits of Turkey in relation to Tethyan metallogeny: Implications for future mineral exploration. Econ. Geol. 2009, 104, 19–51. [Google Scholar] [CrossRef]
- Bozkurt, E.; Piper, J.D.; Winchester, J. Tectonics and Magmatism in Turkey and the Surrounding Area; Geological Society of London: London, UK, 2000. [Google Scholar]
- Moix, P.; Beccaletto, L.; Kozur, H.W.; Hochard, C.; Rosselet, F.; Stampfli, G.M. A new classification of the Turkish terranes and sutures and its implication for the paleotectonic history of the region. Tectonophysics 2008, 451, 7–39. [Google Scholar] [CrossRef]
- Bamba, T. Ophiolite and related copper deposits of the Ergani mining district, Southeastern Turkey. Bull. Miner. Res. Explor. 1976, 86, 36–50. [Google Scholar]
- Delibaş, O.; Moritz, R.; Ulianov, A.; Chiaradia, M.; Saraç, C.; Revan, K.M.; Göç, D. Cretaceous subduction-related magmatism and associated porphyry-type Cu–Mo prospects in the Eastern Pontides, Turkey: New constraints from geochronology and geochemistry. Lithos 2016, 248, 119–137. [Google Scholar] [CrossRef]
- Rabayrol, F. Late Cenozoic Post-Subduction Tectonic, Magmatic and Metallogenic Evolution of the Anatolide-Tauride Orogenic Belt, Turkey. Doctoral Dissertation, University of British Columbia, Vancouver, BC, Canada, 2018. [Google Scholar]
- Zhao, J.X.; Su, B.X.; Xiao, Y.; Hui, K.X.; Qin, K.Z. Evolution of magma oxidation states and volatile components in the Cenozoic porphyry ore systems in the western Turkey, Tethyan domain: Constrains from the compositions of zircon and apatite. Acta Petrol. Sin. 2021, 37, 2339–2363. [Google Scholar]
- Shen, Z.M.; Feng, Z.J.; Ren, Q.J. Classification Quantitative Discrimination Model of Porphyry Copper (Molybdenum) Deposits of Different Mineralization Types. Contrib. Geol. Miner. Resour. Res. 1993, 8, 95–103. [Google Scholar]
- Kirkland, C.; Smithies, R.; Taylor, R.; Evans, N.; McDonald, B. Zircon Th/U ratios in magmatic environs. Lithos 2014, 212–215, 397–414. [Google Scholar] [CrossRef]
- Kinny P D, Maas R. Lu–Hf and Sm–Nd isotope systems in zircon. Reviews in mineralogy and geochemistry. Rev. Mineral. Geochem. 2003; 53, 327–341. [CrossRef]
- Xu, L.-L.; Zhu, J.-J.; Huang, M.-L.; Pan, L.-C.; Hu, R.; Bi, X.-W. Genesis of hydrous-oxidized parental magmas for porphyry Cu (Mo, Au) deposits in a post-collisional setting: Examples from the Sanjiang region, SW China. Miner. Depos. 2023, 58, 161–196. [Google Scholar] [CrossRef]
- Yang, M.; Zhao, F.; Liu, X.; Qing, H.; Chi, G.; Li, X.; Lai, C. Contribution of magma mixing to the formation of porphyry-skarn mineralization in a post-collisional setting: The Machangqing Cu-Mo-(Au) deposit, Sanjiang tectonic belt, SW China. Ore Geol. Rev. 2020, 122, 103518. [Google Scholar] [CrossRef]
- Bao, X.; He, W.; Mao, J.; Liang, T.; Wang, H.; Zhou, Y.; Wang, J. Redox states and genesis of Cu-and Au-mineralized granite porphyries in the Jinshajiang Cu–Au metallogenic belt, SW China: Studies on the zircon chemistry. Miner. Depos. 2023, 58, 1123–1142. [Google Scholar] [CrossRef]
- Fu, Y.; Sun, X.M.; Lin, H.; Zhou, H.Y.; Li, X.; Ouyang, X.Q.; Jiang, L.Y.; Shi, G.Y.; Liang, Y.H. Geochronology of the giant Beiya gold-polymetallic deposit in Yunnan Province, Southwest China and its relationship with the petrogenesis of alkaline porphyry. Ore Geol. Rev. 2015, 71, 138–149. [Google Scholar] [CrossRef]
- Gao, X.-Q.; He, W.-Y.; Gao, X.; Bao, X.-S.; Yang, Z. Constraints of magmatic oxidation state on mineralization in the Beiya alkali-rich porphyry gold deposit, Western Yunnan, China. Solid Earth Sci. 2017, 2, 65–78. [Google Scholar] [CrossRef]
- Meng, X.; Mao, J.; Zhang, C.; Zhang, D.; Liu, H. Melt recharge, fO2-T conditions, and metal fertility of felsic magmas: Zircon trace element chemistry of Cu-Au porphyries in the Sanjiang orogenic belt, Southwest China. Miner. Depos. 2018, 53, 649–663. [Google Scholar] [CrossRef]
- Huang, M.-L.; Bi, X.-W.; Richards, J.P.; Hu, R.-Z.; Xu, L.-L.; Gao, J.-F.; Zhang, X.-C. High water contents of magmas and extensive fluid exsolution during the formation of the Yulong porphyry Cu-Mo deposit, Eastern Tibet. J. Asian Earth Sci. 2019, 176, 168–183. [Google Scholar] [CrossRef]
- Gao, X.; Yang, L.-Q.; He, W.-Y.; Groves, D. Redox conditions, compositional parameters, and indirect subduction-related source of Cretaceous Sn and Cu–Mo fertile post-subduction granites in the Yidun Terrane of Eastern Tibet. Ore Geol. Rev. 2021, 139, 104506. [Google Scholar] [CrossRef]
- Li, J.; Qin, K.; Li, G.; Cao, M.; Xiao, B.; Chen, L.; McInnes, B.I. Petrogenesis and thermal history of the Yulong porphyry copper deposit, Eastern Tibet: Insights from U-Pb and U-Th/He dating, and zircon Hf isotope and trace element analysis. Mineral. Petrol. 2012, 105, 201–221. [Google Scholar] [CrossRef]
- Yang, Z.-M.; Goldfarb, R.; Chang, Z.-S. Generation of post-collisional porphyry copper deposits in Southern Tibet triggered by subduction of the Indian continental plate. In Tectonics and Metallogeny of the Tethyan Orogenic Belt; Society of Economic Geologists: Littleton, CO, USA, 2016. [Google Scholar]
- Wang, R.; Richards, J.P.; Hou, Z.-Q.; Yang, Z.-M.; Gou, Z.-B.; DuFrane, S.A. Increasing magmatic oxidation state from Paleocene to Miocene in the Eastern Gangdese Belt, Tibet: Implication for collision-related porphyry Cu-Mo±Au mineralization. Econ. Geol. 2014, 109, 1943–1965. [Google Scholar] [CrossRef]
- Hezarkhani, A. Petrology of the intrusive rocks within the Sungun porphyry copper deposit, Azerbaijan, Iran. J. Asian Earth Sci. 2006, 27, 326–340. [Google Scholar] [CrossRef]
- Asadi, S.; Moore, F.; Zarasvandi, A. Discriminating productive and barren porphyry copper deposits in the southeastern part of the Central Iranian volcano-plutonic belt, Kerman region, Iran: A review. Earth-Sci. Rev. 2014, 138, 25–46. [Google Scholar] [CrossRef]
- Zhang, W.; Zhao, Z.; Liu, D.; Qiu, K.; Wang, Q.; Zhu, D.-C.; Hou, Z. Mineralogy and geochemistry of the Zedong Late Cretaceous (~94 Ma) biotite granodiorite in the Southern Lhasa Terrane: Implications for the tectonic setting and Cu-Au mineralization. Lithos 2023, 446, 107158. [Google Scholar] [CrossRef]
- Wu, S.; Zheng, Y.; Sun, X. Subduction metasomatism and collision-related metamorphic dehydration controls on the fertility of porphyry copper ore-forming high Sr/Y magma in Tibet. Ore Geol. Rev. 2016, 73, 83–103. [Google Scholar] [CrossRef]
- Hu, Y.B. Petrogenesis and metallogenetic implications of adakites in the Gangdese porphyry copper belt. Doctoral Dissertation, University of Chinese Academy of Sciences, Beijing, China, 2015. [Google Scholar]
- Zhang, B.; Liu, J.; Chen, W.; Zhu, Z.; Sun, C. Late Eocene magmatism of the Eastern Qiangtang Block (Eastern Tibetan Plateau) and its geodynamic implications. J. Asian Earth Sci. 2020, 195, 104329. [Google Scholar] [CrossRef]
- Tang, P.; Tang, J.; Wang, Y.; Lin, B.; Leng, Q.; Zhang, Q.; Wu, C. Genesis of the Lakang’e porphyry Mo (Cu) deposit, Tibet: Constraints from geochemistry, geochronology, Sr-Nd-Pb-Hf isotopes, zircon and apatite. Lithos 2021, 380, 105834. [Google Scholar] [CrossRef]
- Sun, X.; Lu, Y.-J.; McCuaig, T.C.; Zheng, Y.-Y.; Chang, H.-F.; Guo, F.; Xu, L.-J. Miocene ultrapotassic, high-Mg dioritic, and adakite-like rocks from Zhunuo in Southern Tibet: Implications for mantle metasomatism and porphyry copper mineralization in collisional orogens. J. Petrol. 2018, 59, 341–386. [Google Scholar] [CrossRef]
- Li, Q.; Yang, Z.; Wang, R.; Sun, M.; Qu, H. Zircon trace elemental and Hf-O isotopic compositions of the Miocene magmatic suite in the giant Qulong porphyry copper deposit Southern Tibet. Acta Petrol. Mineral. 2021, 40, 1–26. [Google Scholar]
- Zhang, J.; Chen, X.; Zhang, L.; Li, J. Insights into magma evolution and fluid evolution from zircon geochronology and geochemistry of the Xiongcun porphyry Cu-Mo deposit, Tibet, China. Econ. Geol. 2022, 117, 879–899. [Google Scholar]
- Zhu, X.; Li, G.; Liu, H.; Chen, H.; Ma, D.; Liu, C.; Wei, L. High oxidation magmatic evolution in the Naruo porphyry Cu deposit, Tibet, China. Gondwana Res. 2019, 76, 26–43. [Google Scholar] [CrossRef]
- Li, G.-M.; Qin, K.-Z.; Li, J.-X.; Evans, N.J.; Zhao, J.-X.; Cao, M.-J.; Zhang, X.-N. Cretaceous Magmatism and Metallogeny in the Bangong–Nujiang Metallogenic Belt, Central Tibet: Evidence from Petrogeochemistry, Zircon U–Pb Ages, and Hf–O Isotopic Compositions. Gondwana Res. 2017, 41, 110–127. [Google Scholar] [CrossRef]
- Zhang, Z.; Wang, L.; Tang, P.; Lin, B.; Sun, M.; Qi, J.; Yang, Z. Geochemistry and zircon trace elements composition of the Miocene ore-bearing biotite monzogranite porphyry in the Demingding porphyry Cu–Mo deposit, Tibet: Petrogenesis and implication for magma fertility. Geol. J. 2020, 55, 4525–4542. [Google Scholar] [CrossRef]
- Li, Q.; Sun, X.; Lu, Y.; Wang, F.; Hao, J. Apatite and zircon compositions for Miocene mineralizing and barren intrusions in the Gangdese porphyry copper belt of southern Tibet: Implication for ore control. Ore Geol. Rev. 2021, 139, 104474. [Google Scholar] [CrossRef]
- Lu, Y.-J.; Loucks, R.R.; Fiorentini, M.; McCuaig, T.C.; Evans, N.J.; Yang, Z.-M.; Kobussen, A. Zircon compositions as a pathfinder for porphyry Cu±Mo±Au deposits. Miner. Depos. 2016, 51, 249–267. [Google Scholar]
- Sun, X.; Hollings, P.; Lu, Y.-J. Geology and origin of the Zhunuo porphyry copper deposit, Gangdese Belt, Southern Tibet. Miner. Depos. 2021, 56, 457–480. [Google Scholar] [CrossRef]
- Hwang, J.; Park, J.-W.; Wan, B.; Honarmand, M. Contrasting platinum-group element geochemistry of post-collisional porphyry Cu±Au ore-bearing and barren suites in the central and southeastern Urumieh-Dokhtar magmatic arc, Iran. Miner. Depos. 2023, 58, 1583–1603. [Google Scholar] [CrossRef]
- Xie, F.; Tang, J.; Chen, Y.; Lang, X. Apatite and zircon geochemistry of Jurassic porphyries in the Xiongcun district, Southern Gangdese porphyry copper belt: Implications for petrogenesis and mineralization. Ore Geol. Rev. 2018, 96, 98–114. [Google Scholar] [CrossRef]
- Yinqiao, Z.; Wenting, H.; Huaying, L.; Jing, W.; Shuping, L.; Xiuzhang, W. Identification of porphyry genetically associated with mineralization and its zircon U-Pb and biotite Ar-Ar age of the Xiongcun Cu-Au deposit, Southern Gangdese, Tibet. Acta Petrolog. Sin. 2015, 31, 2053–2062. [Google Scholar]
- Wang, L.; Zheng, Y.; Hou, Z.; Xue, C.; Yang, Z.; Shen, Y.; Li, X.; Ghaffar, A. The subduction-related Saindak porphyry Cu-Au deposit formed by remelting of a thickened juvenile lower crust underneath the Chagai Belt, Pakistan. Ore Geol. Rev. 2022, 149, 105062. [Google Scholar] [CrossRef]
- Paolillo, L.; Chiaradia, M.; Ulianov, A. Zircon petrochronology of the Kışladaǧ porphyry Au deposit (Turkey). Econ. Geol. 2022, 117, 401–422. [Google Scholar] [CrossRef]
- Zhou, Y.; Xu, B.; Hou, Z.Q.; Wang, R.; Zheng, Y.C.; He, W.Y. Petrogenesis of Cenozoic high–Sr/Y shoshonites and associated mafic microgranular enclaves in an intracontinental setting: Implications for porphyry Cu-Au mineralization in Western Yunnan, China. Lithos 2019, 324, 39–54. [Google Scholar] [CrossRef]
- Zhang, J.; Peng, T.; Fan, W.; Zhao, G.; Dong, X.; Gao, J.; Chen, L. Petrogenesis of the Early Cretaceous granitoids and its mafic enclaves in the Northern Tengchong Terrane, Southern Margin of the Tibetan Plateau and its tectonic implications. Lithos 2018, 318, 283–298. [Google Scholar] [CrossRef]
- Zeng, Y.-C.; Xu, J.-F.; Huang, F.; Li, M.-J.; Chen, Q. Generation of the 105–100 Ma Dagze volcanic rocks in the North Lhasa Terrane by lower crustal melting at different temperature and depth: Implications for tectonic transition. GSA Bull. 2020, 132, 1257–1272. [Google Scholar] [CrossRef]
- Li, H.; Wang, M.; Zeng, X.-W.; Luo, A.-B.; Yu, Y.-P.; Zeng, X.-J. Generation of Jurassic high-Mg diorite and plagiogranite intrusions of the Asa area, Tibet: Products of intra-oceanic subduction of the Meso-Tethys Ocean. Lithos 2020, 362, 105481. [Google Scholar] [CrossRef]
- Babazadeh, S.; D’Antonio, M.; Cottle, J.M.; Ghalamghash, J.; Raeisi, D.; An, Y. Constraints from geochemistry, zircon U-Pb geochronology and Hf-Nd isotopic compositions on the origin of Cenozoic volcanic rocks from Central Urumieh-Dokhtar magmatic arc, Iran. Gondwana Res. 2021, 90, 27–46. [Google Scholar] [CrossRef]
- Liu, H.-N.; Li, X.-W.; Mo, X.-X.; Xu, J.-F.; Liu, J.-J.; Dong, G.-C.; Yu, H.-X. Early Mesozoic crustal evolution in the NW segment of West Qinling, China: Evidence from diverse intermediate–felsic igneous rocks. Lithos 2021, 396, 106187. [Google Scholar] [CrossRef]
- Ji, C.; Yan, L.-L.; Lu, L.; Jin, X.; Huang, Q.; Zhang, K.-J. Anduo Late Cretaceous high-K calc-alkaline and shoshonitic volcanic rocks in Central Tibet, Western China: Relamination of the subducted Meso-Tethyan oceanic plateau. Lithos 2021, 400, 106345. [Google Scholar] [CrossRef]
- Zeng, Y.-C.; Xu, J.-F.; Li, M.-J.; Chen, J.-L.; Wang, B.-D.; Huang, F.; Ren, S.-H. Late Eocene two-pyroxene trachydacites from the Southern Qiangtang Terrane, Central Tibetan Plateau: High-temperature melting of overthickened and dehydrated lower crust. J. Petrol. 2021, 62, egab080. [Google Scholar] [CrossRef]
- Chen, H.-B.; Ji, W.-Q.; Zhang, S.-H.; Jiang, H.; Xu, Q.; Wu, F.-Y. Disclosing the most intense magmatic flare-up in Southern Tibet: Insights from study of the Pangduo volcanic-plutonic complex. Lithos 2023, 454, 107267. [Google Scholar] [CrossRef]
- Fan, H.; Zhang, M.; Huang, F.; Xu, J.; Liu, X.; Zeng, Y.; Yu, H. Subducted Oceanic Plateau Fed Crustal Growth: Insights from Amdo Dacites in Central Tibetan Plateau. Lithos 2022, 434, 106944. [Google Scholar] [CrossRef]
- Zhang, Y.-F.; Xu, B.; Hou, Z.-Q.; Zhao, Y.; Wang, Z.-X.; Shen, J.-Q.; Li, E.-Q. Zircon Xenocryst Geochronology and Implications for the Lhasa Terrane Evolution: Insights from Cenozoic Volcanic Rocks (Coqen, Tibet). J. Asian Earth Sci. 2023, 255, 105763. [Google Scholar] [CrossRef]
- Li, Q.-H.; Lu, L.; Zhang, K.-J.; Yan, L.-L.; Huangfu, P.; Hui, J.; Ji, C. Late Cretaceous Post-Orogenic Delamination in the Western Gangdese Arc: Evidence from Geochronology, Petrology, Geochemistry, and Sr–Nd–Hf Isotopes of Intermediate–Acidic Igneous Rocks. Lithos 2022, 424, 106763. [Google Scholar] [CrossRef]
- Chen, X.-D.; Li, B.; Yu, M.; Zhang, W.-D.; Zhu, L. Generation of Crystal-Rich Rhyodacites by Fluid-Induced Crystal-Mush Rejuvenation: Perspective from the Late Triassic Nageng (Sub-)Volcanic Complex of the East Kunlun Orogen, NW China. Chem. Geol. 2022, 599, 120833. [Google Scholar] [CrossRef]
- Liu, X.; Zhan, Q.-Y.; Zhu, D.-C.; Weinberg, R.F.; Wang, Q.; Xie, J.-C.; Zhao, Z.-D. Large Zircon Age Spans Record Multi-Stage History of Batholith Assembly: Insights from the Late Triassic Dongcuo Batholith in the Eastern Tibetan Plateau. J. Asian Earth Sci. 2022, 231, 105220. [Google Scholar] [CrossRef]
- Sepidbar, F.; Mirnejad, H.; Ma, C.; Moghadam, H.S. Identification of Eocene-Oligocene Magmatic Pulses Associated with Flare-Up in East Iran: Timing and Sources. Gondwana Res. 2018, 57, 141–156. [Google Scholar] [CrossRef]
- Honarmand, M.; Rashidnejad Omran, N.; Neubauer, F.; Hashem Emami, M.; Nabatian, G.; Liu, X.; Chen, B. Laser-ICP-MS U–Pb Zircon Ages and Geochemical and Sr–Nd–Pb Isotopic Compositions of the Niyasar Plutonic Complex, Iran: Constraints on Petrogenesis and Tectonic Evolution. Int. Geol. Rev. 2014, 56, 104–132. [Google Scholar] [CrossRef]
- Ma, X.; Xu, Z.; Chen, X.; Meert, J.G.; He, Z.; Liang, F.; Ma, S. The Origin and Tectonic Significance of the Volcanic Rocks of the Yeba Formation in the Gangdese Magmatic Belt, South Tibet. J. Earth Sci. 2017, 28, 265–282. [Google Scholar] [CrossRef]
- Wei, Y. The Geochronology, Geochemistry and Petrogenesis of the Volcanic Rocks of Yeba Formation, Southern Tibet. Master’s Thesis, China University of Geosciences, Beijing, China, 2014; pp. 1–59. [Google Scholar]
- Razique, A. Magmatic Evolution and Genesis of the Giant Reko Diq H14-H15 Porphyry Copper-Gold Deposit, District Chagai, Balochistan-Pakistan. Master’s Thesis, University of British Columbia, Vancouver, BC, Canada, 2013. [Google Scholar]


| Deposit | Type | Tonnage(Mt) and Grade | Zircon Count | Fertility |
| GangdeseBelt | ||||
| Xiongcun | Cu-Au | 874, Cu: 2.96 @0.34%, Au: 218.4t @0.25g/t | 283 | Fertile |
| Qulong | Cu-Mo | 2200, Cu: 8 @0.3–0.6%, Mo: 0.03–0.06% | 97 | Fertile |
| Jiama Jiru | Cu-Mo | 1055, Cu: >5 @1.16%, Mo: 0.024% | 77 | Fertile |
| Cu-Mo | 42, Cu: 0.18 @0.43% | 32 | Fertile | |
| Lakang’e Zhunuo Demingding Chongjiang | Mo-Cu | Cu: >0.1, Cu: 0.13–0.49% | 37 | Fertile |
| Cu-Mo | 403, Cu: 2.3 @0.57% | 54 | Fertile | |
| Mo-Cu | Cu: >0.5 @0.26 %, Mo: >0.5 @0.14 % | 15 | Fertile | |
| Cu-Mo | 45, Cu: 0.18 @0.4%, Mo: 0.01 @0.02% | 28 | Fertile | |
| Dabu Luerma | Cu-Mo | 250, Cu: 0.5 @0.2%, Mo: 0.05 @0.02% | 15 | Fertile |
| Cu | Cu: 0.26% ~ 0.73%, Au: 1.2 ~ 37.7 g/t | 69 | Fertile | |
| \ | \ | \ | 485 | Barren |
| Bangong–Nujiang Belt | ||||
| Naruo | Cu | 578, Cu: 2.37 @0.41%, Mo: 104 @0.18% | 100 | Fertile |
| Guaguazi | Cu | \ | 35 | Fertile |
| Saidengnan | Cu-Au | \ | 11 | Fertile |
| \ | \ | \ | 214 | Barren |
| Ailaoshan–Red River Belt | ||||
| Yulong | Cu-Mo-Au | 1006, Cu: 6.24 @0.62%, Mo: 0.42 @0.04%, Au: 50.3t @0.05g/t | 118 | Fertile |
| Machangqing | Cu-Mo-Au | Cu: 0.25 @0.44%, Mo: 0.14%, Au: 0.06g/t | 65 | Fertile |
| Beiya | Au | Au: 323t @2.47g/t, Cu: 56.68 @0.52% | 170 | Fertile |
| Tongchang | Cu-Mo-Au | Cu: 37,958t @1.48%, Mo: 30,370t @0.218%, Au: 0.13–0.25g/t | 47 | Fertile |
| \ | \ | \ | 302 | Barren |
| Yidun–Zhongdian Belt | ||||
| Pulang | Cu-Au | 804, Cu: 446.8 @0.52%, Au: 0.18 g/t | 64 | Fertile |
| Relin | Cu-Mo | 6.6, Mo: 0.049% | 22 | Fertile |
| Xiuwacu | Mo-W | 6.6, Mo: 13,627t @0.34%, WO3: 8431t @0.28% | 74 | Fertile |
| Hongshan | Cu-Mo | 65.1, Cu: 0.64 @1.23 %, Mo: 5769t @0.03 % | 122 | Fertile |
| Tongchanggou | Mo-Cu | 142.5, Mo: 0.3 @0.3 %, Cu: 34 kt @0.8% | 45 | Fertile |
| \ | \ | \ | 146 | Barren |
| Sahand–Bazman Belt | ||||
| Sungun | Cu-Mo | 850, Cu: 0.76 %, Mo: 0.01% | 45 | Fertile |
| Sar Cheshmeh | Cu-Mo | 1700, Cu: 0.65%, Au: 0.06 g/t, Mo: 0.03% | 103 | Fertile |
| Kuh-Panj | Cu | 100, Cu: 100 @0.21% | 18 | Fertile |
| Darreh-Zar | Cu-Mo | 283, Cu: 1.1 @0.38% | 1 | Fertile |
| Meiduk | Cu-Mo | 500, Cu: 0.86%, Mo: 0.007% | 2 | Fertile |
| \ | \ | \ | 104 | Barren |
| Chagai Belt | ||||
| Saindak | Cu-Au | Cu: 27Mt | 64 | Fertile |
| Reko diq | Cu-Au | Cu: 1.23Mt@0.41 %, Au: 59.3 t@0.22 g/t | 88 | Fertile |
| \ | \ | \ | 30 | Barren |
| Other Districts | ||||
| \ | \ | \ | 83 | Fertile |
| \ | \ | \ | 486 | Barren |
| Base Classifier | Selected Parameters | Cross-Validation Accuracy | Test Accuracy | AUC |
|---|---|---|---|---|
| XGBoost | learning_rate = 0.3 min_child_weight = 3 n_estimators = 150 | 87.0% | 88.6% | 0.985 |
| Random Forest | min_samples_leaf = 1 min_samples_split = 2 n_estimators= 190 | 89.5% | 91.0% | 0.990 |
| DNN | Activation = tanh hidden_layer_sizes = (70,10,10) Solver = adam | 90.6% | 90.8% | 0.982 |
| Deposit | Sample | Lithology | Prediction (0-Barren; 1-Fertile) | ||
|---|---|---|---|---|---|
| RF | XGBoost | DNN | |||
| Saricayiryayla Porphyry Cu-Mo | 18UD08-2 | Granite | 0 | 0 | 1 |
| 18MU03 | Granodiorite | 0 | 0 | 1 | |
| Halilaǧa Porphyry Cu-Mo | 18HA10-2 | Andesite | 1 | 1 | 1 |
| 18HA02-1 | Rhyodacite | 0 | 0 | 0 | |
| 18HA03 | Streatted Lava | 0 | 0 | 0 | |
| 18HA06-1 | Dacite | 1 | 1 | 1 | |
| 18HA04-1 | Feldsparphyric Rock | 1 | 1 | 1 | |
| 18HA05-1 | Andesite | 0 | 0 | 0 | |
| Kisladaǧ Porphyry Au | 18US12-3 | Trachyandensite | 0 | 0 | 1 |
| 18US10-1 | Andesite | 1 | 1 | 1 | |
| 18US08-1 | Andesite | 1 | 1 | 1 | |
| 18US09-1 | Dacite | 0 | 0 | 0 | |
| 18US05-1 | Dacite | 0 | 0 | 1 | |
| 18US07-2 | Dacite | 0 | 0 | 1 | |
| 18US06-2 | Dacite | 1 | 1 | 1 | |
| Pınarbaşı Porphyry Mo-Cu | 18GD02-1C | Granite | 1 | 1 | 0 |
| 18GD07-5 | Granite | 1 | 1 | 1 | |
| 18GD02-1D | Mafic Enclave | 0 | 0 | 0 | |
| 18GD04-3 | Monzonite | 1 | 0 | 0 | |
| 18GD06-2 | Granite | 0 | 1 | 0 | |
| Type | Precision | Recall | F1-Score | Support |
|---|---|---|---|---|
| Au-Rich | 0.80 | 0.84 | 0.82 | 19 |
| Cu | 0.95 | 0.95 | 0.95 | 22 |
| Cu-Au | 1.00 | 0.80 | 0.89 | 10 |
| Cu-Mo | 0.80 | 0.67 | 0.73 | 18 |
| Cu-Mo-Au | 0.86 | 0.93 | 0.89 | 45 |
| Mo-Rich | 0.88 | 0.88 | 0.88 | 16 |
Disclaimer/Publisher’s Note: The statements, opinions and data contained in all publications are solely those of the individual author(s) and contributor(s) and not of MDPI and/or the editor(s). MDPI and/or the editor(s) disclaim responsibility for any injury to people or property resulting from any ideas, methods, instructions or products referred to in the content. |
© 2024 by the authors. Licensee MDPI, Basel, Switzerland. This article is an open access article distributed under the terms and conditions of the Creative Commons Attribution (CC BY) license (https://creativecommons.org/licenses/by/4.0/).
Share and Cite
Guo, J.; He, W.-Y. Application of Machine Learning to Characterize Metallogenic Potential Based on Trace Elements of Zircon: A Case Study of the Tethyan Domain. Minerals 2024, 14, 945. https://doi.org/10.3390/min14090945
Guo J, He W-Y. Application of Machine Learning to Characterize Metallogenic Potential Based on Trace Elements of Zircon: A Case Study of the Tethyan Domain. Minerals. 2024; 14(9):945. https://doi.org/10.3390/min14090945
Chicago/Turabian StyleGuo, Jin, and Wen-Yan He. 2024. "Application of Machine Learning to Characterize Metallogenic Potential Based on Trace Elements of Zircon: A Case Study of the Tethyan Domain" Minerals 14, no. 9: 945. https://doi.org/10.3390/min14090945
APA StyleGuo, J., & He, W.-Y. (2024). Application of Machine Learning to Characterize Metallogenic Potential Based on Trace Elements of Zircon: A Case Study of the Tethyan Domain. Minerals, 14(9), 945. https://doi.org/10.3390/min14090945