Article

Study of the Genesis Process and Deep Prospecting Breakthrough in the Gouli Ore Concentration of the East Kunlun Metallogenic Belt Using Audio Magnetotelluric Data

1
Qinghai Geological Survey, MNR Technology Innovation Center for Exploration and Exploitation of Strategic Mineral Resources in Plateau Desert Region, Xining 810000, China
2
School of Geophysics and Information Technology, China University of Geosciences, Beijing 100083, China
3
The Qinghai Third Nonferrous Metals Geological Exploration Institute, Xining 810012, China
*
Authors to whom correspondence should be addressed.
Minerals 2024, 14(9), 930; https://doi.org/10.3390/min14090930
Submission received: 10 July 2024 / Revised: 5 September 2024 / Accepted: 7 September 2024 / Published: 12 September 2024

Abstract

:
The East Kunlun Orogenic Belt is an essential part of the Qin-Qikun composite orogenic system, the most crucial orogenic belt in Qinghai Province, and an important gold ore-producing area in China. The Gouli gold field in its eastern section is one of the most important gold fields discovered in the belt in recent years. The Mailong mining area is an important gold mining area in the Gouli ore-concentrated area. The area has experienced frequent and intense magmatic activity, with intrusive rock bodies extensively exposed and intersected by a complex network of fault structures, providing excellent geological conditions for the formation of gold deposits. However, it is difficult to explore due to high altitude, poor transportation, and shallow coverage. This study used an audio magnetotelluric sounding method to track the deep direction and inclination of known mineral belts in the Mailong mining area, and identified mineral exploration targets, providing a basis for mineral exploration. Subsequently, a gold ore body was discovered through drilling verification, achieving a breakthrough in deep mineral exploration. The electromagnetic exploration method works well for exploring structurally altered rock-type gold deposits in plateau desert areas, and combined with the results of this electromagnetic exploration, a metallogenic geological model and genesis process of the Mailong mining area has been constructed.

1. Introduction

The East Kunlun Orogenic Belt is located in the northeastern part of the Qinghai-Tibet Plateau [1], stretching from the East Kunlun to the Elashan area in an east–west direction [2]. It is an important part of the Central Orogenic Belt [3]. The East Kunlun Orogenic Belt is cut diagonally by the Altyn Tagh tectonic belt in the west, connected to the western Qinling tectonic belt in the east, covered by the Qaidam Basin in the north, and connected to the Bayankela tectonic belt in the south [4]. From north to south, it is divided into East Kunlun North Terrane, East Kunlun South Terrane, and Bayankela Terrane, bounded by two suture belts of Middle Kunlun and South Kunlun [5]. The East Kunlun orogenic belt has experienced the evolution of four different tectonic cycles: the pre-Cambrian, early Paleozoic, late Paleozoic to early Mesozoic, and late Mesozoic to Cenozoic, with widespread distribution of intrusive rocks and volcanic rocks [6,7]. It has experienced the Proto-Tethys, Paleo-Tethys, and Neo-Tethys evolutionary processes from the Paleoproterozoic to the present [8,9,10,11], forming a large number of metal deposits composed of Au-Cu-Co-Ni-Fe-Pb-Zn polymetallic belts [12]. The unique geotectonic position, complex tectonic environment, frequent magmatic activities, and different degrees of metamorphism of the East Kunlun Orogenic Belt have resulted in a variety of metal mineralization types and rich mineral resources in the belt and other geological and tectonic environments control the formation and transformation of different kinds of mineral deposits. It is considered one of the important gold mineralization regions in the Tethys tectonic domain [13] and an essential potential base for mineral resources in China. Wulonggou and Gouli gold mines have been discovered successively, earning the reputation of the “Golden Belt of Qinghai Province” [14,15].
The Gouli ore-concentrated area in the eastern section of the East Kunlun metallogenic belt is one of the most important gold fields discovered recently; gold mineralization is closely related to regional magmatic–tectonic activity [16,17,18,19]. The Gouli ore-concentrated area is mainly related to the Au-Ag-Pb-Zn mineralization series associated with the Indosinian tectonic fluids [20]. A series of large and medium-sized gold deposits are represented by Mailong, Seri, Dareer, Guoluolongwa, Asha, Annage, Walega, Kengdenongshe, Delong, Nagekangqieer, and Luotuogou, with excellent mineralization geological conditions (Figure 1b) [21,22,23].
The Mailong mining area is one of the important mineral deposits discovered in the Gouli ore-concentrated area in recent years. However, it is located at a high altitude with complex topography and covered locations. These conditions have limited previous exploration methods. In the past, mineral exploration was mainly based on surface geological surveys and chemical anomalies, and the lack of deep mineral information slowed progress. To address this issue, AMT exploration was used to study mineral patterns controlled by tectonics and pinpoint areas for deeper exploration, resulting in significant mineral discoveries. The magnetotelluric method is currently one of the primary methods for exploration, and it is an indispensable way to study the structure of the crust and upper mantle from a conductive perspective [25,26]. At the same time, it is extensively used in connection with waste site exploration [27]. AMT observes the electrical structure within a depth range of tens of meters to several kilometers by observing the geomagnetic field signal’s audio frequency band (0.1 Hz~100 kHz). Due to its fast, efficient, and cost-effective advantages, with a considerable detection depth, it is widely used in mineral resource exploration and has achieved good results [28,29,30,31].

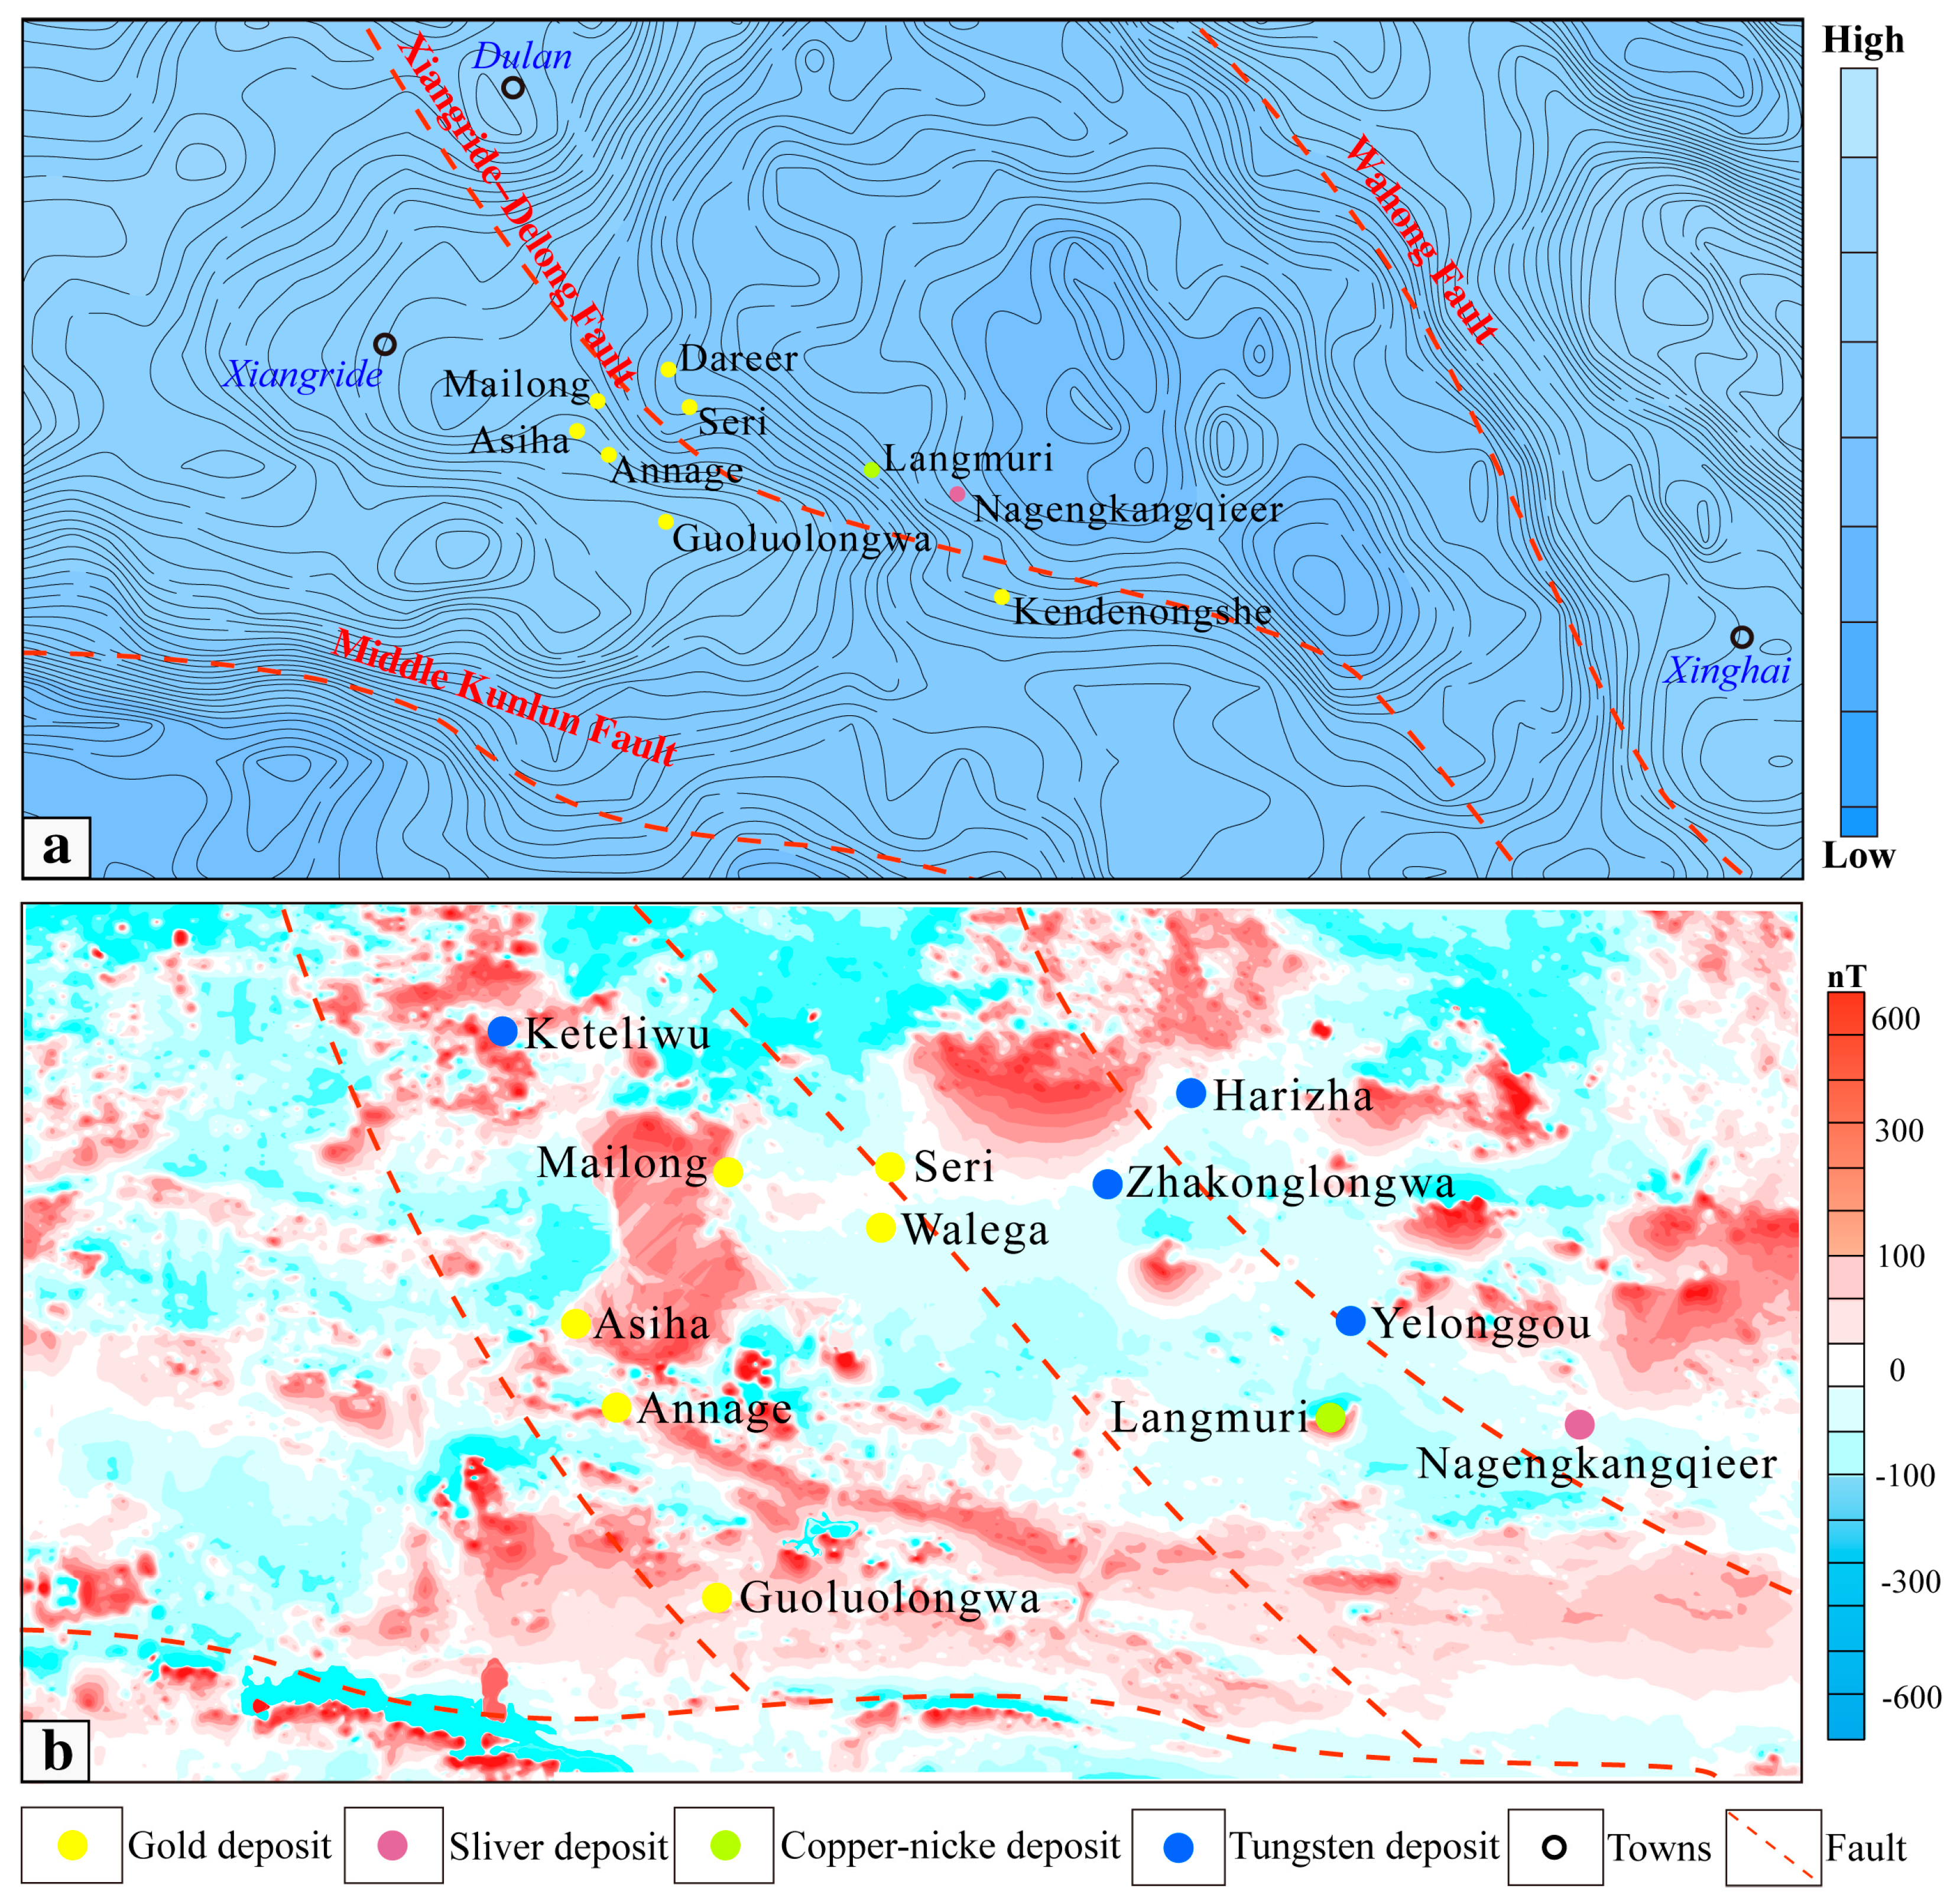
2. Geological and Geophysical Background

The Mailong gold mining area is located north of the Middle Kunlun fault, adjacent to the Dareer and Seri gold mining areas, with several ore deposit points such as Qiangkou nan and Asia distributed in the surrounding area. Due to the influence of frequent and intense magmatic activity, mainly during the Indosinian period–Hualixi period and the North Kunlun fault structure, the area is characterized by NNW and NE-oriented fault structures dominated by compression and pressure torsion (Figure 1c) [32,33]. The extensive exposure of intrusive rocks and the crisscrossing of fault structures in the area have created excellent geological conditions for mineralization [34]. The Mailong mining area extensively exposes intrusions of medium-acidic rocks, mainly Late Permian granodiorite and Middle Permian plagiogranite. Late Permian granodiorite is the most widely distributed rock in the mining area, with most of the ore-bearing alteration zones occurring within it, making it the main rock and ore-bearing rock of the area; Middle Permian plagiogranite is exposed in the eastern part of the mining area, consisting of rock masses and rock cores, with some tectonic fracture zones occurring within it. The main strata exposed internally are the Paleoproterozoic Jinshuikou group, mainly distributed in the eastern and northern parts of the mining area [21,33]. There are multiple different faults in the mining area, including those trending nearly east–west and north–northeast [21]. The nearly east–west structures are regional structures related to early mineralization and control the distribution of strata and magmatic rocks in the area, serving as important ore-controlling structures. The north–northeast structures are secondary structures characterized by thrust faults with multiple periods of activity. These secondary structures often cut through ore bodies and are the main structures for ore guidance and hosting in the area.
Due to the varying levels of geophysical work, the study area currently has a Bouguer gravity anomaly map at a scale of 1:1,000,000 and a high-precision magnetic anomaly map at a scale of 1:50,000, which means they cover different areas and reflect different scales of fault structures (as shown in Figure 2a,b). The Bouguer gravity anomalies mainly reflect the large structural features in the region, while the magnetic anomalies primarily reflect secondary structures.
The 1:1,000,000 Bouguer gravity anomaly in the eastern section of the East Kunlun is characterized by a steeply variable gravity gradient zone with a width of 30–40 km and the main body spreading in the NWW direction, and the distribution of this zone coincides with the Middle Kunlun fault belt, which is an important tectonic unit boundary fault. The Xiangride-De Long fault is mainly characterized by a dense Bouguer gravity anomaly gradient zone trending northwest, which is an important controlling structure for mineral deposits across the Gouli mining deposit area. The Gouli mineral deposit area is located on a dense Bouguer gravity anomaly gradient zone, which trends in a northwesterly direction and exhibits the characteristic of being denser in the north and looser in the south (Figure 2a). The widespread presence of the basement tectonic layer from the Archean to the Proterozoic is an important reason for this area’s high regional gravity anomaly.
The magnetic anomaly in the research area is manifested as a high-intensity anomaly band extending from east to west. The anomaly is continuous and strong, and positive and negative, indicating that the East Kunlun region is composed of multiple geological blocks extending from east to west. Deep major faults separate these blocks, and within these blocks are a large number of highly magnetic deep metamorphic rocks or basic-ultrabasic rock bodies. The Gouli area is located at the eastern end of the high-intensity magnetic anomaly zone, with characteristics of positive and negative anomaly gradient belts.
The high-precision magnetic survey conducted in the Gouli area at a scale of 1:50,000 shows that the distribution of abnormal morphological features in the region is partitioned (Figure 2b). The intensity of magnetic anomalies is closely related to regional strata, magmatic rocks, and structures. The magnetic anomalies are distributed in bands or blocks on the plane, with extension directions consistent with the distribution of strata, magmatic rocks, and regional structural lines. In most areas, the amplitude of magnetic anomalies is low, with several high magnetic anomalies related to medium-acidic intrusive rock bodies. The discovered gold and lead–zinc ore deposits such as Mailong, Guoluolongwa, Walega, and Kengdenongshe are mainly distributed in the transition zone of positive–negative magnetic anomalies in the area near the positive magnetic anomaly belt.

3. Data Collection, Processing, and Analysis

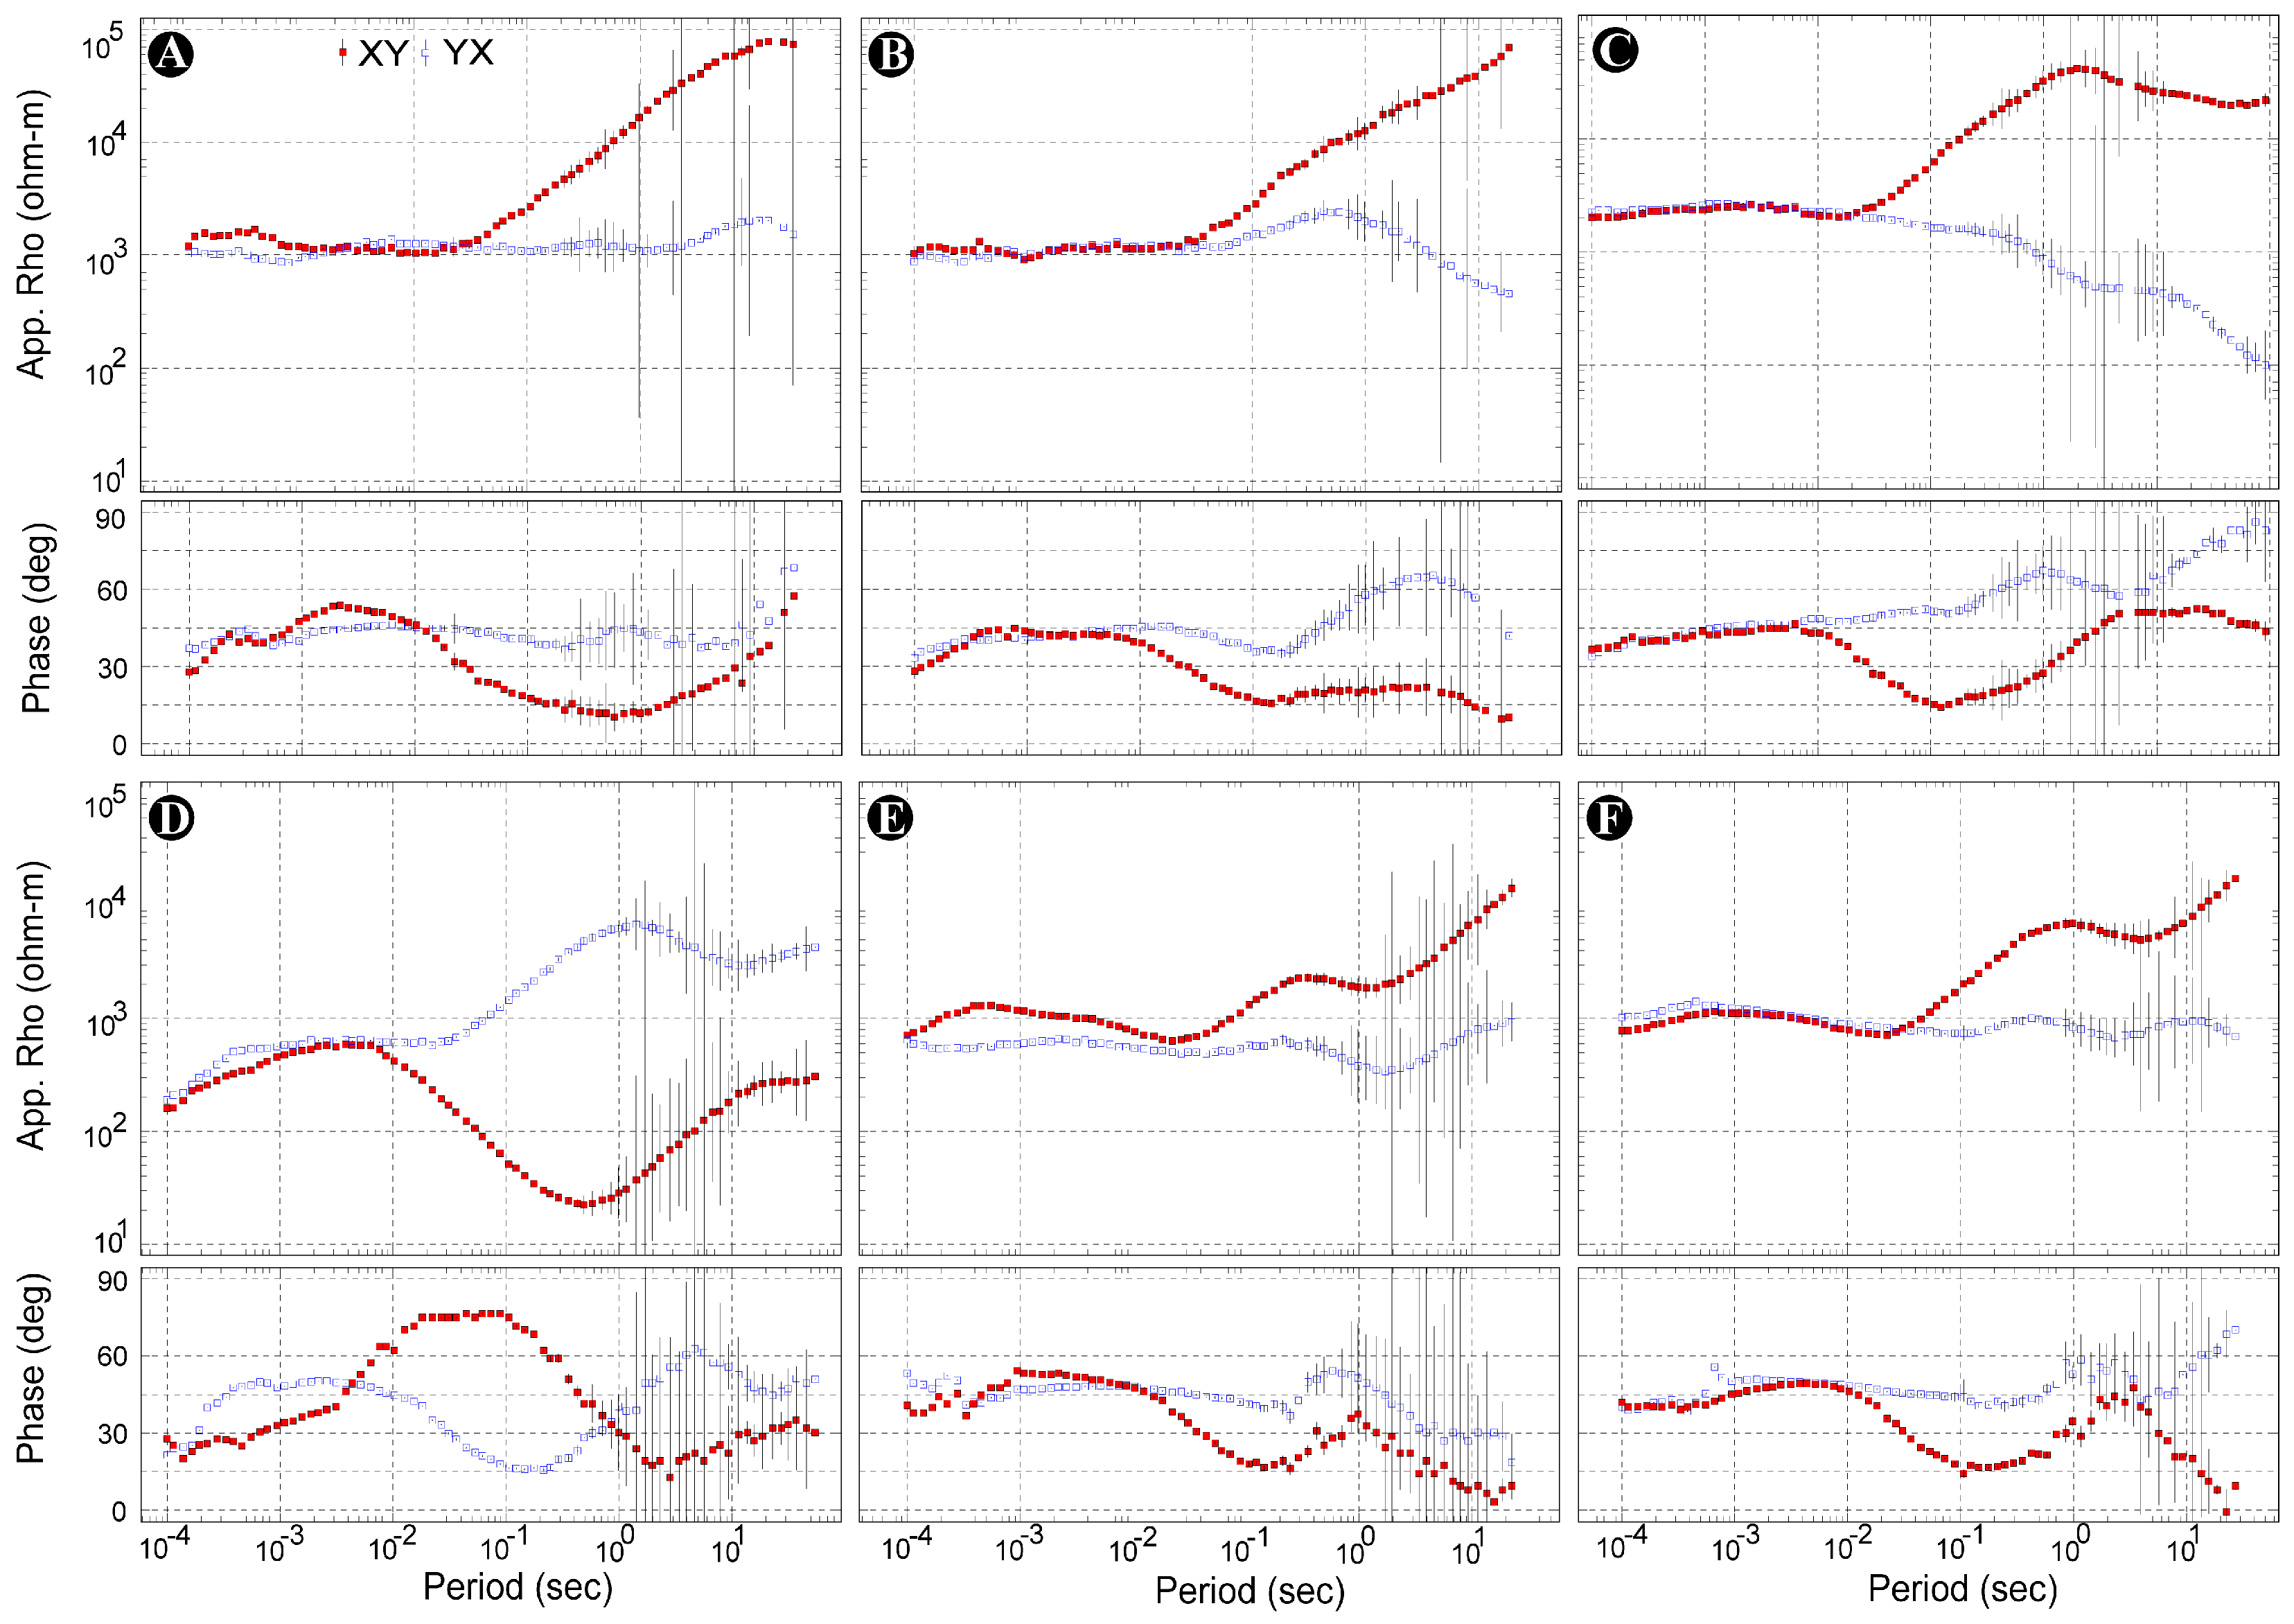
3.1. AMT Data Acquisition and Processing
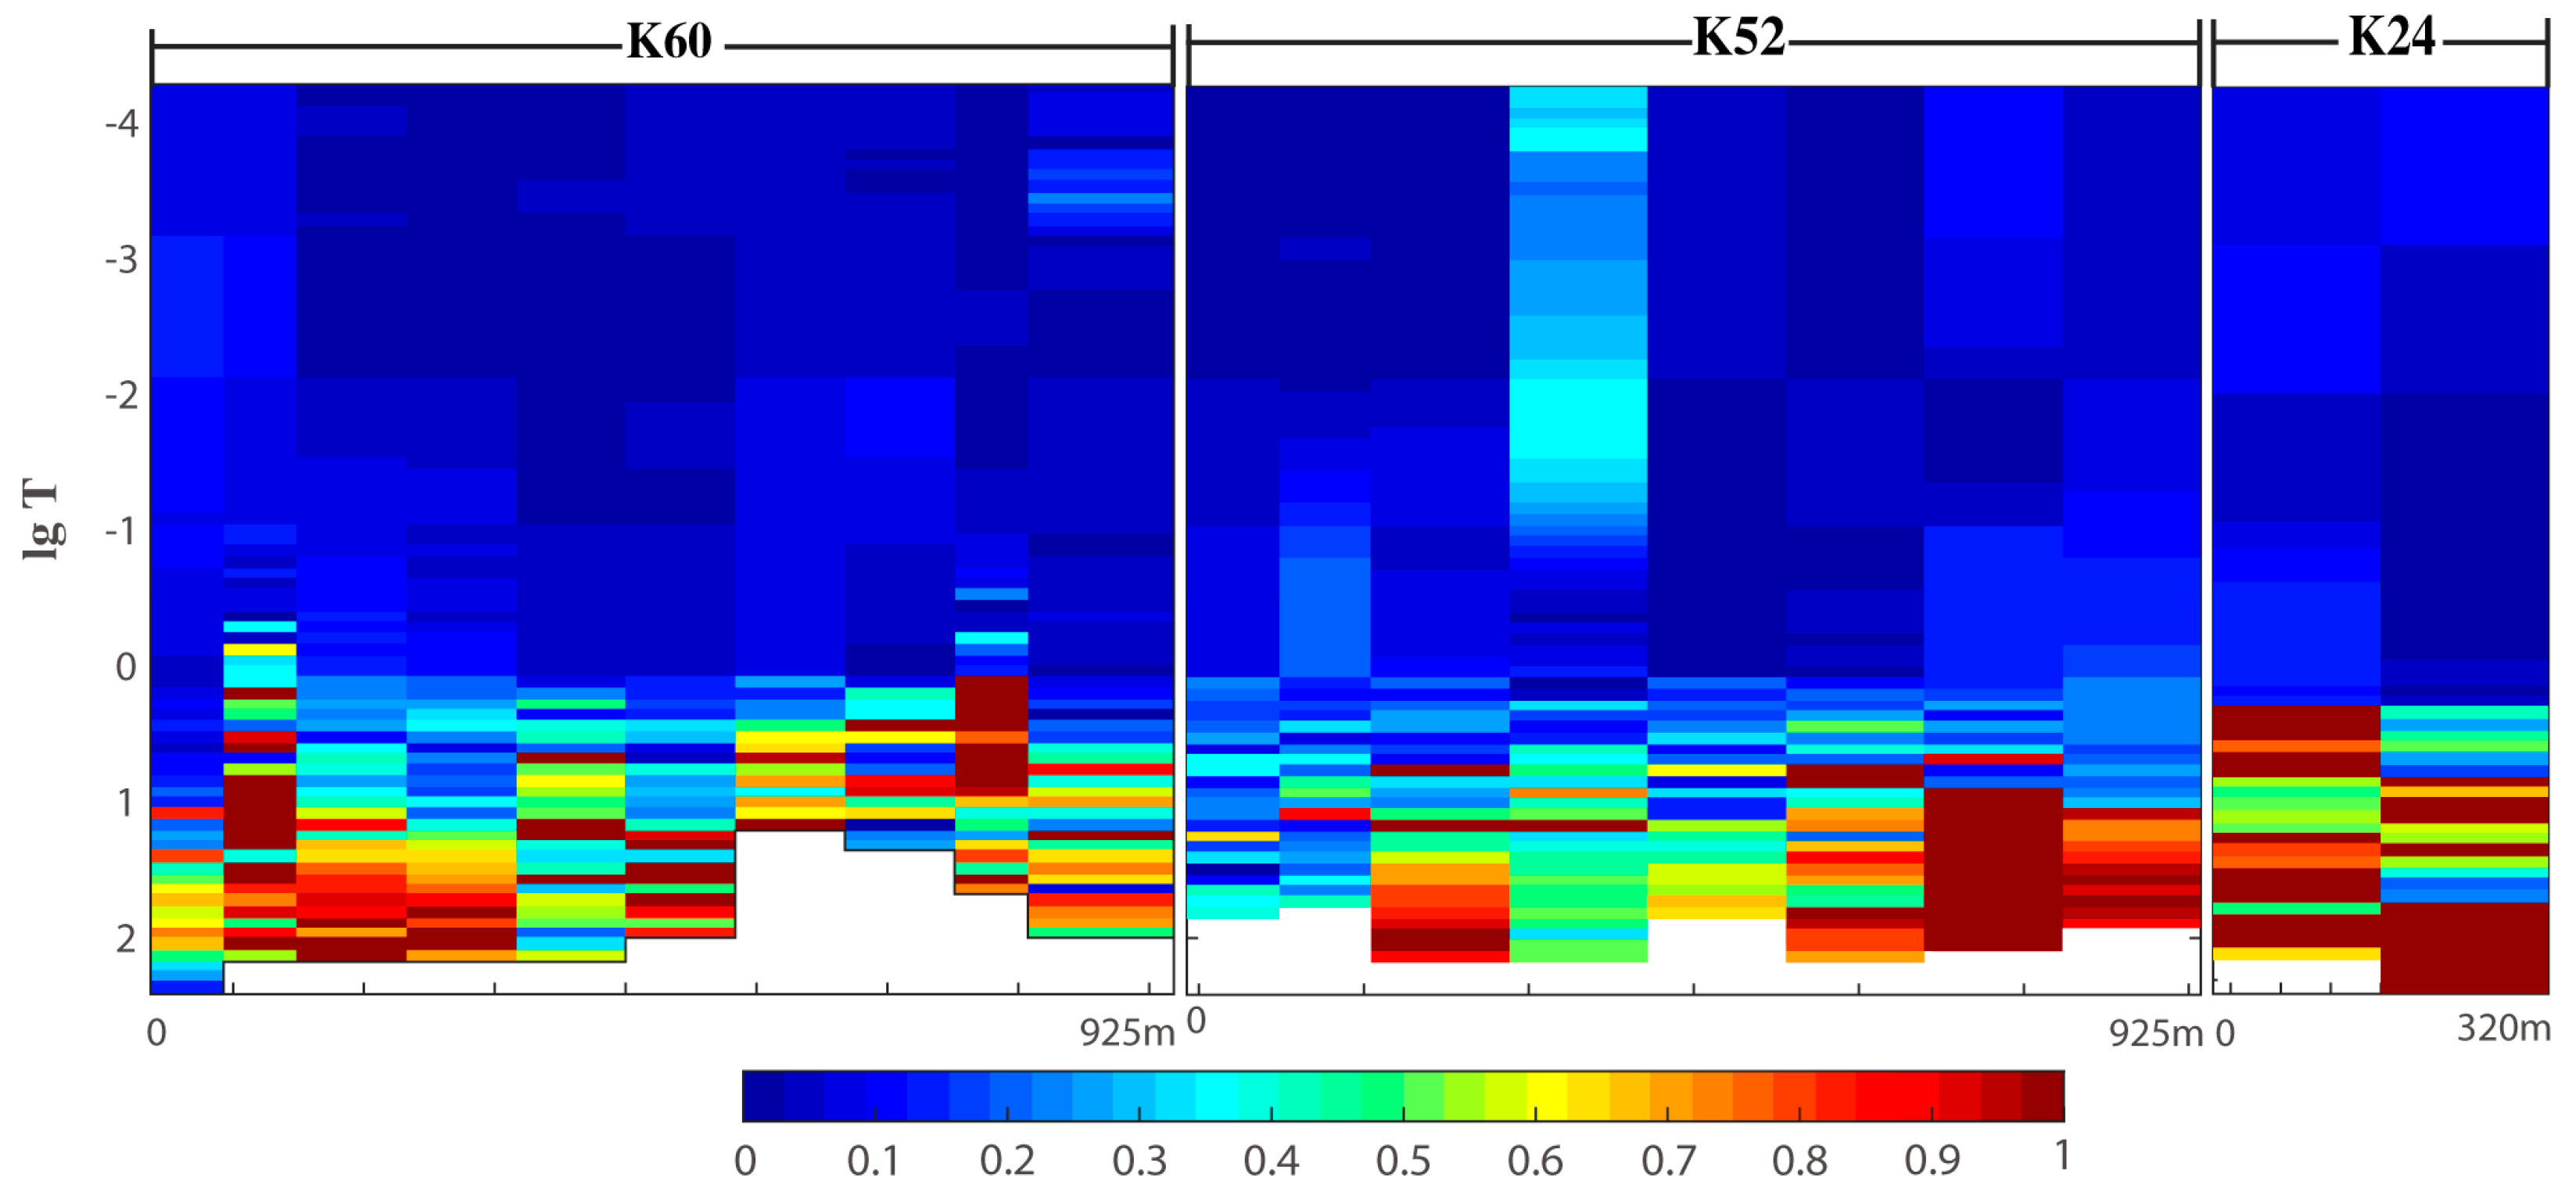
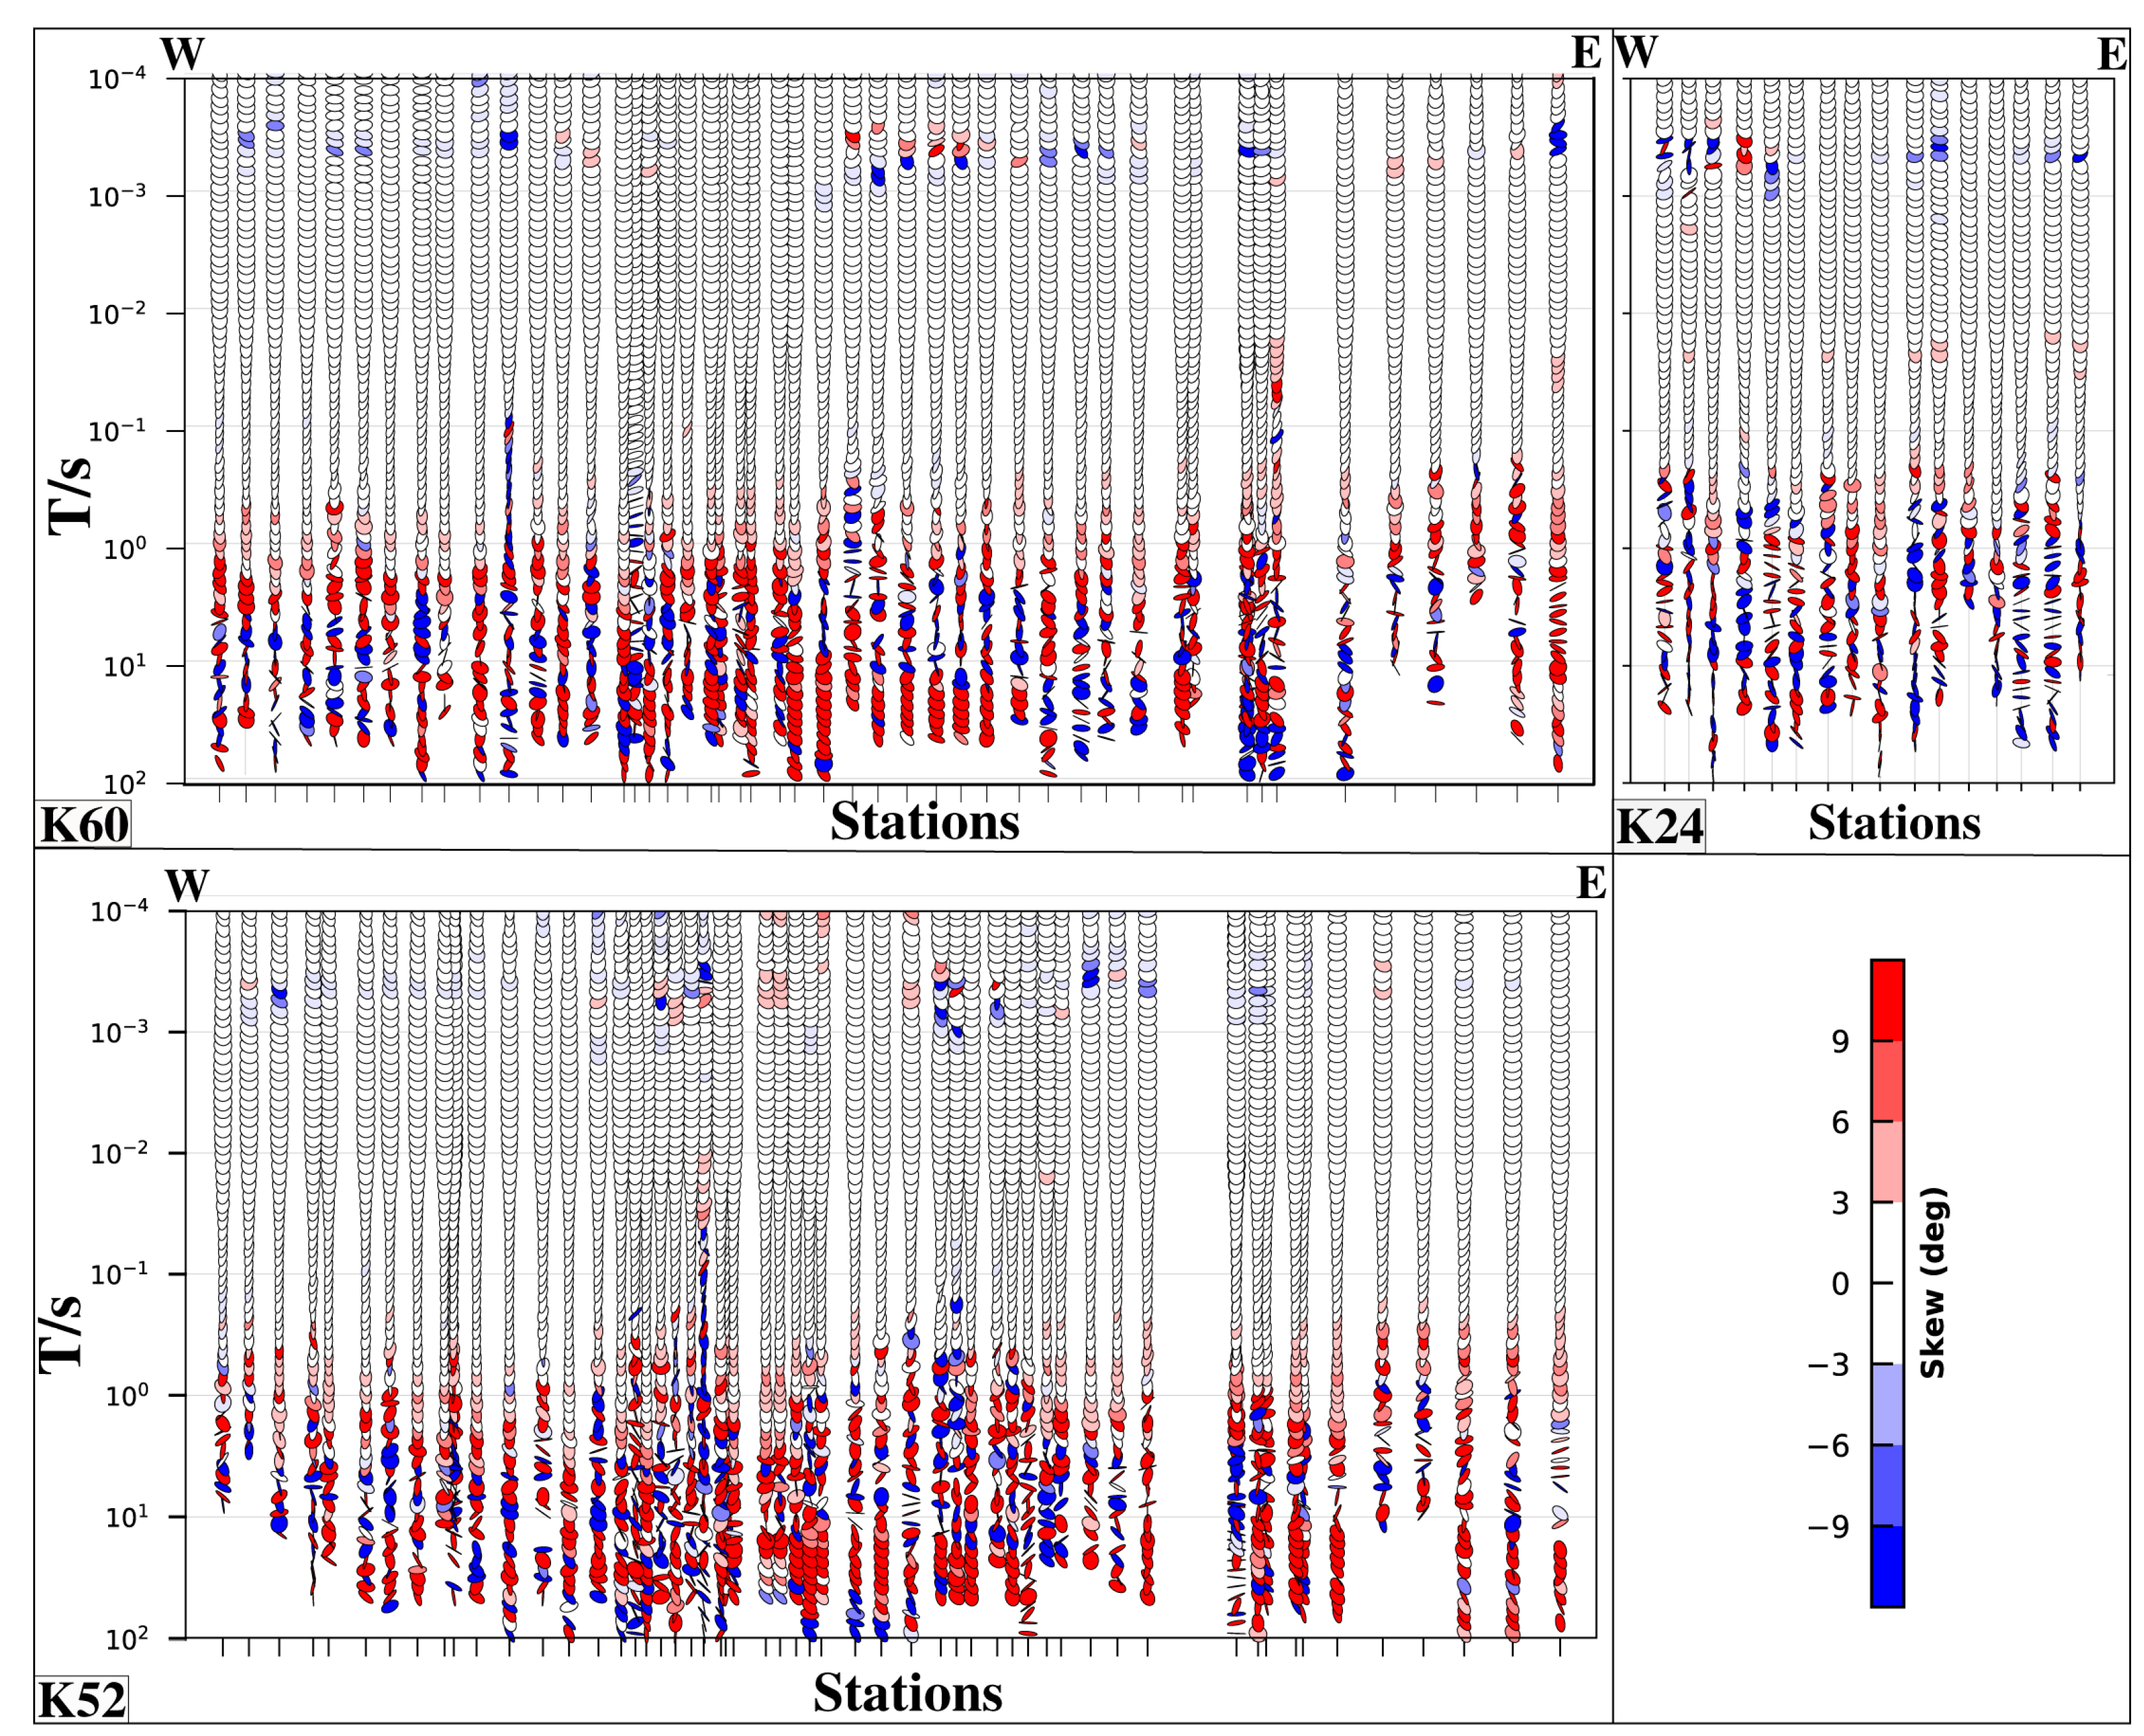
Based on the fundamental principle of EM field propagation, the penetration depth of an electromagnetic signal is directly related to the square root of its frequency. The MT technique records a series of naturally occurring electromagnetic signals on the earth’s surface to investigate the resistivity structure of the lithosphere [35]. The AMT data used in this study were collected in 2023 by the Qinghai Geological Survey. The average station spacing is ~20 m and ~10 m for the focus area. Polarization is defined with true north as the positive x-axis and east as the positive y-axis. Orthogonal Ex, Ey electric field components and Hx, Hy magnetic field components were recorded at each station.
The AMT profiles (K60, K52, K24) were oriented perpendicular to the strike of the Au ore belts (the black dots in Figure 1c). Data from a total of 123 AMT stations were collected in this study. AMT data observations were recorded at all stations using MTU-5C instruments from Phoenix-Geophysics, Toronto, Canada. At least 1 h of time series data were collected at each station, which were then converted into transfer functions for period ranges from 0.0001 to 10 s.
The data were processed using EMPower software (v2.21.0). The remote referencing technique [36] and Robust estimation [37] were applied at each station. The power spectral density was meticulously analyzed, and data from interference time intervals were eliminated. Despite many mines and considerable human interference in the study area, these technical measures enhanced data processing quality (as shown in Figure 3).

3.2. Data Analysis

Before inverting the data, dimensionality analysis was conducted to accurately identify the subsurface structures’ dimensionality. The skew parameter proposed by Bahr [38] can be used to determine whether EM data satisfy the two-dimensional assumption, which is less affected by the distortion effect of the electromagnetic field. The EM data can be regarded as two-dimensional when the skew value is less than 0.3. At the same time, skew values greater than 0.3 may indicate there are three-dimensional structures in the subsurface. Figure 4 shows pseudo-sections of the Bahr skews, the shallow part of the four profiles exhibits an obvious two-dimensional structure, and the three-dimensional characteristics appear only in the deep part represented by the period 1 s. The profiles satisfy the two-dimensional assumption and can be investigated by two-dimensional inversion.
We also used the phase tensor to determine dimensionality. It is the most frequently employed method for dimensionality analysis and has the advantage of being independent of local electric field distortions [39].
The phase tensor is defined by the max phase angle, min phase angle, and skew angle and is shown by the ellipse’s major and minor axes and color. If the skew angle is less than 3°, the subsurface medium can be regarded as a two-dimensional structure [40]. In general, the ellipse’s major or minor axis represents the direction of the structure, and when the ellipse becomes a circle, the subsurface medium is considered to be one-dimensional.
Figure 5 shows the results of phase tensor analysis for all periods of the three profiles. The skew angles are mostly less than 3°, with some even less than 1°, having equal major and minor axis lengths, suggesting a two-dimensional structure in the shallow portion, with some stations showing one-dimensional characteristics. Only in the last periods (1 s) do many stations have skew angles more significant than 3°. This is consistent with the results of Bahr skews. In summary, the dimensionality of the study area is characterized mainly by 2D features, and a 2D inversion study should be carried out.
After confirming that the two-dimensional inversion is necessary through dimensionality analysis, it is essential to analyze the tectonic strike of the region, and only by rotating the EM data to the direction of the tectonic strike, can the EM data be decomposed into two groups of independent TE and TM polarization modes. The impedance tensor decomposition is widely used to determine the strike direction and remove galvanic distortion in EM data [41]. The rose diagrams in Figure 6 show the strike directions produced by the “strike” algorithm [42]. The strike angle calculated from tensor decomposition may have a 90° ambiguity, which can be solved with induction vectors and regional geological information. Thus, the blue and red wedges perpendicular to each other show two possible strike directions. Considering the results of the surface geological survey, the blue wedges are more consistent with the strike directions. A clearly defined angle of N15°E can be determined for all profiles, which is also consistent with the strike of Au ore belts. Finally, all EM data in profiles k60, k52, and k24 were rotated to the NE15° coordinate system for 2D inversion.

3.3. 2D Inversions

The 2D inversion uses the idea of multiple modes and multiple parameters combined for multiple 2D inversion trials. To include more data in the inversion and constrain the electrical model, joint inversions of TE + TM were performed using the nonlinear conjugate gradient (NLCG) inversion algorithm [43] integrated into the WinGLink software (2.20.01). AMT data in the period range of 0.0001–1 s were used in the inversion. The initial model was a uniform half-space with a resistivity of 100 Ωm. due to local conductive bodies that shift the apparent resistivity curves’ frequency independently but leave the phase curves unaffected [44]. The phase error floors for the TM and TE modes were set to 5%, and the TM resistivity error floor was set at 10%. The TE mode data are easily influenced by the “static shift” effect and the data are difficult to fit in inversion. Therefore, the resistivity error floor for the TE mode was set to 100% to reduce the impact of the static shift. Different regularization factor τ values are used for inversion. After 200 iterations, the final RMS misfit of profiles K60, K52, and K24 are 1.6147, 1.5042, and 1.4231, respectively.

4. Discussion and Interpretation

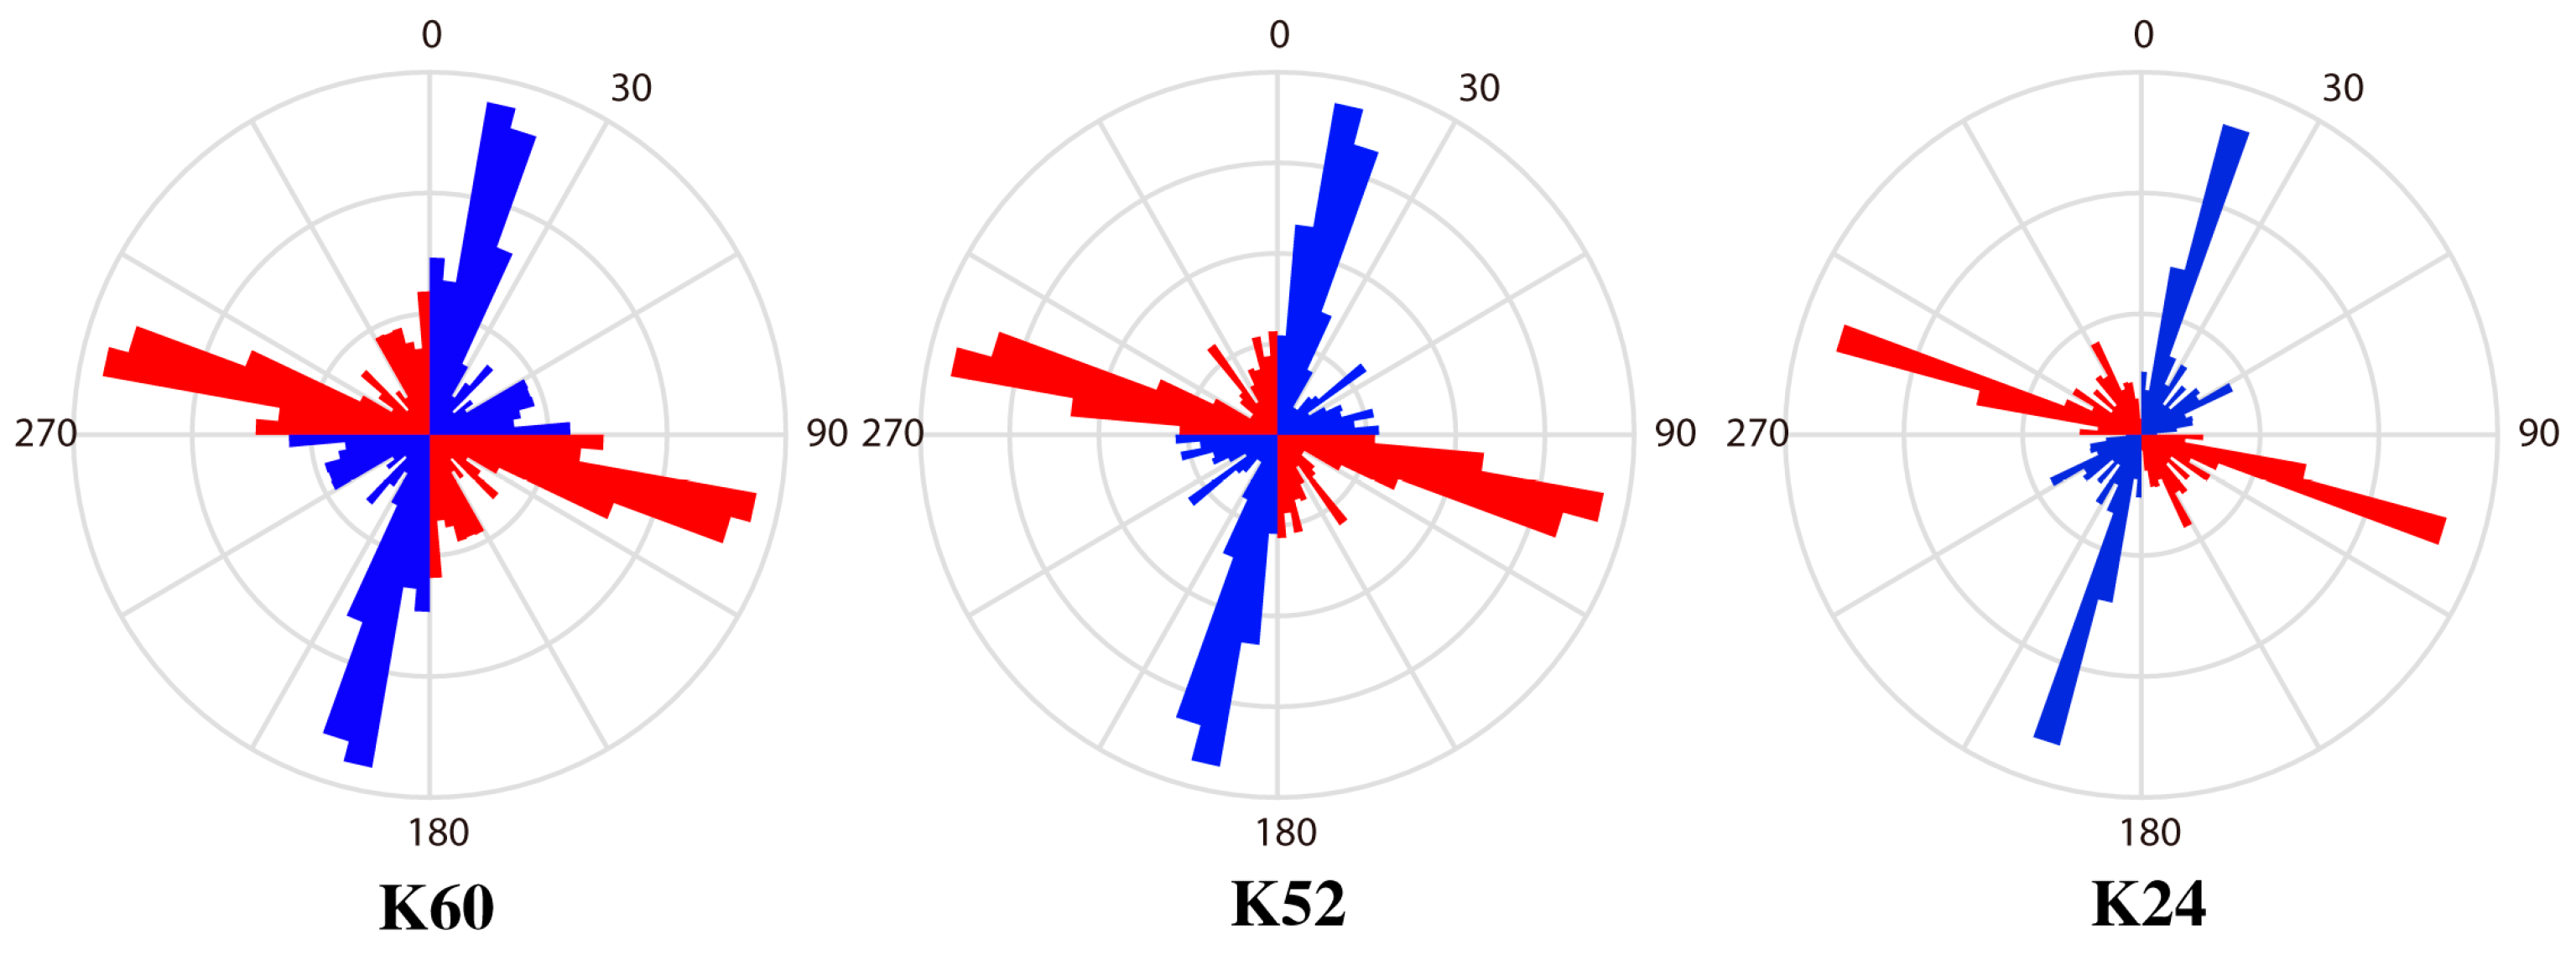
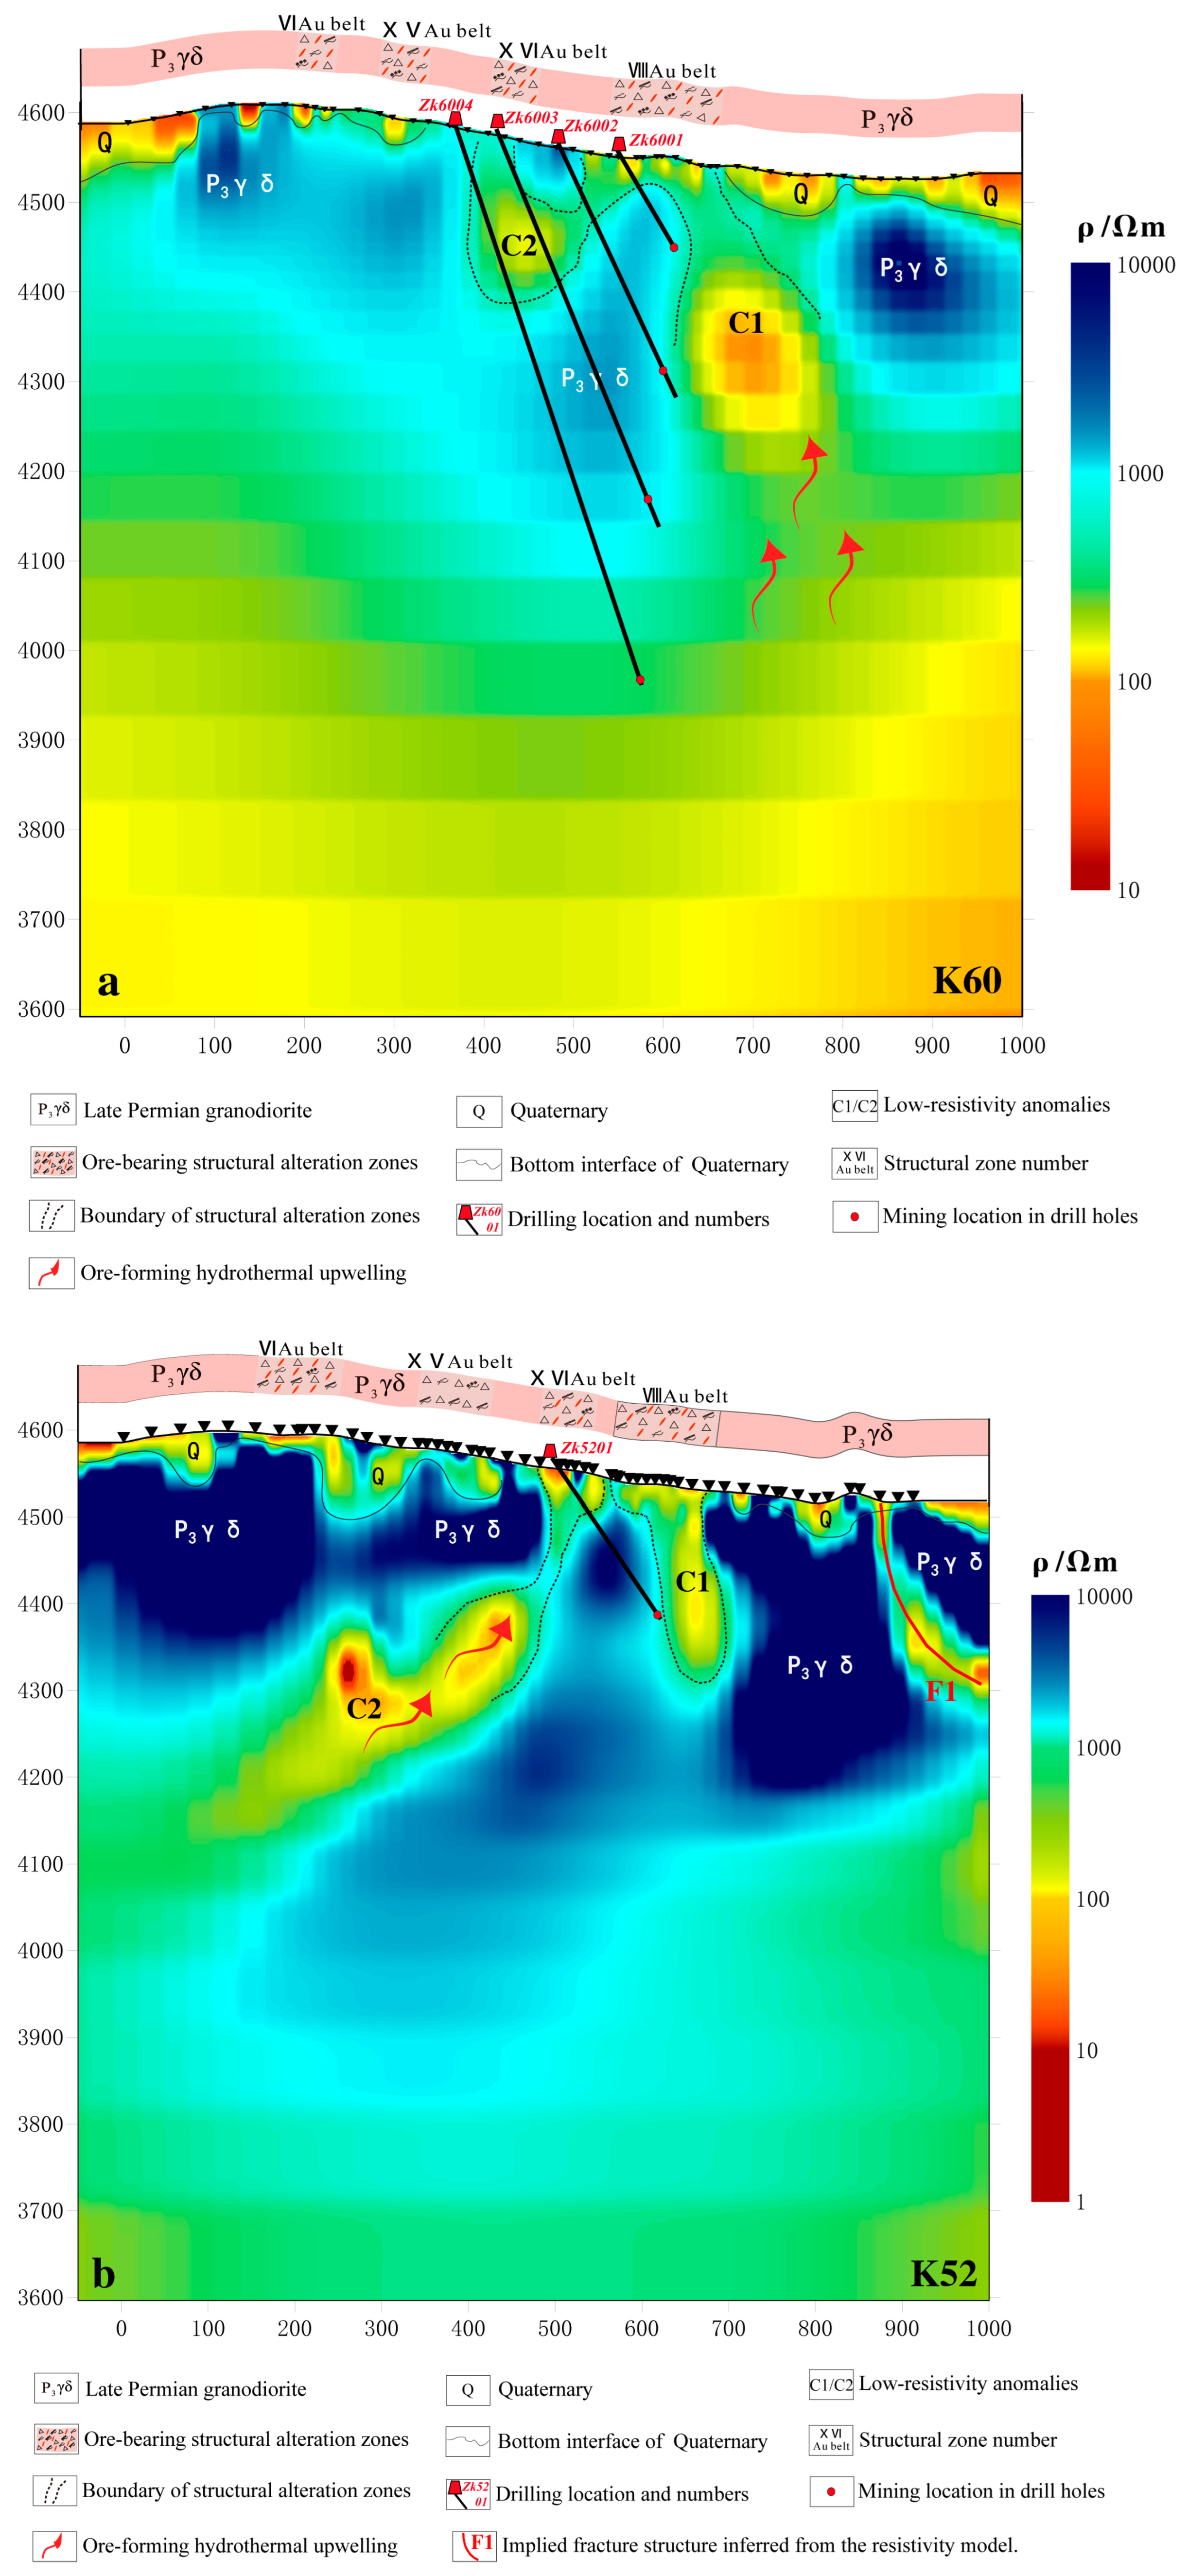
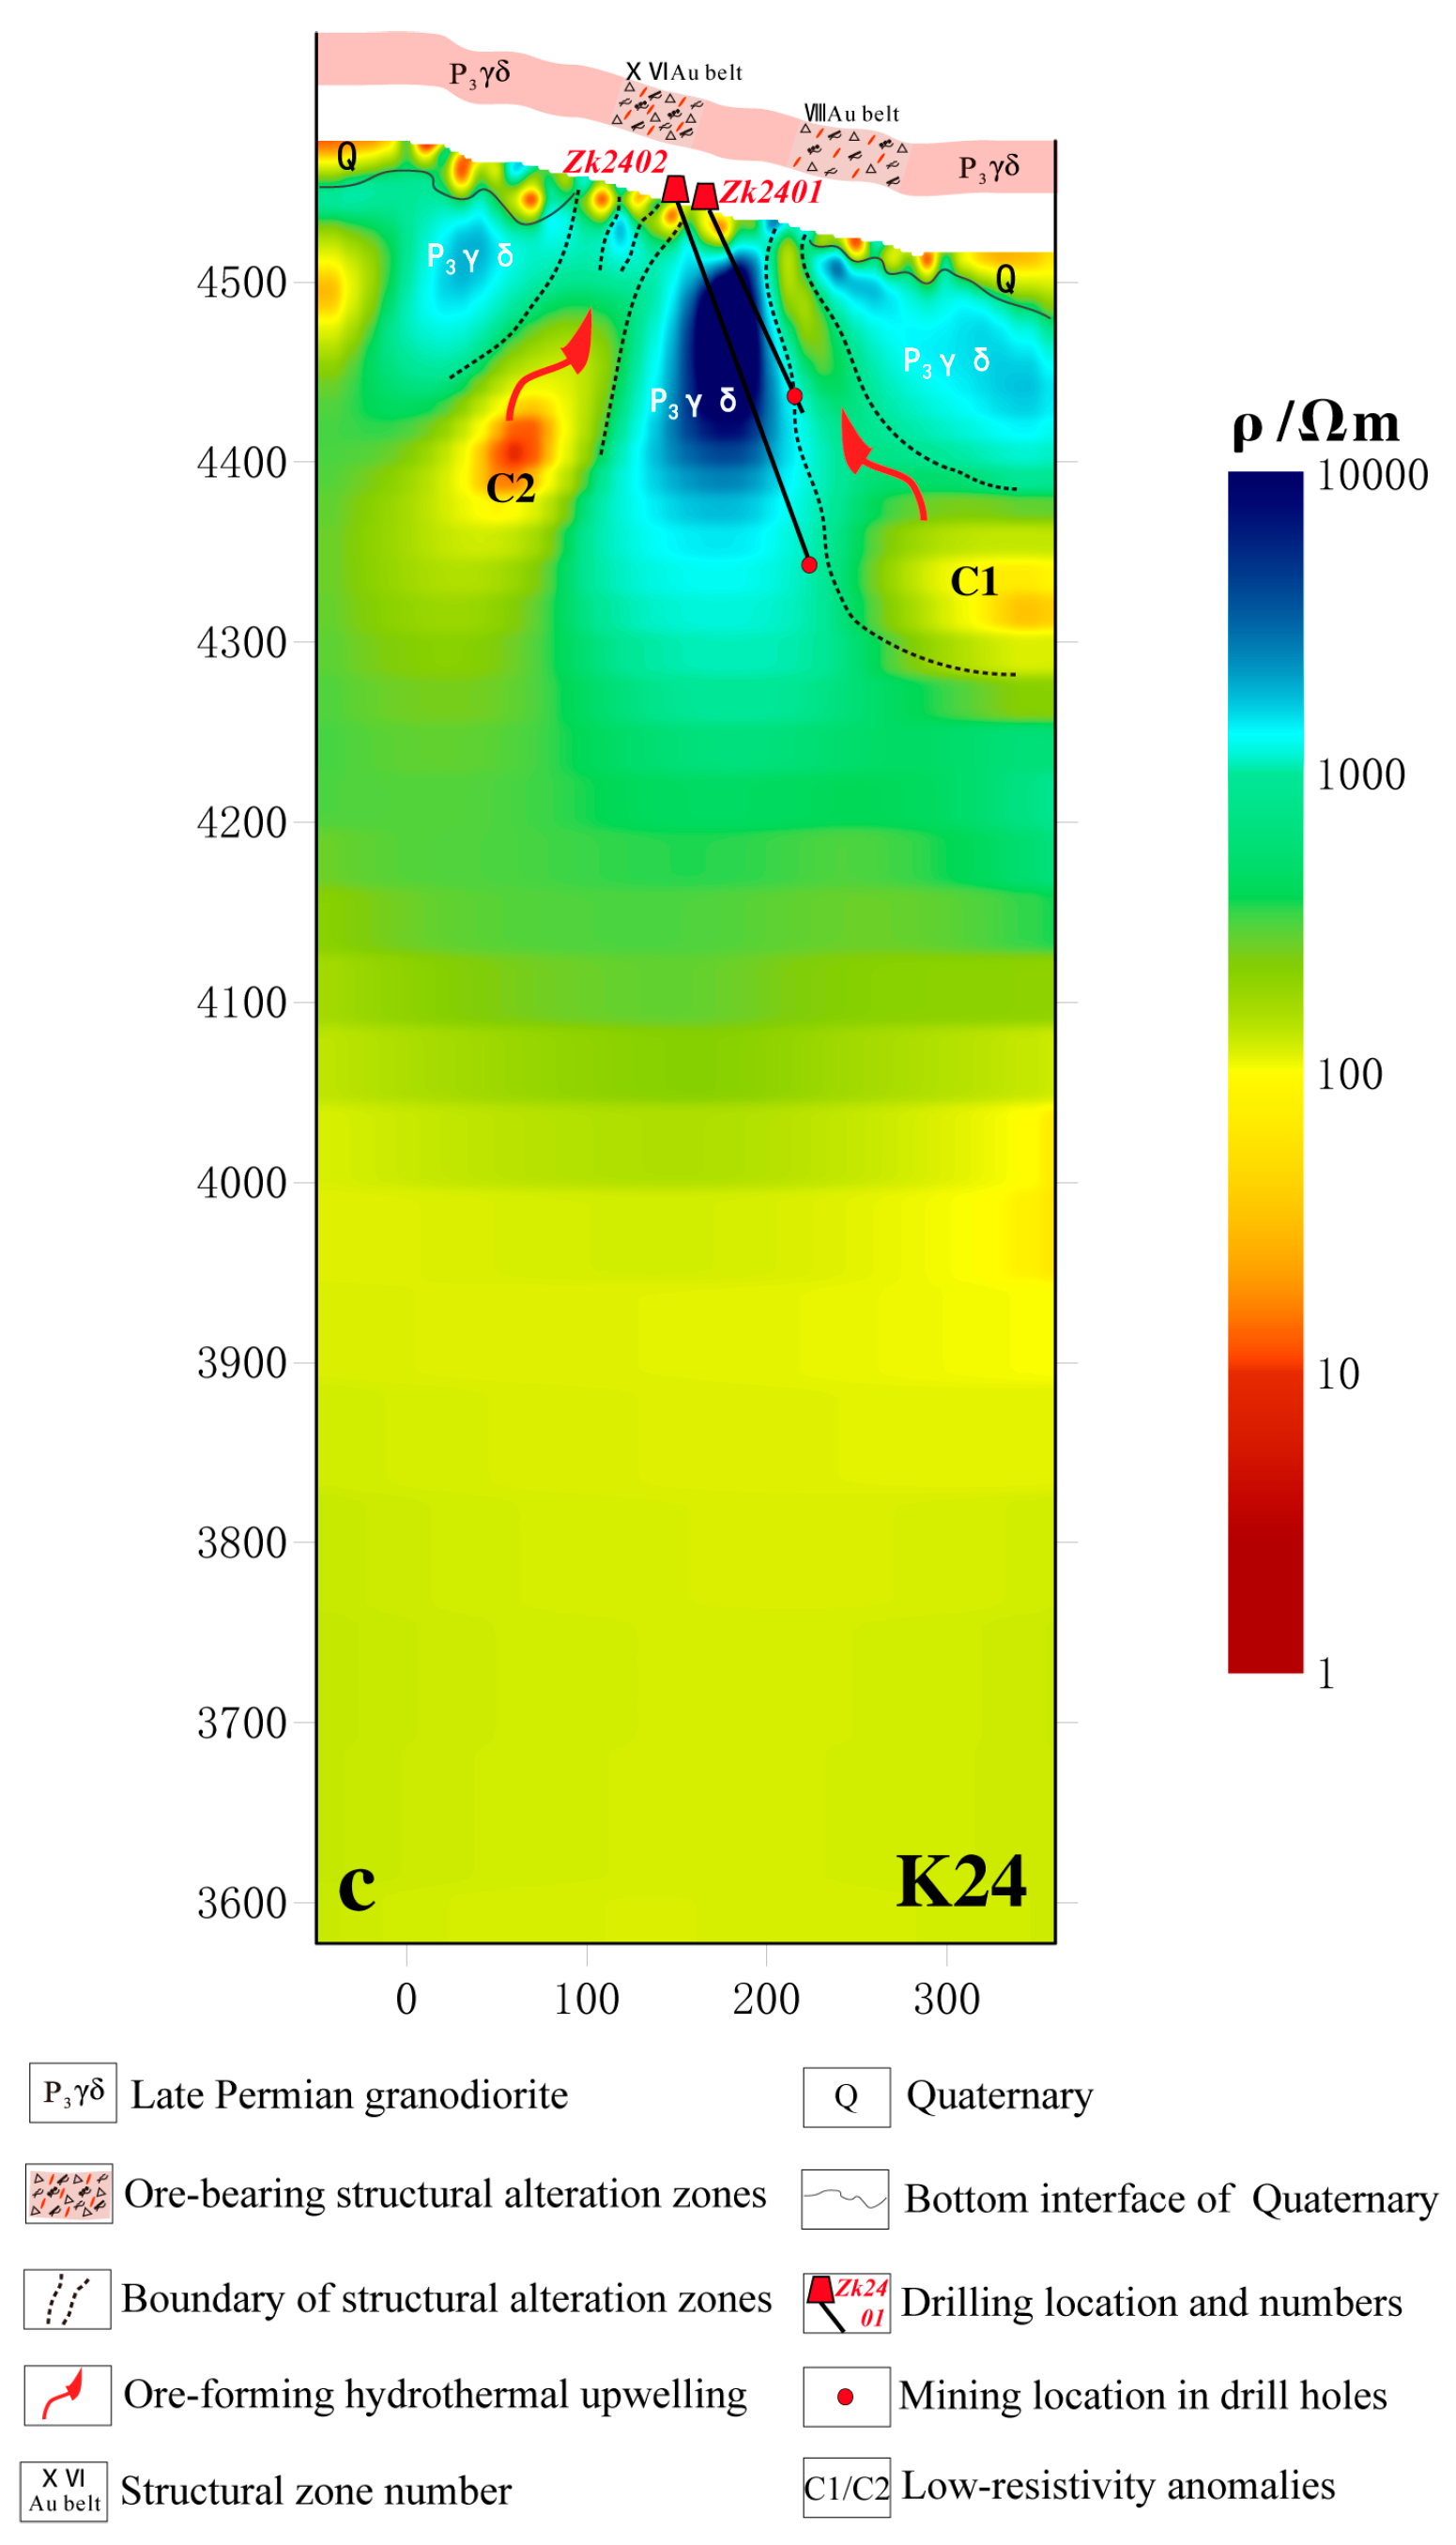
4.1. Electrical Structural Characteristics

The Mailong mining area has a complex geological structure, with fractured and heavily altered rock formations. There are localized areas of electrical heterogeneity near the shallow surface, providing the basis for this electromagnetic exploration to detect differences in physical properties. By applying precise static shift correction and 2D inversion with terrain data, 2D electrical models for the k60, k50, and k24 AMT profiles in the Miaolong mining area were obtained. The 2D resistivity model aligns well with the distribution of altered zones, rock formations, and faults identified in surface surveys, providing a clear and reasonable depiction of the main geological features and structures in the Miaolong mining area. Comparative studies between the inversion models and known geological structures show that the model can reasonably reflect the actual geological layers and structures.
The K60 profile corresponds to the No.60 exploration line of the Mailong mining area, and the final 2D electrical interpretation model is shown in Figure 7a. The model exhibits a “lateral block, vertical layering” characteristic. Vertically, it can be roughly divided into three layers: a near-surface low-resistivity layer of 5–50 m, a high-resistance layer of 50–800 m, and a deeper low-resistivity layer. The resistivity shows a trend from low to high to medium-low from shallow to deep. The near-surface of the Mailong mining area consists of Quaternary alluvial and residual slope deposits with developed soil layers, abundant vegetation root systems, and relatively thin layer thickness with low resistivity, indicating that the first electrical layer corresponds to the Quaternary cover layer. The second electrical layer is generally thicker, with higher resistivity values typically above 2000 Ωm, comprising mainly of medium-acidic intrusive rocks from the Galidong and Hualixi periods, dominated by granite and diorite, and exhibiting high resistivity. At a depth of around 1000 m, it shows low resistance characteristics. The electrical model is mainly characterized by high-resistivity blocks being intersected by gradient zones of medium to low resistivity. Based on geological data, these shallow electrical gradient zones correspond to known fault structures. The ore-bearing alteration zones in the mining area are mainly strip-like, vein-like, and veinlet-like, mainly occurring in the northeast direction in diorite granite, and are relatively dense with clustered distributions. The related gold ore bodies are all distributed within the alteration zones. Therefore, the low-resistivity and relatively low-resistivity electrical gradient separation zones in the profile reflect the regional structural discontinuity zones formed during early tectonic movements, which are the main controlling structures for ore deposits in the area. This profile runs from west to east, showing multiple low-resistivity zones at 200–220 m, 290–310 m, 400–430 m, and 520–650 m. These low-resistivity anomalies correspond to the four major ore-bearing structural alteration zones (Au VI, Au XV, Au XVI, and Au VIII), mainly discovered through surface surveys and engineering disclosures. However, the low resistivity anomalies corresponding to the ore-bearing structural alteration zones Au VI and Au XV are quite small in scale, with a depth extension of only 20–30 m. Combined with exploration data, the surrounding rock structures in the study area are composed of intermediate-acidic magmatic rocks from the Hualixi period and Precambrian metamorphic rock enclaves. These exhibit primarily high resistivity in terms of electrical properties. At the same time, the mineralized bodies, mainly composed of sulfide-bearing quartz veins filling structural fractures, primarily display low resistance in terms of electrical properties. Considering the geological background of the mining area, rock, and ore electrical properties, it is inferred that the Au VI and Au XV ore zones have a small-scale deep level, with only small low-resistivity anomalies present at the surface. This corresponds with results revealed by surface trench exploration. The Au XVI zone is next in importance but extends only about 200 m. Au VIII has the largest scale, displaying clear low-resistivity anomalies in the deep levels (as shown in Figure 7a(C1)), indicating significant exploration potential and space. Consequently, four boreholes were deployed to verify the deep-level extension situation of the Au VIII zone, and the final verification results were consistent with the model’s inference.
The K52 profile corresponds to the No.52 exploration line of the Mailong mining area, and the final 2D electrical interpretation model is shown in Figure 7b. This model also exhibits a “lateral block, vertical layering” feature. Vertically, it can be roughly divided into a shallow low-resistivity layer of 5–50 m, a high-resistivity body from 50–900 m with resistivity reaching 10,000 Ωm, and below 900 m, a gradual transition to low-resistivity characteristics, showing a three-layer electrical feature of low–high–low to medium resistivity. The shallow low-resistivity anomaly is inferred to be Quaternary alluvial and residual slope sedimentary cover in the near-surface; the second electrical layer has an overall large thickness with high resistivity values, usually above 4000 Ωm. According to drilling results, this high-resistivity body consists of granites and diorites intruded during the Caledonian and Hercynian periods, mainly showing high resistivity characteristics. The electrical model mainly shows high-resistivity blocks distinctly cut by medium to low-resistivity gradient bands. From west to east in this profile, multiple low-resistivity bands exist at 180–220 m, 350–400 m, 480–520 m, and 600–650 m. These four low-resistivity anomalies correspond to the main ore-bearing structural alteration zones of AuVI, Au XV, AuXVI, and AuVIII, as found in surface surveys and engineering exposures. The ore-bearing alteration zones in this mining area mainly occur in band-like, vein-like, and thin-vein-like forms in the northeastern direction in diorite granite, appearing densely and in clusters within the alteration zones. The related gold ore bodies are all distributed within these alteration zones. Therefore, this profile’s low-resistivity and relatively low-resistivity gradient bands reflect the internal structural fault zones and are distinct characteristics of “terminal” ore-bearing structures, with varying depths of different structural fractured alteration zones. In Line 52, the deep extension scale of the AuXVI ore zone is significantly larger than in Line 60, showing clear low-resistivity anomalies in deep parts connected to near-surface low-resistivity trends, hinting at a channel for ore-bearing hydrothermal upwelling based on the ore-forming mechanism of structural altered rock-type gold deposits (shown in Figure 7b(C2)). On the other hand, the AuVIII ore zone in Line 52 is notably smaller than in Line 60 (shown in Figure 7b(C1)), with surface alteration of the AuVIII ore zone observed in early drill hole 5201 data but not extensively extending into deeper parts, aligning with the model’s speculation in this study. The inconsistency in the scale of the AuVIII ore zone over such a short distance indicates complex tectonic movements in the study area, leading to varied fault fracturing, multiple-stage alteration, and erosion, providing different mineralization spaces for hydrothermal activities, thereby suggesting that the ore bodies in the study area might have segmented enrichment characteristics. Additionally, new hidden structures were discovered in the profile, likely reflecting fractured alteration zones, yet due to the coverage of the fourth series at the surface, this area remains a target zone for further exploration.
The K24 profile corresponds to exploration line No.24 in the Mailong mining area, and the final 2D electrical interpretation model is shown in Figure 7c. This model can be roughly divided vertically into a shallow low-resistivity layer of 5–20 m, a high-resistivity body reaching 10,000 Ωm from 20–500 m, and a gradually appearing low-resistivity feature below 500 m, showing a three-layer electrical feature of low–high–medium resistivity. The shallow low-resistivity anomaly is speculated to be the cover layer of the fourth series; the second electrical layer has a generally thick thickness, with high resistivity values typically above 3000 Ωm, reflecting the medium-acid intrusive rock mass of the Hualixi period, mainly showing high resistivity features. Laterally, the electrical structure mainly shows segmented features of high resistivity and medium-low resistivity anomalies. Based on previous research and analysis, it is found that the high resistivity–low resistivity electrical gradient zone is a fault fracture zone formed by structural movement inside the area. The profile intersects the known AuXVI and AuVIII ore zones in the area, and the ore zone positions coincide with the gradient zones in the section. The low-resistivity zone is considered to be related to the distribution of structures and ore zones, especially the significant low-resistivity anomalies deep in the AuXVI and AuVIII ore zones (shown in Figure 7c(C1,C2)) connected to the shallow low-resistivity trend, possibly indicating a structural feature of the fracture zone extending deep underground and providing a channel for hydrothermal uplift for epithermal gold deposits based on structural alteration.

4.2. Deep Prospecting Breakthrough

From the 2D resistivity model, we found that the location of the ore body is the high and low resistance contact conversion belt. The depth of each ore zone is roughly the same, and all of them tend to extend to the depth. The low-resistivity bands respond to the region’s major tectonic fracture alteration zones. Especially in the K60 profile, there is a clear low-resistivity zone deep in the AuVIII ore belt, which is speculated to reflect the deep structural fractured zone. There may be concealed mineralized bodies in the deep, indicating a good prospecting outlook in the deep part of this area and delineating favorable areas for deep exploration. Subsequently, drill hole 6004 confirmed the presence of a 1.67 m ore body at a depth of 660 m, with a gold grade of 2.37 g/t, effectively validating the geophysical and geochemical exploration methods. It is believed that the deep part of this area has good potential for mineral exploration, and it is speculated that deep borehole verification of over 1000 m can be carried out. Similarly, in the K52 profile, a significant low-resistivity anomaly was discovered deep in the AuXVI ore belt (as shown in Figure 7b(C1)), which can serve as a deep exploration target area. Due to this, priority will be given to verifying this area in later work. Additionally, in K24, the thick Quaternary cover has hindered surface operations from progressing. However, a 2D electrical profile passing through the covered area effectively inferred a low-resistivity fault zone. It was found that the AuXVI and AuVIII mineral belts extend southward to the vicinity of the 24th exploration line. Through surface trenching, it was revealed to be a structurally altered zone with apparent gold mineralization characteristics, serving as a basis for further verification of the deep target area (as shown in Figure 7c(C1)). As a result, the electromagnetic method has yielded significant results in exploring the Golou gold deposit, marking a breakthrough in the exploration work.

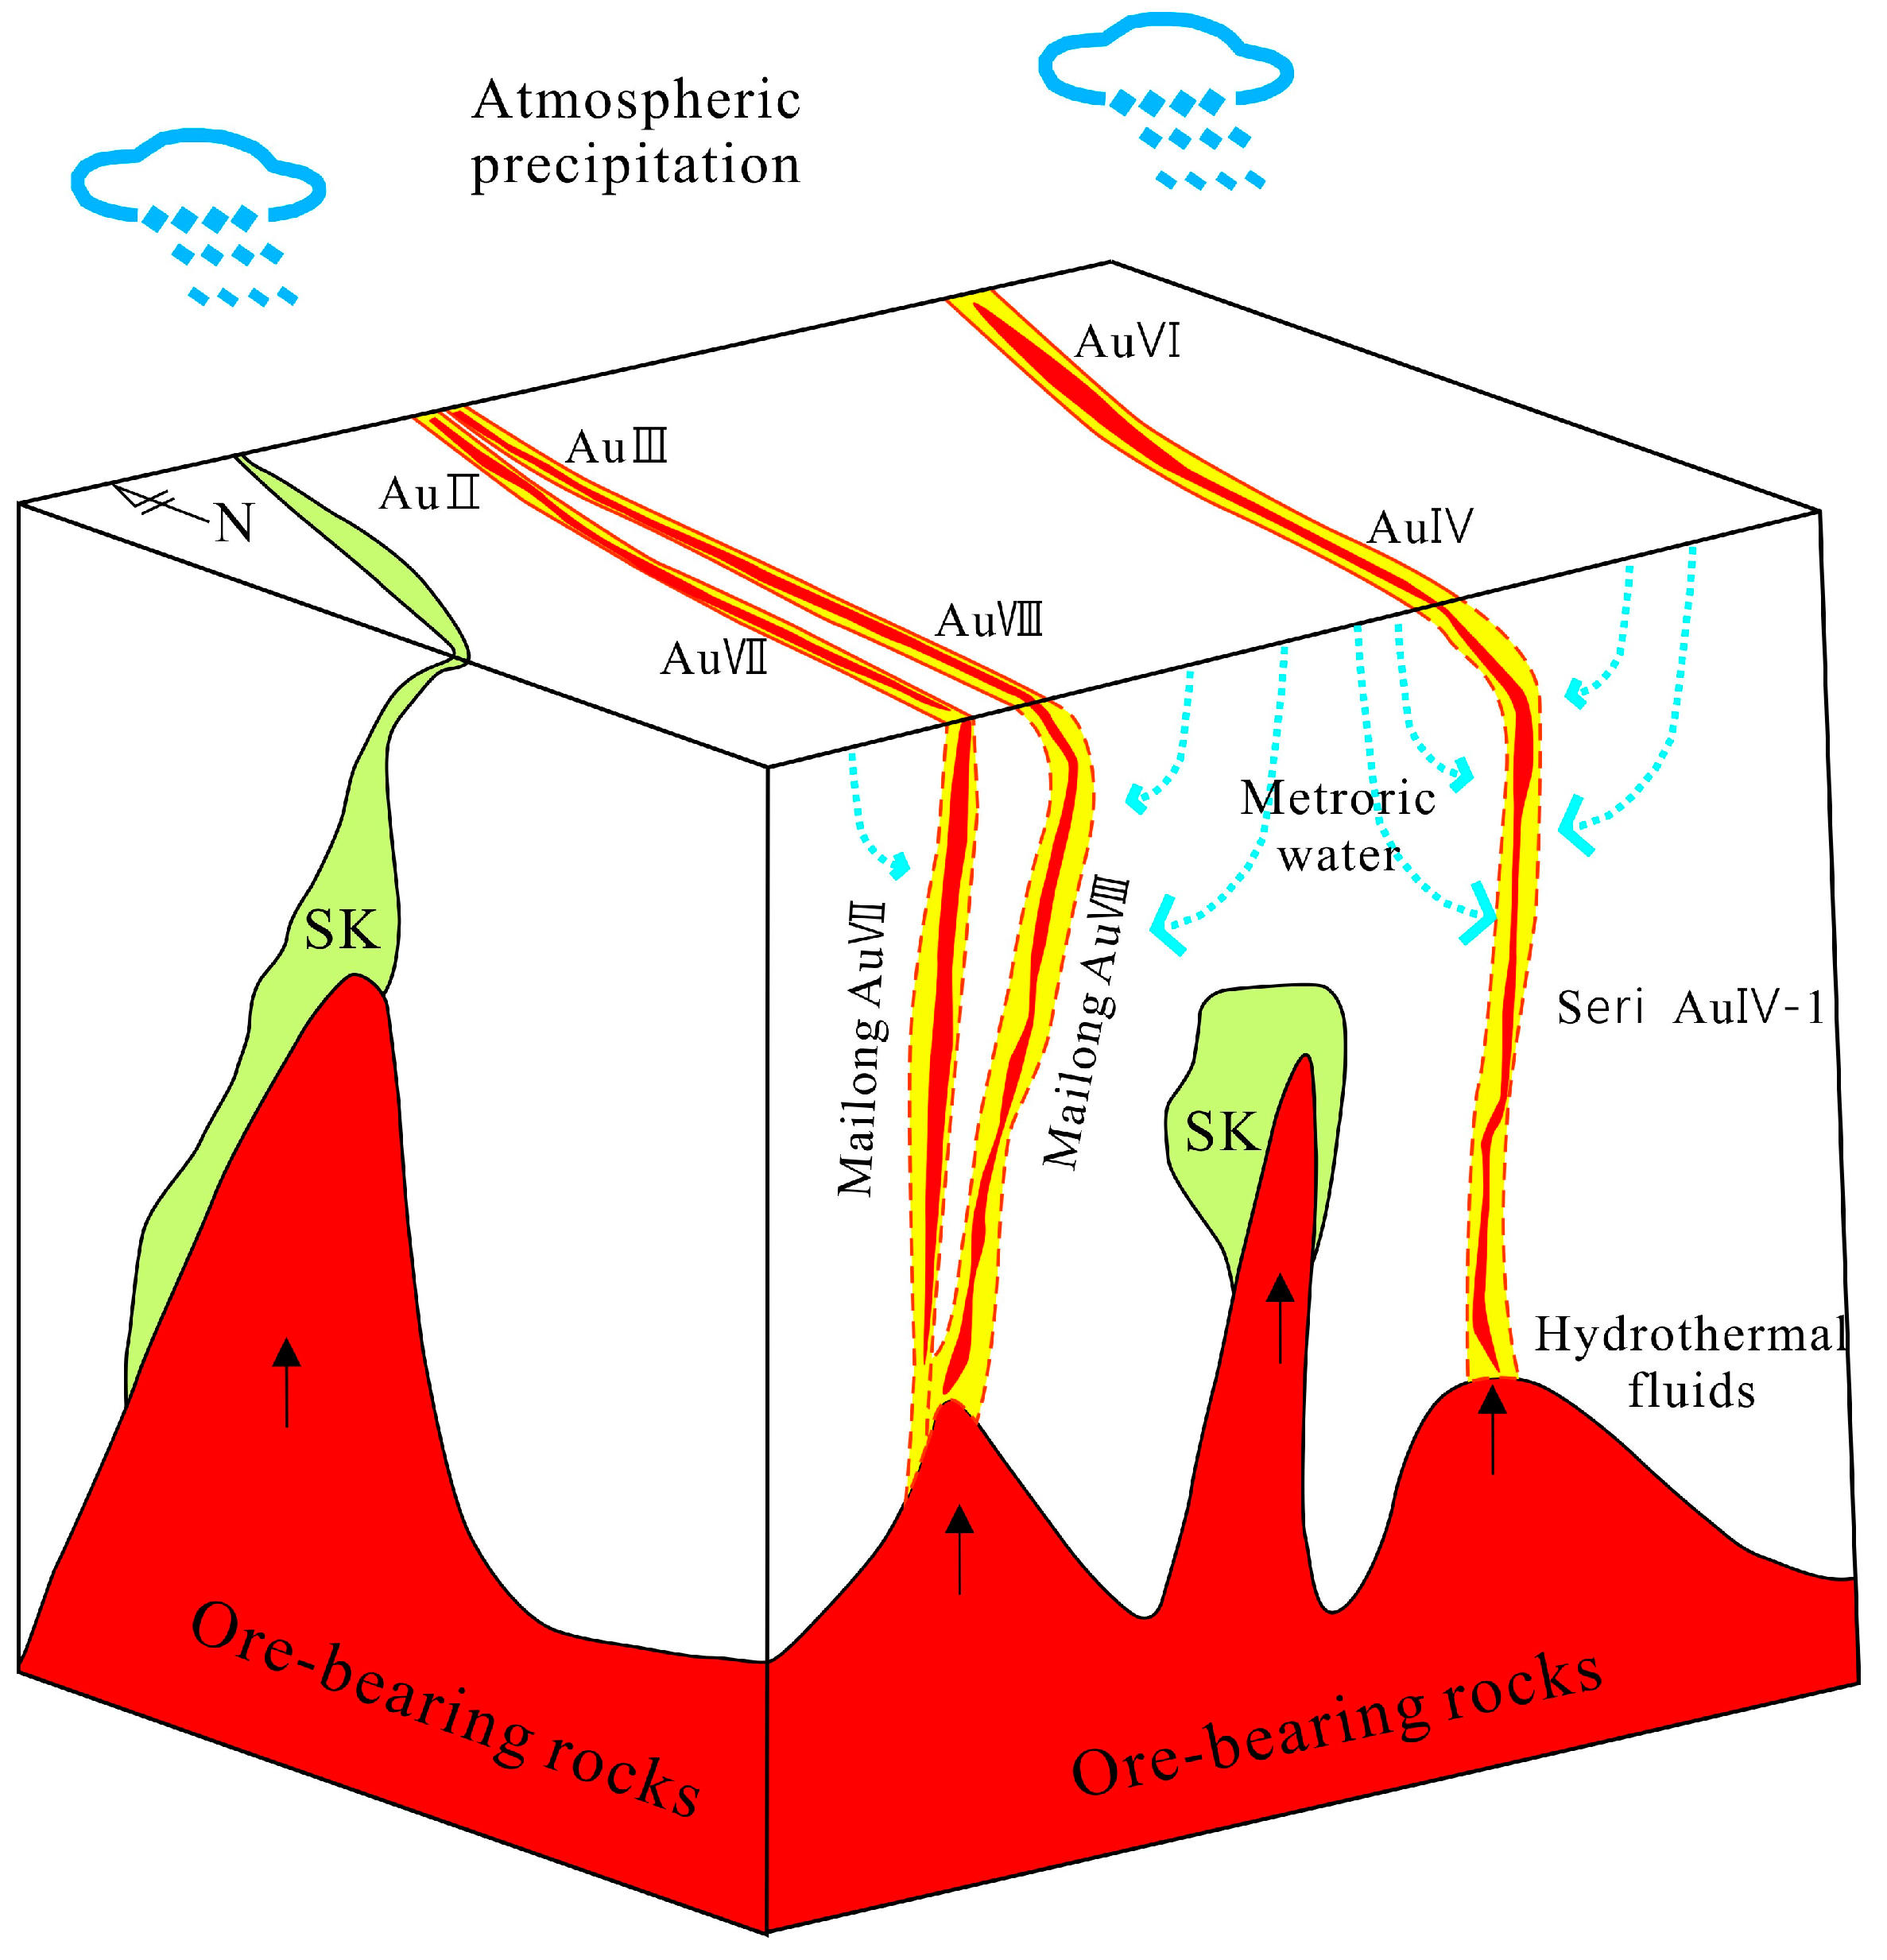
4.3. Mineralization Mechanism and Model

After years of geological exploration and scientific research, previous researchers extensively analyzed and studied the magmatic activity and gold mineralization in the Gouli area from the perspectives of the mineralization era, mineralizing fluids, and mineral sources. It is widely believed that the formation of gold deposits (ore bodies) in the Gouli area is closely related to regional magmatic tectonic activity and exhibits characteristics of multiple mineralization phases [18,21,23,33]. This study suggests that the intense tectonic movements during the Caledonian to Hercynian period in the Golol region led to frequent and vigorous magma activities, forming the Kunbei magmatic arc zone. The Kunbei magmatic arc zone, formed by tectonic magmatic activities, was influenced by extension and compression from the Central Tethys Ocean during the Indonesian period. This resulted in the formation of multiple sets of fracture structures in different directions and with different mechanical properties due to north–south compressional stress in the region. Additionally, the continued thickening of the Kunbei magmatic arc zone triggered the crust and mantle remelting, resulting in deep-seated molten magma formation. This molten magma intruded along the fracture structures, promoting the intrusion and migration of gold-rich magmatic–hydrothermal fluids along these fracture structures. In regions where there were abrupt changes in physical and chemical conditions along major ductile fracture structures, mineral-rich hydrothermal fluids boiled, causing reactions with surrounding rocks and rapid deposition and enrichment of ore-forming materials like gold, ultimately forming corresponding gold ore bodies (as shown in Figure 8).

5. Conclusions

This paper constructed a 2D resistivity model of the Mailong mining area based on audio-frequency magnetotelluric data in the Gouli ore-concentration area in the eastern Kunlun metallogenic belt. Based on the results of the surface geological survey, drill hole verification, and other data, the deep extension of the main ore belt was discussed, and the deep exploration target area was delineated. A breakthrough in deep mineral exploration was achieved through later drill hole verification. Finally, the electrical constraints, such as mineralization regularities and material sources, were provided for the mineralization mechanism of the Mailong mining area. The main conclusions are drawn as follows:
(1)
The study area is controlled by three major fracture structures of the Northern Kunlun Fault, the Central Kunlun Fault, and the Southern Kunlun Fault, with frequent and intense magmatic activities mainly during the Indosinian–Yanshanian period. This has resulted in the fractured basement, extensive outcrops of intrusive rocks, and a network of mainly NNW–NE strike-slip and thrust faults crisscrossing the area, creating excellent ore-forming geological conditions within the region.
(2)
The 2D resistivity model reveals that different ore belts in the area extend to varying depths at the same location, and the same ore belts have different extents at different locations. This indicates that the study area has undergone complex tectonic movements resulting in varying fault displacements and multiple phases of alteration and erosion, providing different ore-controlling spaces for mineralization hydrothermal activities, ultimately resulting in segmented enrichment characteristics of ore bodies in the study area.
(3)
This electromagnetic exploration defined a favorable deep mineralization zone. Subsequent drilling verification revealed a gold-bearing alteration structure. Therefore, electromagnetic exploration achieved good results in exploring structurally altered rock-type gold deposits in the plateau desert area, leading to a breakthrough in deep mineral exploration.

Author Contributions

J.D.: Conceptualization, Resources, Writing—review & editing, Funding acquisition, Project administration, Investigation. P.W.: Conceptualization, Methodology, Data curation, Writing—original draft. H.L.: Supervision, Resources, Writing—review & editing. H.Z.: Writing—review & editing. M.Z.: Writing—review & editing, Investigation. H.T.: Writing—review & editing, Funding acquisition, Project administration. X.Y.: Writing—review & editing. J.L.: Writing—review & editing. B.Z.: Writing—review & editing. All authors have read and agreed to the published version of the manuscript.

Funding

This research is supported by Qinghai Provincial Association for Science and Technology Youth Science and Technology Talent Support Project (2023QHSKXRCTJ47), Qinghai Province “Kunlun Talent High Innovation and Entrepreneurship Talent” Project and Demonstration of Deep Exploration Breakthrough in Important Mineral Concentration Areas of Qinghai Province (2023085029ky004), Exploration Foundation of Qinghai Province (2023085029ky004).

Data Availability Statement

Data will be made available on request.

Acknowledgments

We thank Gary Egbert and Alan Jones for ModEM and MTmap.

Conflicts of Interest

The authors declare no conflicts of interest.

References

  1. Li, Z.; Xue, C.; Wang, X.; Tang, H.; Tu, Q.; Teng, J.; Li, R. Features of Reqional Mineralization and Analysis of the Exploration Development in the Eastern Kunlun Mountains. Geol. Rev. 2007, 53, 708–717. [Google Scholar]
  2. Guo, X.; Jia, Q.; Li, J.; Kong, H.; Yao, X.; Mi, J.; Qian, B.; Wang, Y. Zircon U-Pb geochronology and geochemistry and their geological significances of eclogites from East Kunlun high-pressure metamorphic belt. Earth Sci. 2018, 43, 4300–4318. [Google Scholar]
  3. Xiong, W.; Zhao, M.; Yu, M. Ocean−Continent Transition Process and Magmatism in Orogenic Belts: A Case Study of Paleozoic Granites in the Dulan Area of East Kunlun. Northwest. Geol. 2023, 56, 113–139. [Google Scholar]
  4. Du, Y.-L.; Jia, Q.-Z.; Han, S.-F. Mesozoic Tectono-Magmatic-Mineralization and CopperiGold Polymetallic Ore Prospecting Research in East Kunlun Metallogenic Belt in Qinghai. Northwest. Geol. 2012, 45, 69–75. [Google Scholar]
  5. Xu, Z.; Yang, J.; Li, H.; Zhang, J.; Zeng, L.; Jiang, M. The Qinghai G Tibet Plateau and Continental Dynamics: A Review on Terrain Tectonics, Collisional Orogenesis, and Processes and Mechanisms for the Rise of the Plateau. Geol. China 2006, 33, 221–238. [Google Scholar]
  6. Luo, Z.; Deng, J.; Cao, Y.; Guo, Z.; Mo, X. On late Paleozoic-early Mesozoic volcanism and regional tectonic evolution of Eastern Kunlun, Qinghai Province. Geoscience 1999, 13, 51–56. [Google Scholar]
  7. Mo, X.; Luo, Z.; Deng, J.; Yu, X.-H.; Liu, C.; Yuan, W.; Bi, X. Granitoids and crustal growth in the East-Kunlun orogenic belt. AGU Fall Meet. Abstr. 2011, 2011, T51D-2370. [Google Scholar]
  8. Dong, Y.; He, D.; Sun, S.; Liu, X.; Zhou, X.; Zhang, F.; Yang, Z.; Cheng, B.; Zhao, G.; Li, J. Subduction and accretionary tectonics of the East Kunlun orogen, western segment of the Central China Orogenic System. Earth Sci. Rev. 2018, 186, 231–261. [Google Scholar] [CrossRef]
  9. Liu, Y.; Chen, Z.; Li, W.; Xu, X.; Kou, X.; Jia, Q.; Zhang, Z.; Liu, F.; Wang, Y.; You, M. The Cu-Ni mineralization potential of the Kaimuqi mafic-ultramafic complex and the indicators for the magmatic Cu-Ni sulfide deposit exploration in the East Kunlun Orogenic Belt, Northern Qinghai-Tibet Plateau, China. J. Geochem. Explor. 2019, 198, 41–53. [Google Scholar] [CrossRef]
  10. Zhang, J.; Lei, H.; Ma, C.; Li, J.; Pan, Y. Geochemical and thermodynamical modeling of magmatic sources and processes for the Xiarihamu sulfide deposit in the eastern Kunlun Orogen, western China. J. Geochem. Explor. 2018, 190, 345–356. [Google Scholar] [CrossRef]
  11. Chen, J.; Fu, L.; Wei, J.; Tian, N.; Xiong, L.; Zhao, Y.; Zhang, Y.; Qi, Y. Geochemical characteristics of late ordovician granodiorite in Gouli Area, eastern Kunlun orogenic belt, Qinghai Province: Implications on the evolution of Proto-Tethys ocean. Earth Sci. 2016, 41, 1863–1882. [Google Scholar]
  12. Liang, L.; Fengyue, S.; Shijin, L.; Bile, L.; Ye, Q.; Chao, W.; Tuofei, Z.; Lu, Y.; Guan, W.; Liang, H.; et al. Metallogenic Geological Conditions and Regularity of Magmatic Cu -Ni SulfideDeposits in the East Kunlun Metallogenic Belt. J. Jilin Univ. Earth Sci. Ed. 2022, 52, 1461–1496. [Google Scholar]
  13. Norbu, N.; Tang, L.; Li, J.; Kong, H.; Li, Y.; Jia, Q.; Xu, Y. Petrogenesis of Middle Triassic Adakite-like Intrusions in the Asiha Orogenic Gold Deposit, East Kunlun Orogenic Belt, China. Minerals 2023, 13, 74. [Google Scholar] [CrossRef]
  14. Feng, C.; Zhang, D.; Wang, F.; She, H.-Q.; Li, D.-X. Multiple orogenic processes and geological characteristics of the major orogenic gold deposits in East Kunlun area, Qinghai Province. Acta Geosci. Sin. 2004, 25, 415–422. [Google Scholar]
  15. He, S.; Lin, G.; Zhong, S.; Bai, G.; Zhang, Y.; Shu, S.; Wang, L.; Furong, Z. Geological Characteristics and Related Mineralization of “Qinghai Gold Belt” Formed by Orogeny. Northwest. Geol. 2023, 56, 1–16. [Google Scholar]
  16. Li, J.; Du, W.; Cheng, Y.; Kong, H.; Liu, J.; Li, Y.; Jia, Q.; Namkha, N.; Xia, M.; Li, Y. Characteristics of gold deposits and ore-control factors in the East Kunlun mineralization belt, Qinghai Province. Geol. Explor. 2015, 51, 1079–1088. [Google Scholar]
  17. Wanming, Y.; Xuanxue, M.; Xuehui, Y.; Zhao-Hua, L.; Wei-Dong, G. Gold metallogenic belts and prospecting direction in eastern Kunlun area. Geol. Explor. 2000, 36, 20–23. [Google Scholar]
  18. Yang, B.; Zhang, L.; Ma, Z.; Wang, X. Study on Metallogenic Geological Background of Gold Deposits in Gouli Area. Qinghai. Min. Explor. 2018, 9, 1920–1925. [Google Scholar]
  19. Yuan, W.; Mo, X.; Wang, S.; Zhang, X. The relationship between gold mineralization and regional tectonic evolution in eastern kunlun mountains. Geol. Prospect. 2003, 39, 5–8. [Google Scholar]
  20. Li, S.; Zeng, X.; Wang, F.; Tong, H.; Yang, Y.; Zhang, D.; Kang, B.; Shi, H.; Zheng, Z. Main metallogenic series and prospecting potential in Qinghai province. J. Jilin Univ. Earth Sci. Ed. 2022, 52, 1419–1445. [Google Scholar]
  21. Zhang, B.; Ma, Q.; Zhang, L. Cause analysis of geological characteristics of gold and polymetallic ore deposit in Qinghai county of Dulan province Mairon area. World Nonferrous Met. 2018, 7, 131–132. [Google Scholar]
  22. Dong, M.; Guosheng, S.; Xue, L.; Lei, H.; Jitian, Z.; Geny, L. Geological characteristics and genesis of gold deposits in the Gouli area, Dulan County, Qinghai Province. GOLD 2022, 11, 13–18. [Google Scholar]
  23. Yue, W.; Zhou, J.; Gao, J.; Huang, Y.; Jia, F. Geochemistry, Zircon U-Pb Dating and Hf Isotopic Compositions of the Granite-porphyry in Asiha Gold Ore District, Dulan County, Qinghai Province. Geotecton. Metallog. 2017, 41, 776–789. [Google Scholar]
  24. Song, S.; Niu, Y.; Su, L.; Xia, X. Tectonics of the North Qilian orogen, NW China. Gondwana Res. 2013, 23, 1378–1401. [Google Scholar] [CrossRef]
  25. Wei, W. New Advance and Prospect of Magnetotelluric Sounding (MT) in China. Prog. Geophys. 2002, 17, 245–254. [Google Scholar]
  26. Wei, W.-B.; Jin, S.; Ye, G.-F. Methods to study electrical conductivity of continental lithosphere. Earth Sci. Front. 2003, 10, 15–24. [Google Scholar]
  27. Tezkan, B.; Hordt, A.; Gobashy, M. Two-dimensional radiomagnetotelluric investigation of industrial and domestic waste sites in Germany. J. Appl. Geophys. 2000, 44, 237–256. [Google Scholar] [CrossRef]
  28. Li, F.; Zeng, Q.; Zhu, R.; Chu, S.; Xie, W.; Zhang, B.; Zhang, X. Application of the AMT Method to Gold Deposits: A Case Study in the Qinling Metallogenic Belt of North China Craton. Minerals 2021, 11, 1200. [Google Scholar] [CrossRef]
  29. Pitiya, R.; Lu, M.; Chen, R.; Nong, G.; Chen, S.; Yao, H.; Shen, R.; Jiang, E. Audio Magnetotellurics Study of the Geoelectric Structure across the Zhugongtang Giant Lead–Zinc Deposit, NW Guizhou Province, China. Minerals 2022, 12, 1552. [Google Scholar] [CrossRef]
  30. Qi, P.; Yin, Y.; Jin, S.; Wei, W.; Xu, L.; Dong, H.; Huang, J. Three-Dimensional audio-magnetotelluric imaging including surface topography of the cimabanshuo porphyry copper deposit, Tibet. Minerals 2021, 11, 1424. [Google Scholar] [CrossRef]
  31. Xinluo, Y.; Xiaozhu, L.; Bin, L.; Jiyong, C.; Guicong, F. Application of the audio magnetotelluric (AMT) method to the exploration of the Dingtou gold deposit in Fengshan County, Guangxi. Geol. Explor. 2021, 57, 1366–1373. [Google Scholar]
  32. Zhuoyi, W.; Jiuda, S.; Zhiqiang, Z.; Guosheng, S.; Xue, L.; Shengbao, W.; Dong, M. Geological and geochemical anomaly characteristics and geological significance of Seri Gold-Silver Deposit in Dulan County, Qinghai Province. GOLD 2023, 2, 73–77. [Google Scholar]
  33. Zhiyuan, S.; Tongke, W.; Guozheng, J.; Xinming, Z.; Xu, W. Analysis of ore prospecting of Mailong-Seri area, Dulan county Qinghai province and the target delineation. Contrib. Geol. Miner. Resour. Res. 2022, 37, 291–301. [Google Scholar]
  34. He, J.; Yang, S.; Duan, H.; Liu, Y.; Xiong, S. Qinghai Serir Gold Mine Ore-Forming Characteristics and Prospects for Mineral Exploration. Min. Technol. 2022, 22, 238–243. [Google Scholar]
  35. Chave, A.D.; Jones, A.G. The Magnetotelluric Method: Theory and Practice; Cambridge University Press: Cambridge, UK, 2012. [Google Scholar]
  36. Gamble, T.D.; Goubau, W.M.; Clarke, J. Magnetotellurics with a remote magnetic reference. Geophysics 1979, 44, 53–68. [Google Scholar] [CrossRef]
  37. Egbert, G.D.; Booker, J.R. Robust estimation of geomagnetic transfer functions. Geophys. J. R. Astron. Soc. 1986, 87, 173–194. [Google Scholar] [CrossRef]
  38. Bahr, K. Geological noise in magnetotelluric data: A classification of distortion types. Phys. Earth Planet. Inter. 1991, 66, 24–38. [Google Scholar] [CrossRef]
  39. Caldwell, T.G.; Bibby, H.M.; Brown, C. The magnetotelluric phase tensor. Geophys. J. Int. 2004, 158, 457–469. [Google Scholar] [CrossRef]
  40. Booker, J.R. The magnetotelluric phase tensor: A critical review. Surv. Geophys. 2014, 35, 7–40. [Google Scholar] [CrossRef]
  41. Groom, R.W.; Bailey, R.C. Decomposition of magnetotelluric impedance tensors in the presence of local three-dimensional galvanic distortion. J. Geophys. Res. 1989, 94, 1913–1925. [Google Scholar] [CrossRef]
  42. McNeice, G.W.; Jones, A.G. Multisite, multifrequency tensor decomposition of magnetotelluric data. Geophysics 2001, 66, 158–173. [Google Scholar] [CrossRef]
  43. Rodi, W.; Mackie, R.L. Nonlinear conjugate gradients algorithm for 2-D magnetotelluric inversion. Geophysics 2001, 66, 174–187. [Google Scholar] [CrossRef]
  44. Jones, A.G. Electromagnetic interrogation of the anisotropic Earth: Looking into the Earth with polarized spectacles. Phys. Earth Planet. Inter. 2006, 158, 281–291. [Google Scholar] [CrossRef]
Figure 1. (a) Schematic maps showing major tectonic units of China [24] and the location of the study area. (b) Distribution map of intrusive rocks, ophiolites, and deposits in the Gouli ore-concentrated area. (c) Geological and mineralogical map showing major tectonic structures and AMT station locations in the Mailong gold mining area.
Minerals 14 00930 g001
Figure 2. (a) The 1:1,000,000 Bouguer gravity anomaly map in the Gouli mineral deposit area. (b) The 1: 1:50,000 high-precision magnetic anomaly map in the Gouli mineral deposit area.
Minerals 14 00930 g002
Figure 3. Typical sounding curves at six AMT stations and their locations marked (AF) by the blue dots in Figure 1c.
Minerals 14 00930 g003
Figure 4. Pseudo-sections of Bahr skew of profiles K60, K52, and K24.
Minerals 14 00930 g004
Figure 5. Phase tensor distributions of K60, K52, and K24 AMT profiles.
Minerals 14 00930 g005
Figure 6. Results of impedance tensor decomposition with data from all periods in each profile.
Minerals 14 00930 g006
Figure 7. (a) Comprehensive geological and geophysical interpretation models of K60. (b) Comprehensive geological and geophysical interpretation models of K52. (c) Comprehensive geological and geophysical interpretation models of K24.
Minerals 14 00930 g007aMinerals 14 00930 g007b
Figure 8. Mineralization mechanism and model of the Mailong mining area.
Minerals 14 00930 g008
Disclaimer/Publisher’s Note: The statements, opinions and data contained in all publications are solely those of the individual author(s) and contributor(s) and not of MDPI and/or the editor(s). MDPI and/or the editor(s) disclaim responsibility for any injury to people or property resulting from any ideas, methods, instructions or products referred to in the content.

