Article

New Advance in the Study of Shale Oil Generation Peak Determination and Diagenetic Pore Evolution

1
School of Energy Resources, China University of Geosciences (Beijing), Beijing 100083, China
2
Key Laboratory of Strategic Evaluation of Shale Gas Resources, Ministry of Natural Resources, Beijing 100083, China
*
Author to whom correspondence should be addressed.
Minerals 2024, 14(9), 896; https://doi.org/10.3390/min14090896
Submission received: 26 July 2024 / Revised: 21 August 2024 / Accepted: 29 August 2024 / Published: 30 August 2024

Abstract

Shale formations globally are widely distributed with abundant resources and varied thermal maturation ranges. However, the understanding of shale’s oil generation peak, diagenetic stages, and pore evolution remains incomplete. This study investigates shale samples of varying maturities and organic matter content from representative oil and gas basins in China and the United States. Comprehensive characterization was conducted using thermal simulation, rock X-ray diffraction analysis, N2 and CO2 adsorption, and mercury injection analysis. The study delineates the hydrocarbon generation process in shale, identifies the oil generation threshold, determines the peak oil generation, and categorizes shale’s diagenetic stages based on clay minerals and pore evolution. The results indicate: (1) highly mature shale exhibits delayed hydrocarbon expulsion and peak oil generation, starting at Ro values greater than 0.75% and reaching peak oil generation at Ro levels surpassing 1.2%. In contrast, peak oil generation in less mature shale initiates at Ro values of 1.1%, providing a more precise depiction of the shale’s diagenetic evolution stages; (2) the higher the TOC content of shale, the greater its hydrocarbon generation capacity, showing a robust positive correlation between hydrocarbon generation and TOC; (3) the diagenesis and pore evolution of shale can be categorized into four distinct stages: the early diagenesis stage (Ro < 0.5%), dominated by mesopores, and with reduced pore volume and surface area; the middle diagenesis stage A (0.5%–1.1%), where shale pore volume has been enhanced while the surface area has been reduced; the middle diagenesis stage B (1.1%–2.0%), where an initial decrease followed by an increase in mesopore volume occurs, along with a modest increase in macropores; and the late diagenesis stage (Ro > 2.0%), with increased organic pores and microfractures, while both pore volume and surface area expand. The study suggests that a Ro of 1.1% marks the peak oil generation period for shale, occurring during the early stage of middle diagenesis, characterized by larger pore volume and surface area, crucial for shale oil and gas enrichment.

1. Introduction

Shale oil and gas, as an emerging energy source, have attracted widespread attention worldwide and are being explored and developed [1,2,3,4,5]. Shale layers are globally widespread, with commercial extraction of shale oil and gas occurring from marine, marine–continental transition, and continental strata [5,6,7,8,9,10,11]. The investigation of peak shale oil generation, diagenetic stages, and pore evolution is a critical focus in the global evaluation of oil and gas reservoirs, often utilizing thermal simulation experiments for research purposes.
Regarding the determination of shale oil peak, Guo and Mao have indicated that the Ro value associated with the oil generation peak of Shanxi Formation shale is approximately 1.6% in the Ordos Basin [12]. He et al. concluded that the peak oil generation temperature of Shanxi Formation shale is determined to be 408 °C, with a corresponding Ro value of 1.36% [13]. However, in recent years, there have been new insights into the determination of shale oil peak periods. For example, the Ro values of low-mature lacustrine mudstone in the dongsan part of the Bohai Bay Basin indicate an oil generation stage ranging from 0.6% to 1.1%, with the peak oil generation occurring between 0.75% and 0.86% [14]; the peak oil generation Ro of low organic matter shale is approximately 1.0% in the Qaidam Basin [15]. In terms of diagenetic stages and pore evolution, Xu et al. have suggested that shale hydrocarbon generation, diagenesis, and nanoscale pore evolution interact synergistically, dividing diagenesis into four stages [16]. Hu et al. proposed that organic pore structures are predominantly large pores during the initial phase of hydrocarbon generation, evolving into micro and large pores in the middle to later stages [17]. The diagenetic evolution of dolomites in the shale reservoir has been suggested as undergoing four distinct stages, including primary, paragenetic, rematuration, and organic acid dissolution in the Shahejie Formation in the Bohai Bay Basin [18]. Wang et al. suggested that shale porosity, pore volume, and specific surface area are continuously increasing during the process of maturity evolution, accompanied by an increase in micropore quantity and a decrease in pore size [19]. The diagenetic evolution of Shanxi shale in the Ordos Basin is classified into four stages, based on variations in clay minerals, pore structure, and hydrocarbon generation, namely early diagenesis (Ro < 0.6%), mid-diagenesis A (0.6% < Ro < 1.6%), mid-diagenesis B (1.6% < Ro < 2.5%), and late diagenesis (Ro > 2.5%), with pore volume dominated by medium and large pores, with the specific surface area being dominated by micro- and mesopores. Moreover, the specific surface area and pore volume exhibit an initial decrease followed by an increase as maturity progresses [12].
The division of diagenetic stages heavily relies on shale thermal simulation experiments. Currently, varying maturity levels among samples used in these experiments often impact the outcomes, thus influencing the division of diagenetic stages. High maturity shale samples used in thermal simulations lead to elevated Ro values during the peak oil generation phase, which delays the classification of intermediate diagenetic stages. This delay introduces errors in the classification scheme that fail to accurately depict the authentic diagenetic evolution of shale. Therefore, it is imperative to conduct thermal simulations on shale samples of both high and low maturity, compare their characteristics, refine the determination of the peak oil generation phase, and recalibrate the classification of shale diagenetic stages accordingly.
This study examines shale samples from diverse basins using thermal simulation experiments, N2 and CO2 adsorption, mercury intrusion porosimetry, and other methods. It analyzes shale’s hydrocarbon generation traits, investigates maturity-dependent hydrocarbon generation thresholds, redefines the shale oil peak, evaluates hydrocarbon variations in shales with different TOC levels, and precisely categorizes shale diagenesis stages based on pore size changes. The goal is to enhance the understanding of shale diagenetic processes and propose novel strategies for global hydrocarbon enrichment and high-quality reservoir prediction.

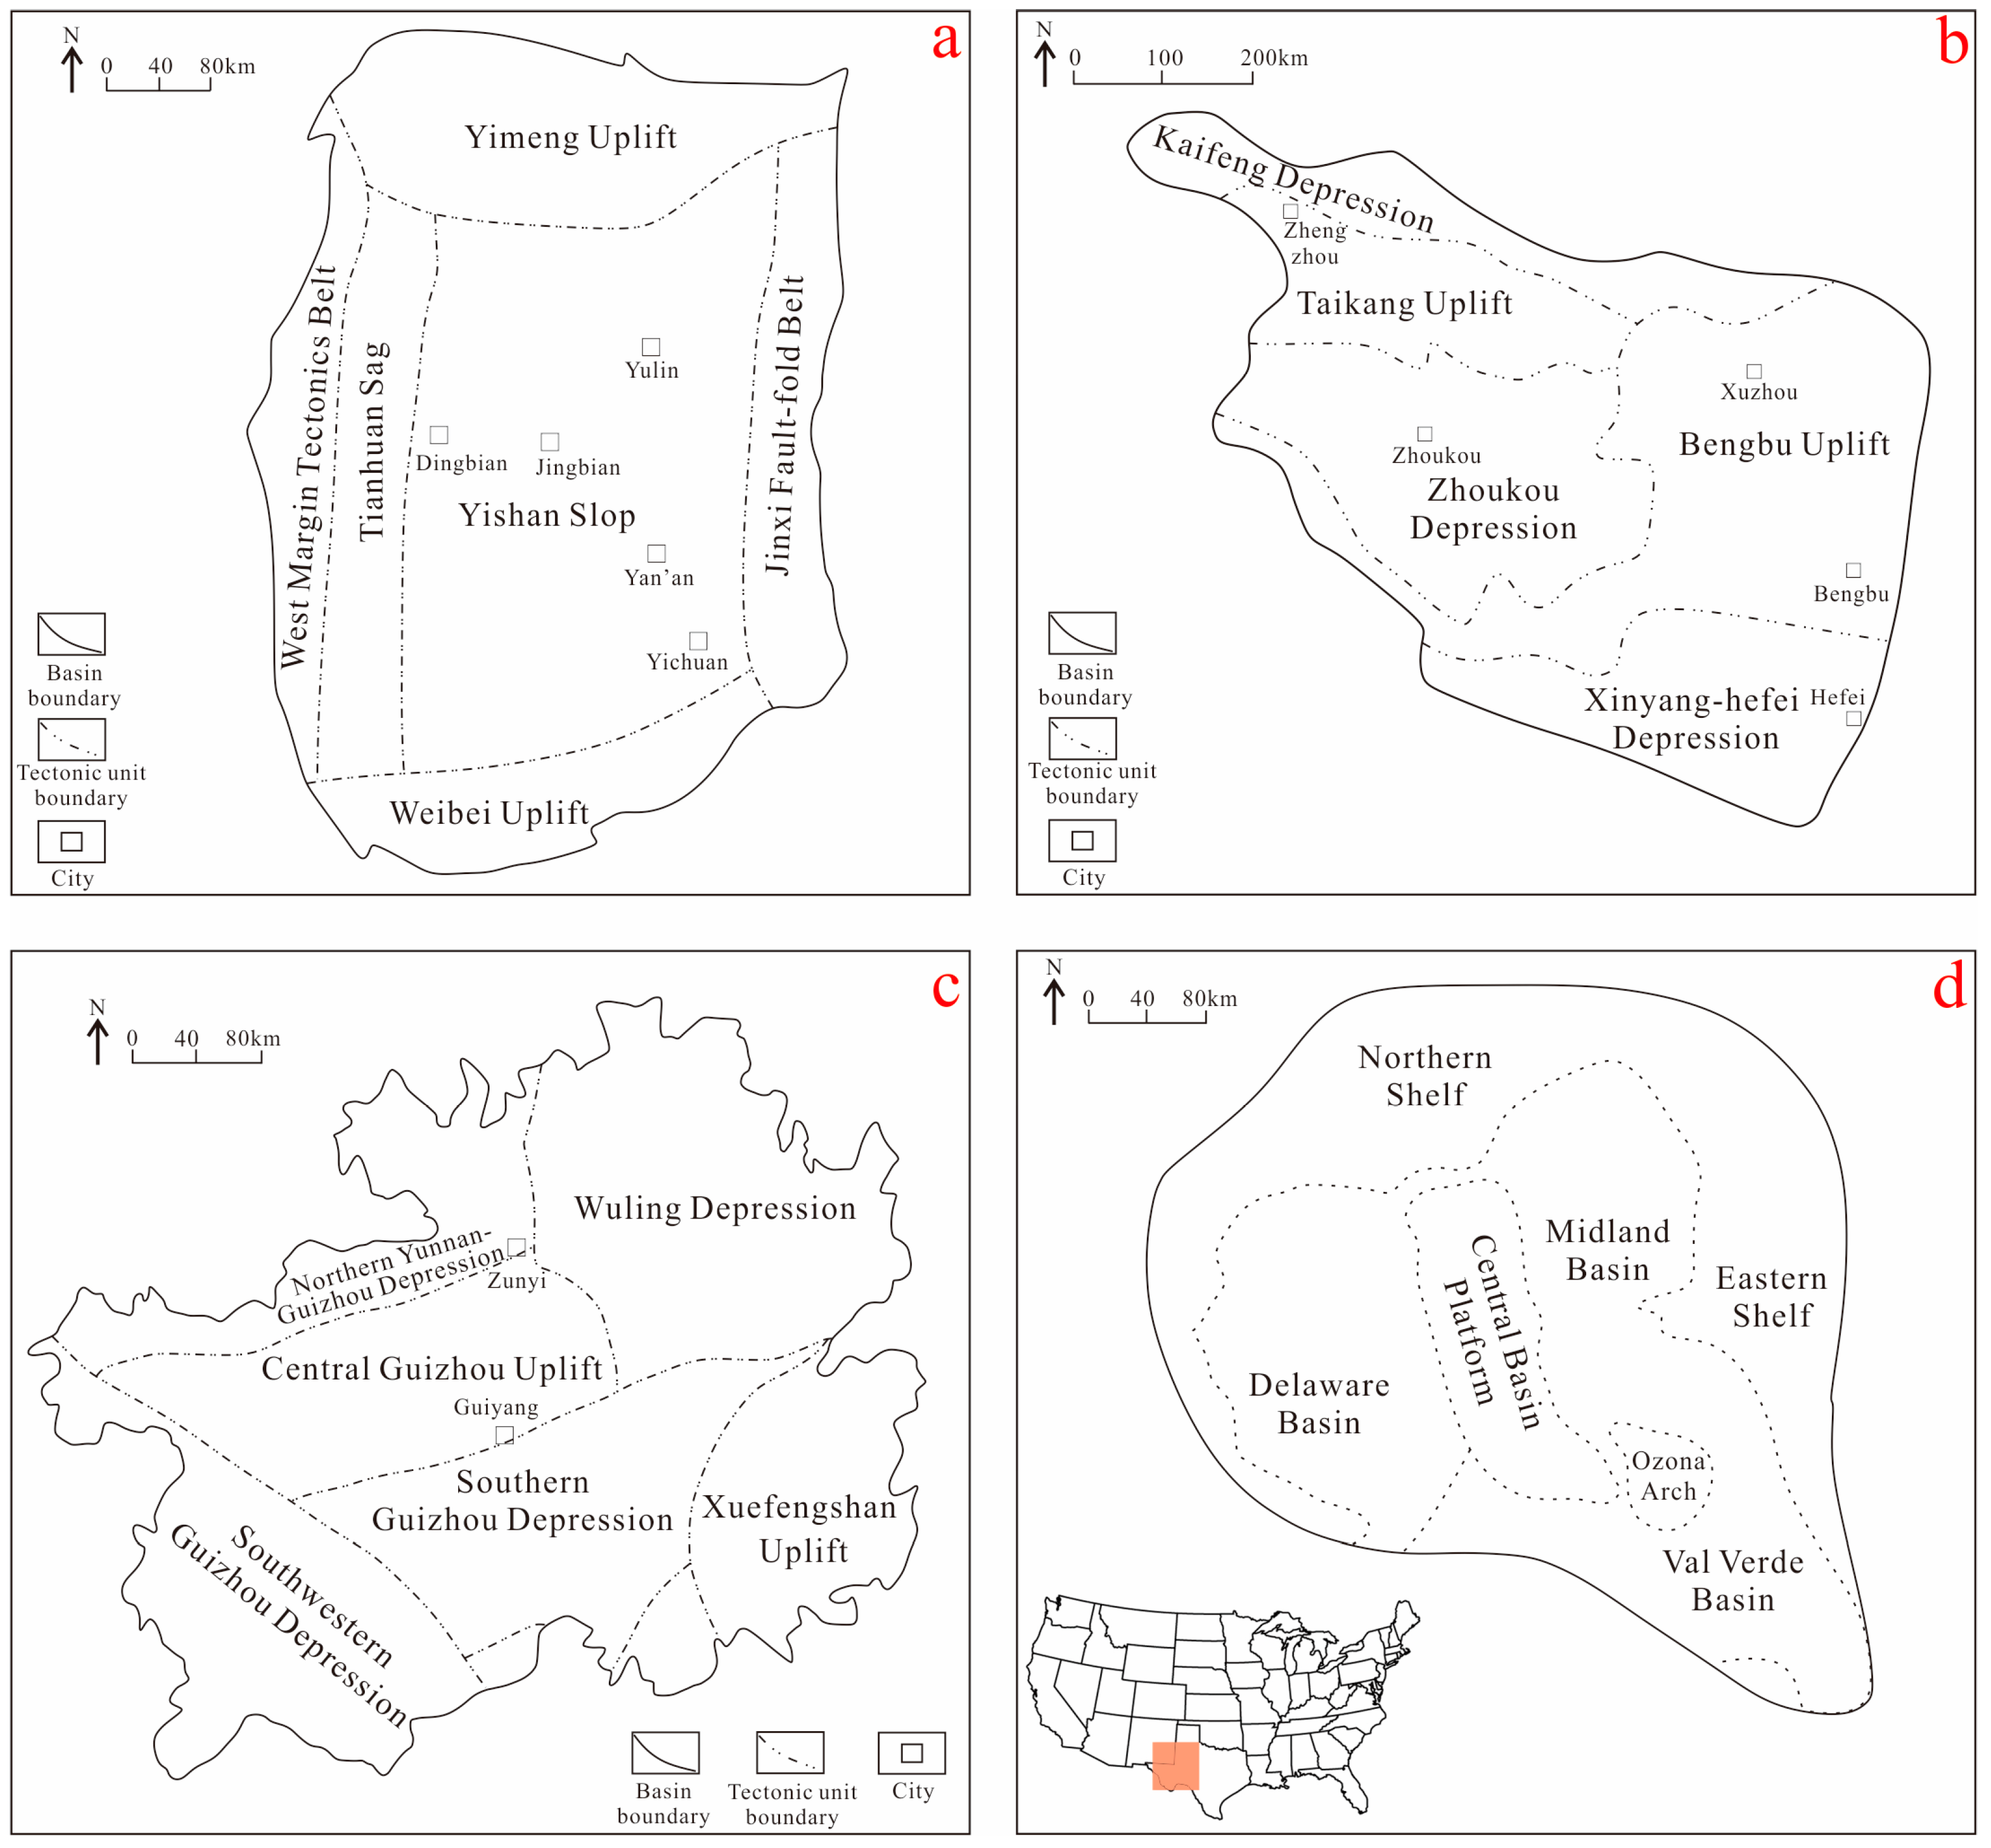
2. Geological Setting

The Ordos Basin, spanning an area of 37 × 104 km2, is a polyphase cratonic superimposed basin [20], including six tectonic units: the Western fault zone, Weibei uplift, Tianhuan depression, Yimeng uplift, Yishan slope, and Western Jinxi fold belt [21]. The Shanxi Formation of the Permian witnessed the development of shallow-water delta deposits [22], and it can be classified into Shan 1 section and Shan 2 section, with thick organic-rich shale averaging over 80 m, thicker in the central and eastern regions of the basin, while remaining relatively thinner in other areas [23]. High-quality shale include siliceous shale and mixed shale, which have a significant content of brittle minerals and TOC. The reservoir space is primarily composed of clay mineral pores and organic pores, and has a porosity range of 3%–4% [24]. The Triassic Yanchang Formation is a large inland sag lake basin with shallow to semi-deep lake facie deposits [25]. The reservoir is divided into ten groups, numbered from Chang 1 to Chang 10 [26], Chang 7 having multiple sets of high-quality shale layers forming during the maximum lake flooding period [27]. Concentrated in the southern, western, and south-western regions of the basin, the Chang 73 substage represents the peak period of lake development, with rock types primarily consisting of dark mudstones and black shales [28,29]. The Chang 7 shale exhibits a thickness ranging from 20 to 40 m, and exhibiting favorable physical properties—it represents the optimal reservoir for the accumulation of shale oil and gas in the Ordos Basin [30]. The Jurassic Yan’an Formation comprises alluvial fans, deltas, and lake deposits [31]. The Yanan Formation of the Middle Jurassic is subdivided into ten oil formation groups, ranging from Yan 1 to Yan 10. Yan 10 is characterized by braided river deposits, while Yan 7 and Yan 9 are lake-delta deposits, with Yan 8 and Yan 9 regions being highly fruitful for oil and gas exploration [32]. The shale development degree gradually decreases from the central basin towards the periphery, characterized by thin individual layers and frequent interbedding with mudstone, sandstone, and coal seams [33]. This study focuses on the Shanxi Formation Shan 1 Member, Yanchang Formation Chang 7 Member, and Yanchang Formation Yan 8 Member (Figure 1a).
The Southern North China Basin, spanning an area of approximately 15 × 104 km2, is a vast superposition basin formed on the foundation of the North China Craton [34]. In the early Permian, due to stratigraphic uplift, marine regression occurred, resulting in the development of early tidal flats, marsh facies, and later deltaic deposits in the Shanxi Formation [35]. The Shan 1 member primarily comprises black clastic rocks, siltstones, mudstones, and carbonaceous mudstones, while the Shan 2 member comprises medium-fine sandstones, black sandy mudstones, and mudstones, with a north-thickening and east-thinning characteristic. The source rock exhibits a high abundance of organic matter, is in the mature to over-mature stage, and possesses type III kerogen [36]. The study targets the Shan 1 Member (Figure 1b).
The Qianxi region, located in the western part of Guizhou Province, is situated tectonically on the southern margin of the Yangtze Plate. It can be divided into the Yungui sag, Qiannan uplift, Diandong uplift, Qiannan depression, and Southwest Guizhou depression. The sedimentary environment primarily consists of lagoon, tidal flat, and deltaic facies [37]. The Permian Longtan Formation contains organic-rich rocks with a thickness exceeding 150 m, consisting of mudstone, siltstone, sandy mudstone, and mudstone. These rocks have a cumulative thickness of approximately 30–50 m and are interbedded with sandstones and coal seams [38]. The target formation consists of black shale with high organic matter content (Figure 1c).
The Permian Basin, situated beneath western Texas and adjacent to New Mexico, covers approximately 30 × 104 km2. It is subdivided into the Midland, Delaware, Val Verde, and Marfa Basins [39,40]. The basin’s basement originated from late Precambrian rifting and north-west–south-east plate convergence. The sedimentary center lies along the present-day trend of the Central Basin Platform, containing abundant clastic sediments, shales, and carbonates [41]. This study focuses on the Pennsylvanian Formation, with a maximum thickness of 460 m, sourced from nearby uplifted siliciclastic sediments [42]. Samples were collected from surface outcrops (Figure 1d).

3. Materials and Methods

3.1. Materials

Shale samples were collected from the well MF7-1, the well Zhuang 284, the well J601-1, the well Wanpandi 1, the well YV-1, and the outcrop. The geochemical parameters of the samples are presented in Table 1.

3.2. Methods

The sample was dried and ground, then partitioned into 11 portions. One portion was designated for analyzing TOC content, vitrinite reflectance, mineral composition, etc. The remaining 10 portions, each weighing approximately 10 g, were finely ground into particles smaller than 5 mm. Sample preparation followed DZ/T 0457-2023 standards [43].

3.2.1. Thermal Simulation Experiment

The thermal simulation experiment employed a sealed high-pressure system featuring a gold tube–high pressure autoclave. Experimental temperatures ranged from 200 °C to 650 °C in 50 °C increments. The sample was encapsulated within a gold tube and inserted into the autoclave. After achieving vacuum conditions, the autoclave was pressurized to 50 MPa, maintaining pressure fluctuations below 1 MPa. The temperature was then raised at a rate of 20 °C/h until reaching the target temperature, ensuring temperature differentials did not exceed 1 °C. The sample was held isothermally at this temperature for 48 h. Subsequently, the gold tube was evacuated, and gas products, alongside carbon isotopes, were analyzed using a GC6890 gas chromatograph and GC-IRMS isotope ratio mass spectrometer. This analysis quantified the mass of hydrocarbon gases generated. Post-experiment, the vitrinite reflectance (Ro) value of the sample was determined.

3.2.2. Reflectance Experiment (Ro)

The reflectance testing was performed using a Leica DM4 500P polarizing microscope equipped with a 50× objective lens and an MPS200 photometer for vitrinite reflectance measurements. Samples were examined under a 20× dry microscope to confirm a stain-free, scratch-free, polished surface with distinct component boundaries. Microscopic analysis was conducted under oil-immersion for reflection and fluorescence conditions. This experiment adhered to industry standard SY/T-5124-2012 [44].

3.2.3. Adsorption and Mercury Porosimetry Experiment

The experiments on low-temperature N2 adsorption and low-pressure CO2 adsorption were performed using the ASAP2420 physical adsorption analyzer manufactured by Micromeritics Corporation of Norcross, Georgia in the United States. Prior to analysis, samples were ground to 40–60 mesh (particle size 0.28–0.45 mm) and subjected to vacuum degassing at 3.99 MPa and 200 °C for 3 h. Adsorption and desorption isotherms were recorded over a range of relative pressures (P/P0) from 0.005 to 1.0 at a temperature corresponding to liquid nitrogen (77.35 K). The specific surface area for nitrogen adsorption was determined using the BET method, and pore volume as well as pore size distribution were assessed using the BJH model. Low-pressure CO2 adsorption data were analyzed employing the Dubinin–Radushkevich theory to evaluate micropore characteristics. High-pressure mercury porosimetry experiments were conducted using the Autopore IV 9520 mercury porosimeter, capable of testing up to a maximum pressure of 413 MPa and measuring pore sizes ranging from 800 μm to 3 nm. Prior to testing, 1 cm3 samples were polished and dried to a constant weight, followed by mercury injection under vacuum conditions to complete the analysis. The experiments were conducted in accordance with industry standard NB/T 14008-2021 [45].

3.2.4. X-ray Diffraction Analysis

The experiment was performed using the S4 PIONEER X-ray fluorescence spectrometer manufactured by Bruker AXS in Billerica, MA, USA. Initially, clay samples of less than 2 μm were extracted and allowed to settle for 8 h to remove carbonates and organic impurities, followed by natural drying for 12 h. Subsequently, the samples underwent ethylene glycol saturation treatment at constant temperature, followed by heating to 550 °C and maintained for 2 h. This was followed by treatment with hot diluted hydrochloric acid. After the sample preparation was completed, X-ray diffraction analysis was conducted. The experimental procedures were conducted in accordance with SY/T 5163-2018 standards [46].

3.2.5. TOC Content Test

Samples were processed using the Leco CS-400 carbon–sulfur analyzer. After grinding to <0.2 mm, 0.3 g was weighed and treated with 1 mol/L hydrochloric acid to remove inorganic carbon. Following neutral washing with distilled water and drying, samples were analyzed for CO2 and SO2 content via gas absorption. TOC in shale samples was determined by dividing carbon and sulfur content by sample mass, following GB/T 19145-2022 standards [47].

4. Results

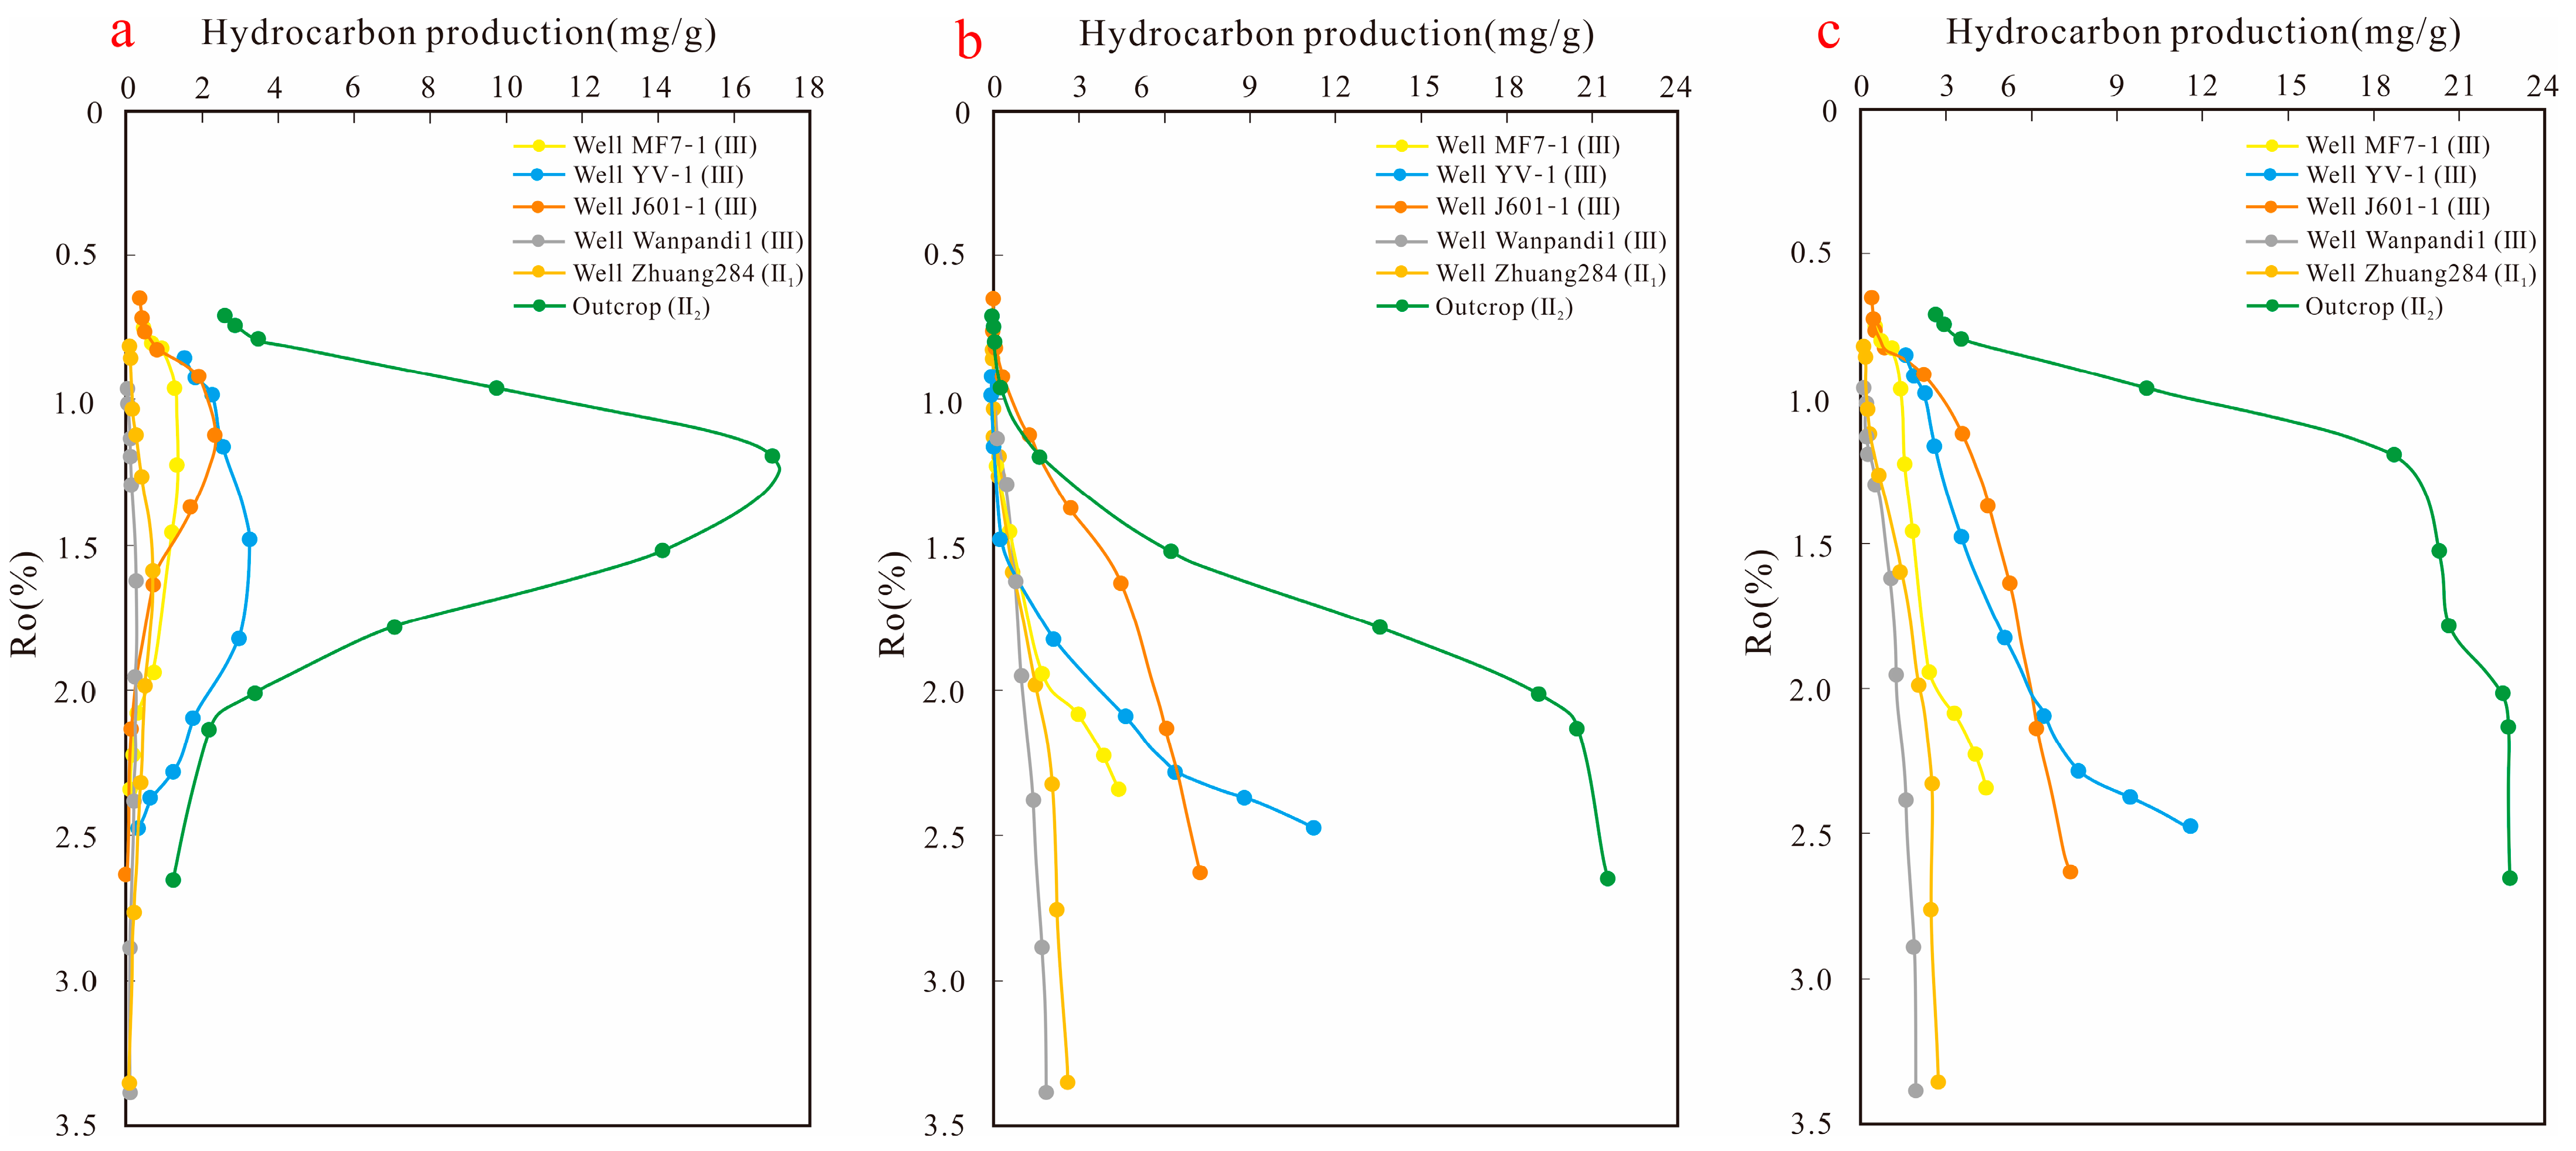
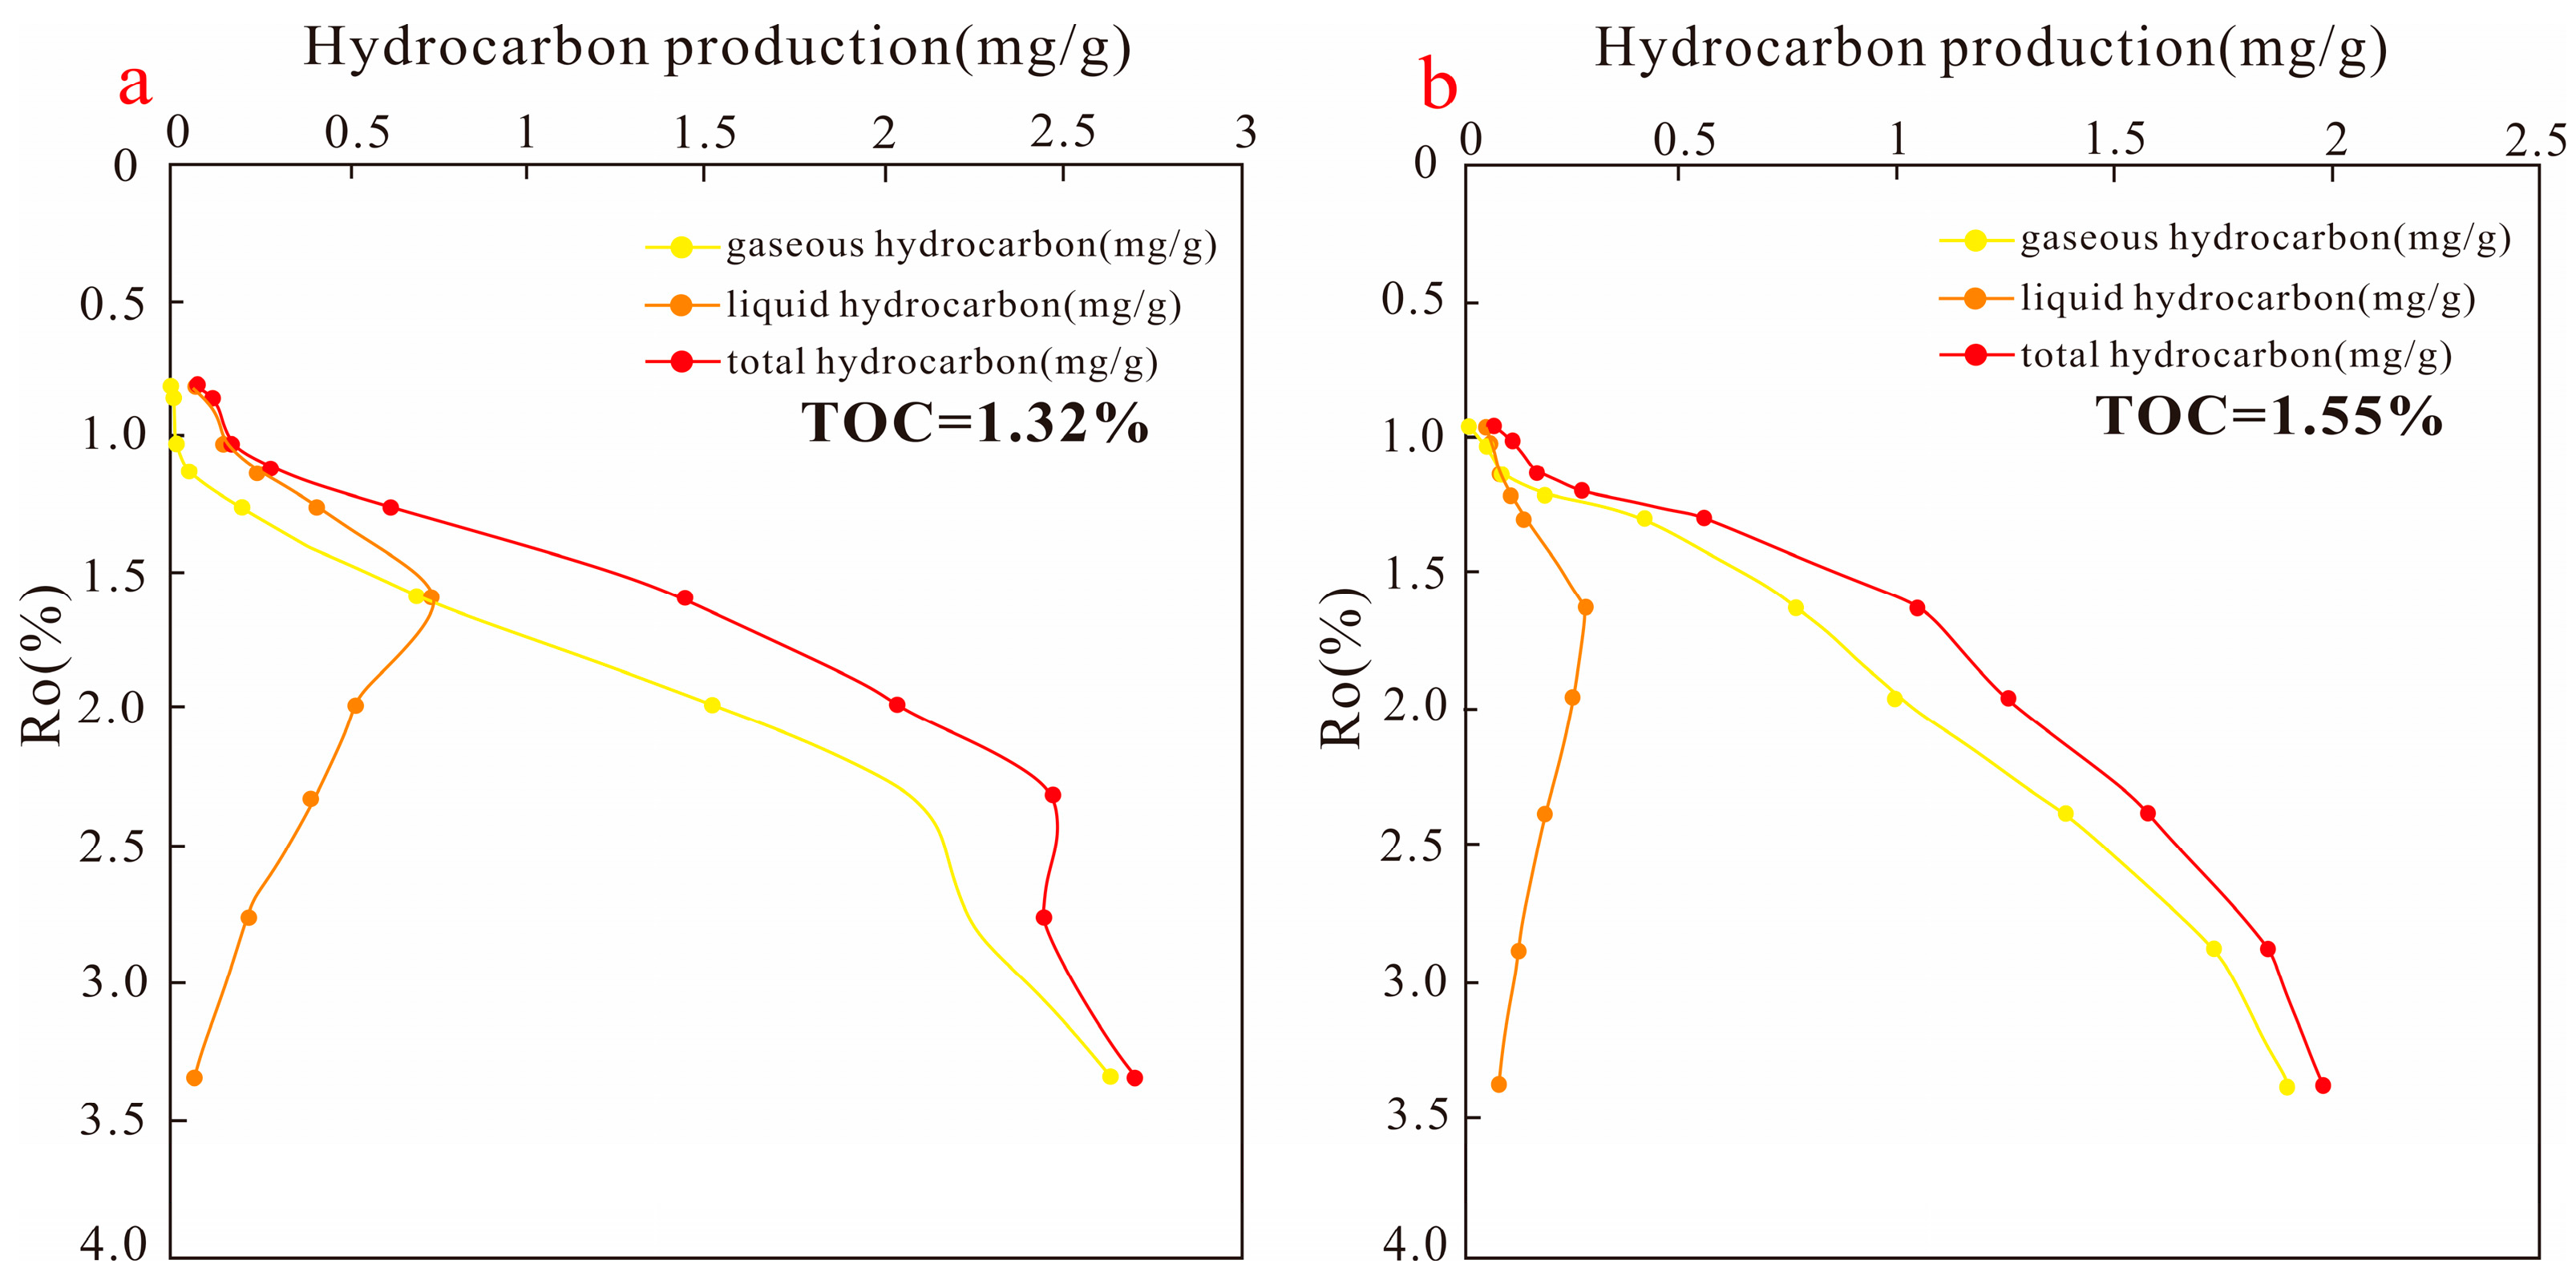
4.1. Hydrocarbon Generation Product Characteristics

Studies have shown a good correlation between the vitrinite reflectance of source rocks and the temperatures they have experienced [48,49], allowing the association between hydrocarbon generation and temperature in shale thermal simulation experiments to be translated into a relationship between Ro and hydrocarbon generation.

4.1.1. Liquid Hydrocarbon Yield Characteristics

The main liquid products in shale thermal simulation experiments are hydrocarbons with a carbon number greater than C5+. The yield of liquid hydrocarbons initially increases and then decreases as the Ro value increases (Figure 2a), with three stages of variation: (1) slow increase stage corresponding to thermal maturation Ro in the range of 0.65%–1.13%—the shale oil production increases slowly, with oil production ranging from 0.07 mg/g to 3.5 mg/g. (2) Rapid increase stage corresponding to thermal maturation Ro in the range of 0.82%–1.62%—the oil production rapidly increases, reaching a maximum oil production generally ranging from 0.28 mg/g to 17.02 mg/g. (3) Decrease stage corresponding to thermal evolution Ro ranges from 1.12% to 3.35%—the oil production first sharply decreases and then gradually decreases, with the overall final oil production being less than the initial oil production, ranging from 0.04 mg/g to 1.5 mg/g.

4.1.2. Gaseous Hydrocarbon Yield Characteristics

The gaseous products in the shale thermal simulation experiments were CH4 to C5H12. The production of gaseous hydrocarbons exhibited a positive correlation with the rise in Ro (Figure 2b), with three stages of variation: (1) slow increase stage corresponding to thermal maturation Ro in the range of 0.65%–1.2%, when Ro was greater than 0.76% and the shale started to gradually produce gas, with the total gas production for each shale being less than 0.5 mg/g at Ro of 1.2%, with a hydrocarbon production of 1.21 mg/g for the well J601-1 and 1.68 mg/g for the outcrop. (2) Rapid increase stage corresponding to thermal evolution when Ro fell within the range of 1.2% to 2.3%; at this stage, gas production increased rapidly, with the measured rates reaching up to 2 mg/g, and gas production ranging from 1.3 mg/g to 20.5 mg/g. (3) Gradual increase stage corresponding to thermal maturation Ro in the range of 2.3%–3.4%; at this stage, gas production gradually increased with Ro, with most rates being less than 1 mg/g, and the maximum gas production ranging from 4.3 mg/g to 21.55 mg/g. Additionally, when the production of gaseous hydrocarbons reached its peak, the production of liquid hydrocarbons declined to a minimum level.

4.1.3. Total Hydrocarbon Yield Characteristics

The total production of hydrocarbons is the aggregate of liquid hydrocarbon production and gaseous hydrocarbon production. The correlation between the total production of hydrocarbons and Ro can be categorized into three distinct stages (Figure 2c): (1) slow increase stage corresponding to thermal maturation Ro in the range of 0.65%–1.2%, with growth rates at various measurement points being less than 0.5 mg/g, and total hydrocarbon production ranging from 0.25 mg/g to 3.5 mg/g. (2) Rapid increase stage: the corresponding thermal evolution Ro ranges from 0.79% to 2.32%; at this stage, the total hydrocarbon production increased significantly, with production ranging from 1.1 mg/g to 18.7 mg/g. (3) Gradual increase stage: the corresponding thermal evolution Ro ranged from 1.19% to 3.38%; at this stage, the total hydrocarbon production increase rate tended to level off, with the maximum total hydrocarbon production ranging from 1.9 mg/g to 22.8 mg/g.

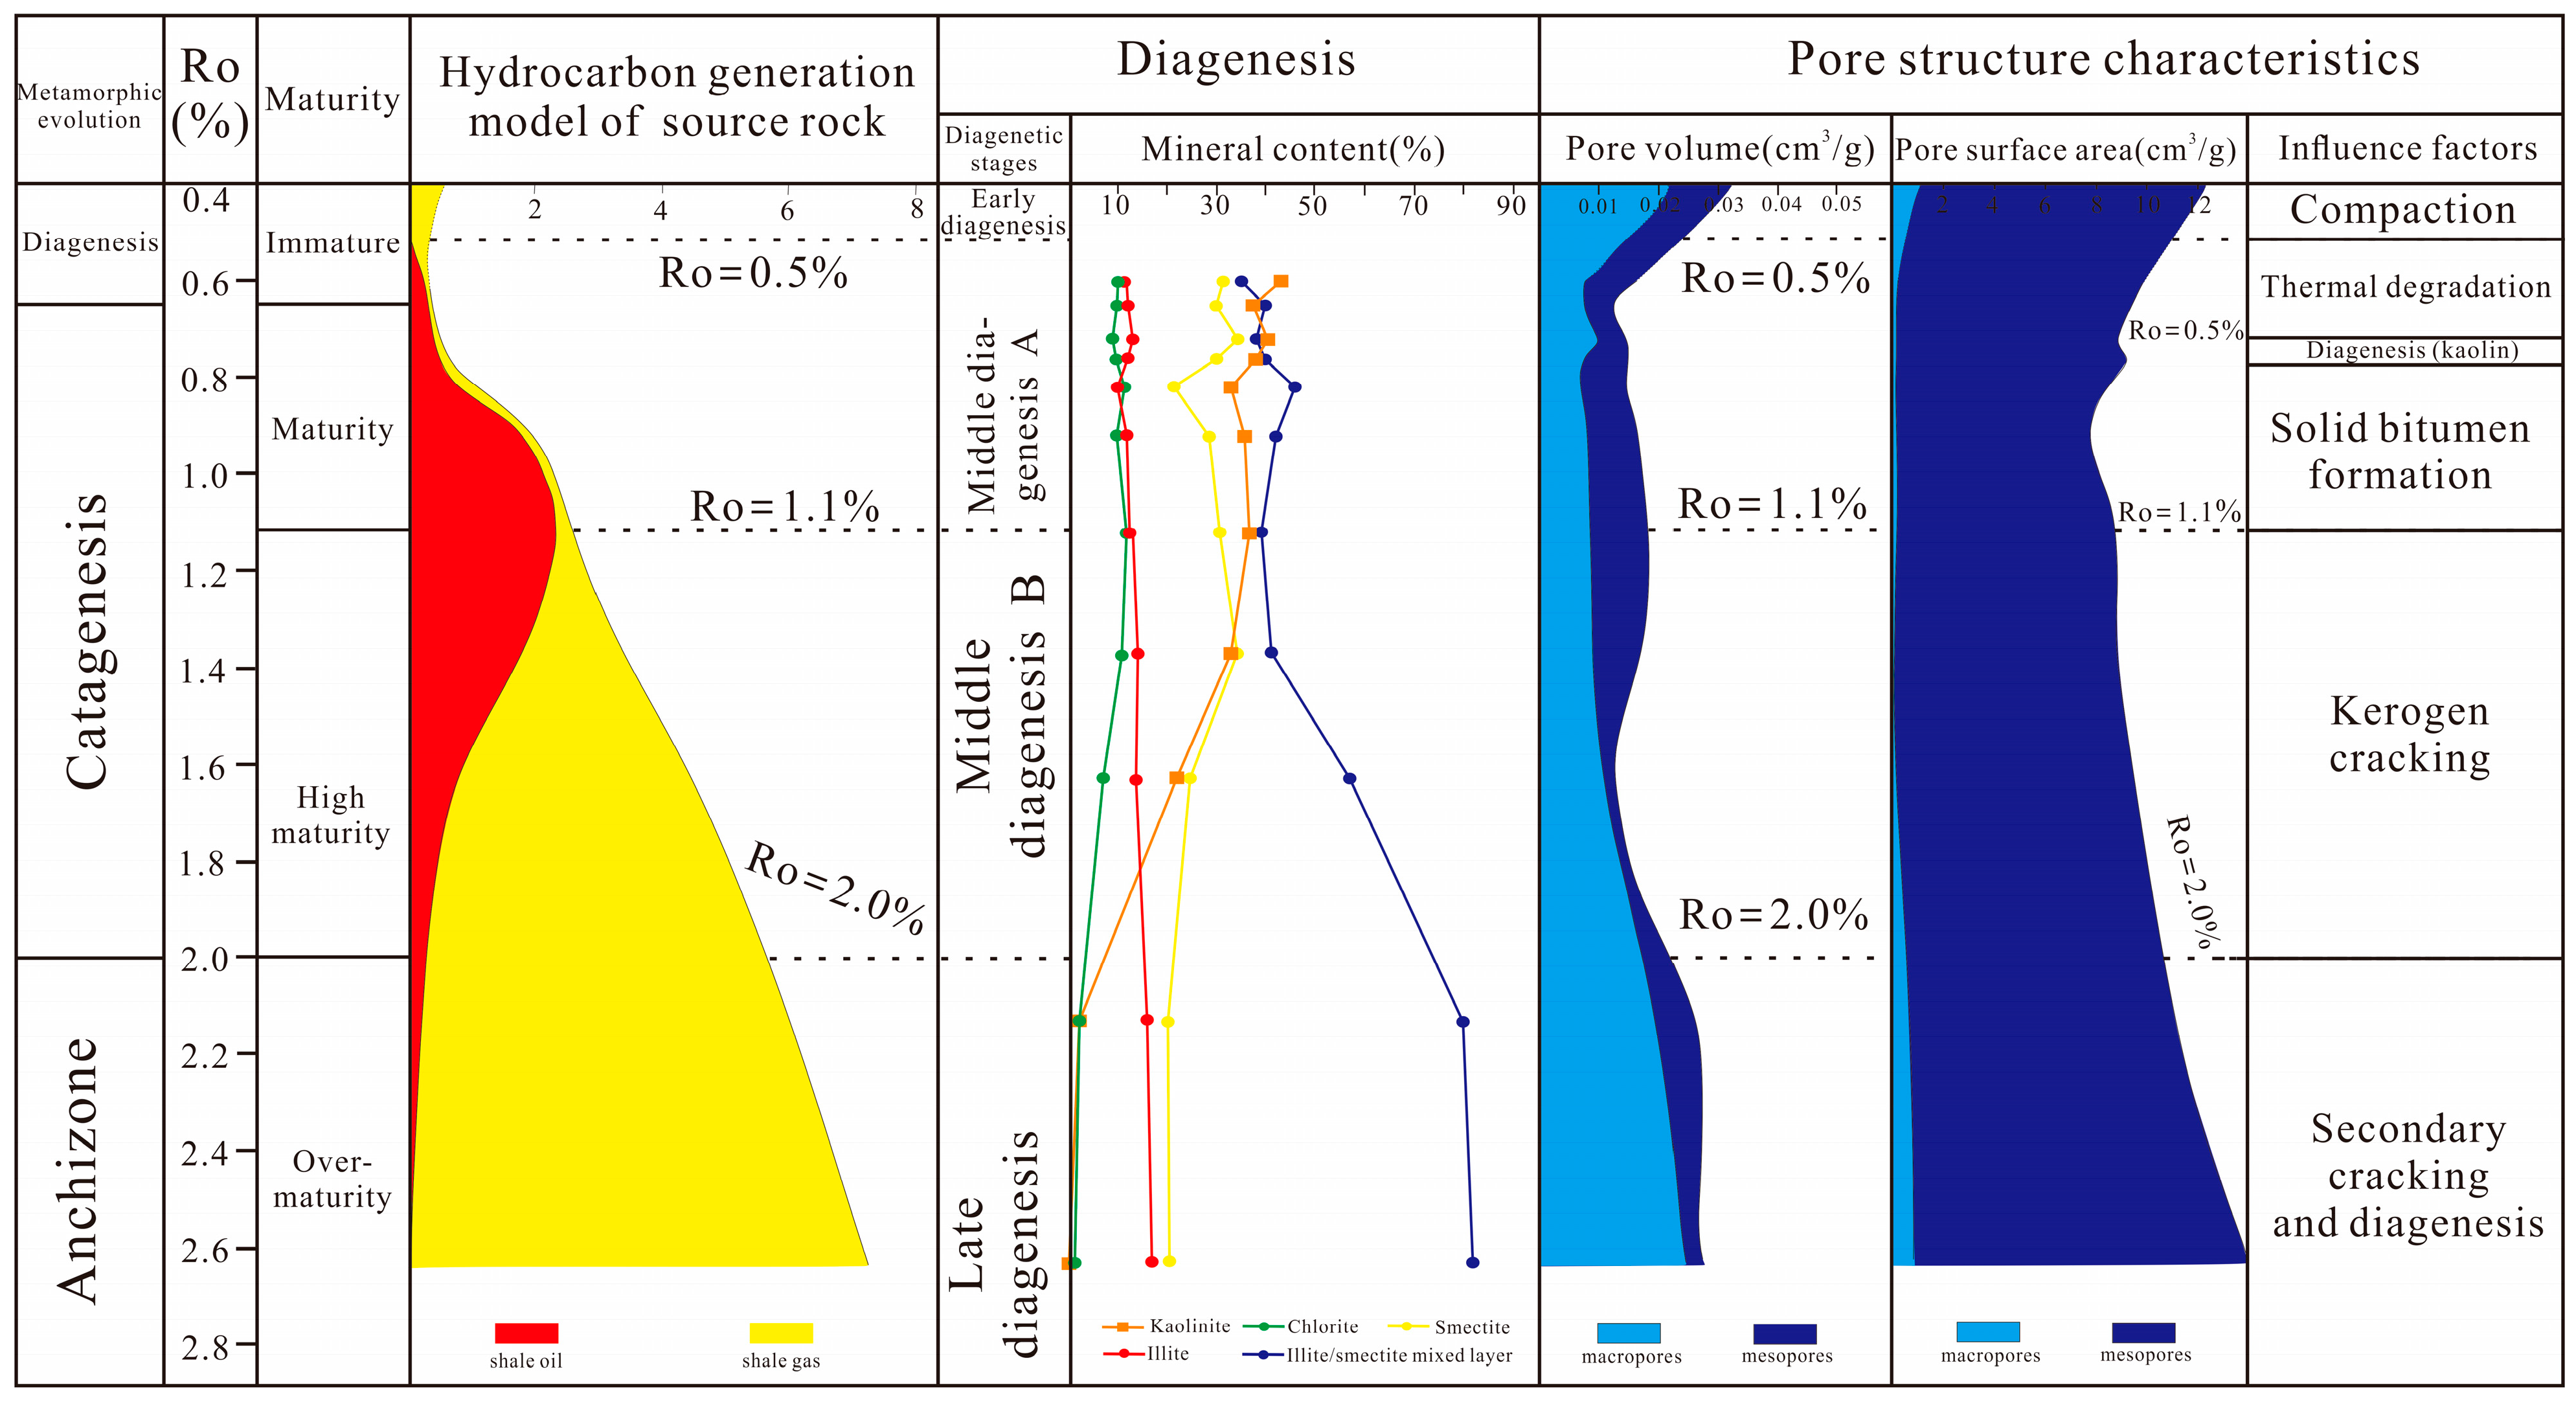
4.2. Clay Minerals’ Composition Characteristics

The samples primarily consisted of clay minerals, quartz, feldspar, and pyrite (Table 2). In the shale of well J601-1, clay minerals comprised 43%–53%, quartz 33%–43%, potassium feldspar 4%–5%, plagioclase 7%–9%, and pyrite less than 5%. The shale–clay mineral assemblage primarily consisted of kaolinites, chlorites, illites, and illite/smectite (I/S) mixed layers. Taking the shale from well J601-1 in the Ordos Basin and the outcrop in the Permian Basin as an example, as the temperature increased, shale maturity gradually rose and was accompanied by a progressive decrease in the content of kaolinite and chlorite, while the content of the illite and I/S mixed layer showed a gradual increase (Figure 3). The content of kaolinite in the well J601-1 decreased from 43% to 22% (Ro < 1.63%), then sharply dropped to 2% (Ro < 1.63%) and eventually disappeared; the shale at the outcrop had a low kaolinite content (Ro < 4%). The shale at the well J601-1 showed fluctuations in illite content between 9% and 12% at a Ro of 1.63%, and then decreased to 1% at a Ro of 2.63%, while the shale at the outcrop had an illite content that decreased from 8% (Ro = 0.71%) to 4% (Ro = 0.78%). The transformation of kaolinite to illite and I/S mixed layer was observed, with an increase in illite content from 11% to 17% as Ro increased from 0.6% to 2.63%; the I/S mixed layer content of aemon exhibited a significant increase from 35% to 82%, with an increase of over 50%. Conversely, the smectite content in the I/S mixed layer decreased from 65% to 30%, showing only a slight increase within the range of Ro between 0.76% and 0.82%. In the shale at the outcrop, as Ro increased from 0.7% to 2.65%, the illite content increased from 22% to 31%, while the I/S mixed layer content increased from 68% to 72%, with a slight decrease in smectite content within the I/S mixed layer.

4.3. Pore Evolution Characteristics

The shale pore volume and pore surface area of well J601-1 were characterized after undergoing thermal simulation. Shale pores primarily consisted of mesoporous and macro pores, exhibiting a total pore volume ranging from 0.0191 to 0.0507 cm3/g and a total pore surface area ranging from 7.845 to 14.775 cm2/g (Table 3). The presence of pores ranging from 2 nm to 50 nm significantly contributed to the overall pore volume and surface area. For Ro values between 0.6% and 1.2%, the mesopore volume initially decreased and then increased, from 0.0164 cm3/g to 0.0121 cm3/g, then increased to 0.0183 cm3/g, while the macropore volume initially increased from 0.0075 cm3/g to 0.0098 cm3/g, followed by a subsequent decrease to 0.0085 cm3/g. The mesopore surface area initially decreased from 9.805 cm2/g to 7.757 cm2/g, followed by an increase to 8.863 cm2/g, while the surface area of macropores showed an increasing trend, from 0.032 cm2/g to 0.140 cm2/g. For Ro values between 1.2% and 2.63%, both mesopore and macropore volumes showed an increasing trend. At this stage, the maximum mesopore volume was 0.0263 cm3/g, and the maximum macropore volume was 0.0244 cm3/g. However, there was a dip in mesopore volume at a Ro of 1.63%. The surface area also showed an increasing trend, with mesopore surface areas ranging from 7.757 to 13.987 cm2/g and macropore surface areas ranging from 0.001 to 0.788 cm2/g.

5. Discussion

5.1. Determine Peak Oil Generation

Previous studies have divided shale maturity evolution into five stages: Ro < 0.5%, representing the immature stage; 0.5% < Ro < 0.7%, denoting a stage of low maturity; 0.7% < Ro < 1.3%, signifying a mature stage; 1.3% < Ro < 2.0%, indicating a high maturity stage; and finally, Ro > 2.0%, characterizing an over-mature stage [50]. During burial, as temperature and pressure increase, organic matter in shale matures gradually, and when it reaches a certain range, significant hydrocarbon production begins, leading to the expulsion of petroleum from source rocks [51]. Shales of different maturities exhibit significant differences in oil and gas generation thresholds. For example, when shale samples are of low maturity (Ro < 0.65%), the measured oil generation at Ro 0.65% for well J601-1 shale was 0.34 mg/g, while outcrop shale at Ro 0.71% yielded 2.26 mg/g of oil. well J601-1 shale started gas generation at Ro 0.76%, producing 0.01 mg/g of gas, while Permian basin shales gradually started gas generation at Ro 0.79%, with a gas yield of 0.03 mg/g (Figure 4). This indicates that low maturity shales within the Ro range of 0.65% to 0.71% already possess oil generation capabilities and can expel hydrocarbons. Beyond Ro 0.76%, shales have gas generation capabilities consistent with previous research results [13]. When shale samples reach higher maturity (Ro > 0.8%), the Ro values for oil and gas generation peaks are higher (Figure 5). For instance, well MF7-1 shale at Ro 0.87% exhibited oil generation capability at Ro 0.75%, with an oil yield of 0.49 mg/g and gas generation capability at Ro 0.82%, with a gas yield of 0.08 mg/g. A sample from well Wanpandi 1 with Ro 0.95% started oil generation at Ro 0.96%, with the oil yield being 0.06 mg/g and gas yield being 0.01 mg/g. Well YV-1 shale maturity of Longtan Formation in the western Guizhou was 1.06%, with oil generation starting only when Ro exceeded 0.85%, yielding between 1.5 and 1.9 mg/g of oil; gas generation began when Ro exceeded 1.16%, with gas yield ranging from 0.01 to 0.02 mg/g.
The differences in shale maturity lead to variations in oil generation peaks. For low maturity shales (Ro < 0.65%), the oil generation peak occurred at Ro values below 1.2% (Figure 4). For instance, well J601-1 shale reached its maximum oil yield at Ro 1.12%, with 2.36 mg/g of oil; Pennsylvanian outcrop shale achieved its peak oil yield at Ro 1.19%, with 17.02 mg/g of oil. These results are consistent with previous experiments on low maturity shales from the Shanxi Formation in the Ordos Basin, where the oil generation peak was observed at a Ro value of 1.20% [52]. In contrast, for higher maturity shales (Ro > 0.8%), the oil generation peak occurred at significantly higher Ro values, typically above 1.2%, ranging from 1.22% to 1.6% (Figure 5). For example, the oil generation peak for the well Zhuang 284 shale in the Triassic Yanchang Formation of the Ordos Basin corresponded to a maturity of Ro 1.59%, with a maximum oil yield of 0.73 mg/g. Well YV-1 shale reached its oil generation peak at Ro 1.48%, with an oil generation rate of 3.27 mg/g. Well MF7-1 shale achieved its oil generation peak at Ro 1.22%, with an oil generation rate of 1.36 mg/g.
Compared to thermal simulation experiments with low maturity shale, higher maturity shales showed a significant delay in hydrocarbon generation threshold and peak oil production. The primary reason for the higher maturity threshold and peak oil generation Ro in thermal simulation experiments is attributed to the shale sample utilized, which had a Ro value exceeding 0.8% and reached the mature stage. When immature, shale produced almost no products. Upon heating, as the temperature rose, shale gradually matured and began to generate hydrocarbons. When the kerogen reached maturity, the shale entered the oil window and started producing small amounts of oil [53]. During thermal simulation experiments, using higher maturity samples and heating to the temperature where oil starts to expel, the corresponding Ro value was excessively high. With further heating, the liquid hydrocarbons in the shale reached a peak, but the Ro value calculated at this temperature was based on the maturity level of the shale itself after heating, often exceeding the peak oil generation value tested in immature samples. This led to a higher Ro value associated with the peak oil generation of shale, showing a significant difference from the actual peak oil generation. Therefore, for studying hydrocarbon generation mechanisms and diagenesis in shale, thermal simulation experiments should use lower maturity shale samples to enhance the accuracy and reliability of the research.

5.2. TOC Content and Shale Hydrocarbon Generation

Organic matter is the source of hydrocarbons in shale, with its type and content controlling the shale’s hydrocarbon potential. Organic matter types are classified into sapropelic kerogen (Type I–II) and humic kerogen (Type III), which determine whether shale generates oil or gas [54]. Type I and II1 have strong oil generation potential, while Type II2-III have strong gas generation potential [55]. The organic matter types in the samples of this study were predominantly Type II and III.
The higher the TOC content, the greater the shale’s hydrocarbon generation capacity, showing a robust positive correlation between this capacity and TOC in shale. For poor organic shales (TOC < 2%), at peak maturity, gaseous hydrocarbons predominate, while liquid and gaseous hydrocarbon yields are generally low, with maximum yields of less than 1.00 mg/g, 2.65 mg/g, and 3.00 mg/g, respectively (Figure 6). For instance, well Zhuang 284 shale (type II1 kerogen) with a TOC of 1.32% exhibited a maximum gas yield at 2.63 333 mg/g, minimal liquid hydrocarbon yield at 0.07 mg/g, and a total hydrocarbon yield of 2.70 mg/g at peak maturity. Similarly, well Wanpandi 1 shale (type III kerogen), with TOC of 1.55%, showed a gas yield of 1.90 mg/g, a liquid hydrocarbon yield of 0.08 mg/g, and a total hydrocarbon yield of 1.98 mg/g at peak maturity. Although the TOC in the shale of well Wanpan 1 was slightly higher than in well Zhuang 284, differences in organic matter type and maturity resulted in a slight variation in hydrocarbon yield. The reasons for this discrepancy require further investigation. This study primarily explored the relationship between TOC and hydrocarbon yield. Overall, the low TOC content in the shales of both wells led to a lower total hydrocarbon content. In contrast, for rich organic shales (TOC > 3.5%), gaseous hydrocarbons dominated at peak maturity, with significantly higher yields for both gaseous and total hydrocarbons, reaching a maximum of 21.55 mg/g and 22.80 mg/g, respectively (Figure 7). Well J601-1 shale with a TOC of 3.45% exhibited a total hydrocarbon yield of 7.33 mg/g at peak maturity, with gaseous hydrocarbons contributing 7.29 mg/g and liquid hydrocarbons 0.04 mg/g. Well YV-1 shale with a TOC of 6.53% showed a maximum total hydrocarbon yield of 11.55 mg/g at peak maturity, with liquid and gaseous hydrocarbon yields of 0.03 mg/g and 11.22 mg/g, respectively. Shales from the Pennsylvanian Basin in the United States, with a TOC of 5.52%, exhibited maximum total hydrocarbon yields of 22.80 mg/g at peak maturity, comprising 21.55 mg/g of gaseous hydrocarbons and 1.25 mg/g of liquid hydrocarbons. The hydrocarbon production in shales with varying organic matter content indicated that organic matter content is a major factor influencing shale hydrocarbon generation. Shales with TOC greater than 3% are classified as high organic matter shales, while those with TOC less than 3% are classified as low organic matter shales. High organic matter shales have greater hydrocarbon generation potential under closed conditions than low organic matter shales. Organic matter type controls hydrocarbon generation potential when organic matter content is similar.

5.3. Diagenetic Stage and Pore Evolution of Shale

The classification of diagenetic stages and pore evolution in shale offer an effective approach to examine the characteristics of shale oil and gas generation and enrichment. Based on Tissot’s hydrocarbon generation model [56], shale diagenesis and pore evolution can be categorized into four stages, taking into account clay minerals and pore structure analysis (Figure 8):
Early Diagenesis Stage: The Ro value of this stage is below 0.5%, representing the immature and low maturity periods of shale. Influenced by biotic and diagenetic processes, sediment transforms into kerogen, generating small amounts of biogenic methane gas [57]. Mesopores and macropores dominate the shale pore types, with mesopores being predominant. Compaction is the primary control factor for shale pore evolution [58]. As maturity increases, compaction leads to a reduction in mesopore and macropore volumes in shale. Under acidic conditions, chlorite is not produced, and kaolinite content reaches its maximum; under neutral or alkaline environments, a significant transformation from montmorillonite to illite or chlorite occurs. Diagenesis is weak at this stage.
Middle Diagenesis Stage A: Ro ranging from 0.5% to 1.1%, corresponding to the early maturity phase of shale. During this stage, kerogen thermally cracks to produce liquid hydrocarbons under catalytic conditions, reaching the hydrocarbon generation threshold, with oil production peaking at Ro 1.1%. Gas hydrocarbons also begin to be produced, albeit at lower levels. The process of hydrocarbon generation leads to a reduction in pore volume and surface area of shale due to the initial cracking of sedimentary organic matter and the presence of solid asphalt, thereby impeding pore generation, however, abundant organic micropores form within or between organic matter particles [59], and changes in PH, strengthen diagenetic processes [60]. At this stage, the transformation of clay minerals is evident as kaolinite and smectite decrease, while illite increases. The I/S mixed layer acts as an intermediate product in the transformation from smectite to illite, with variations in its content. Under alkaline conditions, Mg2+ enters the smectite layers in illite–smectite mixed layers, forming Mg(OH)2, leading to a decrease in smectite and a trend towards chlorite/smectite mixed layers. Some smectite transforms into illite or forms illite–smectite, resulting in a reduced smectite content in illite–smectite mixed-layers. Additionally, when K+ is present in pore fluids, kaolinite begins to convert to illite, causing a reduction in kaolinite content [61]. However, due to the test results, no chlorite/montmorillonite mixed layer was detected. The transformation of montmorillonite plays a significant catalytic role in hydrocarbon generation, promoting substantial hydrocarbon production [62]. The deactivation of kaolinite can increase mesoporous and macroporous spaces. Additionally, illitization of kaolinite can facilitate feldspar dissolution, aiding in the formation of secondary pores (Formulas (1) and (2)) [63], which may be a reason for the increase in pore volume and surface area of shale macropores(Ro = 0.76%). The compaction process also leads to a decrease in both pore volume and surface area [64].
3KAlSi3O8(potassium feldspar) + 2H+ + H2O = 2K+ + Al2Si2O5(OH)4(kaolinite) + 4SiO2(quartz)
3Al2Si2O5(OH)4(kaolinite) + 2K+ = 2KAl3Si3O10(OH)2(illite) + 2H+ + 3H2O
Middle Diagenesis Stage B: Ro ranging from 1.1% to 2.0%, corresponding to the high maturity to over-mature period of shale. The thermal cracking in this stage decomposes solid bitumen and kerogen, resulting in the production of significant amounts of methane and heavy hydrocarbon gas, with a notable increase in gas hydrocarbon production and a corresponding decrease in liquid hydrocarbon yield. In this period, substantial transformation of montmorillonite to illite occurs in the I/S mixed layer, resulting in a rapid decrease in montmorillonite content, which aids in the pore network formation [65]. Simultaneously, rapid transformations of kaolinite to illite enhance the heterogeneity of mesopores [66]. The pore volume and surface area initially increased, while the mesoporous pore volume showed a decreasing trend followed by a subsequent increase. The production of organic acids accelerates the efficiency of clay mineral dehydration transformation, further promoting the development of shrinkage fissures, with the predominant spatial features being dissolution pores, clay mineral shrinkage fissures, and organic matter shrinkage fissures [67].
Late Diagenesis Stage: Ro exceeding 2.0%, corresponding to the over-mature period of shale. The residual kerogen undergoes aromatization at this stage, resulting in the formation of methane gas under high temperatures. Simultaneously, liquid hydrocarbons undergo decomposition, leading to a significant increase in cracked gases, while the yield of liquid hydrocarbons decreases until it is almost negligible. Organic pores and microfractures multiply, with the contraction of organic matter edges enlarging organic pore spaces, enhancing connectivity, and forming larger honeycomb-like pores [67]. More micropores develop from original kerogen and solid bitumen, with widespread development of amorphous organic matter microfractures [68]. Illitization of kaolinite occurs during this stage, with measurements showing almost no kaolinite within clay minerals, and although the illite and I/S mixed layer exhibits an increase, the rate of increase stabilizes illitization of kaolinite, and montmorillonite enhances the augmentation of total pore volume and total surface area in mesoporous and macroporous shale.

6. Conclusions

(1) Low maturity shale initiates hydrocarbon generation at an Ro of 0.65%, and reaches peak oil generation at a Ro of 1.1%. Higher maturity shale shows significant delays in both the onset of hydrocarbon generation and expulsion, as well as in peak oil generation, with Ro values exceeding 0.75% and 1.2%, respectively. These delays are primarily attributed to the higher maturity of the shale samples utilized.
(2) The higher TOC content, the greater the shale’s capacity for hydrocarbon generation, and there is a strong positive correlation between TOC and hydrocarbon quantity generated. In lean organic carbon shales, the maximum yields of liquid hydrocarbons, gaseous hydrocarbons, and total hydrocarbons are all respectively less than 1.00 mg/g, 2.65 mg/g, and 3.00 mg/g. And rich organic carbon shales can, respectively, reach maximum yields of 17.02 mg/g, 21.55 mg/g, and 22.80 mg/g.
(3) The diagenesis and pore evolution of shale can be categorized into four distinct stages: the early diagenesis stage (Ro < 0.5%): shale primarily contains mesopores, and the compaction results in a decrease in the pore volume and surface area of both mesopores as well as macropores. Mid-diagenesis stage A (0.5% < Ro < 1.1%): shale starts to generate oil, illite transformation from smectite occurs, leading to changes in pore parameters. The shale pore volume exhibits an increase from 0.0239 cm3/g to 0.0268 cm3/g, while the corresponding pore surface area decreases from 9.837 cm2/g to 9.003 cm2/g. Mid-diagenesis stage B (1.1% < Ro < 2.0%): kerogen decomposition increases gas hydrocarbon production. The mesopore volume of shale initially decreases, then subsequently increases. The pore volume increases from 0.0268 cm3/g to 0.0459 cm3/g, while the surface area increases from 9.003 cm2/g to 11.769 cm2/g. Late diagenesis stage (Ro > 2.0%): liquid hydrocarbon cracks and kaolinite disappears while increasing the illite and I/S mixed layer. This also leads to enhanced organic pores, microfractures, pore volume (0.0507 cm3/g), and surface area (14.755 cm2/g).
(4) When categorizing shale diagenetic stages, the peak hydrocarbon generation in low maturity shale closely corresponds to its diagenetic phase, accurately reflecting shale evolution. However, highly mature shale exhibits notable discrepancies in its hydrocarbon generation peak, inadequately representing the shale’s diagenetic evolution. Therefore, studies focusing on shale diagenetic stage division should prioritize the use of low maturity samples.

Author Contributions

Data curation, writing—original draft preparation, H.S.; supervision, methodology, writing—reviewing and editing, S.G. All authors have read and agreed to the published version of the manuscript.

Funding

This study received support from the Ministry of Science and Technology of the People’s Republic of China (Grant No. 2016ZX05034).

Data Availability Statement

All experimental data are contained within the article.

Acknowledgments

We would like to thank anonymous reviewers for their suggestions.

Conflicts of Interest

The authors declare that we do not have any commercial or associative interests that represent a conflict of interest in connection with the work submitted.

References

  1. Zou, C.N. Shale Oil and Gas. In Unconventional Petroleum Geology, 2nd ed.; Elsevier: Amsterdam, The Netherlands, 2017; pp. 275–321. [Google Scholar] [CrossRef]
  2. Zou, C.N.; Zhao, Q.; Dong, D.Z.; Yang, Z.; Qiu, Z.; Liang, F.; Wang, N.; Huang, Y.; Duan, A.X.; Zhang, Q.; et al. Geological characteristics, main challenges and future prospect of shale gas. J. Nat. Gas Geosci. 2017, 2, 273–288. [Google Scholar] [CrossRef]
  3. Soeder, D.J. The successful development of gas and oil resources from shales in North America. J. Petrol. Sci. Eng. 2018, 163, 399–420. [Google Scholar] [CrossRef]
  4. Goodarzi, F.; Hosseininejad, S.; Pedersen, P.K.; Gentzis, T.; Sanei, H. Characterization of immature oil shales from the Cretaceous Second White Specks Formation in Saskatchewan and Manitoba, Canada. Mar. Pet. Geol. 2022, 143, 105774. [Google Scholar] [CrossRef]
  5. Sohail, G.M.; Radwan, A.E.; Mahmoud, M. A review of Pakistani shales for shale gas exploration and comparison to North American shale plays. Energy Rep. 2022, 8, 6423–6442. [Google Scholar] [CrossRef]
  6. Ma, Y.S.; Cai, X.Y.; Zhao, P.R. China’s shale gas exploration and development: Understanding and practice. Pet. Explor. Dev. 2018, 45, 589–603. [Google Scholar] [CrossRef]
  7. Wang, R.Y.; Wang, G.P.; Zhao, G.; Qian, M.H.; Liu, Y.J.; He, W.L.; Li, Z.H. Geological characteristics and resources potential of shale oil in Chang7 Member of Upper Triassic Yanchang Formation in Fuxian area, southern Ordos Basin, western China. Unconv. Resour. 2023, 3, 237–247. [Google Scholar] [CrossRef]
  8. Zou, C.N.; Yang, Z.; Cui, J.W.; Zhu, R.K.; Hou, L.H.; Tao, S.Z.; Yuan, X.J.; Wu, S.T.; Lin, S.H.; Wang, L.; et al. Formation mechanism, geological characteristics and development strategy of nonmarine shale oil in China. Pet. Explor. Dev. 2013, 40, 15–27. [Google Scholar] [CrossRef]
  9. Jiang, F.J.; Hu, M.L.; Hu, T.; Lyu, J.H.; Huang, L.L.; Liu, C.L.; Jiang, Z.X.; Huang, R.D.; Zhang, C.X.; Wu, G.Y.; et al. Controlling factors and models of shale oil enrichment in Lower Permian Fengcheng Formation, Mahu Sag, Junggar Basin, NW China. Pet. Explor. Dev. 2023, 50, 812–825. [Google Scholar] [CrossRef]
  10. Gentzis, T. A review of the thermal maturity and hydrocarbon potential of the Mancos and Lewis shales in parts of New Mexico, USA. Int. J. Coal Geol. 2013, 113, 64–75. [Google Scholar] [CrossRef]
  11. Gentzis, T. Review of the hydrocarbon potential of the Steele Shale and Niobrara Formation in Wyoming, USA: A major unconventional resource play? Int. J. Coal Geol. 2016, 166, 118–127. [Google Scholar] [CrossRef]
  12. Guo, S.B.; Mao, W.J. Division of diagenesis and pore evolution of a Permian Shanxi shale in the Ordos Basin, China. J. Petrol. Sci. Eng. 2019, 182, 106351. [Google Scholar] [CrossRef]
  13. He, Q.B.; Chen, S.J.; Li, S.X.; Guo, B.Z.; Lu, J.G.; Li, Y.; Li, X.G.; Zhao, L.P.; Ma, Z.W. Organic geochemical characteristics and hydrocarbon generation mechanism of marine-continental transitional organic-rich shale: A case study from the Shanxi formation in the eastern margin of the Ordos Basin. J. Petrol. Sci. Eng. 2022, 219, 111116. [Google Scholar] [CrossRef]
  14. Li, K.; Cheng, Y.; Su, L.; Zhang, T.Y.; Tang, G.M.; He, J.H.; Wang, H.D. Experiment on hydrocarbon generation characteristics of lacustrine mudstone in third member of Dongying Formation, Bohai Oilfield, Bohai Bay Basin. Nat. Gas Geosci. 2023, 34, 2210–2221, (In Chinese with English Abstract). [Google Scholar] [CrossRef]
  15. Li, G.X.; Zhang, B.; Wu, K.Y.; Wu, S.T.; Wang, X.M.; Zhang, J.; Qi, X.N.; Zhang, N.; Xing, H.T.; Xian, C.G.; et al. Low organic matter abundance and highly efficient hydrocarbon generation of saline source rock in the Qaidam Basin, NW China. Pet. Explor. Dev. 2023, 50, 898–910. [Google Scholar] [CrossRef]
  16. Xu, L.W.; Yang, K.J.; Wei, H.; Liu, L.F.; Jiang, Z.X.; Li, X.; Chen, L.; Xu, T.; Wang, X.M. Pore evolution model and diagenetic evolution sequence of the Mesoproterozoic Xiamaling shale in Zhangjiakou, Hebei. J. Petrol. Sci. Eng. 2021, 207, 109115. [Google Scholar] [CrossRef]
  17. Hu, C.E.; Tan, J.Q.; Lyu, Q.; Zhang, Y.L. Evolution of organic pores in Permian low maturity shales from the Dalong Formation in the Sichuan Basin: Insights from a thermal simulation experiment. Gas Sci. Eng. 2024, 121, 205166. [Google Scholar] [CrossRef]
  18. Teng, J.; Qiu, L.W.; Zhang, S.P.; Ma, C.F. Origin and diagenetic evolution of dolomites in Paleogene Shahejie Formation lacustrine organic shale of Jiyang Depression, Bohai Bay Basin, East China. Pet. Explor. Dev. 2022, 49, 1251–1265. [Google Scholar] [CrossRef]
  19. Wang, X.; Wang, M.; Li, J.B.; Shao, H.M.; Deng, Z.X.; Wu, Y. Thermal maturity: The controlling factor of wettability, pore structure, and oil content in the lacustrine Qingshankou shale, Songliao Basin. J. Petrol. Sci. Eng. 2022, 215, 110618. [Google Scholar] [CrossRef]
  20. Zhang, L.F.; Dong, D.Z.; Qiu, Z.; Wu, C.J.; Zhang, Q.; Wang, Y.M.; Liu, D.X.; Deng, Z.; Zhou, S.W.; Pan, S.Q. Sedimentology and geochemistry of Carboniferous-Permian marine-continental transitional shales in the eastern Ordos Basin, North China. Palaeogeogr. Palaeoclimatol. Palaeoecol. 2021, 571, 110389. [Google Scholar] [CrossRef]
  21. Zhao, B.S.; Li, R.X.; Qin, X.L.; Wang, N.; Zhou, W.; Khaled, A.; Zhao, D.; Zhang, Y.N.; Wu, X.L.; Liu, Q. Geochemical characteristics and mechanism of organic matter accumulation of marine-continental transitional shale of the lower permian Shanxi Formation, southeastern Ordos Basin, north China. J. Petrol. Sci. Eng. 2021, 205, 108815. [Google Scholar] [CrossRef]
  22. Qiu, Z.; Song, D.J.; Zhang, L.F.; Zhang, Q.; Zhao, Q.; Wang, Y.M.; Liu, H.L.; Liu, D.X.; Li, S.X.; Li, X.T. The geochemical and pore characteristics of a typical marine–continental transitional gas shale: A case study of the Permian Shanxi Formation on the eastern margin of the Ordos Basin. Energy Rep. 2021, 7, 3726–3736. [Google Scholar] [CrossRef]
  23. Guo, S.B.; Zheng, H.M.; Huang, J.G. Integrated Exploration Prospects of Unconventional Gas of Upper Paleozoic in Ordos Basin. Geol. Sci. Technol. Info. 2014, 33, 69–77, (In Chinese with English Abstract). [Google Scholar]
  24. Guo, S.B.; Peng, Y.X. Determination method of shale gas content: A case study in the Ordos Basin, China. J. Petrol. Sci. Eng. 2019, 173, 95–100. [Google Scholar] [CrossRef]
  25. Dou, W.T.; Hou, M.C.; Chen, H.D.; Dong, G.Y. A research on the conditions of the reservoir formation and the main controlling factors of Upper Triassic Yanchang Formation in Ordos Basin, China. J. Chengdu Univ. Technol. Sci. Technol. Ed. 2008, 35, 686–692, (In Chinese with English Abstract). [Google Scholar] [CrossRef]
  26. Zhang, M.Z.; Ji, L.M.; Wu, Y.D.; He, C. Palynofacies and geochemical analysis of the Triassic Yanchang Formation, Ordos Basin: Implications for hydrocarbon generation potential and the paleoenvironment of continental source rocks. Int. J. Coal Geol. 2015, 152, 159–176. [Google Scholar] [CrossRef]
  27. Yuan, X.J.; Lin, S.H.; Liu, Q.; Yao, J.L.; Wang, L.; Guo, H.; Deng, X.Q.; Cheng, D.W. Lacustrine fine-grained sedimentary features and organicrich shale distribution pattern: A case study of Chang7 Member of Triassic Yanchang Formation in Ordos Basin, NW China. Pet. Explor. Dev. 2015, 42, 37–47. [Google Scholar] [CrossRef]
  28. Er, C.; Li, Y.Y.; Zhao, J.Z.; Wang, R.; Wei, Z.K. Characteristics of lacustrine organic-rich shale: A case study of the Chang 7 member, Triassic Yanchang Formation, Ordos Basin, China. J. Nat. Gas Geosci. 2016, 1, 173–185. [Google Scholar] [CrossRef]
  29. Lu, H.; Li, Q.; Yue, D.L.; Wu, S.H.; Fu, Y.P.; Tang, R.Z.; Zhang, Z.Y. Study on optimal selection of porosity logging interpretation methods for Chang 73 segment of the Yanchang Formation in the southwestern Ordos Basin, China. J. Petrol. Sci. Eng. 2021, 198, 108153. [Google Scholar] [CrossRef]
  30. Jiang, S.; Chen, L.; Wu, Y.; Jiang, Z.L.; McKenna, E. Hybrid plays of Upper Triassic Chang7 lacustrine source rock interval of Yanchang Formation, Ordos Basin, China. J. Petrol. Sci. Eng. 2017, 159, 182–196. [Google Scholar] [CrossRef]
  31. Tanner, L.H.; Wang, X.; Morabito, A.C. Fossil charcoal from the Middle Jurassic of the Ordos Basin, China and its paleoatmospheric implications. Geosci. Front. 2012, 3, 493–502. [Google Scholar] [CrossRef]
  32. Guo, S.B. The influence of the pre-existing topography on the depositionary systems, the development of the Lower Jurassic reservoirs and hydrocarbon accumulation in Central Western Ordos Basin. J. Petrol. Sci. Eng. 2010, 75, 129–134. [Google Scholar] [CrossRef]
  33. Wang, D.D.; Shao, L.Y.; Li, Z.X.; Li, M.P.; Lv, D.W.; Liu, H.Y. Hydrocarbon generation characteristics, reserving performance and preservation conditions of continental coal measure shale gas: A case study of Mid-Jurassic shale gas in the Yan’an Formation, Ordos Basin. J. Petrol. Sci. Eng. 2016, 145, 609–628. [Google Scholar] [CrossRef]
  34. Peng, Y.X.; Guo, S.B. Lithofacies analysis and paleosedimentary evolution of Taiyuan Formation in Southern North China Basin. J. Petrol. Sci. Eng. 2023, 220, 111127. [Google Scholar] [CrossRef]
  35. Tang, S.; Zhang, J.C.; Elsworth, D.; Tang, X.; Li, Z.M.; Du, X.R.; Yang, X.Q. Lithofacies and pore characterization of the Lower Permian Shanxi and Taiyuan shales in the southern North China Basin. J. Nat. Gas Sci. Eng. 2016, 36, 644–661. [Google Scholar] [CrossRef]
  36. Sun, J.; Zheng, Q.G.; Wen, Z.H.; Hou, F.H.; Xiao, R.; Ren, J.Z. Shale gas reservoir-forming conditions and exploration prospect in Permian Shanxi Formation of the Southern North China basin. Mar. Geol. Front. 2014, 30, 20–27, (In Chinese with English Abstract). [Google Scholar] [CrossRef]
  37. He, Q.; Dong, T.; He, S.; Zhai, G.Y. Methane adsorption capacity of marine-continental transitional facies shales: The case study of the Upper Permian Longtan Formation, northern Guizhou Province, Southwest China. J. Petrol. Sci. Eng. 2019, 183, 106406. [Google Scholar] [CrossRef]
  38. Liu, S.X.; Wu, C.F.; Li, T.; Wang, H.C. Multiple geochemical proxies controlling the organic matter accumulation of the marine-continental transitional shale: A case study of the Upper Permian Longtan Formation, western Guizhou, China. J. Nat. Gas Sci. Eng. 2018, 56, 152–165. [Google Scholar] [CrossRef]
  39. Fan, M.J.; Alsalem, O.B.; Tian, H.; Kasprowicz, F.; Valencia, V.A. Paleozoic evolution and heterogeneity of sediment provenance in the permian basin. Palaeogeogr. Palaeoclimatol. Palaeoecol. 2022, 588, 110820. [Google Scholar] [CrossRef]
  40. Fairhurst, B.; Ewing, T.; Lindsay, B. West texas (permian) super basin, united states: Tectonics, structural development, sedimentation, petroleum systems, and hydrocarbon reserves. AAPG Bull. 2021, 105, 1099–1147. [Google Scholar] [CrossRef]
  41. Davis, A.; Kolawole, O.; Watson, M.; Onwumelu, C. Optimal field development and production design for unconventional reservoirs: A case study from central sub-basin, permian basin, new mexico. Pet. Res. 2021, 6, 66–76. [Google Scholar] [CrossRef]
  42. Mazzullo, S.J. Permian stratigraphy and facies, permian basin (texas-new mexico) and adjoining areas in the midcontinent united states. In The Permian of Northern Pangea; Springer: Berlin/Heidelberg, Germany, 1995; pp. 41–60. [Google Scholar] [CrossRef]
  43. DZ/T 0457-2023; Preparation Method for Oil Shale Sample. Ministry of Natural. Resources of the People’s Republic of China: Beijing, China, 2024.
  44. SY/T 5124-2012; Method of Determining Microscopically the Reflectance of Vitrinite in Sedimentary. National Energy Administration of People’s Republic of China: Beijing, China, 2013.
  45. NB/T 14008-2021; Analysis of Full-Scale Pore Size Distribution of Shale Method Combined by Mercury Porosimetry and Gas Adsorption. National Energy Administration of People’s Republic of China: Beijing, China, 2022.
  46. SY/T 5163-2018; Analysis Method for Clay Minerals and Ordinary Non-Clay Mineralsin Sedimentary Rocks by the X-ray Diffraction. National Energy Administration of People’s Republic of China: Beijing, China, 2019.
  47. GB/T 19145-2022; Determination for Total Organic Carbon in Sedimentary Rock. Standardization administration of the People’s Republic of China: Beijing, China, 2022.
  48. Tissot, B.P.; Welte, D.H. Petroleum Formation and Occurrence; Springer Science & Business Media: New York, NY, USA, 1984. [Google Scholar] [CrossRef]
  49. Waples, D.W. Time and temperature in petroleum formation: Application of lopatin’s method to petroleum exploration1. AAPG Bull. 1980, 64, 916–926. [Google Scholar] [CrossRef]
  50. Zhao, W.Z.; Hu, S.Y.; Hou, L.H.; Yang, T.; Li, X.; Guo, B.C.; Yang, Z. Types and resource potential of continental shale oil in China and its boundary with tight oil. Pet. Explor. Dev. 2020, 47, 1–11. [Google Scholar] [CrossRef]
  51. Hakimi, M.H.; Lashin, A.; Varfolomeev, M.A.; Rahim, A.; Sen, S.; Naseem, W.; Saeed, S.A.; Al-Muntaser, A.A.; Qadri, S.M.T.; Mustapha, K.A. Oil generation and expulsion modeling of the syn-rift Salif oil-source rock in the Tihamah Basin, Yemeni Red Sea: Implications for shale oil exploration. J. Afr. Earth Sci. 2023, 202, 104924. [Google Scholar] [CrossRef]
  52. Gao, D.C.; Guo, C.; Jiang, C.F.; Zhang, L.X.; Wang, H.; Shi, P.; Chen, Y.Y. Hydrocarbon generation simulation of low-maturity shale in Shanxi Formation, Ordos Basin. Pet. Geol. Expt. 2018, 40, 454–460, (In Chinese with English Abstract). [Google Scholar]
  53. Sun, J.; Xiao, X.M.; Cheng, P.; Wang, M.L.; Tian, H. The relationship between oil generation, expulsion and retention of lacustrine shales: Based on pyrolysis simulation experiments. J. Petrol. Sci. Eng. 2021, 196, 107625. [Google Scholar] [CrossRef]
  54. Liang, Z.K.; Jiang, Z.X.; Qiao, P.; Wu, W.; Jiang, Y.Q.; Tang, X.L.; Chen, R.H.; Arif, M. Molecular structure and evolution mechanism of shale kerogen: Insights from thermal simulation and spectroscopic analysis. J. Anal. Appl. Pyrolysis 2024, 181, 106648. [Google Scholar] [CrossRef]
  55. Hui, S.S.; Pang, X.Q.; Jiang, F.J.; Wang, C.X.; Mei, S.X.; Hu, T.; Pang, H.; Li, M.; Zhou, X.L.; Shi, K.Y. Quantitative effect of kerogen type on the hydrocarbon generation potential of Paleogene lacustrine source rocks, Liaohe Western Depression, China. Pet. Sci. 2024, 21, 14–30. [Google Scholar] [CrossRef]
  56. Tissot, B.P.; Durand, B.; Espitalie, J.; Combaz, A. Influence of nature and diagenesis of organic matter in formation of petroleum. AAPG Bull. 1974, 58, 499–506. [Google Scholar] [CrossRef]
  57. Dong, C.M.; Ma, C.F.; Luan, G.Q.; Lin, C.Y.; Zhang, X.G.; Ren, L.H. Pyrolysis Simulation Experiment and Diagenesis Evolution Pattern of Shale. Acta Seismol. Sin. 2015, 33, 1053–1061, (In Chinese with English Abstract). [Google Scholar] [CrossRef]
  58. Loucks, R.G.; Reed, R.M.; Ruppel, S.C.; Hammes, U. Spectrum of pore types and networks in mudrocks and a descriptive classification for matrix-related mudrock pores. AAPG Bull. 2012, 96, 1071–1098. [Google Scholar] [CrossRef]
  59. Bernard, S.; Horsfield, B.; Schulz, H.M.; Wirth, R.; Schreiber, A.; Sherwood, N. Geochemical evolution of organic-rich shales with increasing maturity: A STXM and TEM study of the Posidonia Shale (Lower Toarcian, northern Germany). Mar. Pet. Geol. 2012, 31, 70–89. [Google Scholar] [CrossRef]
  60. Lu, J.M.; Ruppel, S.C.; Rowe, H.D. Organic matter pores and oil generation in the Tuscaloosa marine shale. AAPG Bull. 2015, 99, 333–357. [Google Scholar] [CrossRef]
  61. Xu, J.; Ge, Y.J.; He, Y.H.; Pu, R.H.; Liu, L.Y.; Duan, L.; Du, K.F. Quantitative characterization and dynamic evolution of pore structure in shale reservoirs of Chang 7 oil layer group in Yanchang area, Ordos Basin. Oil Gas Geol. 2023, 44, 292–307, (In Chinese with English Abstract). [Google Scholar] [CrossRef]
  62. Li, G.X.; Liu, C.L.; Wang, F.L.; Tang, G.M.; Yang, H.; Zeng, X.X.; Wu, Y.P.; Yang, X.Y. Geochemical characteristics and hydrocarbon generation mode of source rocks of Dongying Formation in Bozhong sag, Bohai Bay Basin. Acta Petrol. Sin. 2022, 43, 1568–1584. [Google Scholar]
  63. Liu, X.P.; Li, W.Q. Research advance on pore evolution of organic-rich shale based on thermal simulation experiment. Sci. Technol. Eng. 2020, 20, 8849–8859, (In Chinese with English Abstract). [Google Scholar]
  64. Wang, Y.; Cheng, H.F.; Hu, Q.H.; Liu, L.F.; Hao, L.W. Diagenesis and pore evolution for various lithofacies of the Wufeng-Longmaxi shale, southern Sichuan Basin, China. Mar. Pet. Geol. 2021, 133, 105251. [Google Scholar] [CrossRef]
  65. Cui, H.Y.; Liang, F.; Ma, C.; Zhong, N.N.; Sha, Y.L.; Ma, W. Pore evolution characteristics of Chinese marine shale in the thermal simulation experiment and the enlightenment for gas shale evaluation in South China. Geosci. J. 2019, 23, 595–602. [Google Scholar] [CrossRef]
  66. Huang, Z.L.; Liu, G.H.; Li, T.J.; Li, Y.T.; Yin, Y.; Wang, L. Characterization and Control of Mesopore Structural Heterogeneity for Low Thermal Maturity Shale: A Case Study of Yanchang Formation Shale, Ordos Basin. Energy Fuels 2017, 31, 11569–11586. [Google Scholar] [CrossRef]
  67. Zhou, Y.; Wu, W.; Zhang, L.; Liu, W.Q.; Feng, Z.D. Evolution characteristies of shale minerals and pores based on thermal simulationby taking the lower Es3 member of Shahejie formation in well Liye l of Dongying sag an example. Petrol. Geol. Eng. 2022, 36, 49–56, (In Chinese with English Abstract). [Google Scholar] [CrossRef]
  68. Xu, L.; Yang, W.; Jiang, Z.X.; Chen, D.X.; Wang, Y.H.; Lu, J.K.; Zhao, M.Z.; Li, L. Evolution and genesis of organic pores in Triassic Xujiahe Formation shale, Western Sichuan Depression, Sichuan Basin. Oil Gas Geol. 2022, 43, 325–340, (In Chinese with English Abstract). [Google Scholar] [CrossRef]
Figure 1. Regional geological overview of different basins. (a) Ordos Basin; (b) Southern North China Basin; (c) Guizhou area; (d) Permian Basin, US.
Minerals 14 00896 g001
Figure 2. Curve characteristics of shale hydrocarbon generation products. (a) Curve of liquid hydrocarbon production; (b) curve of gaseous hydrocarbon production; (c) curve of total hydrocarbon production.
Minerals 14 00896 g002
Figure 3. Evolution characteristics of clay minerals in shale.
Minerals 14 00896 g003
Figure 4. Hydrocarbon generation characteristics of low maturity shale. (a) Well J601-1; (b) shale outcrop.
Minerals 14 00896 g004
Figure 5. Hydrocarbon generation characteristics of high maturity shale. (a) Well MF7-1; (b) Well Zhung 284; (c) Well Wanpandi 1; (d) Well YV-1.
Minerals 14 00896 g005
Figure 6. Shale hydrocarbon potential with poor organic carbon content. (a) Well Zhuang 284 (II1); (b) Well Wanpamdi 1 (II).
Minerals 14 00896 g006
Figure 7. Shale hydrocarbon potential with rich organic carbon content. (a) Well J601-1 (III); (b) Well MF7-1 (III); (c) Well YV-1 (III); (d) shale outcrop (II2).
Minerals 14 00896 g007
Figure 8. Diagram of diagenesis and hydrocarbon generation in relation to changes in pore volume and surface area (Red represents shale oil production, while yellow indicates shale gas production).
Minerals 14 00896 g008
Table 1. Geological parameters of shale samples from different basins.
BasinStrataFormationWellSampling Depth/mKerogen TypeRo/%TOC/%
Ordos BasinTriassicYanchangZhuang 2841595.1II10.811.32
JurassicYananJ601-11134.0III0.63.45
PermianShanxiMF7-11123.1III0.874.65
Southern North China BasinPermianShanxiWanpandi 11421.9III0.951.55
Western GuizhouPermianLongtanYV-1678.0III1.066.53
Permian Basin, USPermianPennsylvanianoutcrop/II20.655.52
Table 2. Main mineral contents of samples from Well J601-1.
WellTemperature (°C)Equivalent Ro (%)Whole Rock Mineral Content (%)
ClayQuartzPotassium FeldsparPlagioclaseSiderite
J601-12000.655333473
J601-12500.7251334753
J601-13000.764937472
J601-13500.825334474
J601-14000.924936472
J601-14501.12513548
J601-15001.37513847
J601-15501.63503857
J601-16002.13483958
J601-16502.63434359
Table 3. Pore volume and surface area of mesopores and macropores under thermal simulation of Well J601-1.
Ro/%Pore Volume (cm3/g)Pore Surface Area (cm2/g)
Mesopore (2–50 nm)Macropore (>50 nm)TotalMesoporoe (2–50 nm)Macropore (>50 nm)Total
0.600.01640.00750.02399.8050.0329.837
0.650.01210.00730.01989.5800.0789.658
0.720.01450.00980.02438.7950.0728.867
0.760.01490.00740.02239.2660.0669.332
0.820.01470.00700.02178.4130.0508.463
0.920.01640.00820.02467.7570.0887.845
1.120.01830.00850.02688.8630.1409.003
1.370.01720.00900.02628.8480.0018.849
1.630.00850.01060.01919.5500.1049.654
2.130.02600.01990.045911.1260.64311.769
2.630.02630.02440.050713.9870.78814.775
Disclaimer/Publisher’s Note: The statements, opinions and data contained in all publications are solely those of the individual author(s) and contributor(s) and not of MDPI and/or the editor(s). MDPI and/or the editor(s) disclaim responsibility for any injury to people or property resulting from any ideas, methods, instructions or products referred to in the content.

