Article

Petrology and Geochemistry of Highly Differentiated Tholeiitic Magmas: Granophyres in the Messejana–Plasencia Great Dyke (Central Iberia)

1
Departamento de Mineralogía y Petrología, Universidad Complutense de Madrid, José Antonio Novais 12, 28040 Madrid, Spain
2
Instituto de Geociencias IGEO (UCM, CSIC), Severo Ochoa 7, 28040 Madrid, Spain
3
Departamento de Observación de la Tierra y Ciencias del Espacio, Instituto Nacional de Técnica Aeroespacial, Carretera de Ajalvir km 4, 28850 Torrejón de Ardoz, Spain
*
Author to whom correspondence should be addressed.
Minerals 2024, 14(3), 316; https://doi.org/10.3390/min14030316
Submission received: 2 February 2024 / Revised: 7 March 2024 / Accepted: 10 March 2024 / Published: 16 March 2024

Abstract

:
The Messejana–Plasencia great dyke (MPGD) is a Late Triassic tholeiitic gabbro intrusion related to the Central Atlantic Magmatic Province. Its large outcrop extent (~530 km), combined with its prolongation below the Duero basin (additional 100 km), makes it one of the world’s largest dykes known. We have studied felsic granophyric bodies appearing in its northernmost segment at different scales, from mm-sized (interstitial micrographic pockets) to felsic dykes of up to 10 m thick and 1.5 km long, intruding within the gabbros. Significant differences exist in the mineral and whole-rock composition of gabbros and granophyres, including the Sr–Nd isotopic ratios. The chemical variation in the gabbros is coherent with fractionation of olivine, clinopyroxene and plagioclase at depth. However, the presence of a compositional gap between gabbros and granophyres (absence of intermediate compositions) and the formation of these late-stage intergranular felsic melts within the gabbro mesostasis suggest that they could be derived by liquid immiscibility. The Sr–Nd isotopic heterogeneity in the MPGD gabbros and the presence of zircons with Variscan ages (~286 Ma), inherited from granulitic rocks, indicate that the mafic magmas experienced some degree of lower crust assimilation during fractionation close to the Moho depth. On the contrary, the scarce xenocrystic Variscan zircon crystals found in a granophyric dyke within the MPGD gabbro display similar textures and ages (~299 Ma) to those of the country rock granites and point to contamination at a different crustal level.

1. Introduction

The Messejana–Plasencia great dyke (MPGD) intruded the Variscan basement of Western Iberia at circa 200 Ma [1]. It has an outcropping length of 530 km and a SW–NE orientation, from the Alentejo (southwestern Portugal) to Avila (central Spain), plus more than ~100 km below the Duero Cenozoic Basin [2]. Such great length, together with its variable width, ranging from 25 to 200 m (Figure 1), makes it the largest dyke and the longest simple tectonic structure crosscutting the Iberian Peninsula [2] and even one of the world’s largest known dykes (slightly longer than the Great Dyke of Zimbabwe, although much thinner). It belongs to the so-called Central Atlantic Magmatic Province (CAMP) and is related to the radiating dyke swarms generated during the opening of the Central Atlantic Ocean in the Triassic–Jurassic transition [3,4].
The MPGD has been studied from the early 1950s, mostly in the Portuguese sector [5,6], to recent years [7,8,9]. Most researchers agree that the dolerites of the MPGD might be the result of partial melting of lithospheric mantle sources enriched by subduction-related components and that they also reflect some degree of crustal contamination, either at the mantle source [9,10] or en route due to lower crustal rocks assimilation [7].
Figure 1. Geological sketch maps showing (A) the Messejana–Plasencia great dyke (MPGD) in the Iberian Peninsula modified after [11] and (B) the northeasternmost segment of the MPGD. Sample locations are shown with stars including the following: (1) Cid quarry (103309, 103310, 103311); (2) NE Sanchorreja (106285, 106286, 106289, 113105, 113106); (3) SW Sanchorreja (106284); (4) Balbarda (103301); (5) Villatoro (103318); (6) Villatoro mountain pass (103317, 104367, 106292, 113104) and (7) Villafranca quarry (103326).
Minerals 14 00316 g001
In its northern sector, the MPGD shows dispersed granophyric veinlets, dykelets and dykes intruding the main gabbroic dolerite dyke [12]. This is a common feature to other gabbroic dykes of the Central Atlantic Magmatic Province (CAMP), as granophyres have been described in the Shelburne dyke of Nova Scotia (Canada) [13], and in the doleritic dyke swarms of the Guyana craton and northern Brazil [14], among others. Rhyolitic interstitial melts have also been described in tholeiitic continental basalts from Nova Scotia (CAM Province) [15]. Two accepted origins for these granophyres are based on open-system magmatic processes, either combining crystal fractionation and variable crustal assimilation [14] or by partial melting of the crust induced by the high thermal energy of gabbroic intrusions [13]. Nevertheless, the formation of granophyres in tholeiitic magmas linked to a closed-system magmatic evolution involving extreme crystal fractionation (e.g., [16]) or melt immiscibility has also been proposed in tholeiitic bodies (e.g., [15,17,18]).
The present work is focused on the easternmost segment of the MPGD, between Villafranca de la Sierra and Sanchorreja villages (45 km long and with an average width of 100 m) (Figure 1). We analysed the mineral chemistry and the major, trace element and isotopic (Sr–Nd) bulk rock geochemistry of the small-volume felsic rocks associated with the dyke, together with data on the zircon populations (zircon petrography and U–Pb geochronology) of two samples (gabbro and granophyre). This study represents the first attempt to constrain the origin of these SiO2-rich felsic melts and their genetic relationship with the host gabbros of the MPGD.

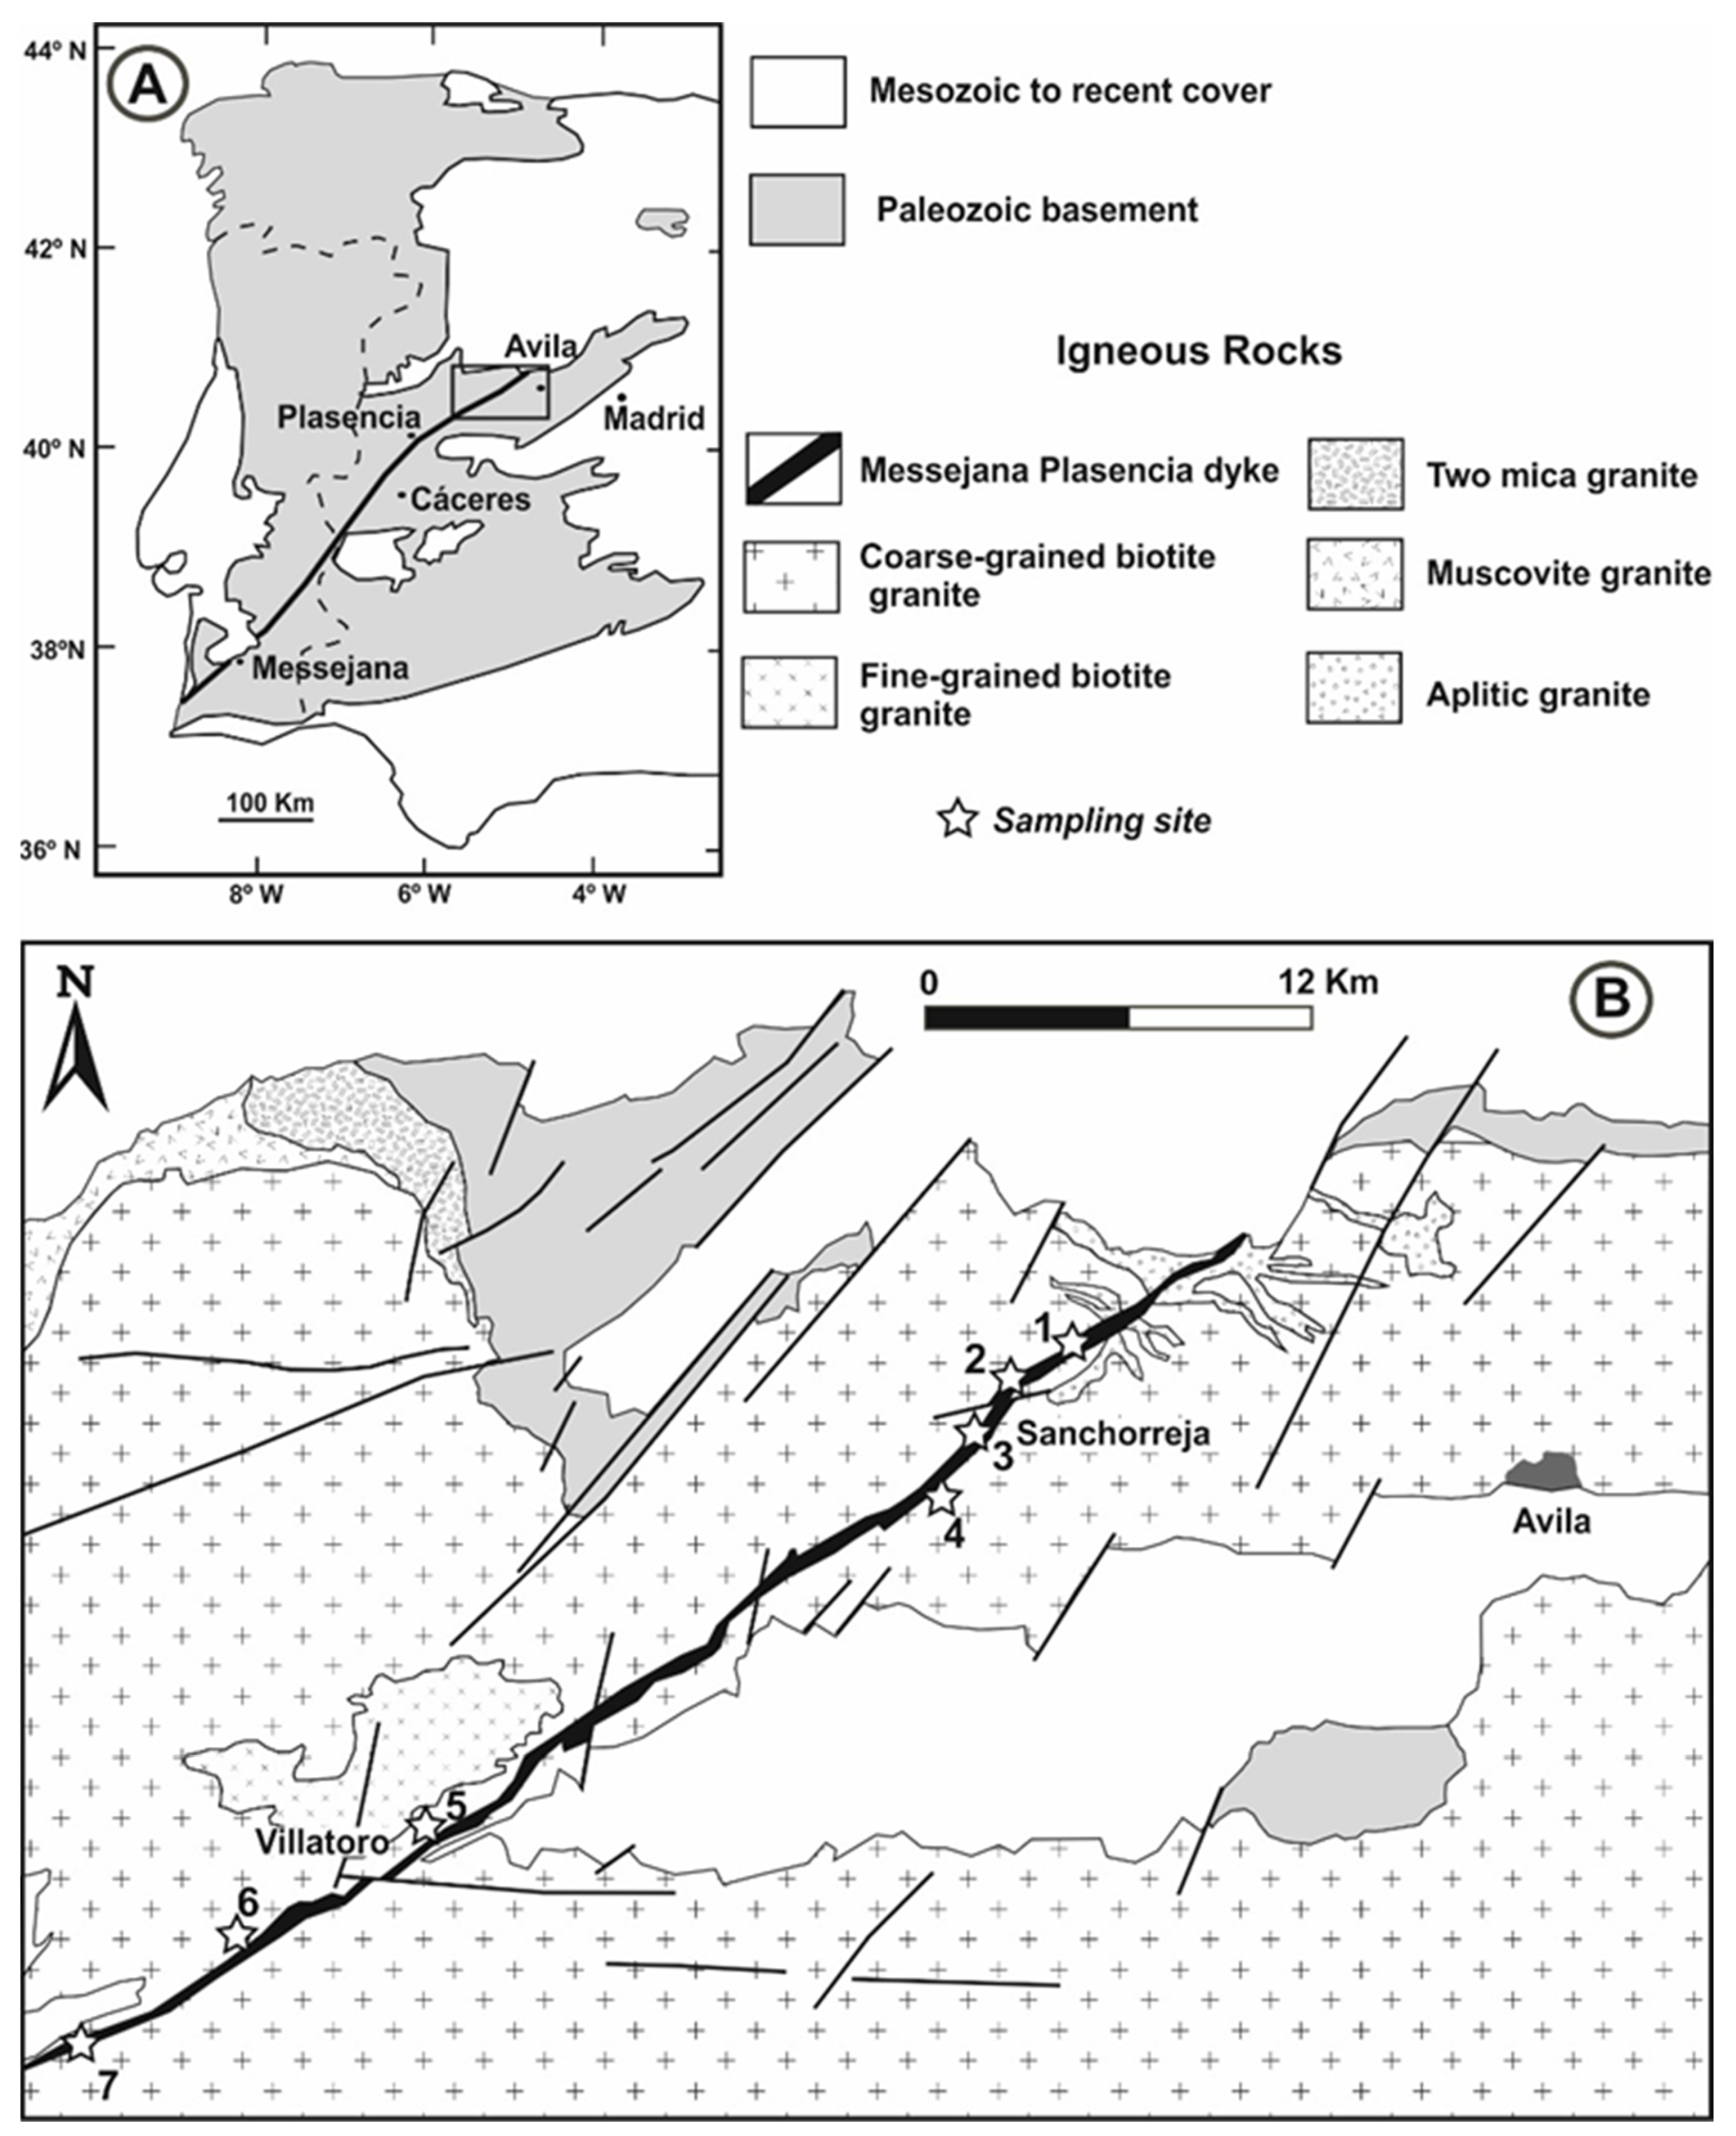
2. Geological Setting

The Iberian Massif is a basement area representing the westernmost part of the European Variscan Belt, a consequence of the continental collision of Gondwana and Laurussia. It outcrops in central and western Iberia and has been subdivided into several zones according to their stratigraphic, structural and petrologic characteristics (e.g., [19]). These zones may be considered independent microterranes originally close to the Gondwana margin or internal–external domains assembled during the Variscan collision in a single terrane (e.g., [20]). The Central Iberian Zone (CIZ) of the Iberian Massif is representative of the innermost region of the Iberian Variscan Belt and is mainly composed of Neoproterozoic to Paleozoic metasedimentary and metaigneous rocks, together with abundant granitic plutons, which intruded during the last stages of the orogeny.
Several post-Variscan magmatic events have been recognised in the CIZ, which consist mainly of small subvolcanic intrusions, dykes and volcanic products of alkaline, tholeiitic or transitional composition. The oldest one corresponds to a suite of volatile-rich mafic–ultramafic alkaline dykes (diabases and alkaline lamprophyres) of Permian age (274–264 Ma) ([21] and references therein) accompanied by monzogabbroic to syenitic porphyries. They are found in central Iberia [21,22] and northern Portugal [23], and have been related to a rifting context after the Permo-Carboniferous extension in western Europe, resulting in the rise of the asthenospheric mantle and melting of lithospheric and asthenospheric mantle sources [8,21].
The main post-Variscan tholeiitic magmatism is represented by the large Messejana–Plasencia dyke–fault system, which is a conspicuous geological intrusion within the Iberian Massif due to its length (>530 km) and width (25–200 m; locally > 300 m). It is mainly made of gabbros outcropping discontinuously from its SW endpoint (Alentejo) to the NE until it is covered by Cenozoic sediments in the Duero basin. According to the most accurate geochronology studies based on 40Ar/39Ar dating, the dyke was likely emplaced as a result of several magma injections during the Jurassic–Triassic transition (~206–200 Ma) [1,10,24]. However, paleomagnetic data on the MPGD, as well as other CAMP mafic dykes, point to magma intrusion taking no longer than 1 Ma [25]. The main petrographic features and preliminary data on the whole-rock and mineral geochemistry have been described in several studies focused on different sectors along the dyke [7,9,11,12,26,27,28,29]. These works have highlighted the presence of variable textures in the gabbros from coarse-grained to fine-grained (sometimes associated with core–margin dyke zonation) and scarce inner pegmatoid bodies. The whole-rock composition of the MPGD gabbros reveals an affinity to low-Ti continental tholeiites and a moderate enrichment in some incompatible trace elements (LILE), and the Sr–Nd–Pb isotope signatures are in accordance with a significant degree of crystal fractionation and small percentages of assimilation of lower-crustal rocks [7].
The easternmost segment of the MPGD intrudes mainly in Variscan peraluminous granitic rocks. Between Villafranca de la Sierra and Sanchorreja (Figure 1), the dyke includes diverse granophyric bodies cutting the mafic rocks in its central zone. The presence of occasional quartz-bearing leucocratic bodies of granophyric texture inside the MPGD has already been described [12,26], mainly in this NE segment, but also in its central part, where these felsic structures are less abundant. However, very scarce geochemical data exist on these rocks, and their origin has not been discussed yet.

3. Materials and Methods

The major element mineral composition was determined at the Centro de Microscopía Electrónica “Luis Bru” (Complutense University of Madrid) using a JEOL JZA-8900 M electron microprobe with four wavelength dispersive spectrometers. The accelerating voltage during the analyses was 15 kV and the electron beam current was 20 nA, with a beam diameter of 5 μm. The counting time was 10 s on the peak and 5 s on each background position. The following mineral standards were used: sillimanite for Al; albite for Si and Na; almandine for Fe and Mn; kaersutite for Mg; microcline for K; ilmenite for Ti; Ni alloy for Ni and chromite for Cr. Corrections were made using the ZAF method. Analytical precision, expressed as a relative percentage, is 0.5–6% for oxides with concentration > 1.5 wt.% and <10% for oxides with concentration < 1.5 wt.%.
The whole-rock composition of 8 samples (7 granophyres and 1 gabbro) was determined at the Actlabs laboratories (Ancaster, ON, Canada) for major and trace elements. The fusion technique was used by employing lithium metaborate/tetraborate. The molten bead was then digested in a weak nitric acid solution. The samples were analysed by inductively coupled plasma optic emission spectrometry (ICP–OES) for major elements, while trace elements were determined by ICP mass spectrometry (ICP–MS), using a Thermo Jarrell Ash ENVIRO II simultaneous and sequential ICP or a Perkin Elmer Optima 3000 ICP. Uncertainties in major elements were always below 0.01%. All elements were analysed under the control of certified international standards (SY-3, NIST 694, W-2a, DNC-1, BIR-1 and GBW 07113). Further details on calibration, detection limits of trace elements, etc., can be found at http://www.actlabs.com/ (accessed on 2 February 2024).
Five granophyre samples and one gabbro were selected to determine their Sr–Nd isotopic signatures. The analyses were performed at the CAI de Geocronología y Geoquímica Isotópica of the Complutense University in Madrid, using an automated VG Sector 54 multicollector thermal ionisation mass spectrometer with data acquired in multidynamic mode. Isotopic ratios of Sr and Nd were measured on an aliquot of whole-rock powder. The Sr–Nd analytical procedures used in this laboratory have been described elsewhere [30]. Repeated analysis of NBS 987 gave 87Sr/86Sr = 0.710249 ± 30 (2σ, n = 15) and for the JM Nd standard, 143Nd/144Nd = 0.511809 ± 20 (2σ, n = 13). The 2σ error on calculated ε(Nd) values was ±0.4.
Two samples were selected for U–Pb geochronology including one granophyre and one gabbro. Zircons were separated and concentrated using standard techniques, and a representative selection was handpicked from each sample. They were mounted in epoxy resin for microanalytical analysis at the IBERSIM laboratories (University of Granada, Spain), together with the reference zircons TEMORA 1, SL13 and REG. The mount was polished, and the zircon central portions were imaged with transmitted and reflected light and with cathodoluminescence on a scanning electron microscope. U, Th and Pb isotopes were analysed on the Sensitive High-Resolution Ion Microprobe (SHRIMP II) with each analysis consisting of six scans through the relevant mass range. The primary beam, composed of 16O16O+, was set to an intensity of about 5 nA, with a 120 μm Kohler aperture, which generates 17 μm × 20 μm elliptical spots on the target. All calibration procedures were performed on the standards included on the same mount. One TEMORA zircon standard was analysed for every four unknown analyses. Data were reduced using SHRIMPTOOLS software, specifically developed for IBERSIMS by Fernando Bea. More details can be found at http://www.ugr.es/~ibersims/ibersims/Sample_analysis_and_methods.html (accessed on 2 February 2024). Pb/U ratios were normalised relative to a value of 0.06683 for the 206Pb/238U ratio of the TEMORA reference zircon, equivalent to an age of 417 ± 1 Ma (IDTIMS in zircon) [31]. Concentration data were normalised against zircon standard SL13 (U = 210 ppm) [32]. Uncertainties given for individual analyses (ratios and ages) are at the 1σ level, and all ages are 204-corrected 206Pb/238U ages. Concordia and probability density plots were drawn using Isoplot 3.0 software [33].

4. Results

This section describes the outcrops, petrography, mineral chemistry and whole-rock geochemistry of granophyre samples from the MPGD. The gabbros, which constitute the main lithology of this dyke, have been studied in detail in previous works [7,10,29]. Nevertheless, a brief summary of their petrology and mineral chemistry is also presented in this section, together with the new whole-rock analysis of a gabbro sample.

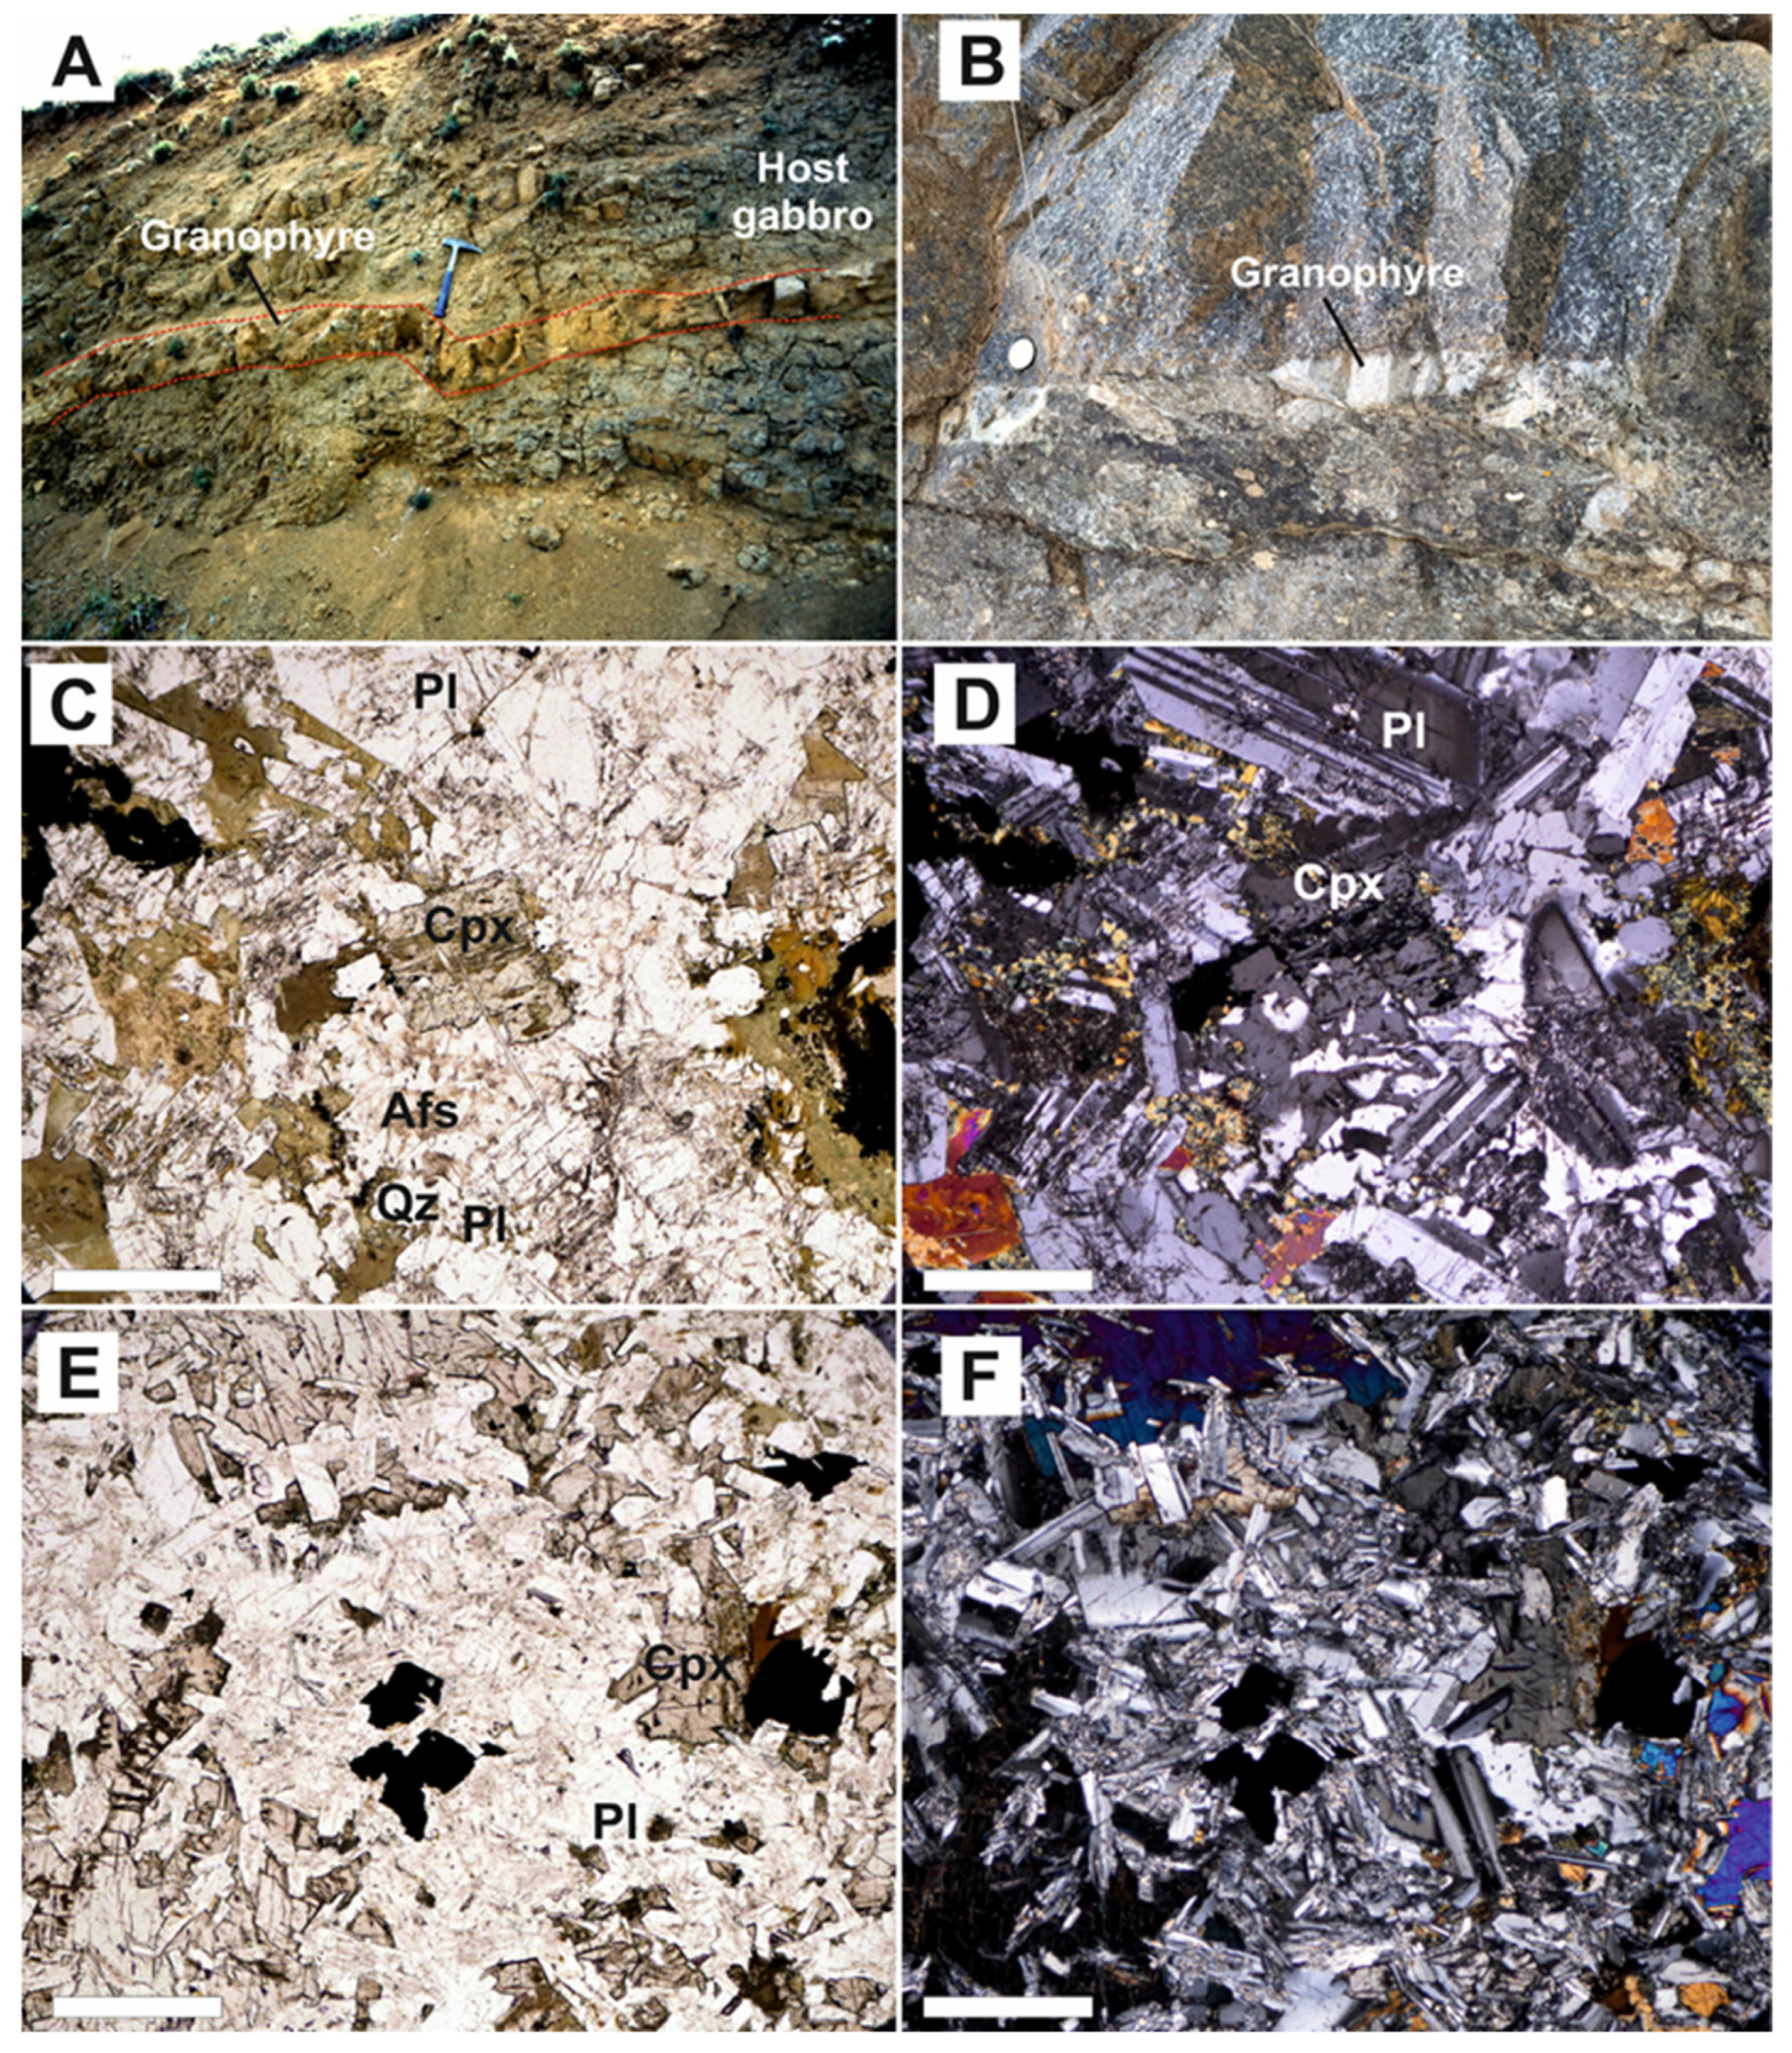
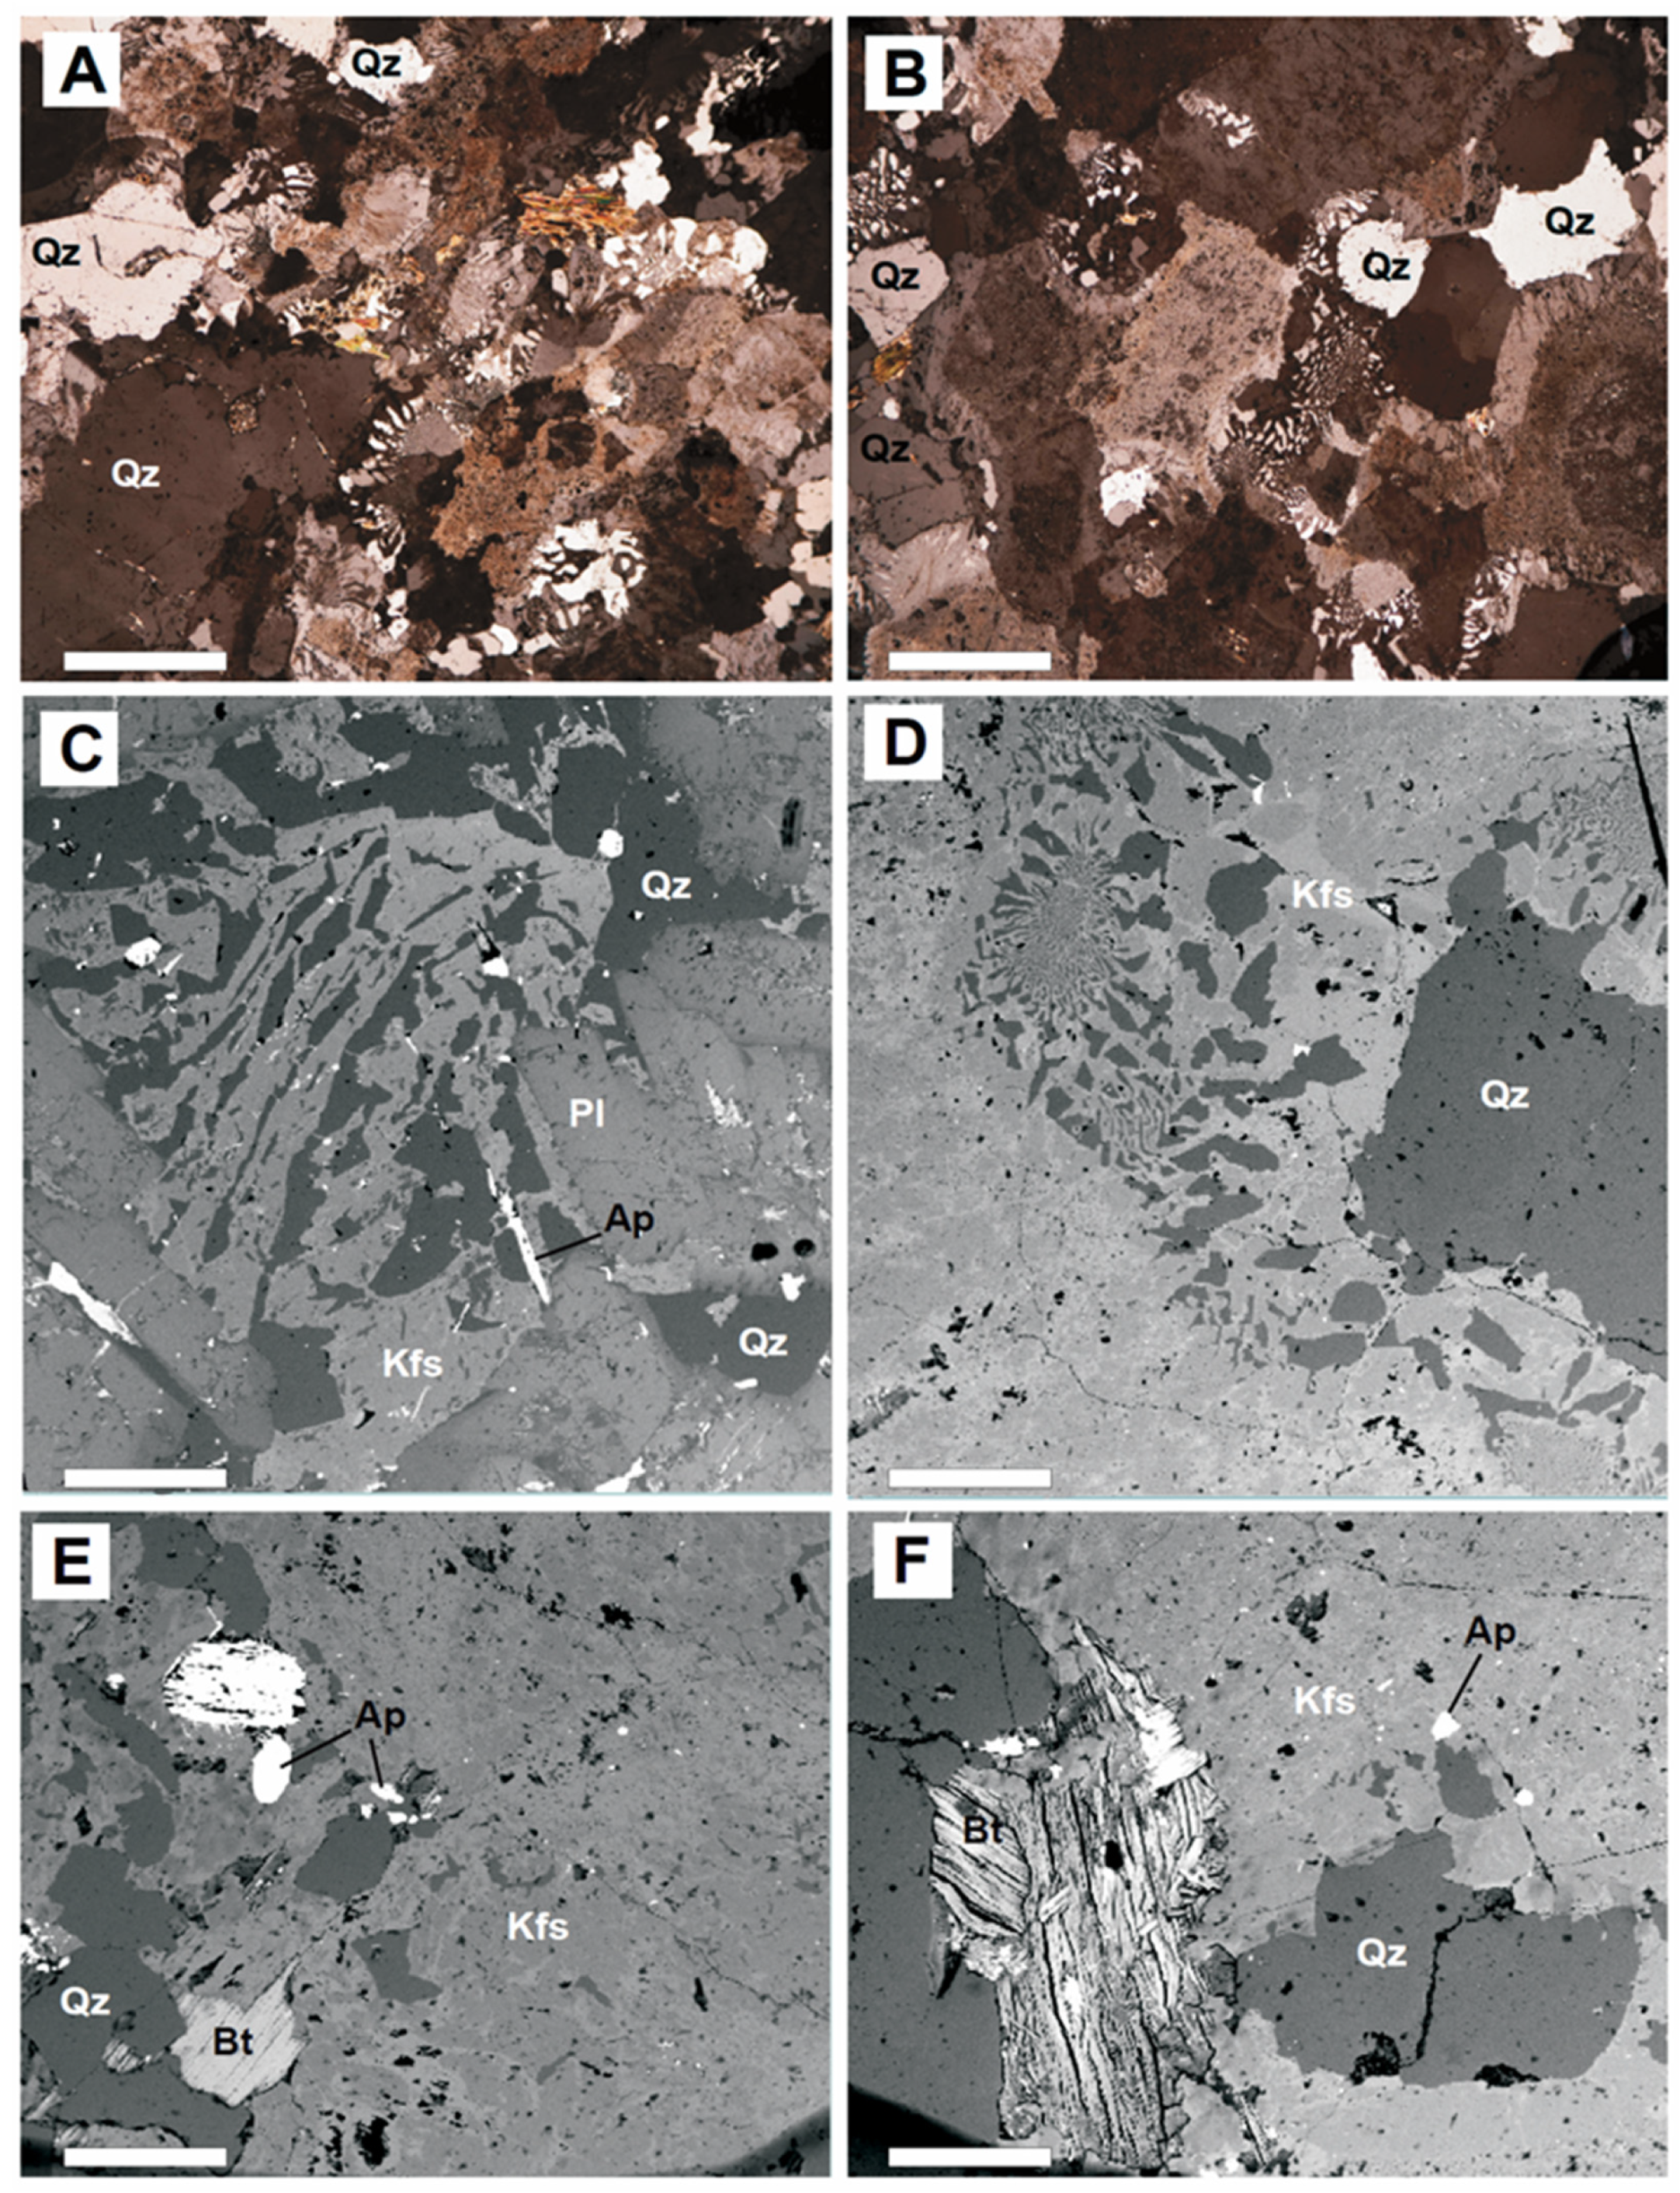
4.1. Outcrop Features and Petrography

The MPGD granophyres appear on variable scales. They can be major leucogranite bodies forming veinlets, irregular dykes of small to moderate size (3 cm to 1 m) or a large dyke (up to 10 m thickness and more than 1.5 km length) within the main gabbroic intrusion (Figure 2A,B); but also interstitial pockets with micropegmatitic quartz–alkali feldspar intergrowths, usually radiating from plagioclase crystals of the diabase (Figure 2C–F).
These leucocratic rocks are found in Sanchorreja, El Cid quarry (north of Sanchorreja), Villatoro pass and the Villafranca de la Sierra quarry (Figure 1). The 15 m wide leucogranitic dyke outcrops in Sanchorreja, show small miarolitic cavities, scarce biotite and small (2–3 cm) fine-grained mafic enclaves. In the rest of the outcrops, granophyres mainly form up to 5–30 cm wide dykelets with sharp contacts and scarce miarolitic cavities (Figure 2A,B). Moreover, abundant interstitial micrographic quartz–alkali feldspar intergrowths appear within the crystal framework of the host diabase (Figure 2C–F) in this NE MPGD segment. These features are consistent with the more evolved composition of this dyke sector when compared with the younger SW segment (Alentejo, Portugal), which also displays less radiogenic BSE-like Sr–Nd isotopic ratios (εNd > 0) [8]. Similar intergrowth textures are also characteristic of the granophyre dykes (Figure 3).
The gabbros from the MPGD display mainly a coarse-grained diabasic texture in its core, which varies to fine-grained subofitic towards the contact. The mineralogy is typical of continental tholeiites with plagioclase, clinopyroxene, Ca-poor pigeonite and orthopyroxene as major phases, as well as minor amphibole, biotite, ilmenite, ulvöspinel, apatite, quartz and alkali feldspar. Accessory olivine may also be present, although usually as a pseudomorph (e.g., [7]). Interstitial quartz between plagioclase laths is common and it sometimes forms micrographic intergrowth with alkali feldspar or albite (Figure 2C–F). Very coarse-grained amphibole-rich pegmatoids are occasional, with the amphibole growing interstitially to plagioclase laths.
The pyroxene composition in the gabbros evolves from Mg-rich to Fe–Ti-rich [29]. This variation is observed in several pyroxene types of the MPGD gabbros. Thus, enstatites (Mg# = 0.80–0.72) evolve towards Ca-poor pigeonite (Mg# = 0.75–0.57) and ferroan enstatite (Mg# = 0.68–0.56). Augite is more abundant than low-Ca pyroxenes (orthopyroxene and pigeonite) and exhibits a broad composition of Wo39–34, En44–35 and Fs22–25 (towards Wo38–46, En21–35 and Fs23–36 in pegmatitic facies). Plagioclase displays a wide compositional range from An75 to An20 (sometimes as core-to-rim zoning), although it frequently shows narrower values typical of labradorite composition (An55–65). Values of An18–03 are observed in interstitial plagioclases associated with quartz–alkali feldspar microgranophyric intergrowths (Figure 4A). H2O-rich mafic minerals (amphibole and biotite) appear mostly as accessory phases rimming previous augite or pigeonite crystals, except in the amphibole-rich pegmatitic gabbros. Amphibole ranges from Fe-edenite to Mg-hornblende, with Mg# in the range of 0.3–0.6 and a negative correlation between Mg and Ti [29]. Biotite composition is typical of subalkaline mafic rocks and is characterised by high Fe (Mg# = 0.2–0.45) and TiO2 (>3 wt%) contents. It is worth mentioning that biotite and apatite crystals of the MPGD gabbros are mostly concentrated in the felsic interstitial granophyric intergrowths, and their chemical composition is very similar and overlaps that of associated granitic granophyres (Figure 4B–F).
Interstitial leucocratic granophyric intergrowth of quartz and albite or alkali feldspar can be found within the diabases (Figure 2C,D), mostly in the MPGD NE segment (Figure 1). The gabbros showing these felsic micro-aggregates are also associated with small felsic granophyre dykes of variable thickness (from a few cm to up to 2 m) and sharp contacts, along with subvertical irregular veins permeating the main gabbroic body. Granophyre mineralogy is simple: quartz, alkali feldspar and scarce albite as major phases, and minor biotite, titanite, acicular apatite, tourmaline and ilmenite, as accessories. The small veins or dykes display an anhedral microgranular texture, also with some subhedral plagioclases, whereas larger dykes develop granophyric texture, with quartz–alkali feldspar intergrowth among plagioclase and quartz crystals (Figure 3). Miarolitic cavities are common in granophyric dykes, filled with prehnite, epidote, Fe-Mg chlorite and fibrous clay minerals.

4.2. Granophyre Mineral Chemistry
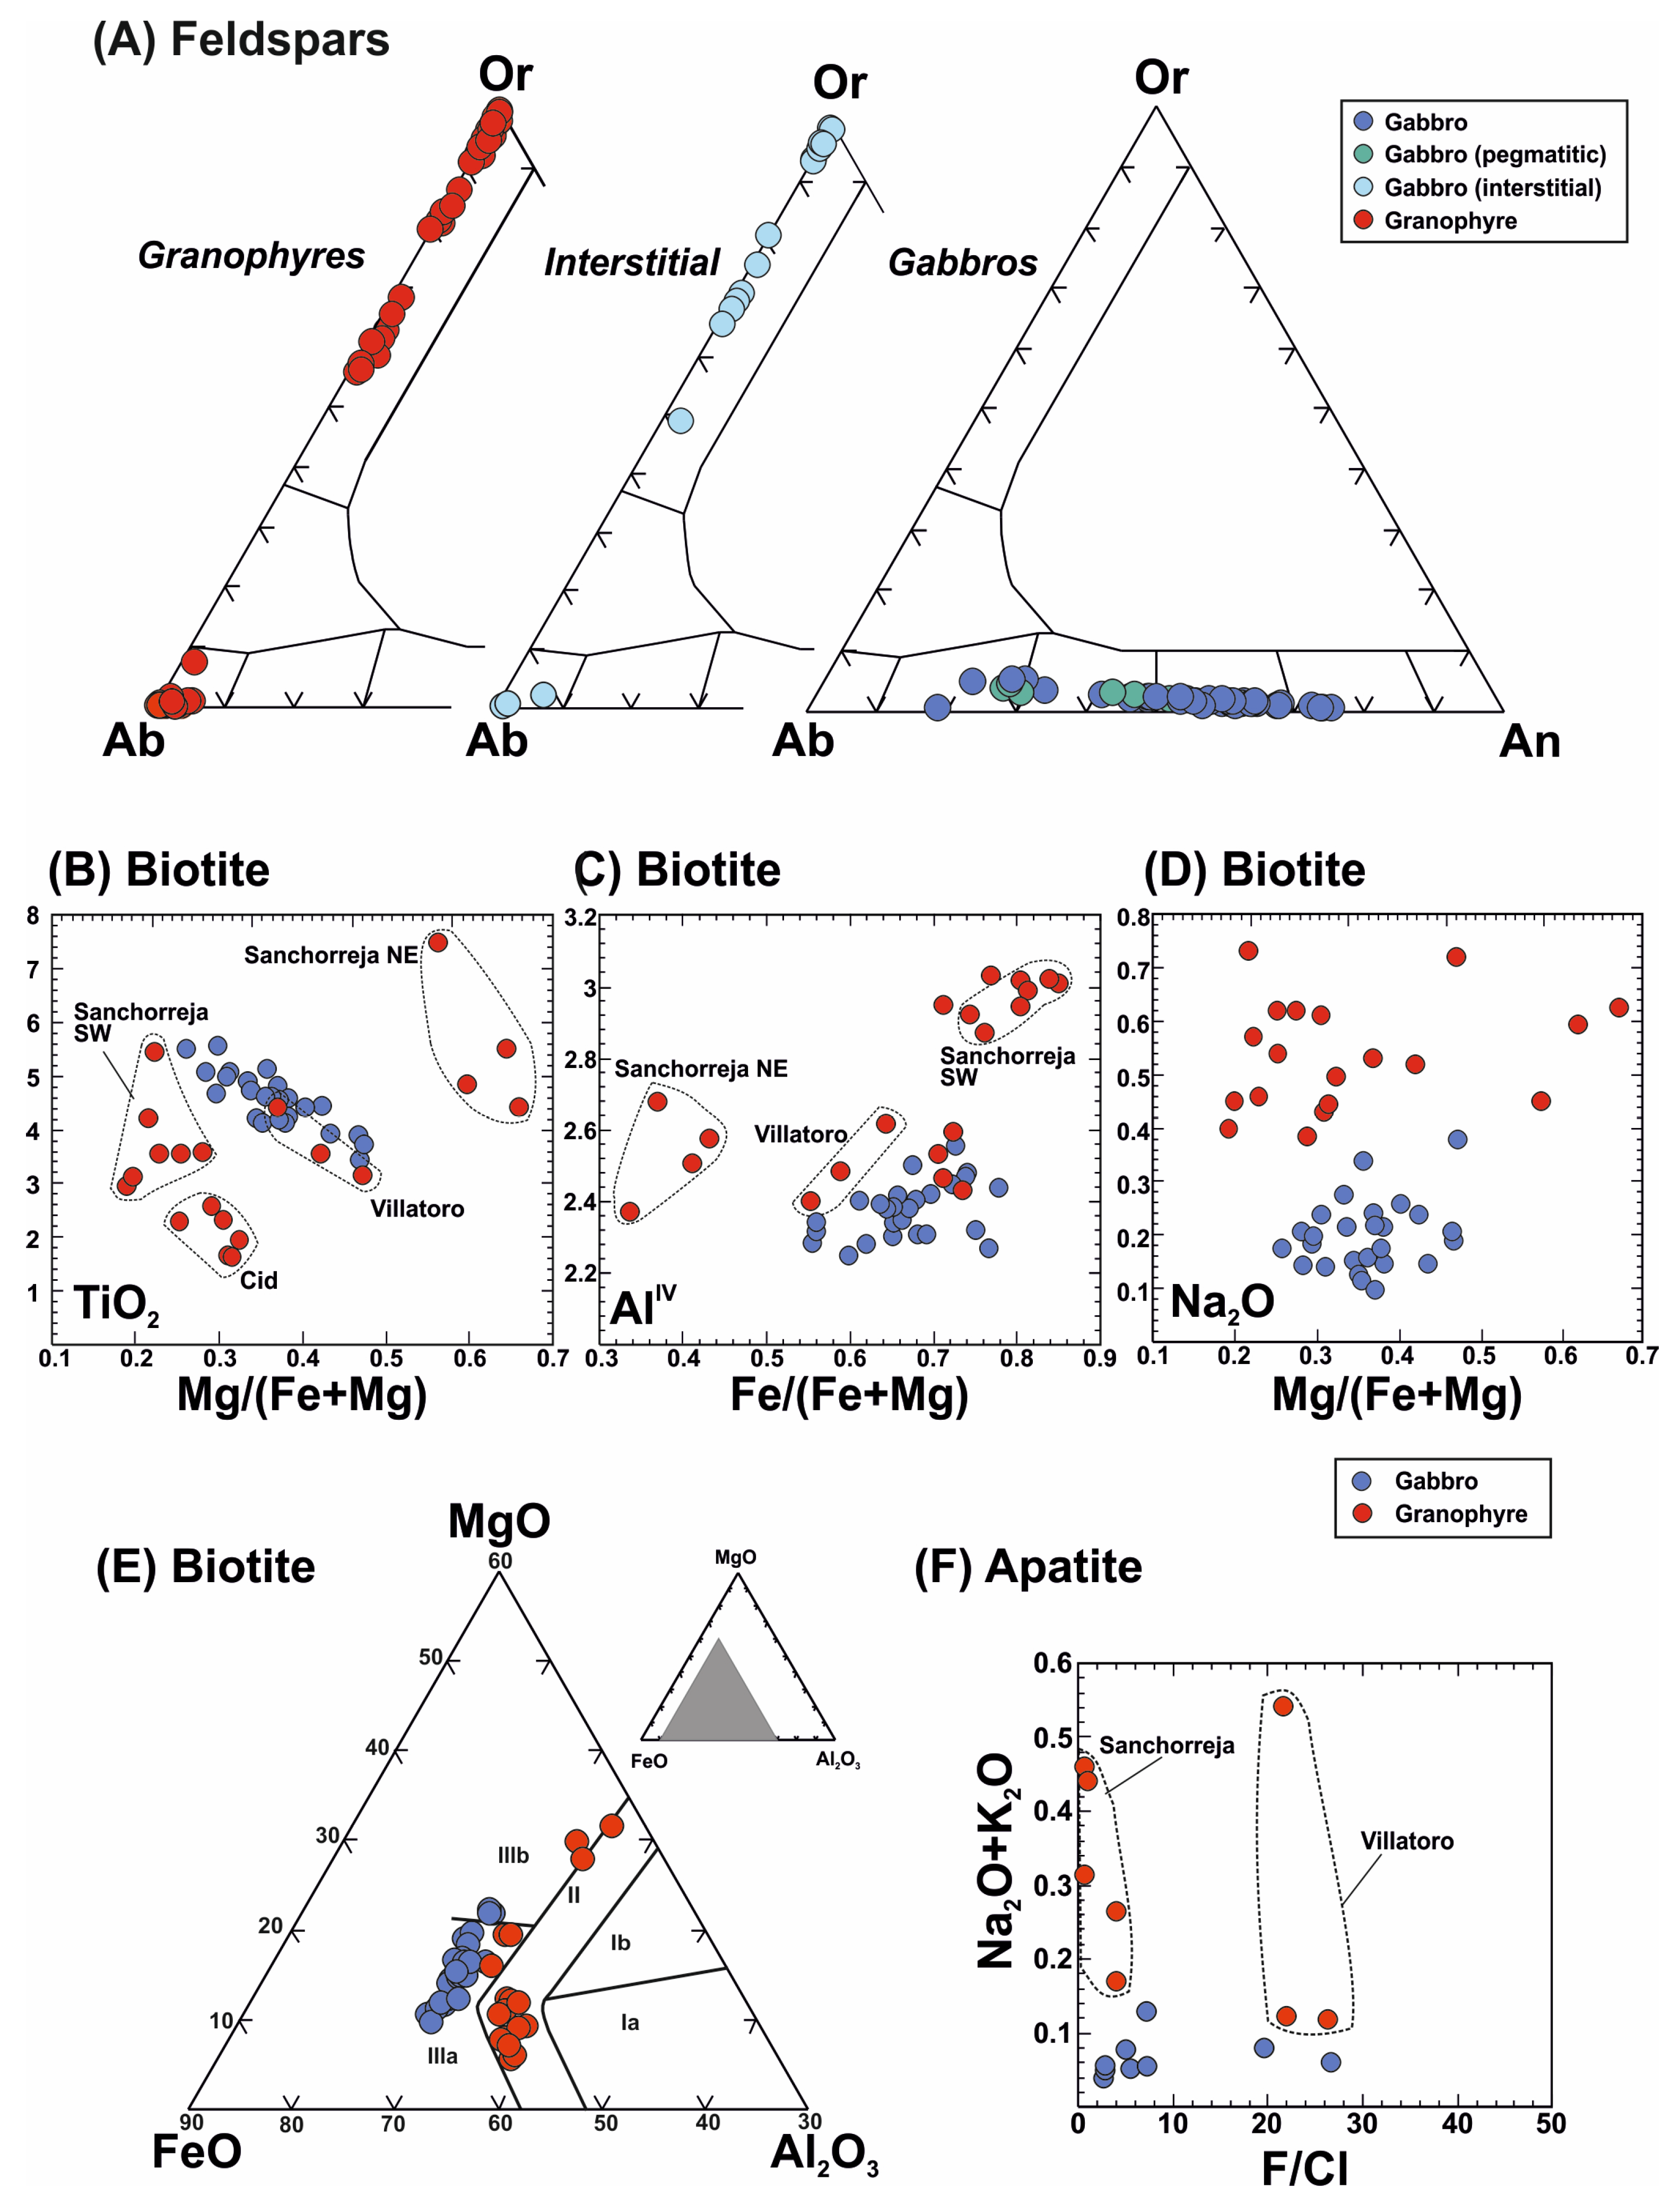
4.2.1. Feldspars

Euhedral and subhedral plagioclase crystals with simple twinning, as well as those from micrographic intergrowths, were analysed (Table 1). In most cases, the composition is that of pure albite (Ab99–Ab94). Alkali feldspars are orthoclase (Or99 Or81) or sanidine (~Or80, rarely reaching Or48) (Figure 4A). The composition of both feldspars is similar to that of those present in the micrographic intergrowths of gabbros (interstitial granophyres of Figure 4A and Table 1).

4.2.2. Biotite

Biotite composition varies significantly depending on the outcrop considered (Figure 4B,C). Two broad biotite types can be distinguished as follows: (1) higher Mg–Ti biotite (mainly from Sanchorreja outcrop 2; Figure 1) and (2) lower Mg–Ti biotite (from other outcrops). These elements are negatively correlated (Figure 4B).
As a whole, biotite shows a negative correlation between Al–Ti and Mg#, and it displays lower TiO2 and higher Al2O3 and Na2O contents when compared with biotite from the host gabbros (Figure 4B–D). It also shows fairly variable K2O values. Biotite from the Villafranca and Villatoro samples has a composition closer to that of the gabbro biotites, mainly with those from the pegmatoid facies (Figure 4B,C).
When plotted in the Mg–Altotal diagram of [36] (not shown), granophyre biotite falls within the field of calc-alkaline series. Most granophyre biotites also plot in calc-alkaline fields according to the classification of [35] (Figure 4E). In these diagrams, gabbro biotites plot in Al-poor subalkaline fields, although there is some overlap with the granophyre compositional field.
The high F content of biotite from these felsic granophyres is remarkable (up to 3.1 wt%, Table 2), which is much higher than that of micas from the MPGD gabbros (mostly F < 0.36 wt%) or from Variscan granites (mostly F < 1.27 wt%).

4.2.3. Apatite

Slight chemical differences can also be observed in apatite from the granophyres. The F/Cl ratio of apatite from the Sanchorreja samples (large dyke, outcrop 2 in Figure 1) is much lower than that of the Villatoro dykelets, and also from some gabbro apatites, although granophyre apatite can show higher Na2O + K2O contents (Figure 4F, Table 2).

4.3. Whole-Rock Composition

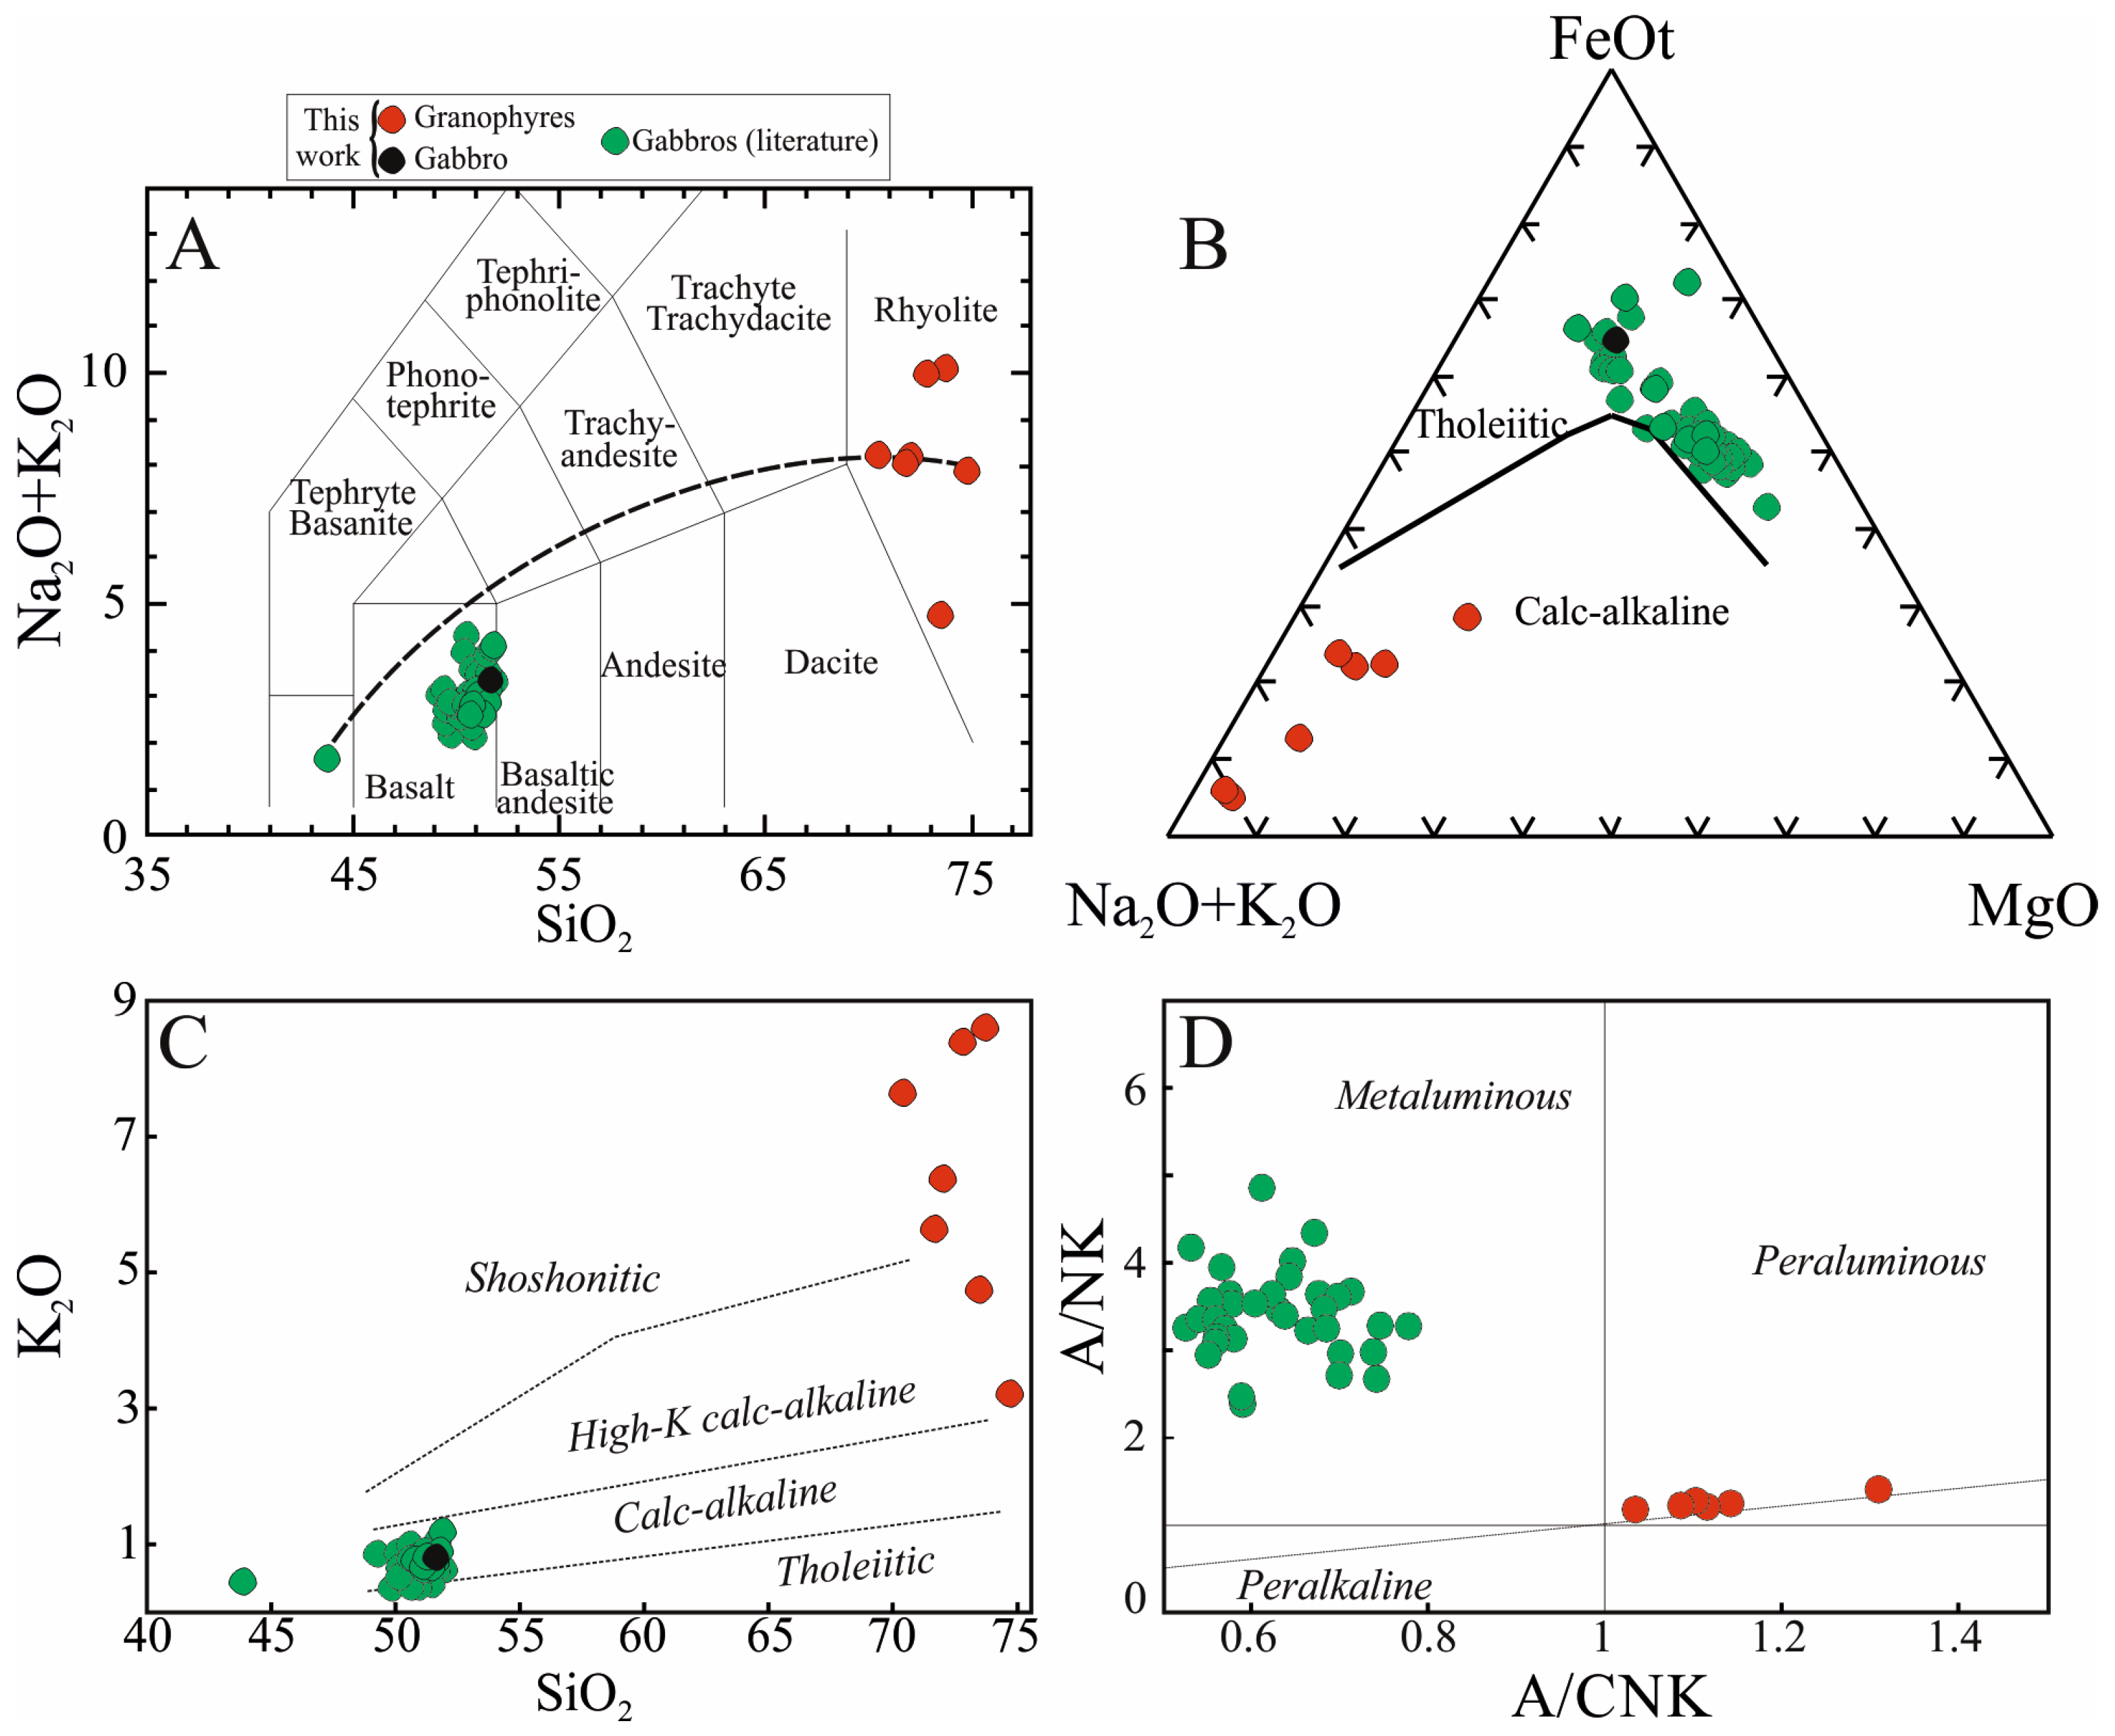
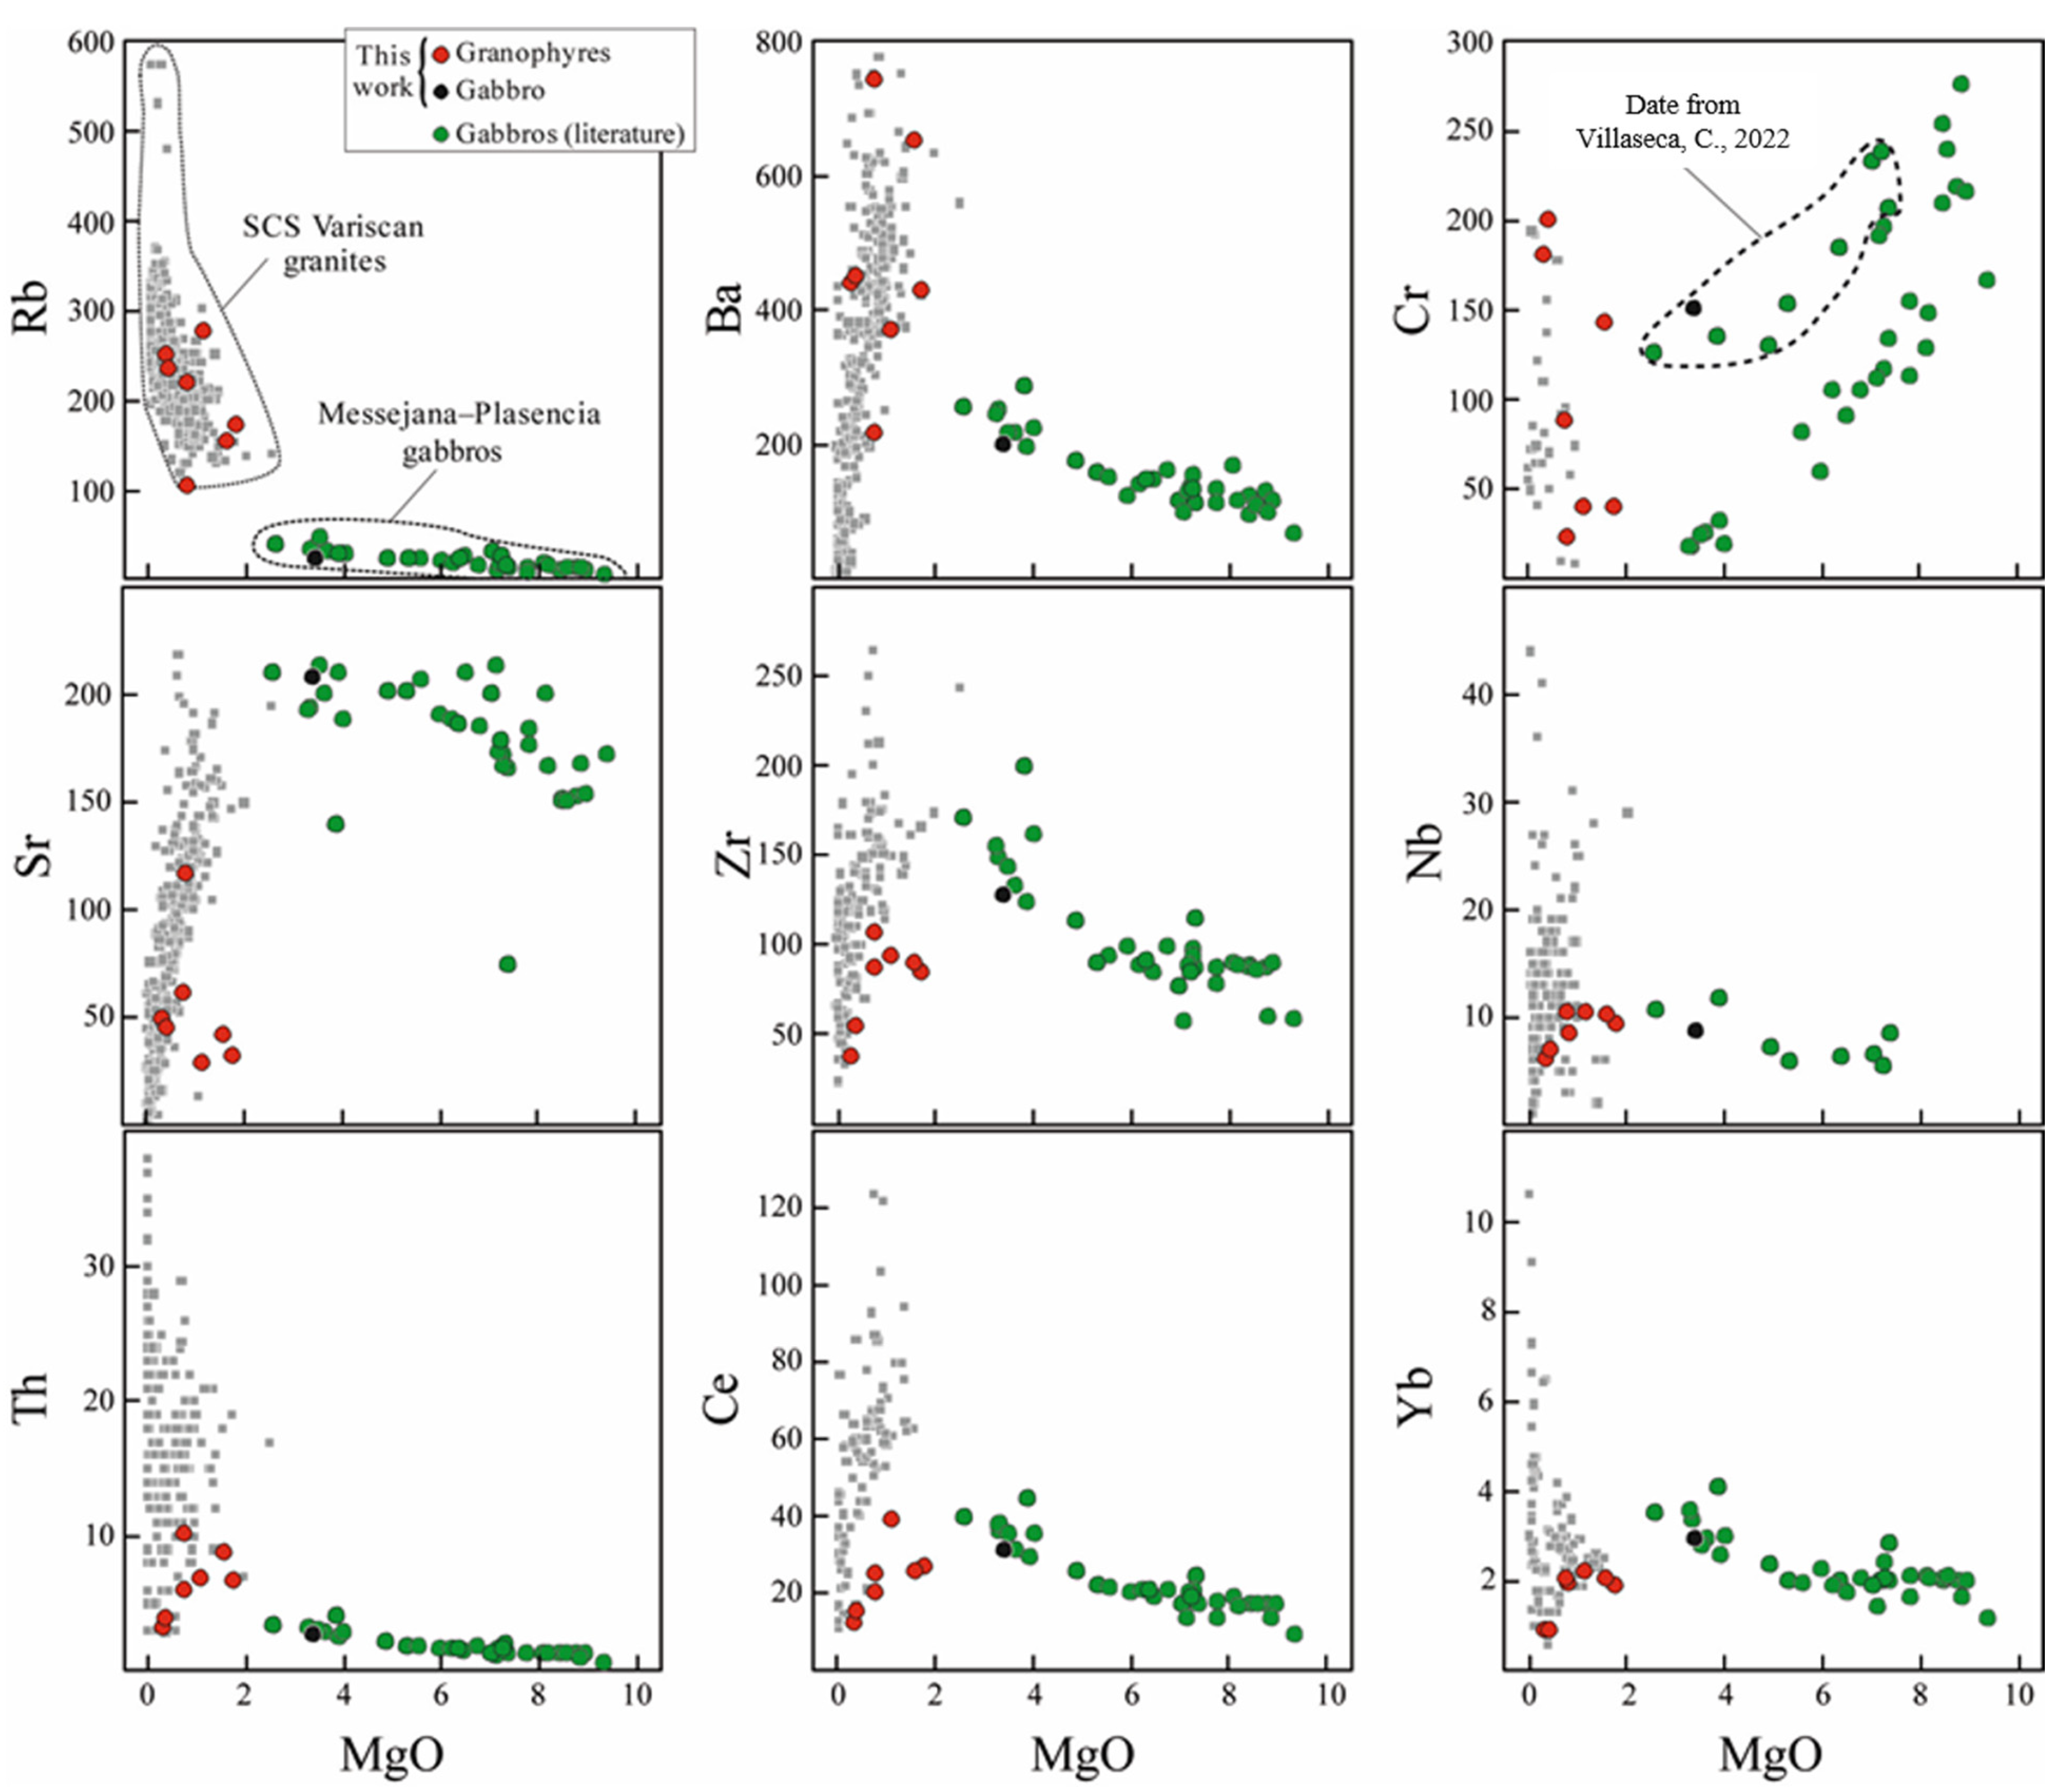
4.3.1. Major and Trace Elements

The MPGD granophyres display a silica-rich composition (SiO2 = 70.55–74.85 wt%) and draw a large compositional gap with the associated gabbros (Figure 5). Their composition is slightly peraluminous and shows high K contents (K/Na ratios mostly > 1.5), plotting in high-K calc-alkaline to shoshonitic fields, in contrast to the host gabbros (Figure 5C,D).
Granophyre major element contents are somewhat homogeneous (Table 3) and characterised by MgO < 1.8 wt%, Fe2O3 < 2.9 wt% and low TiO2 (<0.33 wt%) and CaO (<0.71 wt%) values when compared with the MPGD gabbros (Figure 6). Alkalies are more variable in composition, displaying low Na2O concentrations (mostly below 2.5 wt%) and relatively high K2O (3.2–8.6 wt%). A subtle correlation can be observed within granophyre samples with increasing SiO2 and Al2O3 and decreasing Fe2O3 and TiO2 towards lower MgO (Figure 6). Their trace element composition is characterised by relatively high LILE (Ba = 217–741 ppm; Rb = 105–278 ppm), Th (3.2–10.2 ppm), U (2–3.5 ppm) and Pb (up to 36 ppm) values and moderate to low contents of Sr (22–117 ppm), other HFSE (Zr = 38–107 ppm; Hf = 1.5–3 ppm; Nb = 6.1–10.4 ppm; Ta = 1.1–1.9 ppm) and REE (e.g., Ce = 12.3–38.6 ppm; Eu = 0.29–0.57 ppm; Yb = 0.88–2.19 ppm) (Figure 7). Such composition yields a slightly fractionated chondrite-normalised LREE pattern (flat for the HREE) with a marked negative Eu anomaly and a Primitive Mantle-normalised spectrum with high relative abundance of Rb, Ba, Th, U and K, a strong positive Pb anomaly and relatively deep throughs at Nb, Sr, Eu and Ti (Figure 8). A slight positive Ta peak in the composition of the studied granophyres is also remarkable. The Cr concentrations are variable, reaching relatively high values (200 ppm). The fact that the samples with higher Cr contents (113105 and 113106) are the least evolved granophyres, and the lack of correlation between Cr and the other metallic elements (e.g., Mg, Ti, Ni, Co, V, Sc), suggests that the highest Cr values are actually not reliable but an artefact likely caused by Cr addition during sample crushing using a Cr-rich disc mill.
The only gabbroic sample analysed for this work (sample 113104) plots towards the differentiated pole of the MPGD gabbros compositional field (Figure 6). It displays low MgO (3.41 wt%) and relatively high TiO2 (1.68 wt%) and Fe2O3 (12.47 wt%). Its trace element contents and the Chondrite- and Primitive Mantle-normalised patterns also overlap those of the literature MPGD gabbros, plotting towards the higher values for most incompatible elements (Figure 7 and Figure 8). The overall Cr contents of the gabbros are slightly heterogeneous. It should be noted that the gabbros collected by our research team [8] in the northeastern segment of the MPGD display a tendency towards higher Cr concentrations when compared with the samples analysed by other authors (Figure 7). As mentioned above for the granophyres, this discrepancy is only shown by Cr and points to contamination during sample crushing.
A comparison between the MPGD granophyre composition and the main felsic SCS Variscan magmatism can be found in Figure 6 and Figure 7. It can be appreciated that the granophyre compositional field broadly overlaps the major and trace element field of the SCS granites and also reproduces similar elemental correlations between MgO and SiO2, Fe2O3, TiO2, P2O5, Ba, Rb and Cr. However, the MgO–Al2O3 correlation of the granophyres does not match that of the granites, and the alkalies display a more heterogeneous and distinct composition: the Na2O values are clearly lower and the K2O concentrations are broadly higher than those in the Variscan granites (Figure 6). Several differences are also apparent in some trace elements, mainly the low Sr, Zr, Nb, Th, U and REE contents (Figure 7).
When comparing the composition of the granophyres with that of the host mafic rocks (mainly gabbros), there is a marked gap in major and trace element compositions between the Mg-poor pole of these mafic rocks and the granophyres (e.g., SiO2 ~52–71 wt%, Fe2O3 ~3–9 wt%, Rb ~49–105 ppm, Sr ~61–180; Figure 6 and Figure 7). Moreover, the chemical trend drawn by the mafic rocks undergoes an abrupt change if the granophyre pole is considered as a hypothetical cogenetic line of evolution, implying a sudden increase in Si, K, Ba, Rb and U and decrease in Ti, Al, Fe, Mn, Ca, Na, Sr, Zr, Hf, Nb and REE (Figure 6 and Figure 7).

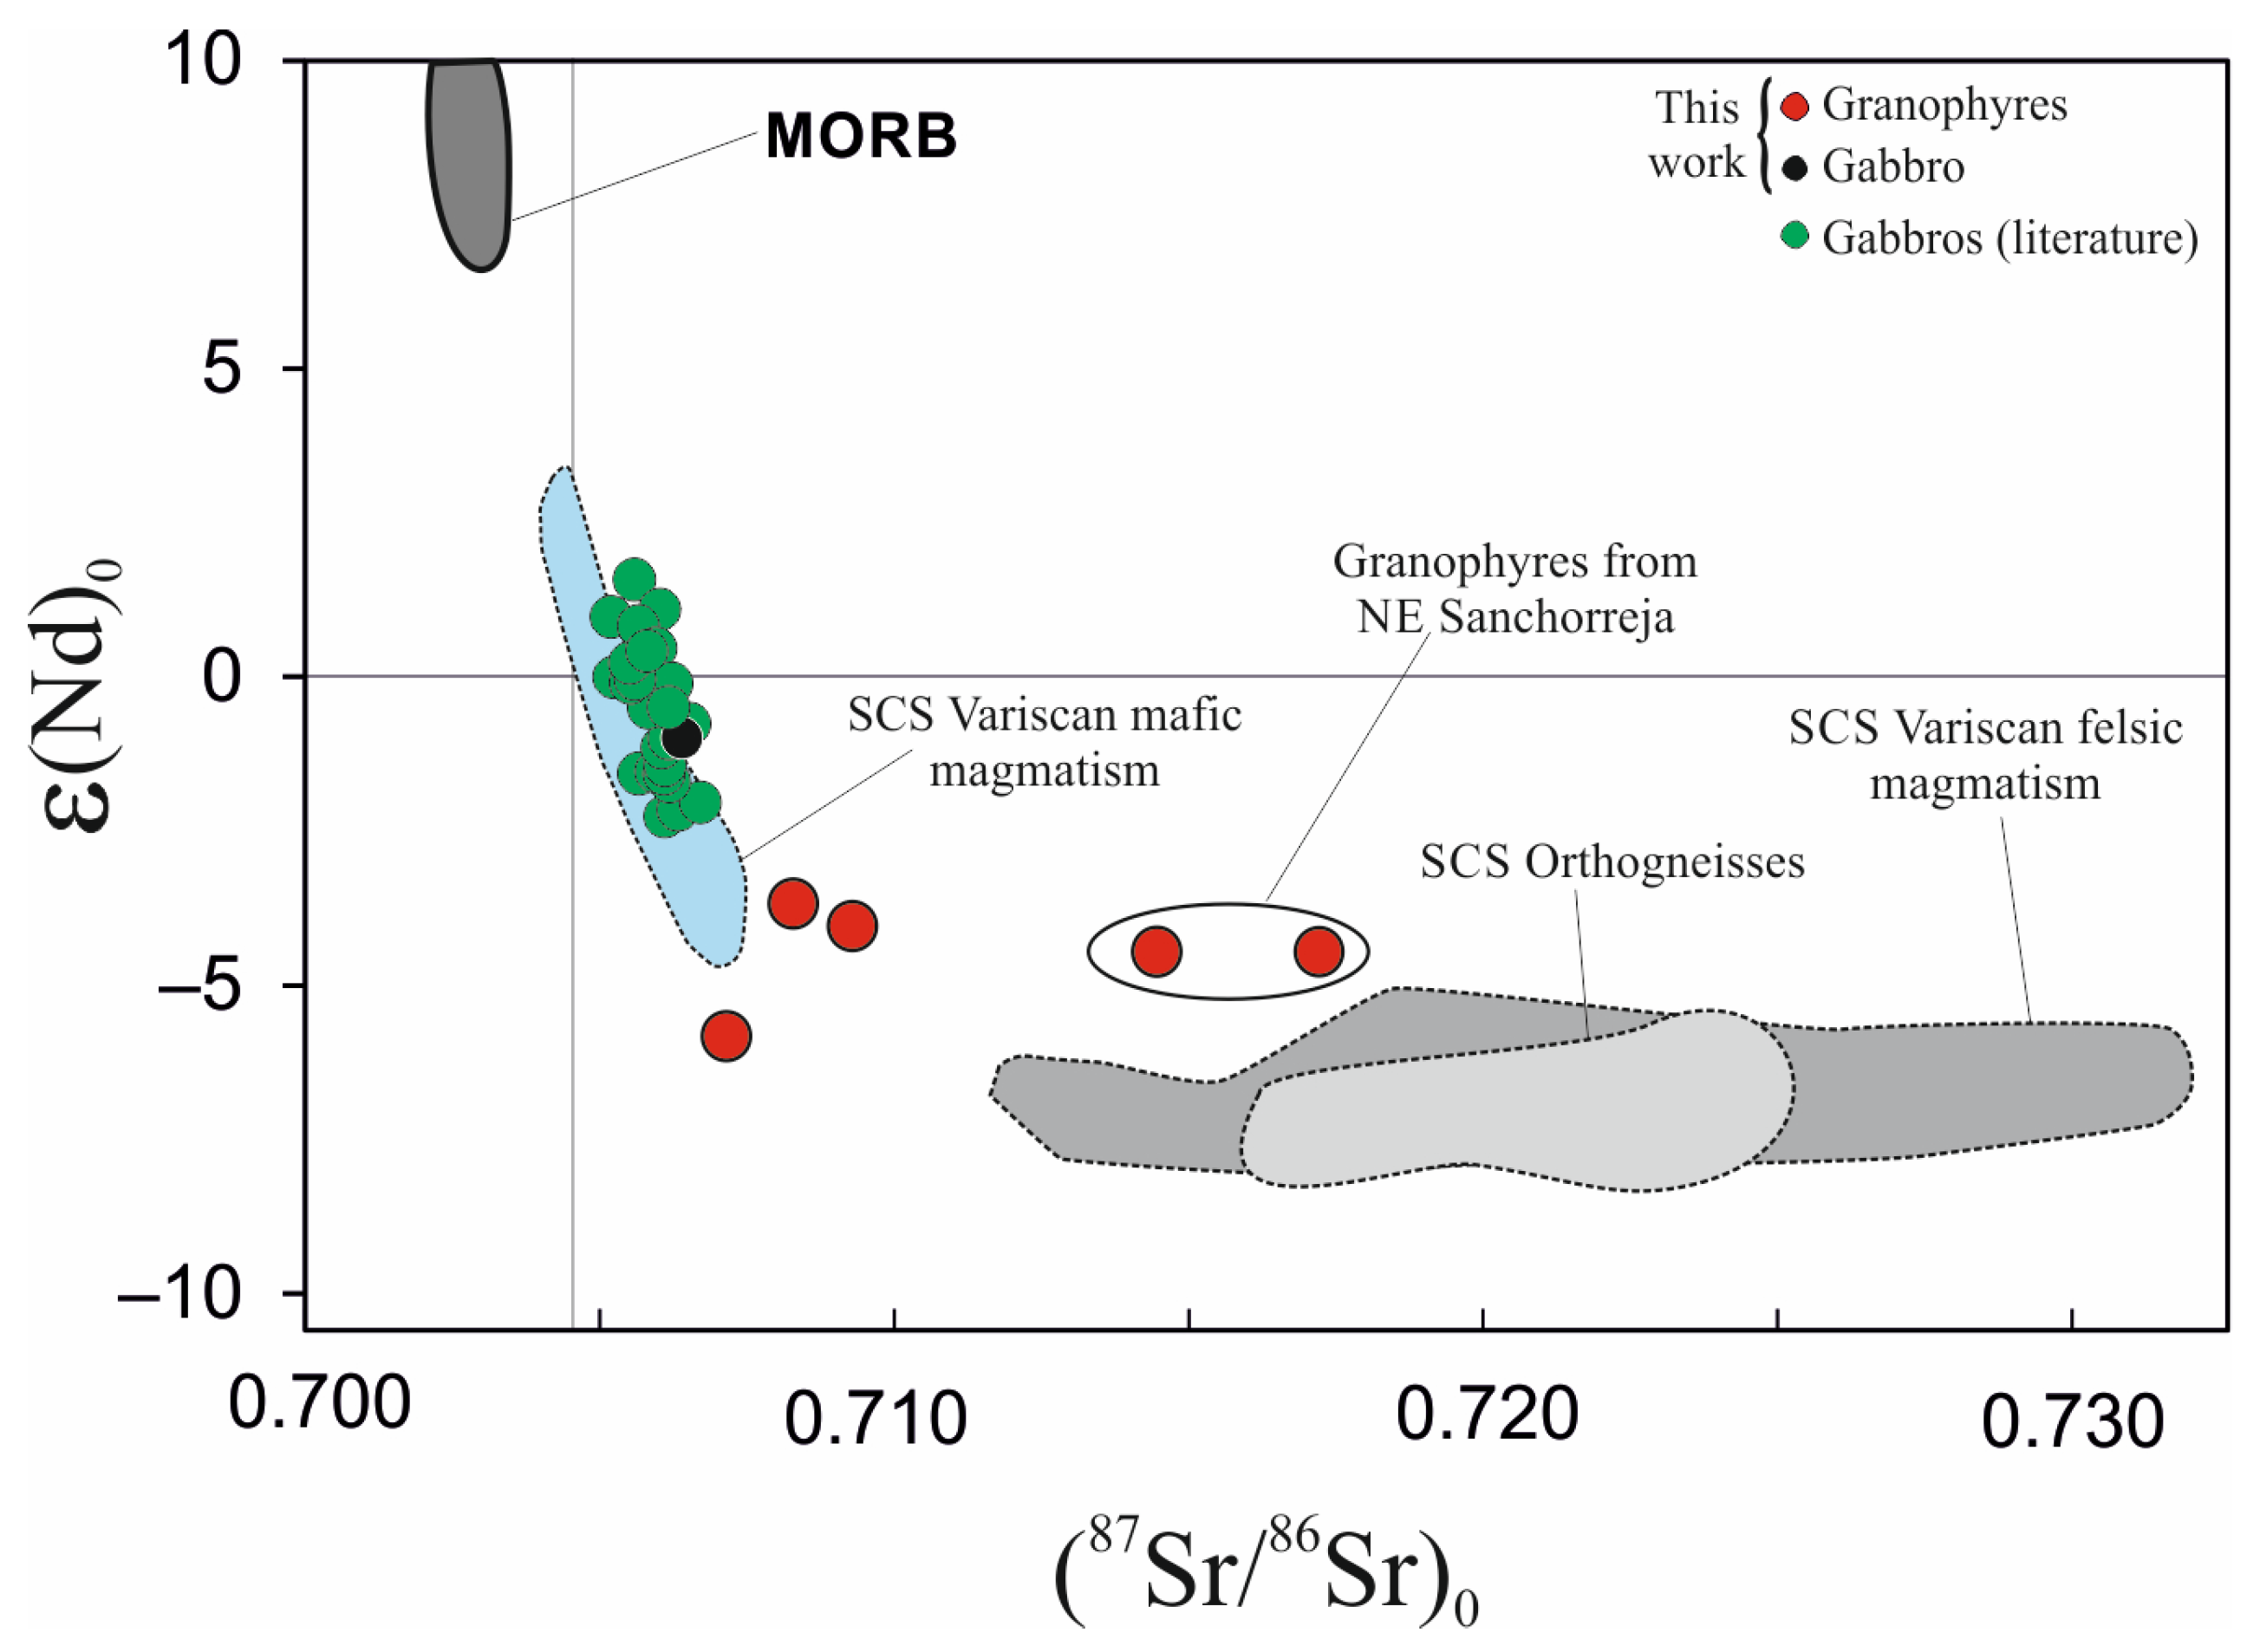
4.3.2. Sr–Nd Isotopes

The Sr–Nd isotopic ratios of the analysed samples were calculated to 200 Ma, as well as the rest of magmatic rocks plotted in Figure 9 (MPGD gabbros, SCS mafic and felsic Variscan magmatic rocks and SCS orthogneisses). The granophyre data represent the first attempt to constrain the isotopic composition of these evolved felsic rocks from the Messejana–Plasencia dyke. They display fairly variable radiogenic Sr signatures [(87Sr/86Sr)0 = 0.708292–0.717215] but restricted εNd values (−3.7 to −5.8) (Figure 9 and Table 4). The most Sr radiogenic values are found in miarolitic granophyres from the large felsic dyke intruding the MPGD in the NE area of Sanchorreja (outcrop 2 in Figure 1). The granophyre Sr–Nd isotopic composition is intermediate between the less radiogenic values of the MPGD gabbros and the field of the SCS granites and orthogneisses wall rocks (Figure 9). The gabbro analysed for this study (sample 113104) shows a BSE-like composition [(87Sr/86Sr)0 = 0.706401; εNd = −1.0] which plots within the isotopic field previously defined for the MPGD gabbros, which, in turn, matches the composition of the SCS Variscan mafic magmatic series, mainly of calc-alkaline affinity [8] (Figure 9).

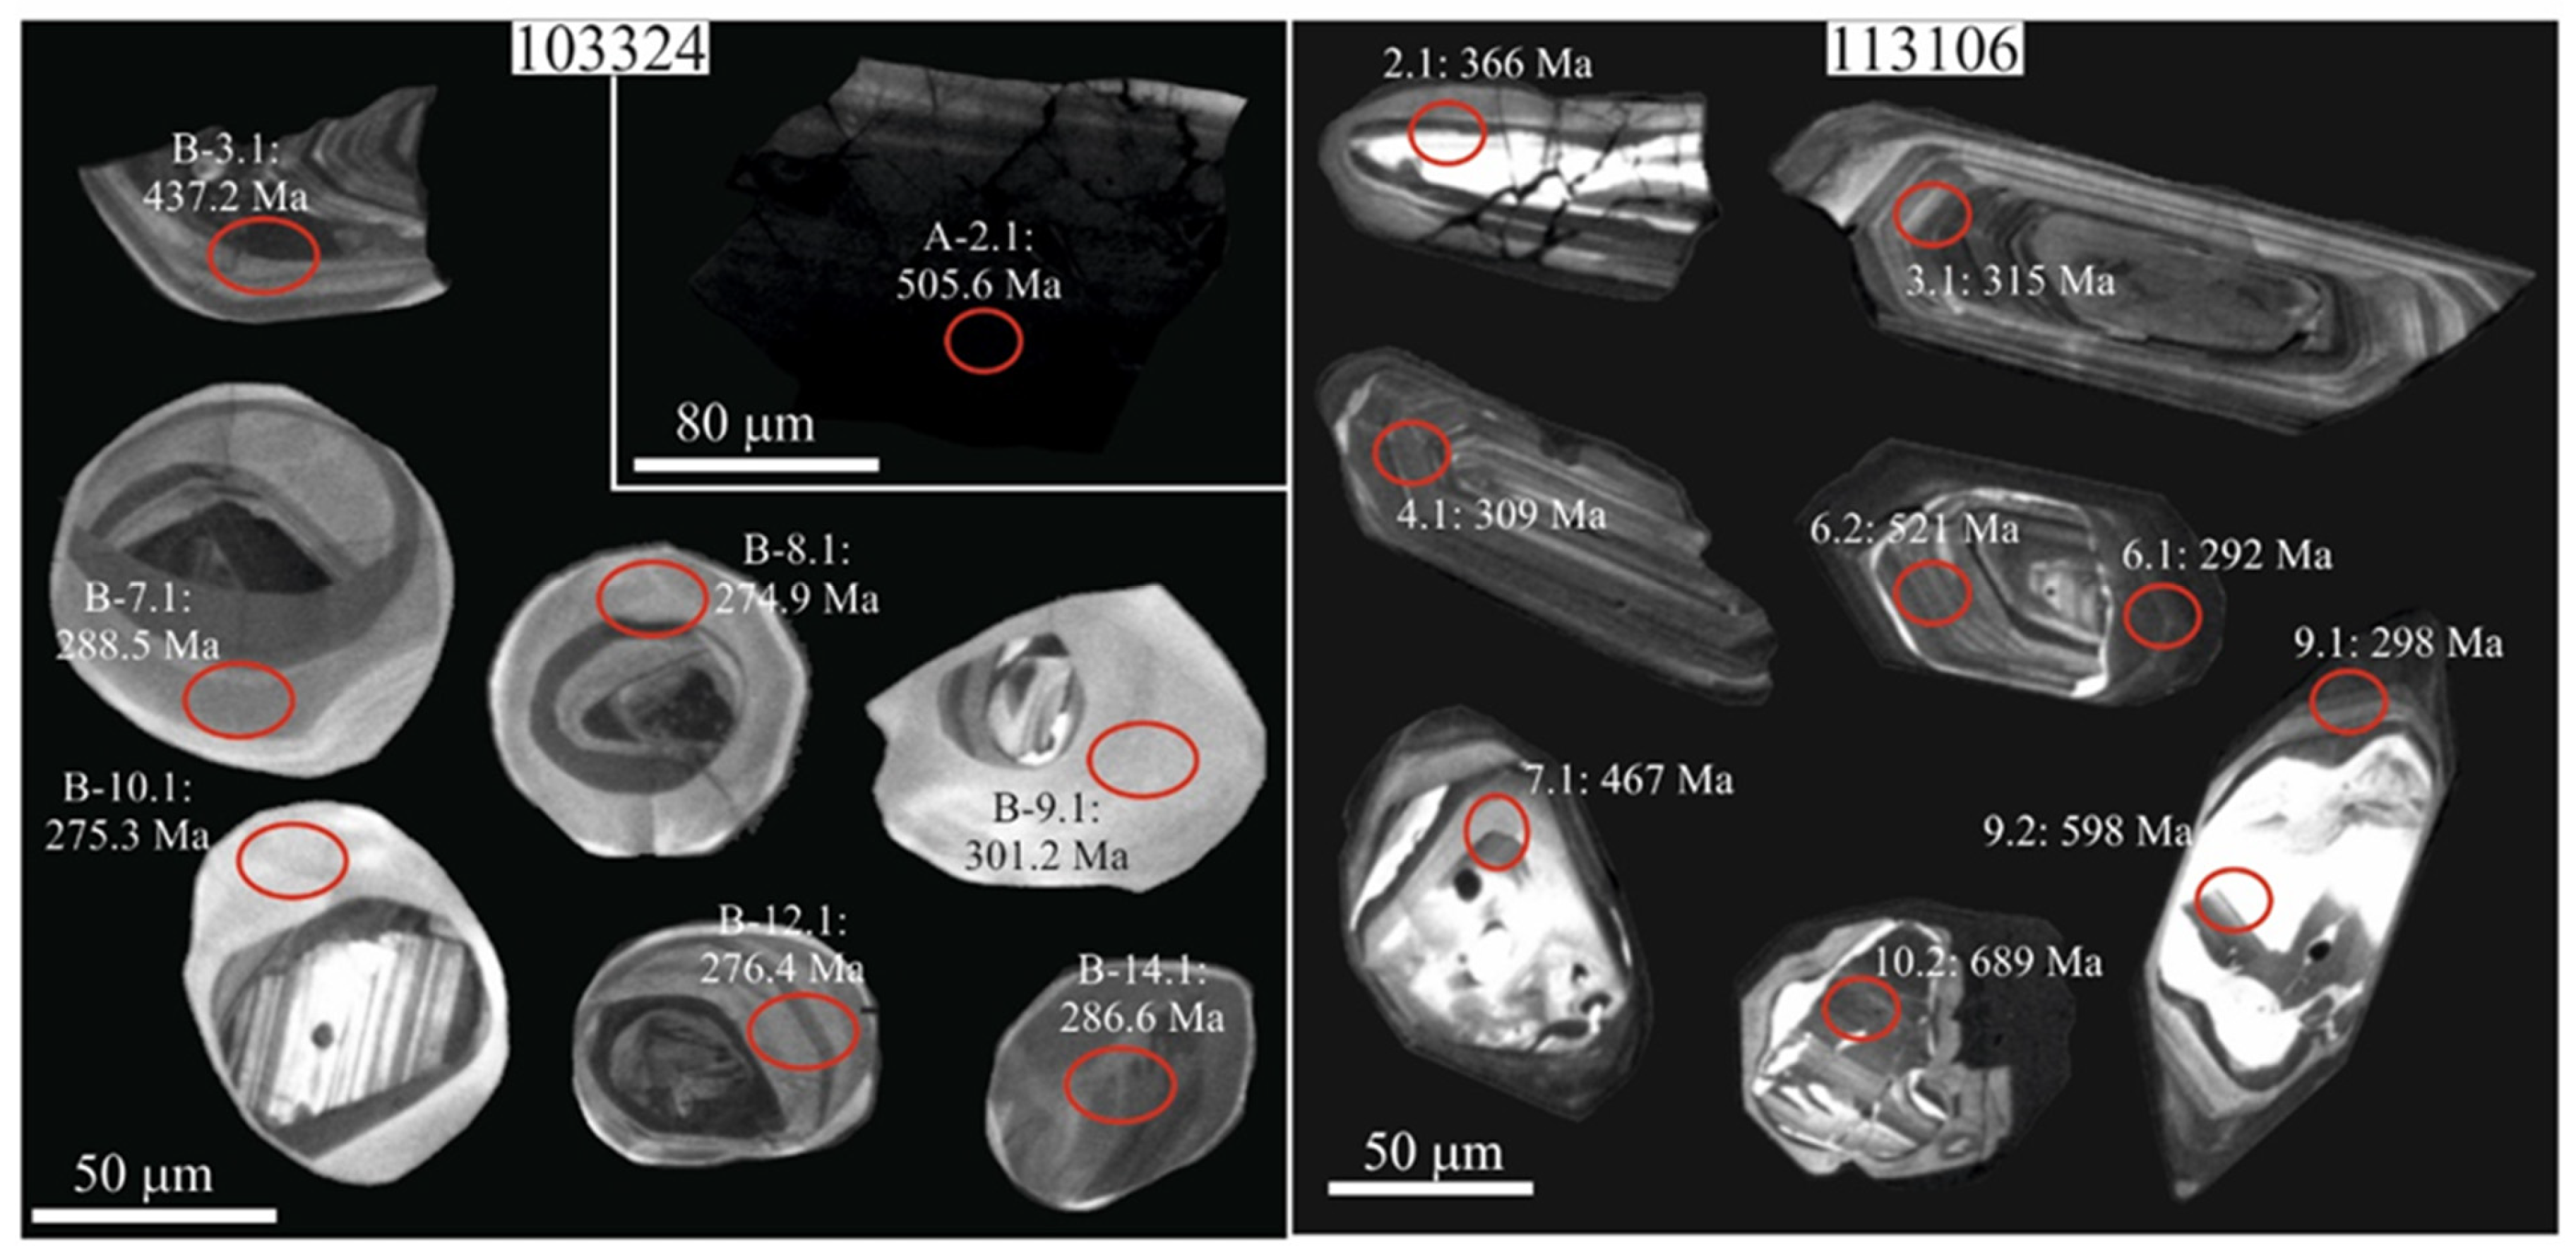
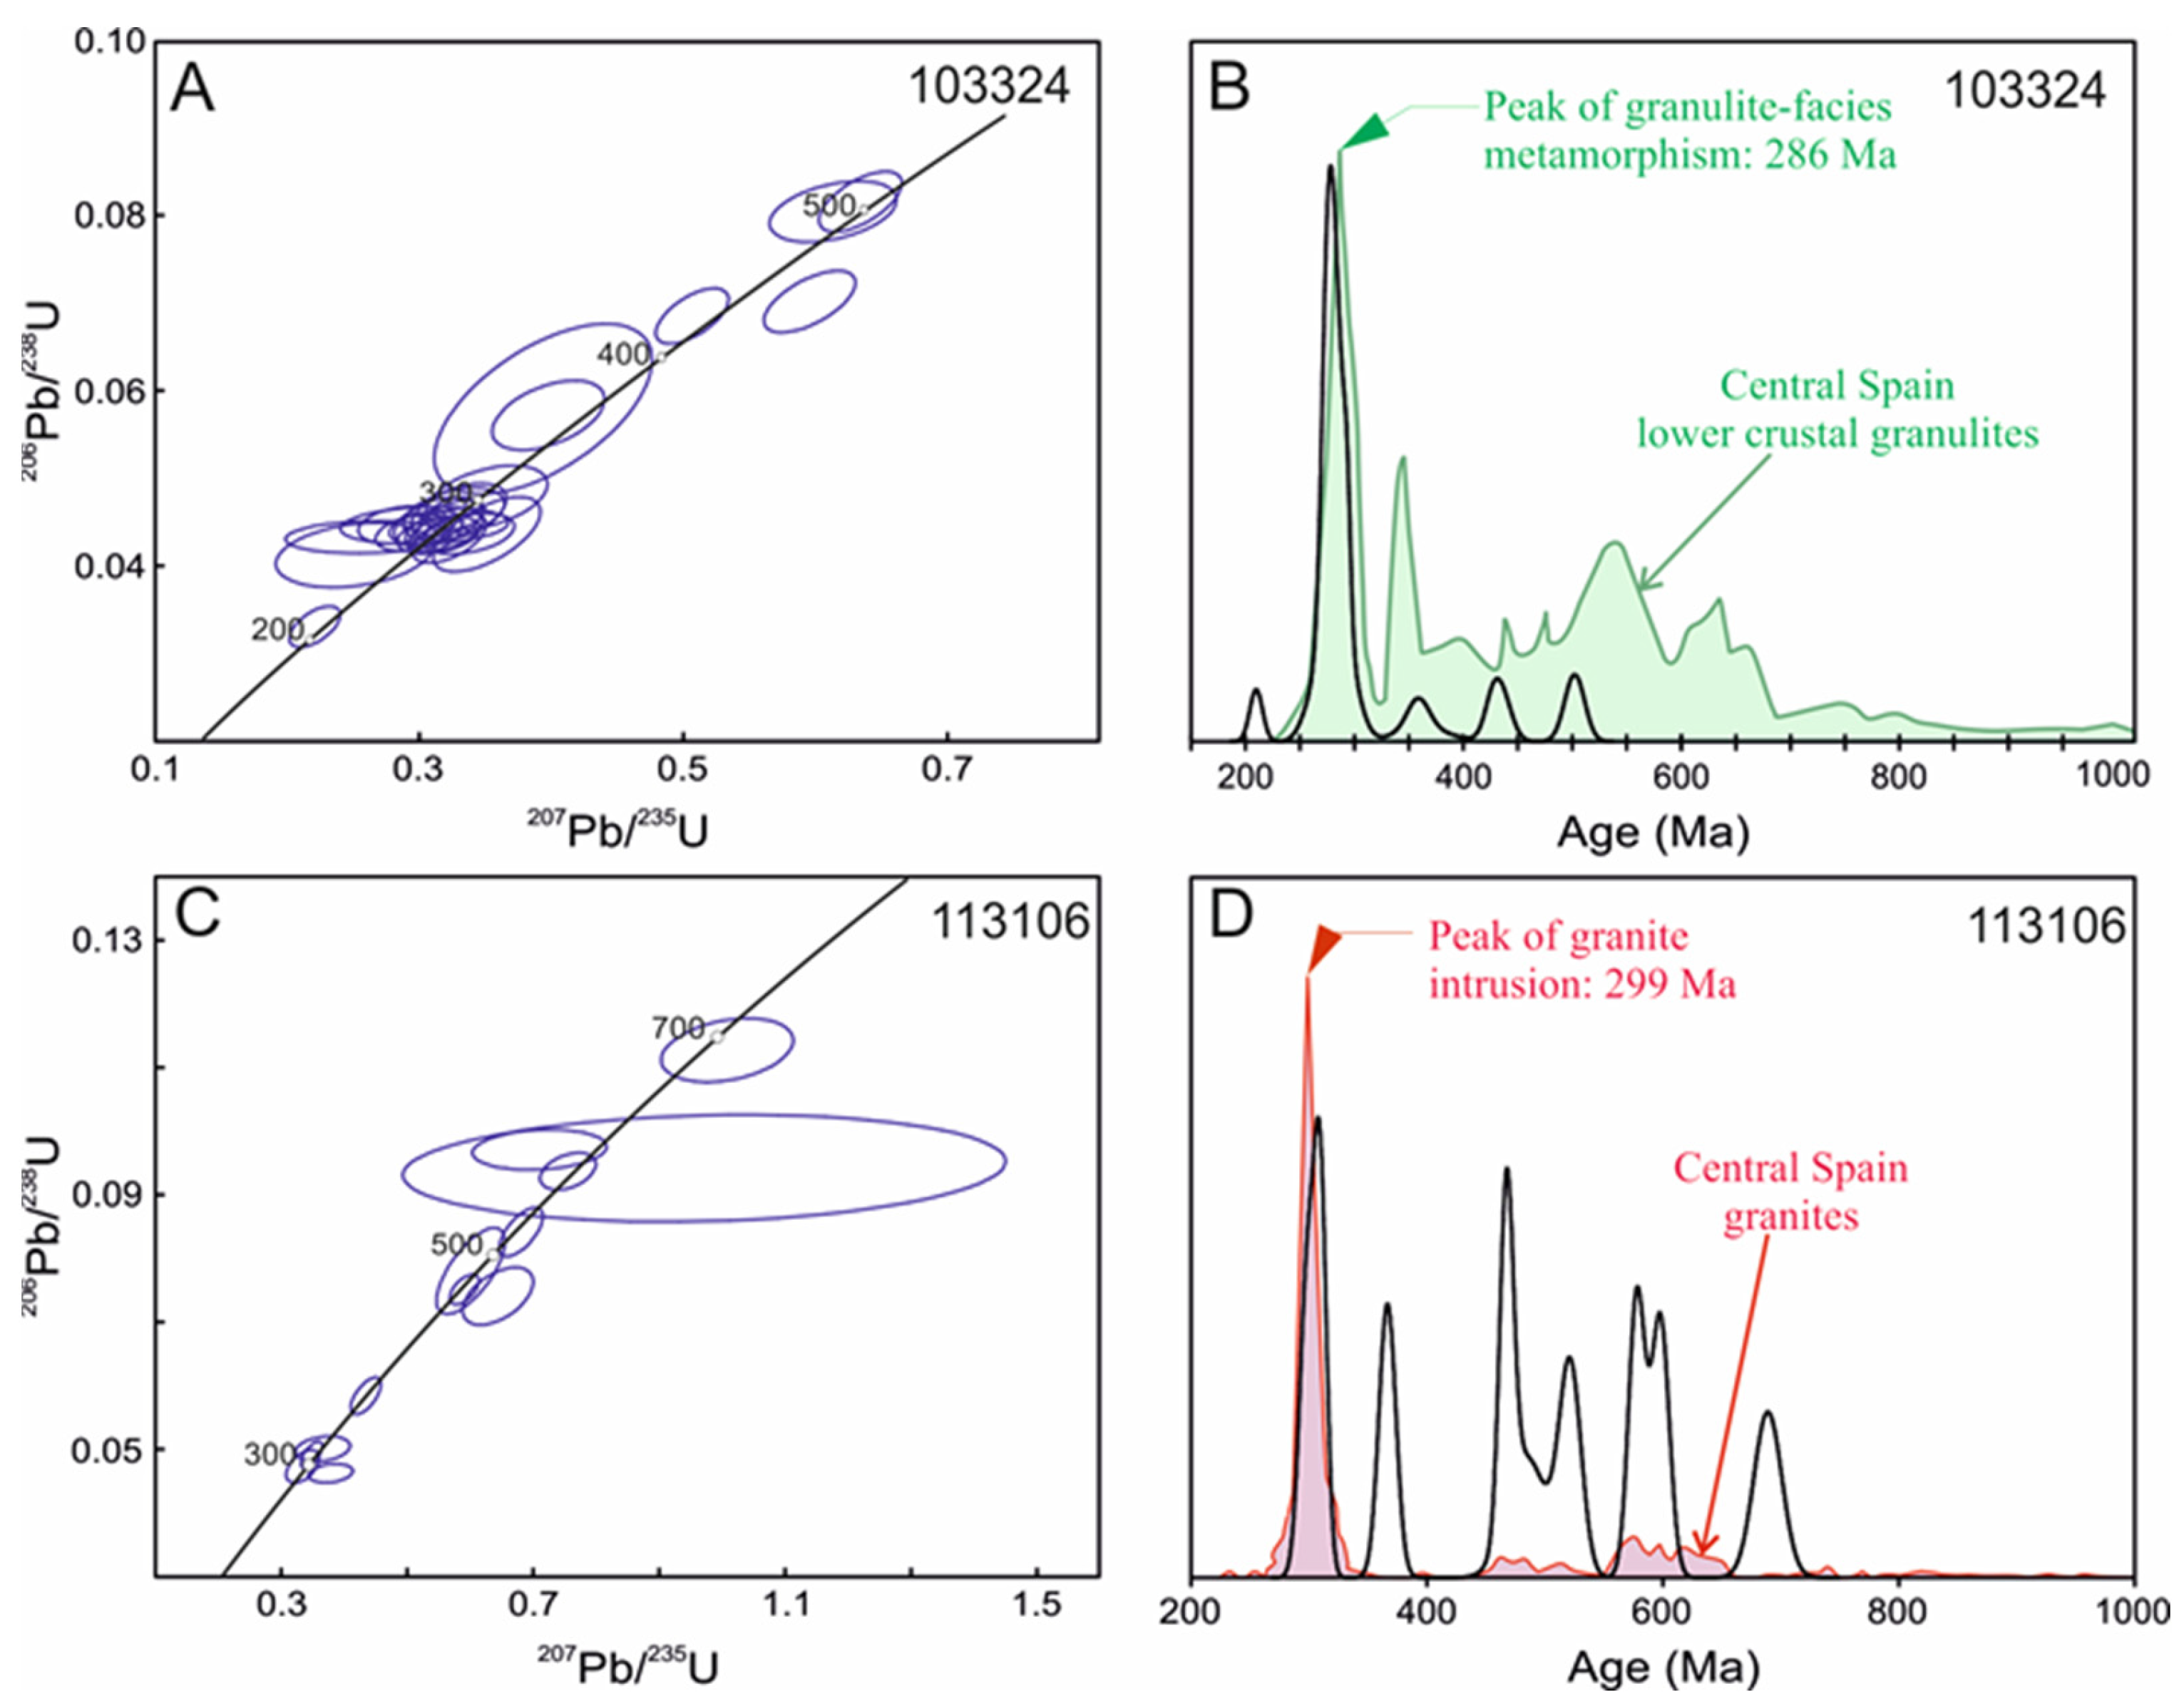
4.3.3. U–Pb Zircon Geochronology

Zircons from two samples of the MPGD (gabbro 103324 and granophyre 113106) were separated for U–Pb geochronology. The gabbro provided a higher number of zircon grains, from which 60 were selected, whereas only 11 zircons were extracted from the granophyre. Their size, external morphology and inner texture were studied by transmitted and reflected microscopy and CL imaging, and significant differences were found between the two samples.
The gabbro zircons are generally small: most of them are below 100 μm (91%), and only a few (9%) can reach up to 200 μm. These latter larger grains are irregular in shape, likely representing prism fragments, and develop marked oscillatory zoning (A-2.1 in Figure 10). However, the bulk of zircons in this sample are small rounded grains or stubby prisms, half of them displaying subhedral, variably resorbed inherited cores. These cores show blurred or oscillatory zoning and a dark thin rim, and they are surrounded by a dark or bright regrowth, sometimes formed by several concentric bands. Zircon grains without inherited cores and displaying a homogeneous dark or bright CL response are also relatively abundant (B-14.1 in Figure 10).
The 11 zircon grains from the granophyre sample have variable sizes (50–170 μm) and shapes, predominating the euhedral stubby or elongated prisms, with aspect ratios from 1:2 to 1:4 and a tendency to develop bipyramidal ends (Figure 10). CL images reveal the frequent presence of anhedral to subhedral inherited cores with blurred or oscillatory zoning. These cores appear in 40% of the zircons (stubby prisms) and represent more than 50% of their volume. The surrounding rims and the elongated prisms without cores are characterised by magmatic oscillatory zoning (Figure 10).
The U–Pb isotopic signatures determined by SHRIMP in zircons from both samples are shown in Table 5. A total of 35 crystals were analysed (25 from sample 103324 and 10 from sample 113106), a few of them in several places (core and rim), resulting in 39 analyses. The isotopic data were plotted in Wetherill Concordia diagrams, and the calculated ages were represented in density probability plots (Figure 11). Only data with discordance below 10% and common Pb values lower than 1.1 were plotted and considered in the discussion.
The 206Pb/238U ages obtained in zircons from the gabbro (103324) are characterised by an abundant group restricted to a narrow range (272–301 Ma), some scattering from 358 to 506 Ma, and a single younger age of 209 Ma, which is the only age close to the age of the MPGD intrusion (~206–200 Ma) [1,10,24]. Thus, the bulk of zircons have to be considered of xenocrystic origin. The oldest ages (358–506 Ma) were obtained from the larger irregular zircon grains and stubby prisms with oscillatory zoning. The most abundant ages clearly record the Variscan cycle, yielding a peak at ~280 Ma in the probability density plot (Figure 11B), and are restricted to the overgrowths that surround the cores or to rounded homogenous grains (Figure 10). No ages were determined in the inherited cores because the initial objective was the U–Pb dating of the MPGD mafic magmatism, and age determination in cores was left aside. However, it is expected that they would have provided very old ages (see discussion). Based on the similitude in size, shape and internal structure of the analysed zircons with zircons from central Spain lower crustal granulites [44,46], the density plot of Figure 11B shows a comparison with results from these SCS granulites. It can be observed that the main U–Pb age peak produced by the gabbro is very close to that given by the granulitic zircons (~286 Ma) and that the oldest ages in the gabbro sample somewhat reproduce the pre-Variscan Palaeozoic age range of the granulites.
The scarce 206Pb/238U ages of zircons from the granophyre (113106) are scattered in a range from 298 to 689 Ma (Figure 11C). Thus, all zircons from this sample have to be considered xenocrystic. The distribution of ages yields several peaks of similar height (Figure 11D), but they have no statistical relevance given the low number of analyses considered. However, it is interesting to note that all pre-Variscan ages (>315 Ma) were obtained from inherited cores, whereas the Variscan ages (290–315 Ma) come from elongated zircons without inheritances or rims around inherited cores (Figure 10). Given that Variscan magmatic rocks are likely related to the origin of the analysed zircons, we also show in Figure 11D the distribution of zircon ages from the central Spain granites (see references in the caption of Figure 11). The broad similitude between the main peak of granite intrusion for central Spain (~299 Ma) and that provided by the youngest zircons from the analysed granophyre (~309 Ma) are noteworthy. The distribution of the pre-Variscan zircon ages yields several peaks in the same interval from the Ordovician to the Neoproterozoic if compared with data from the SCS country-rock granites (Figure 11D). Zircons with similar petrographic features and U–Pb age distribution to those of the studied granophyres are also present (although scarce) in rocks from the lower crustal levels of central Spain [47], and they are more abundant in lower crustal rocks further south of the MPGD outcropping section (i.e., Calatrava volcanic field) [44].

5. Discussion

5.1. Mafic Magma Evolution

The subalkaline composition of gabbroic and diabasic samples from the MPGD and the trend of increasing Fe in the AFM diagram (Figure 5A,B) are features typical of tholeiitic suites. The TiO2 value under 1.5 wt% in the most primitive samples relates the composition of the studied mafic rocks with that of the low-Ti continental flood basalts (CFB) (e.g., [48]).
The major element geochemistry of MPGD gabbros describes a moderate to strong compositional heterogeneity, characterised by a positive correlation between Mg and Ca, whereas Ti, Na and K display a moderate enrichment towards lower Mg contents (Figure 6). Such behaviour is coherent with some degree of crystal fractionation. Al and Fe depict a different evolution pattern, defined by an initial Al enrichment at constant Fe, followed by an Fe increase at constant Al (starting at MgO ~6 wt%; Figure 6). These latter features, together with the overall early depletion of Ca and Mg, likely imply that fractionation was initially dominated by Ca-rich clinopyroxene (augite). The low Cr and Ni concentrations of the most primitive samples (Cr < 300 ppm, Ni < 140 ppm; Figure 7) imply that they cannot be considered primary magmas (Cr = 500–1000 ppm; Ni = 200–500 ppm) and that some degree of early olivine fractionation also took place. On the contrary, plagioclase likely acquired a more relevant role afterwards. The chemical variation in trace elements agrees with this possibility, as all incompatible elements increase in composition in the more evolved samples, with the exception of Sr, which reproduces the same pattern of Al (Figure 7) and supports that the change in behaviour is controlled by an increase in the modal abundance of plagioclase during fractionation. The lack of a final depletion in Fe and Ti towards the most evolved gabbroic samples indicates that the degree of differentiation did not achieve fractionation of Fe-Ti oxides, typical of the tholeiitic evolution.
An equivalent fractionated mineral assemblage has been proposed for several mafic magmas of the CAMP (including samples from the Messejana–Plasencia dyke) based on chemical modelling using MELTS software [10]. Their results indicate that plagioclase is an early crystallising phase, but their data also present an evolution pattern with increasing Al towards lower Mg, which seems to contradict the typical evolution of tholeiitic magmas. The stabilisation of plagioclase in crystallising tholeiitic melts at low pressures prior to augite has been described in experimental studies (e.g., Refs. [49,50]). However, the plagioclase/pyroxene ratio, which can change with small variations in parental melt composition, has a strong effect on the magma chemical evolution [49] and can lead to kink patterns with an initial increase in the Al content followed by depletion [50].

5.2. Origin of the Granophyric Melt

Two broad possible scenarios can be considered in the origin of these granophyres: they might represent felsic melts unrelated to the MPGD or they may be genetically linked with the mafic magma via extensive differentiation, as shown by experimental works focused on the formation of silicic melt due to crystal fractionation of basalt (e.g., [51]). The following two main reasons argue against the possibility of MPGD granophyres being related to granitic magmas of crustal origin totally disconnected from the mafic melt: first, felsic magmatic events in central Spain ended about 85 Ma before the intrusion of the MPGD (e.g., [45]), and second, the granophyres composition is not in accordance with that of minimum temperature anatectic granitic melts (Figure 12). The granophyres are found exclusively as intrusive bodies within the gabbros at several scales including the following: small interstitial pockets within the gabbro minerals, small veins of irregular contact permeating the mafic rocks and, occasionally, as a large dyke of 1 km in length (Figure 2). In all cases, these felsic bodies are only found within the mafic dyke, not in the wall-rock granites. This layout of the granophyric melts points to a direct connection between the felsic pockets within the gabbros and the small veinlets and dykes, which might be considered segregates formed due to the squeezing and extraction of a residual felsic melt during the last stages of crystallisation. The presence of similar small-volume granophyres within tholeiitic gabbros has already been described (e.g., [52,53,54]), including the CAMP magmas [11,16], and explained as the result of mafic magma evolution. Accordingly, it is likely that the granophyres formed during the last stages of the mafic magma differentiation within the MPGD intrusion.
The major and trace element geochemistry of the felsic rocks associated with the gabbroic intrusion is heterogeneous and clearly separated from that of the mafic rocks (Figure 6 and Figure 7), independently of the size of these bodies (veinlets, small dykes or larger dykes). This is manifested by a compositional gap that is noticeable for SiO2, Fe2O3, CaO, Rb, Ba and Sr, among other elements (Figure 6 and Figure 7). The absence of volcanic and plutonic rocks of intermediate composition, identified as the Daly gap, is not uncommon in highly differentiated mafic magmas, but their origin is controversial (e.g., [57]). Some studies suggest that melts of intermediate composition may form during crystal fractionation of basaltic magmas and that their absence or scarcity would be the result of viscosity–density barriers [58], fast evolution of intermediate liquids [59] or other mechanical factors related to magma chamber dynamics (e.g., low crystallinity percentage and magma convection) [60]. However, the presence of interstitial quartz–alkali feldspar-bearing micro-aggregates within the gabbro mineral groundmass (Figure 2C–F) implies that the differentiation process leading to granophyre formation can occur in the dyke itself after its intrusion, rather than within a deeper magma chamber. The fact that the micro-aggregates, veinlets and dykes represent felsic compositions, with no intermediate terms, suggests that simple crystal fractionation would not be the main differentiation mechanism in the generation of these granophyres.
An alternative hypothesis proposed to explain the Daly compositional gap is liquid immiscibility (e.g., [57]). This process has been associated with the presence of glass droplets in the mesostasis of basalts (e.g., [17]), but it has also been identified in mafic plutonic intrusions, such as Skaergaard, Sept Iles, Bushveld and Duluth (e.g., [61,62,63,64,65,66]). These studies describe the coeval segregation of silica and iron-rich melts at the mm- to cm-scale.
Immiscibility along tholeiitic trends involves the unmixing of ferrobasaltic and rhyolitic melts (e.g., [66]). The compositional space of such an immiscibility gap has been represented in triangular diagrams such as those of Figure 13. In all these plots, the granophyres from the MPGD display a composition very close to that of the silica-rich immiscible liquids, represented either by glass droplets in basalts (Figure 13A) or melts from immiscibility experiments in a tholeiitic system (Figure 13B,C).
The bulk of the gabbroic samples plot in an intermediate position between the Si-rich and Fe-rich poles, within the wide one-liquid field represented by lavas from some major tholeiitic provinces (Figure 13B,C). The mineral chemistry of the granophyres is slightly different from that of the gabbros (e.g., higher Na-Al in biotites, higher Na + K in apatite; Figure 4), but mostly overlaps with the mineral geochemical evolution trends (Figure 4). Experimental and empirical studies ([66] and references therein) have established that the onset of immiscibility in tholeiitic mafic systems is associated with plagioclase with a composition in the range of An36–60 and clinopyroxenes with Mg# < 64. Such values are reached in the studied MPGD gabbros (Figure 4A), which agree with the evolved contents usually associated with liquid immiscibility. The evolution depicted by the MPGD mafic rocks is also in accordance with the liquid line of descent described by tholeiitic suites, which have experienced immiscibility, such as the slight increase in Ti, Fe and P in the gabbros (Figure 6). The relative depletion in Eu, Sr and Ti in the granophyres (Figure 8) is coherent with their generation during the last stages of differentiation of the mafic magma, after fractionation of plagioclase and Fe–Ti oxides. Moreover, other chemical features of the granophyres, such as the relative enrichment in Rb and elevated Ba/La (20–94) and Ta/Nb (0.12–0.31) ratios (Figure 8), can be considered good indicators of liquid immiscibility in silicic rocks. Liquid immiscibility in tholeiitic systems can partition trace elements, e.g., favouring the incorporation of LILE to the felsic melt over REE, thus imposing these distinct geochemical imprints in the two immiscible melts [68]. Such partitioning could explain the similar or lower REE contents of the granophyres when compared to the gabbros.
A possible weakness of this magma immiscibility model is the low ratio of iron-rich melts to silica-rich melts, the latter being represented by the minor granophyric bodies within the MPGD. Only one sample (103329) shows a particularly high Fe–Mn–Ti-rich and Si–Al–Na-poor composition (Figure 6), which plots towards the Fe-rich pole of the experimental immiscibility fields (Figure 13B,C). This sample might be representative of cumulate rocks derived from this Fe-rich immiscible counterpart and may have been undervalued during sampling due to their similar appearance to any other MPGD gabbro. In any case, the experiments suggest that the relative amount of Fe-rich melt produced during magma immiscibility is low [66]. In summary, these data, together with the lack of intermediate compositions and the close textural relationship between gabbros and granophyres, support the likely origin of the MPGD granophyres as immiscible Si-rich melts generated during the last stages of differentiation of the mafic magma.

5.3. Magma Ascent and Contamination

The slightly evolved composition of the MPGD gabbros and their isotopic heterogeneity points to an open-system differentiation process, although it is not straightforward at which lithospheric level it took place. As stated above, the low Mg and Cr values of these gabbros are not characteristic of primary magmas and point to a certain degree of olivine–clinopyroxene–plagioclase fractionation. The fact that both plagioclase and clinopyroxene (instead of only plagioclase) are relevant early-crystallising minerals suggests that fractionation took place at moderate pressures. Fractional crystallisation experiments with tholeiitic melts at 0.7 GPa [50], equivalent to the lower crust (~23–25 km), yielded trends similar to the MPGD gabbros (e.g., initial Al2O3 increment).
The entrainment of zircon xenocrysts are also relevant data. The presence of such zircons in mafic magmas is usually interpreted as the result of crustal assimilation. The gabbro sample 103324 includes relatively abundant zircon xenocrysts with an internal CL structure similar to that of metamorphic zircons of the SCS granulitic xenoliths (Figure 10): small, rounded grains with a homogeneous dark CL response or dark mantles surrounding older inherited zones [44,46]. Moreover, the distribution of U–Pb zircon ages both in gabbro xenocrysts and zircons from granulites overlaps and displays a remarkable peak at about 280–290 Ma (Figure 11). The study of these xenoliths [44,46,69], which are included in Permian mafic magmas, has shown that (1) they were extracted from the SCS lower crust (~25–30 km), (2) this deep crustal level is abundant in felsic granulites and (3) the above ages represent the last stages of granulitisation in the SCS lower crust at the end of the Variscan cycle. These textural features and geochronology data of zircon xenocrysts suggest that the mafic magma likely interacted with the lower crust. Another possibility is that these zircons were incorporated from the mantle source. Examples of mantle zircons have been described in orogenic peridotites and mantle xenoliths, either associated with mantle metasomatism (e.g., [70]) or recycling of crustal components (e.g., [71,72]). Such recycling is possible via lower crustal delamination into the mantle, which has been proposed for the central zone of the Iberian Variscan Belt [73]. Unfortunately, we do not have solid arguments to support this possibility.
Accordingly, we think that a process of mafic magma stagnation, fractionation and contamination with lower crustal granulites is likely behind the evolution of the MPGD magmas. Such a process has already been proposed in previous studies [7,10], although the conclusions differ with respect to the nature of the assimilating component. The possibility of crustal contamination could also account for the variability in the Sr–Nd radiogenic ratios (Figure 9). We tested this possibility with a crystal fractionation and assimilation (AFC) model (Figure 14) based on the equations of [74]. The model (see details on the parameters used in Table 6) illustrates the isotopic and trace element variation in an initial mafic magma with a composition similar to the most depleted MPGD gabbros. The contaminant used in the model is the average of SCS lower crustal granulite xenoliths (grey area) [69]. The fractionating phases are cpx, pl and ol, as interpreted at the beginning of the discussion. The model fits well with the chemical variation in the gabbros when using an assimilation/fractionation ratio (r) of 0.25, which implies assimilation of lower crustal rocks in the approximate range of 10–12%. A model considering the SCS granites as the contaminating component does not fit the isotopic variation in the gabbros due to their high radiogenic Sr values. Taking into account that the analysed rocks do not represent a primary composition, these crustal contamination rates could be considered minimum values.
The more radiogenic isotope composition of the granophyres with respect to that of the MPGD gabbros (Figure 9), along with the inclusion of typically igneous Variscan zircons, points also to crustal contamination, although involving a different crustal protolith. These zircon xenocrysts display CL textures similar to those of Variscan granites or pre-Variscan meta-igneous rocks: large euhedral bipyramidal prisms with oscillatory zoning (Figure 10). Their U–Pb ages also reproduce the distribution observed in zircons from Variscan granites (Figure 11D), with a large peak at ~300 Ma (crystallisation age) and older (usually Cadomian) inheritances. Such features are characteristic of the SCS granites [45] and some lower crustal granulites [44,47] and likely reflect a contamination process occurring at a different crustal level than that described above. As the MPGD granophyres are formed and segregated within the gabbros, the contamination process has to occur initially in the mafic magma. We applied an AFC model for Sr–Nd isotopes (Figure 15) starting with the composition of the least primitive gabbros (see details on the parameters used in Table 6) because the granophyres were derived from the more differentiated mafic magmas. The fractionating minerals used in the model are the most abundant phases in the gabbros (cpx, pl and opx), and the contaminant is a representative SCS granite taken from [40]. An assimilation/fractionation ratio (r) of 0.25 is used. The resulting model only fits well for the least radiogenic granophyres, yielding assimilation rates up to 21%. The evolution line does not reach the more radiogenic samples from NE Sanchorreja, which would require a much more radiogenic contaminant and/or unrealistic assimilation rates.
Another process, apart from crustal assimilation, is necessary to explain the composition of the two granophyres with 87Sr/86Sr values higher than 0.714. This increase in radiogenic Sr could be associated with the alteration of these rocks, caused by their interaction with meteoric or hydrothermal fluids and manifested in the variable transformation of the main igneous minerals to secondary phases. The principle behind it is based on the washing of radiogenic 87Sr from K-feldspar lattice sites due to an extensive and prolonged rock–fluid interaction, which could lead to preferential mobilisation of Sr vs. Nd. A link between hydrothermal fluid circulation and the disturbance of Rb–Sr isotope systematics has already been proposed for granitic rocks [75,76]. Other studies focused on the effects of weathering or hydrothermal alteration on the Rb–Sr isotopic system [77,78,79] also suggest that an increase in the alteration degree can lead to higher 87Sr/86Sr ratios. The presence of miarolitic cavities filled with low-T minerals (prehnite, chlorite, clay minerals) in these samples from the NE Sanchorreja granophyre dyke, is indicative of the involvement of late-stage fluids. Also, the region where the samples were collected has been subject to several hydrothermal events after the MPGD intrusion [80]. Anyhow, the nature of this fluid and the way it may have interacted with the MPGD felsic rocks is not straightforward and is beyond the scope of this work. However, it should be noted that the higher K2O contents and general depletion in HREE and most HFSE of the samples from NE Sanchorreja, when compared to other granophyre dykes, are compatible with potassic alteration [81].
Table 6. Parameters used in the AFC models for the Messejana–Plasencia Great Dyke gabbros and granophyres.
AFC model for the MPGD gabbros
87Sr/86Sr143Nd/144NdSrNdRbBa
Initial melt composition0.705600.51244315010.514.5122
Contaminant composition0.712160.511983248321041037
Fractionating phases: Cpx (67%), Pl (27%) and Ol (6%)
AFC model for the MPGD granophyres
87Sr/86Sr143Nd/144NdSrNd
Initial melt composition0.706360.51227121420
Contaminant composition0.719150.5120169632
Fractionating phases: Cpx (50%), Pl (40%) and Opx (10%)
Mineral/mafic magma partition coefficients
MineralElementKdReference
ClinopyroxeneSr0.1[82]
ClinopyroxeneNd0.38[82]
ClinopyroxeneRb0.015[83]
ClinopyroxeneBa0.005[82]
PlagioclaseSr2[84]
PlagioclaseNd0.3[84]
PlagioclaseRb0.08[84]
PlagioclaseBa0.2[84]
OlivineSr0.0094[83]
OlivineNd0.008[85]
OlivineRb0.0133[83]
OlivineBa0.01[83]
OrthopyroxeneSr0.0026[82]
OrthopyroxeneNd0.013[82]
The bulk of the analysed granophyres constitute a relatively heterogeneous group, as highlighted by the variable concentrations of some elements (e.g., Na, K, Rb, Ba; Figure 6 and Figure 7). This variability, which is also reflected in the mineral chemistry (Figure 4), suggests that granophyres from each sector followed independent differentiation processes as disconnected magma bodies after their segregation from the mafic intrusion. The larger size of the NE Sanchorreja dyke, along with its highly radiogenic Sr ratios and the entrainment of zircon xenocrysts, calls for a more complex differentiation scenario (a larger magma body). Overall, the above data point to the joint participation of crystal fractionation, crustal rocks assimilation and posterior fluid interaction.

6. Conclusions

The Messejana–Plasencia great dyke (MPGD) is a complex Late Triassic tholeiitic gabbro intrusion which, with a minimum confirmed length of ~630 km, can be considered one of the world’s largest dykes known.
The major and trace element composition of the mafic rocks does not represent that of primary mantle-derived melts. Nevertheless, primary tholeiitic (low-Ti) magmas would ascend from their lithospheric mantle source and stagnate close to the Moho, where they would differentiate via crystal fractionation of olivine, clinopyroxene and plagioclase. Their Sr–Nd radiogenic ratios, close to the BSE values, display a significant heterogeneity and correlation with the SiO2 content. These geochemical features, together with the inclusion of xenocrystic zircons with similar texture and age to those of SCS lower crustal granulites, indicate that these magmas assimilated rocks from the deep crust. These evolved mafic magmas would rise and intrude the upper crust in successive pulses.
The granophyric bodies found in the NE segment of this gabbroic intrusion represent highly evolved magmas with a composition clearly separated from that of the gabbros by a compositional gap (lack of intermediate values). Several features support their formation via liquid immiscibility including the following: (1) the presence in the same outcrop of granophyre melts at very different scales (interstitial mm-sized pockets within the gabbros, small veins and m-sized dykes), (2) the compositional gap with the host gabbros and (3) the similitude of their major element composition with that of experimental immiscible felsic melts formed from mafic tholeiitic magmas.
The more radiogenic Sr–Nd ratios of the MPGD granophyres with respect to the gabbros, and the presence of xenocrystic zircons with internal textures and ages similar to those of the SCS granites, suggests that the ascending magmas were also contaminated by crustal rocks equivalent to these latter intrusions. These felsic melts would segregate and evolve in independent magma bodies of different volumes. Hydrothermal alteration can explain the markedly high Sr radiogenic values of samples from the larger Sanchorreja granophyre dyke.

Author Contributions

Petrography and major element mineral chemistry, C.V. and P.A.; geochemical models, E.L. and D.O. All authors collaborated in the creation of figures and tables. D.O. conceived this study and wrote an original draft, which was later improved with inputs from C.V., E.L. and P.A. All authors have read and agreed to the published version of the manuscript.

Funding

This research was funded by the MINISTERIO DE CIENCIA E INNOVACIÓN (SPAIN), through the research project with number PID2020-115980 GB-I00.

Data Availability Statement

The original contributions presented in this study are included in this article. Further inquiries can be directed to the corresponding author.

Acknowledgments

We acknowledge Alfredo Fernández Larios for his assistance with the electron microprobe analyses in the CAI of Microscopía Electrónica (UCM). We also thank Pilar Montero for the work carried out during zircon preparation and analysis in the IBERSIMS laboratory (University of Granada). This work has also benefited from the constructive comments of four anonymous reviewers, which have helped to improve the final manuscript.

Conflicts of Interest

The authors declare that they have no personal circumstances or interests that may be perceived as inappropriately influencing the representation or interpretation of the reported research results. The funders had no role in the design of this study; in the collection, analyses, or interpretation of data; in the writing of this manuscript; or in the decision to publish the results.

References

  1. Dunn, A.M.; Reynolds, P.H.; Clarke, D.B.; Ugidos, J.M. A comparison of the age and composition of the Sherburne Dyke, Nova Scotia, and the Messejana Dyke, Spain. Can. J. Earth Sci. 1998, 35, 1110–1115. [Google Scholar] [CrossRef]
  2. de Vicente, G.; Olaiz, A.; Muñoz-Martín, A.; Cunha, P.P. Longest and still longer: The Messejana-Plasencia dyke and its links with later Alpine deformation belt in Iberia. Tectonophysics 2021, 815, 229009. [Google Scholar] [CrossRef]
  3. Greenough, J.D.; Hodych, J.D. Evidence for lateral magma injection in the Early Mesozoic dykes of eastern North America. In Mafic Dykes and Emplacement Mechanisms; Parker, R.J., Rickwood, P.C., Tucker, D.H., Eds.; Balkema: Rotterdam, The Netherlands, 1990; pp. 35–46. [Google Scholar]
  4. Dalziel, I.W.D.; Lawver, L.A.; Murphy, J.B. Plumes, orogenesis, and supercontinental fragmentation. Earth Planet. Sci. Lett. 2000, 78, 1–11. [Google Scholar] [CrossRef]
  5. Torre de Assunçao, C. Sobre uma intrusão doleritica no Antracolitico do Baixo-Alentejo. Bol. Soc. Portu. Cienc. Naturais 1949, 2, 66–74. [Google Scholar]
  6. Torre de Assunçao, C. Os doleritos pigeoníticos de quimismo pacífico do sul de Portugal. In Boletim do Museu e Laboratório Mineralógico e Geológico da Faculdade de Ciências; Universidade de Lisboa: Lisboa, Portugal, 1951; Volume 19, pp. 109–117. [Google Scholar]
  7. Cebriá, J.M.; López-Ruiz, J.; Doblas, M.; Martins, L.T.; Munha, J. Geochemistry of the Early Jurassic Messejana-Plasencia dyke (Portugal-Spain); Implications on the Origin of the Central Atlantic Magmatic Province. J. Petrol. 2003, 44, 547–568. [Google Scholar] [CrossRef]
  8. Villaseca, C.; Orejana, D.; Higueras, P.; Pérez-Soba, C.; García Serrano, J.; Lorenzo, S. The evolution of the subcontinental mantle beneath the Central Iberian Zone: Geochemical tracking of its mafic magmatism from the Neoproterozoic to the Cenozoic. Earth Sci. Rev. 2022, 228, 103997. [Google Scholar] [CrossRef]
  9. Alibert, C. A Sr-Nd isotope and REE study of Late Triassic dolerites from the Pyrenees (France) and the Messejana dyke (Spain and Portugal). Earth Planet. Sci. Lett. 1985, 73, 81–90. [Google Scholar] [CrossRef]
  10. Callegaro, S.; Rapaille, C.; Marzoli, A.; Bertrand, H.; Chiaradia, M.; Reisberg, L.; Bellieni, G.; Martins, L.; Madeira, J.; Mata, J.; et al. Enriched mantle source for the Central Atlantic magmatic province: New supporting evidence from southwestern Europe. Lithos 2014, 188, 15–32. [Google Scholar] [CrossRef]
  11. Schermerhorn, L.J.G.; Priem, H.N.A.; Boelrijk, N.A.I.M.; Hebeda, E.H.; Verdurmen, E.A.T.; Verschure, R.H. Age and origin of the Messejana dolerite fault–dike system (Portugal and Spain) in the light of the opening of the North Atlantic Ocean. J. Geol. 1978, 86, 299–309. [Google Scholar] [CrossRef]
  12. García de Figuerola, L.C.; Carnicero, A. El extremo noreste del gran dique del Alentejo-Plasencia. Stud. Geol. Salmant. 1973, 6, 73–84. [Google Scholar]
  13. Dostal, J.; Dunning, M. Geochemical constraints on the origin and evolution of early Mesozoic dikes in Atlantic Canada. Eur. J. Mineral. 1998, 10, 79–93. [Google Scholar] [CrossRef]
  14. Nomade, S.; Pouclet, A.; Chen, Y. The French Guyana doleritic dykes: Geochemical evidence of three populations and new data for the Jurassic Central Atlantic Magmatic Province. J. Geodyn. 2002, 34, 595–614. [Google Scholar] [CrossRef]
  15. Kontak, D.J.; De Young, M.Y.D.; Dostal, J. Late-stage crystallization history of the Jurassic North Mountain Basalt, Nova Scotia, Canada. I. Textural and chemical evidence for pervasive development of silicate-liquid immiscibility. Can. Mineral. 2002, 40, 1287–1311. [Google Scholar] [CrossRef]
  16. Halder, M.; Paul, D.; Yang, S.Y. Origin of silicic rocks of the Deccan Traps continental flood basalt province: Inferences from field observations, petrography, and geochemistry. Geochem. Ger. 2023, 83, 125958. [Google Scholar] [CrossRef]
  17. Philpotts, A.R. Composition of immiscible liquids in volcanic rocks. Contrib. Mineral. Petrol. 1982, 80, 201–218. [Google Scholar] [CrossRef]
  18. Andreeva, O.A.; Andreeva, I.A.; Yarmolyuk, V.V.; Ji, J.Q.; Zhou, X.; Borisovskii, S.E. Silicate Liquid Immiscibility as a Result of Fenner-Type Crystal Fractionation of Wangtian’e Tholeiitic Melts, Northeast China. Petrology 2020, 28, 357–373. [Google Scholar] [CrossRef]
  19. Martínez-Catalán, J.R. The Central Iberian arc, an orocline centered in the Iberian Massif and some implications for the Variscan belt. Int. J. Earth Sci. 2012, 101, 1299–1314. [Google Scholar] [CrossRef]
  20. Kroner, U.; Romer, R.L. Two plates—Many subduction zones: The Variscan orogeny reconsidered. Gondwana Res. 2013, 24, 298–329. [Google Scholar] [CrossRef]
  21. Orejana, D.; Villaseca, C.; Kristoffersen, M. Geochemistry and geochronology of mafic rocks from the Spanish Central System: Constraints on the mantle evolution beneath central Spain. Geosci. Front. 2020, 11, 1651–1667. [Google Scholar] [CrossRef]
  22. Scarrow, J.H.; Molina, J.F.; Bea, F.; Montero, P.; Vaughan, A.P.M. Lamprophyre dikes as tectonic markers of late orogenic transtension timing and kinematics: A case study from the Central Iberian Zone. Tectonics 2011, 30, TC4007. [Google Scholar] [CrossRef]
  23. Oliveira, A.J.T.; Martins, H.C.B.; da Silva, H.M.S.M. Permo-Carboniferous hypabyssal magmatism in northern Portugal: The case of the Lamas de Olo microgranite and lamprophyre dykes. Iber. J. Geol. 2022, 48, 1–28. [Google Scholar] [CrossRef]
  24. Sebai, A.; Féraud, G.; Bertrand, H.; Hanes, J. 40Ar/39Ar dating and geochemistry of tholeiitic magmatism related to the early opening of the Central Atlantic rift. Earth Planet. Sci. Lett. 1991, 104, 455–472. [Google Scholar] [CrossRef]
  25. Osete, M.L.; Palencia Ortas, A. Iberian palaeomagnetic poles for the last 300 Ma. Fis. Tierra 2006, 18, 157–181. [Google Scholar]
  26. García de Figuerola, L.C.; Corretge, L.G.; Bea, F. El dique de Alentejo-Plasencia y haces de diques básicos de Extremadura. Bol. Geol. Min. Esp. 1974, 85, 308–337. [Google Scholar]
  27. Bertrand, H.; Millot, G. Le magmatisme tholéitique continental de la marge Ibérique, précurseur de l’overture de l’Atlantique Central: Les dolérites du dyke de Messejana–Plasencia (Portugal–Espagne). C. R. Geosci. 1987, 304, 215–220. [Google Scholar]
  28. Martins, L.T.; Cebriá, J.M.; Doblas, M.; López-Ruiz, J.; Munhá, J. Petrologia e geoquímica do dique de Messejana. Mem. Mus. Lab. Geol. Mineral. Porto 1995, 4, 747–750. [Google Scholar]
  29. Andonaegui, P.; Villaseca, C.; López García, J.A. Caracterización de los minerales del dique gabroideo de Messejana-Plasencia en su sector nor-oriental. Geogaceta 2005, 38, 219–222. [Google Scholar]
  30. Dahlquist, J.A.; Galindo, C.; Morales Camera, M.M.; Moreno, J.A.; Alasino, P.H.; Basei, M.A.S.; Macchioli Grande, M. A combined zircon Hf isotope and whole rock Nd and Sr isotopes study of Carboniferous A-type granites, Sierras Pampeanas of Argentina. J. S. Am. Earth Sci. 2020, 100, 102545. [Google Scholar] [CrossRef]
  31. Black, L.P.; Kamo, S.L.; Allen, C.M.; Aleinikoff, J.N.; Davis, D.W.; Korsch, R.J.; Foudoulis, C. TEMORA 1: A new zircon standard for Phanerozoic U–Pb geochronology. Chem. Geol. 2003, 200, 155–170. [Google Scholar] [CrossRef]
  32. Black, L.P.; Kamo, S.L.; Allen, C.M.; Davis, D.W.; Aleinikoff, J.N.; Valley, J.W.; Mundil, R.; Campbell, I.H.; Korsch, R.J.; Williams, I.S.; et al. Improved Pb/U microprobe geochronology by the monitoring of a trace-element-related matrix effect; SHRIMP, ID-TIMS, ELA-ICP-MS and oxygen isotope documentation for a series of zircon standards. Chem. Geol. 2004, 205, 115–140. [Google Scholar] [CrossRef]
  33. Ludwig, K.R. ISOPLOT/Ex, version 3. A geochronological toolkit for Microsoft Excel. Berkeley Geochr. Cent. Spec. Pub. 2003, 4, 1–71. [Google Scholar]
  34. Whitney, D.L.; Evans, B.W. Abbreviations for names of rock-forming minerals. Am. Mineral. 2010, 95, 185–187. [Google Scholar] [CrossRef]
  35. Rossi, P.; Chevremont, P. Classification des associations magmatiques granitoides. Geochronique 1987, 21, 14–18. [Google Scholar]
  36. Nachit, H.; Razafimahefa, N.; Stussi, J.M.; Carron, J.P. Biotite chemical-compositions and magmatic typology of the granitoids. C. R. Geosci. 1985, 301, 813–817. [Google Scholar]
  37. Rollinson, H.R. Using Geochemical Data: Evaluation, Presentation, Interpretation; Longman Scientific & Technical: New York, NY, USA, 1993; 352p. [Google Scholar]
  38. Brandebourger, E. Les Granitoides Hercyniens Tardifs de la Sierra de Guadarrama (Système Central, Espagne): Pétrographie et Geochimie. Ph.D. Thesis, Université de Lorraine, Metz, France, 1984; 209p. [Google Scholar]
  39. Casillas, R. Las Asociaciones Plutónicas Tardihercínicas del Sector Occidental de la Sierra de Guadarrama, Sistema Central Español, (Las Navas del Marqués–San Martín de Valdeiglesias). Petrología, Geoquímica, Génesis y Evolución. Ph.D. Thesis, Universidad Complutense de Madrid, Madrid, Spain, 1989; 316p. [Google Scholar]
  40. Villaseca, C.; Barbero, L.; Rogers, G. Crustal origin of Hercynian peraluminous granitic batholiths of central Spain: Petrological, geochemical and isotopic (Sr,Nd) arguments. Lithos 1998, 43, 55–79. [Google Scholar] [CrossRef]
  41. Sun, S.S.; McDonough, W.F. Chemical and isotopic systematics of oceanic basalts; implications for mantle composition and processes. In Magmatism in Ocean Basins; Saunders, A.D., Norrey, M.J., Eds.; Geological Society Special Publication: Oxford, UK, 1989; Volume 42, pp. 313–345. [Google Scholar]
  42. McDonough, W.F.; Sun, S.S. The composition of the Earth. Chem. Geol. 1995, 120, 223–253. [Google Scholar] [CrossRef]
  43. Villaseca, C.; Merino Martínez, E.; Orejana, D.; Andersen, T.; Belousova, E.A. Zircon Hf signatures from granitic orthogneisses of the Spanish Central System: Significance and sources of the Cambro-Ordovician magmatism in the Iberian Variscan Belt. Gondwana Res. 2016, 34, 60–83. [Google Scholar] [CrossRef]
  44. Orejana, D.; Villaseca, C.; Elburg, M.A.; Merino-Martínez, E.; Serrano, J.G. Nature and evolution of the lower crust under central Spain: Inferences from granulite xenoliths (Calatrava Volcanic Field-Spanish central system). Geosci. Front. 2023, 14, 101525. [Google Scholar] [CrossRef]
  45. Orejana, D.; Villaseca, C.; Valverde-Vaquero, P.; Belousova, E.A.; Armstrong, R.A. U–Pb geochronology and zircon composition of late Variscan S- and I-type granitoids from the Spanish Central System batholith. Int. J. Earth Sci. 2012, 101, 1789–1815. [Google Scholar] [CrossRef]
  46. Orejana, D.; Villaseca, C.; Armstrong, R.A.; Jeffries, T.E. Geochronology and trace element chemistry of zircon and garnet from granulite xenoliths: Constraints on the tectonothermal evolution of the lower crust under central Spain. Lithos 2011, 124, 103–116. [Google Scholar] [CrossRef]
  47. Fernández Suárez, J.; Arenas, R.; Jeffries, T.E.; Whitehouse, M.J.; Villaseca, C. A U–Pb study of zircons from a lower crustal granulite xenolith of the Spanish Central system: A record of Iberian lithospheric evolution from the Neoproterozoic to the Triassic. J. Geol. 2006, 114, 471–483. [Google Scholar] [CrossRef]
  48. Cox, K.G.; MacDonald, R.; Hornung, G. Geochemical and petrographic provinces in the Karroo basalts of southern Africa. Am. Mineral. 1967, 52, 1451–1474. [Google Scholar]
  49. Thy, P.; Lesher, C.E.; Nielsen, T.F.D.; Brooks, C.K. Experimental constraints on the Skaergaard liquid line of descent. Lithos 2006, 92, 154–180. [Google Scholar] [CrossRef]
  50. Villiger, S.; Ulmer, P.; Müntener, O. Equilibrium and fractional crystallization experiments at 0.7 GPa: The effect of pressure on phase relations and liquid compositions of tholeiitic magmas. J. Petrol. 2007, 48, 159–184. [Google Scholar] [CrossRef]
  51. Sisson, T.W.; Ratajeski, K.; Hankins, W.B.; Glazner, A.F. Voluminous granitic magmas from common basaltic sources. Contrib. Mineral. Petrol. 2005, 148, 635–661. [Google Scholar] [CrossRef]
  52. Hotz, P.E. Petrology of granophyre in diabase near Dillsburg, Pennsylvania. Geol. Soc. Am. Bull. 1953, 64, 675–704. [Google Scholar] [CrossRef]
  53. Marsh, B.D. Solidification fronts and magmatic evolution. Mineral. Mag. 1996, 60, 5–40. [Google Scholar] [CrossRef]
  54. White, C.M. The graveyard point intrusion: An example of extreme differentiation of Snake River Plain basalt in a shallow crustal pluton. J. Petrol. 2007, 48, 303–325. [Google Scholar] [CrossRef]
  55. Johannes, E.; Holtz, F. Petrogenesis and Experimental Petrology of Granitic Rocks. Minerals, Rocks and Mountains; Springer: Berlin, Germany, 1996; 335p. [Google Scholar]
  56. Winter, J.D. An Introduction to Igneous and Metamorphic Petrology, 1st ed.; Prentince Hall: Upper Saddle River, NJ, USA, 2001; 697p. [Google Scholar]
  57. Charlier, B.; Namur, O.; Toplis, M.J.; Schiano, P.; Cluzel, N.; Higgins, M.D.; Vander Auwera, J. Large-scale silicate liquid immiscibility during differentiation of tholeiitic basalt to granite and the origin of the Daly gap. Geology 2011, 39, 907–910. [Google Scholar] [CrossRef]
  58. Geist, D.; Howard, K.A.; Larson, P. The Generation of Oceanic Rhyolites by Crystal Fractionation—The Basalt-Rhyolite Association at Volcan-Alcedo, Galapagos-Archipelago. J. Petrol. 1995, 36, 965–982. [Google Scholar] [CrossRef]
  59. Peccerillo, A. Relationships between Mafic and Peralkaline Silicic Magmatism in Continental Rift Settings: A Petrological, Geochemical and Isotopic Study of the Gedemsa Volcano, Central Ethiopian Rift. J. Petrol. 2003, 44, 2003–2032. [Google Scholar] [CrossRef]
  60. Dufek, J.; Bachmann, O. Quantum magmatism: Magmatic compositional gaps generated by melt-crystal dynamics. Geology 2010, 38, 687–690. [Google Scholar] [CrossRef]
  61. McBirney, A.R. Differentiation of the Skaergaard intrusion. Nature 1975, 253, 691–694. [Google Scholar] [CrossRef]
  62. Jakobsen, J.K.; Veksler, I.V.; Tegner, C.; Brooks, C.K. Immiscible iron- and silica-rich melts in basalt petrogenesis documented in the Skaergaard intrusion. Geology 2005, 33, 885–888. [Google Scholar] [CrossRef]
  63. Ripley, E.M.; Severson, M.J.; Hauck, S.A. Evidence for sulfide and Fe-Ti-P-rich liquid immiscibility in the Duluth Complex, Minnesota. Econ. Geol. Bull. Soc. 1998, 93, 1052–1062. [Google Scholar] [CrossRef]
  64. Namur, O.; Charlier, B.; Holness, M.B. Dual origin of Fe-Ti-P gabbros by immiscibility and fractional crystallization of evolved tholeiitic basalts in the Sept Iles layered intrusion. Lithos 2012, 154, 100–114. [Google Scholar] [CrossRef]
  65. VanTongeren, J.A.; Mathez, E.A. Large-scale liquid immiscibility at the top of the Bushveld Complex, South Africa. Geology 2012, 40, 491–494. [Google Scholar] [CrossRef]
  66. Charlier, B.; Namur, O.; Grove, T.L. Compositional and kinetic controls on liquid immiscibility in ferrobasalt-rhyolite volcanic and plutonic series. Geochim. Cosmochim. Acta 2013, 113, 79–93. [Google Scholar] [CrossRef]
  67. Roedder, E.W. Low temperature liquid immiscibility field in the system K2O–FeO–Al2O3–SiO2. Am. Mineral. 1951, 36, 282–286. [Google Scholar]
  68. Veksler, I.V.; Dorfman, A.M.; Danyushevsky, L.V.; Jakobsen, J.K.; Dingwell, D.B. Immiscible silicate liquid partition coefficients: Implications for crystal-melt element partitioning and basalt petrogenesis. Contrib. Mineral. Petrol. 2006, 152, 685–702. [Google Scholar] [CrossRef]
  69. Villaseca, C.; Downes, H.; Pin, C.; Barbero, L. Nature and composition of the lower continental crust in central Spain and the granulite-granite linkage: Inferences from granulitic xenoliths. J. Petrol. 1999, 40, 1465–1496. [Google Scholar] [CrossRef]
  70. Grieco, G.; Ferrario, A.; von Quadt, A.; Koeppel, V.; Mathez, E.A. The zircon-bearing chromitites of the phlogopite peridotite of Finero (Ivrea zone, southern Alps): Evidence and geochronology of a metasomatized mantle slab. J. Petrol. 2001, 42, 89–101. [Google Scholar] [CrossRef]
  71. Liu, Y.; Gao, S.; Hu, Z.; Gao, C.; Zong, K.; Wang, D. Continental and oceanic crust recycling-induced melt-peridotite interactions in the Trans-North China Orogen: U–Pb dating, Hf isotopes and trace elements in zircons from mantle xenoliths. J. Petrol. 2010, 51, 537–571. [Google Scholar] [CrossRef]
  72. González-Jiménez, J.M.; Marchesi, C.; Griffin, W.L.; Gervilla, F.; Belousova, E.A.; Garrido, C.J.; Romero, R.; Talavera, C.; Leisen, M.; O’Reilly, S.Y.; et al. Zircon recycling and crystallization during formation of chromite- and Ni-arsenide ores in the subcontinental lithospheric mantle (Serranía de Ronda, Spain). Ore Geol. Rev. 2017, 90, 193–209. [Google Scholar] [CrossRef]
  73. Gutiérrez-Alonso, G.; Murphy, J.B.; Fernández-Suárez, J.; Weil, A.B.; Franco, M.P.; Gonzalo, J.C. Lithospheric delamination in the core of Pangea: Sm–Nd insights from the Iberian mantle. Geology 2011, 39, 155–158. [Google Scholar] [CrossRef]
  74. DePaolo, D.J. Trace element and isotopic effects of combined wallrock assimilation and fractional crystallization. Earth Planet. Sci. Lett. 1981, 53, 189–202. [Google Scholar] [CrossRef]
  75. Wenner, D.; Taylor, H. Oxygen and hydrogen isotope studies of a precambrian granite-rhyolite terrane, St-Francois mountains, southeastern Missouri. Geol. Soc. Am. Bull. 1976, 87, 1587–1598. [Google Scholar] [CrossRef]
  76. Walraven, F.; Strydom, J.H.; Strydom, N. Rb–Sr open-system behaviour and its application as a pathfinder for Sn mineralisation in granites of the Bushveld Complex, South Africa. J. Geochem. Expl. 1990, 37, 333–350. [Google Scholar] [CrossRef]
  77. Brantley, S.L.; Chesley, J.T.; Stillings, L.L. Isotopic ratios and release rates of strontium from weathering feldspars. Geochim. Cosmochim. Acta 1998, 62, 1493–1500. [Google Scholar] [CrossRef]
  78. Ma, Y.; Liu, C. Sr isotope evolution during chemical weathering of granites—Impact of relative weathering rates of minerals. Sci. China (Earth Sci.) 2001, 44, 726–734. [Google Scholar] [CrossRef]
  79. Kaur, P.; Chaudhri, N.; Hofmann, A.W.; Raczek, I.; Okrusch, M.; Skora, S.; Baumgartner, L.P. Two-Stage, extreme albitization of A-type granites from Rajasthan, NW India. J. Petrol. 2012, 53, 919–948. [Google Scholar] [CrossRef]
  80. Ubanell, A.G.; Garzón, G.; de la Peña, J.A.; Bustillo, A.; Martil, R. Estudio de procesos de alteración hidrotermal en rocas graníticas y sedimentarias (provincia de Ávila). Est. Geol. 1978, 34, 151–160. [Google Scholar]
  81. Parsapoor, A.; Khalili, M.; Maghami, M. Discrimination between mineralized and unmineralized alteration zones using primary geochemical haloes in the Darreh-Zar porphyry copper deposit in Kerman, southeastern Iran. J. Afr. Earth Sci. 2017, 132, 109–126. [Google Scholar] [CrossRef]
  82. Irving, A.J.; Frey, F.A. Trace element abundances in megacrysts and their host basalts: Constraints on partition coefficients and megacryst genesis. Geochim. Cosmochim. Acta 1984, 48, 1201–1221. [Google Scholar] [CrossRef]
  83. Philpotts, J.A.; Schnetzler, C.C. Phenocryst-matrix partition coefficients for K, Rb, Sr and Ba, with applications to anorthosite and basalt genesis. Geochim. Cosmochim. Acta 1970, 34, 307–322. [Google Scholar] [CrossRef]
  84. Bindeman, I.N.; Davis, A.M.; Drake, M.J. Ion Microprobe Study of Plagioclase-Basalt Partition Experiments at Natural Con-centration Levels of Trace Elements. Geochim. Cosmochim. Acta 1998, 62, 1175–1193. [Google Scholar] [CrossRef]
  85. Paster, T.P.; Schauwecker, D.S.; Haskin, L.A. The behavior of some trace elements during solidification of the Skaergaard layered series. Geochim. Cosmochim. Acta 1974, 38, 1549–1577. [Google Scholar] [CrossRef]
Figure 2. (A) Example of a field outcrop of a granophyric dyke intruding the gabbroic Messejana–Plasencia dyke (hammer for scale) (stop 1 of Figure 1). (B) Granophyric cm-sized dykelete intruding diabasic gabbro in the Villatoro pass (stop 6 of Figure 1). See a one-euro coin in the left corner for scale. (CF) Plane- and cross-polarised light images of thin sections illustrating interstitial quartz-alkali feldspar granophyric intergrowth within the diabasic gabbro: (C,D): sample 103324 50× PPL and XPL; (E,F): sample 103301 50× PPl and XPL, respectively. The white bar in images (CF) represents 550 μm. Mineral abbreviations after [34].
Minerals 14 00316 g002
Figure 3. Cross-polarised light photographs (A,B) and Back-Scattered Electron (BSE) images (CF) of selected granophyres of the Messejana–Plasencia dyke. (A,B) Thin section of granophyre 113106 (50× PPL) showing granophyric intergrowths of quartz and alkali feldspar within a medium-grained matrix of alkali feldspar and quartz crystals. (C) Gabbro 103324 showing interstitial granitic granophyre intergrowths of quartz and alkali feldspar. (D,E) Granophyre 113106 showing quartz-K-feldspar intergrowths and accessory biotite and apatite crystals. (F) Granophyre 113105 showing biotite partially altered and apatite crystals. The white bar represents 550 μm and 200 μm in images A–B and C–F, respectively. Mineral abbreviations after [34].
Minerals 14 00316 g003
Figure 4. Selected major oxide mineral chemistry of MPGD gabbros and granophyres. (A) Feldspar composition in Ab-Or-An plots. (BE) Biotite composition of selected oxides (wt%) and AlIV (apfu) vs. Mg# or Fe# (in atomic ratios). FeO-MgO-Al2O3 plot with compositional fields after [35]. Fields I, II and III are aluminium-potassic (peraluminous), calc-alkaline and monzonitic granitic series, respectively. (F) Apatite composition in a Na2O + K2O vs. F/Cl plot (in wt%). In some diagrams, granophyre fields from different locations (see key to Figure 1B) are marked.
Minerals 14 00316 g004
Figure 5. Whole-rock major element composition (wt%) of MPGD rocks: (A) TAS diagram: total alkalis vs. silica. Classification fields taken from [37] and references therein. (B) Triangular (Na2O + K2O)–FeOt–MgO diagram for tholeiitic–calc-alkaline series discrimination. (C) K2O vs. SiO2 diagram. (D) A/NK vs. A/CNK diagram. Literature data from [7,8].
Minerals 14 00316 g005
Figure 6. Major elements vs. MgO (wt%) diagrams for the MPGD samples. Literature data from [7,8]. The composition of SCS granites is also plotted for comparison (grey squares) [38,39,40].
Minerals 14 00316 g006
Figure 7. Trace elements (ppm) vs. MgO (wt%) diagrams for the MPGD samples. Literature data from [7,8]. The composition of SCS granites is also plotted for comparison (grey squares) [38,39,40].
Minerals 14 00316 g007
Figure 8. (A) Chondrite-normalised REE and (B) Primitive Mantle-normalised multi-trace element composition of the MPGD samples. Literature data from [7,8]. Chondrite and Primitive Mantle normalisation values after [41,42], respectively.
Minerals 14 00316 g008
Figure 9. Initial 87Sr/86Sr and 143Nd/144Nd ratios of the MPGD samples. Literature data from [7,8]. The fields of SCS Variscan mafic magmatism, SCS orthogneisses and SCS Variscan felsic magmatism were taken from [21,43,40], respectively.
Minerals 14 00316 g009
Figure 10. CL images of representative zircon grains from samples 103324 (gabbro) and 113106 (granophyre) from the MPGD, showing the analysed spots (red ellipse) and age obtained.
Minerals 14 00316 g010
Figure 11. SHRIMP U–Pb data for zircons from the MPGD samples. (A,B) Concordia and probability plot diagrams of sample 103324 (gabbro). (C,D) Concordia and probability plot diagrams of sample 113106 (granophyre). Error ellipses are given at the 2σ level. The distribution of zircon ages from the SCS lower crust granulites and SCS Variscan granites, which were taken from [44,45], respectively, is plotted for comparison in diagrams (B,D).
Minerals 14 00316 g011
Figure 12. Normative composition of the MPGD granophyres in the Ab–Or–Qtz system. The ternary cotectic curves and eutectic minima for 0.2, 0.5 and 1 GPa [55], and the composition of typical anatectic granites are also shown. Modified after [56].
Minerals 14 00316 g012
Figure 13. Triangular diagrams showing the major element composition of the MPGD samples together with immiscibility fields from experiments in tholeiitic systems. (A): Plot modified after [17], including the composition of Fe-rich and Si-rich glasses formed by liquid immiscibility. The immiscibility field of fayalite–leucite–silica was taken from [67]. (B,C): Plots modified after [66] showing tholeiitic basalts and their products of differentiation and the Fe-rich and Si-rich experimental and natural immiscible melts. The thick grey line separates the two-liquid (up) from the one-liquid (down) fields. Literature data from [7,8].
Minerals 14 00316 g013
Figure 14. Assimilation and Fractional Crystallisation (AFC) models [74] with Sr–Nd isotopic ratios and trace element composition of the MPGD gabbros. Literature data from [7,8]. The black arrow represents the chemical evolution predicted by the model with an indication of the percentage of fractionation. The best fit is obtained for an assimilation/fractionation ratio (r) of 0.25. The initial melt and contaminant compositions are represented with a white circle and a black star, respectively. Note the change in scale in the isotopic diagram (left).
Minerals 14 00316 g014
Figure 15. Assimilation and Fractional Crystallisation (AFC) model [74] for the Sr–Nd isotopic ratios of the MPGD granophyres. Literature data from [7,8]. The black line represents the evolution predicted by the model with an indication of the percentage of fractionation. The initial melt and contaminant compositions are represented with a white circle and a black star, respectively. The compositional field of SCS granites is also shown for comparison (grey field).
Minerals 14 00316 g015
Table 1. Major element chemistry (wt%) of representative feldspars from the gabbros and granophyres of the Messejana–Plasencia dyke.
Sample103324103324103324103324103317103317103317103327103327103327103327103309104367
Analysis4837394328424533352197481
Rock GbGbGbGbGbGbGbGb pegGb pegGb pegGb pegGbGrn
MineralKfsKfsPlPlPlPlPlPlPlPlKfsPlPl
Locationinterstinterstrimcore interstinterst interst
Outcrop7777666777716
SiO264.9962.9459.9652.6349.4650.1966.2766.8355.5161.6163.9250.5267.52
TiO20.010.080.020.110.010.040.000.000.060.040.080.030.03
Al2O318.7318.1523.4428.7530.1829.5620.1919.6727.2923.7218.9730.9019.77
FeOt0.080.030.190.470.740.780.120.000.710.350.130.650.04
MnO0.040.000.000.000.000.060.030.000.000.000.000.000.01
MgO0.020.000.000.040.130.200.060.000.020.010.000.020.00
CaO0.240.055.7411.5316.7414.921.480.5410.435.650.3614.730.09
Na2O3.250.688.324.853.003.8311.0111.425.758.002.543.0812.02
K2O12.2015.950.770.310.120.220.420.040.430.8212.560.160.03
Total99.5797.8898.4598.73100.56100.1699.6398.50100.27100.2598.57100.1599.75
Cations calculated based on 8 O
Si2.9802.9792.7212.4202.2732.3122.9292.9682.5092.7402.9532.3072.968
Ti0.0000.0030.0010.0040.0000.0010.0000.0000.0020.0010.0030.0010.001
Al1.0131.0131.2541.5591.6351.6051.0521.0301.4541.2441.0501.6641.024
Fe3+0.0030.0010.0060.0160.0260.0270.0040.0000.0240.0120.0040.0220.001
Mg0.0010.0000.0000.0020.0090.0140.0040.0000.0020.0010.0000.0010.000
Mn0.0020.0000.0000.0000.0000.0020.0010.0000.0000.0000.0000.0000.001
Ca0.0120.0030.2790.5680.8240.7360.0700.0260.5050.2690.0180.7210.004
Na0.2890.0630.7320.4320.2670.3420.9430.9830.5040.6900.2310.2731.024
K0.7140.9630.0440.0180.0070.0130.0240.0020.0250.0470.7520.0090.002
Suma cat.5.0135.0245.0385.0205.0415.0535.0275.0095.0245.0035.0104.9985.025
An1.180.2726.4455.7874.9067.126.772.5248.8526.791.8071.880.41
Ab28.486.1069.3642.4624.2631.2290.8697.2648.7568.5923.0927.2299.43
Or70.3493.644.201.770.661.192.290.222.394.6375.110.900.16
Sample103311103311103326103326106284106284106292106292113105113105113106113106
Analysis326011139597778130315057
Rock GrnGrnGrnGrnGrnGrnGrnGrnGrnGrnGrnGrn
MineralPlKfsPlKfsKfsKfsKfsKfsKfsKfsKfsKfs
Location simpl
Outcrop117733662222
SiO266.7564.5868.2164.0163.2663.1563.1863.3563.9765.3363.2463.51
TiO20.060.020.030.040.040.120.030.000.020.040.000.04
Al2O320.1418.3919.5018.3518.2518.1318.0318.1618.1118.3220.0319.09
FeOt0.080.260.030.020.090.810.220.100.000.030.050.03
MnO0.010.020.040.000.000.000.010.050.000.030.000.00
MgO0.010.000.000.010.040.170.010.000.020.010.000.03
CaO0.770.080.340.050.010.010.220.020.180.080.400.17
Na2O11.170.4211.620.230.140.120.470.272.304.154.882.44
K2O0.0415.530.0416.4916.8116.6815.8516.6513.6210.779.7613.29
Total99.0399.3399.8199.4198.6599.2698.0498.6198.2198.7598.3798.59
Cations calculated based on 8 O
Si2.9512.9972.9872.9862.9792.9682.9852.9842.9903.0012.9182.955
Ti0.0020.0010.0010.0010.0010.0040.0010.0000.0010.0010.0000.001
Al1.0491.0061.0071.0101.0131.0041.0041.0080.9980.9921.0901.047
Fe3+0.0030.0090.0010.0010.0030.0290.0080.0040.0000.0010.0020.001
Mg0.0010.0000.0000.0010.0030.0120.0000.0000.0010.0000.0000.002
Mn0.0000.0010.0020.0000.0000.0000.0000.0020.0000.0010.0000.000
Ca0.0360.0040.0160.0030.0000.0000.0110.0010.0090.0040.0200.009
Na0.9570.0380.9870.0200.0130.0110.0430.0240.2080.3700.4370.220
K0.0020.9190.0020.9821.0101.0000.9561.0000.8120.6310.5750.789
Suma cat.5.0014.9765.0025.0045.0235.0285.0095.0235.0195.0015.0425.024
An3.660.421.610.270.040.021.090.100.900.381.900.84
Ab96.133.9798.162.021.221.084.232.3920.2236.8242.3621.67
Or0.2095.610.2497.3698.7398.8994.6897.5178.8962.8155.7377.50
Mineral abbreviations after [34]. Gb = gabbro, Gb peg = pegmatitic gabbro, Grn = felsic granophyre, interst = interstitial granophyric intergrowth. Outcrop numbers from Figure 1.
Table 2. Major element chemistry (wt%) of representative biotite and apatite from the gabbros and granophyres of the Messejana–Plasencia dyke.
Sample103322103322103325103325103325103327103327103301103309103309103311103311113105
Analysis11212113161950536213283434
Rock GbGbGbGbGbGb pegGb pegGbGbGbGrnGrnGrn
MineralBtBtBtBtBtBtBtBtBtBtBtBtBt
Outcrop7777777411112
SiO236.4037.5736.0234.6635.8036.7236.2534.9936.0136.2034.1234.9135.40
TiO24.813.905.085.514.123.745.143.934.894.451.951.657.49
Al2O312.9713.0413.0313.0713.6612.6013.0513.0512.5112.3116.8317.1914.56
FeOt25.9723.0327.4828.0626.5822.2626.1425.7625.5523.4125.6425.6716.15
MnO0.170.070.070.150.090.170.050.100.040.130.250.160.19
MgO7.5710.105.104.477.019.977.169.186.438.786.025.8511.89
CaO0.010.040.110.070.040.000.020.010.000.000.070.100.01
Na2O0.240.210.210.170.130.380.340.150.280.240.500.450.45
K2O9.619.519.239.259.269.478.958.039.089.208.188.089.11
P2O5nd.nd.nd.nd.nd.nd.nd.nd.nd.nd.nd.nd.nd.
F0.260.36nd.nd.nd.nd.nd.0.150.360.53nd.nd.0.20
Clnd.nd.nd.nd.nd.nd.nd.0.420.360.27nd.nd.0.31
Total97.9997.8296.3395.4196.6895.3197.1295.8795.4995.5193.5794.0595.96
Mg#0.340.440.250.220.320.440.330.390.310.400.290.290.56
Cations calculated based on 22 O (OH, Cl, F) for biotite and 25 O (OH, Cl, F) for apatite
Si5.5885.6665.6795.5615.5955.7155.6185.4705.6475.6145.4665.5375.311
AlIV2.3462.3172.3212.4392.4052.2852.3822.4042.3132.2512.5342.4632.576
AlVI0.0000.0000.0990.0320.1110.0260.0020.0000.0000.0000.6440.7510.000
Ti0.4900.4250.6020.6650.4840.4380.5990.3360.5370.3840.2350.1960.732
Fe3+0.0000.0000.0000.0000.0000.0000.0000.0000.0000.0000.0000.0000.000
Fe2+3.3342.9043.6223.7653.4732.8973.3883.3683.3503.0373.4353.4042.027
Mn0.0220.0090.0100.0210.0120.0220.0070.0130.0050.0160.0340.0210.025
Mg1.7322.2711.1991.0681.6342.3121.6552.1391.5032.0291.4371.3842.661
Ca0.0010.0070.0180.0130.0070.0000.0040.0020.0000.0000.0110.0170.002
Na0.0710.0610.0630.0540.0380.1140.1020.0450.0840.0720.1540.1370.131
K1.8821.8291.8571.8931.8451.8801.7701.6011.8151.8201.6721.6361.744
P0.0000.0000.0000.0000.0000.0000.0000.0000.0000.0000.0000.0000.000
F0.1280.1730.0000.0000.0000.0000.0000.0750.1800.2570.0000.0000.094
Cl0.0000.0000.0000.0000.0000.0000.0000.1110.0950.0720.0000.0000.078
Suma cat15.59415.66115.47015.51115.60515.68915.52615.56315.52915.55215.62315.54615.380
Sample113106106285106285106286106286106289106292106292103301103324113106104367
Analysis54343842441376846542568
Rock GrnGrnGrnGrnGrnGrnGrnGrnGbGbGrnGrn
MineralBtBtBtBtBtBtBtBtApApApAp
Outcrop222222664726
SiO236.7033.2133.9334.7533.3333.6133.4635.280.460.140.140.21
TiO25.553.573.602.332.293.144.433.570.000.000.000.00
Al2O315.8817.7416.6217.6318.2718.5114.3913.890.000.000.000.00
FeOt15.0125.9426.0225.5726.1226.5924.1522.180.390.561.970.19
MnO0.070.330.270.290.340.380.120.130.050.000.690.00
MgO14.323.685.035.814.392.907.408.720.070.000.390.00
CaO0.020.020.050.010.020.020.050.0855.5955.9450.7755.08
Na2O0.630.460.620.610.620.450.530.520.050.060.380.08
K2O8.819.098.888.988.189.198.938.610.010.020.060.04
P2O5nd.nd.nd.nd.nd.nd.nd.nd.41.2041.6340.8642.30
F0.882.792.733.103.012.671.371.561.952.591.732.26
Cl0.270.690.400.430.501.291.131.070.680.131.940.09
Total98.2297.5198.2099.7697.1298.7695.9695.6199.52100.0699.0399.43
Mg#0.630.200.250.290.230.160.350.41
Cations calculated based on 22 O (OH, Cl, F) for biotite and 25 O (OH, Cl, F) for apatite
Si5.2674.9765.0525.0524.9804.9795.1525.3540.0770.0230.0250.036
AlIV2.6873.0242.9162.9483.0203.0212.6112.4840.0000.0000.0000.000
AlVI0.0000.1080.0000.0720.1960.2100.0000.0000.0000.0000.0000.000
Ti0.5540.4020.3710.2550.2570.3490.2770.2460.0000.0000.0000.000
Fe3+0.0000.0000.0530.2790.0670.0000.0000.0000.0000.0000.0000.000
Fe2+1.8013.2503.1862.8293.1953.2943.1102.8150.0540.0770.2840.026
Mn0.0090.0420.0340.0350.0430.0480.0160.0160.0080.0000.1000.000
Mg3.0640.8211.1171.2600.9780.6411.6991.9740.0170.0000.1000.000
Ca0.0040.0030.0090.0020.0030.0030.0090.0139.9049.8999.3769.939
Na0.1740.1350.1780.1720.1800.1300.1590.1520.0150.0200.1260.026
K1.6131.7371.6861.6661.5591.7371.7541.6660.0020.0040.0140.008
P0.0000.0000.0000.0000.0000.0000.0000.0005.8985.9655.9355.948
F0.3981.3191.2841.4251.4201.2530.6660.7470.9931.3020.9031.141
Cl0.0670.1750.1010.1060.1250.3250.2950.2760.1860.0360.5390.023
Suma cat15.63815.99115.98716.10216.02515.98915.74915.74417.15417.32617.40117.148
Mineral abbreviations after [34]. Gb = gabbro, Gb peg = pegmatitic gabbro, Grn = felsic granophyre. Outcrop numbers from Figure 1.
Table 3. Whole-rock composition (major and trace elements) of samples from the Messejana–Plasencia dyke 1.
Sample103310103326106284106285106292113105113106113104
Type 2GrnGrnGrnGrnGrnGrnGrnGb
Location17326226
SiO272.1174.8573.6270.5571.8273.8672.9551.77
TiO20.240.200.280.320.200.070.101.68
Al2O312.4212.8411.8812.9312.2014.0014.2216.31
Fe2O3 (*)2.901.312.622.702.880.680.6312.47
MnO0.030.020.010.010.030.010.010.15
MgO0.800.781.781.141.600.330.423.41
CaO0.710.640.460.310.560.390.3810.29
Na2O1.874.750.060.652.521.551.642.60
K2O6.363.174.707.615.608.578.360.72
P2O50.180.150.180.200.180.220.200.17
LOI2.421.313.522.291.680.931.091.18
Total100.05100.0299.1298.7199.28100.61100.00100.75
ACNK 31.61.02.01.31.11.11.10.7
Rb22110517227815525223724
Ba741217428370653438451200
Cs3.901.2019.412.12.588.204.502.10
Sr11761.032.428.842.149.045.0208
Pbbdlbdlbdl32.9bdl36.035.0bdl
Th5.9310.26.676.828.763.243.852.72
U2.742.632.193.423.332.062.120.73
Zr87.010784.593.689.938.054.0127
Nb8.5010.39.2610.410.16.106.908.60
Y20.421.516.823.021.410.811.628.8
Co4.003.003.684.494.915.007.0037.0
V16.016.021.522.213.67.09.0374
Nibdlbdlbdlbdlbdlbdlbdl40.0
Cr22.087.039.439.3143180200150
Ga14.015.015.416.513.413.014.020.0
Ta1.641.701.181.751.591.911.430.59
Hf2.503.002.362.872.621.501.803.70
La7.9110.012.318.310.16.627.7714.0
Ce20.225.126.838.625.512.315.230.8
Pr2.753.243.334.703.271.521.853.96
Nd11.913.613.117.913.35.886.8217.7
Sm3.053.283.004.223.461.471.794.54
Eu0.300.310.390.570.330.360.411.44
Gd3.173.392.904.313.571.591.914.99
Tb0.580.630.500.730.620.290.350.90
Dy3.663.893.064.203.901.682.045.37
Ho0.730.770.640.840.780.330.361.15
Er2.122.262.042.492.310.950.973.32
Tm0.320.340.300.360.340.140.140.48
Yb1.932.061.872.192.060.910.882.94
Lu0.280.290.270.320.280.140.140.46
1 Major and trace element concentrations in wt.% and ppm, respectively. 2 Grn: granophyre; Gb: gabbro. 3 ACNK = [Al2O3/(CaO + Na2O + K2O)] in molecular values. (*) Total Fe expressed as Fe2O3.
Table 4. Sr–Nd isotopic composition of the Messejana–Plasencia dyke granophyres and gabbro.
Sample103310103326106285113105113106113104
Type 1GrnGrnGrnGrnGrnGb
Location172226
Rb (ppm)22110527825223724
Sr (ppm)11761294945208
87Rb/86Sr5.484.9927.9614.9615.320.33
87Sr/86Sr ± 2σ0.723865 ± 040.723491 ± 050.786676 ± 070.759765 ± 030.758034 ± 030.707350 ± 02
87Sr/86Sr200 Ma0.7082920.7093000.7071570.7172150.7144670.706401
Sm (ppm)3.13.34.21.51.84.5
Nd (ppm)11.913.617.95.96.817.7
147Sm/144Nd0.1550.1460.1430.1510.1590.155
143Nd/144Nd ±2σ0.512395 ± 030.512365 ± 030.512269 ± 050.512350 ± 020.512360 ± 020.512533 ± 02
143Nd/144Nd 200 Ma0.5121920.5121740.5120830.5121530.5121520.512330
ε(Nd)200 Ma–3.7–4.0–5.8–4.4–4.5–1.0
Rb, Sr, Sm and Nd concentrations determined by ICP–MS. 1 Grn: granophyre; Gb: gabbro.
Table 5. Ion microprobe (SHRIMP) U–Pb data of zircon from the analysed Messejana–Plasencia dyke samples.
Spot NumberCommon 206Pb (%)U (ppm)Th (ppm)Th/URadiogenic RatiosAge (Ma)Disc. (%) 1
207Pb/235U ± σ (%)206Pb/238U ± σ (%)ρ207Pb/206Pb ± σ (%)207Pb/206Pb ± σ (Ma)206Pb/238U ± σ (Ma)207Pb/235U ± σ (Ma)
103324 (Gabbro)
A-1.11.44001140.30.6135 ± 3.20.0805 ± 1.80.400.0553 ± 2.7424.5 ± 58.2498.9 ± 8.5485.8 ± 12.5–2.6
A-1.20.17602560.30.6341 ± 2.00.0816 ± 1.70.620.0564 ± 1.0466.5 ± 21.6505.6 ± 8.4498.6 ± 8.0–1.4
A-2.11.2751071.50.2610 ± 9.80.0433 ± 1.70.130.0437 ± 9.60.0 ± 0.0273.3 ± 4.6235.5 ± 20.8–16.0
A-3.10.4901001.10.3039 ± 8.60.0446 ± 2.00.170.0494 ± 8.3166.1 ± 183.8281.5 ± 5.4269.4 ± 20.4–4.4
A-4.10.15573230.60.5067 ± 2.20.0685 ± 1.90.610.0536 ± 1.1354.7 ± 25.2427.4 ± 7.8416.2 ± 7.6–2.6
B-1.10.3155821281.40.2209 ± 3.60.0331 ± 2.90.580.0484 ± 2.0119.9 ± 47.6209.8 ± 5.9202.7 ± 6.6–3.6
B-2.11.11292011.60.2507 ± 9.70.0413 ± 3.60.270.0441 ± 8.90.0 ± 99.9260.6 ± 9.3227.1 ± 19.8–14.8
B-3.10.210637940.80.5957 ± 2.40.0702 ± 2.00.620.0616 ± 1.2658.9 ± 24.6437.2 ± 8.6474.5 ± 9.17.8
B-4.10.12275460.00.3978 ± 4.40.0572 ± 2.80.470.0504 ± 3.3214.9 ± 75.0358.6 ± 9.9340.0 ± 12.7–5.4
B-5.10.31261140.90.3373 ± 4.20.0437 ± 2.20.370.0560 ± 3.6451.5 ± 77.4275.7 ± 5.9295.1 ± 10.86.6
B-6.10.7120760.70.2871 ± 4.70.0447 ± 2.00.300.0466 ± 4.30.0 ± 126.7282.1 ± 5.5256.3 ± 10.8–10.0
B-7.10.02301310.60.3276 ± 2.80.0458 ± 1.50.400.0519 ± 2.3281.5 ± 51.0288.5 ± 4.4287.7 ± 6.9–0.2
B-8.10.13151150.40.3147 ± 4.10.0436 ± 2.00.350.0524 ± 3.5302.3 ± 78.4274.9 ± 5.4277.8 ± 9.91.0
B-9.10.1139600.40.3514 ± 5.30.0478 ± 3.10.420.0533 ± 4.3340.3 ± 94.8301.2 ± 9.1305.8 ± 14.21.6
B-10.10.1218710.30.3511 ± 4.70.0436 ± 4.00.610.0584 ± 2.5543.7 ± 54.0275.3 ± 10.8305.6 ± 12.610.0
B-11.10.3326620.20.3053 ± 3.70.0444 ± 1.70.340.0498 ± 3.3187.3 ± 74.2280.2 ± 4.7270.5 ± 8.9–3.6
B-12.10.2299720.20.2959 ± 4.00.0438 ± 1.90.350.0490 ± 3.5146.9 ± 80.0276.4 ± 5.2263.2 ± 9.4–5.0
B-13.10.765370.60.3300 ± 4.50.0462 ± 2.90.470.0518 ± 3.4276.9 ± 75.8291.1 ± 8.2289.6 ± 11.4–0.6
B-14.10.04491510.30.3168 ± 2.30.0455 ± 2.20.670.0505 ± 0.8220.1 ± 17.8286.6 ± 6.1279.4 ± 5.7–2.6
B-15.10.311400.00.3227 ± 3.50.0432 ± 2.70.550.0542 ± 2.3378.9 ± 50.0272.6 ± 7.2284.0 ± 8.84.0
B-16.10.4104440.40.3143 ± 4.30.0451 ± 2.60.430.0506 ± 3.4221.9 ± 77.4284.1 ± 7.2277.5 ± 10.5–2.4
B-17.10.033380.00.3119 ± 2.70.0435 ± 2.00.540.0520 ± 1.8283.9 ± 40.0274.7 ± 5.5275.7 ± 6.60.4
B-18.10.7821171.50.3262 ± 4.80.0459 ± 2.70.410.0516 ± 3.9265.9 ± 87.4289.2 ± 7.6286.7 ± 12.0–0.8
B-19.10.0260400.20.3939 ± 8.60.0579 ± 6.90.580.0493 ± 5.1162.5 ± 115.4363.0 ± 24.2337.2 ± 24.9–7.6
B-20.10.1142760.50.3211 ± 3.40.0466 ± 1.10.220.0500 ± 3.2195.1 ± 73.4293.5 ± 3.1282.8 ± 8.5–3.8
B-21.10.610710.00.3188 ± 3.80.0441 ± 2.30.430.0524 ± 3.0302.9 ± 66.6278.3 ± 6.2281.0 ± 9.31.0
113106 (granophyre)
1.10.22611410.60.7556 ± 2.40.0937 ± 1.30.380.0585 ± 2.0547 ± 43578 ± 7572 ± 11–1.0
2.10.21109370.00.4345 ± 2.30.0584 ± 2.00.640.0539 ± 0.9368 ± 21366 ± 7366 ± 70.0
3.110.28172390.30.3660 ± 4.80.0501 ± 1.60.240.0530 ± 4.5327 ± 100315 ± 5317 ± 130.4
4.10.111633400.30.3483 ± 2.00.0491 ± 1.80.630.0514 ± 0.9259 ± 20309 ± 5303 ± 5–2.0
5.10.71146300.00.6012 ± 3.70.0781 ± 3.50.690.0559 ± 1.0447 ± 21485 ± 17478 ± 14–1.4
6.11.411951570.10.3785 ± 3.80.0463 ± 1.30.240.0593 ± 3.6579 ± 76292 ± 4326 ± 1110.6
6.20.29262310.30.6811 ± 2.10.0842 ± 1.90.650.0587 ± 0.8555 ± 18521 ± 9527 ± 91.2
7.10.08701390.20.5906 ± 1.60.0751 ± 1.30.580.0570 ± 0.9492 ± 19467 ± 6471 ± 60.8
8.13.12891150.40.6443 ± 3.60.0741 ± 2.50.500.0631 ± 2.5710 ± 53461 ± 11505 ± 148.8
8.218.92971920.70.9724 ± 20.10.0942 ± 3.60.130.0749 ± 19.81065 ± 354580 ± 20690 ± 10615.8
9.10.11109160.00.3342 ± 3.20.0474 ± 2.30.500.0512 ± 2.3249 ± 52298 ± 7293 ± 8–1.8
9.21.187150.20.7106 ± 6.10.0971 ± 1.30.150.0531 ± 6.0332 ± 130598 ± 8545 ± 26–9.6
10.21.08265750.71.0089 ± 4.20.1127 ± 1.80.310.0649 ± 3.8771 ± 78689 ± 12708 ± 222.8
Uncertainties are given at the one-sigma level. Common Pb corrected using measured 204Pb. ρ: error correlation between 206Pb/238U and 207Pb/235U ratios. 1 Disc. = U−Pb discordance; difference between the 204Pb-corrected 206Pb/238U and 207Pb/235U ages.
Disclaimer/Publisher’s Note: The statements, opinions and data contained in all publications are solely those of the individual author(s) and contributor(s) and not of MDPI and/or the editor(s). MDPI and/or the editor(s) disclaim responsibility for any injury to people or property resulting from any ideas, methods, instructions or products referred to in the content.

