

Distribution of Copper, Iron, and Sulfur in Copper Concentrate Particles during Oxidation under Simulated Flash Smelting Conditions

 ,
,
Abstract
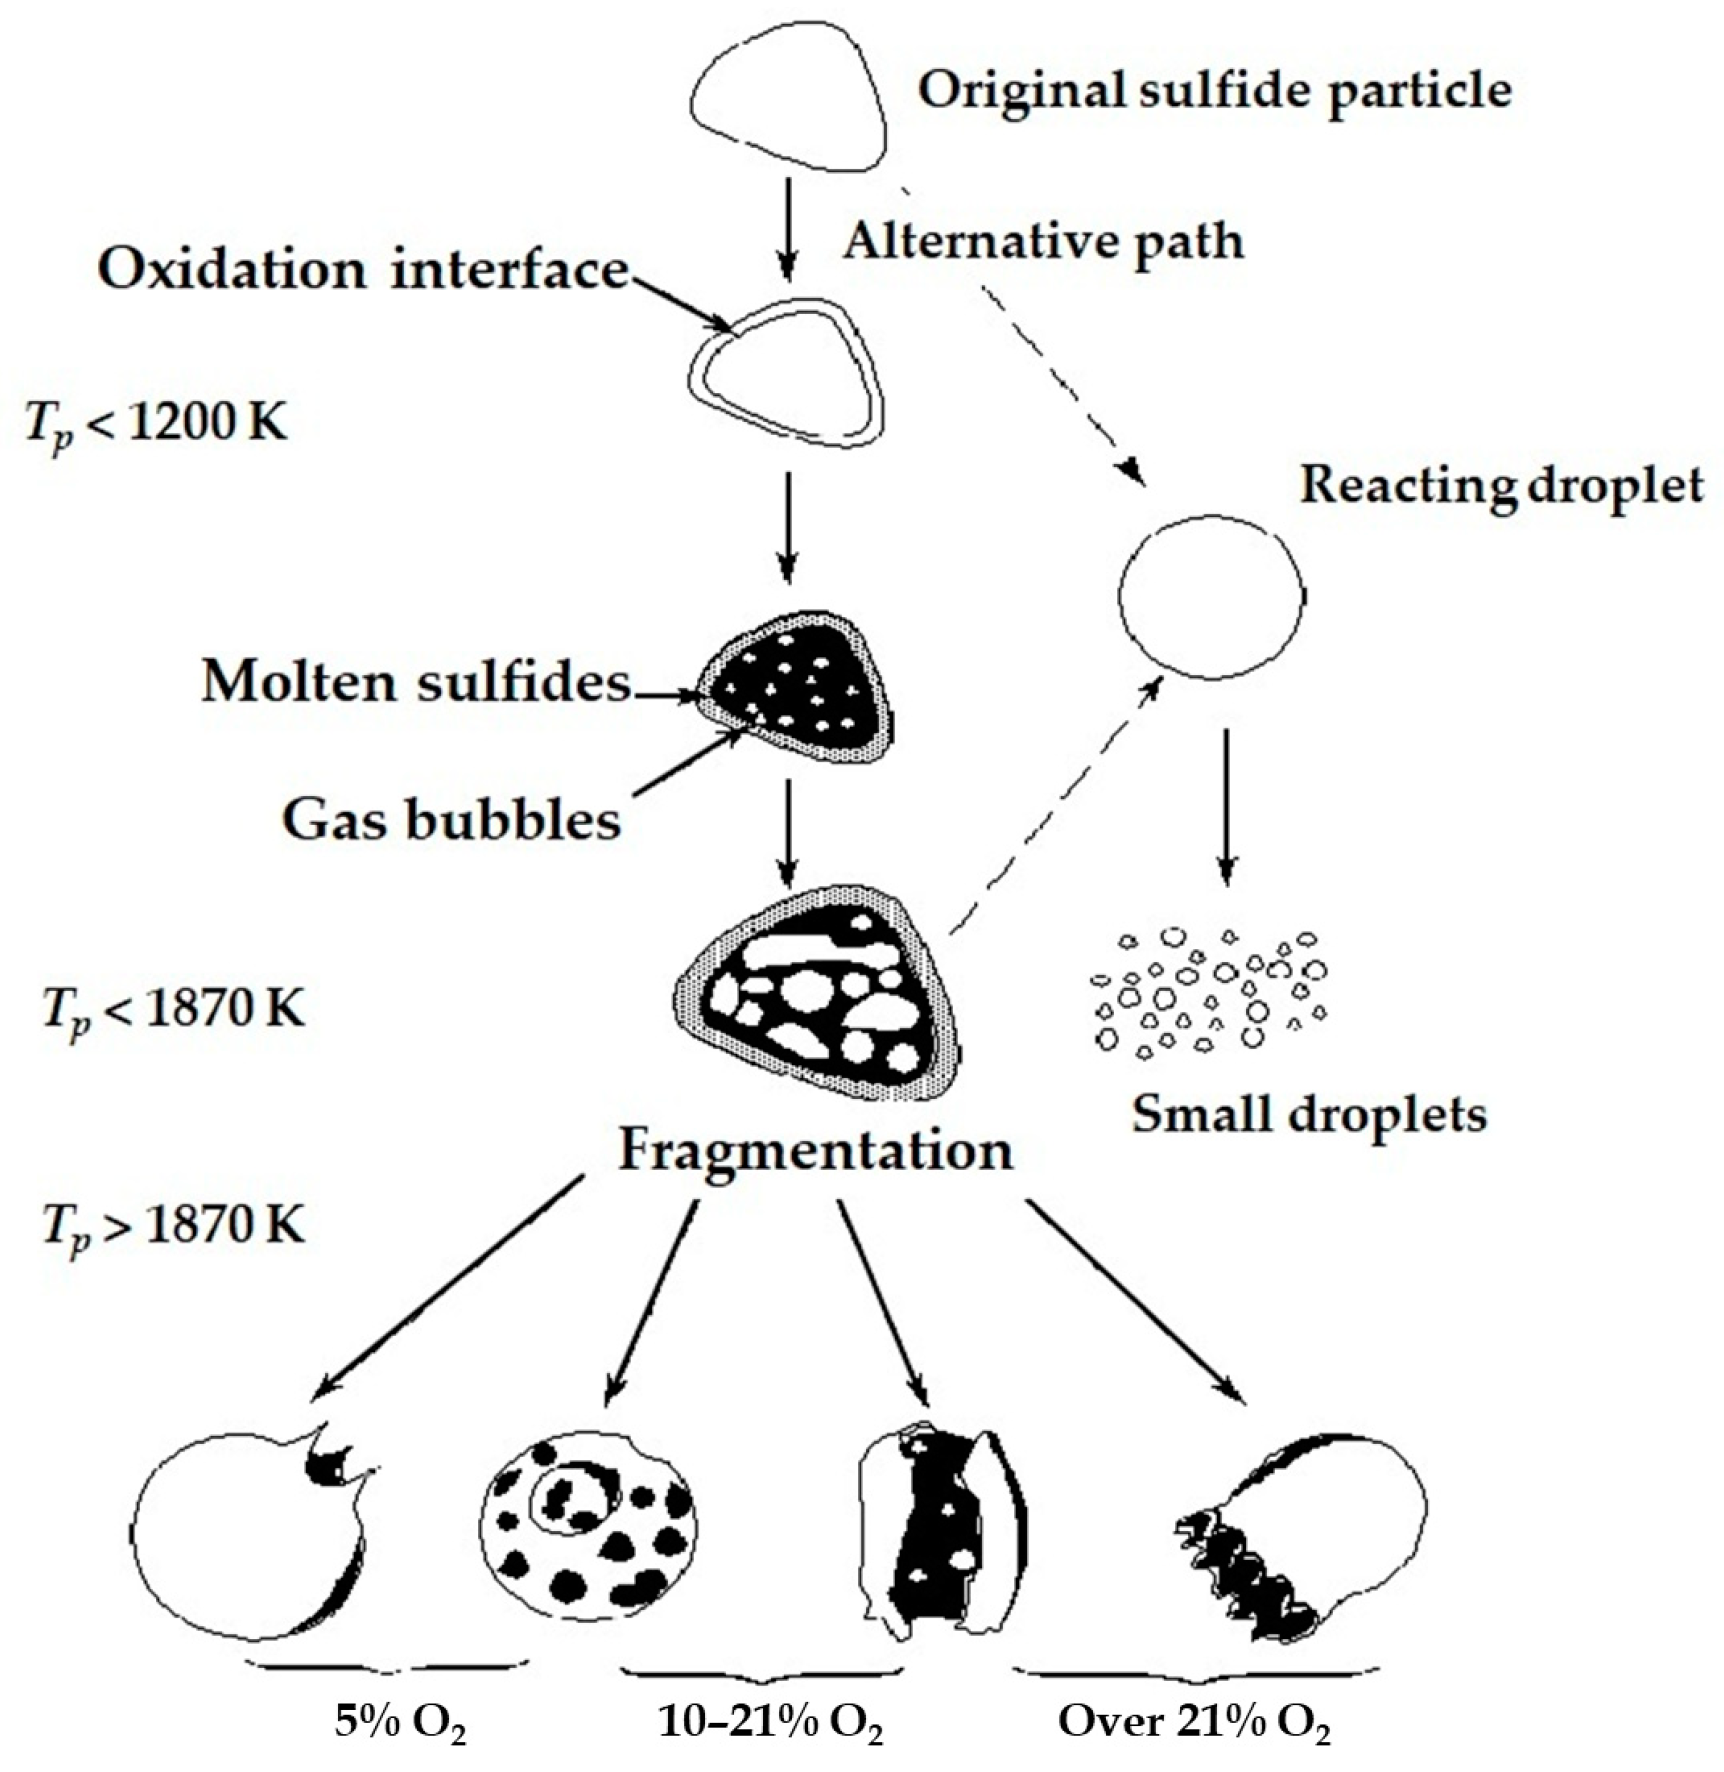
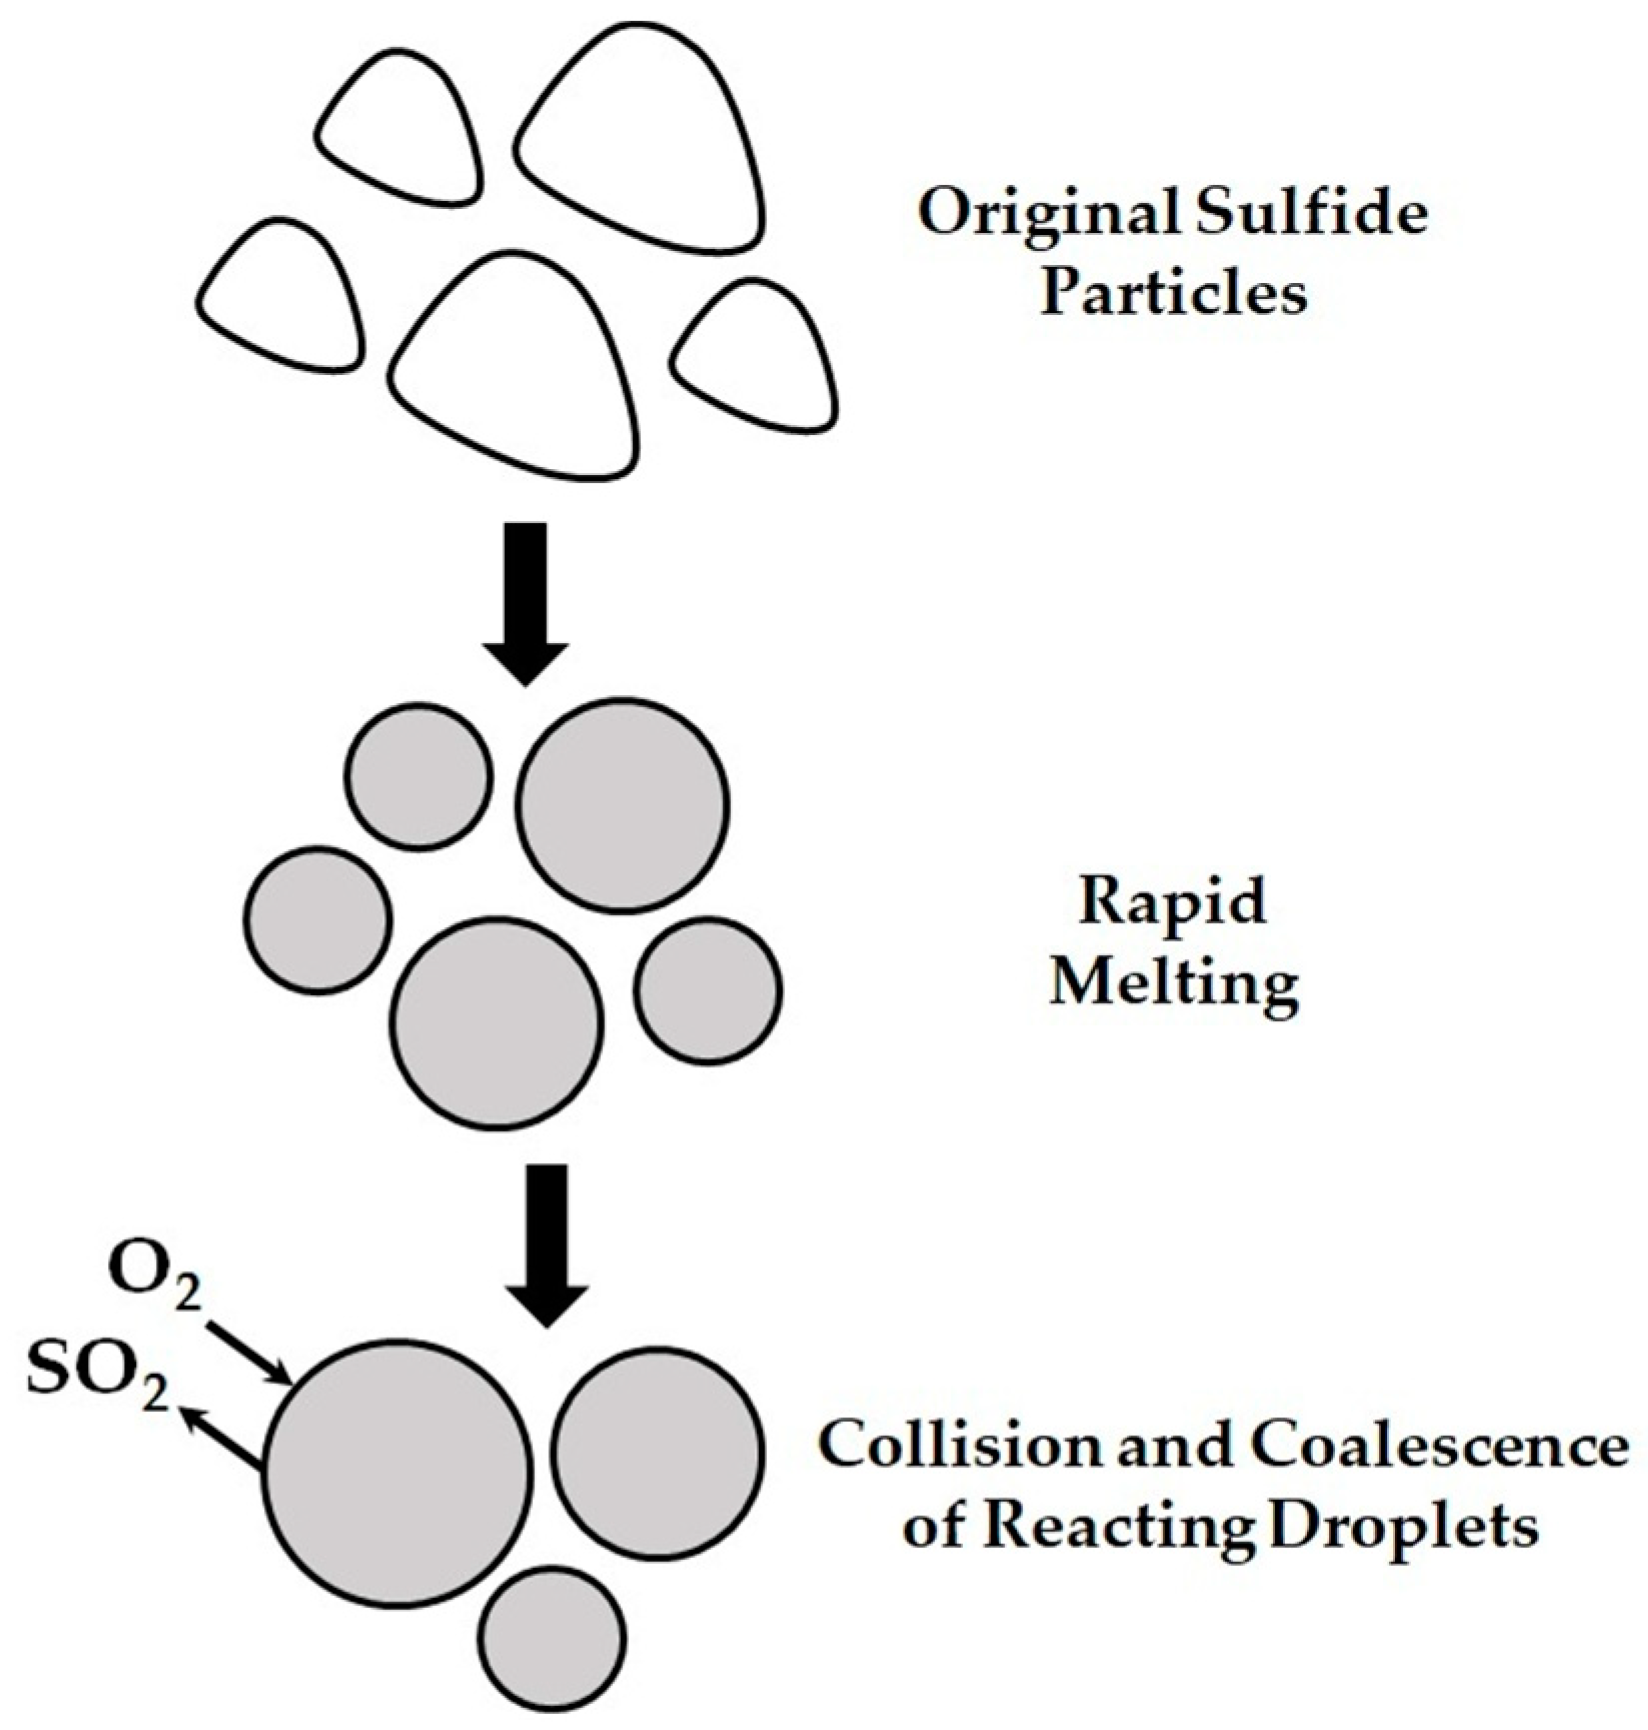
1. Introduction
2. Materials and Methods
2.1. Experimental Work
2.2. QEMSCAN® Data Processing
3. Results and Discussion
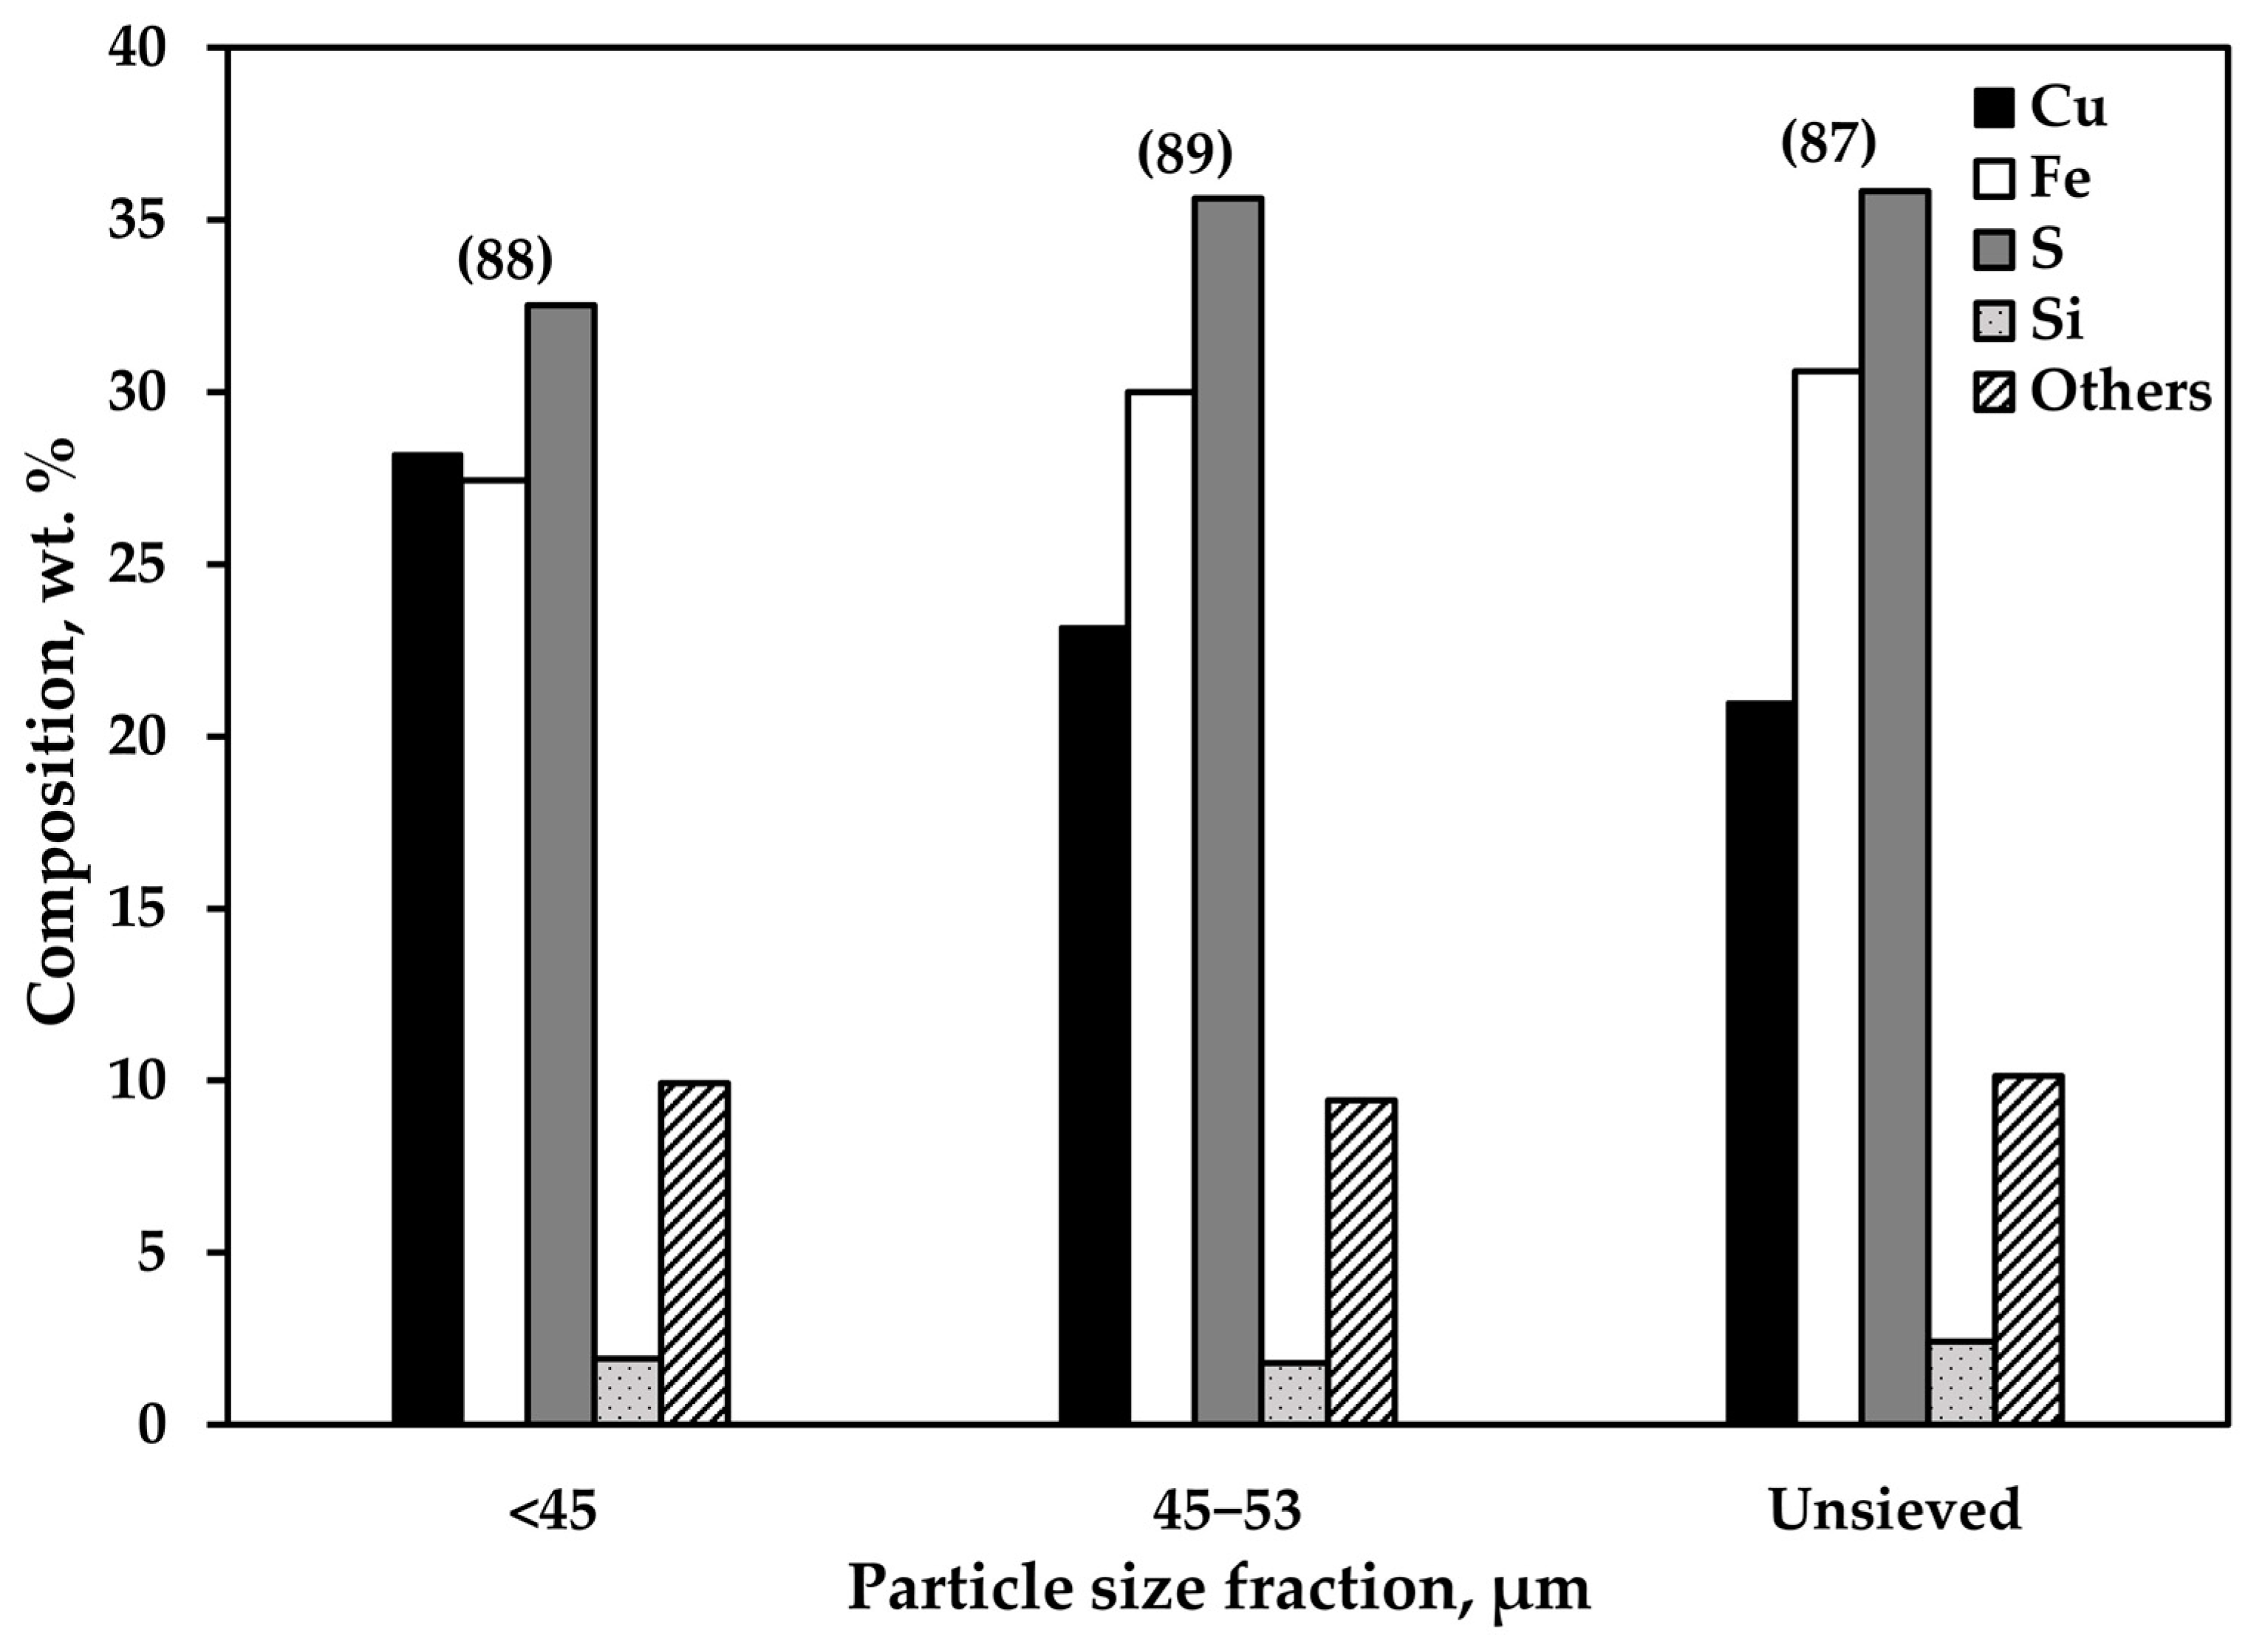
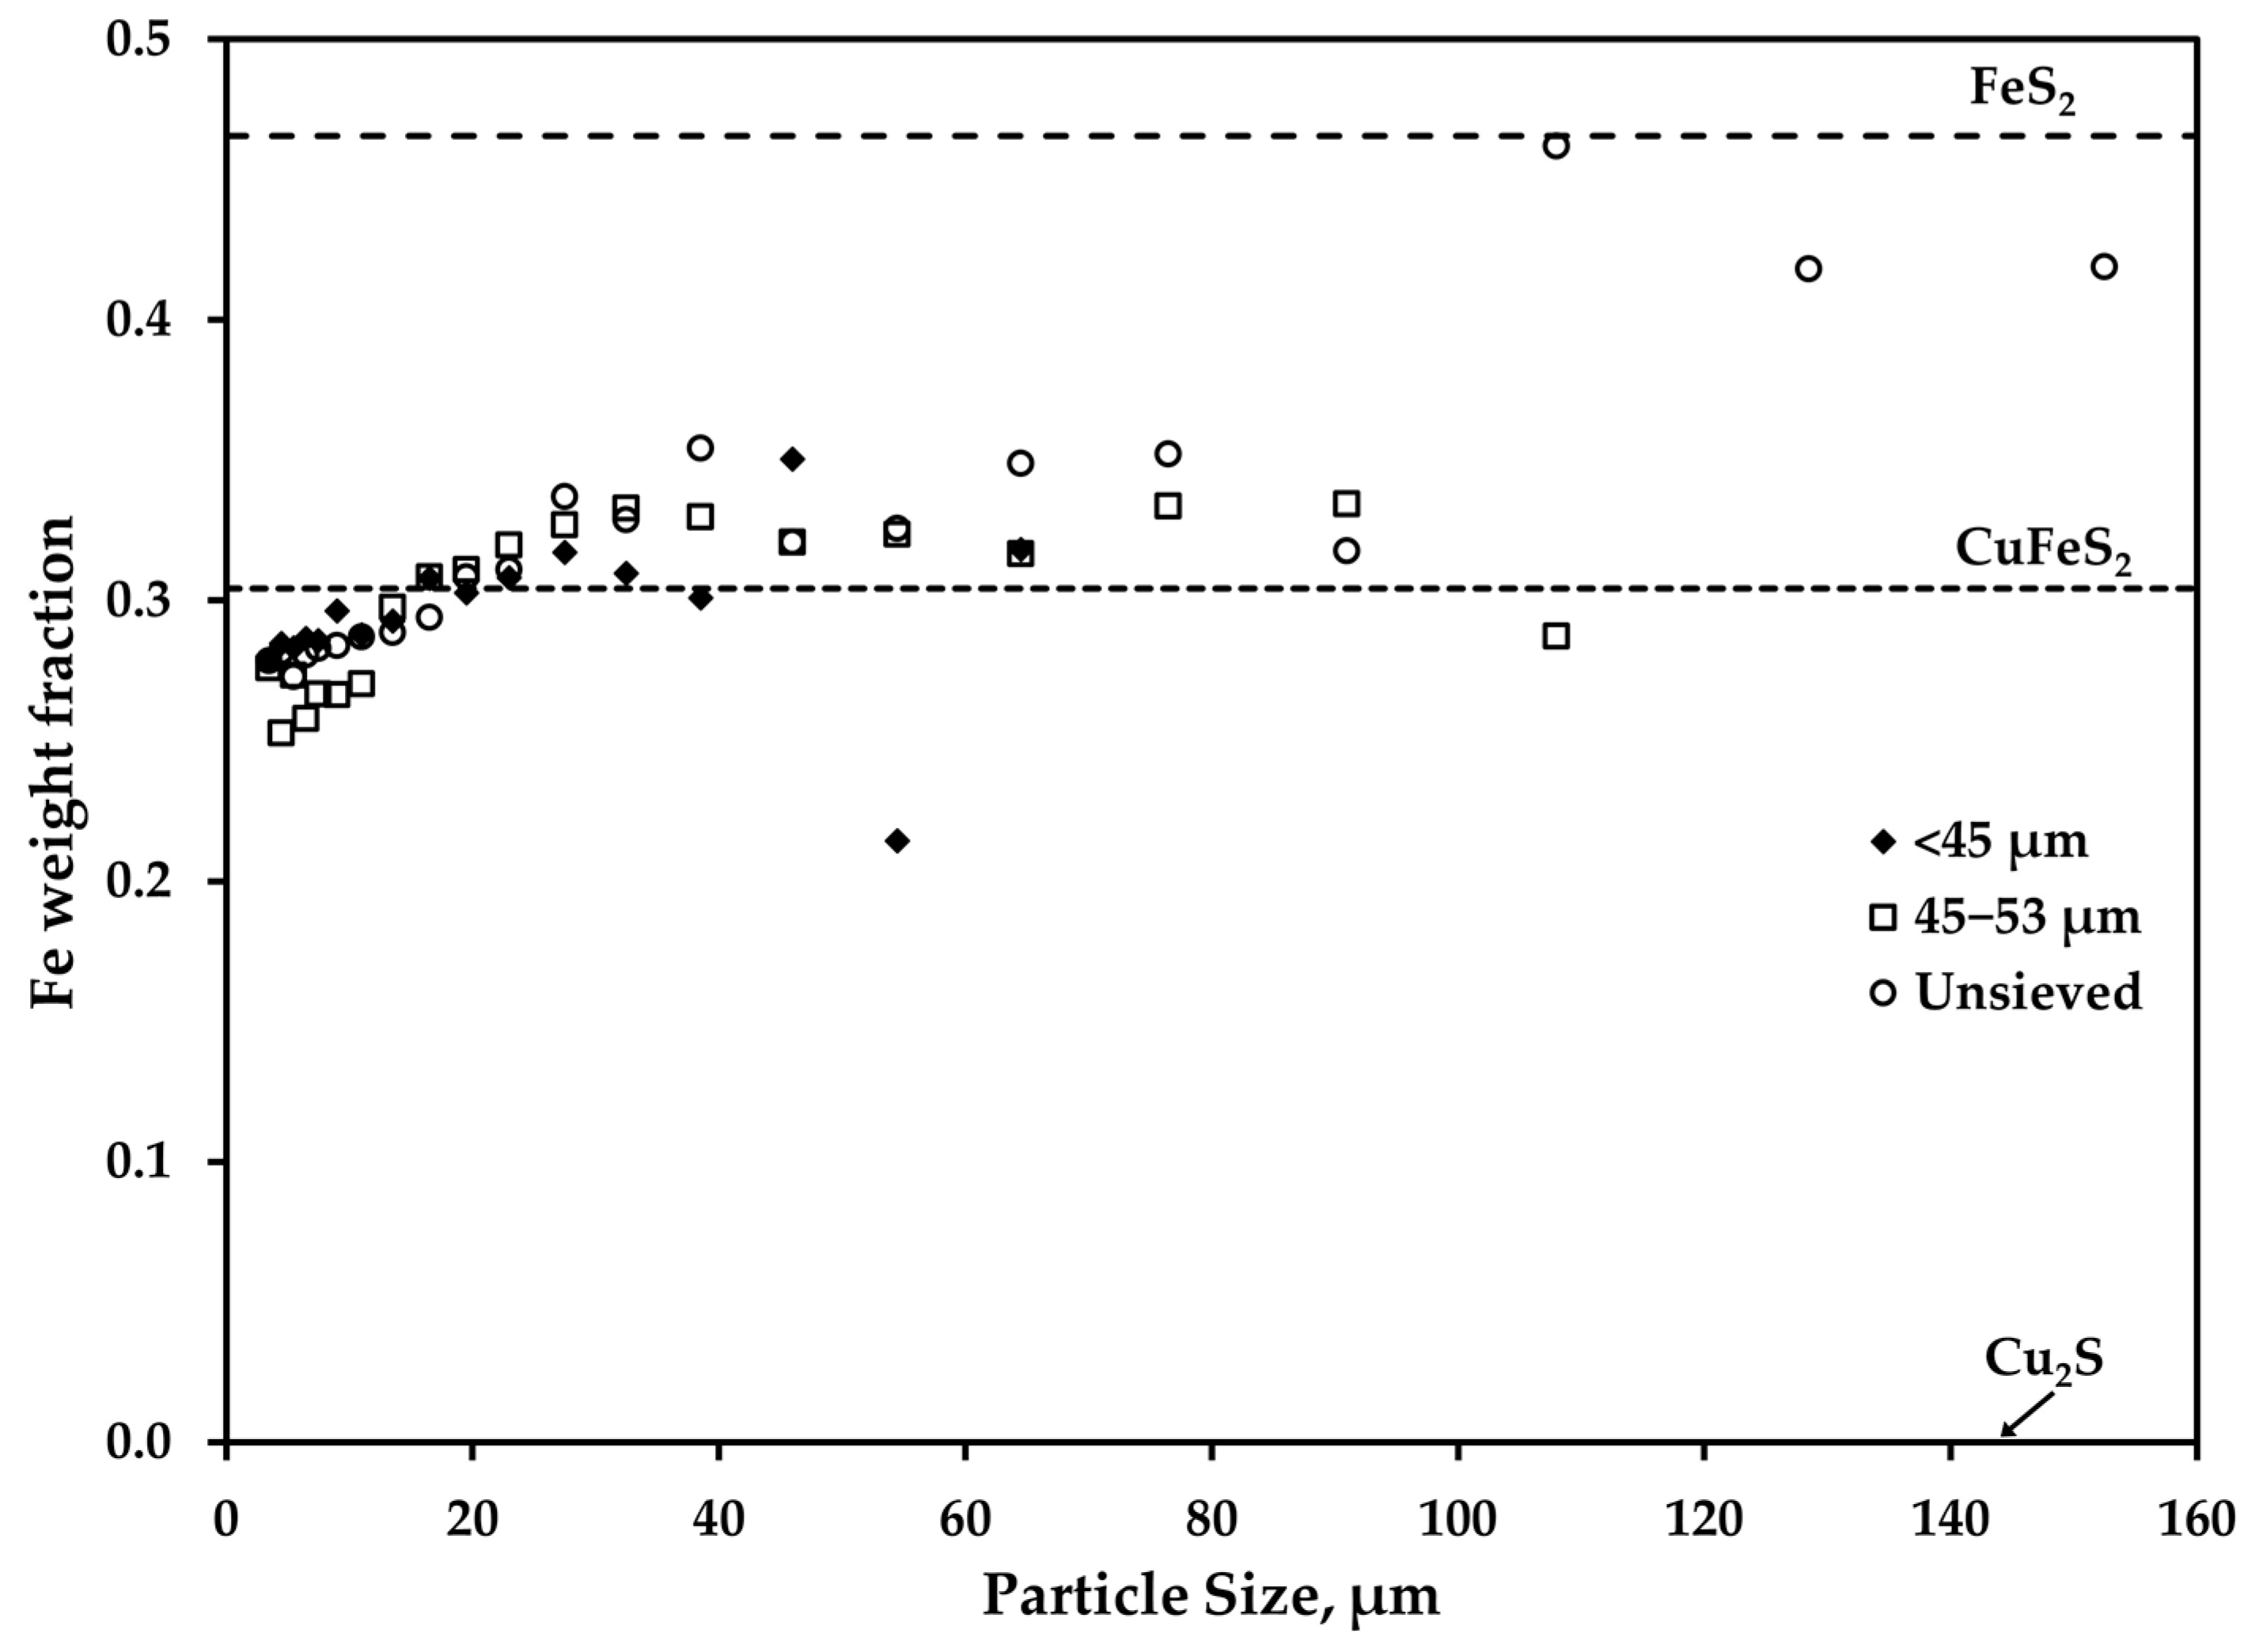
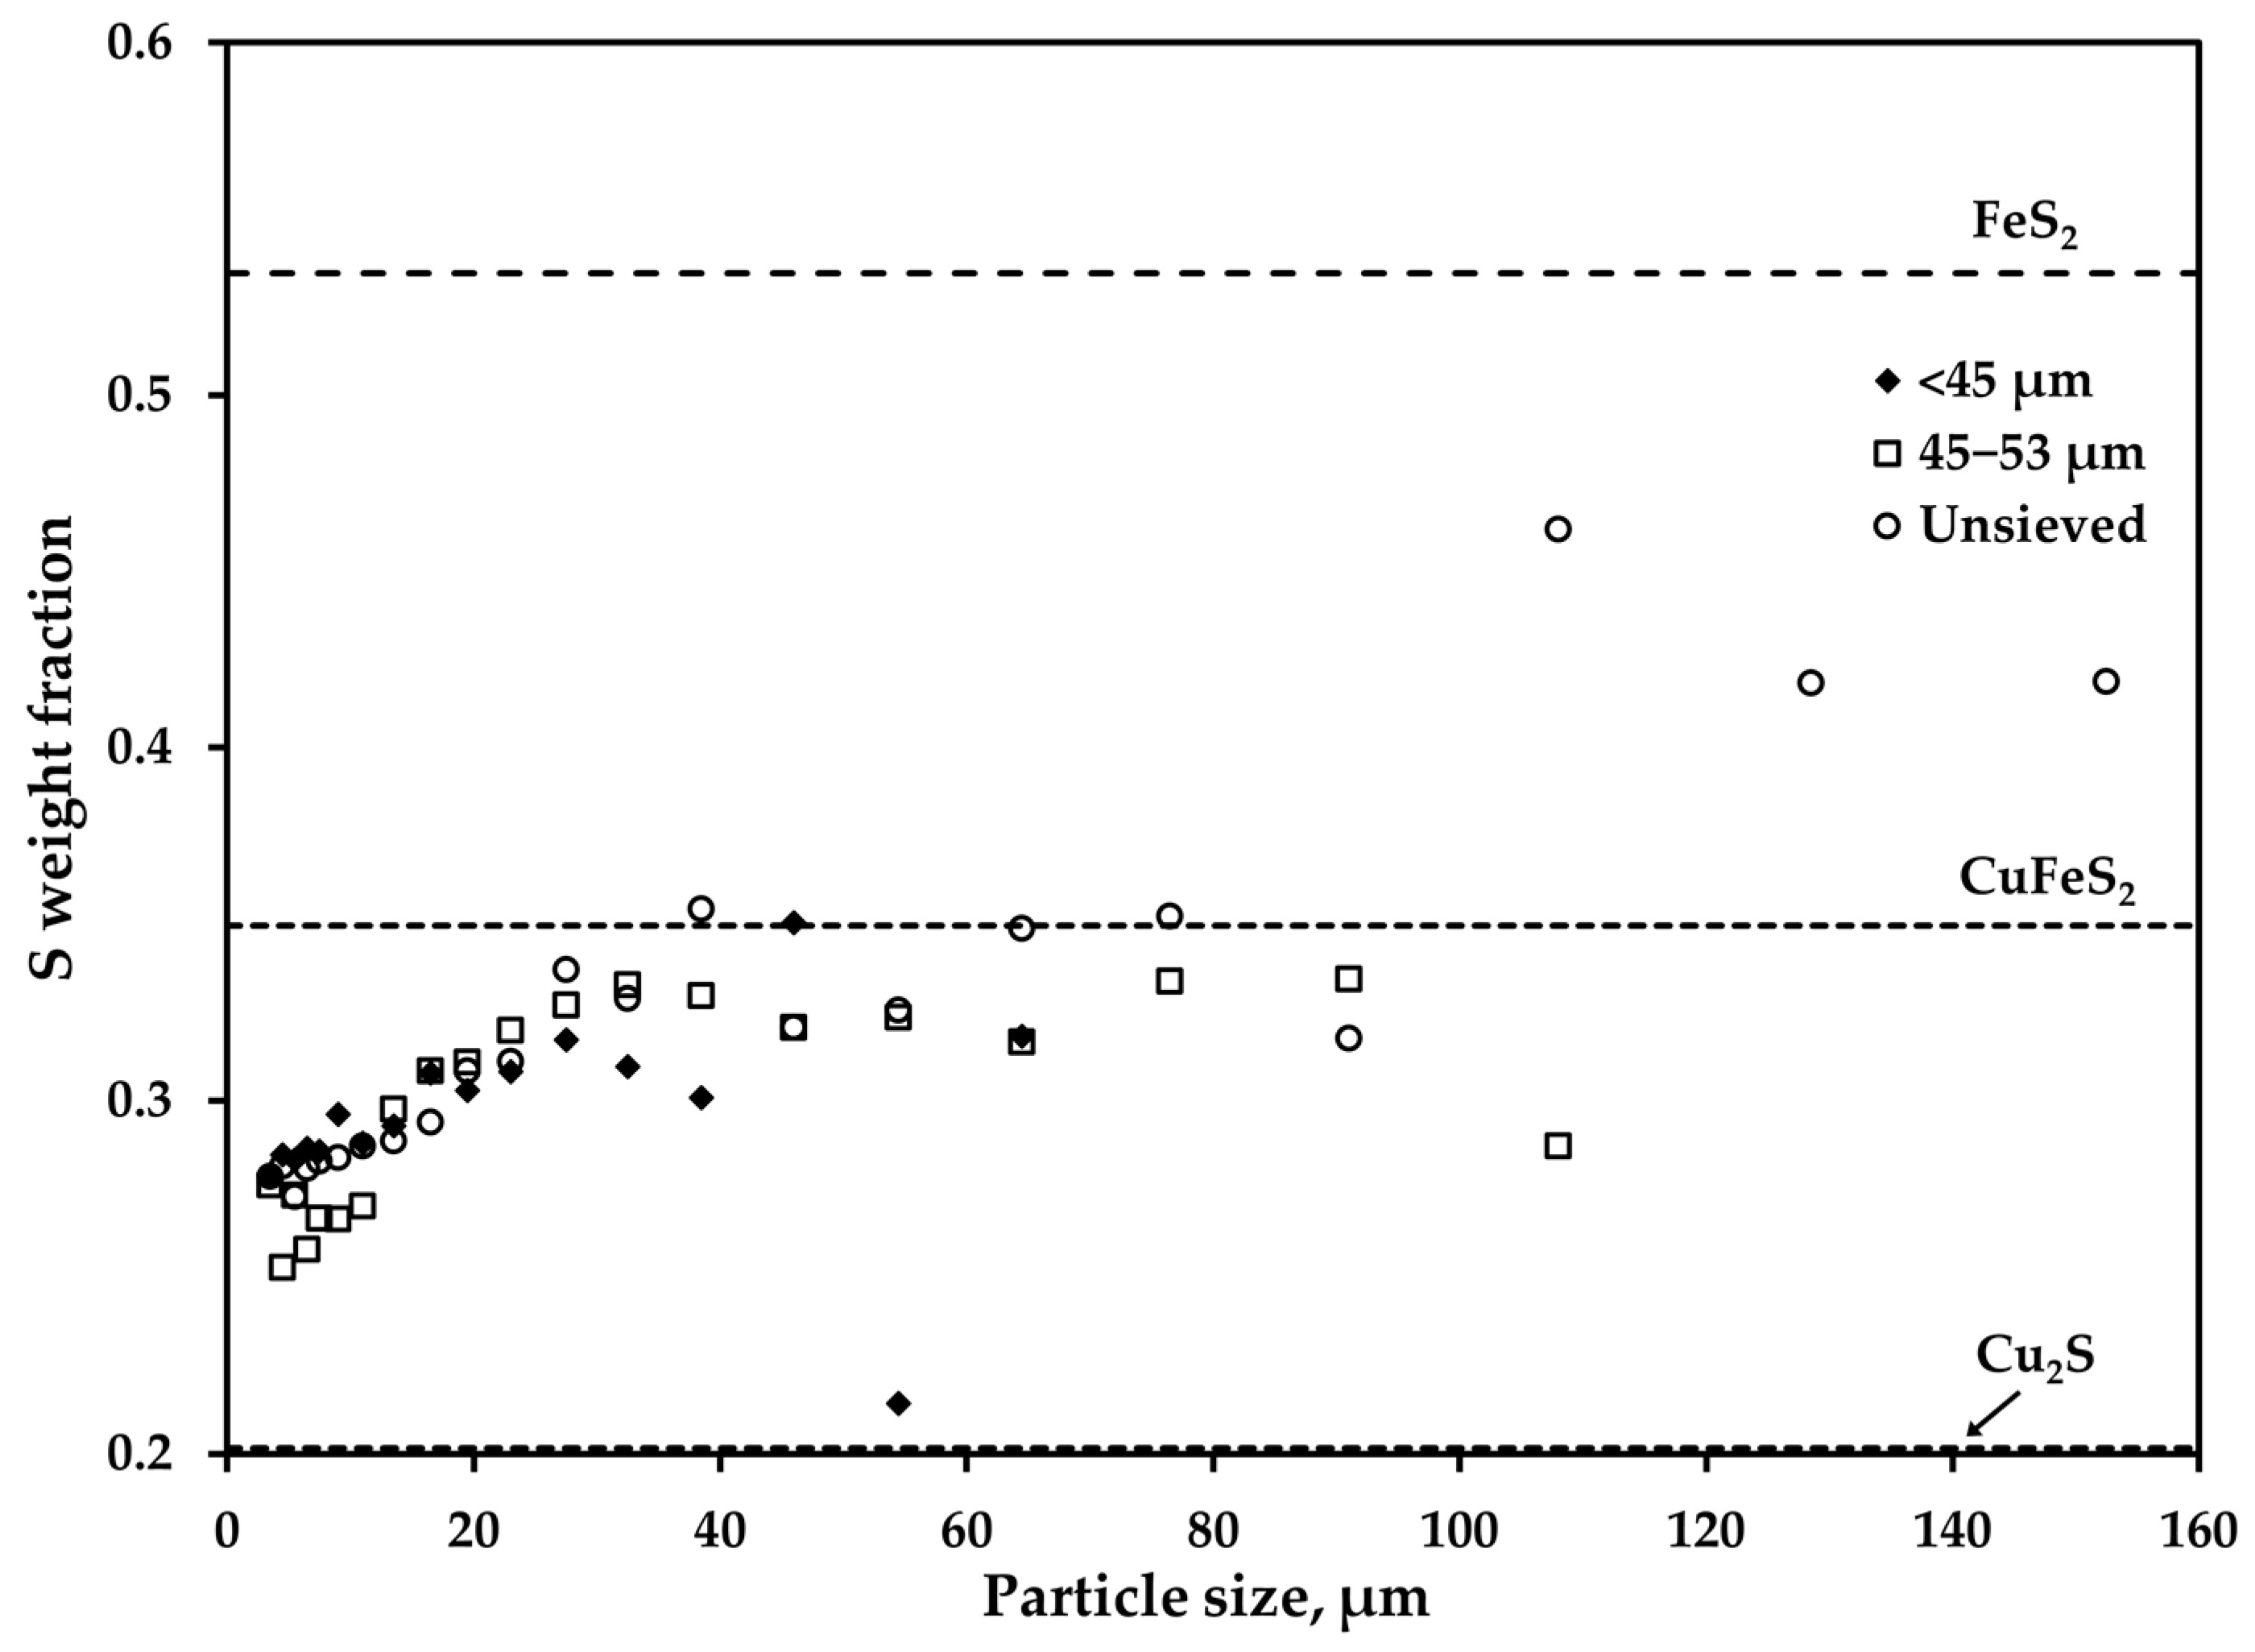
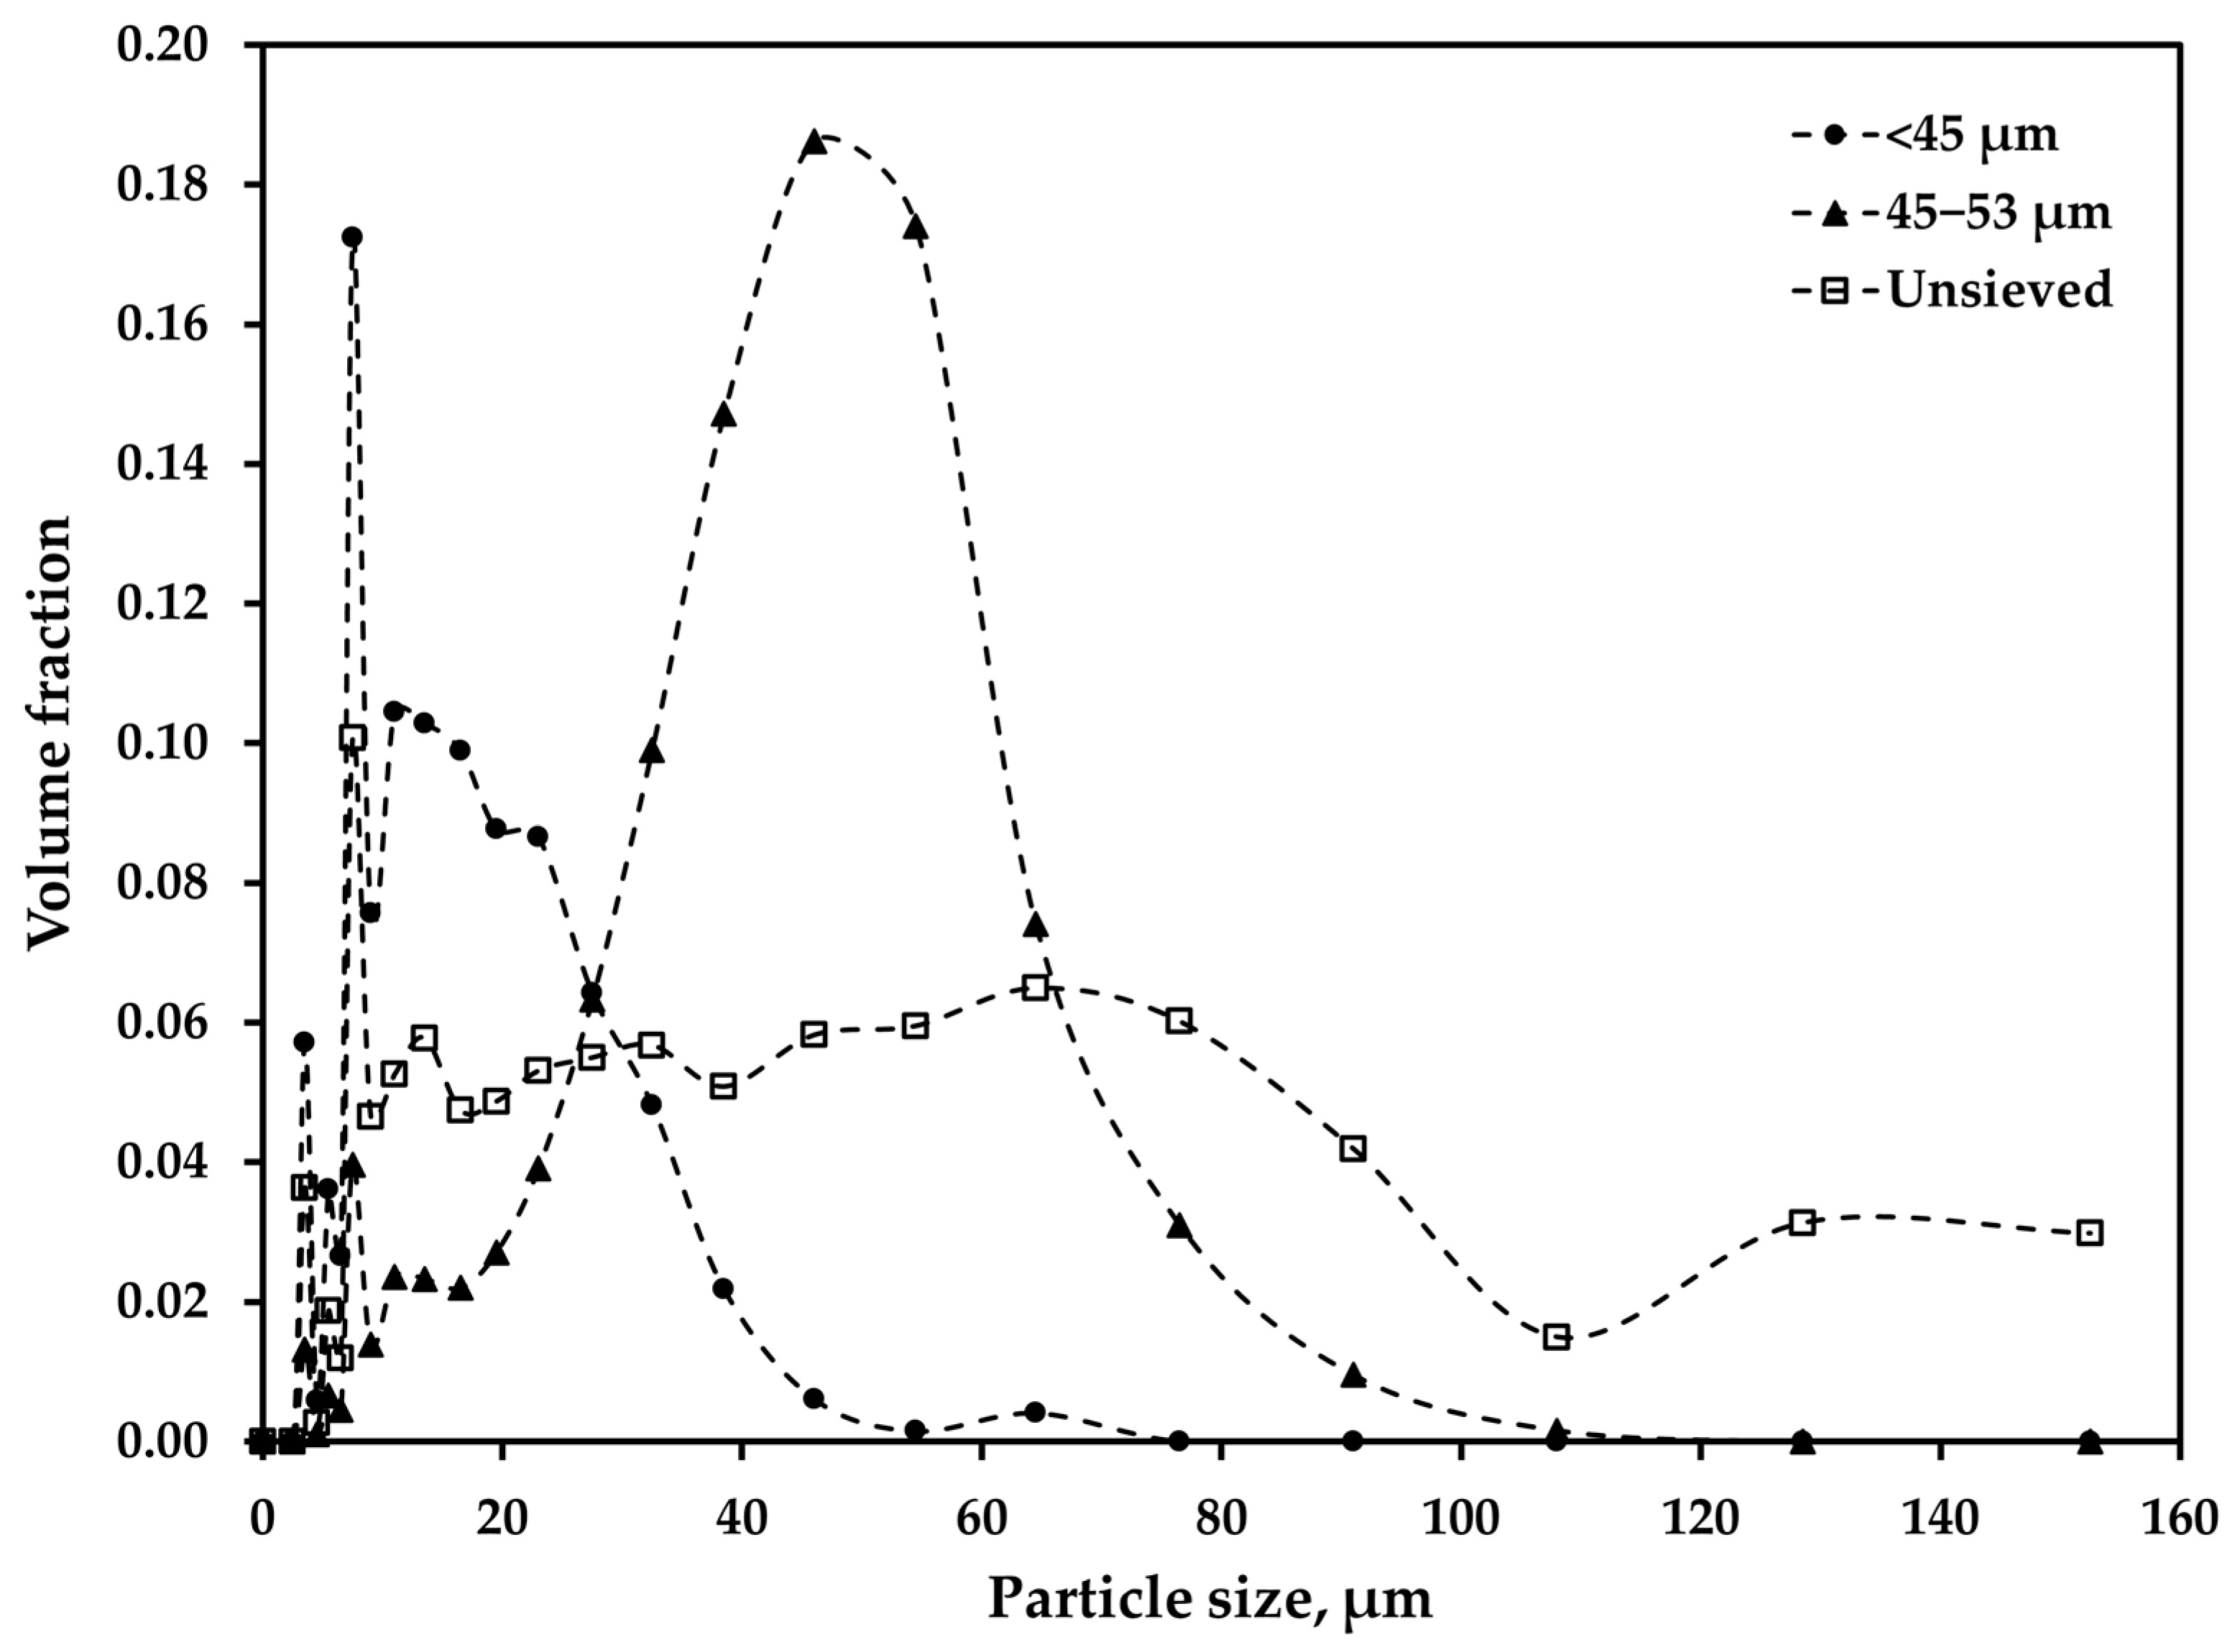
3.1. Overall Chemical Composition and Size Distribution of the Feed Particles
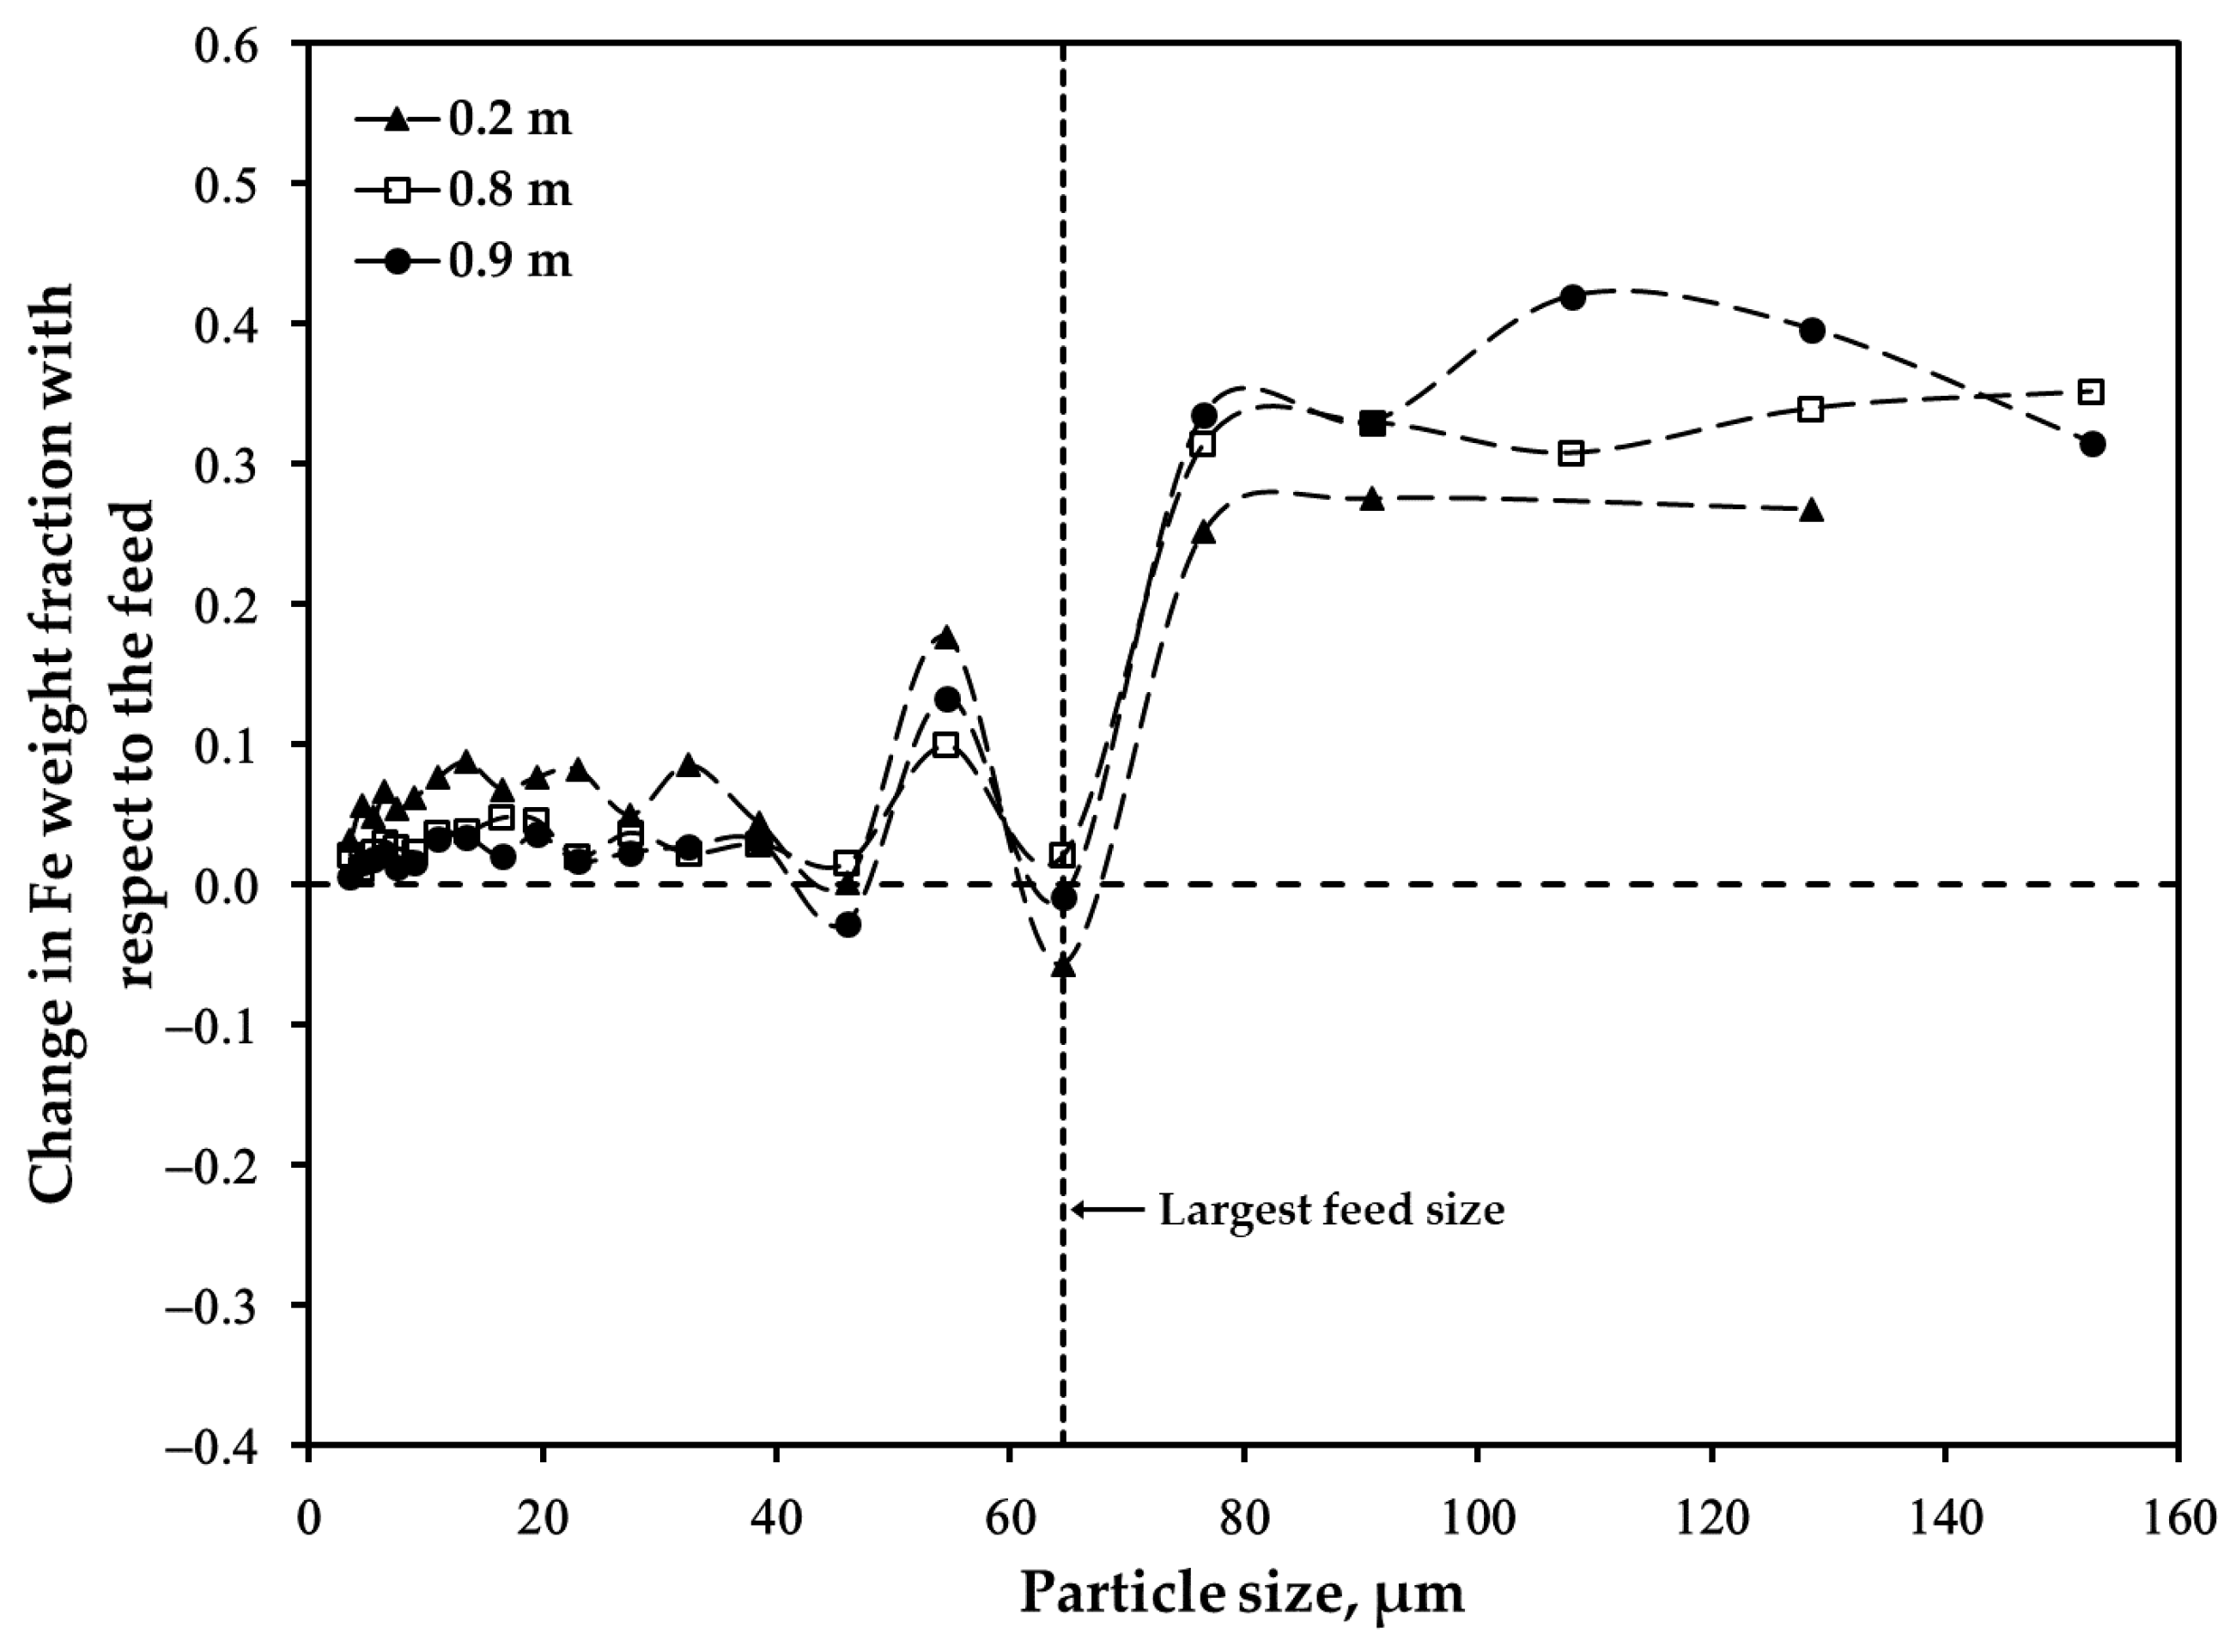
3.2. Distribution of Major Elements: Size Fraction of <45 μm after Oxidation
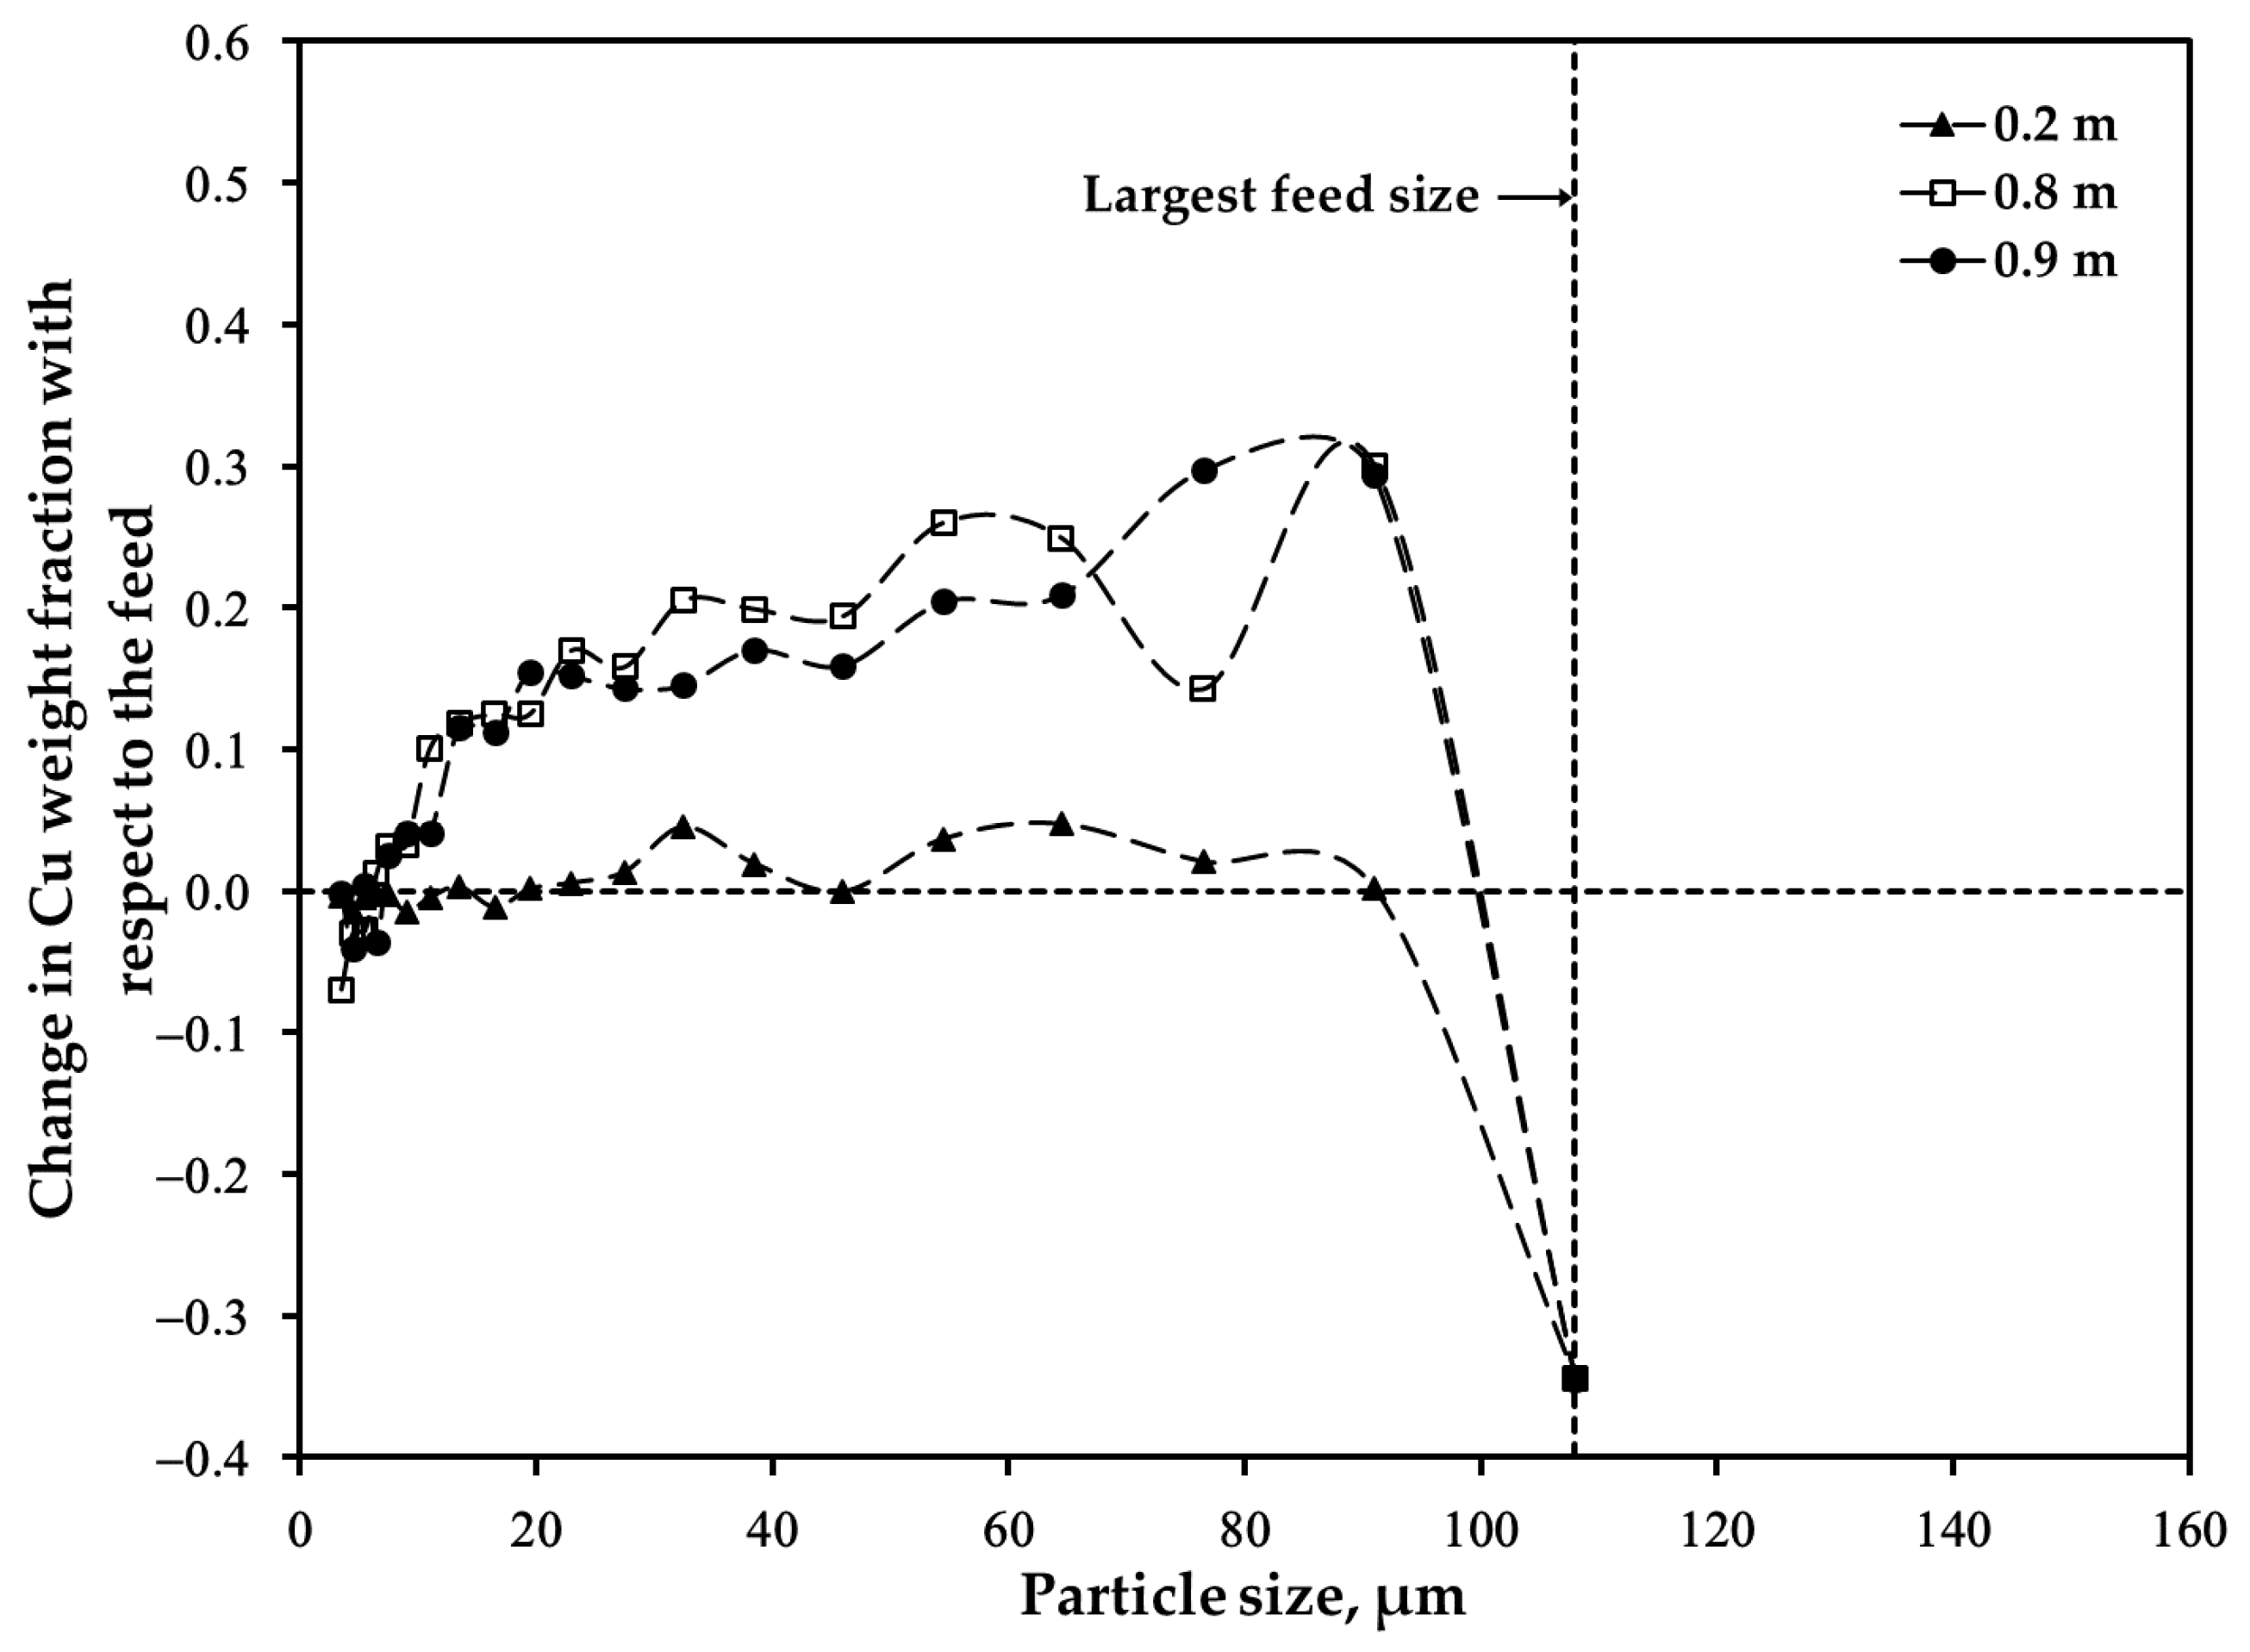
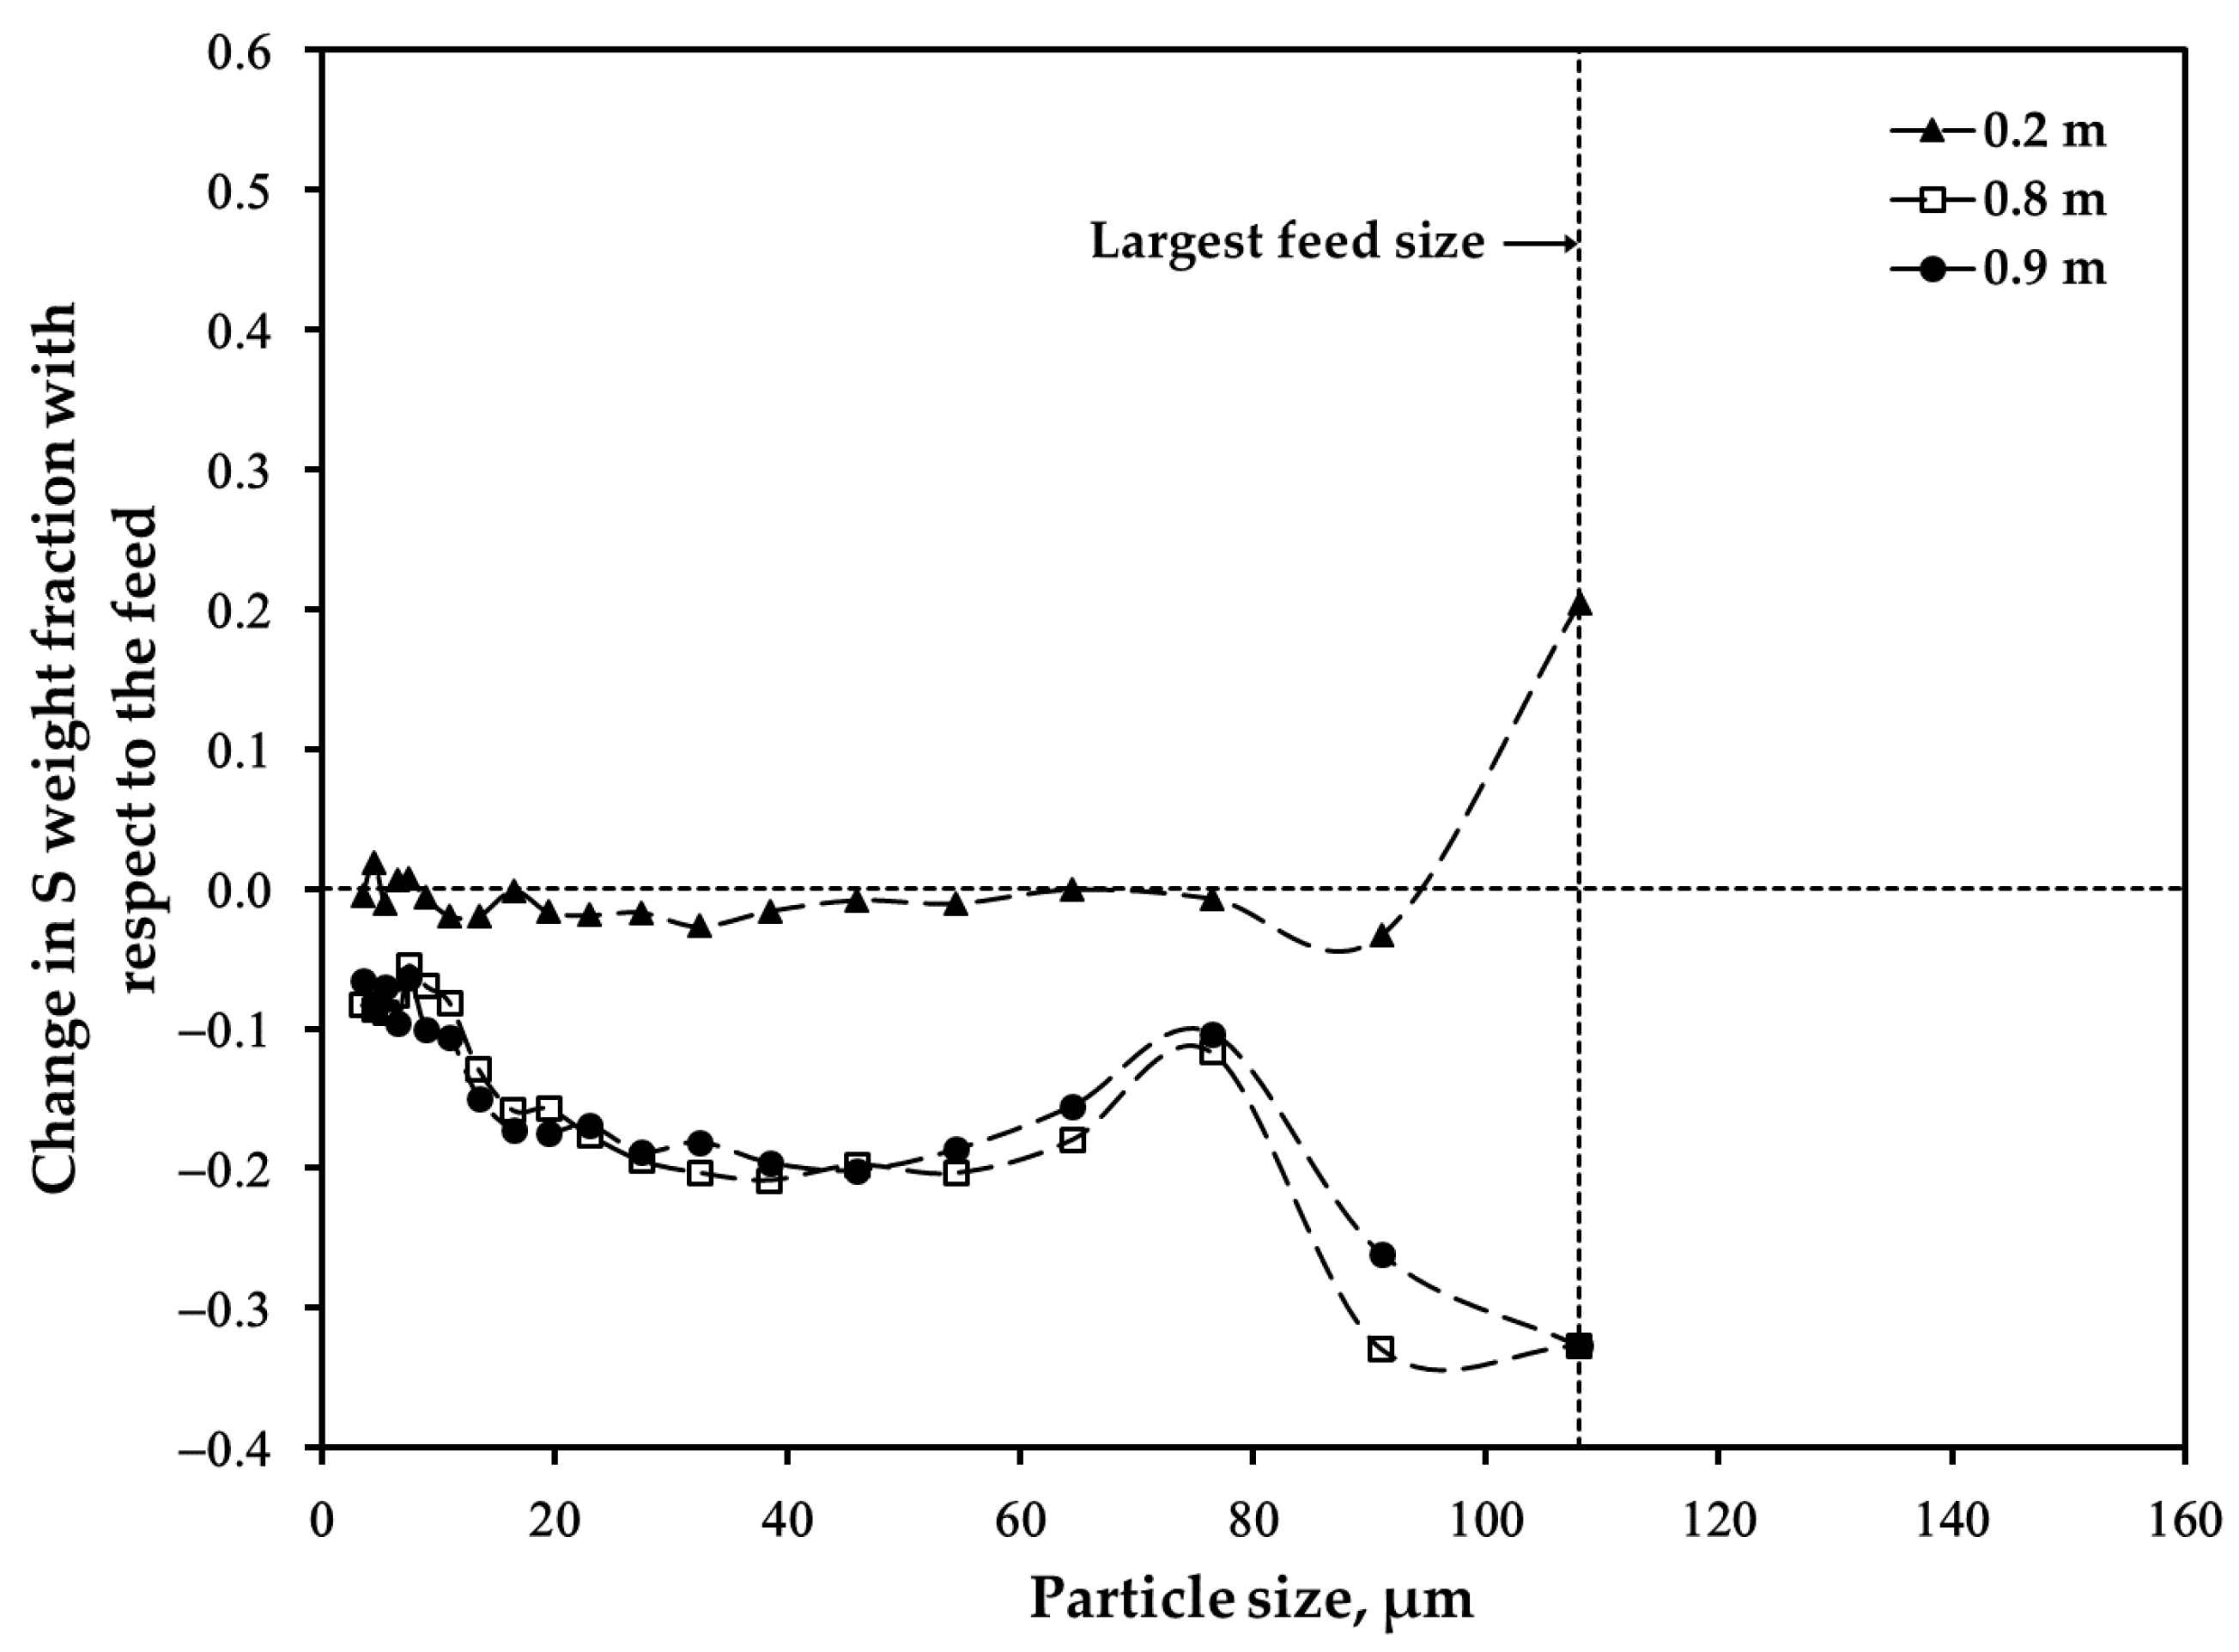
3.3. Distribution of Major Elements: Size Fraction of 45–53 μm after Oxidation
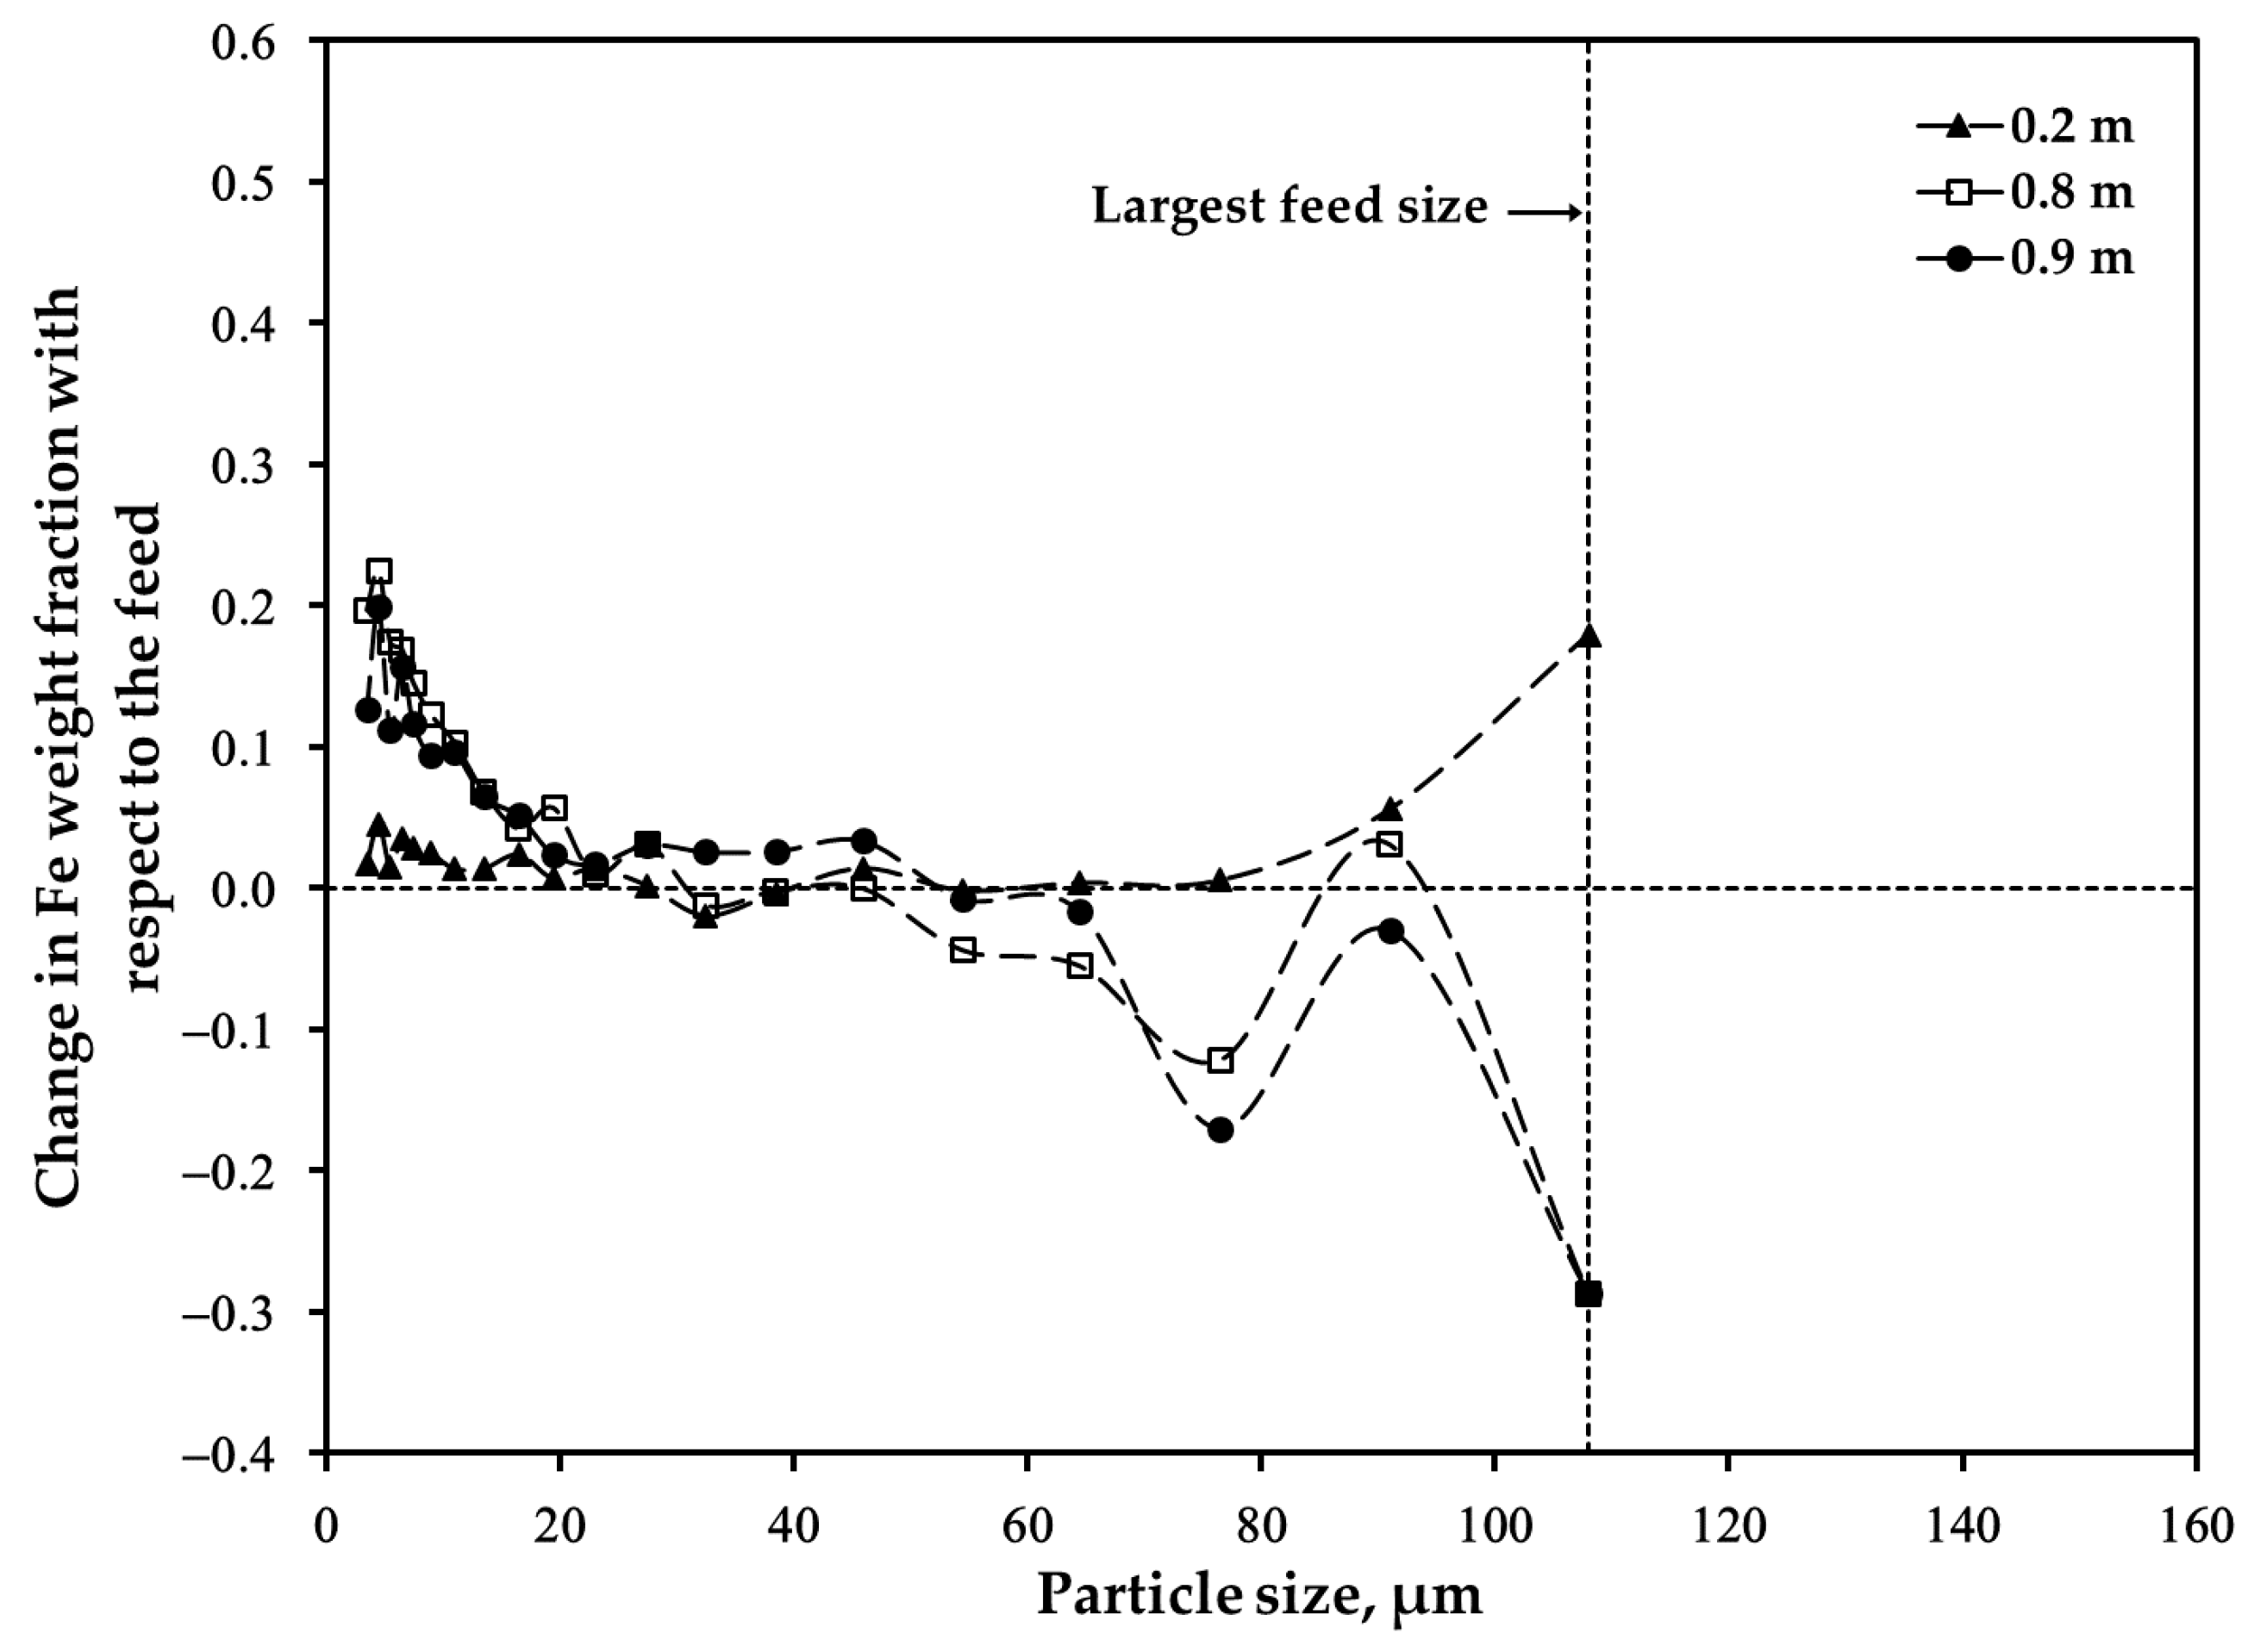
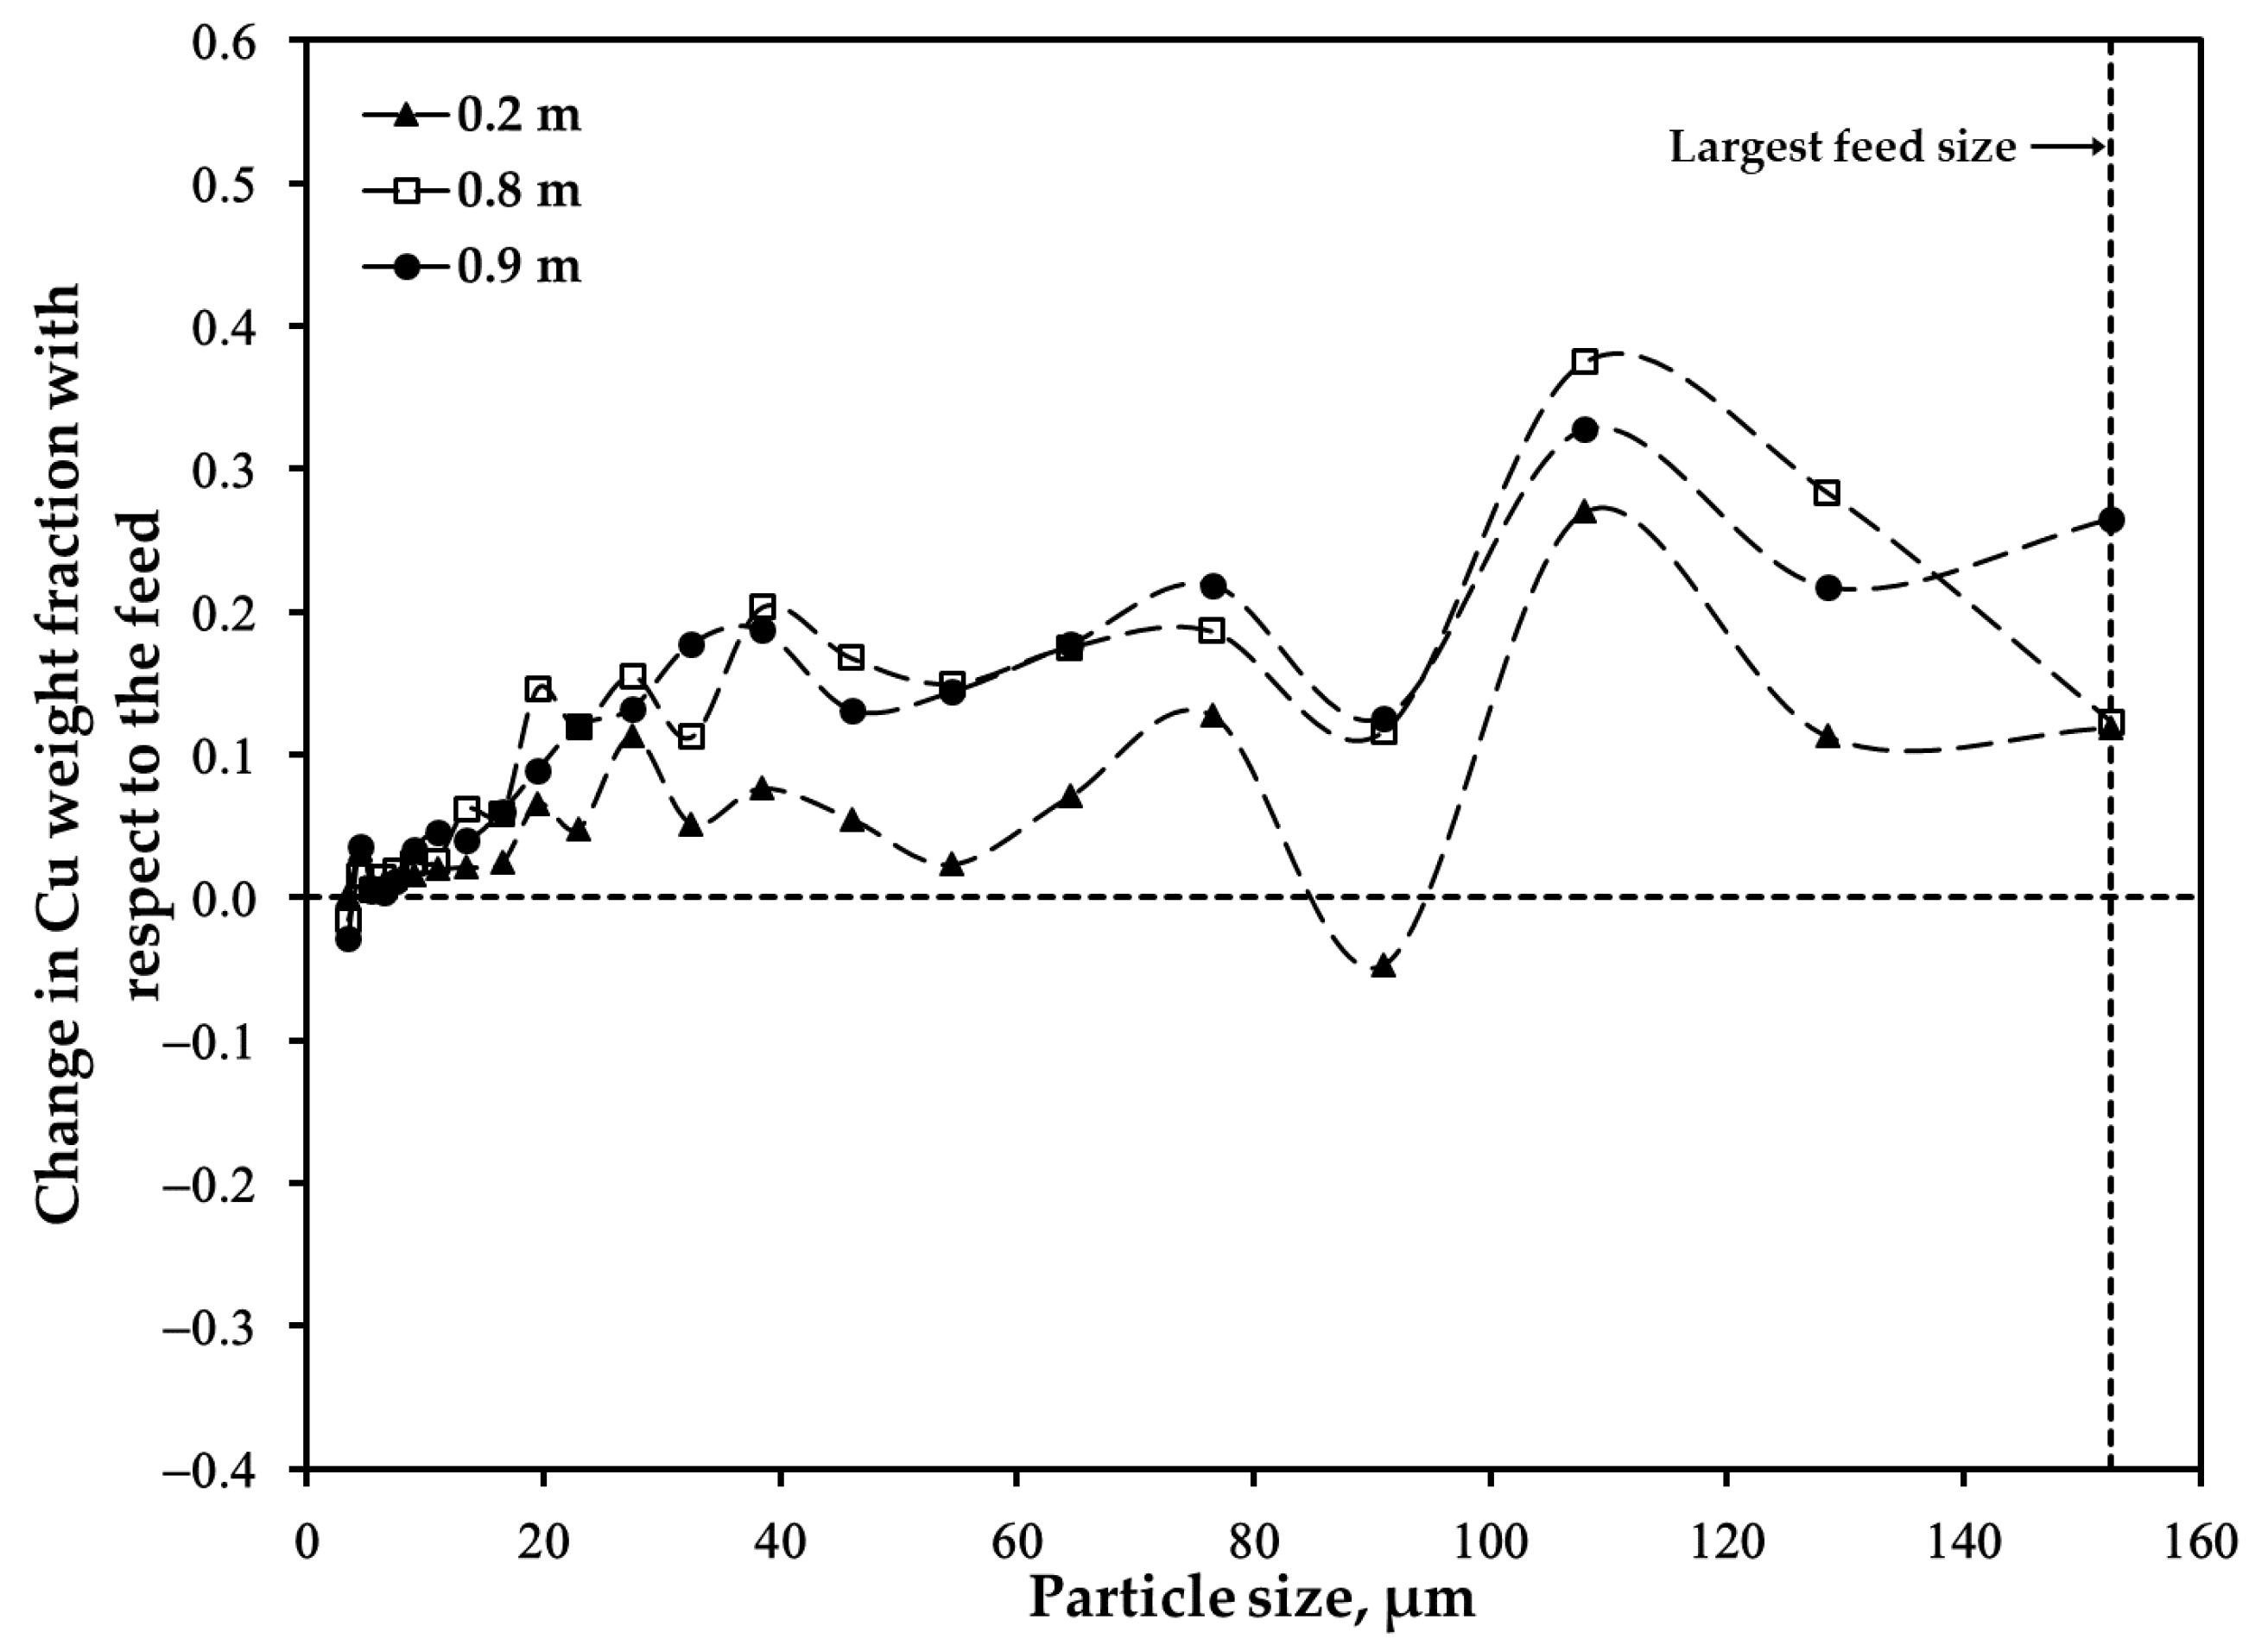
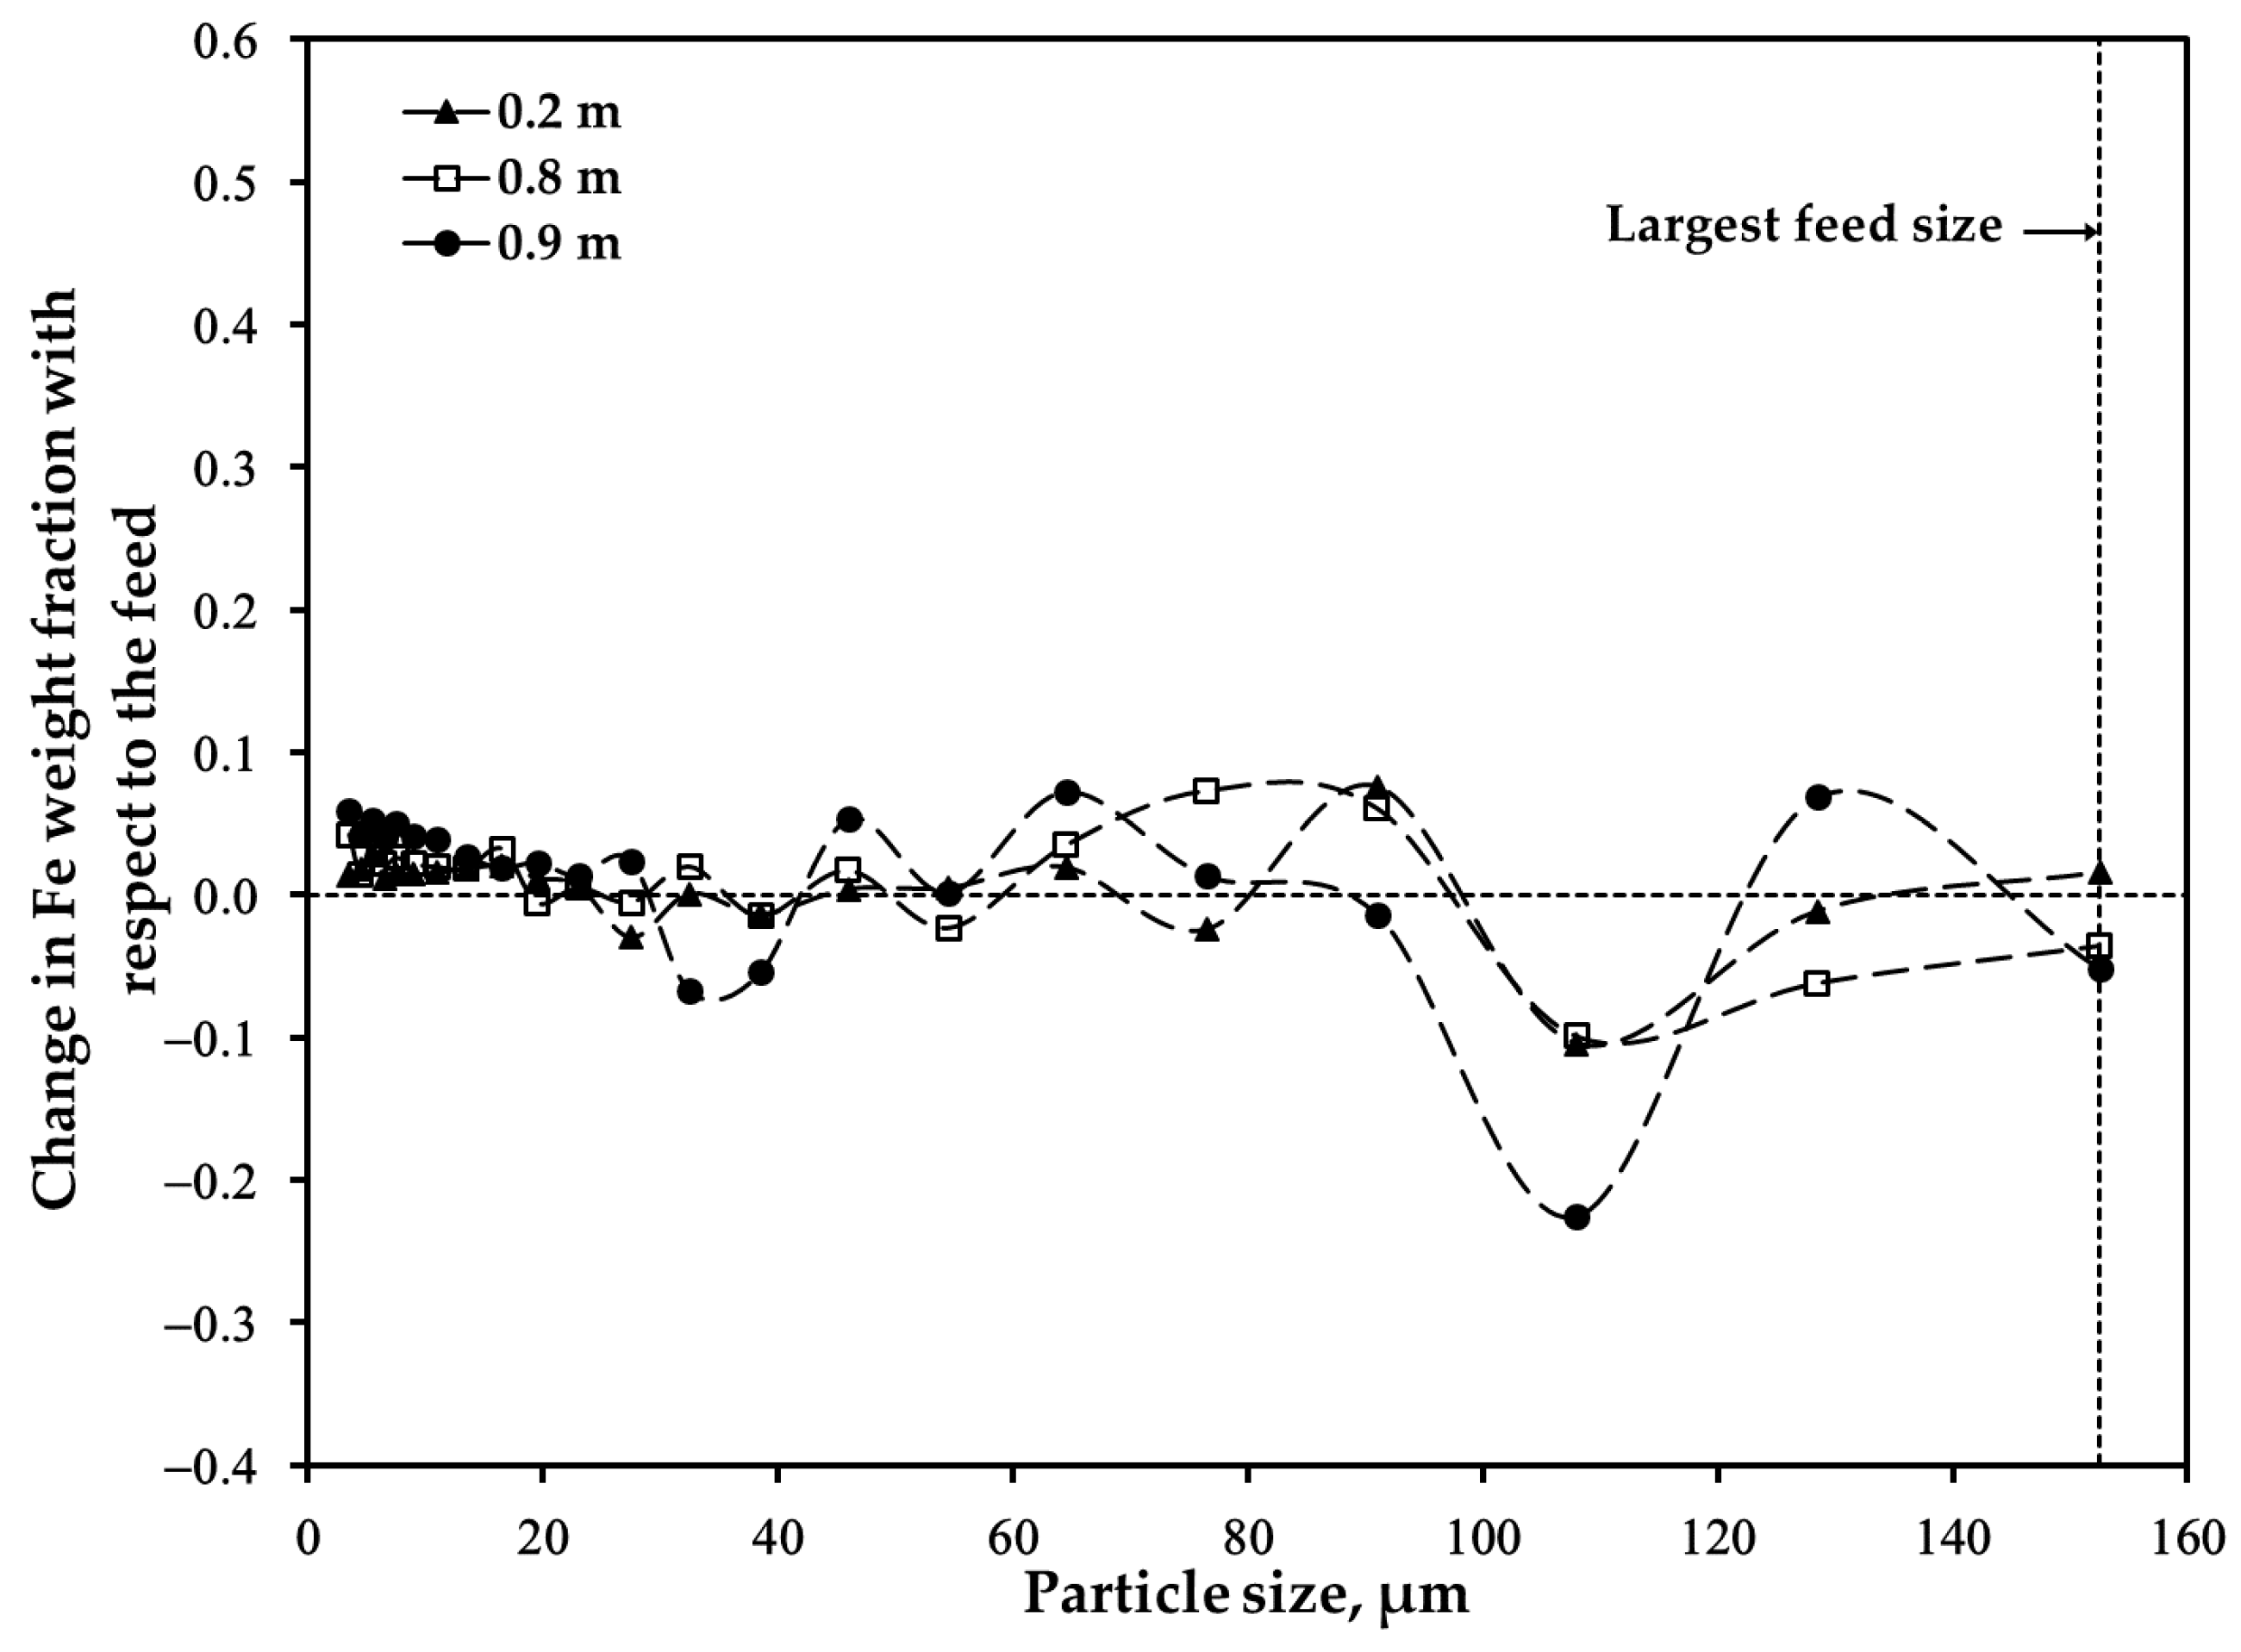
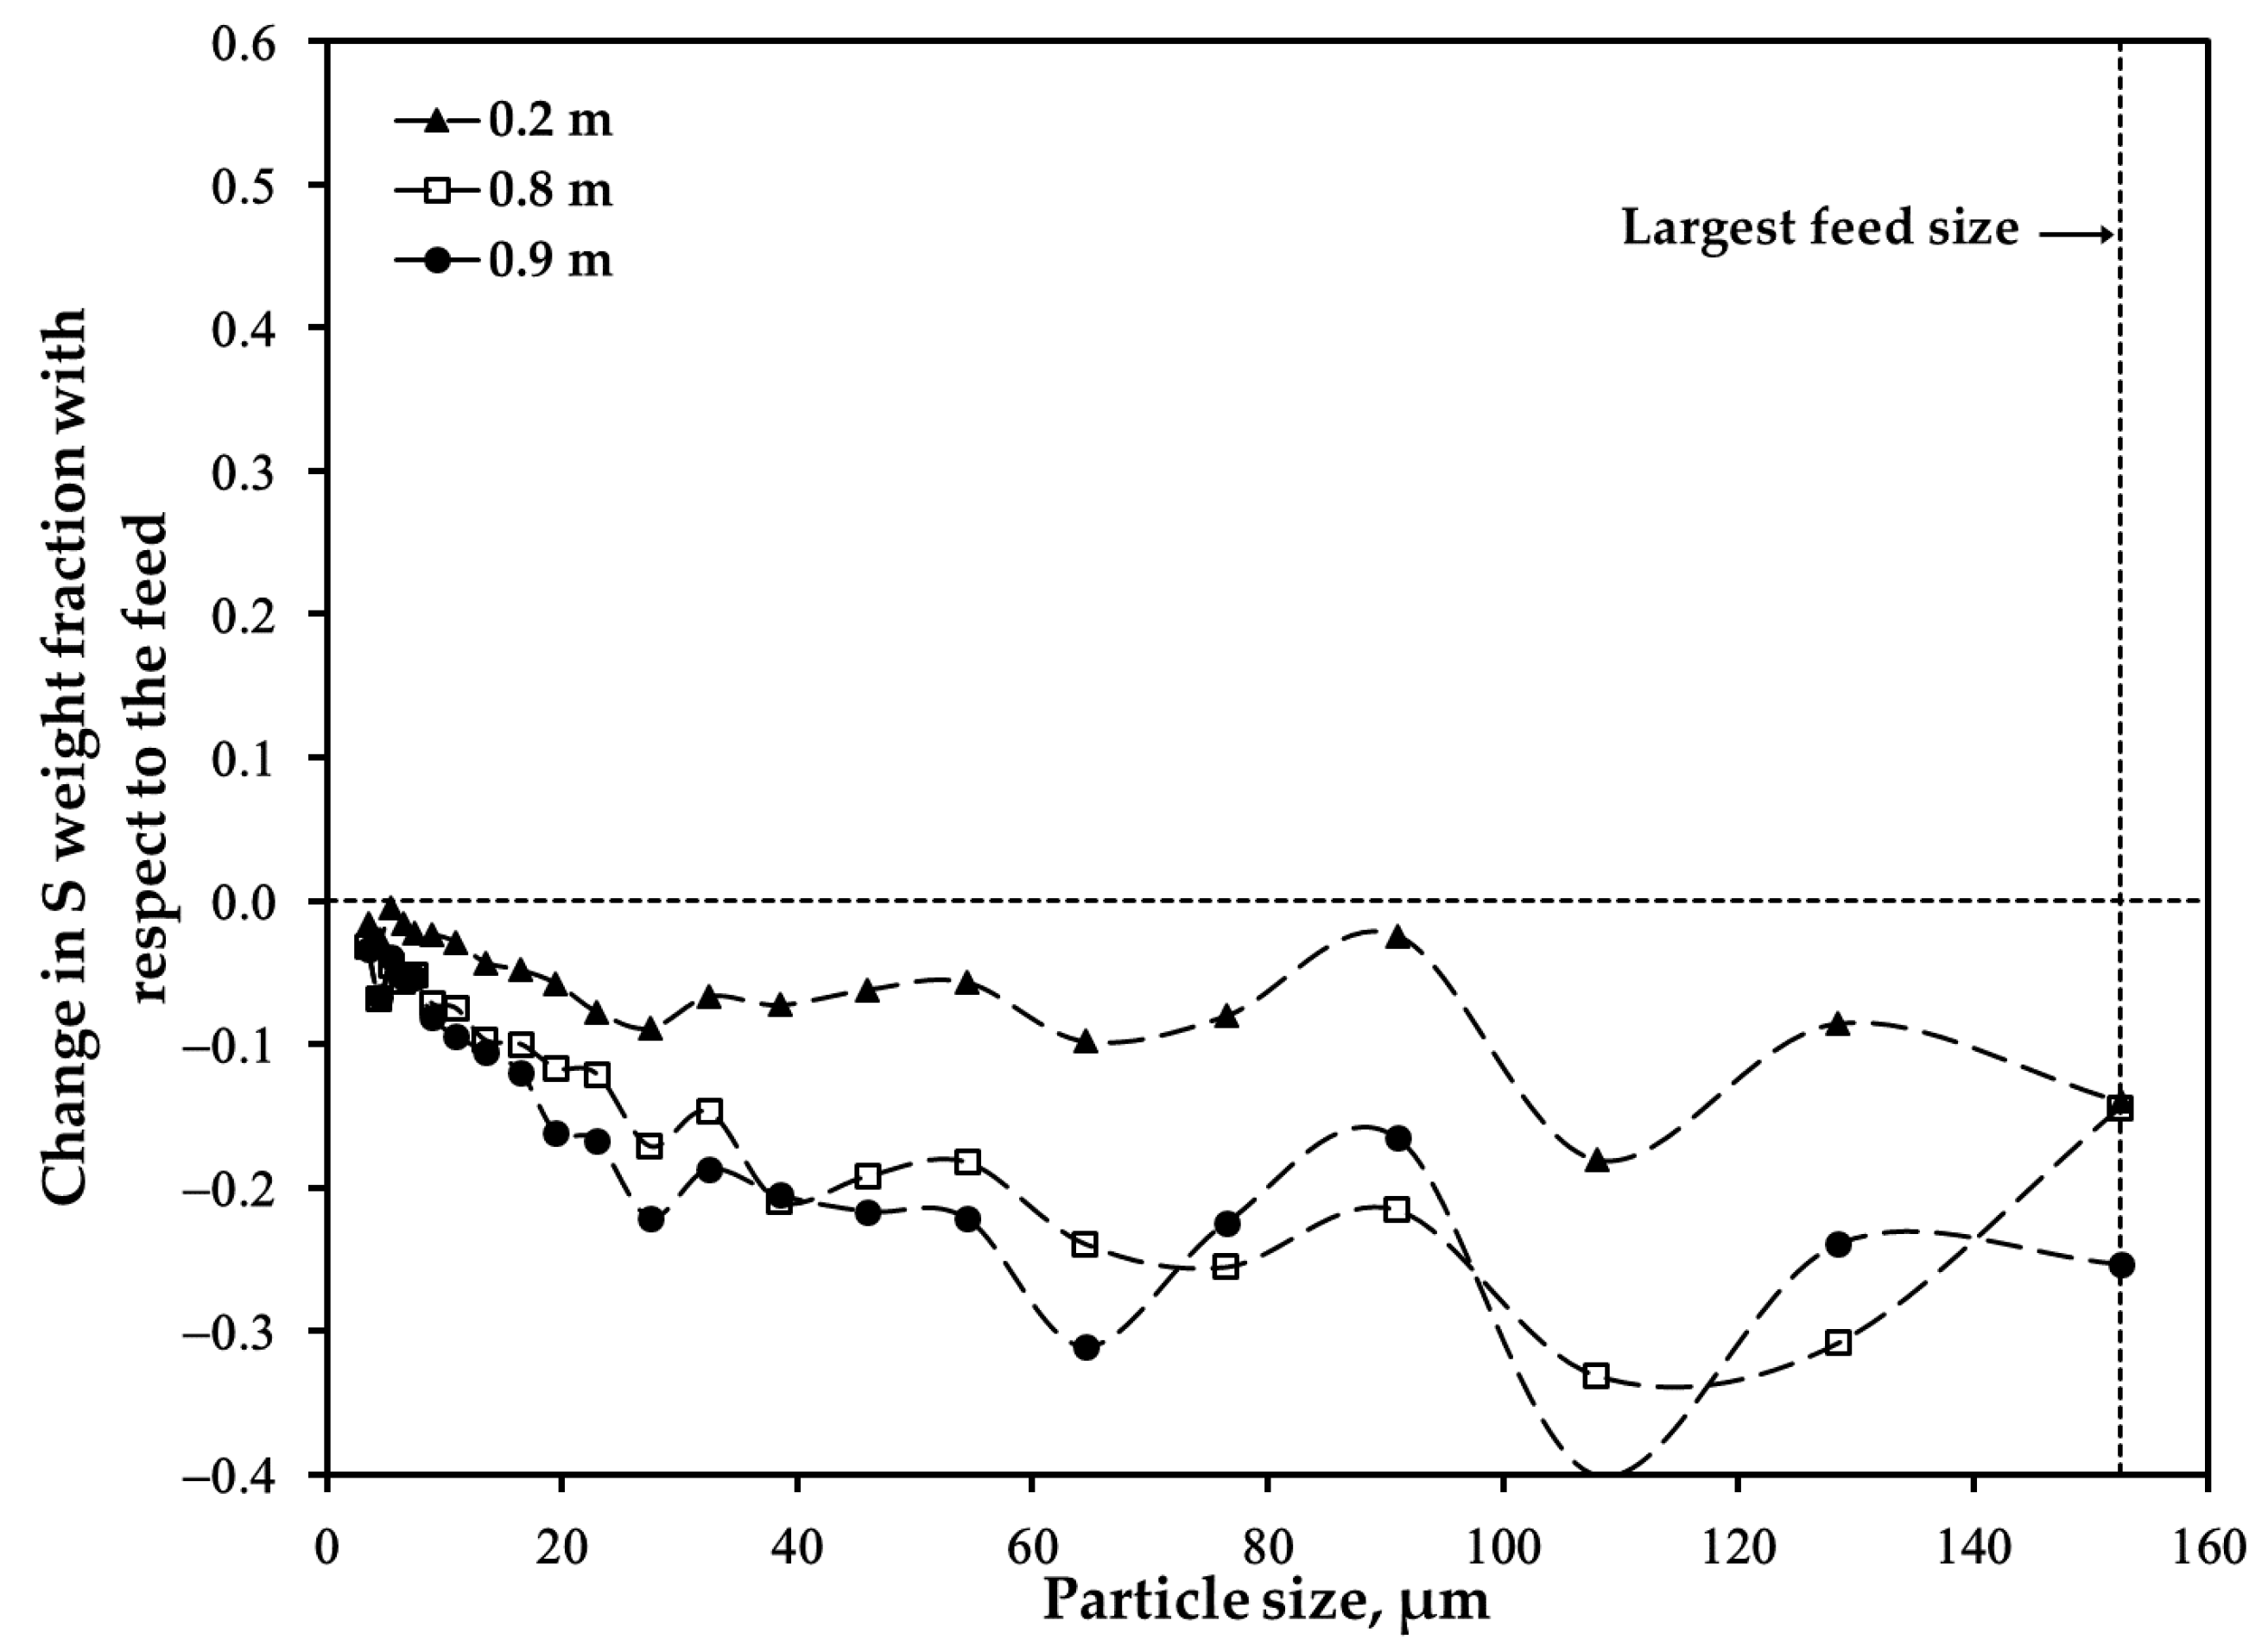
3.4. Distribution of Major Elements: Unsieved Concentrate after Oxidation
4. Concluding Remarks
Author Contributions
Funding
Data Availability Statement
Acknowledgments
Conflicts of Interest
References
- Sohn, H.Y.; Kang, S.; Chang, J. Sulfide Smelting Fundamentals, Technologies and Innovations. Miner. Metall. Process. 2005, 22, 65–76. [Google Scholar] [CrossRef]
- Kim, Y.H.; Themelis, N.J. Effect of Phase Transformation and Particle Fragmentation on the Flash Reaction of Complex Metal Sulfides. In The Reinhardt Schuhmann International Symposium on Innovative Technology and Reactor Design in Extractive Metallurgy; Gaskell, D.R., Hager, J.P., Hoffman, J.E., Mackey, P.J., Eds.; TMS: Colorado Springs, CO, USA, 1986; pp. 349–369. [Google Scholar]
- Jokilaakso, A.; Suominen, P.A.; Taskinen, P. Oxidation of Chalcopyrite in Simulated Suspension Smelting. Trans. Inst. Min. Metall. Sect. C—Miner. Process. Extr. Metall. 1991, 100, C79–C90. [Google Scholar]
- Jorgensen, F.R.A.; Segnit, E.R. Copper Flash Smelting Simulation Experiments. Proc Australas Inst Min Met. 1977, 261, 39–46. [Google Scholar]
- Jorgensen, F.R.A.; Koh, P.T.L. Combustion in Flash Smelting Furnaces. JOM 2001, 53, 16–20. [Google Scholar] [CrossRef]
- Jorgensen, F.R.A. Cenosphere Formation During the Combustion of Pyrite. Proc. Australas. Inst. Min. Metall. 1980, 276, 41–47. [Google Scholar]
- Jorgensen, F.R.A.; Zuiderwyk, M. Two-Colour Pyrometer Measurement of the Temperature of Individual Combusting Particles. J. Phys. E 1985, 18, 486–491. [Google Scholar] [CrossRef]
- Jorgensen, F.R.A. Single-Particle Combustion of Chalcopyrite. Proc. Australas. Inst. Min. Metall. 1983, 288, 37–46. [Google Scholar]
- Jokilaakso, A.; Ahokainen, T.; Teppo, O.; Yang, Y.; Lilius, K. Experimental and Computational-Fluid-Dynamics Simulation of the Outokumpu Flash Smelting Process. Miner. Process. Extr. Metall. Rev. 1995, 15, 217–234. [Google Scholar] [CrossRef]
- Thomas, A.; Grace, J.R.; Samarasekera, I.V. Combustion of Copper Concentrate Particles in a Stagnant Gas Furnace. Can. Metall. Q. 2000, 39, 187–194. [Google Scholar] [CrossRef]
- Kimura, T.; Ojima, Y.; Mori, Y.; Ishii, Y. Reaction Mechanism in a Flash Smelting Reaction Shaft. In The Reinhardt Schumann International Symposium on Innovative Technology ad Reactor Design in Extraction Metallurgy; Gaskell, D.R., Hager, J.P., Hoffman, J.E., Mackey, P.J., Eds.; TMS: Colorado Springs, CO, USA, 1986; pp. 403–418. [Google Scholar]
- Kemori, N.; Ojima, Y.; Kondo, Y. Variation of the Composition and Size of Copper Concentrate Particles in the Reaction Shaf. In Proceedings of the Flash Reaction Processes: Center for Pyrometallurgy Conference, Salt Lake City, UT, USA, 15–17 June 1988; pp. 47–68. [Google Scholar]
- Kemori, N.; Denholm, W.T.; Kurokawa, H. Reaction Mechanism in a Copper Flash Smelting Furnace. Metall. Mater. Trans. B 1989, 20, 327–336. [Google Scholar] [CrossRef]
- Pérez-Tello, M.; Parra-Sánchez, V.R.; Sánchez-Corrales, V.M.; Gómez-Álvarez, A.; Brown-Bojórquez, F.; Parra-Figueroa, R.A.; Balladares-Varela, E.R.; Araneda-Hernández, E.A. Evolution of Size and Chemical Composition of Copper Concentrate Particles Oxidized Under Simulated Flash Smelting Conditions. Metall. Mater. Trans. B 2018, 49, 627–643. [Google Scholar] [CrossRef]
- Pérez-Tello, M.; Sohn, H.Y.; St. Marie, K.; Jokilaakso, A. Experimental Investigation and Three-Dimensional Computational Fluid-Dynamics Modeling of the Flash-Converting Furnace Shaft: Part I. Experimental Observation of Copper Converting Reactions in Terms of Converting Rate, Converting Quality, Changes in Parti. Metall. Mater. Trans. B 2001, 32, 847–868. [Google Scholar] [CrossRef]
- Themelis, N.J.; Wu, L.; Jiao, Q. Some Aspects of Mathematical Modeling of Flash Smelting Phenomena. In Proceedings of the Flash Reaction Processes: Center for Pyrometallurgy Conference, Salt Lake City, UT, USA, 15–17 June 1988. [Google Scholar]
- Schlesinger, M.E.; Sole, K.C.; Davenport, W.G.; Alvear Flores, G.R.F. Chapter 6—Flash smelting (Davenport et al., 2001). In Extractive Metallurgy of Copper, 6th ed.; Schlesinger, M.E., Sole, K.C., Davenport, W.G., Alvear Flores, G.R.F., Eds.; Elsevier: Amsterdam, The Netherlands, 2022; pp. 119–141. ISBN 978-0-12-821875-4. [Google Scholar]
- Chaubal, P.C.; Sohn, H.Y. Intrinsic kinetics of the oxidation of chalcopyrite particles under isothermal and nonisothermal conditions. Metall. Trans. B 1986, 17, 51–60. [Google Scholar] [CrossRef]
- Pérez-Fontes, S.E.; Pérez-Tello, M.; Prieto-López, L.O.; Brown, F.; Castillón-Barraza, F. Thermoanalytical study on the oxidation of sulfide minerals at high temperatures. Miner. Metall. Process. 2007, 24, 275–283. [Google Scholar] [CrossRef]


| Variable | Value |
|---|---|
| Oxygen concentration in the process gas, vol pct. | 40 |
| 70 | |
| Size fraction in the feed, µm | <45 45–53 Unsieved |
| Sampling location from the lance tip, m | 0.0 0.2 0.8 0.9 |
| Mineral | <45 µm | 45–53 µm | Unsieved |
|---|---|---|---|
| Chalcopyrite, CuFeS2 | 62.0 | 46.0 | 46.3 |
| Pyrite, FeS2 | 20.3 | 35.2 | 36.4 |
| Chalcocite, Cu2S | 6.46 | 8.01 | 5.07 |
| Silica, SiO2 | 4.12 | 4.75 | 4.61 |
| Others | 7.12 | 6.00 | 7.67 |
Disclaimer/Publisher’s Note: The statements, opinions and data contained in all publications are solely those of the individual author(s) and contributor(s) and not of MDPI and/or the editor(s). MDPI and/or the editor(s) disclaim responsibility for any injury to people or property resulting from any ideas, methods, instructions or products referred to in the content. |
© 2024 by the authors. Licensee MDPI, Basel, Switzerland. This article is an open access article distributed under the terms and conditions of the Creative Commons Attribution (CC BY) license (https://creativecommons.org/licenses/by/4.0/).
Share and Cite
Pérez-Tello, M.; de la Paz-Ojeda, V.; Parra-Sánchez, V.R.; Araneda-Hernández, E.A.; Fernández-Sagredo, M.C.; Villagrán-Guerra, E.A. Distribution of Copper, Iron, and Sulfur in Copper Concentrate Particles during Oxidation under Simulated Flash Smelting Conditions. Minerals 2024, 14, 315. https://doi.org/10.3390/min14030315
Pérez-Tello M, de la Paz-Ojeda V, Parra-Sánchez VR, Araneda-Hernández EA, Fernández-Sagredo MC, Villagrán-Guerra EA. Distribution of Copper, Iron, and Sulfur in Copper Concentrate Particles during Oxidation under Simulated Flash Smelting Conditions. Minerals. 2024; 14(3):315. https://doi.org/10.3390/min14030315
Chicago/Turabian StylePérez-Tello, Manuel, Valeria de la Paz-Ojeda, Víctor R. Parra-Sánchez, Eugenia A. Araneda-Hernández, Madrioly C. Fernández-Sagredo, and Eduardo A. Villagrán-Guerra. 2024. "Distribution of Copper, Iron, and Sulfur in Copper Concentrate Particles during Oxidation under Simulated Flash Smelting Conditions" Minerals 14, no. 3: 315. https://doi.org/10.3390/min14030315
APA StylePérez-Tello, M., de la Paz-Ojeda, V., Parra-Sánchez, V. R., Araneda-Hernández, E. A., Fernández-Sagredo, M. C., & Villagrán-Guerra, E. A. (2024). Distribution of Copper, Iron, and Sulfur in Copper Concentrate Particles during Oxidation under Simulated Flash Smelting Conditions. Minerals, 14(3), 315. https://doi.org/10.3390/min14030315