Article

Efficient Aqueous Copper Removal by Burnt Tire-Derived Carbon-Based Nanostructures and Their Utilization as Catalysts

by
Iviwe Cwaita Arunachellan
1,2,
Madhumita Bhaumik
3,
Hendrik Gideon Brink
3,*,
Kriveshini Pillay
1 and
Arjun Maity
2,3,*
1
Department of Chemical Science, University of Johannesburg, Doornfontein, Johannesburg 2028, South Africa
2
DST/CSIR, Centre for Nanostructure and Advanced Materials (CeNAM), Council for Scientific and Industrial Research (CSIR), 1-Meiring Naude Road, Pretoria 0081, South Africa
3
Department of Chemical Engineering, Faculty of Engineering, Built Environment and Information Technology, University of Pretoria, Private Bag X20, Pretoria 0028, South Africa
*
Authors to whom correspondence should be addressed.
Minerals 2024, 14(3), 302; https://doi.org/10.3390/min14030302
Submission received: 4 December 2023 / Revised: 6 March 2024 / Accepted: 8 March 2024 / Published: 13 March 2024

Abstract

:
This research focuses on valorising waste burnt tires (BTs) through a two-phase oxidation process, leading to the production of onion-like carbon-based nanostructures. The initial carbonization of BTs yielded activated carbon (AC), denoted as “BTSA”, followed by further oxidation using the modified Hummer’s method to produce onion-like carbon designated as “BTHM”. Brunauer–Emmett–Teller (BET) surface area measurements showed 5.49 m2/g, 19.88 m2/g, and 71.08 m2/g for raw BT, BTSA, and BTHM, respectively. Additional surface functionalization oxidations were observed through Fourier-Transform Infrared (FTIR), X-ray diffraction (XRD), Scanning Electron Microscopy (SEM), and Transmission Electron Microscopy (TEM) analyses. Raman spectroscopy indicated an increased graphitic nature during each oxidation stage. BTHM was assessed in batch adsorption studies for cupric wastewater remediation, revealing a two-phase pseudo-first-order behaviour dominated by mass transfer to BTHM. The maximum adsorption capacity for Cu2+ on BTHM was determined as 136.1 mg/g at 25 °C. Langmuir adsorption isotherm best described BTHM at a solution pH of 6, while kinetics studies suggested pseudo-second-order kinetics. Furthermore, BTHM, laden with Cu2+, served as a catalyst in a model coupling reaction of para-idoanisole and phenol, successfully yielding the desired product. This study highlights the promising potential of BTHM for both environmental remediation and catalytic reuse applications to avoid the generation of secondary environmental waste by the spent adsorbent.

1. Introduction

Copper, as the third most widely utilized metal across diverse industries, plays a pivotal role in economic activities. However, the established correlation between copper mining and adverse effects on surrounding water sources, including groundwater aquifers, wildlife, and farmland, raises significant environmental and health concerns [1]. Epidemiological studies have linked copper mining activities to various health issues, ranging from headaches to serious conditions such as cirrhosis, kidney failure, and cancer [2,3,4]. The substantial waste production, with approximately 99% of mined rock ending up as waste, contributes significantly to copper contamination [1]. Additionally, copper refining demands substantial water input, leading to massive production of copper-contaminated wastewater that requires effective treatment [5]. Current treatment technologies necessitate further research to develop sustainable and efficient methods for copper recovery from aqueous streams [2].
Activated carbon (AC), a versatile material, can be derived from various sources, including high-purity carbon feedstocks or low-cost agricultural waste such as fruit seeds, nut shells, vegetable waste, and wheat straw [6,7]. However, traditional methods for AC synthesis are often energy-intensive and involve high temperatures, catalysts, and expensive chemicals [8]. Carbon nanostructured materials (CNs), encompassing materials like carbon nanotubes (CNTs), carbon fibres, graphene, fullerenes, and onion-like carbon (OLC), offer unique properties but are typically produced using energy-intensive and expensive methods [9]. Some of these methods include hydrothermal carbonisation (HTC) [10], chemical vapour deposition (CVD), and thermal activation [11]. OLCs are usually produced through high-temperature annealing under a vacuum [12]. Graphene is produced using mechanical cleavage of graphite crystals, exfoliation of graphite through its intercalation compounds, CVD on various substrates, or utilising an organic synthesis process [13,14]. Synthetic design is crucial for CNs, enabling the fine-tuning of properties, but the associated methods are often costly and environmentally hazardous [15]. Natural materials such as agricultural waste, tyre waste, plastics, eggshells, leaves, newspaper, vegetable and fruit waste, agricultural waste, and sewage waste have been explored for CN [11], CNT [15], and graphene [16] production.
The wastewater treatment industry, a key source of recycled water globally, employs various techniques to ensure water safety [17]. Current wastewater treatment technologies have limitations [18], prompting the exploration of CN adsorbents for their economic and environmental benefits. CN adsorbents, with metal ion-attracting functional groups on their surfaces, exhibit enhanced sensitivity and specificity in the removal of toxic heavy metals from wastewater [19]. These adsorbents are expected to efficiently remove metal ions and allow for multiple reuse cycles.
However, the saturated adsorbent often presents an environmental problem when it loses its adsorption efficiency and is discarded back into the environment. Hence, it has become imperative to explore reuse applications of the spent adsorbent. Among such reuse applications, catalysis has become increasingly attractive since heavy metals have been effectively used as catalysts in industrial reactions.
Coupling reactions in organic chemistry, facilitated by metal-containing catalysts, produce valuable compounds by joining two fragments. Carbon-supported copper catalysts have proven effective in various coupling reactions, including Grignard, Sonagashira, Suzuki, and Ullmann coupling reactions [20,21].
This study therefore aims to synthesise CNs via a sophisticated two-step oxidation process, utilizing an economically viable carbonaceous precursor—burnt tyre residue. The procedure commences with a low-temperature carbonization of the residue employing a strong acid, resulting in the production of activated carbon (AC) [22]. Subsequently, a refined Hummer’s method is applied for further oxidation [23,24], followed by treatment with hydrogen peroxide to eradicate any lingering contaminating ions, culminating in the creation of CNs. Notably, the innovation presented transcends conventional AC synthesis methods, addressing the energy-intensive and environmentally detrimental characteristics associated with prevalent approaches to CN production. This investigation underscores the potential of harnessing natural waste materials, including agricultural and tyre waste, for the synthesis of CNs. By reimagining abundant and economical precursors, the study introduces an ecologically sound strategy, harmonizing with the principles of sustainable material synthesis.
The innovative thrust further extends to the practical application of the synthesized CNs in batch adsorption studies for the treatment of synthetic cupric wastewater, thereby highlighting their promise in overcoming the limitations inherent in prevailing wastewater treatment technologies.
Finally, the assessment of the copper-ion laden material as a catalyst in model coupling organic reactions accentuates the multifaceted nature of the synthesized CNs. This inventive exploration of their catalytic potential introduces a fresh dimension to the myriad applications of CNs, transcending the conventional realm of wastewater treatment.

2. Materials and Methods

2.1. Materials and Reagents

Burnt tyre residue (collected from a recycling site where old tyres are recycled or burnt), 98% H2SO4 and NaHCO3, NaNO3, 98% H2SO4, KMnO4, and HCl were used in this study. All materials (except for the burnt tyre residue) were of analytical grade and were obtained in <90% purity from Sigma Aldrich (Burlington, MA, USA).

2.2. Preparation of Sulfuric Acid Modified Burnt Tyre Material

The burnt tyre residue underwent multiple washes with deionized water and was subsequently dried in a vacuum oven at 60 °C. The resulting residue, now in fine powder form (5 g), was subjected to treatment with 98% H2SO4 at a 1:1 ratio (tyre waste to H2SO4, w/w) and placed in a vacuum oven at 100 °C for 24 h for carbonization. Following this, the material was mixed with deionized water and agitated for 2 h to eliminate any excess acid, followed by filtration through a vacuum. The material underwent repeated washings with deionized water until a clear filtrate was obtained and was then immersed in a 1% NaHCO3 solution to eliminate any residual acid. The carbonized adsorbent was subsequently dried in a vacuum oven at 100 °C, ground, and stored in an airtight container [25].

2.3. Oxidation via Modified Hummer’s Method

A total of 2 g of carbonized burnt tyre and 2 g of NaNO3 were combined in a 1000 mL Erlenmeyer flask containing 100 mL of 98% H2SO4, where continuous stirring was maintained overnight. Subsequently, the mixture underwent stirring for 4 h at temperatures ranging from 0 to 5 °C, facilitated by an ice bath. During this process, 12 g of KMnO4 was slowly introduced into the suspension, ensuring that the temperature remained below 15 °C to prevent overheating. The mixture was then gradually diluted by adding 100 mL of water, with stirring continuing for an additional 2 h. After removing the ice, the stirring persisted at 35 °C for another 2 h. The temperature was then raised to 98 °C for 10–15 min, gradually lowered, and then maintained at 35 °C for a final 2 h.
To complete the process, 6 mL of H2O2 (30%), diluted in 200 mL of water, was divided into beakers, with equal portions poured and stirred for 1 h. Subsequently, the solution was left unstirred for the remaining 3–4 h, allowing particles to settle, and was then subjected to filtration. The particles underwent repeated washing via centrifugation with 10% HCl and deionized water. Following centrifugation, the particles were vacuum-dried at 60 °C for a duration of 12 h [26].

2.4. Characterisation

The visualization of surface morphology and structure of the materials was conducted using a JEOL JSM 7500F microscope (JEOL, Tokyo, Japan) and a Zeiss field emission scanning electron microscope (FE-SEM) (FE-SEM, LEO Zeiss SEM, ZEISS, Oberkochen, Germany). For more in-depth size and morphology studies, a high-resolution transmission electron microscope (HR-TEM), specifically the JEOL JEM-2100 instrument (JEOL, Tokyo, Japan) with a LAB6 filament, operated at 200 kV.
The determination of surface area, pore volume, and pore diameter for each synthesized material was carried out using the Brunauer, Emmett, and Teller (BET) method. This analysis utilized a Micromeritics ASAP 2020 gas adsorption apparatus (Micromeritics, Norcross, GA, USA). Crystalline behaviour of all the powdered samples was explored by employing a PANalytical X’Pert PRO diffractometer (Malvern Panalytical, Malvern, UK). X-ray diffraction (XRD) patterns were obtained using CuKα radiation with a generator voltage of 45 kV along with a turbo current of 40 mA. The diffractograms were recorded in the range of 2θ = 5–90° with a scanning step size of 0.026°.
Functional groups present on the surfaces of the various materials were identified through Fourier-Transform Infrared Spectroscopy (FTIR), which was performed using a PerkinElmer Spectrum 100 spectrometer in the range of 600–4000 cm−1 with spectral resolution.
For the evaluation of vibrational, rotational, and other low-frequency modes resulting from the materials’ structure, Raman spectroscopy was employed. The elemental composition of the materials before and after adsorption was determined using X-ray photoelectron spectroscopy (XPS) (PHOIBOS 150, SPECS, Berlin, Germany). Inductively coupled plasma mass spectrometry (ICP-MS) (iCAP RQplus, ThermoScientific, Waltham, MA, USA) was utilized to assess the remaining concentration of the solution after the adsorption process. Lastly, Nuclear Magnetic Resonance (NMR) was performed on a Bruker Fourier 300 MHz spectrometer (Bruker, Billerica, MA, USA) for the comprehensive analysis of the synthesized compounds.

2.5. Batch Adsorption Studies

A solution stock was prepared by dissolving 3.8019 g of copper(II) nitrate trihydrate in deionized water, resulting in a 1000 mg/L solution in a flask. Experimental solutions containing Cu2+ ions for adsorption studies were then derived by diluting the stock solution (1000 mg/L) to various concentrations, such as 20, 50, 100, and 200 mg/L. Adsorption equilibrium studies were conducted in a thermostatic shaker at 200 rpm for 24 h. This involved introducing a known quantity of BTHM into 50 mL glass bottles containing a pre-determined concentration of Cu2+ solution. Subsequently, the solutions were analysed using ICP-MS to determine the remaining concentration post adsorption.
To investigate the impact of pH on Cu2+ adsorption, the pH of the initial Cu2+ solution was varied between pH 1 and 6. pH adjustments were made using prepared solutions of HCl or NaOH at concentrations ranging from 1 M to 0.1 M. The quantity of BTHM adsorbent was systematically varied from 10 mg to 100 mg to assess the optimal dose for maximum adsorbate removal. The Cu2+ percentage removal and adsorption capacity were calculated using Equations (1) and (2):
% r e m o v a l = C 0 C e C o × 100
q e = C 0 C e m v
where C0 and Ce are the initial and equilibrium Cu2+ concentrations in mg/L, respectively. The adsorption kinetics studies were carried out by varying the initial Cu2+ concentration (20, 50, 100 mg/L). The adsorbents and Cu2+ solution were stirred in a 1 L beaker for 24 h at 200 rpm, while pH and dose were kept at a constant optimum amount. At allocated time intervals, aliquots of 2 mL were collected and filtered using a 0.45 μm syringe filter. The filtrate was analysed for residual Cu2+ concentration. Furthermore, to analyse the adsorption kinetics for the adsorption of Cu2+ ion by the adsorbents, the experimental data were then fitted to the models: the pseudo-first-order, pseudo-second-order [27], and two-phase pseudo-first-order [28] models represented in Equation (3) to Equation (5), respectively.
q t = q e 1 e x p k 1 t
q t = q e 2 k 2 t 1 + q e k 2 t
q t = q e ϕ f a s t 1 exp k 1 , fast t + 1 ϕ f a s t 1 exp k 1 , slow t
where qe (mg/g) and qt (mg/g) are the adsorption capacity at equilibrium and at a determined time t (min), respectively; k1 (1/min), k2 (g/mg/min) are the pseudo-first-order and pseudo-second-order rate constants, respectively; ϕfast is the fraction of qe that adsorbs rapidly; k1,fast and k1,slow are the rapid and slow first order reaction rate constants in Equation (5).
The rate determining step for adsorption can be determined Using the Crank and Weber and Morris intra-particle models [27]. The Crank model is represented by Equation (6) and the simplified solution of this model can be calculated using Equation (7).
q t t = D e R 2 R R 2 q t R
q t q e = 6 D e t R 2 1 2 π 1 2 1 2 D e t R 2 1 2 ,       q t q e < 0.8                                         1 6 π 2 exp D e π 2 t R 2 ,       q t q e 0.8
The intra-particle model makes use of Equation (8):
q t = k i t 0.5 + C , k i = 6 q e D e π R 2 0.5
where De is the effective diffusivity of the adsorbate within the adsorbent intraparticle space, R is the radius of the agglomerated particle, ki is the intra-particle diffusion rate constant (mg/g/min0.5), and C is the intercept related to boundary layer thickness (mg/g). The Webber and Morris model can be interpreted using a plot of qt vs. t0.5 which is represented as 3 linear regions separated from the curve [29].
The isotherm experiments were conducted where the pH, concentration, and dose were kept constant while the temperature was varied at 25, 35, and 45 °C. The mixtures were shaken in a temperature-controlled thermostat at 200 rpm in 50 mL solutions for 24 h. The effect of temperature on the Cu2+ adsorption capacity of the adsorbents was studied by fitting the data from the adsorption equilibrium studies to two models: Langmuir and Freundlich, represented by Equations (9) and (10), respectively [30].
q e q m = b C e 1 + b C e
q e =   K F C e 1 / n  
where qm is the maximum adsorption capacity, and b is the Langmuir constant. The Freundlich constants kF (mg/g) and 1/n signify the adsorption capacity and adsorption intensity.
To determine the thermodynamic parameters in the adsorption process, the isotherm studies were used. The Gibbs free energy change (ΔG°), enthalpy change (ΔH°), and entropy change (ΔS°) parameters can be used to determine the nature of the thermodynamics observed in the adsorption of Cu2+ by BTHM. These make use of Equations (11) and (12):
G ° = R T I n K c
I n K c = Δ S ° R Δ H ° R T K c = m V q e C e
where Kc is the equilibrium constant (L/mol), R is the ideal gas constant (J/mol/K), m/V is the adsorbent concentration (g/L), and T is temperature (K).

2.6. Catalysis

The copper catalyst was used for C-O cross coupling reaction as presented in Scheme 1.
In a 25 mL two-neck round-bottom flask, a mixture comprising 1 mmol of para-idoanisole, 1.2 mmol of phenol, and 10 mg of copper adsorbed BTHM (Cu@BTHM) was stirred. Subsequently, K2CO3 (3 mmol) and 5 mL of DMF were added once stirring commenced. The entire reaction mixture was stirred at 120 °C for 24 h, with continuous monitoring using thin-layer chromatography. Upon completion of the reaction, the mixture was cooled to room temperature, and the catalyst was filtered using Whatman A filter paper. The filtrate was quenched with water (15 mL), and the product was subjected to extraction with ethyl acetate (3×, 10 mL).
The combined organic layers underwent washing with saturated sodium bicarbonate, a brine solution, and, finally, the organic layer was dried using anhydrous sodium sulphate. The solution was then concentrated under vacuum at 45 °C to obtain the crude product. Purification of the crude product was achieved through column chromatography (60–120 silica gel) using hexane and ethyl acetate as the mobile phase in a ratio of 9:1, resulting in the recovery of the pure compound [31].

3. Results and Discussion

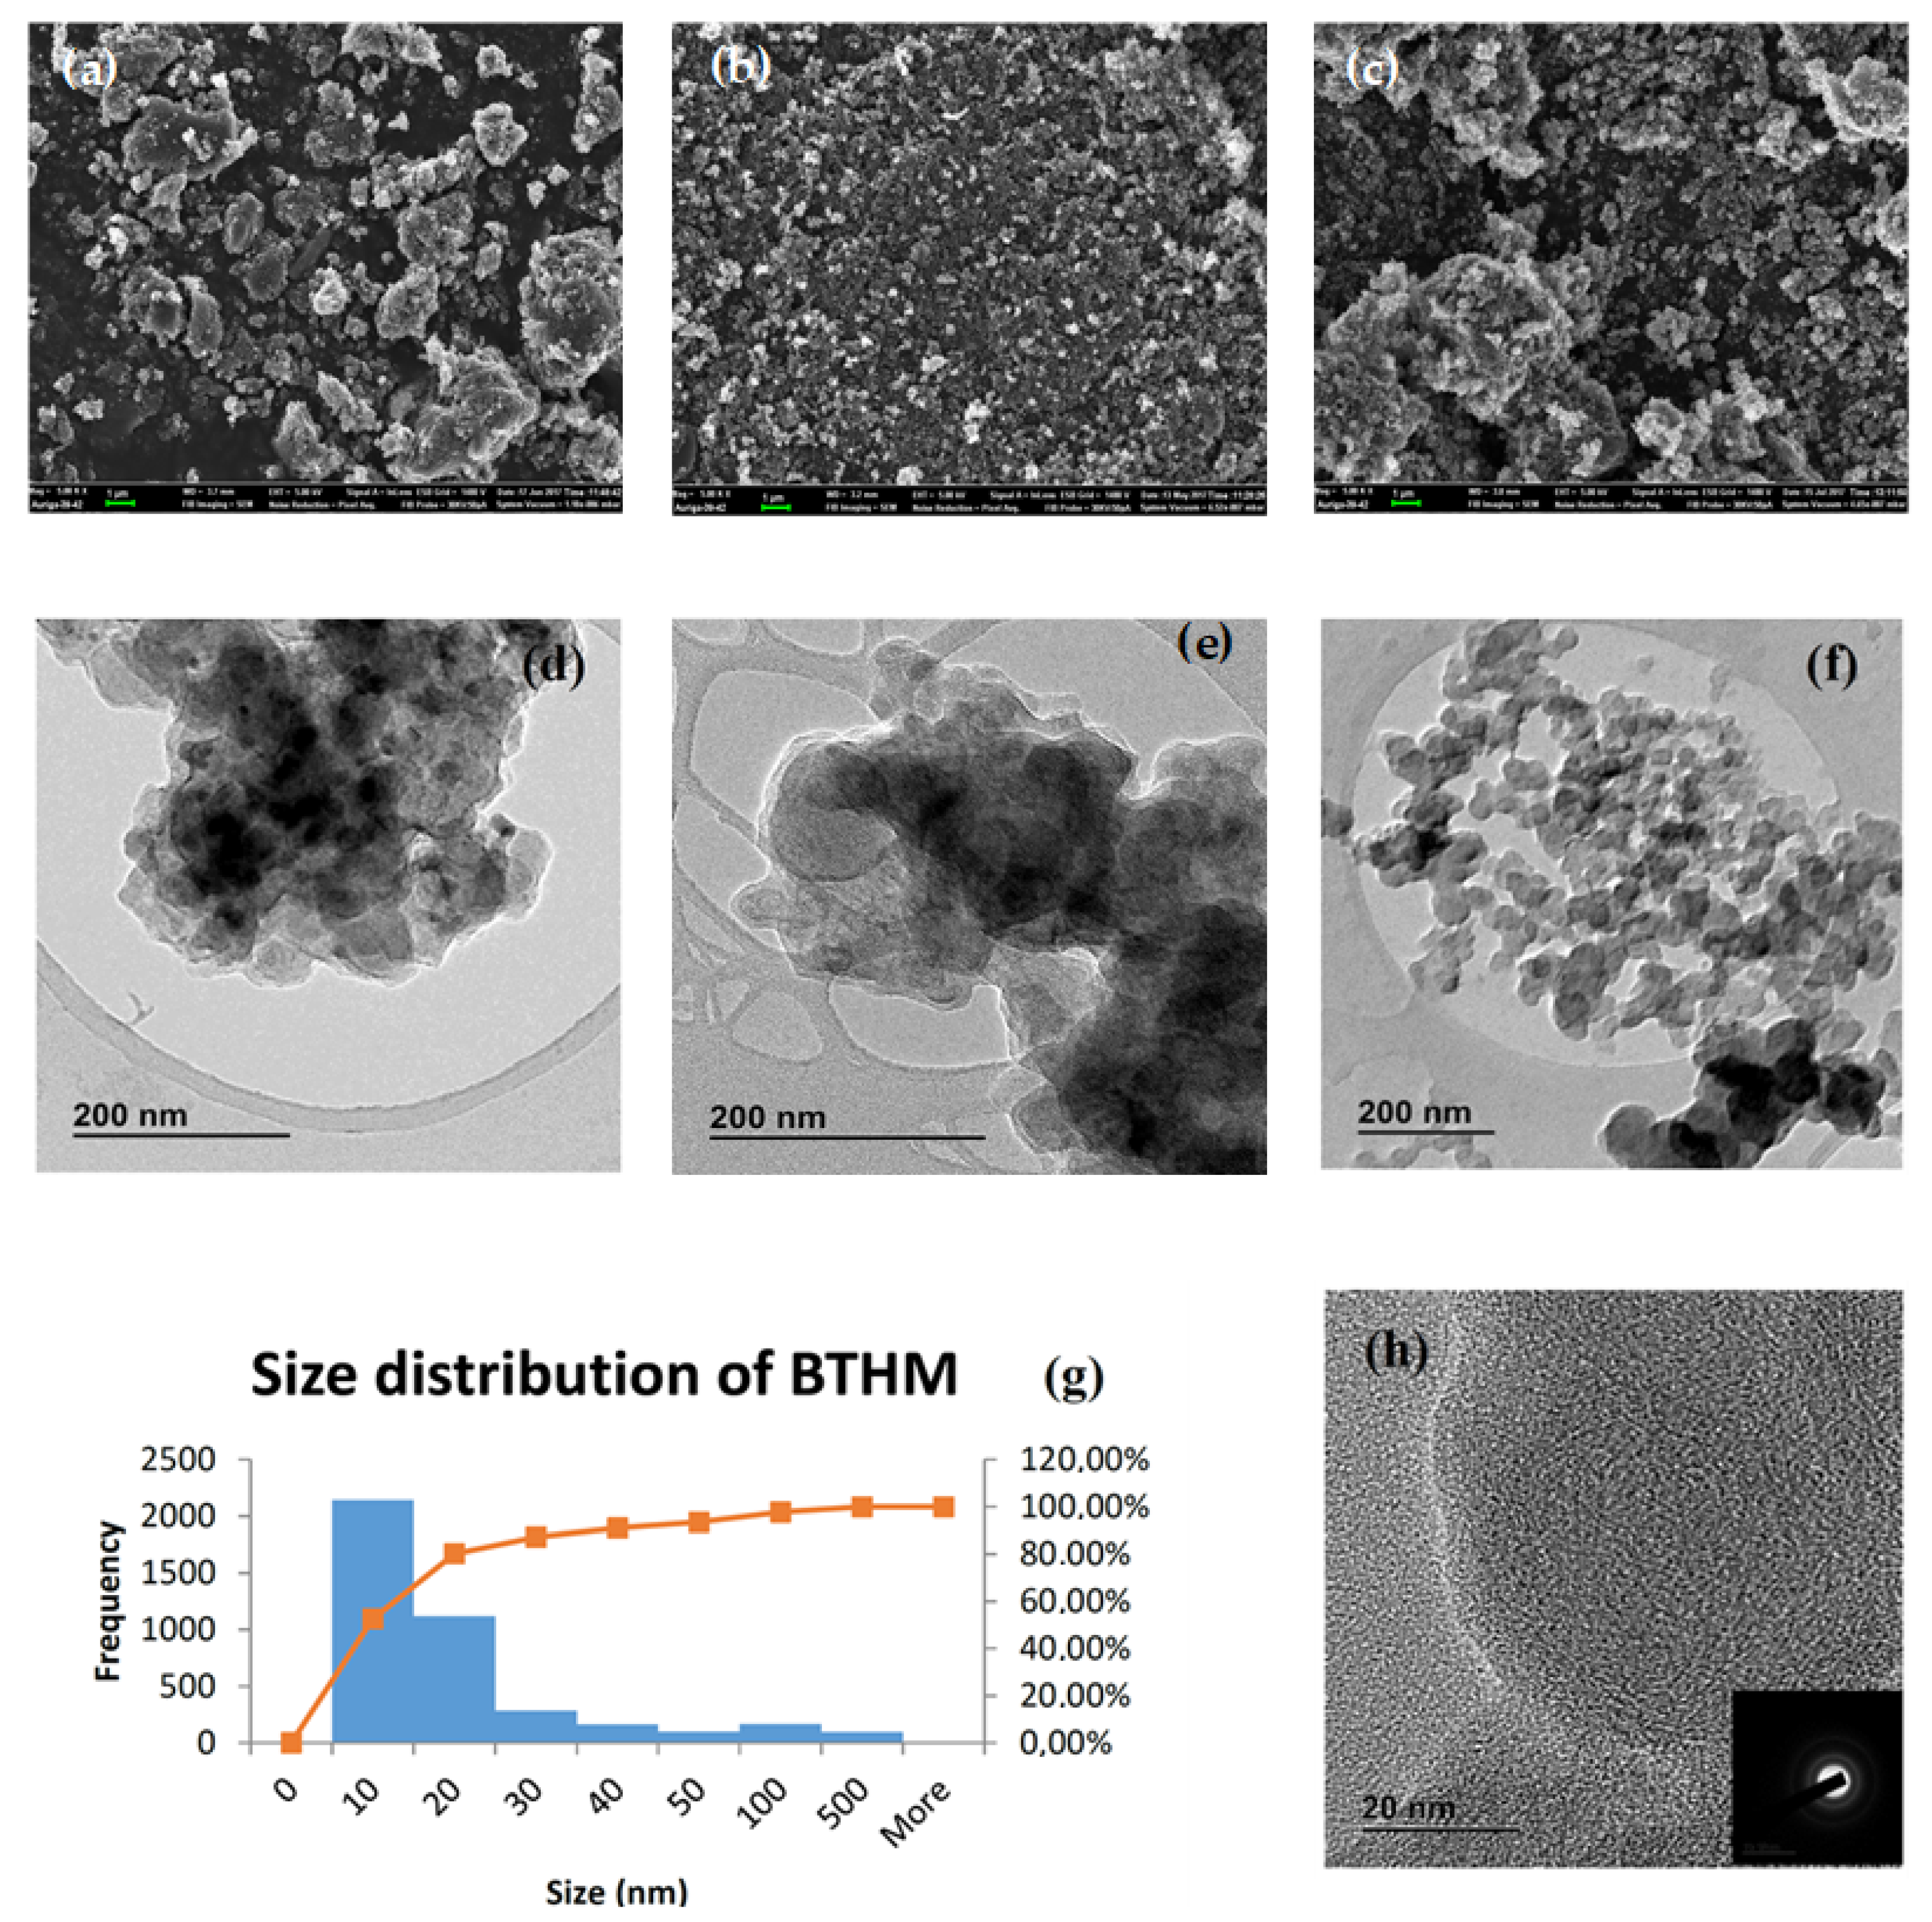
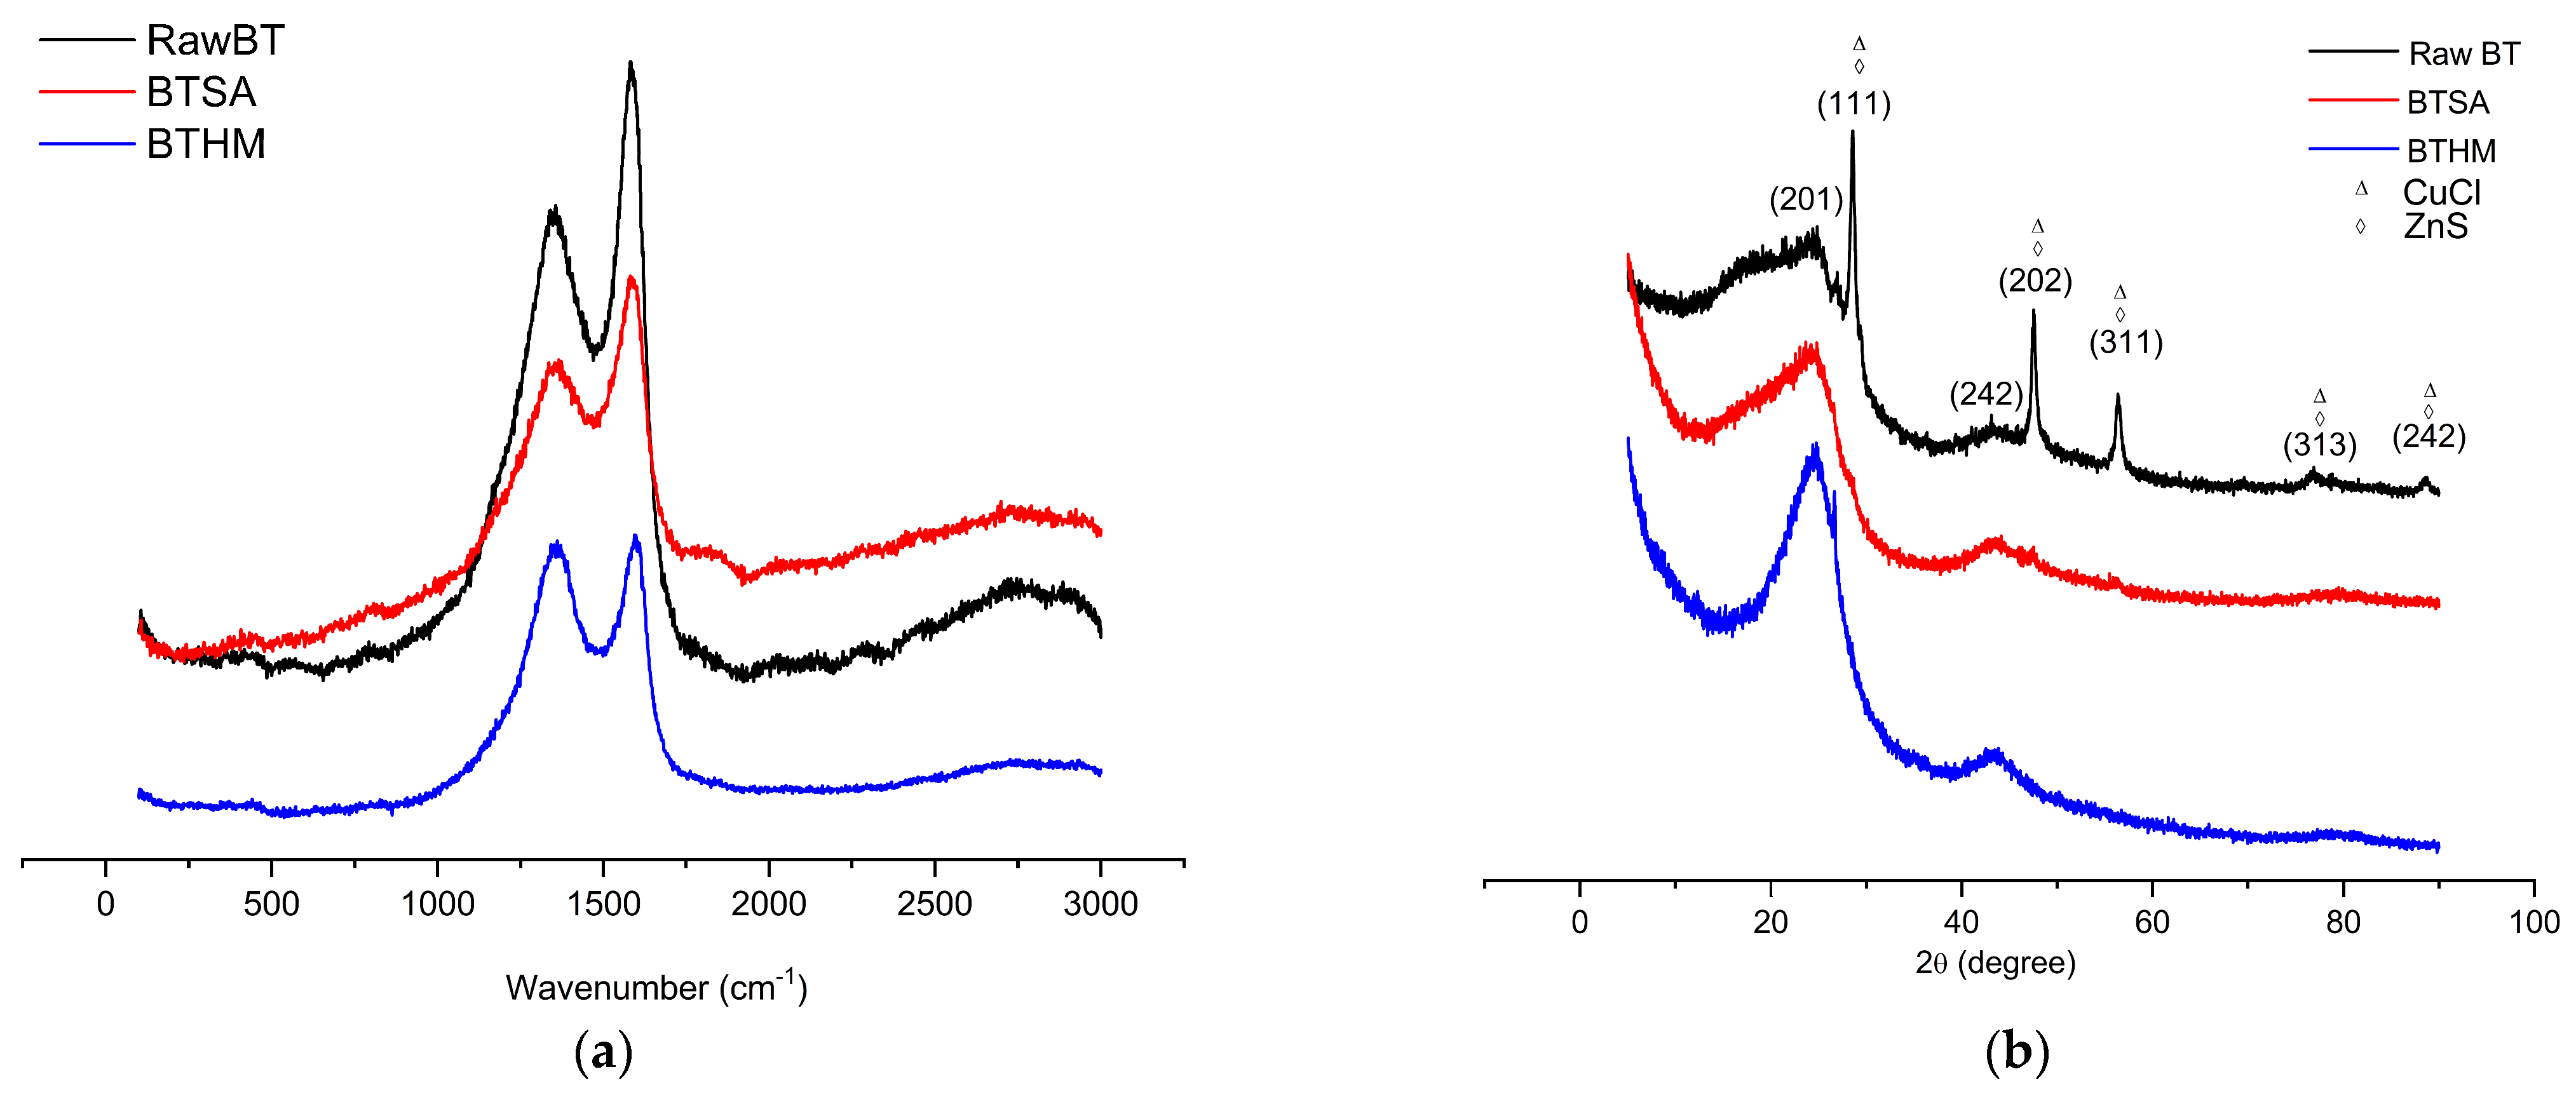
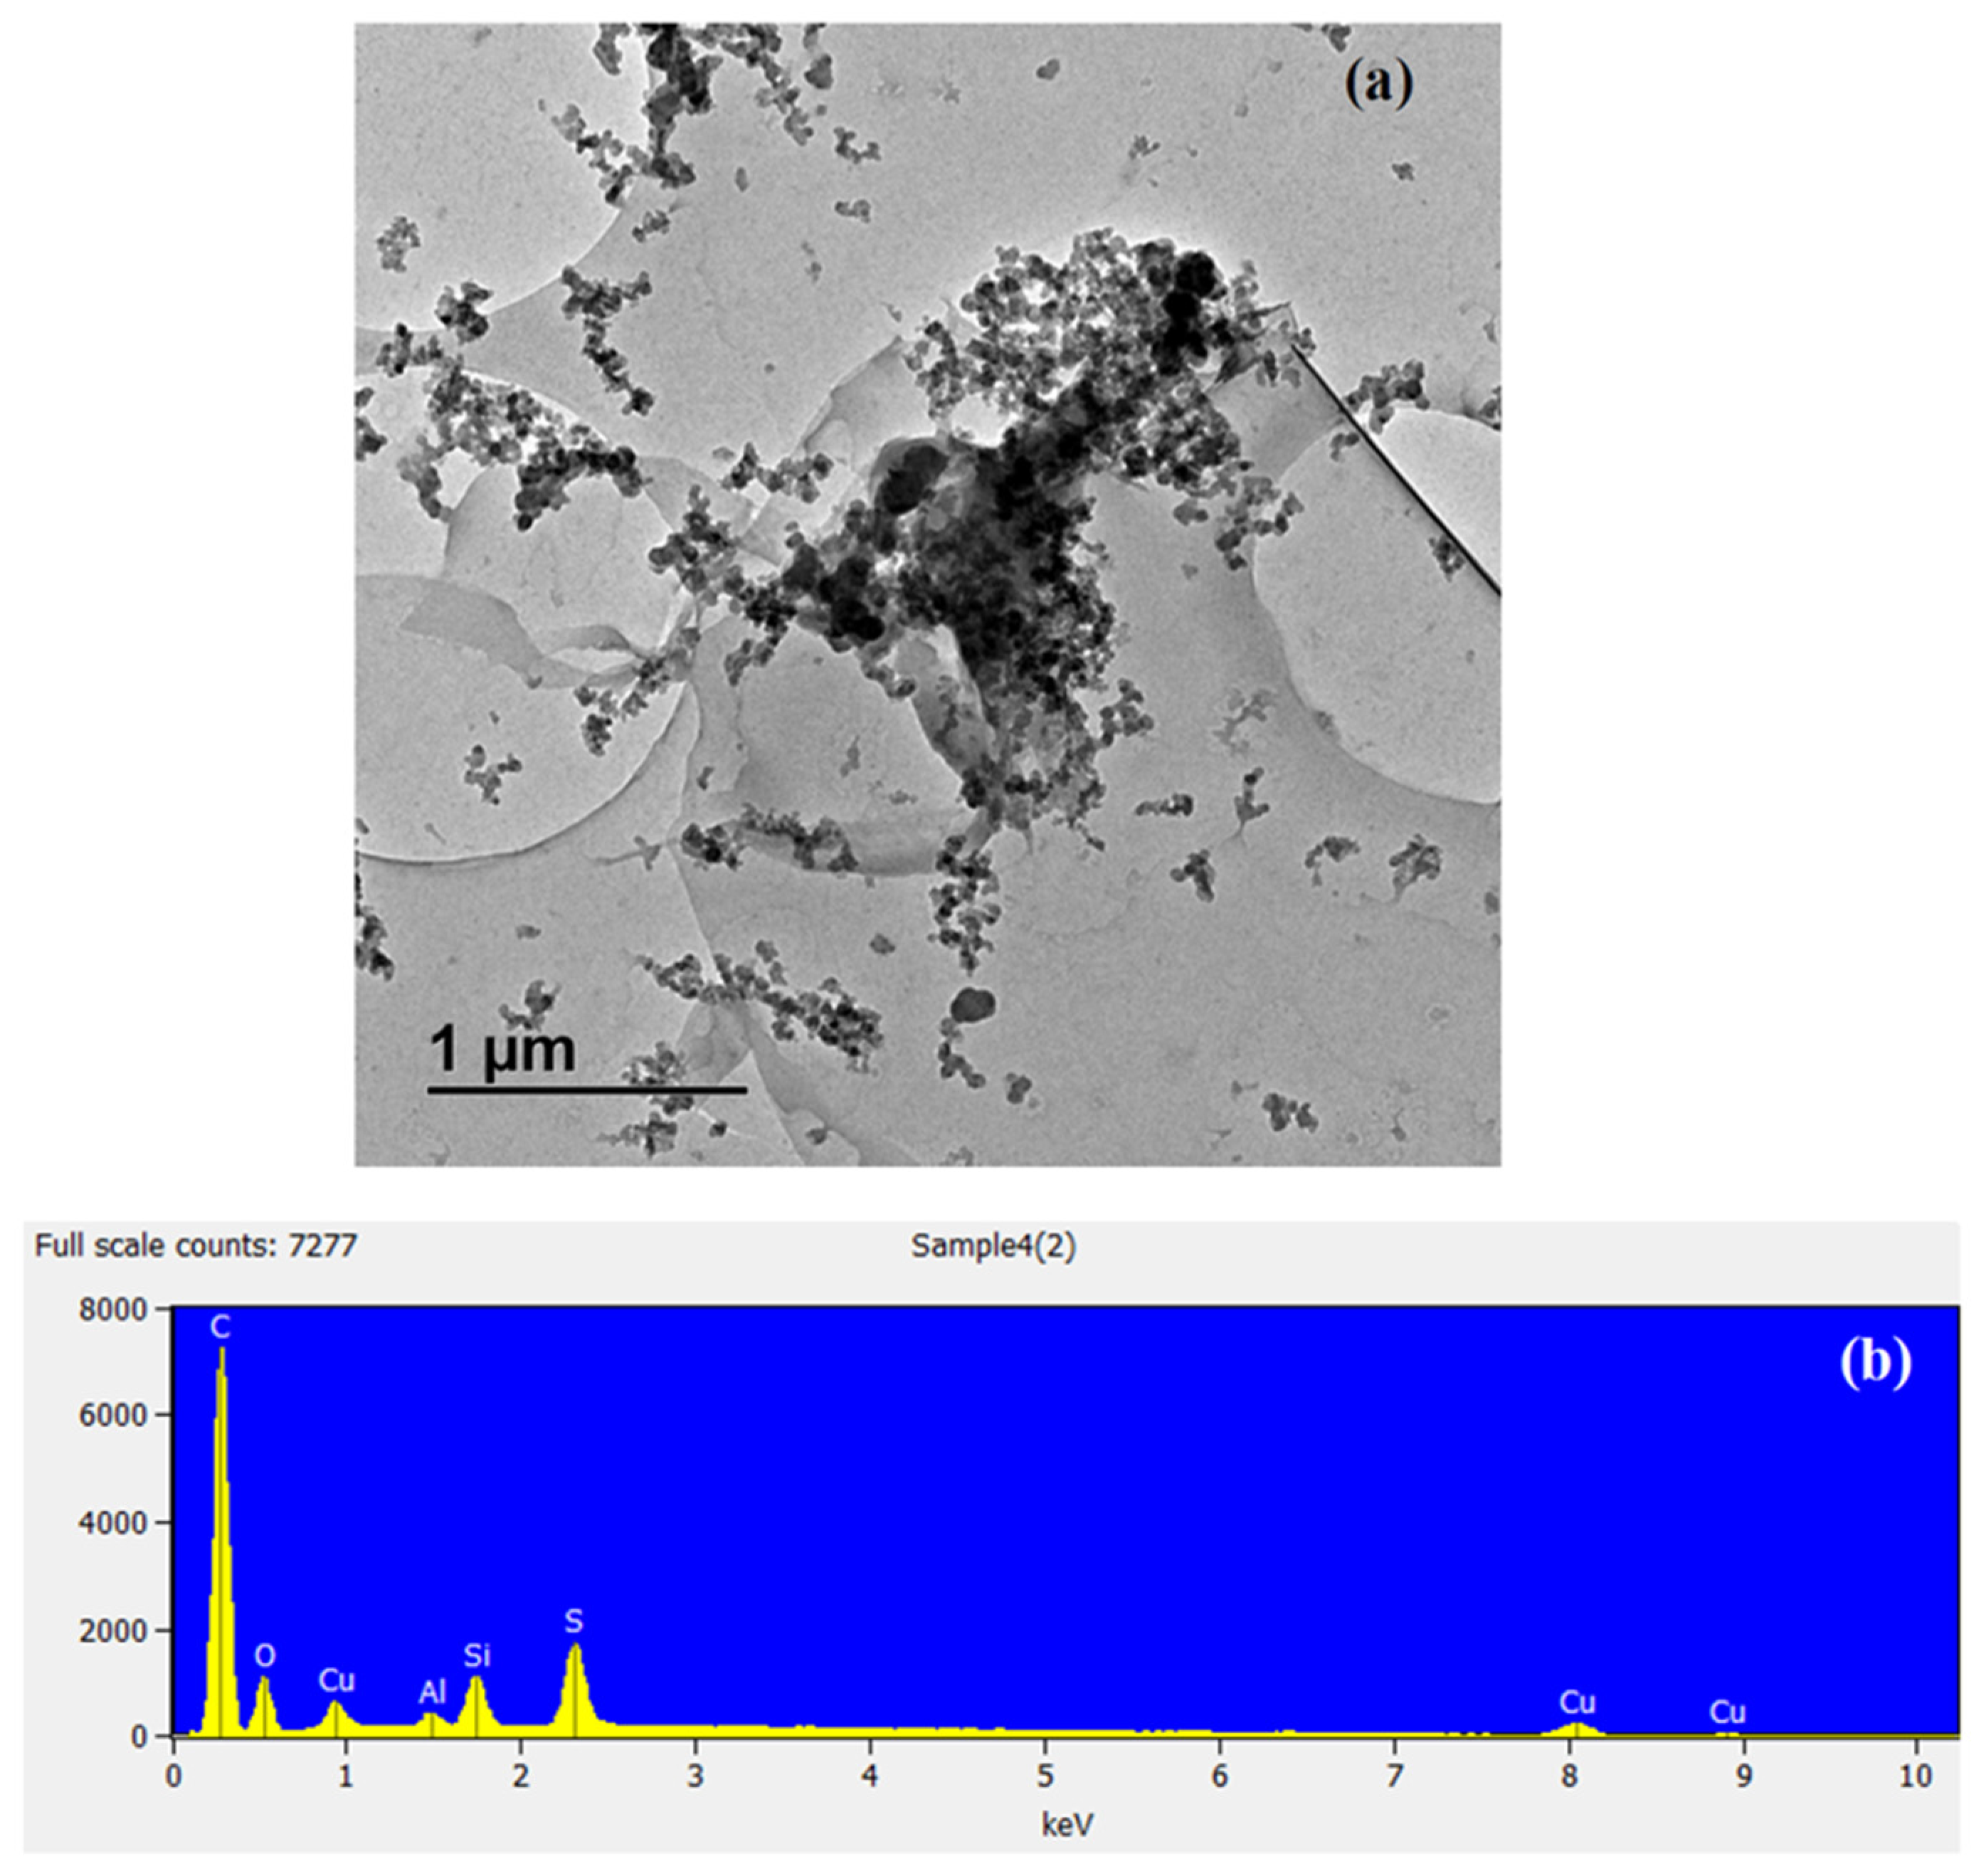
3.1. Characterisation of Carbonaceous Adsorbents before and after Adsorption

The SEM images of the raw burnt tyre material “raw BT” are shown in Figure 1a; it was carbonised at 100 °C using a strong acid to obtain clumps of AC, shown in Figure 1b, denoted as “BTSA”. The AC was then further oxidised using the modified Hummer’s method to produce amorphous, smooth and homogenous, nanostructured spheres, “BTHM”, shown in Figure 1c. The images shown in Figure 1d–f of all the materials depict the change from micro-size spheres of the BT to nanostructured spheres observed after the oxidation steps. The spheres were analysed to determine the average particle size and are graphically represented in a histogram in Figure 1g; an average particle size of 25.3 nm was calculated from the particle size distribution. The diffraction pattern in Figure 1h confirms the amorphous structure of the nanostructured spheres.
The characterisation using Raman spectroscopy shown in Figure 2a depicts the D band’s increasing intensity from raw BT to BTHM with each oxidation stage until it was equal to the G band, indicating an increase in graphitic nature. The active D- and G-bands from BTHM at ~1340 cm−1 and ~1590 cm−1, respectively, were due to the planar graphite. This is further indicative of the presence of sp2 hybridised carbons [32]. Illustrated in Figure 2b are the diffraction patterns using XRD for the materials. The Raw BT, BTSA, and BTHM included a prominent broad amorphous hump at 2θ ≈ 20° and a broad peak around 2θ ≈ 43°, which are indicative of the amorphous carbonaceous structure of the burnt tyre material [33,34]. In addition, the Raw BT XRD pattern included the characteristic XRD patterns for CuCl and ZnS, as identified using the built in database (obtained from the “Crystallography Open Database” (COD)) within the Match! Phase Analysis software published by Crystal Impact (Bonn, Germany). This is likely a result of the inherent heavy metal content of tyres [35]. However, these metals were likely leached out during the sulphuric acid treatment step in which BTSA was obtained.
The BET analysis is shown in Table 1. The materials all followed a trend of increasing surface area and pore volume after each oxidation synthetic step, while the pore diameters varied after oxidation. Shown in Table 1 is the analysis of the raw BT, with 5.49 m2/g, 0.035 cm3/g, and 25.55 nm, BTSA, with 19.88 m2/g, 0.088 cm3/g, and 17.77 nm, and BTHM with 71.08 m2/g, 0.380 cm3/g, and 21.42 nm surface area, pore volume, and pore diameter, respectively. This indicates the mesoporous nature of the adsorbent. Analyses of the FTIR before adsorption of the raw BT, BTSA, and BTHM are shown in Figure S1 (Supporting Information). BTSA and BTHM before adsorption show the C–O stretching vibration (1633–1705 cm−1), C–C from sp2 C–C bonds (1596–1633 cm−1), and C–O vibrations (1100–1144 cm−1) [36].
For characterisation before the adsorption of Cu, the XPS analysis, with the data illustrated in Figure 3, was conducted. The BTHM survey that scanned the spectrum before adsorption, shown in Figure 3a,b, displayed clear signals of C 1s and O 1s. Before adsorption, the high-resolution XPS spectrum, shown in Figure 3a, of C 1s, was deconvoluted to four peaks due to the different chemical states of the C atom. The characteristic peaks located at ~284.8, ~286.1, ~287.8, and ~289.9 eV are contributions by carbons in C−C, C=O, C−O, O−C=O, respectively. Figure 3b represents the O 1s spectrum prior to adsorption. This O 1s spectrum can be divided into four major peaks situated at ~530.7, ~531.6, ~532.4, ~533.4, and ~534.1 eV, which correspond to oxygen water, organic O−C=O, C=O, C−OH, C–O–C, and organic O, respectively.
To evaluate the thermal stability, the materials BTSA and BTHM were tested under an air atmosphere from room temperature to 800 °C, and the TGA curve is presented in Figure S2 (Supporting Information). A small fraction of weight was lost between 23 °C and 100 °C, which can be attributed to the removal of surface-adsorbed water from the materials. From 100 to 200 °C, there was no observable significant mass loss. The majority of the decomposition took place in the range of 200 to 800 °C, where there was primary carbonization which presented a considerably greater weight loss for both BTSA and BTHM, due to the elimination of large amounts of volatile matter. Both materials have significant thermal stability, which is a great property for adsorption applications.
After adsorption, the Cu2+ laden BTHM was characterised using XPS, SEM-EDS, and HR-TEM to visualise or quantify the presence of Cu in the material. The BTHM survey which scanned the spectrum after adsorption is shown in Figure 4. It displayed clear signals of C 1s, O 1s, and S 2p at 164, 284, and, 530 eV, respectively.
The high-resolution XPS spectrum of C 1s after adsorption is shown in Figure 4b. The characteristic peaks located at 284.8, 285.7, 287.4, and 288.8 eV are contributions by carbons in C−C, C=O, C−O, and O−C=O, respectively. After adsorption, the O 1s spectrum, shown in Figure 4c, can be divided into three major peaks situated at 530.7, 531.8, and 532.4 corresponding to oxygen O−C=O/C=O, O−H, and C–C–O, respectively. Finally, in Figure 4d, the high-resolution XPS spectrum with a binding energy of 368.2 eV, which corresponds to the Cu+ and Cu0 valence state of deposited Cu, respectively, is shown. The spin energy separation of 6.0 eV is representative of the ionic copper (Cu2+). The after adsorption characterisation of materials using HR-TEM and SEM-EDS is shown in Figure 5. The HR-TEM in Figure 5a shows the Cu particles in the carbonaceous structure of BTHM. In Figure 5b, the SEM-EDS of Cu@BTHM was determined to contain majority carbon and oxygen groups with some sulphur, aluminium, and silicon contaminants; however, most importantly, it confirms the incorporation of Cu into the adsorbent.

3.2. Batch Adsorption Studies

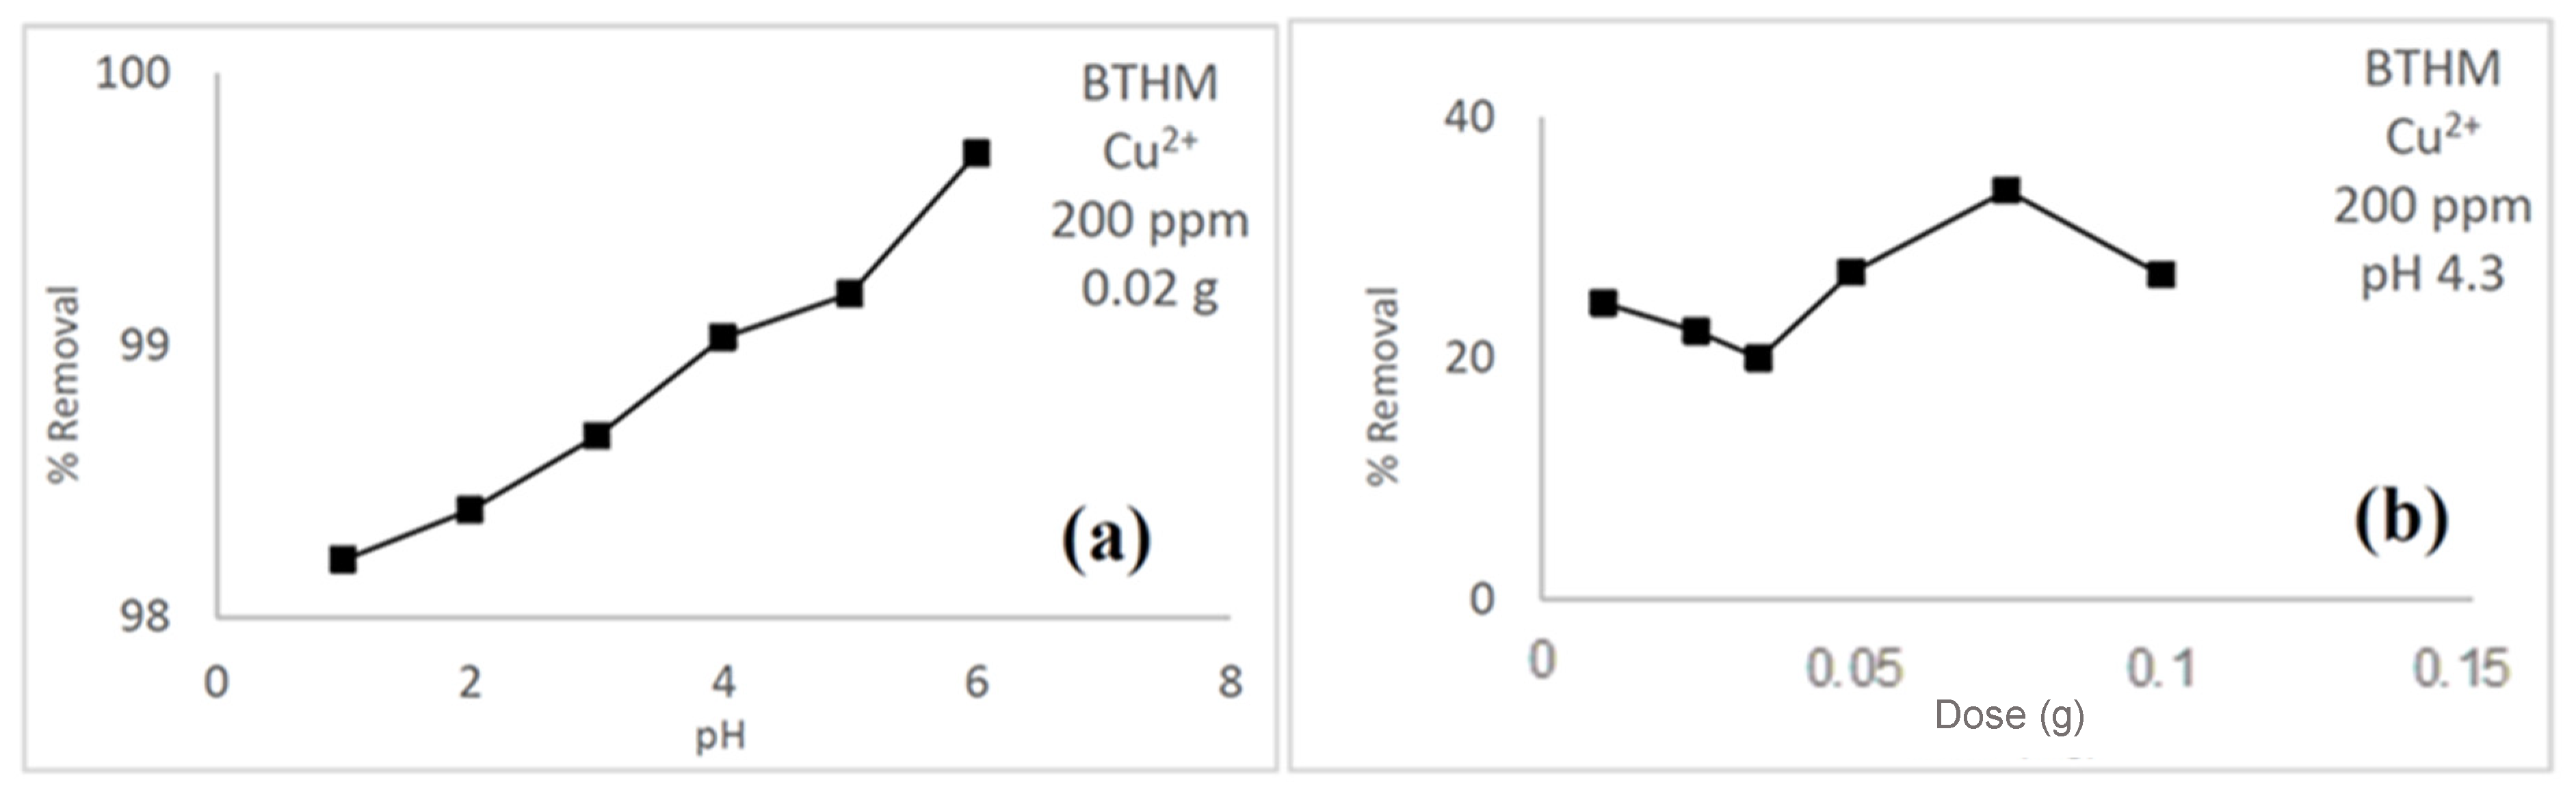
Effect of pH and Dosage

The pH where maximum adsorption occurs was investigated by varying the pH of the copper ion-containing solution from 1 to 8. The dose, initial concentration, and temperature were kept constant at 20 mg, 200 mg/L, and 25 °C, respectively. The pH studies determined that the optimum pH for maximum adsorption for BTHM was pH 6 at 25 °C, as shown in Figure 6a. The observed increase in adsorption in pH values above 6 is a result of precipitation that is known to occur to heavy metals in solutions such as Cu2+ ions at a higher pH where there is an increase in the concentrations of Cu(OH)+ and Cu(OH)2 as the pH of the solution increases. The amount of adsorbent for optimum adsorption of Cu2+ ions from solution was investigated. The ideal dosage of the adsorbent amount was between 10 and 100 mg, while the initial Cu2+ ions concentration was kept at 200 mg/L, at the solution pH of 4.3 at 25 °C. It was observed that the removal of the Cu2+ ions increases with an increase in adsorbent dosage for BTHM until 75 mg, and then the observed absorbance decreases. The optimum absorbance was determined to be 75 mg (Figure 6b). This can be explicated by the increase in active sites available at higher doses for the adsorbents to attach to.

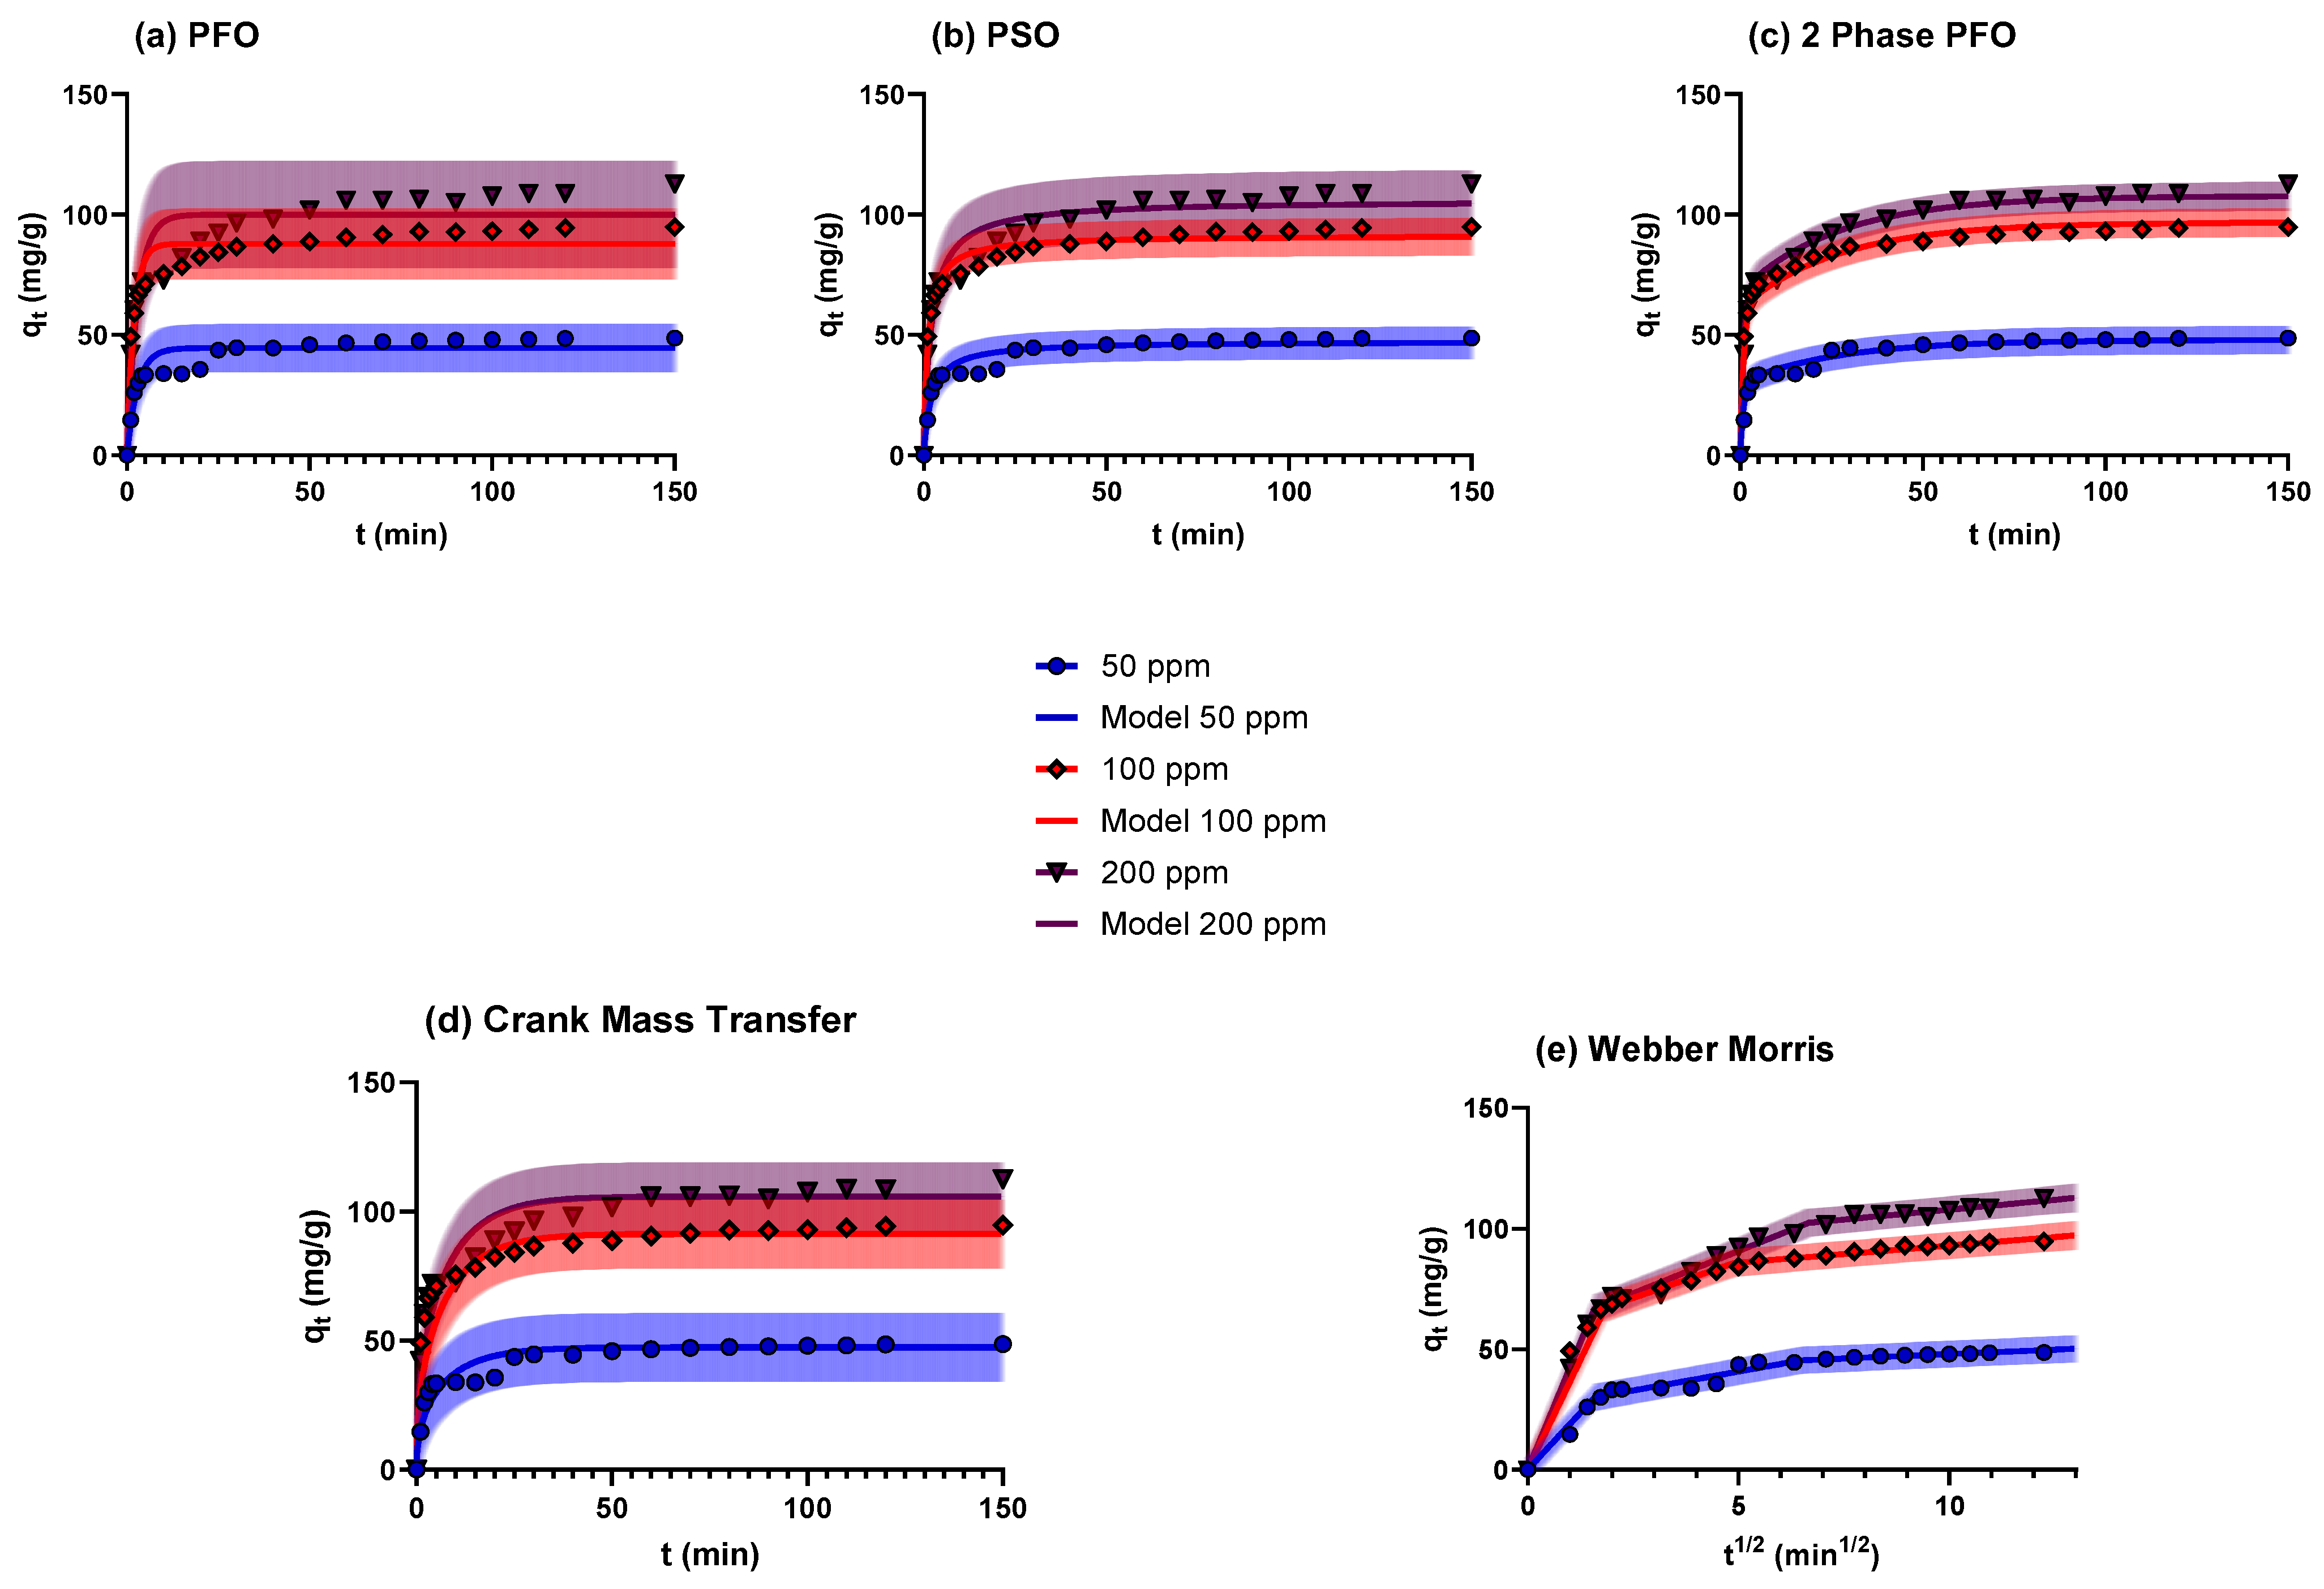
3.3. Adsorption Kinetics

The dynamic relationship between contact time and adsorbed Cu2+ ions at varying initial concentrations (50, 100, and 200 mg/L) at pH 6 and 25 °C was explored and is illustrated in Figure 7. The adsorbent amount was kept constant for BTHM as 1.5 g in 1 L solution. The adsorption kinetics were studied only at 25 °C. The pseudo-first-order (PFO) model is based on the adsorption of Cu2+ ions onto BTHM following the first-order mechanism [37], the pseudo-second-order (PSO) model, which is based on the solid adsorbent capacity being proportional to adsorbate Cu2+ ions in the solution [38], and the two-phase pseudo-first-order model (2 phase PFO), which assumes the parallel rapid and slow adsorption processes taking place on the surface of the adsorbent [28]. Figure 7a–c show the fits of the kinetic data to the pseudo-first-order, pseudo-second-order, and two-phase pseudo-first-order kinetic models for Cu2+ removal by BTHM, respectively. In addition, Figure 7 shows the 95% prediction bands for the fitted models. The 95% prediction bands provide the area within which there is a 95% probability of future observations [39]; therefore, the greater the prediction band, the less accurate the model.
The kinetic parameters obtained for the fittings are presented in Table 2. Table 2 shows that higher R2 values and lower Sy.x and RMSE values were obtained for the 2 phase PFO model than either the PFO or PSO models, suggesting that the former model fits the data better; his observation is mirrored in the size of the 95% predictions bands shown in Figure 7. These results indicate that the adsorption shows a two-phase behaviour in which the adsorption takes place as two parallel adsorption phenomena, one fast and one slow, likely as a result of heterogenous surface interactions with the adsorbate. In addition, the 2 phase PFO model parameters are independent of the adsorbate concentration, with the qe predicted by equilibrium conditions and constant values for ϕfast, k1,fast, and k1,slow. Therefore, this model could provide the basis for the design and scaling of the system to continuous operation [40].
Figure 7d and e show the resulting fits for the Crank and Webber and Morris models [27], respectively. The results from the fits are summarised in Table 2. From Figure 7d, it can be seen that a good fit can be obtained of the data exhibiting a relatively small 95% prediction interval—especially considering that a single parameter De was fitted for all three initial concentrations. Comparing the estimated De of 3.7 × 10⁻¹⁰ m2/s to the molecular diffusivity of Cu(II) ions in an aqueous solution at 25 °C–1.2 × 10⁻⁹ m2/s [41], it is clear that significant internal diffusional resistance is experienced by the Cu(II) ion as it diffuses to the adsorbent. This further results in the formation of thermodynamically stable structures due to the large time that Cu2+ must roam the surface of the adsorbents and attain minimum energy configuration before attaching to the growing island nuclei [42].
In Figure 7e, the first region is where the initial adsorption was observed to be fast and to interact with the boundary of the BTHM material. This was followed by a slower adsorption where the nanostructure pores took up more Cu2+, and then, finally, the third region equilibrium was reached. It is interesting that the same De was estimated for the initial phase of adsorption by the Webber and Morris model as for the Crank model.
Using a plot of ln Kc vs. 1/T, shown in Figure 8, the slope and intercept were ΔH° and ΔS°, respectively. The thermodynamic parameters are presented in Table 3. The analysis of the plotted data shows that the adsorption process was endothermic and spontaneous, due to the positive ΔH° value and increasingly negative value of ΔG° with temperature, respectively [43]. The positive value of ΔS° shows that there was an increase in disorder at the adsorbent and Cu solution interface throughout the adsorption process [44].

3.4. Equilibrium Adsorption Isotherm

The effect of an initial concentration of Cu2+ ions on the adsorbent capacity was determined at fixed doses for BTHM, including 75 mg at pH 6. These adsorption isotherm studies were carried out at three different temperatures: 25 °C, 35 °C, and 45 °C. The initial concentration for Cu2+ varied from 20 to 200 mg/L. The fits of the equilibrium isotherm data for Cu2+ removed by BTHM to the Langmuir and Freundlich models are presented in Figure 9.
The associated Langmuir and Freundlich isotherm parameters obtained for the fittings are presented in Table 4. The R2 values are higher and they Sy.x and RMSE values are lower for the Langmuir model fitting, suggesting that this model fits the data better than the Freundlich model. The Langmuir maximum adsorption capacity of BTHM for Cu2+, 136.1 mg/g (25 °C), is relatively high when compared to the other materials reported in the literature that were studied regarding Cu2+ adsorption, as shown in Table 5.

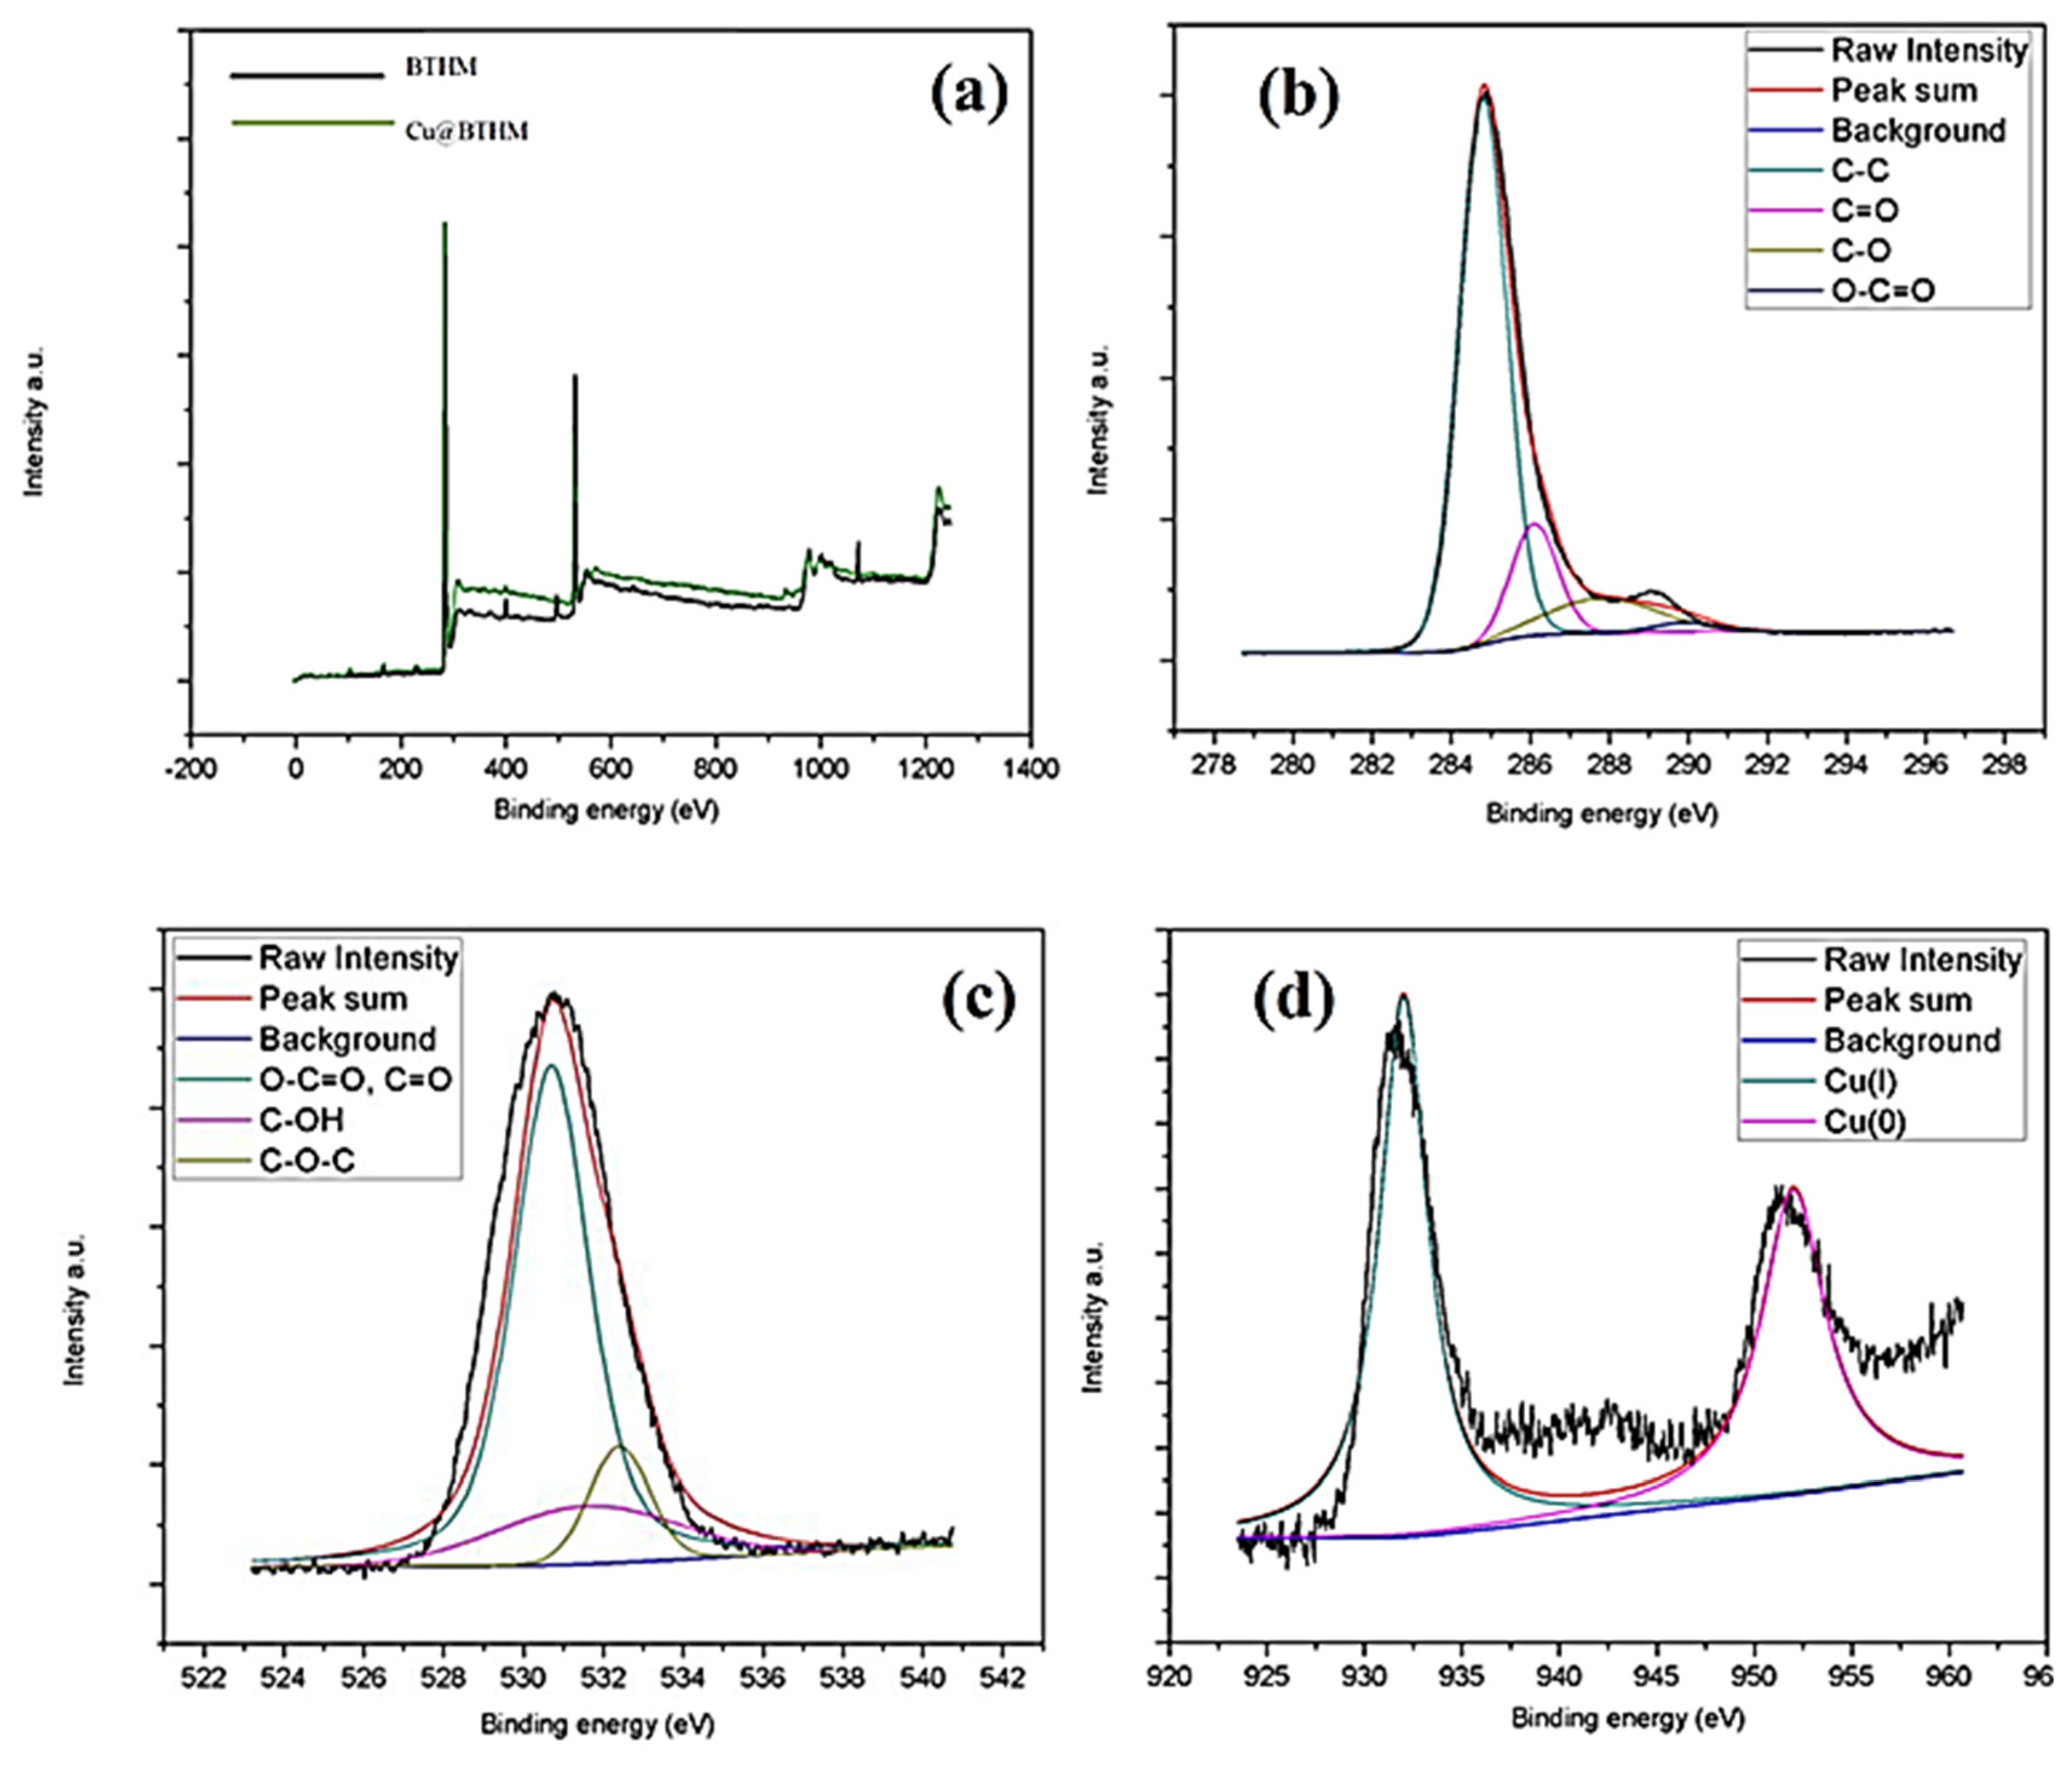
3.5. Adsorption Mechanism

The before and after adsorption FTIR and XPS results were used to determine a credible adsorption mechanism for BTHM. As discussed, the BTHM material analysed using pHpzc is negatively charged at isoelectric point of pH 4 and above; thus, the surface of the material at the selected optimum pH 6 is negative. The positively charged Cu2+ ions, therefore, have an opportunity for surface charge interaction. The high-resolution XPS spectra of various elements present in BTHM before adsorption (Figure 3) compared to the XPS spectra after adsorption (Figure 4) corroborate this proposed mechanism as the presence of a Cu energy peak in the survey scan of BTHM confirmed the successful adsorption of a Cu2+ ion onto the surface, along with the potential bonds indicated by the intensity and energy shift changes observed and discussed in the XPS spectra before and after adsorption.

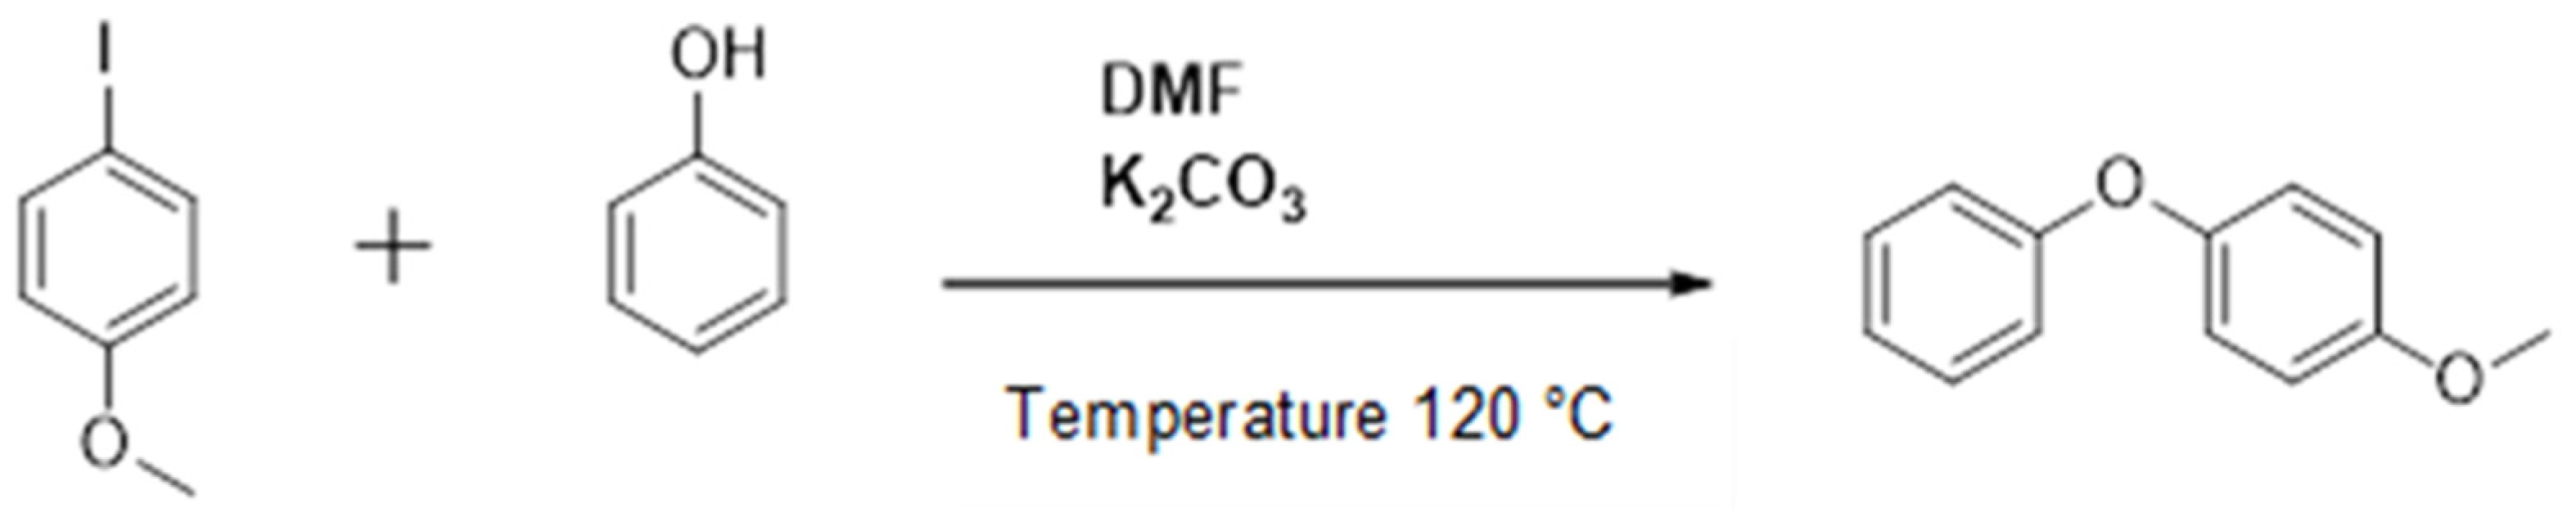
3.6. Catalysis: Coupling Reactions

Finally, the spent adsorbent was then used as a catalyst in the coupling reaction to evaluate its ability to produce valuable coupled organic compounds. The catalyst denoted Cu@BTHM was air-dried in the fume hood overnight and stored in a glass container. The formation of the desired products was monitored using thin-layer chromatography (TLC) and the compounds formed were analysed using NMR. Coupling reactions are critical in organic synthesis of various pharmaceutical, cosmetic, and other important compounds. The synthesised compound was analysed using NMR and the spectra are illustrated in Figure 10. 1H NMR dissolved in deuterated DMSO, Bruker 400 MHz, had peaks appearing at 7.54 (CH3O-Ar-C-H), 7.50 (CH3O-Ar-C-H), 7.0 (C-H), 6.70 (CH3O-Ar-C-H), 3.85 (CH3), and 0.8–1.5 (O-Ar-C-H). These results confirm the successful coupling of iodobenzene with a phenol (as predicted in Scheme 1).

4. Conclusions

The synthesis of the materials started with a low-cost carbon source, BT, which was then modified through a two-step synthesis. The synthesis resulted in the production of amorphous AC, BTSA, which was used as a precursor for the synthesis of oxidised BTHM. The materials were characterized using SEM, HR-TEM, XRD, and Raman and FTIR spectroscopy to determine their structure as well as chemical composition. The Raman active D- and G-bands at ~1340 cm−1 and ~1590 cm−1 from the planar graphite arising from sp3 hybridised carbons consist of defects and sp2 hybridized carbon, respectively. We observed an increase in intensity after each stage of synthesis, while the Raman shift remained the same. Each stage of modification changed the size, structure, and morphology of the material as well as functional groups available on the surface (active sites) of the materials. The raw and modified materials were then used in batch adsorption studies. The kinetic analysis of the Cu2+ adsorption to BTHM was found to exhibit two-phase pseudo-first-order behaviour (compartmentalized fast and slow adsorption) dominated by mass transfer to BTHM. It was further determined that BTHM exhibited increased adsorption capacity with the optimum pH at 6 with a 136.1 mg/g capacity. The application of carbonaceous materials for water treatment is, therefore, a promising venture and the modification of these materials and their capacity for Cu2+ removal from wastewater need to be studied. Furthermore, the catalytic ability of the materials to promote the synthesis of the coupling reaction, which is important in organic chemistry, will be studied and further catalytic studies will be conducted to evaluate the selectivity, sensitivity, and recyclability of the catalysts. The Cu@BTHM material’s catalytic ability was confirmed using coupling reactions where an iodobenzene was coupled with a phenol in a classic organic coupling reaction, which successfully yielded the coupled compound. This verified that the Cu-laden adsorbent is reusable as a catalyst and secondary waste generation can be avoided in this manner.

Supplementary Materials

The following supporting information can be downloaded at: https://www.mdpi.com/article/10.3390/min14030302/s1, Figure S1. FTIR before adsorption for Raw BT, BTSA and, BTHM; Figure S2. Thermogravimetric analysis of BTSA and BTHM.

Author Contributions

Conceptualization, I.C.A., K.P. and A.M.; methodology, I.C.A., M.B. and A.M.; software, I.C.A., H.G.B. and A.M.; validation, I.C.A., H.G.B., M.B., K.P. and A.M.; formal analysis, I.C.A., M.B., K.P., H.G.B. and A.M.; investigation, I.C.A. and A.M.; resources, A.M.; data curation, A.M.; writing—original draft preparation, I.C.A., K.P., H.G.B. and A.M.; writing—review and editing, H.G.B. and A.M.; visualization, I.C.A., H.G.B. and A.M.; supervision, A.M.; project administration, A.M.; funding acquisition, A.M. All authors have read and agreed to the published version of the manuscript.

Funding

This research received no external funding.

Data Availability Statement

The raw data supporting the conclusions of this article will be made available by the authors on request.

Conflicts of Interest

The authors declare no conflicts of interest.

References

  1. Afroze, Q. How Does Mining Affect the Environment. Available online: https://federalmetals.ca/how-does-copper-mining-affect-the-environment/ (accessed on 14 November 2023).
  2. Liu, Y.; Wang, H.; Cui, Y.; Chen, N. Removal of Copper Ions from Wastewater: A Review. Int. J. Environ. Res. Public Health 2023, 20, 3885. [Google Scholar] [CrossRef]
  3. Tchounwou, P.B.; Yedjou, C.G.; Patlolla, A.K.; Sutton, D.J. Heavy Metal Toxicity and the Environment. Exp. Suppl. 2012, 101, 133–164. [Google Scholar] [CrossRef] [PubMed]
  4. Singh, R.; Gautam, N.; Mishra, A.; Gupta, R. Heavy metals and living systems: An overview. Indian J. Pharmacol. 2011, 43, 246. [Google Scholar] [CrossRef] [PubMed]
  5. Dong, D.; van Oers, L.; Tukker, A.; van der Voet, E. Assessing the future environmental impacts of copper production in China: Implications of the energy transition. J. Clean. Prod. 2020, 274, 122825. [Google Scholar] [CrossRef]
  6. Xu, Y.; Weinberg, G.; Liu, X.; Timpe, O.; Schlögl, R.; Su, D.S. Nanoarchitecturing of Activated Carbon: Facile Strategy for Chemical Functionalization of the Surface of Activated Carbon. Adv. Funct. Mater. 2008, 18, 3613–3619. [Google Scholar] [CrossRef]
  7. Kobya, M.; Demirbas, E.; Senturk, E.; Ince, M. Adsorption of heavy metal ions from aqueous solutions by activated carbon prepared from apricot stone. Bioresour. Technol. 2005, 96, 1518–1521. [Google Scholar] [CrossRef]
  8. El Fakir, L.; Flayou, M.; Dahchour, A.; Sebbahi, S.; Kifani-Sahban, F.; El Hajjaji, S. Adsorptive removal of copper(II) from aqueous solutions on phosphates: Equilibrium, kinetics, and thermodynamics. Desalin. Water Treat. 2015, 43, 1–10. [Google Scholar] [CrossRef]
  9. Bobrowska, D.M.; Olejnik, P.; Echegoyen, L.; Plonska-Brzezinska, M.E. Onion-Like Carbon Nanostructures: An Overview of Bio-Applications. Curr. Med. Chem. 2019, 26, 6896–6914. [Google Scholar] [CrossRef]
  10. Ren, X.; Li, J.; Tan, X.; Wang, X. Comparative study of graphene oxide, activated carbon and carbon nanotubes as adsorbents for copper decontamination. Dalt. Trans. 2013, 42, 5266. [Google Scholar] [CrossRef]
  11. Deng, J.; You, Y.; Sahajwalla, V.; Joshi, R.K. Transforming waste into carbon-based nanomaterials. Carbon N. Y. 2016, 96, 105–115. [Google Scholar] [CrossRef]
  12. McDonough, J.K.; Gogotsi, Y. Carbon Onions: Synthesis and Electrochemical Applications. Interface Mag. 2013, 22, 61–66. [Google Scholar] [CrossRef]
  13. Eatemadi, A.; Daraee, H.; Karimkhanloo, H.; Kouhi, M.; Zarghami, N.; Akbarzadeh, A.; Abasi, M.; Hanifehpour, Y.; Joo, S.W. Carbon nanotubes: Properties, synthesis, purification, and medical applications. Nanoscale Res. Lett. 2014, 9, 393. [Google Scholar] [CrossRef] [PubMed]
  14. Zhang, B.-T.; Zheng, X.; Li, H.-F.; Lin, J.-M. Application of carbon-based nanomaterials in sample preparation: A review. Anal. Chim. Acta 2013, 784, 1–17. [Google Scholar] [CrossRef] [PubMed]
  15. Meng, X.; Deng, D. Trash to Treasure: Waste Eggshells Used as Reactor and Template for Synthesis of Co 9 S 8 Nanorod Arrays on Carbon Fibers for Energy Storage. Chem. Mater. 2016, 28, 3897–3904. [Google Scholar] [CrossRef]
  16. Akhavan, O.; Bijanzad, K.; Mirsepah, A. Synthesis of graphene from natural and industrial carbonaceous wastes. RSC Adv. 2014, 4, 20441. [Google Scholar] [CrossRef]
  17. Yang, X.; Wan, Y.; Zheng, Y.; He, F.; Yu, Z.; Huang, J.; Wang, H.; Ok, Y.S.; Jiang, Y.; Gao, B. Surface functional groups of carbon-based adsorbents and their roles in the removal of heavy metals from aqueous solutions: A critical review. Chem. Eng. J. 2019, 366, 608–621. [Google Scholar] [CrossRef]
  18. Akpor, O.B.; Muchie, M. Remediation of heavy metals in drinking water and wastewater treatment systems: Processes and applications. Int. J. Phys. Sci. 2010, 5, 1807–1817. [Google Scholar]
  19. Radetzki, M. Seven thousand years in the service of humanity—The history of copper, the red metal. Resour. Policy 2009, 34, 176–184. [Google Scholar] [CrossRef]
  20. Rao, H.; Fu, H. Copper-Catalyzed Coupling Reactions. Synlett 2011, 2011, 745–769. [Google Scholar] [CrossRef]
  21. Lokolkar, M.S.; Kolekar, Y.A.; Jagtap, P.A.; Bhanage, B.M. Cu-Catalyzed C-C Coupling Reactions. In Topics in Organometallic Chemistry; Springer: Cham, Switzerland, 2023; pp. 277–384. [Google Scholar]
  22. Colacot, T.J. (Ed.) New Trends in Cross Coupling; Royal Chemistry Society; Catalysis Series; Royal Society of Chemistry: Cambridge, UK, 2005; ISBN 978-1-84973-896-5. [Google Scholar]
  23. San Miguel, G.; Fowler, G.D.; Sollars, C.J. A study of the characteristics of activated carbons produced by steam and carbon dioxide activation of waste tyre rubber. Carbon N. Y. 2003, 41, 1009–1016. [Google Scholar] [CrossRef]
  24. Khatmi Maab, N.Z.; Shokuhfar, A.; Ahmadi, S. The effect of temperature and type of peroxide on graphene synthesized by improved Hummers’ method. Int. Nano Lett. 2016, 6, 211–214. [Google Scholar] [CrossRef]
  25. Moyo, M.; Chikazaza, L.; Nyamunda, B.C.; Guyo, U. Adsorption Batch Studies on the Removal of Pb(II) Using Maize Tassel Based Activated Carbon. J. Chem. 2013, 2013, 508934. [Google Scholar] [CrossRef]
  26. Paulchamy, B.; Arthi, G.; Lignesh, B.D. A Simple Approach to Stepwise Synthesis of Graphene Oxide Nanomaterial. J. Nanomed. Nanotechnol. 2015, 6, 1. [Google Scholar] [CrossRef]
  27. Largitte, L.; Pasquier, R. A review of the kinetics adsorption models and their application to the adsorption of lead by an activated carbon. Chem. Eng. Res. Des. 2016, 109, 495–504. [Google Scholar] [CrossRef]
  28. Wang, Z.; Zhao, J.; Song, L.; Mashayekhi, H.; Chefetz, B.; Xing, B. Adsorption and desorption of phenanthrene on carbon nanotubes in simulated gastrointestinal fluids. Environ. Sci. Technol. 2011, 45, 6018–6024. [Google Scholar] [CrossRef]
  29. Gupta, K.; Ghosh, U.C. Arsenic removal using hydrous nanostructure iron(III)–titanium(IV) binary mixed oxide from aqueous solution. J. Hazard. Mater. 2009, 161, 884–892. [Google Scholar] [CrossRef]
  30. Chung, H.-K.; Kim, W.-H.; Park, J.; Cho, J.; Jeong, T.-Y.; Park, P.-K. Application of Langmuir and Freundlich isotherms to predict adsorbate removal efficiency or required amount of adsorbent. J. Ind. Eng. Chem. 2015, 28, 241–246. [Google Scholar] [CrossRef]
  31. Islam, S.M.; Salam, N.; Mondal, P.; Roy, A.S.; Ghosh, K.; Tuhina, K. A highly active reusable polymer anchored copper catalyst for C-O, C-N and C-S cross coupling reactions. J. Mol. Catal. A Chem. 2014, 387, 7–19. [Google Scholar] [CrossRef]
  32. Jorio, A.; Ferreira, E.H.M.; Moutinho, M.V.O.; Stavale, F.; Achete, C.A.; Capaz, R.B. Measuring disorder in graphene with the G and D bands. Phys. Status Solidi 2010, 247, 2980–2982. [Google Scholar] [CrossRef]
  33. Danila, V.; Januševičius, T. Adsorption of aqueous Pb(II) using non-devulcanized and devulcanized tyre rubber powder: A comparative study. Environ. Sci. Pollut. Res. 2023, 1–17. [Google Scholar] [CrossRef] [PubMed]
  34. Lee, S.M.; Lee, S.H.; Roh, J.S. Analysis of activation process of carbon black based on structural parameters obtained by XRD analysis. Crystals 2021, 11, 153. [Google Scholar] [CrossRef]
  35. Jeong, H. Toxic metal concentrations and Cu–Zn–Pb isotopic compositions in tires. J. Anal. Sci. Technol. 2022, 13, 2. [Google Scholar] [CrossRef]
  36. Nandiyanto, A.B.D.; Oktiani, R.; Ragadhita, R. How to Read and Interpret FTIR Spectroscope of Organic Material. Indones. J. Sci. Technol. 2019, 4, 97–118. [Google Scholar] [CrossRef]
  37. Revellame, E.D.; Fortela, D.L.; Sharp, W.; Hernandez, R.; Zappi, M.E. Adsorption kinetic modeling using pseudo-first order and pseudo-second order rate laws: A review. Clean. Eng. Technol. 2020, 1, 100032. [Google Scholar] [CrossRef]
  38. Ho, Y.S.; McKay, G. Pseudo-second order model for sorption processes. Process Biochem. 1999, 34, 451–465. [Google Scholar] [CrossRef]
  39. Muedi, K.L.L.; Brink, H.G.G.; Masindi, V.; Maree, J.P.P. Effective removal of arsenate from wastewater using aluminium enriched ferric oxide-hydroxide recovered from authentic acid mine drainage. J. Hazard. Mater. 2021, 414, 125491. [Google Scholar] [CrossRef] [PubMed]
  40. Scott Fogler, H. Elements of Chemical Reaction Engineering, 4th ed.; Pearson Education Limited: London, UK, 2013; ISBN 0130473944. [Google Scholar]
  41. Ribeiro, A.C.; Esteso, M.A.; Lobo, V.M.; Valente, A.J.; Simoes, S.M.; Sobral, A.J.; Burrows, H.D. Diffusion coefficients of copper chloride in aqueous solutions at 298.15 K and 310.15 K. J. Chem. Eng. Data 2005, 50, 1986–1990. [Google Scholar] [CrossRef]
  42. Sick, T. Synthesis and Characterization of Nanoporous Covalent Organic Frameworks for Optoelectronic Applications. Ph.D. Dissertation, Faculty of Chemistry and Pharmacy, LMU, München, Germany, 2018. [Google Scholar] [CrossRef]
  43. Saha, P.; Chowdhury, S. Insight Into Adsorption Thermodynamics. In Thermodynamics; Mizutani, T., Ed.; InTech: London, UK, 2011. [Google Scholar]
  44. Kera, N.H.; Bhaumik, M.; Ballav, N.; Pillay, K.; Ray, S.S.; Maity, A. Selective removal of Cr(VI) from aqueous solution by polypyrrole/2,5-diaminobenzene sulfonic acid composite. J. Colloid Interface Sci. 2016, 476, 144–157. [Google Scholar] [CrossRef] [PubMed]
  45. Darweesh, M.A.; Elgendy, M.Y.; Ayad, M.I.; Ahmed, A.M.M.; Elsayed, N.M.K.; Hammad, W.A. Adsorption isotherm, kinetic, and optimization studies for copper (II) removal from aqueous solutions by banana leaves and derived activated carbon. S. Afr. J. Chem. Eng. 2022, 40, 10–20. [Google Scholar] [CrossRef]
  46. Sabela, M.I.; Kunene, K.; Kanchi, S.; Xhakaza, N.M.; Bathinapatla, A.; Mdluli, P.; Sharma, D.; Bisetty, K. Removal of copper (II) from wastewater using green vegetable waste derived activated carbon: An approach to equilibrium and kinetic study. Arab. J. Chem. 2019, 12, 4331–4339. [Google Scholar] [CrossRef]
  47. Bouhamed, F.; Elouear, Z.; Bouzid, J. Adsorptive removal of copper(II) from aqueous solutions on activated carbon prepared from Tunisian date stones: Equilibrium, kinetics and thermodynamics. J. Taiwan Inst. Chem. Eng. 2012, 43, 741–749. [Google Scholar] [CrossRef]
  48. Orozco, C.I.; Freire, M.S.; Gómez-Díaz, D.; González-Álvarez, J. Removal of copper from aqueous solutions by biosorption onto pine sawdust. Sustain. Chem. Pharm. 2023, 32, 101016. [Google Scholar] [CrossRef]
  49. Demiral, H.; Güngör, C. Adsorption of copper(II) from aqueous solutions on activated carbon prepared from grape bagasse. J. Clean. Prod. 2016, 124, 103–113. [Google Scholar] [CrossRef]
  50. Helleur, R.; Popovic, N.; Ikura, M.; Stanciulescu, M.; Liu, D. Characterization and potential applications of pyrolytic char from ablative pyrolysis of used tires. J. Anal. Appl. Pyrolysis 2001, 58–59, 813–824. [Google Scholar] [CrossRef]
  51. Arunachellan, I.C.; Sypu, V.S.; Kera, N.H.; Pillay, K.; Maity, A. Flower-like structures of carbonaceous nanomaterials obtained from biomass for the treatment of copper ion-containing water and their re-use in organic transformations. J. Environ. Chem. Eng. 2021, 9, 105242. [Google Scholar] [CrossRef]
  52. Chen, W.S.; Chen, Y.C.; Lee, C.H. Modified Activated Carbon for Copper Ion Removal from Aqueous Solution. Processes 2022, 10, 150. [Google Scholar] [CrossRef]
  53. Sulaiman, S.; Azis, R.S.; Ismail, I.; Man, H.C.; Yusof, K.F.M.; Abba, M.U.; Katibi, K.K. Adsorptive Removal of Copper(II) Ions from Aqueous Solution Using a Magnetite Nano-Adsorbent from Mill Scale Waste: Synthesis, Characterization, Adsorption and Kinetic Modelling Studies. Nanoscale Res. Lett. 2021, 16, 168. [Google Scholar] [CrossRef]
  54. Neisan, R.S.; Saady, N.M.C.; Bazan, C.; Zendehboudi, S.; Albayati, T.M. Adsorption of copper from water using TiO2-modified activated carbon derived from orange peels and date seeds: Response surface methodology optimization. Heliyon 2023, 9, e21420. [Google Scholar] [CrossRef]
Scheme 1. Cross coupling reaction of para-idoanisole and phenol.
Minerals 14 00302 sch001
Figure 1. SEM images of (a) raw BT, (b) BTSA, and (c) BTHM. (df) Show TEM of the adsorbents. (g) Size distribution of BTHM and (h) HR-TEM nanostructure with diffraction pattern inserted.
Minerals 14 00302 g001
Figure 2. (a) Raman shifts and (b) XRD patterns of all the materials.
Minerals 14 00302 g002
Figure 3. XPS of BTHM before adsorption showing (a) the C 1s peaks, (b) the O 1s peaks.
Minerals 14 00302 g003
Figure 4. XPS spectra after adsorption for Cu@BTHM and BTHM for (a) the survey scan, (b) the C 1s peaks, (c) the O 1s peaks and (d) the Cu 2p3/2 peaks.
Minerals 14 00302 g004
Figure 5. The images of (a) HR-TEM of Cu@BTHM and (b) SEM-EDS of Cu@BTHM.
Minerals 14 00302 g005
Figure 7. Graphical representation of the effect of contact time on Cu2+ adsorption by BTHM at 25 °C for different initial concentrations of Cu2+ ions and fits of kinetic data to the (a) pseudo-first-order (PFO), (b) pseudo-second-order (PSO), (c) 2 phase PFO, (d) Crank mass transfer and (e) Webber and Morris kinetic models.
Minerals 14 00302 g007
Figure 8. Thermodynamic plot of Cu2+ adsorption by BTHM.
Minerals 14 00302 g008
Figure 9. Adsorption equilibrium isotherms for Cu2+ adsorption by BTHM at different temperatures and fits of data to the Langmuir and Freundlich isotherm models.
Minerals 14 00302 g009
Figure 10. 1H NMR of synthesised coupling compound.
Minerals 14 00302 g010
Figure 6. (a) pH and (b) dose studies for BTHM.
Minerals 14 00302 g006
Table 1. BET analysis of Raw BT, BTSA, and BTHM.
Surface Area (m2/g)Pore Volume (cm3/g)Pore Diameter (nm)
Raw BT5.490.03525.55
BTSA19.880.08817.77
BTHM71.080.38021.42
Table 2. Kinetics model constants and goodness of fit values for Cu2+ adsorption of BTHM.
Kinetic ModelInitial Cu Concentration
50 mg/L100 mg/L200 mg/L
Pseudo-first-order
qe44.5587.8499.96
k10.34180.51510.3477
R20.87880.91050.8696
Absolute Sum of Squares392.7867.11999
Sy.x4.5466.75510.26
RMSE4.4316.5849.997
Pseudo-second-order
qe47.4091.42105.9
k20.0098260.0094870.004677
R20.94550.97500.9504
Absolute Sum of Squares176.6242.4760.3
Sy.x3.0493.5726.326
RMSE2.9713.4816.166
Two-phase pseudo-first-order
qe47.8996.74107.7
ϕfast0.6319
k1,fast1.078
k1,slow0.03732
R20.9922
Absolute Sum of Squares439.3
Sy.x2.776
RMSE2.662
Crank mass transfer
Qmax47.4091.42105.9
De3.7 × 10−10
R20.9264
Absolute Sum of Squares1365
Sy.x6.531
RMSE6.531
Webber and Morris
De13.70 × 10−10
De26.15 × 10−11
De31.43 × 10−11
R20.9934
Absolute Sum of Squares368.2
Sy.x2.587
RMSE2.437
Units: qe: mg/g, k1, k1,fast, k1,slow: 1/min, k2: g/mg.min, De, De1, De2, De3: m2/s.
Table 3. Thermodynamic parameter estimation for Cu2+ adsorption on BTHM.
Temperature (°C)ΔG°ΔH°ΔS°
25−0.951758.1616790.030567
35−1.25742
45−1.56308
Units: ΔGo: kJ/mol, ΔH°: kJ/mol, ΔS°: kJ/mol.K.
Table 4. Langmuir and Freundlich isotherm constants for Cu2+ removal by BTHM.
Isotherm ModelTemperature
25 °C35 °C45 °C
Langmuir
Best-fit values
qm136.1143.9149.5
b0.077440.076930.09670
Std. Error
qm15.9817.3915.86
b0.030720.030680.03495
Goodness of Fit
R20.89230.89260.9067
Absolute Sum of Squares783.8880.6856.3
Sy.x14.0014.8414.63
Freundlich
Best-fit values
KF30.3831.1236.22
N3.2973.2083.391
Std. Error
KF12.0812.1812.89
N1.0881.0231.061
R20.75500.76780.7713
Absolute Sum of Squares178419052098
Sy.x21.1221.8222.90
R20.75500.76780.7713
Units: qm: mg/g, b: L/mg, KF: ((mg.g−1)(mg.L−1)−1/n).
Table 5. Comparison of the qmax values for Cu removal by waste-derived activated carbon (AC) and modified activated carbon (MAC)-based adsorbents.
Adsorbentsqmax (mg/g)Ref
Banana leave AC66.2[45]
Green vegetable AC 75.0[46]
Date stone AC31.3[47]
Sawdust AC2.23[48]
Grape bagasse AC43.5[49]
Used tire AC20.0[50]
Dried tree fibre MAC80.2[51]
Waste wood MAC84.5[52]
Mill Waste MAC4.4[53]
Orange Peels, TiO2 MAC14.0[54]
BTHM136.1Current study
Disclaimer/Publisher’s Note: The statements, opinions and data contained in all publications are solely those of the individual author(s) and contributor(s) and not of MDPI and/or the editor(s). MDPI and/or the editor(s) disclaim responsibility for any injury to people or property resulting from any ideas, methods, instructions or products referred to in the content.

