Article

Raman–Infrared Spectral Correlation of an Artificially Space-Weathered Carbonaceous Chondrite Meteorite

1
Institute for Geological and Geochemical Research, Research Centre for Astronomy and Earth Sciences, HUN-REN, 1112 Budapest, Hungary
2
MTA Centre of Excellence Budapest, Research Centre for Astronomy and Earth Sciences, Konkoly Thege Miklós út 15-17, 1121 Budapest, Hungary
3
Institute for Nuclear Research Debrecen, HUN-REN, 4016 Debrecen, Hungary
4
Geographical Institute, Research Centre for Astronomy and Earth Sciences, HUN-REN, 1112 Budapest, Hungary
5
Konkoly Thege Miklos Astronomical Institute, Research Centre for Astronomy and Earth Sciences, HUN-REN, 1121 Budapest, Hungary
6
Department of Petrology and Geochemistry, Eotvos Lorand University of Sciences (ELTE), 1117 Budapest, Hungary
*
Authors to whom correspondence should be addressed.
Minerals 2024, 14(3), 288; https://doi.org/10.3390/min14030288
Submission received: 12 January 2024 / Revised: 26 February 2024 / Accepted: 2 March 2024 / Published: 9 March 2024

Abstract

:
Raman and infrared measurements of the same locations were conducted on a northwest African (NWA) 10580 CO3 meteorite sample, before and after three proton irradiations (1 keV ion energy using 1011, 1014, and 1017 ion/cm2 fluent values), to simulate space weathering effects. In the case of Raman spectroscopy, both FWHM and peak positions of the major olivine and pyroxene bands changed after the irradiation, and the minor bands disappeared. In the FTIR spectra, the minor bands of olivine and pyroxene also disappeared; meanwhile, major IR bands of pyroxene remained visible, demonstrating both positive and negative peak shifts, and the olivines were characterised only by negative peak shifts. The olivines were characterised by negative FWHM changes for major bands, but positive FWHM changes for minor bands. The pyroxenes were characterised by elevated FWHM changes for minor bands after the irradiation. The disappearance of minor bands both of IR and Raman spectra indicates the amorphization of minerals. The negative peak shift in IR spectra indicates Mg loss for olivine and pyroxene, in agreement with the literature. The Raman spectra are characterised by positive peak shift and positive FWHM changes; the IR spectra are characterised by a negative peak shift. The Mg loss, which was detected by negative peak shifts of FTIR bands, may be caused by distortion of the crystal structure, which could be detected by a positive peak shift in Raman spectra. This joint observation and interpretation has not been formulated in the literature, but indicates further possibilities in the confirmation of mineral changes by different instruments. Shock alteration-based observations by other researchers could be used as a reference for irradiation experiments as irradiation makes a similar structural alteration, like a low-grade shock metamorphism.

1. Introduction

Space weathering [1,2] influences the surface mineralogy of asteroids, diminishing the fingerprints of minerals in their spectra [3], making it difficult to link meteorite groups to specific asteroids [4,5]. The surfaces of airless bodies are influenced by irradiation, implantation, and the sputtering process of galactic and solar energetic particles (mainly protons and alpha particles) as well as UV irradiation, impacts, and daily temperature fluctuations. Lots of information on space weathering comes from the Moon [6,7,8], where collected samples have highlighted the important role of nanophase iron [9], while recent asteroid sample return missions also improved our understanding on space weathering; for example, on Itokawa [10,11], with further data on nanophase iron, a range of oxidation states [12], and amorphous/Si enrichment [11]. Space weathering modifies the appearance, mineral structure, and composition of asteroid surfaces with mechanical fracturing, melting, and ablation, destroying the crystalline lattice, producing amorphization, and ion implantation. A candidate parent body of ordinary chondrite meteorites, Eros’s surface was found to be depleted in sulphur [13] by space weathering, while solar wind H implantation altered the spectral slope of ordinary chondrites [14].
Our aim is to identify and understand the consequences of artificial solar wind simulating proton irradiation on the NWA 10580 CO3 chondrite meteorite, jointly evaluating infrared and Raman measurements. This is an accessible meteorite with substantial mass located at the authors’ repository home laboratory (to allow further tests in the future, improved using the first results), also being a frequently occurring, primitive, and poorly modified meteorite. Beyond the scientific aim, the survey of the observability of different bands with different spectral resolutions also aimed to see what observational capabilities are needed for an infrared detector onboard a future asteroid mission, to identify the space-weathering-related consequences.

Space Weathering Effects

Solar wind energies strongly influence the consequences of space weathering, and besides the energy level of ions, the total dose witnessed by the target also matters. The so-called fluence values are representative for solar wind exposure time-scales (e.g., [1,15,16,17,18,19]). As the time-scales of laboratory tests are substantially smaller than real-life exposure durations, so larger doses and stronger irradiations are used to counterbalance this aspect. The intensity of irradiation is characterized by various units: total fluence—the total number of ions per surface area deposited during the whole test; the total amount of energy deposited during the whole test; and the dose—the number of ions with a certain energy during a given period over a given area. The infrared and Raman spectral curves recorded before and after irradiation tests indicated modifications from mineral changes by a given level of irradiation, which are discussed and overviewed in this work.
Earlier experiments with irradiation tests are summarized below. Separated sample units were measured with Raman spectroscopy (e.g., olivine decreasing from Fo = 70–80 before the irradiation to Fo = 50–60—[1], polystyrol, and olivine [20,21]). Lantz et al. 2017 [1] noticed the amorphization of the silicates as seen on the Lance meteorite: the olivine peaks at about 820 and 850 cm−1 almost disappeared after irradiation in the Raman spectrum. This doublet is the dominant feature of the olivine Raman spectrum that arises from coupled symmetric and asymmetric stretching vibrational modes of the SiO4 tetrahedra [22]. These modes could be efficiently observed under Raman spectroscopy with an olivine crystalline structure, while they exhibited an amorphous structure and modified peaks after heavy irradiation. The authors of [1,17] studied the Raman spectra olivine of Tagish Lake, Murchison, and the Lance meteorite. They observed the complete disappearance of the major doublet at around 820 and 850 cm−1 at high fluences. Lazzarin et al. [19] observed not only the disappearance of the major doublet of olivine in the Allende meteorite, but also the merging to a single band at 1040 cm−1. The spectral shift of the IR and Raman bands could be due to the loss of Mg by preferential sputtering compared to the heavier Fe [23], leading toward amorphization ([24,25]). The change in the Fe/Mg ratio by Mg loss in the crystalline lattice of pyroxene and olivine was also observed by [26]. According to [27], the positive peak shift of olivine by irradiation indicates the modification of SiO4 tetrahedra to SiO2 in a metastable phase of olivine. For pyroxene, a negative trend (decreasing values) of band positions was observed as Mg loss from after the irradiation [1].
It is also worth mentioning that besides the charged particle irradiation, other methods have also been used to simulate space weathering processes, including micrometeorite bombardment mimicking microsecond pulse lasers (supporting amorphization, microscale melting, and volatile release, [28,29,30,31]) and ultraviolet irradiation (also causing amorphization and volatile release [20,32]), however far fewer tests have analysed the effect of temperature fluctuation (producing mechanical failures [33]).

2. Methods

During this work, the same locations of the analysed meteorite were surveyed before and after the irradiation to see the gradual change in spectra and related mineral properties. All these observations were realized both with Raman and infrared methods. The FTIR measuring areas were marked by small letters and numbers “a, b, c, d”, the Raman measuring areas were marked by capital R letters with the numbers R1, R2, R3, and R4. These are described in detail in Table 1 and Table 2 in columns 1–2 separately (names for the “IR area” and “Raman area” were given separately). The increase and decrease in peak shift is mentioned in cm−1.
For infrared spectroscopy and microscopy, a Vertex 70 FTIR spectrometer (Bruker, Billerica, MA, USA), equipped with a Hyperion 2000 microscope, was used with 15× IR objective in reflection mode. The measurements were completed with 32 scans for every location, in the 400–4000 cm−1 range. All measurements were performed for 30 s at 4 cm−1 spectral resolution. Bruker Optics’ Opus 5.5. software (Bruker, Billerica, MA, USA) was used for manipulation of the gained spectra (e.g., baseline correction, atmospheric compensation, etc.). The maximal absorbance (or IR intensity or IR maximal intensity) used in this work refers to the measurement at the position in wavenumber of the strongest v1 SiO4 vibration, with polished surface gold standards applied. The field of view using the IR 15x objective was 200 µm in diameter, and this method is applicable for the polished rock sample.
Raman spectroscopy was utilized by a Morphologi G3-ID instrument produced by Malvern Instruments [34]. The Raman spectra were used for monitoring the change in mineralogical characteristics, like identification of minerals and determination of amorphization after the irradiation. The equipment, provided by Kaiser Optical Systems Inc. (Ann Arbor, MI, USA) was a Raman Rxn1 Spectrometer (laser at 785 nm wavelength, using exposure time of 30 s at 10 mW laser power), while the size of the laser spot was 3 μm at 50× magnification. The spectral resolution was 4 cm−1, the focal depth 1.82 μm. For the identification of Raman spectra, Bio-Rad’s KnowItAll ID Expert software (KnowItAll, Austin, TX, USA) and Morphologi software (Malvern Panalytical, Malvern, UK) were used. Comparative spectra of the minerals were imported from the RRUFF database [35].
During the measurements, two values were determined: peak position and full width at half maximum (FWHM). FWHM values were calculated by measuring the width of bands at their half height manually. The accuracy of the peak position measurements was ±0.5 cm−1 based on the experience of the operator and the OPUS software manual (OPUS). Peak shifts were described where the given bands appeared before and after irradiation, and the change in maximal position was measured. The observed bands in the 600–900 cm−1 range were Reststrahlen features, while Christiansen features were beyond the considered wavelength range. No emissivity but reflectance was displayed in the vertical axis.
The meteorite sample was irradiated by 1 keV H+ protons produced by the ECR ionsource (for technical details, see [36]) at the Atomki Institute under vacuum conditions for 3 times: 15 s (1011 ion/cm2) for the 1st irradiation, for 1 h (1014 ion/cm2) for the 2nd irradiation, and for 1 day (1017 ion/cm2) for the 3rd irradiation. As a result, after each irradiation action, the meteorite had also already witnessed the earlier irradiations; thus, their cumulative consequence can be seen, although these three irradiation actions differed by 1000 times. However, in this work, the change between the non-irradiated and the most heavily irradiated samples (3rd irradiation) was analysed in order to focus on the strongest and most clearly observable changes.
The used sample NWA 10580 CO3 type meteorite is a poorly altered primitive meteorite with unweathered material, mainly of forsterite, enstatite, and diopside, hosting small chondrules, very few calcium–aluminium-rich inclusions (CAIs), and blebs of sulphides, together in a fine-grained matrix, making up about half of the meteorite. The lithic fragments contain few accessory minerals (e.g., troilite and FeNi) besides the main constituent mineral phases. The texture of NWA 10580 is typical Ornan-type (CO) carbonaceous chondritic with many refractory inclusions [37,38]. The meteorite sample was already analysed regarding the infrared measurements, which will be published in detail in Gyollai et al. (2024 (under rev.)). This work contributes to the general knowledge with the comparative evaluation of Raman and infrared analysis to better understand irradiation-produced changes.

3. Results

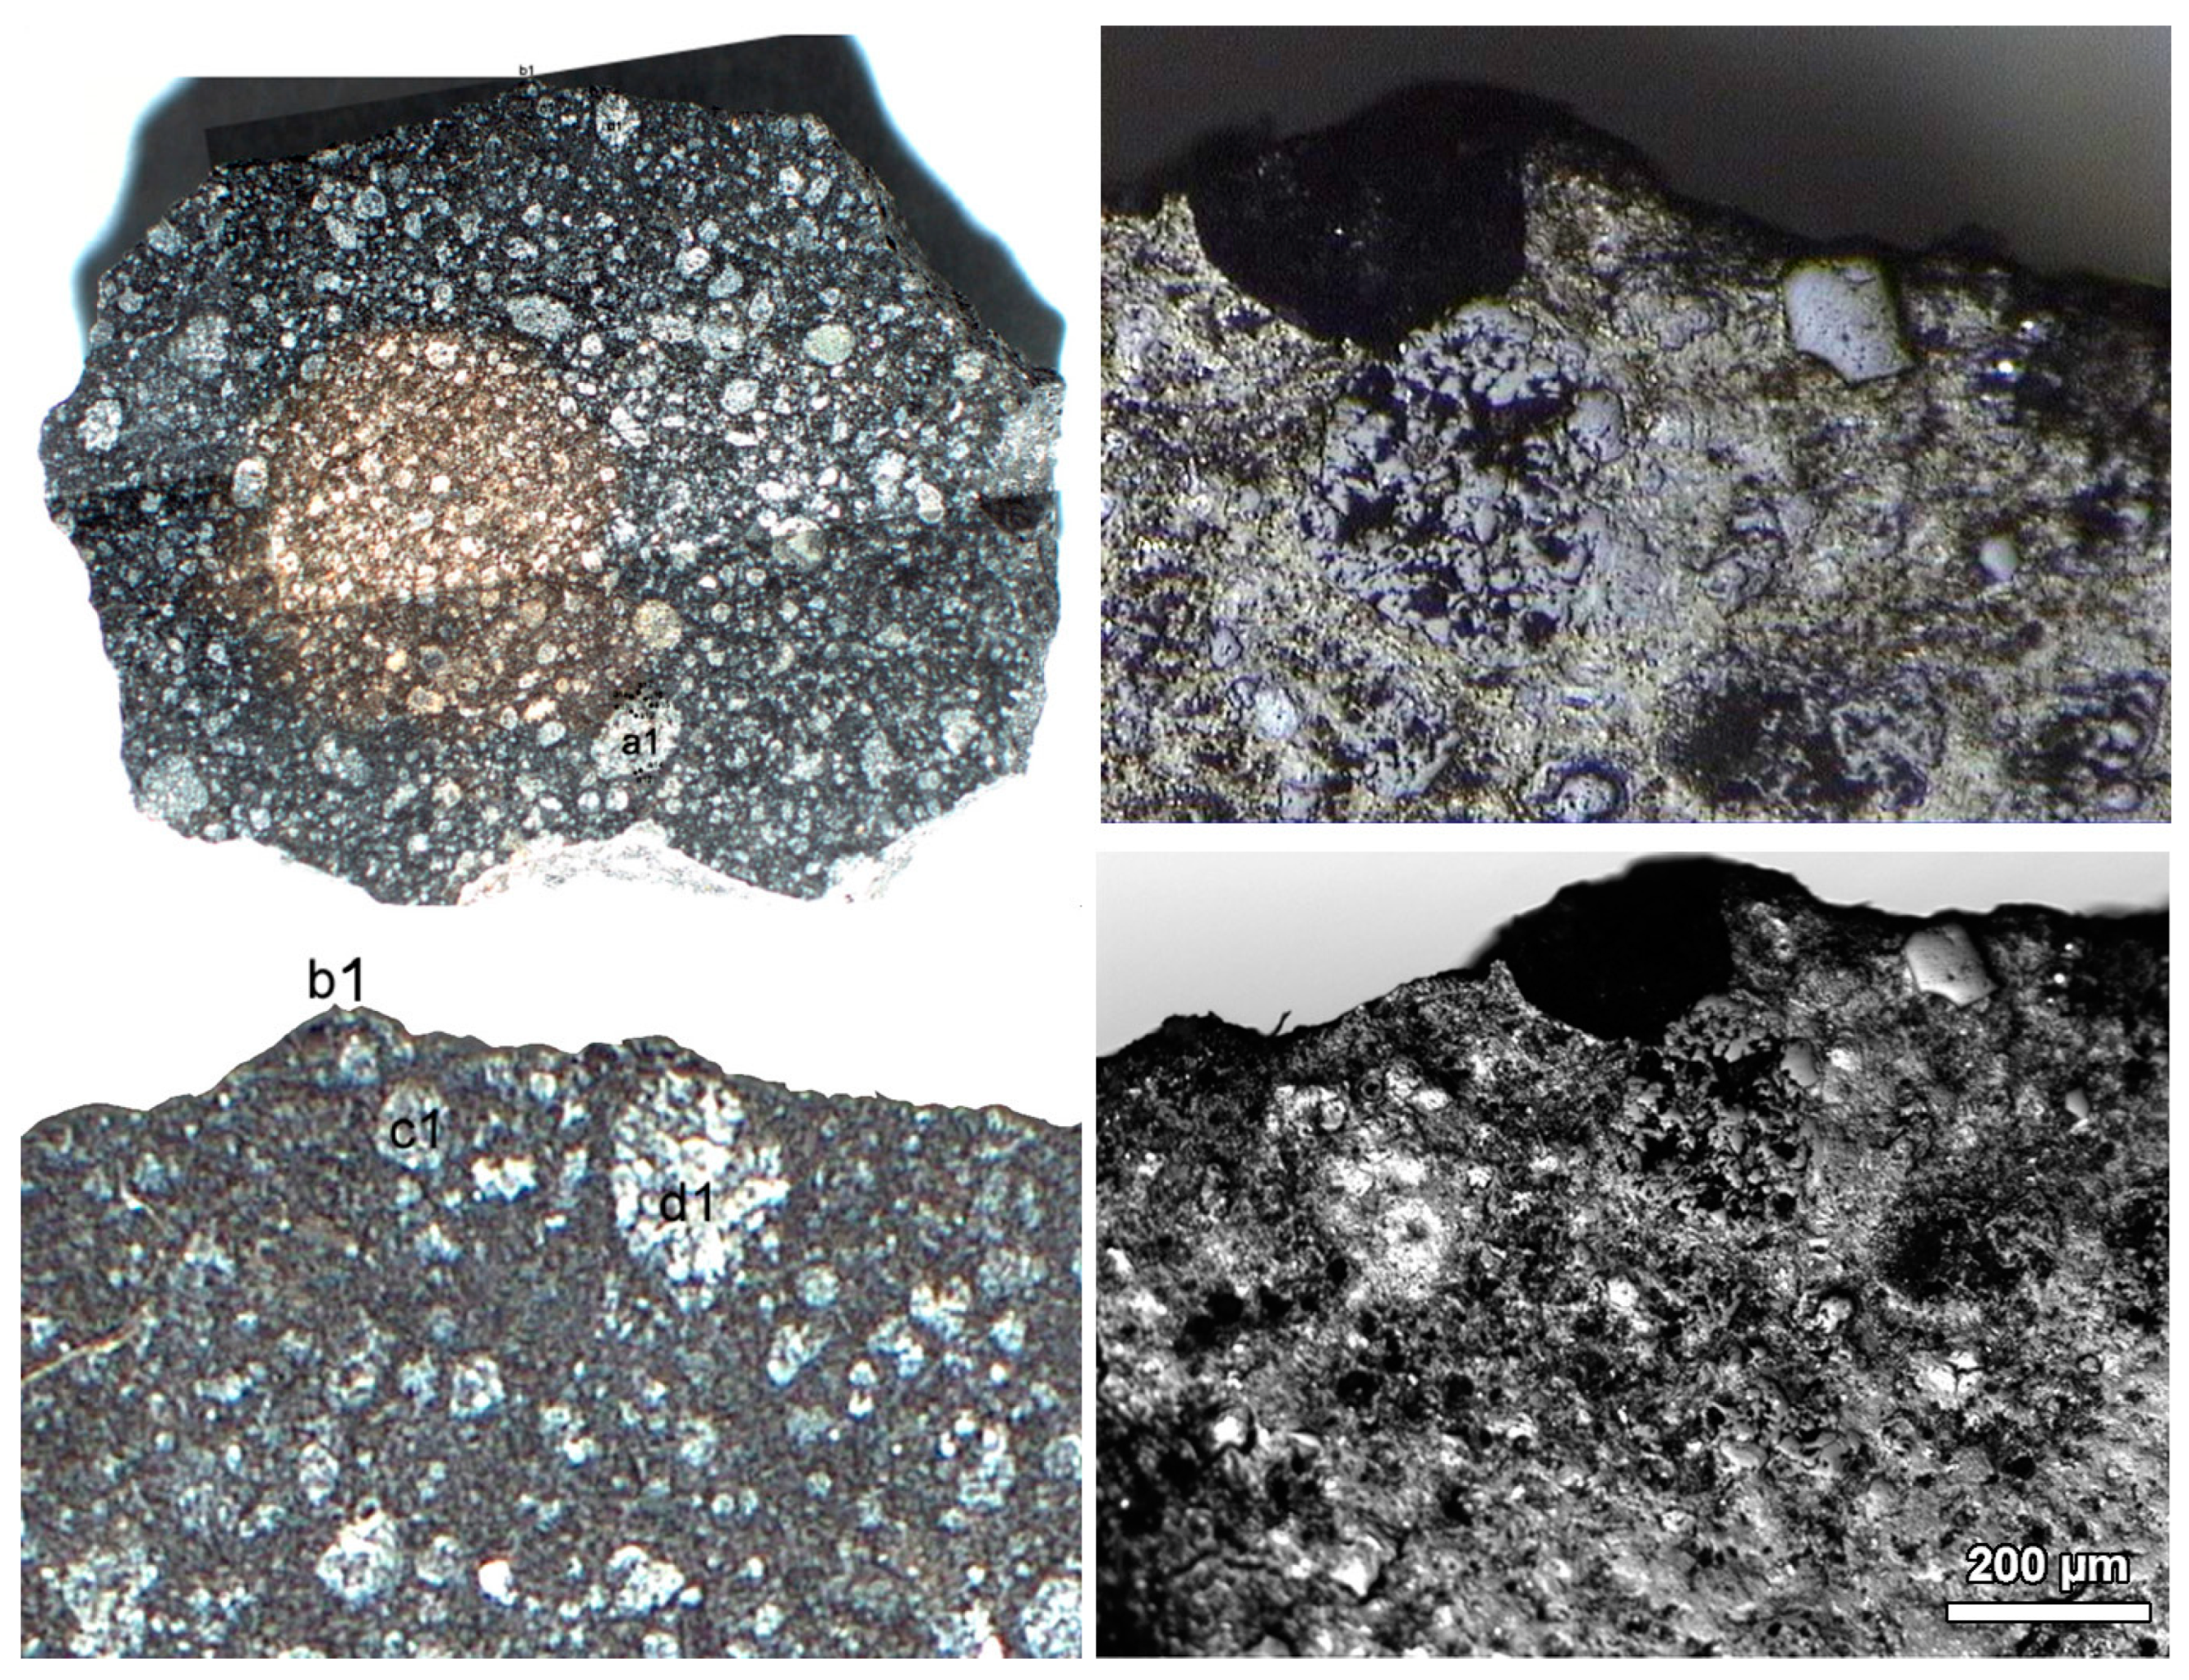
3.1. Mineral Identification

Raman analysis: The following bands were used to identify the targeted minerals: 1010 cm−1 for pyroxene, 819 and 840 cm−1 for olivine as the major band. The olivine has a minor band at 950 cm−1, and the pyroxene has minor bands at 340, 660, and 680 cm−1. The peak shifts and FWHM values are calculated by major bands of minerals: 819 and 840 cm−1 of olivine, 1010 cm−1 for pyroxene. The calcite was identified at 1086 cm−1 in Raman spectra before the irradiation.
Using characteristic bands, minerals were identified from the RRUFF database and the Crystal Sleuth software [35], as well as from related publications. The main bands and FWHM values used for statistics were: 849, 880 cm−1 for olivine, and 1049 cm−1 for pyroxene. Depending on the amorphization rate, the minerals were detected not only by the major bands but also by the minor bands. These minor, less intense bands disappeared earlier than the major, higher intensity bands. For example, olivine might have only one band that remained from the major doublet due to amorphization in our Raman measurements (Figure 1 and Figure 2e (R1/8)) In general, the minerals (olivine, pyroxene) have less bands after the 3rd irradiation than before.

3.2. Raman Spectral Changes

The results of the Raman analysis can be seen in Table 1 with band positions and FWHM both before and after the irradiations, where eight measuring points are shown at three measuring areas (b1, c1, d1), which were analysed in this work in the sample NWA 10580 (Figure 2).
Based on the values given in the Raman table, the band positions and FWHM of olivine (820, 850, 950 cm−1) show increasing peak shift values (between +1 and +7 cm−1) by the irradiation. In the case of pyroxene, not only the increasing peak (between +2 and +6 cm−1) shift, and increased FWHM, but the disappearance of the 658 cm−1 and 670 cm−1 bands can be observed after the irradiation. The calcite was identified in one spectrum before the irradiation at 1086 cm−1.
In the following (Figure 1), characteristic examples are presented for peak changes between the original (non-irradiated) and most heavily irradiated cases. Please also note the general decrease in Raman intensity after the irradiation.
Olivine minerals demonstrate the following features (Figure 1 and Figure 2d–h):
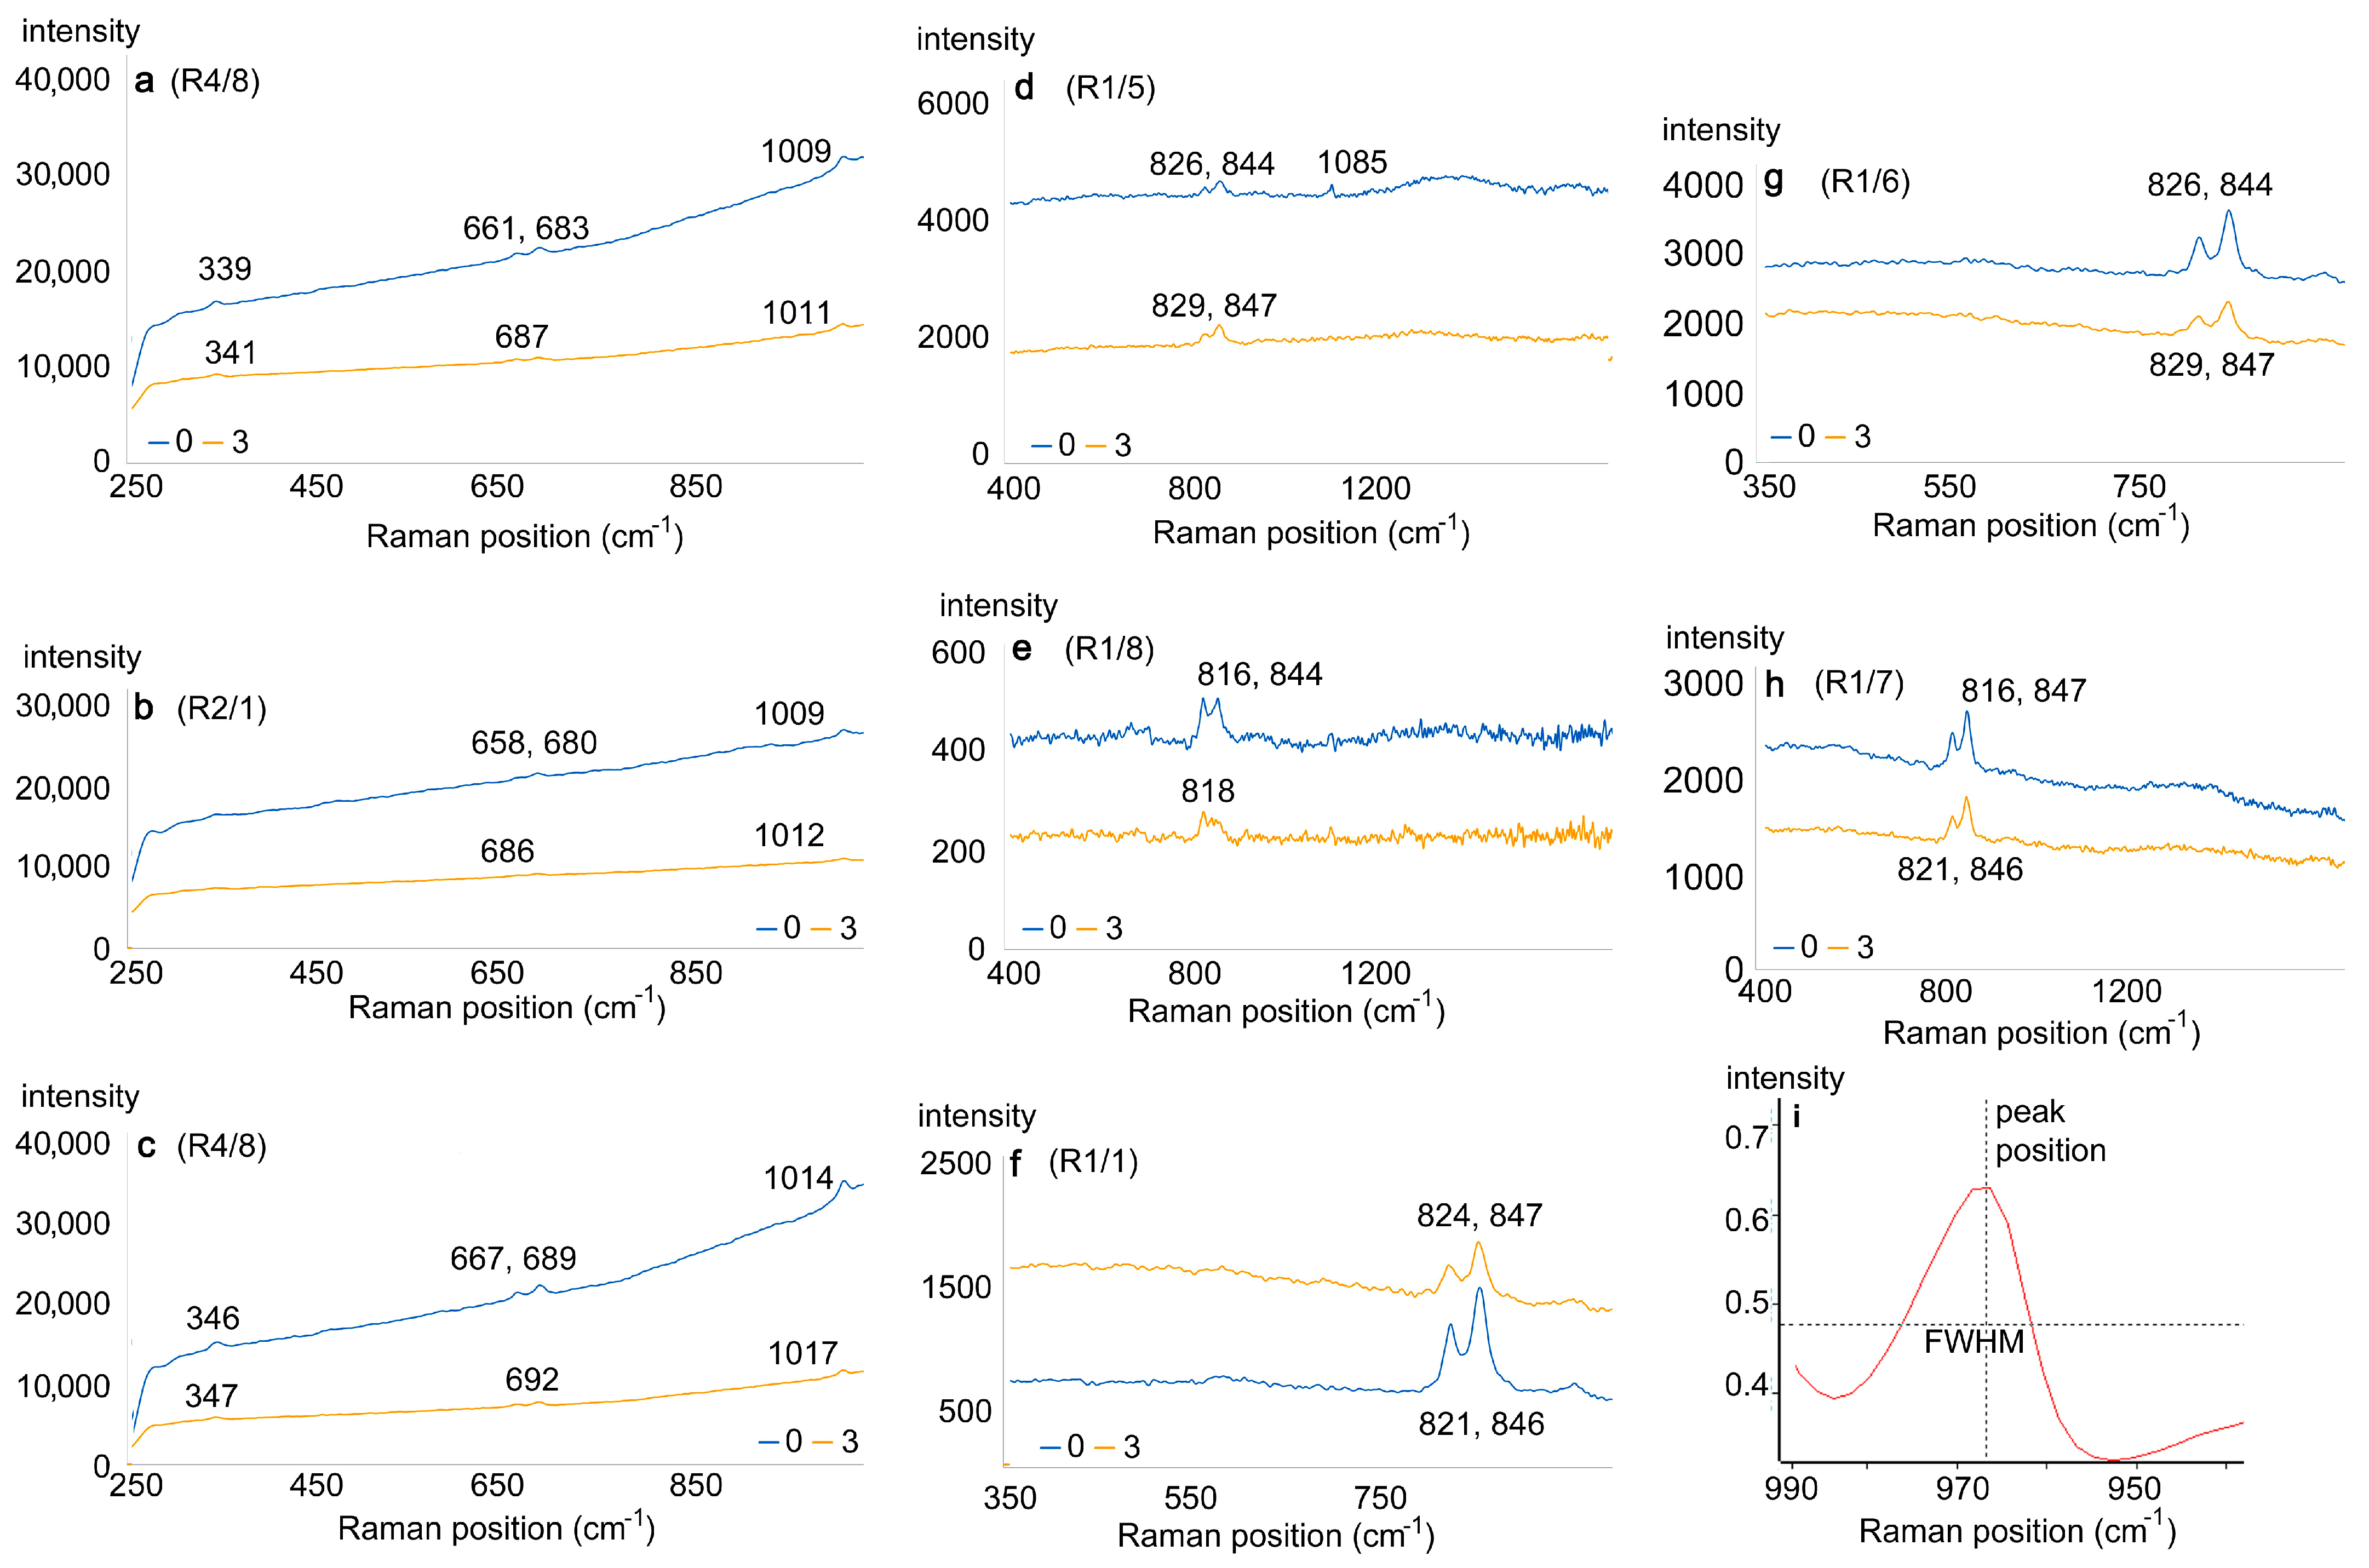
  • In the R1/1 area (Figure 2f), the spectrum after irradiation is characterized by decreasing intensity and increasing peak shift toward higher Raman shift in cm−1 values and increasing FWHM values. The change of band 821 is +3 (peak shift), +3 cm−1 (increase in FWHM), while of 846 cm−1 band these values are +1 cm−1 in position, and +3 cm−1 values in FWHM. The minor band at 954 cm−1 shows a peak shift of +6 cm−1 and an increase in FWHM with +5 cm−1.
  • In the R1/5 area (Figure 2d), the band of calcite (1086 cm−1, which is probably Earth-based weathering product) can be observed before the irradiation, which band disappears after the irradiation. In the case of bands 826 cm−1 and 844 cm−1, these shifted to a higher wavenumber with +3 cm−1. The olivine is characterized by less intense bands than the R1/1 area and higher FWHM already before the irradiation. The band of organic material at 1355 cm−1 disappears after the irradiation.
  • The R1/6 area (Figure 2g) is characterized by lower intensity bands than the spectrum before irradiation and higher FWHM values for olivine after the irradiation. The 817 cm−1 and 849 cm−1 major bands of olivine show an increase in peak shift by +2 cm−1 after the irradiation. The increase in FWHM is +5 cm−1 for band 817 cm−1, and +3 cm−1 for band 849 cm−1. The minor band at 955 cm−1 shows a decreasing intensity and shifted with +9 cm−1 to a higher wavenumber.
  • The R1/7 (Figure 2h) is characterized by lower intensity bands and higher FWHM values for olivine after the irradiation. The band 816 cm−1 shifted with +4 cm−1, the band 847 cm−1 with +3 cm−1 to a higher wavenumber after the irradiation. The band 816 cm−1 has +5 cm−1 and the band 847 cm−1 has +6 cm−1 increase in FWHM. The organic material at band 1375 cm−1 disappears after the irradiation.
  • The R1/8/7 (Figure 2e) spectrum has bands at 816 cm−1 and 844 cm−1 before irradiation with low intensity bands. The band at 844 cm−1 disappeared after the irradiation. The increase in FWHM values is +4 cm−1, and peak shift is +2 cm−1 of the band 816 cm−1 which can be identified after the irradiation.
  • The Raman spectra of pyroxene are displayed at Figure 2a–c.
  • The pyroxene in the b1/2 area (Figure 1 shows a decrease in intensity and increase in the FWHM value. The major band at 1009 cm−1 has +3 cm−1 peak shift and +7 cm−1 increase in the FWHM value. The minor band 658 cm−1 disappeared, and the band 680 cm−1 shifted with +6 cm−1 higher wavenumber.
  • The d1 area (R4) contains pyroxene spectra. The R4/8 (Figure 2c) spectrum of pyroxene shows a decreasing intensity after the irradiation. The minor band at 667cm−1 disappeared after the irradiation, and other bands were characterised by an increased peak shift after the irradiation: +1 (band 346 cm−1); +3 (bands 689, 1014 cm−1). The band 689 cm−1 shows +9 cm−1, and the band 1014 cm−1 shows +8 cm−1 increase in FWHM.
  • The pyroxene spectrum at R4/9 (Figure 1a) shows a decreasing intensity after the irradiation. The minor band at 661 cm−1 disappeared after the irradiation, the peak shift of other 339 cm−1 and 1009 cm−1 bands were characterized by +2 cm−1, and the 683 cm−1 band +4 cm−1. These bands show increasing FWHM about +7 cm−1 of band 683 cm−1, and +3 cm−1 both at bands 339 cm−1 and 1009 cm−1.
In summary, the bands (peak positions) and FWHM values of olivine show increasing values after the irradiation in Raman spectra; meanwhile, in the case of pyroxene, not only an increasing peak shift and FWHM, but a decreasing peak shift at 658 cm−1 and 670 cm−1 can be observed after the irradiation.

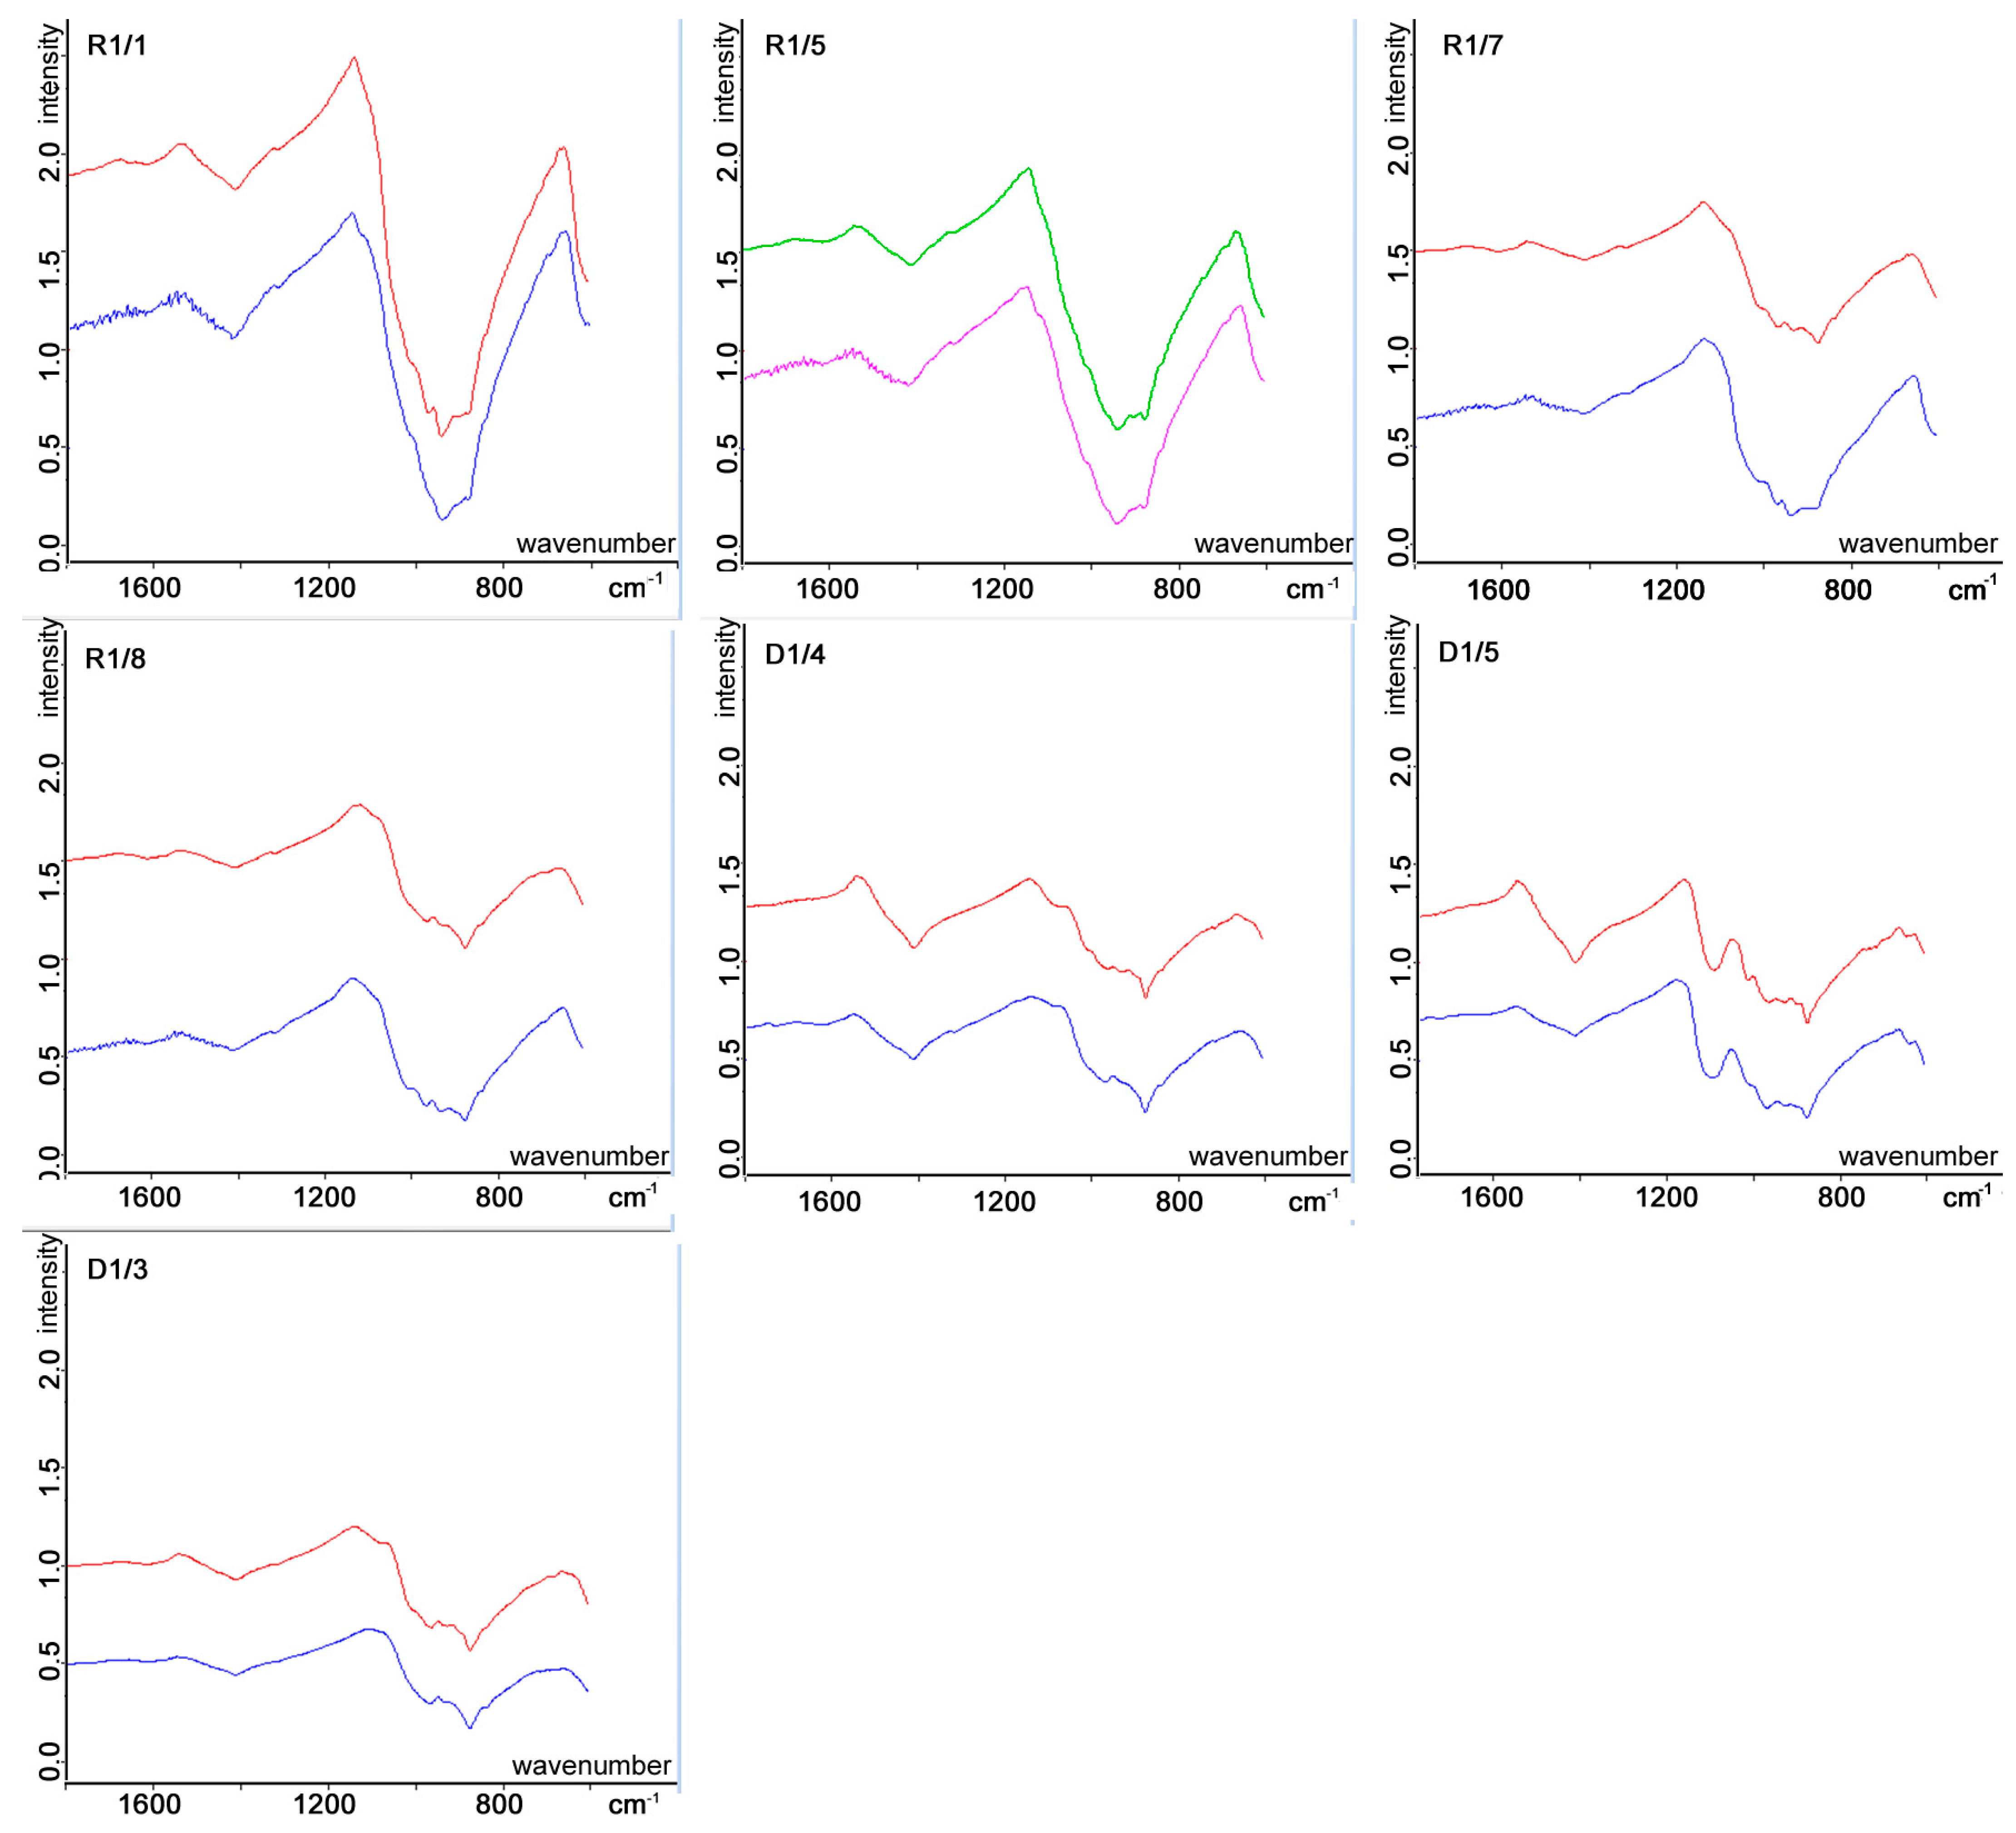
3.3. Infrared Spectral Changes

Infrared spectral analysis was realized at the same locations as the Raman measurements presented above in order to make them comparable and allow joint interpretation. The numerical results can be seen in Table 2.
The important findings shown in Table 2 and Figure 2 and Figure 3 can be summarised below. The IR spectra of olivine in the b1 area (corresponding to R1 Raman area, Figure 2 (R1/1, 5, 7, 8; see the d, e, f, g, and h panels)), the major band at 894 cm−1 can be detected, while the minor band at 978 cm−1 rarely appears. This minor band mostly disappeared after the irradiation (in 66% of IR spectra); in one case, the peak shift is characterized by −8 cm−1 decreasing value. In other cases (more usual than the disappearance of peaks), the FWHM value of the minor bands increased averagely with +4 cm−1. The major 894 cm−1 band of olivine is characterised by negative peak shift (on average −4 cm−1) between −3 and −41 cm−1 and by decreasing FWHM (between 0 and −6 cm−1). In summary, the irradiation caused mostly a negative peak shift of IR bands.
The IR spectra of pyroxene can be seen in the c1 and d1 areas in Figure 3 d1/3–5 insets. In the c1 area, the minor bands at 703 and 667 cm−1 disappeared after the irradiations, and the major band at 1046 cm−1 shifted by +19 cm−1 toward a higher wavenumber up to 1064 cm−1. At the c1 area (b1/3, Figure 3 (R1/7)), the minor band of olivine mostly disappears, whereas the major band of olivine shows a negative peak shift, and decrease in FWHM by FTIR spectroscopy. The pyroxene shows both an increase and decrease in peak positions at major bands, and also a decrease in FWHM values. However, the FWHM value of the major band decreased in two out of three cases. In the d1 area, the minor bands 940 (R4/8, R4/9, Figure 3, D1/3–4) and 693 cm−1 (R4/9, Figure 3, D1/5) disappeared after the irradiation. Those minor bands, which were all present through the whole test series (913, 660 cm−1) shifted to higher wavenumbers (+3–+7 cm−1 the band 660 cm−1, with +1 cm−1 the band 913 cm−1). However, the major band of pyroxene (1046–1064 cm−1) shifted to a lower wavenumber (−7–−25 cm−1), and was characterized by a decrease in FWHM (average with −6 cm−1).
The spectra shown in Figure 3 display the mineral mixtures before and after the irradiation (insets: R1/1, 5, 7, 8, D1/4, 5, 3) with the lower curves before irradiation, and the upper curves after irradiations. For a better comparison with Raman bands, in the text and table, the olivines are displayed at the location of R1, and pyroxene at the c1 and d1 area (Table 1 and Table 2). The spectra are named by Raman measuring position name (R1, R4) regarding a better comparison of the IR and Raman methods (between 0 and −14 cm−1), but the minor IR bands which have not disappeared show a moderate increase in FWHM (+20 …+43 cm−1) (Figure 3 (R1/7, R1/8, D1/5)).
At infrared observations in case of olivine at most of the observed minor bands disappeared, while the major band (889 cm−1) showed decrease in peak shift (between −3 and −41 cm−1) and FWHM (between −6 and +4 cm −1) after the irradiation in all cases in IR spectra. The negative peak shifts are probably caused by Mg loss from the crystal structure [1], while the irradiation-related amorphization caused the disappearance of the minor band 978 cm−1 of olivine [19,39] in the IR spectra. The possible occurrence of nanophase iron is suggested by the literature and could not be identified here; however, this meteorite contains reddish-brown parts in chondrules (iron oxides), which may support nanophase iron.
The major IR bands showed decreasing peak shifts and variable FWHM in pyroxene. The minor bands of pyroxene did not disappear but showed increasing peak shifts and increasing FWHM in the IR spectra. In the c1 area (Table 1 and Table 2: R2/1; Figure 3b), the bands 703 and 667 cm−1 disappeared; in the d1 area, the band 940 cm−1 also disappeared after the irradiation. The d1 area showed a change in FWHM between +20 and +93 cm−1 for band 660 cm−1, and +43 cm−1 for the band 693 cm−1. In summary, the pyroxene showed a decrease in FWHM for the major band (0…−14 cm−1) but the minor bands showed an increase in FWHM.
The disappearance of the Raman bands was mentioned in the references related to shock metamorphism ([27,40] for olivine, [41] for pyroxene, and [42] for feldspar). The disappearance of the bands after the irradiation was mentioned by [39] in the case of organic material, and by [43] and [1] in the case of olivine.
At Raman observations, both of pyroxenes and olivines, an increasing peak shift was shown regarding the main and minor bands, and also an increasing change in FWHM. In the case of olivine, one of the major bands (R1/8) disappeared at 840 cm−1, while in several cases, the minor bands also disappeared (660–680 cm−1 in c1 area). In the case of Raman spectroscopy, both the major and minor bands of olivine and pyroxene showed a positive Raman peak shift (increasing wavenumber of peak positions) and increase in FWHM from the irradiation. The disappearance of the mineral phase of specific peaks could be observed after the irradiation: calcite bands disappeared after the irradiation (Figure 2 inset d). In [19], merging of the olivine Raman olivine bands (820, 850 cm−1) to a single band 840 cm−1 due to irradiation was observed, which was also observed in this work near 890 cm−1.
The olivine and pyroxene were both characterised by positive average peak shifts and increasing FWHM change for major bands in Raman spectroscopy (Table 3). In the case of FTIR spectra, both olivine and pyroxene presented a negative average peak shift and decreasing FWHM change for major band (Table 3).

3.4. Comparison of Raman and Infrared Changes

In the case of IR spectra, the major bands showed a decrease in peak position (negative peak shift) and in FWHM change, but the minor bands disappeared or showed an increase in peak shift and in FWHM change (Table 2 and Table 3). Consequently, the amorphization after the irradiation can be better demonstrated by minor bands, which changed (increased peak shift and FWHM) and disappeared, partly similar to the changes observed after shock metamorphic processes [42,44]. In the case of FTIR spectroscopy, the change in FWHM and peak shift showed correlation in our data. With increasing shock stage by corresponding works, the peaks shift to a higher wavenumber and show increasing FWHM due to disordering SiO4 tetrahedra in the crystal structure; this feature was only observed in our Raman spectra. After the irradiation, the amorphization could be observed by the disappearance of minor bands and increase in peak shift and FWHM of major bands; hence, the observations in the references regarding shock metamorphism can be used here.
In FTIR spectra, the major band of olivine and pyroxene were characterised by negative peak shifts, but minor bands of pyroxenes presented positive peak shifts. In Raman spectra, all of the data were characterised by positive peak shifts (Table 1). The negative (decreasing) peak shifts of major bands indicates that FTIR is more sensitive for Mg loss (decreasing peak position [1]), but the Raman spectroscopy presented positive peak shifts of major bands and being more sensitive for general structural changes like depolymerisation of SiO4 tetrahedra, e.g., amorphization [44].
The disappearance of minor bands from IR spectra of olivine and pyroxene after the irradiation indicates amorphization, similar to Raman spectroscopy (disappearance of minor band at 667 cm−1 of pyroxene, disappearance of 844 cm−1 of olivine band in the spectrum R1/8). These results are in agreement with the literature: irradiation-related changes by amorphization in olivine were described by [39,43], who observed disordering of organic material after the irradiation by Raman spectroscopy with decreasing in intensities of most bands, and disappearance of minor bands for silicates. Similar to their observation, decreasing intensities of bands after the irradiation and disappearance of minor bands can be observed by Raman spectroscopy (Figure 2) in this work.

4. Discussion

4.1. Interpretation of Spectral Changes

The negative peak shifts observed in most cases of pyroxenes and olivines in IR spectra corresponds not only to the decomposition of the crystalline structure, but also to the variation in the Fe/Mg ratio. According to earlier results, a negative peak shift of IR band indicates Mg loss from the structure, causing the Fe ratio to increase [17]. Meanwhile, the authors of [19] observed that the shift of the ~870 cm−1 band is much larger (~12 cm−1) than a shift possibly due to the heterogeneous composition of the matrix olivines. Similar to the references, in our IR spectra, a negative peak shift for major band of minerals appeared (Table 3). The authors of [19] used H+, He+, Ar+, and Ar2+ with energies (60–400 keV, which caused larger alterations by the incorporation of nucleus distort crystal lattice due to bombarding bigger ions). In our case, the irradiation energy is 1 keV with increasing fluences after each irradiation step, and the ion size is lower as we used H+ ion with fluences 1014 and 1017 ions/sec/cm−2. In the case of Raman spectroscopy, positive peak shift of major bands and disappearance of minor bands related rather to amorphization. The Mg losses, which were detected by negative peak shifts of FTIR bands, may cause distortion of the crystal structure, which could be detected by positive peak shift in the Raman spectra.

4.2. Amorphization

The Raman spectra show an increase (positive peak shift) in major and minor band positions, which indicates amorphization for olivine and pyroxene [45], while in IR spectra, the amorphization could be indicated by the increase in peak shift and FWHM of minor bands. In a few cases, some minor bands disappeared after the irradiation due to amorphization both in our Raman and IR spectra.
According to [46], the silicates (px and ol) showed progressive amorphization due to elastic collision with ions (the process depends on the size of ion, and being higher by bombardment of Ar+ than H+), causing a shift of bands to higher wavenumbers (positive peak shift in µm) and a decrease in the intensity of minor IR bands. They observed an Mg loss of crystal lattice with negative peak shifts after the irradiations, which are similar to our data. In our case, H+ on 1 keV was used after the irradiation, but the amorphization progresses by increasing fluences and irradiation time. Such amorphization was observed in our IR and Raman spectra in the form of the disappearance of minor bands, increasing FWHM values, increasing peak position of minor bands, showing a decrease in the intensity of major bands after the irradiation (which was observed by [39]).
The positive peak shift is indicated by amorphization after the irradiation, whereas a negative peak shift is indicated by Mg loss from crystal structure after the references. The disordering of minerals after shock metamorphism are more usually studied by Raman spectroscopy in the references. Our observed positive peak shift of Raman bands has not been described by other works after irradiation. However, the authors of [47] observed a Raman peak shift due to distortion of SiO4 tetrahedra of feldspar by shock deformation [48] of crystal lattice; hence, in our case the positive peak shift could be interpreted by crystal lattice defect due to irradiation instead of shock effect.
According to [27], the positive peak shifts of olivine (which were identified by olivine and pyroxene in Raman spectra) indicate dimer effects (polymerization of SiO4 tetrahedra forming SiO2 molecules) in metastable crystalline olivine, which was observed in our Raman spectra. The polymerization of SiO4 tetrahedra is accompanied by the disordering of the crystalline structure: the SiO4 transition to SiO2 molecules. This feature is indicated by positive peak shift and increasing FWHM (in the case of olivine and pyroxene) in Raman spectra. The peak shift increased by increasing fluences of irradiations, and the positive peak shift indicates amorphization of olivine and pyroxene. A further step would be to better understand the role of microscopic impacts and related simulation; however, this is beyond the scope of this work.

5. Conclusions

The NWA 10580 CO3 meteorite was studied before and after irradiation actions with up to 1017 ions/cm2 fluences on 1 keV H+ ions, where eight points were investigated by both IR and Raman spectroscopy. The comparison of spectral features before and after the irradiation provided the following results:
  • The disappearance of minor bands of pyroxene (660 cm−1) and of olivine (978 cm−1) indicates amorphization. The increase in FWHM of minor bands of olivine and pyroxene also indicates structural disordering by the IR spectra.
  • The decreasing peak position (negative peak shift) of the major IR bands of olivine (880 cm−1) and pyroxene (1050 cm−1) indicates Mg loss in infrared spectra (Table 3). There are a lot of other works also dealing with these data (Brunetto et al. [2,19,39,46], Lantz et al. [1,17], Lazzarin et al. [18], Vernazza et al. [16]). The Mg loss can be observed better in the IR spectra than in the Raman spectra.
  • The increasing peak position (positive peak shift) and FWHM of pyroxene and of olivine in Raman spectra indicate structural disordering after the irradiations (Table 3). The disappearance of calcite peaks can be observed in one Raman spectrum after the irradiation.
  • The positive peak shift with increasing FWHM and disappearance of minor bands in minerals by Raman spectroscopy after the irradiation experiments were first observed in our work.
  • The positive peak shift, increasing FWHM, and decreasing minor bands which were observed in our Raman data after the irradiation were not observed in other works related to irradiation experiments. The positive peak shift and disappearance of minor bands were mentioned in the references only relating to shock metamorphic features. The new Raman data we provide here are complementary and coincide in trend with the also Raman-based results acquired not from irradiated but from shock-based alteration of meteorite minerals—pointing to the perspective regarding the connection between shock deformation and irradiation-modified aspects of changes in the mineral lattice.

Author Contributions

Conceptualization, Á.K. and S.B.; validation, Z.J.; formal analysis, B.S., R.R., P.S. and M.S.; investigation, I.G. and C.K.; samples acquisition T.S.; sample preparation D.R.; writing—review and editing, Z.S. All authors have read and agreed to the published version of the manuscript.

Funding

This research was funded by NKFIH grant number K_138594.

Data Availability Statement

The data presented in this study are available on request from the corresponding author due to privacy.

Conflicts of Interest

The authors declare no conflicts of interest exist.

References

  1. Lantz, C.; Brunetto, R.; Barucci, M.A.; Fornasier, S.; Baklouti, D.; Bourçois, J.; Godard, M. Ion irradiation of carbonaceous chondrites: A new view of space weathering on primitive asteroids. Icarus 2017, 285, 43–57. [Google Scholar] [CrossRef]
  2. Brunetto, R.; Loeffler, M.J.; Nesvorný, D.; Sasaki, S.; Strazzulla, G. Asteroid Surface Alteration by Space Weathering Processes. In Asteroids IV; Michel, P., De Meo, F.E., Bottke, W.F., Eds.; University of Arizona Press: Tucson, AZ, USA, 2015. [Google Scholar]
  3. Chapman, C.R. Space weathering of asteroid surfaces. Annu. Rev. Earth Planet. Sci. 2004, 32, 539–567. [Google Scholar] [CrossRef]
  4. DeMeo, F.E.; Burt, B.J.; Marsset, M.; Polishook, D.; Burbine, T.H.; Carry, B.; Binzel, R.P.; Vernazza, P.; Reddy, V.; Tang, M.; et al. Connecting asteroids and meteorites with visible and near-infrared spectroscopy. Icarus 2022, 380, 114971. [Google Scholar] [CrossRef]
  5. Krämer, R.L.; Beck, P.; Gattacceca, J.; Eschrig, J. Visible-infrared spectroscopy of ungrouped and rare meteorites brings further constraints on meteorite-asteroid connections. Icarus 2021, 362, 114393. [Google Scholar] [CrossRef]
  6. Keller, L.P.; McKay, D.S. Discovery of vapor deposits in the lunar regolith. Science 1993, 261, 1305–1307. [Google Scholar] [CrossRef] [PubMed]
  7. Keller, L.P.; McKay, D.S. The nature and origin of rims on lunar soil grains. Geochim. Et Cosmochim. Acta 1997, 61, 2331–2341. [Google Scholar] [CrossRef]
  8. Hapke, B. Space weathering from Mercury to the asteroid belt. J. Geophys. Res. Planets 2001, 106, 10039–10073. [Google Scholar] [CrossRef]
  9. Pieters, C.M.; Fischer, E.M.; Rode, O.; Basu, A. Optical effects of space weathering: The role of the finest fraction. J. Geophys. Res. Planets 1993, 98, 20817–20824. [Google Scholar] [CrossRef]
  10. Noguchi, T.; Nakamura, T.; Kimura, M.; Zolensky, M.E.; Tanaka, M.; Hashimoto, T.; Konno, M.; Nakato, A.; Ogami, T.; Fujimura, A.; et al. Incipient space weathering observed on the surface of Itokawa dust particles. Science 2011, 333, 1121. [Google Scholar] [CrossRef] [PubMed]
  11. OPUS Spectroscopy Software. Quick Reference Guide; Version 7; Bruker Optik GmbH: Ettlingen, Germany, 2017. [Google Scholar]
  12. Matsumoto, T.; Tsuchiyama, A.; Miyake, A.; Noguchi, T.; Nakamura, M.; Uesugi, K.; Takeuchi, A.; Suzuki, Y.; Nakano, T. Surface and internal structures of a space-weathered rim of an Itokawa regolith particle. Icarus 2015, 257, 230. [Google Scholar] [CrossRef]
  13. Thompson, M.S.; Zega, T.J.; Becerra, P.; Keane, J.T.; Byrne, S. The oxidation state of nanophase Fe particles in lunar soil: Implications for space weathering. Meteorit. Planet. Sci. 2016, 51, 1082–1095. [Google Scholar] [CrossRef]
  14. Nittler, L.R.; Starr, R.D.; Lim, L.; Mccoy, T.J.; Burbine, T.H.; Reedy, R.C.; Trombka, J.I.; Gorenstein, P.; Squyres, S.W.; Boynton, W.V.; et al. X-ray fluorescence measurements of the surface elemental composition of asteroid 433 Eros. Meteorit. Planet Sci. 2001, 36, 1673. [Google Scholar] [CrossRef]
  15. Loeffler, M.J.; Dukes, C.A.; Baragiola, R.A. Irradiation of olivine by 4 keV He+: Simulation of space weathering by the solar wind. J. Geophys. Res. 2009, 114, E03003. [Google Scholar] [CrossRef]
  16. Dukes, C.A.; Baragiola, R.A.; McFadden, L.A. Surface modification of olivine by H+ and He+ bombardment. J. Geophys. Res.: Planets 1999, 104, 1865–1872. [Google Scholar] [CrossRef]
  17. Vernazza, P.; Fulvio, D.; Brunetto, R.; Emery, J.P.; Dukes, C.A.; Cipriani, F.; Witasse, O.; Schaible, M.J.; Zanda, B.; Strazzulla, G.; et al. Paucity of Tagish Lake-like parent bodies in the Asteroid Belt and among Jupiter Trojans. Icarus 2013, 225, 517–525. [Google Scholar] [CrossRef]
  18. Lantz, C.; Brunetto, R.; Barucci, M.A.; Dartois, E.; Duprat, J.; Engrand, C.; Godard, M.; Ledu, D.; Quirico, E. Ion irradiation of the Murchison meteorite: Visible to mid-infrared spectroscopic results. Astron. Astrophys. 2015, 577, A41. [Google Scholar] [CrossRef]
  19. Lazzarin, M.; Marchi, S.; Moroz, L.V.; Brunetto, R.; Magrin, S.; Paolicchi, P.; Strazzulla, G. Space weathering in the main asteroid belt: The big picture. Astrophys. J. 2006, 647, L179. [Google Scholar] [CrossRef]
  20. Brunetto, R.; Lantz, C.; Ledu, D.; Baklouti, D.; Barucci, M.A.; Beck, P.; Delauche, L.; Dionnet, Z.; Dumas, P.; Duprat, J.; et al. Ion irradiation of Allende meteorite probed by visible, IR, and Raman spectroscopies. Icarus 2014, 237, 278–292. [Google Scholar] [CrossRef]
  21. Kaňuchová, Z.; Baratta, G.A.; Garozzo, M.; Strazzulla, G. Space weathering of asteroidal surfaces Influence on the UV-Vis spectra. Astron. Astrophys. 2010, 517, A60. [Google Scholar] [CrossRef]
  22. Kaňuchová, Z.; Boduch, P.; Domaracka, A.; Palumbo, M.E.; Rothard, H.; Strazzulla, G. Thermal and energetic processing of astrophysical ice analogues rich in SO2. Astron. Astrophys. 2017, 604, A68. [Google Scholar] [CrossRef]
  23. Kuebler, K.E.; Jolliff, B.L.; Wang, A.; Haskin, L.A. Extracting olivine (Fo–Fa) compositions from Raman spectral peak positions. Geochim. Et Cosmochim. Acta 2006, 70, 6201–6222. [Google Scholar] [CrossRef]
  24. Hapke, B.; Cassidy, W.; Wells, E. Effects of vapor-phase deposition processes on the optical, chemical, and magnetic properties OE the lunar regolith. Moon 1975, 13, 339–353. [Google Scholar] [CrossRef]
  25. Brucato, J.R.; Strazzulla, G.; Baratta, G.; Colangeli, L. Forsterite amorphisation by ion irradiation: Monitoring by infrared spectroscopy. Astron. Astrophys. 2004, 413, 395–401. [Google Scholar] [CrossRef]
  26. Demyk, K.; d’Hendecourt, L.; Leroux, H.; Jones, A.P.; Borg, J. IR spectroscopic study of olivine, enstatite and diopside irradiated with low energy H and He ions. Astron. Astrophys. 2004, 420, 233–243. [Google Scholar] [CrossRef]
  27. Rietmeijer, F.J. The irradiation-induced olivine to amorphous pyroxene transformation preserved in an interplanetary dust particle. Astrophys. J. 2009, 705, 791. [Google Scholar] [CrossRef]
  28. Durben, D.J.; McMillan, P.F.; Wolf, G.H. Raman study of the high-pressure behavior of forsterite (Mg2SiO4) crystal and glass. Am. Mineral. 1993, 78, 1143–1148. [Google Scholar]
  29. Kissel, J.; Krueger, F.R. Ion Formation by Impact of Fast Dust Particles and Comparison with Related Techniques. Applied Physics A Solids and Surfaces. Appl. Phys. A 1987, 42, 69–85. [Google Scholar] [CrossRef]
  30. Moroz, L.V.; Fisenko, A.V.; Semjonova, L.F.; Pieters, C.M.; Korotaeva, N.N. Optical effects of regolith processes on S-asteroids as simulated by laser shots on ordinary chondrite and other mafic materials. Icarus 1996, 122, 366–382. [Google Scholar] [CrossRef]
  31. Sasaki, S.; Nakamura, K.; Hamabe, Y.; Kurahashi, E.; Hiroi, T. Production of iron nanoparticles by laser irradiation in a simulation of lunar-like space weathering. Nature 2001, 410, 555–557. [Google Scholar] [CrossRef]
  32. Ferus, M.; Knížek, A.; Cassone, G.; Rimmer, P.B.; Changela, H.; Chatzitheodoridis, E.; Uwarova, I.; Žabka, J.; Kabáth, P.; Saija, F.; et al. Simulating asteroid impacts and meteor events by high-power lasers: From the laboratory to spaceborne missions. Front. Astron. Space Sci. 2023, 10, 1186172. [Google Scholar] [CrossRef]
  33. Morimitsu, S.; Sasaki, S.; Kaiden, H.; Hiro, T. Space weathering simulation with UV irradiation on olivine. In Proceedings of the Japan Geoscience Union Meeting, Chiba, Japan, 22–27 May 2022; pp. PPS07–PPS22. [Google Scholar]
  34. Ruesch, O.; Sefton-Nash, E.; Vago, J.; Kueppers, M. In situ fragmentation of lunar blocks and implications for impacts and solar-induced thermal stresses. Icarus 2020, 336, 113431. [Google Scholar] [CrossRef]
  35. Garzanti, E.; Resentini, A.; Andò, S.; Vezzoli, G.; Pereira, A.; Vermeesch, P. Physical controls on sand composition and relative durability of detrital minerals during ultra-long distance littoral and aeolian transport (N amibia and southern A ngola). Sedimentology 2015, 62, 971–996. [Google Scholar] [CrossRef]
  36. Lafuente, B.; Downs, R.T.; Yang, H.; Stone, N. The Power of Databases: The RRUFF Project. In Highlights in Mineralogical Crystallography; Armbruster, T., Danisi, R.M., Eds.; De Gruyter: Berlin, Germany, 2015; pp. 1–30. [Google Scholar]
  37. Biri, S.; Rácz, R.; Pálinkás, J. Status and special features of the Atomki ECR ion source. Rev. Sci. Instrum. 2012, 83, A341. [Google Scholar] [CrossRef]
  38. Zhu, K.; Liu, J.; Moynier, F.; Qin, L.; O’De Alexander, C.M.; He, Y. Chromium Isotopic Evidence for an Early Formation of Chondrules from the Ornans CO Chondrite. Astrophys. J. 2019, 873, 8238. [Google Scholar] [CrossRef]
  39. Brunetto, R.; Lantz, C.; Nakamura, T.; Baklouti, D.; Le Pivert-Jolivet, T.; Kobayashi, S.; Borondics, F. Characterizing irradiated surfaces using IR spectroscopy. Icarus 2020, 345, 113722. [Google Scholar] [CrossRef]
  40. Van de Moortèle, B.; Reynard, B.; McMillan, P.F.; Wilson, M.; Beck, P.; Gillet, P.; Jahn, S. Shock-induced transformation of olivine to a new metastable (Mg, Fe) 2SiO4 polymorph in Martian meteorites. Earth Planet. Sci. Lett. 2007, 261, 469–475. [Google Scholar] [CrossRef]
  41. Huang, E.; Chen, C.H.; Huang, T.; Lin, E.H.; Xu, J.A. Raman spectroscopic characteristics of Mg-Fe-Ca pyroxenes. Am. Mineral. 2000, 85, 473–479. [Google Scholar] [CrossRef]
  42. Johnson, J.R.; Hörz, F.; Staid, M.I. Thermal infrared spectroscopy and modeling of experimentally shocked plagioclase feldspars. Am. Mineral. 2003, 88, 1575–1582. [Google Scholar] [CrossRef]
  43. Demyk, K.; Carrez, P.; Leroux, H.; Cordier, P.; Jones, A.P.; Borg, J.; Quirico, E.; Raynal, P.I.; d’Hendecourt, L. Structural and chemical alteration of crystalline olivine under low energy He+ irradiation. Astron. Astrophys. 2001, 368, L38–L41. [Google Scholar] [CrossRef]
  44. Sharp, T.G.; DeCarli, P.S. Shock effects in meteorites. Meteor. Early Sol. Syst. II 2006, 943, 653–677. [Google Scholar]
  45. Morlok, A.; Bischoff, A.; Patzek, M.; Sohn, M.; Hiesinger, H. Chelyabinsk–a rock with many different (stony) faces: An infrared study. Icarus 2017, 284, 431–442. [Google Scholar] [CrossRef]
  46. Brunetto, R.; Vernazza, P.; Marchi, S.; Birlan, M.; Fulchignoni, M.; Orofino, V.; Strazzulla, G. Modeling asteroid surfaces from observations and irradiation experiments: The case of 832 Karin. Icarus 2006, 184, 327–337. [Google Scholar] [CrossRef]
  47. Heymann, D.; Hörz, F. Raman-spectroscopy and X-ray diffractometer studies of experimentally produced diaplectic feldspar glass. Phys. Chem. Miner. 1990, 17, 38–44. [Google Scholar] [CrossRef]
  48. Pittarello, L.; Fritz, J.; Roszjar, J.; Lenz, C.; Chanmuang, N.C.; Koeberl, C. Partial amorphization of experimentally shocked plagioclase: A spectroscopic study. Meteorit. Planet. Sci. 2020, 55, 669–678. [Google Scholar] [CrossRef]
Figure 1. Example of optical images of the whole sample (top left); part of the target area (bottom left). Please note the many bright chondrules; meanwhile, magnified insets of the (b1) area can be seen with the microscope of FTIR (top right) and Raman (bottom right) instruments. Please also note the large number of small occasionally irregularly shaped components. The letters plus numbers mark observing locations.
Minerals 14 00288 g001
Figure 2. Spectral curves named by Raman measuring area codes. Pyroxene: inset (a) (R4/9), (b) (R2/1), (c) (R4/8), olivine: (d) (R1/5), (e) (R1/8), (f) (R1/1), (g) (R1/6), and (h) (R1/7) are visible. Values from further examples on peak and FWHM changes are presented in Table 1 in detail. The spectral curves show every bands’ decreasing intensity after the irradiation in general. An example peak position and FWHM determination can be seen in the magnified “(i)” inset for olivine.
Minerals 14 00288 g002
Figure 3. IR spectra before (lower curves on the images), and after the irradiation (upper curves on the images). Peak shifts and increases in FWHM value can be observed after the irradiation. Figure 2 (insets R1/5, R1/5) show the spectra of olivine at b1 area with the lower curve before (blue) and after the irradiation (red), while Figure 2 R1/8, D1/4, 5 of pyroxene. (Legend: y axis is intensity; x axis is wavenumber in cm−1).
Minerals 14 00288 g003
Table 1. Summary of Raman band positions with FWHM before and after the irradiation, and peak shift and FWHM change values after the irradiation. Olivine is marked by italic numbers; pyroxene by regular numbers in the IR peak position column. Acronyms: d = disappearance of Raman bands; hence, peak shift and FWHM change cannot be calculated there. The peak shift column shows the change in the positions of the indicated bands.
IR AreaRaman
Area
No. of SpecBefore IrradiationAfter IrradiationProduced Change
Raman Band Positions (cm−1)FWHM (cm−1)Raman Band Positions
(cm−1)
FWHM
(cm−1)
Peak Shift (cm−1)FWHM
(cm−1)
b1/2R1/11821, 846, 9548, 15, 8824, 847, 96011, 18, 13+3, +1, +6+3, +3, +5
b1/2R1/52826, 84412, 22829, 84714, 24+3, +3+2, +2
b1/2R1/63826, 844, 9486, 10, 17829, 847, 95512, 16, 23+3, +3, +7+6, +6, +6
b1/2R1/75816, 84711, 15820, 85016, 22+4, +3+5, +6
b1/2R1/86816, 8448, 9818, d12, d+2, d+4, d
c1 R2/12658, 680, 100920, 13, 9d, 686, 1012d, 22, 14 d, +6, +3d, +9. +5
d1R4/84346, 667, 689, 101414, 10, 21, 20347, d, 692, 101725, d, 30, 28+1 d, +3, +3+11, +9, +8
d1R4/95339, 661, 683, 100922, 14, 21, 20341, d, 687, 101125, d, 28, 23+2, d, +4, +2+3, d, +7, +3
Table 2. IR bands and FWHM values of olivine b1 area and of pyroxene at c1 and d1 areas before and after the irradiation with peak shift and change in FWHM values. Olivine is marked by italic numbers, pyroxene by regular numbers in the IR peak position column. Because the olivine bands disappeared after the 3rd irradiation, we use values after 2nd irradiation for comparison of spectral changes of Raman spectroscopy (Table 1).
IR AreaRaman
Area
SpecBefore IrradiationAfter IrradiationDifference
IR Peak Position (cm−1)FWHM (cm−1)IR Peak Position (cm−1)FWHM
(cm−1)
IR Peak Shift (cm−1)FWHM
(cm−1)
(b1/2)R1/11978, 8947, 11970, 84511, 11−8, −39+4, 0
(b1/2)R1/52978, 8947, 118876d, −7d, −5
(b1/2)R1/63978, 8947, 118915d, −3d, −6
(b1/2)R1/75894118875−7−6
(b1/2)R1/8689414853, 97011, 12−41, p−3, p
c1 R2/121046, 703, 66726, 7, 16106521+19, d, d−5, d, d
d1R4/841046, 940, 913, 693, 66031, 8, 7, 10, 7 1039, 914, 667,31, 50, 100−7, d, +1, d, +70, d, +43, +93
d1R4/951064, 945, 66440, 10, 801039, 667,26, 100−25, d, +3−14, d, +20
Table 3. Average peak shift and FWHM of olivine and pyroxene.
MineralRaman Peak ShiftRaman FWHM ChangeIR Peak ShiftIR FWHM Change
olivine major bands: 820, 840 cm−1—Raman, 894 cm−1—FTIR)+3 cm−1 (820 cm−1),
+3.2 cm−1 (840 cm−1)
+5 cm−1 (820 cm−1),
+4.2 cm−1 (840 cm−1)
−24 cm−1 −4.2 cm−1
pyroxene major band: 1010 cm−1—Raman, 1046 cm−1 —FTIR+3.6 cm−1 +5.2 cm−1−6.5 cm−1 −6 cm−1
Disclaimer/Publisher’s Note: The statements, opinions and data contained in all publications are solely those of the individual author(s) and contributor(s) and not of MDPI and/or the editor(s). MDPI and/or the editor(s) disclaim responsibility for any injury to people or property resulting from any ideas, methods, instructions or products referred to in the content.

