
Microdistribution and Mode of Rare Earth Element Occurrence in the Zhijin Rare Earth Element-Bearing Phosphate Deposit, Guizhou, China

Abstract
1. Introduction
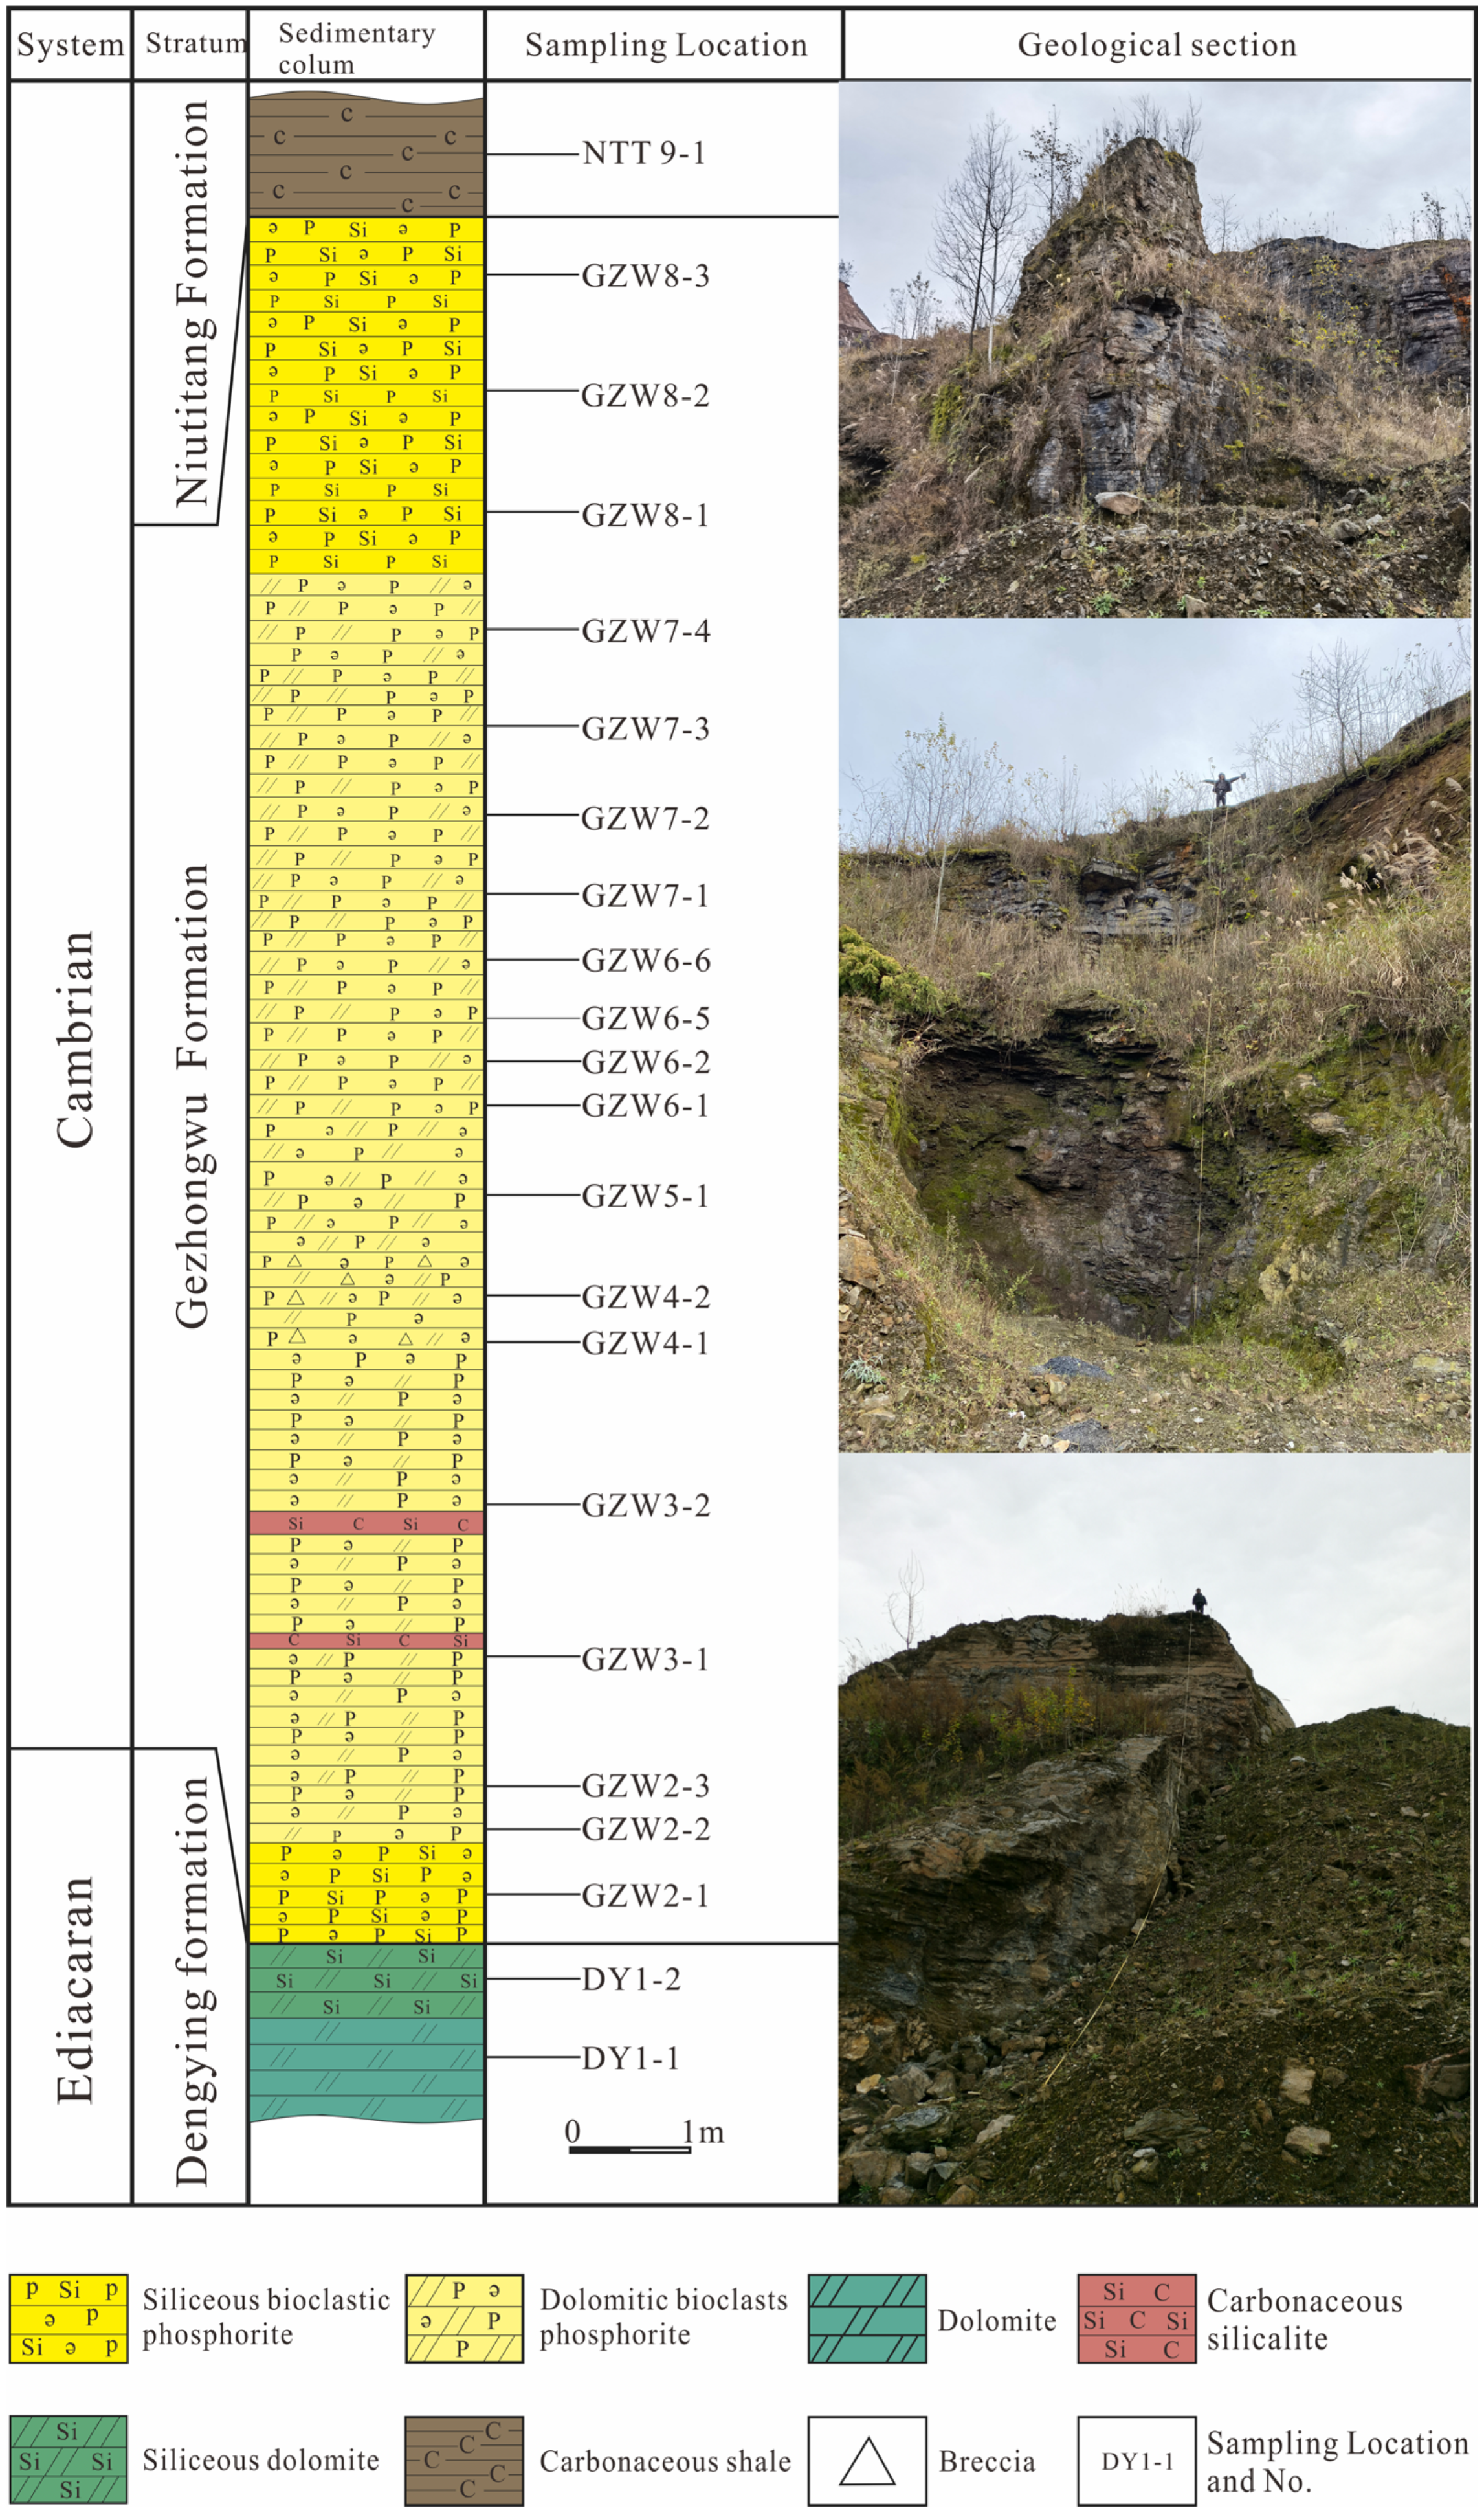
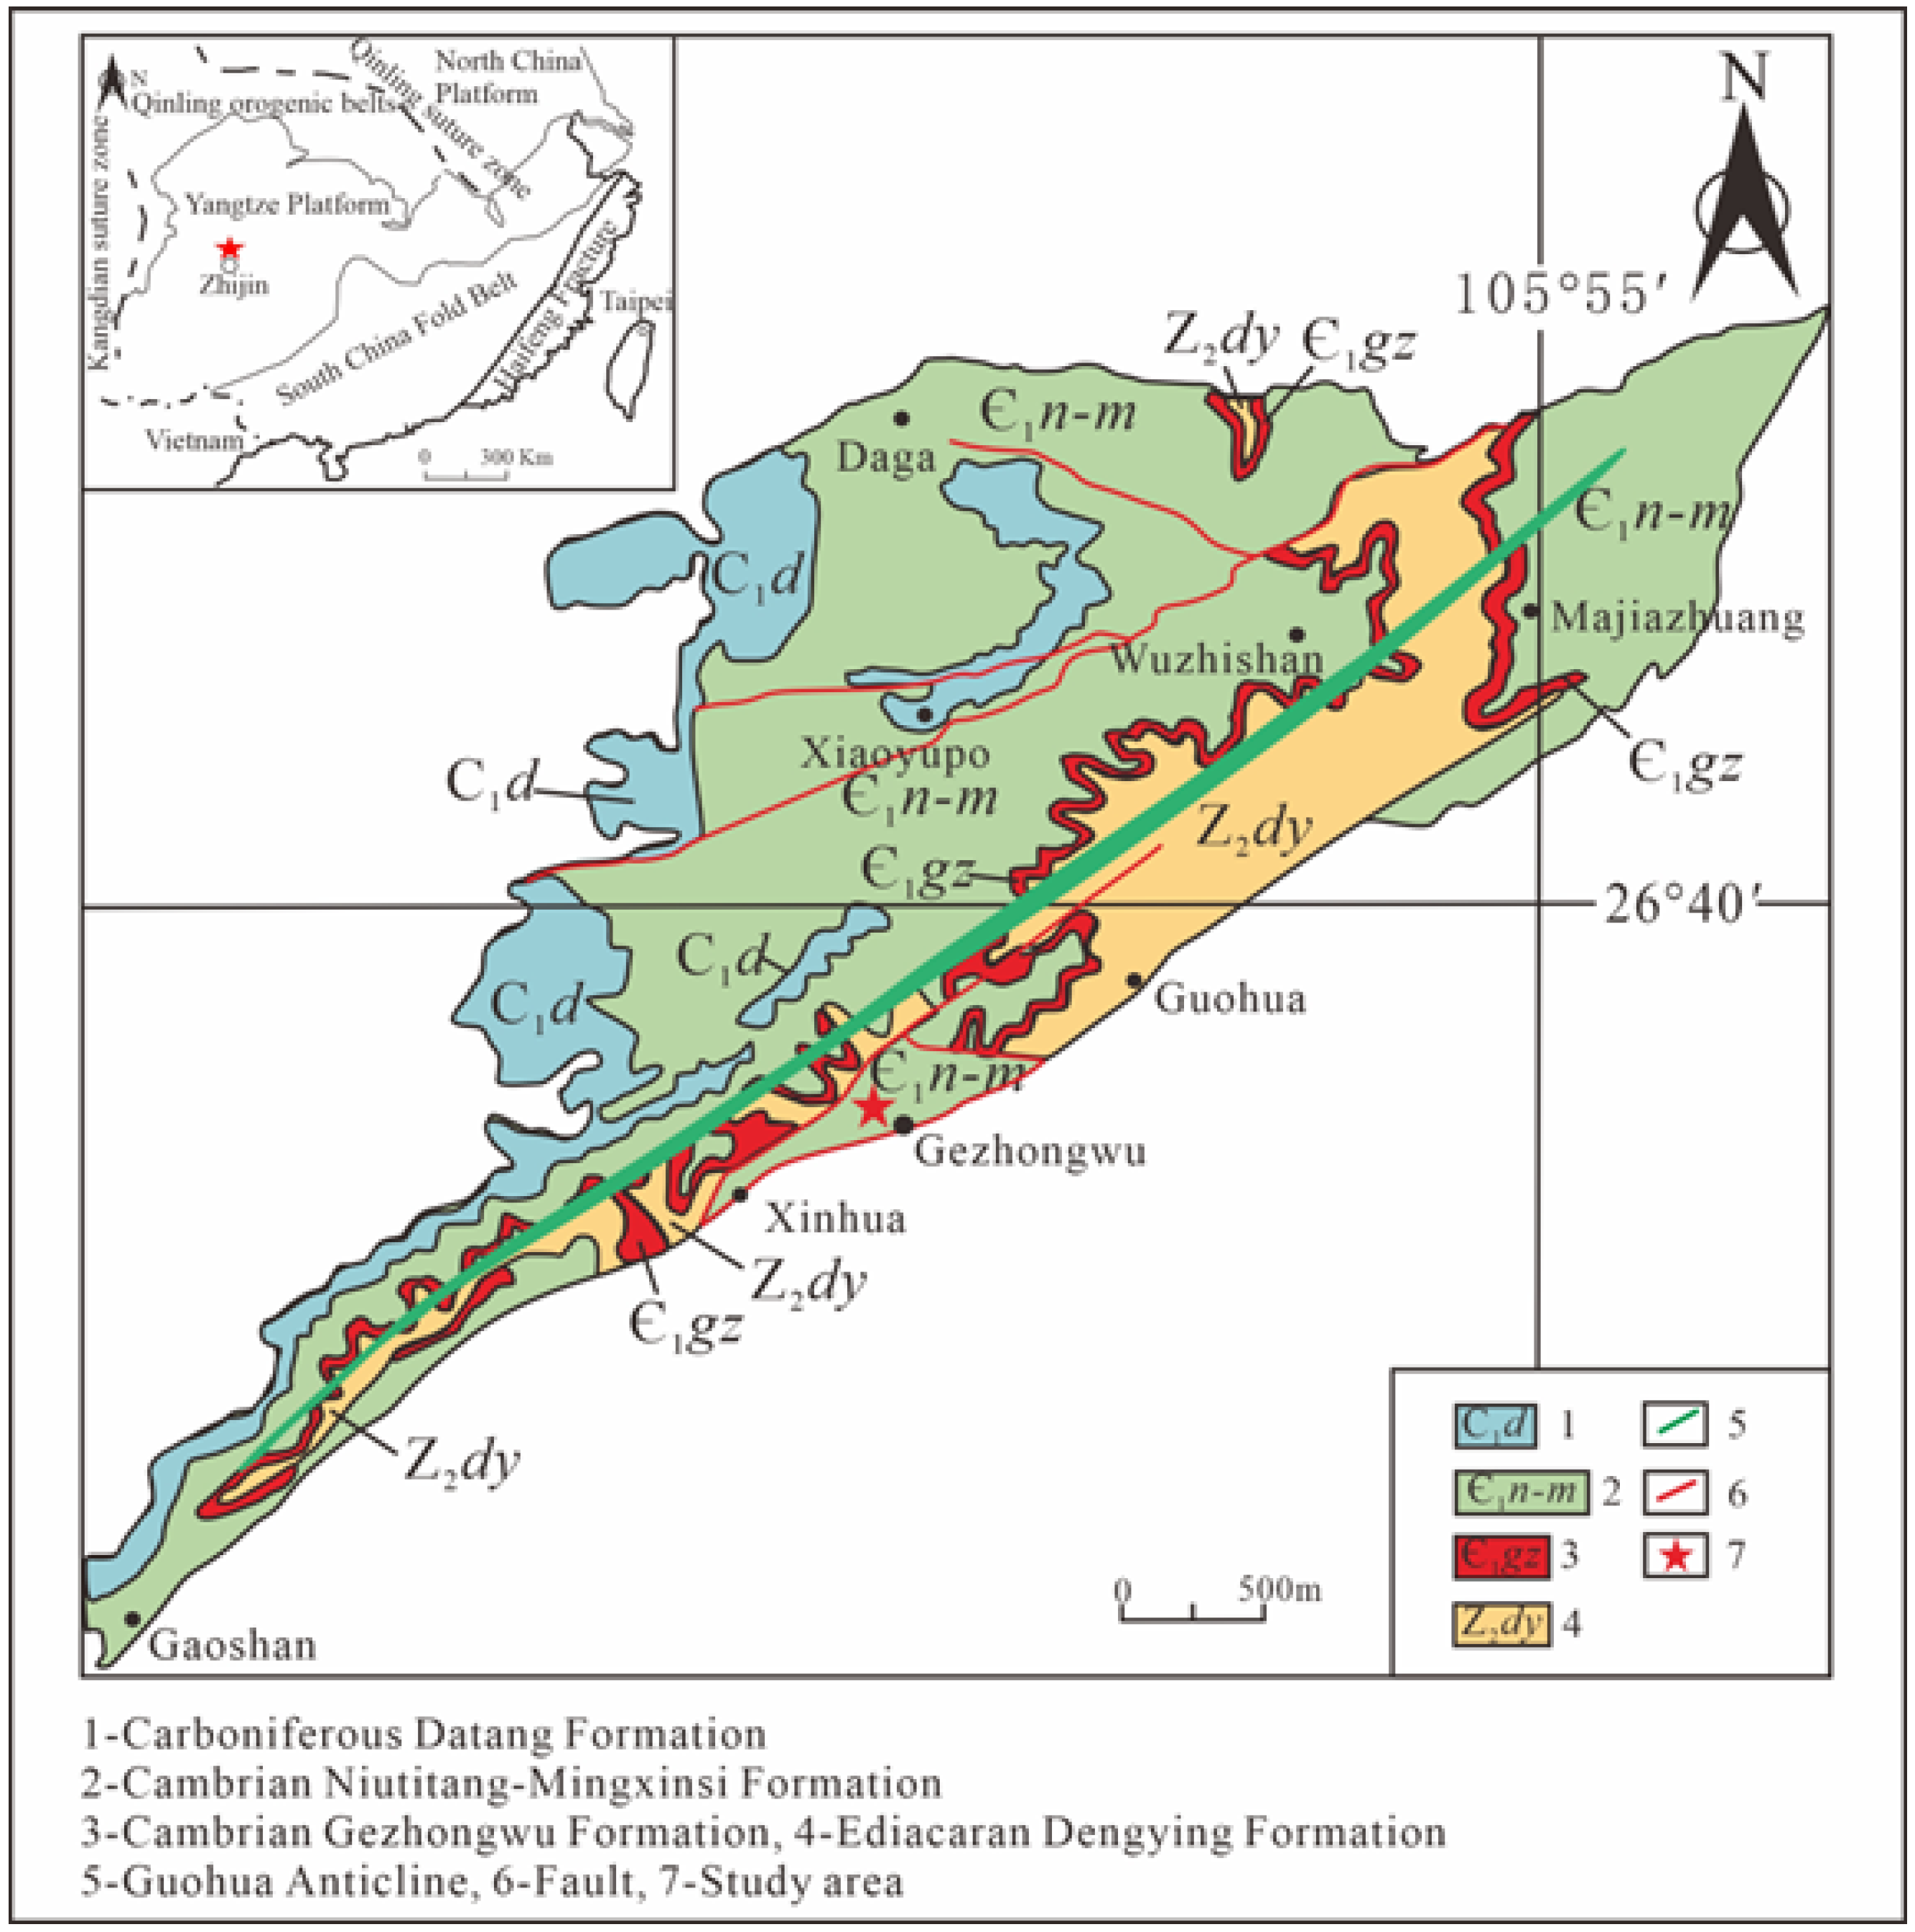
2. Geological Background
3. Materials and Methods
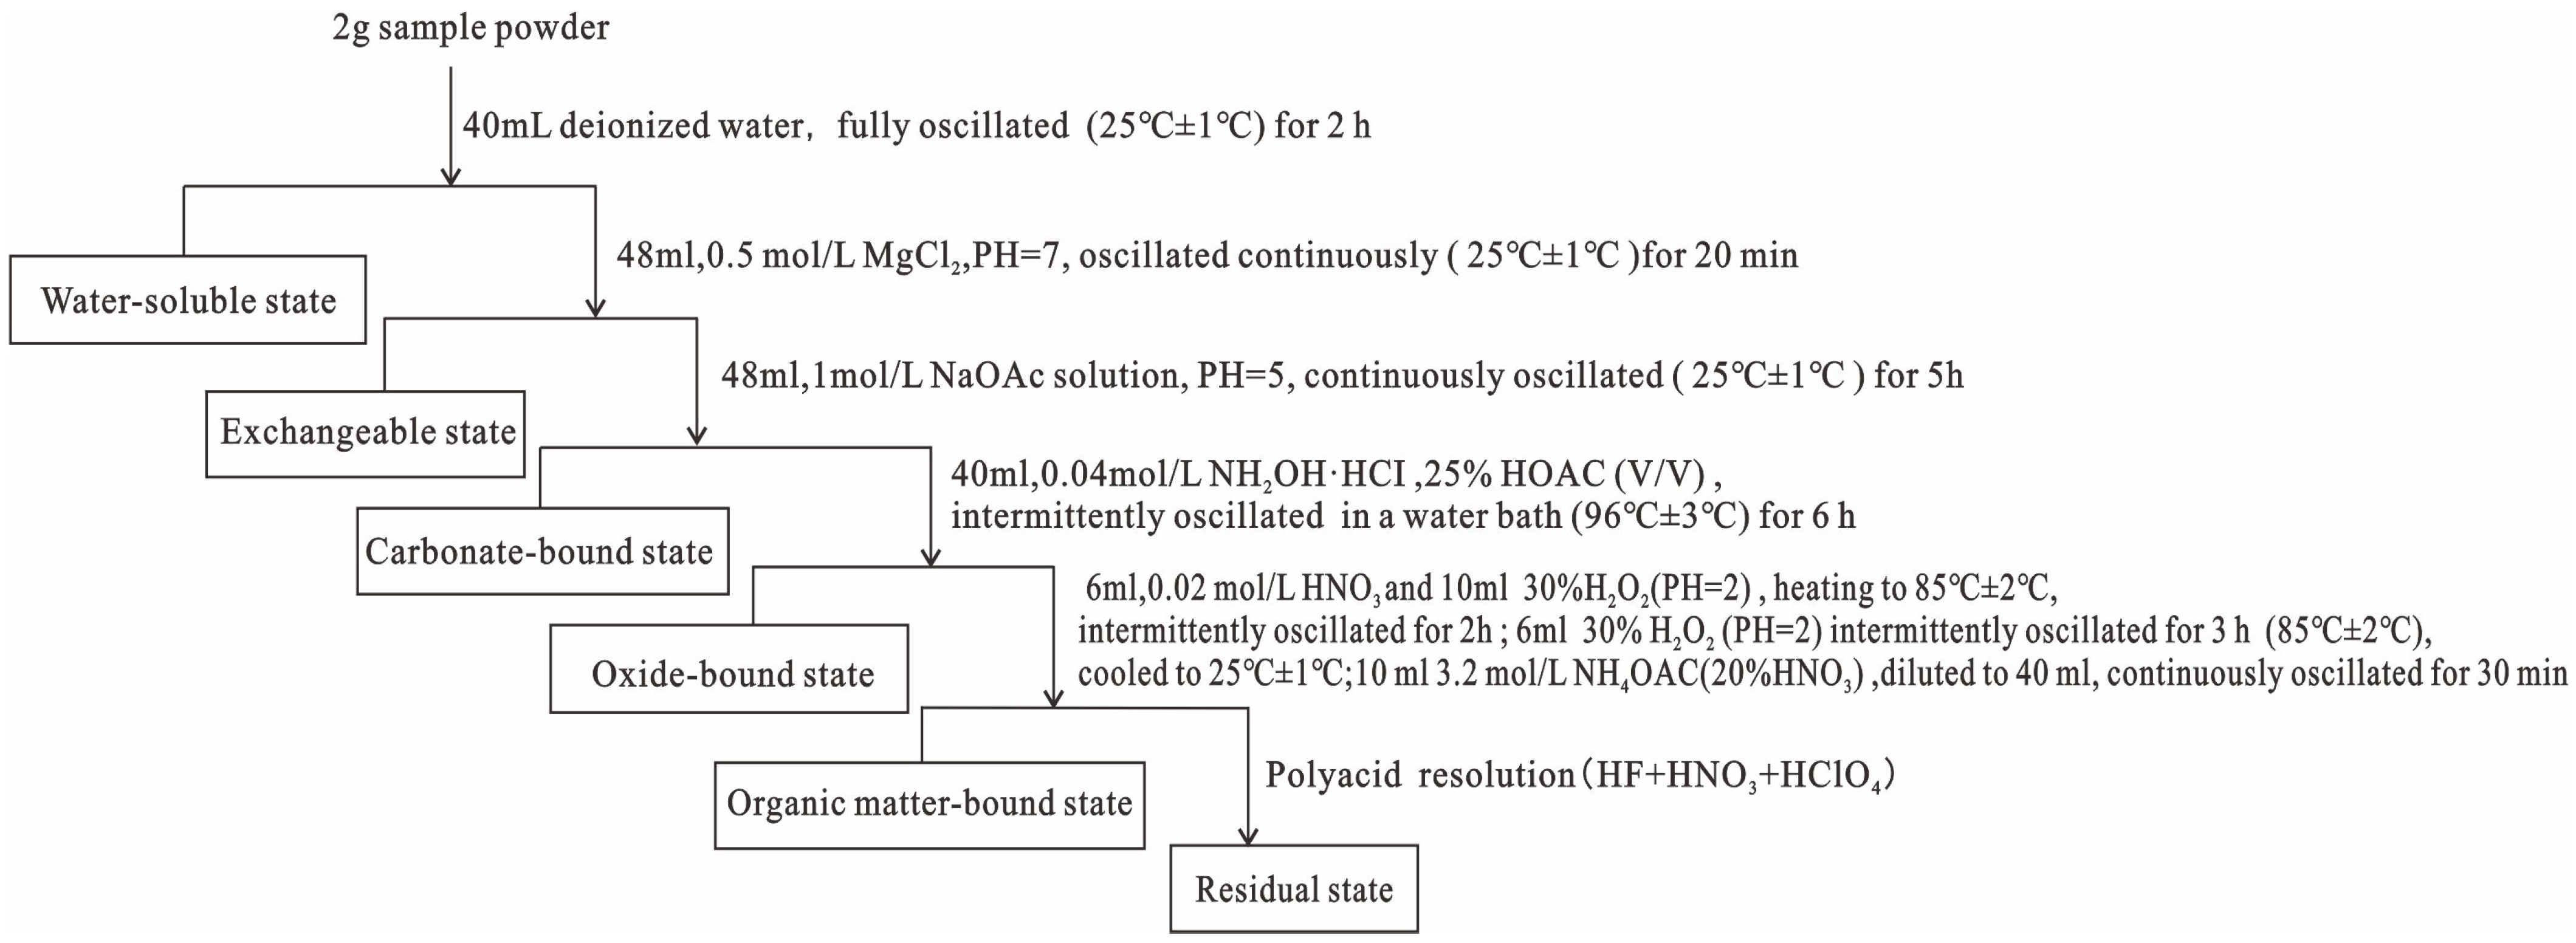
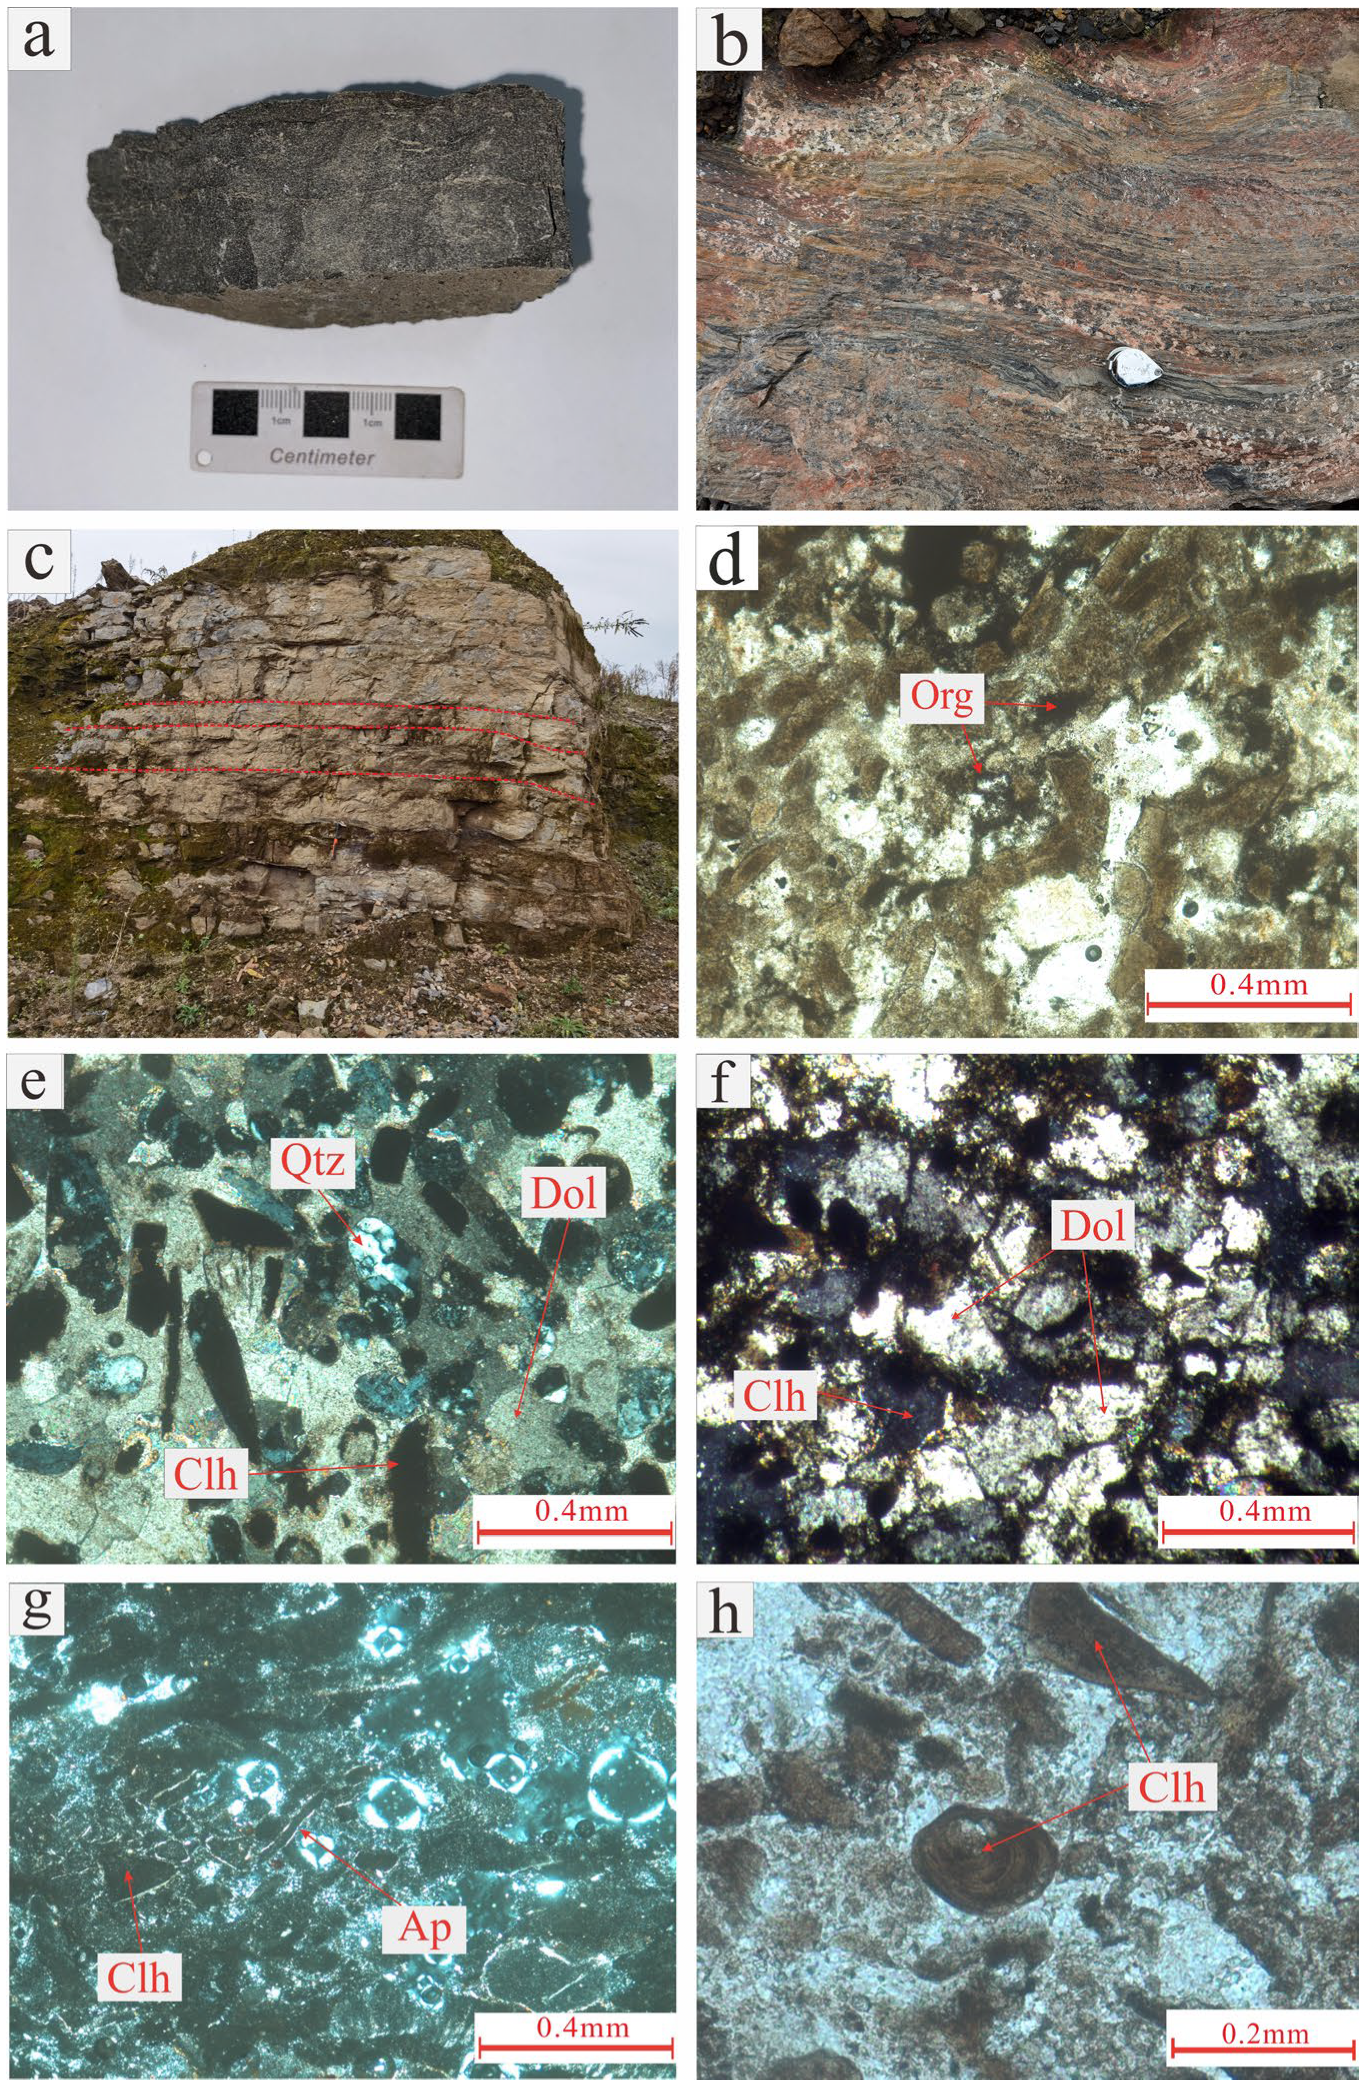
3.1. Sampling
3.2. Test Analysis
4. Results and Discussion
4.1. Correlation Analysis of the REEs and Major Ore Components
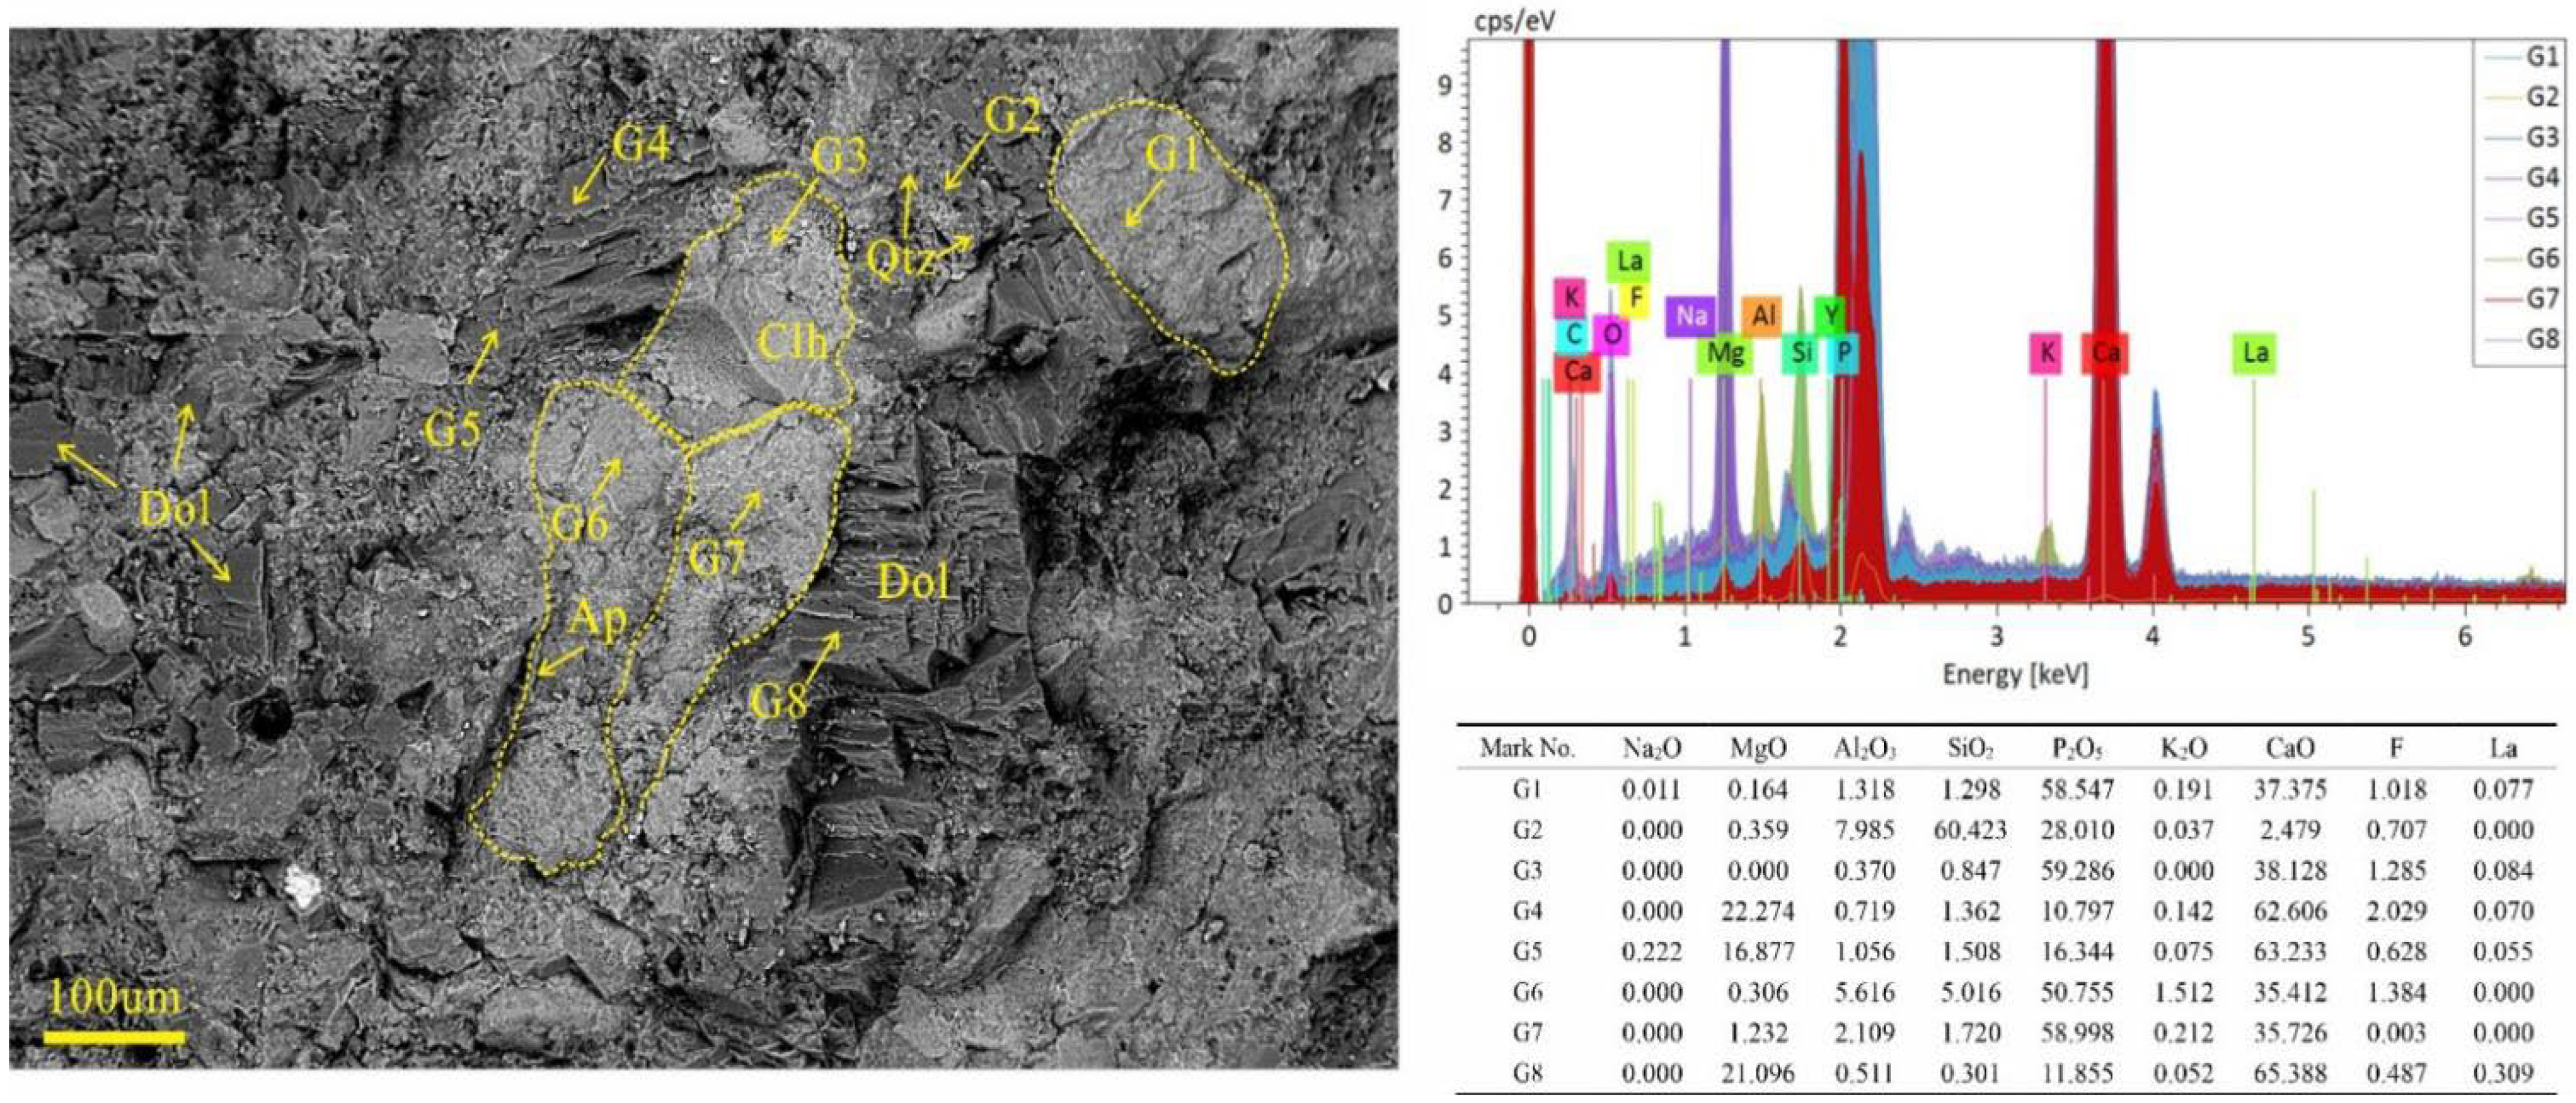
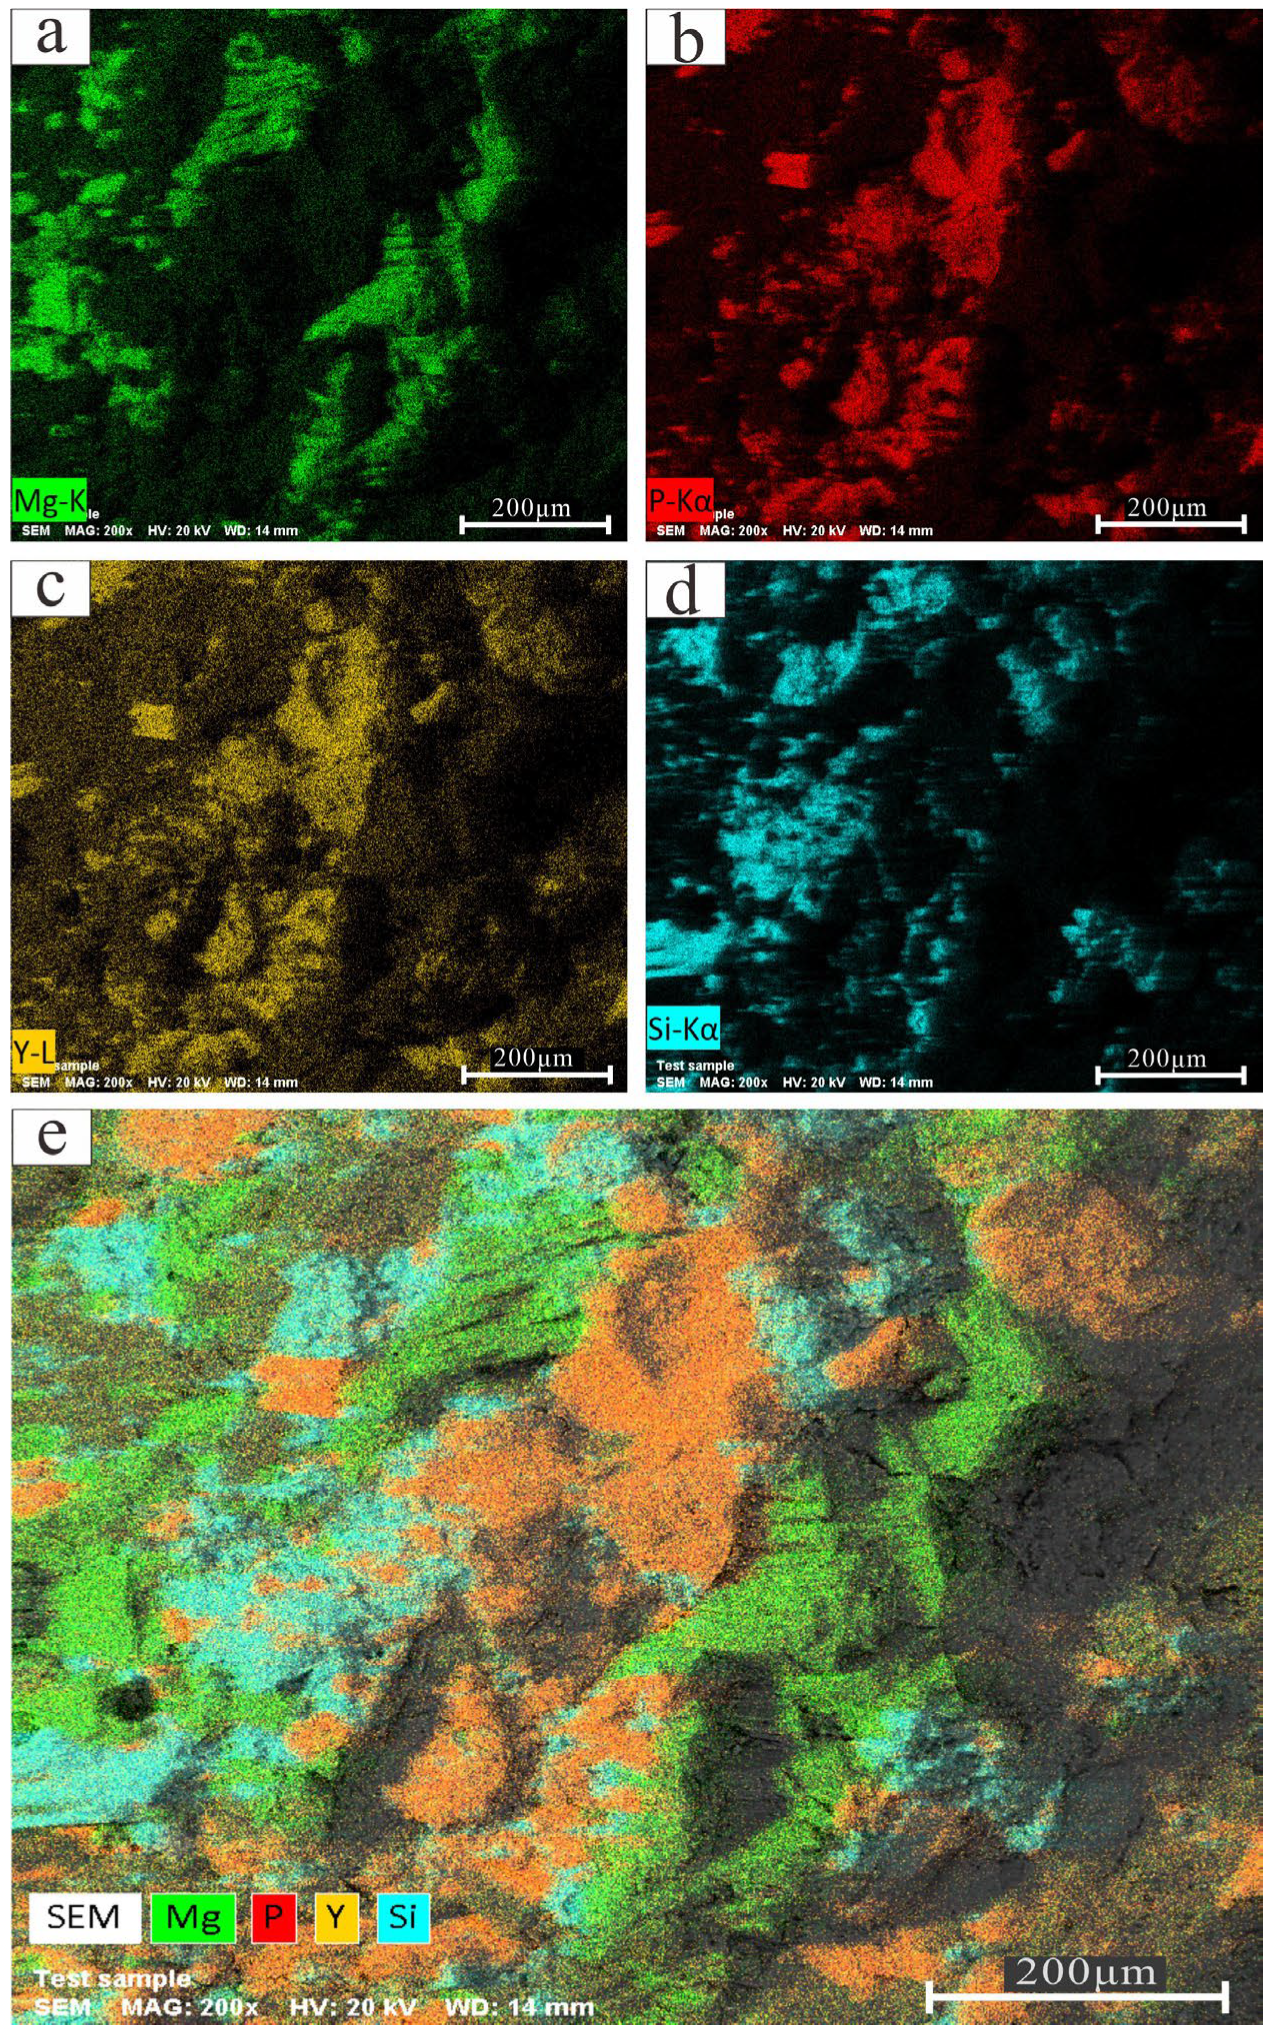
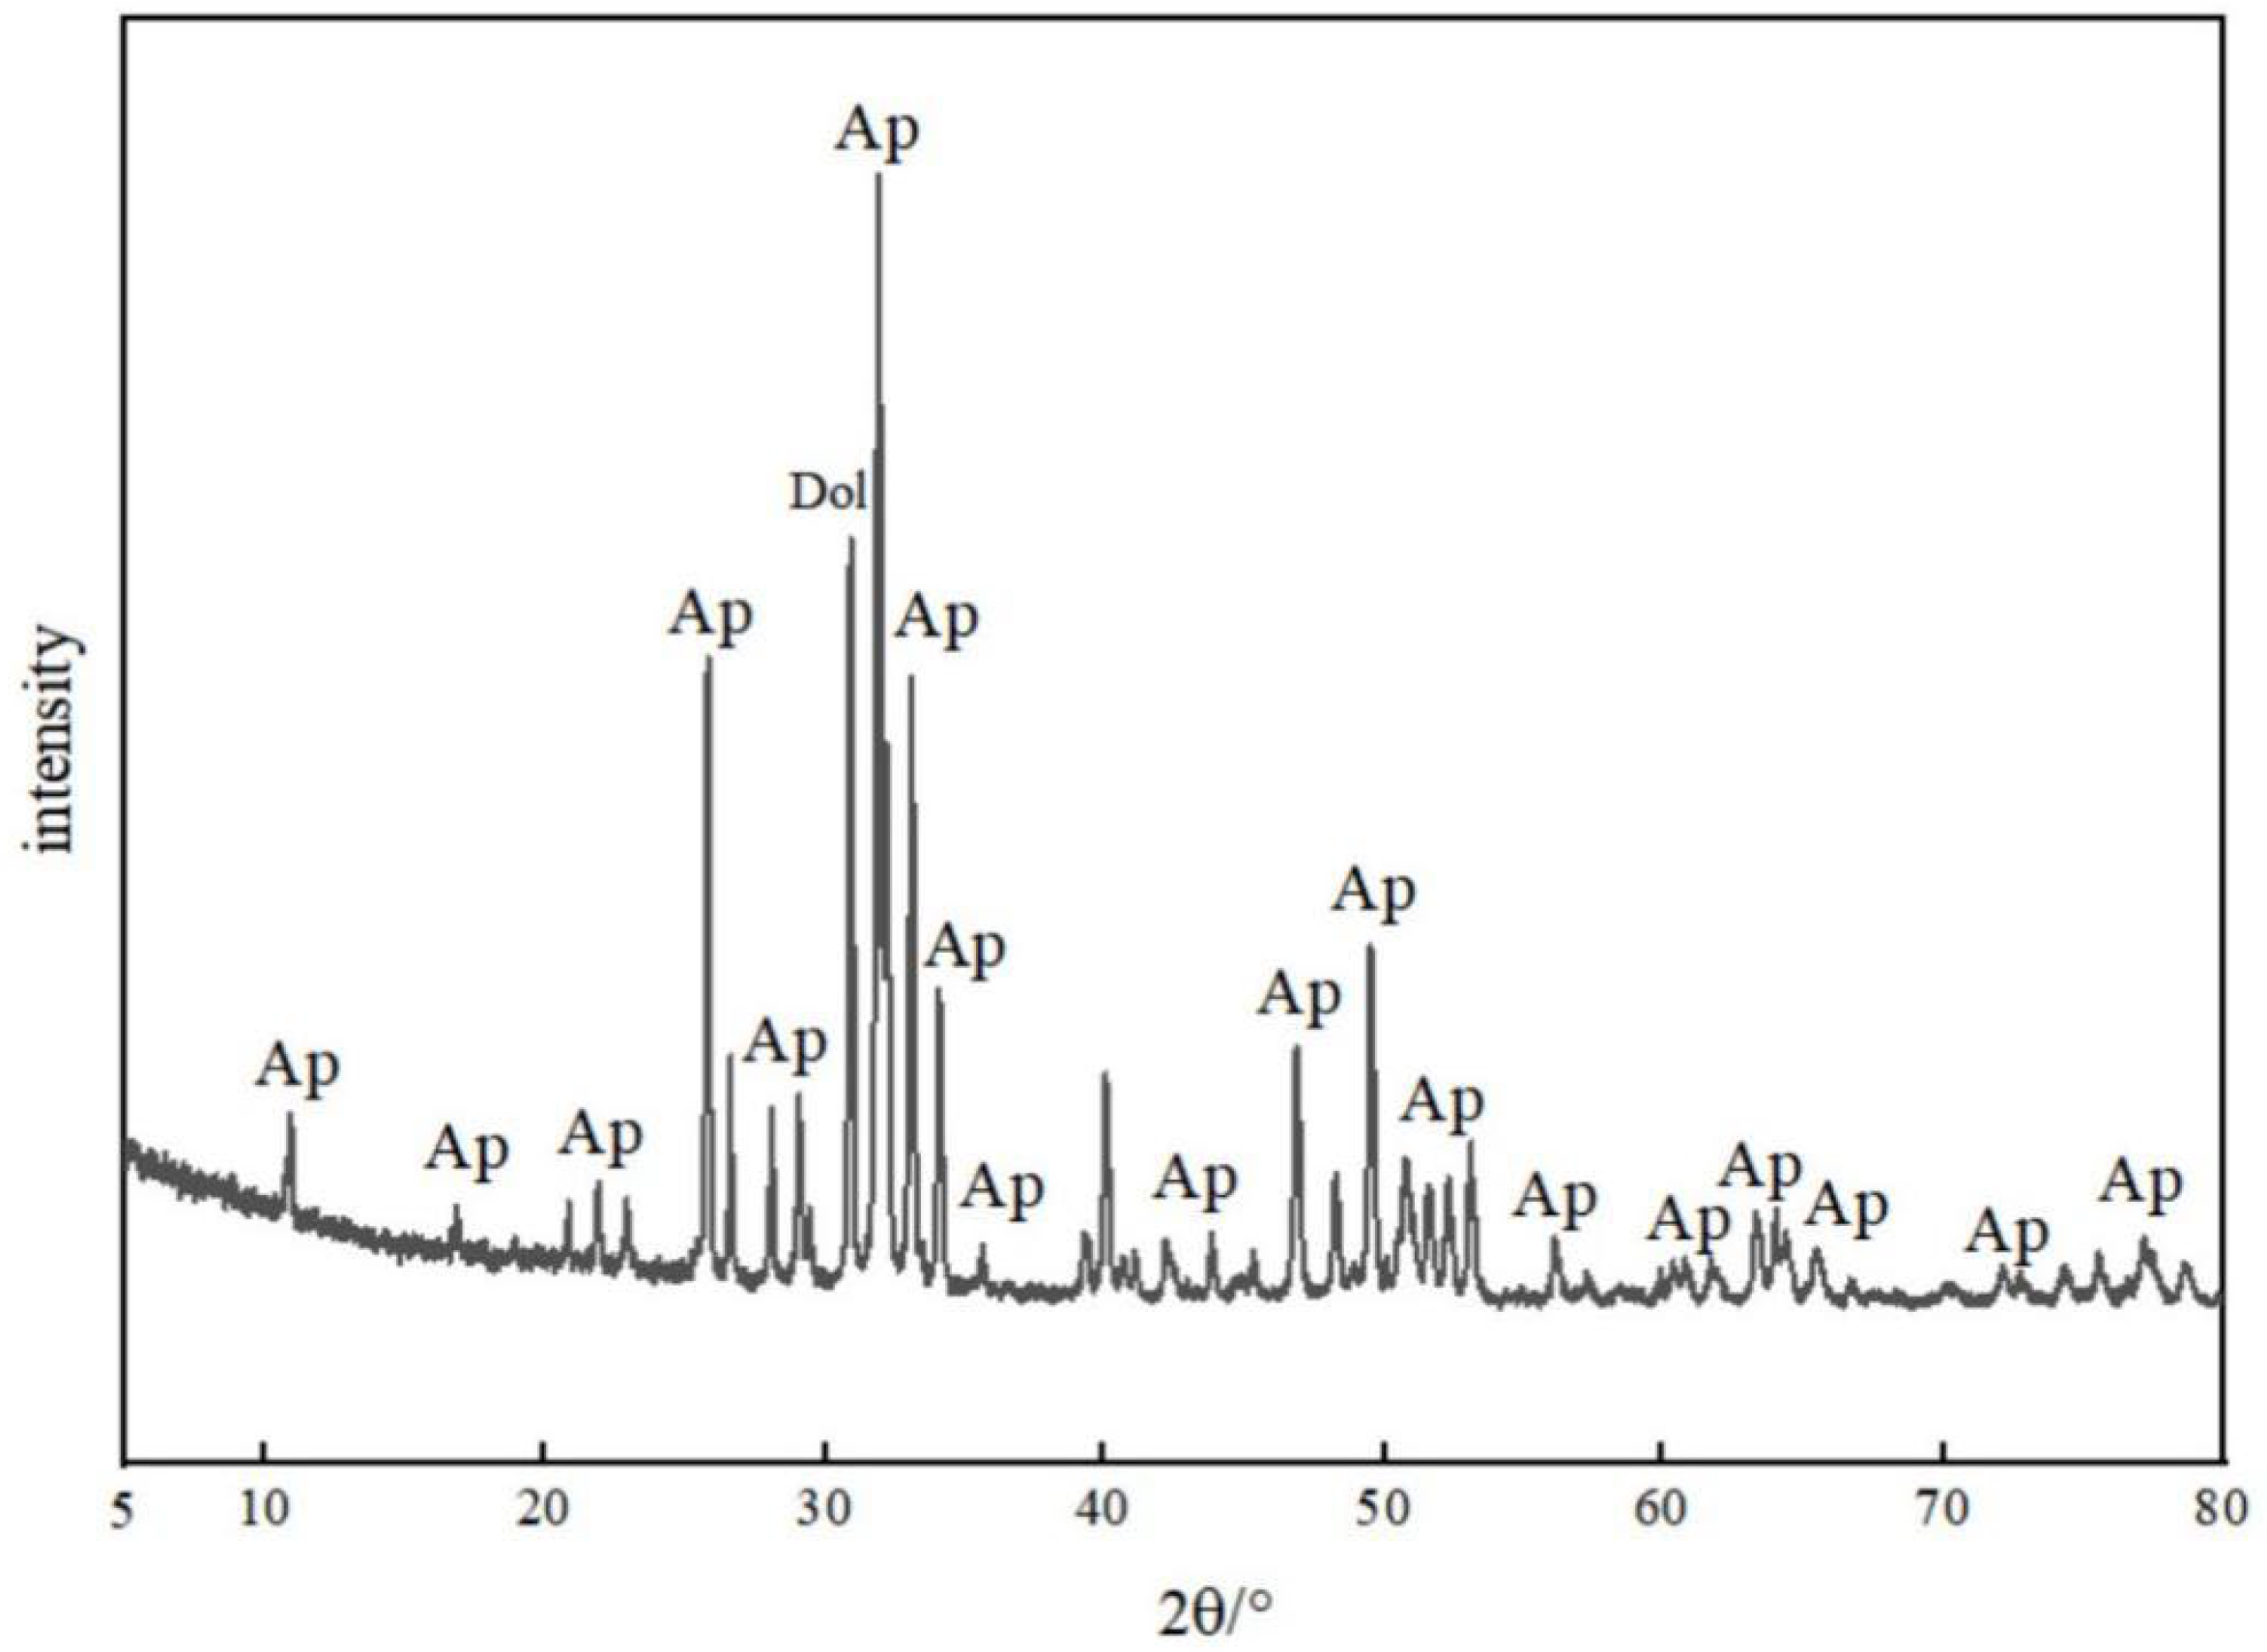
4.2. Microdistribution and Occurrence of REEs Based on SEM-EDS and XRD
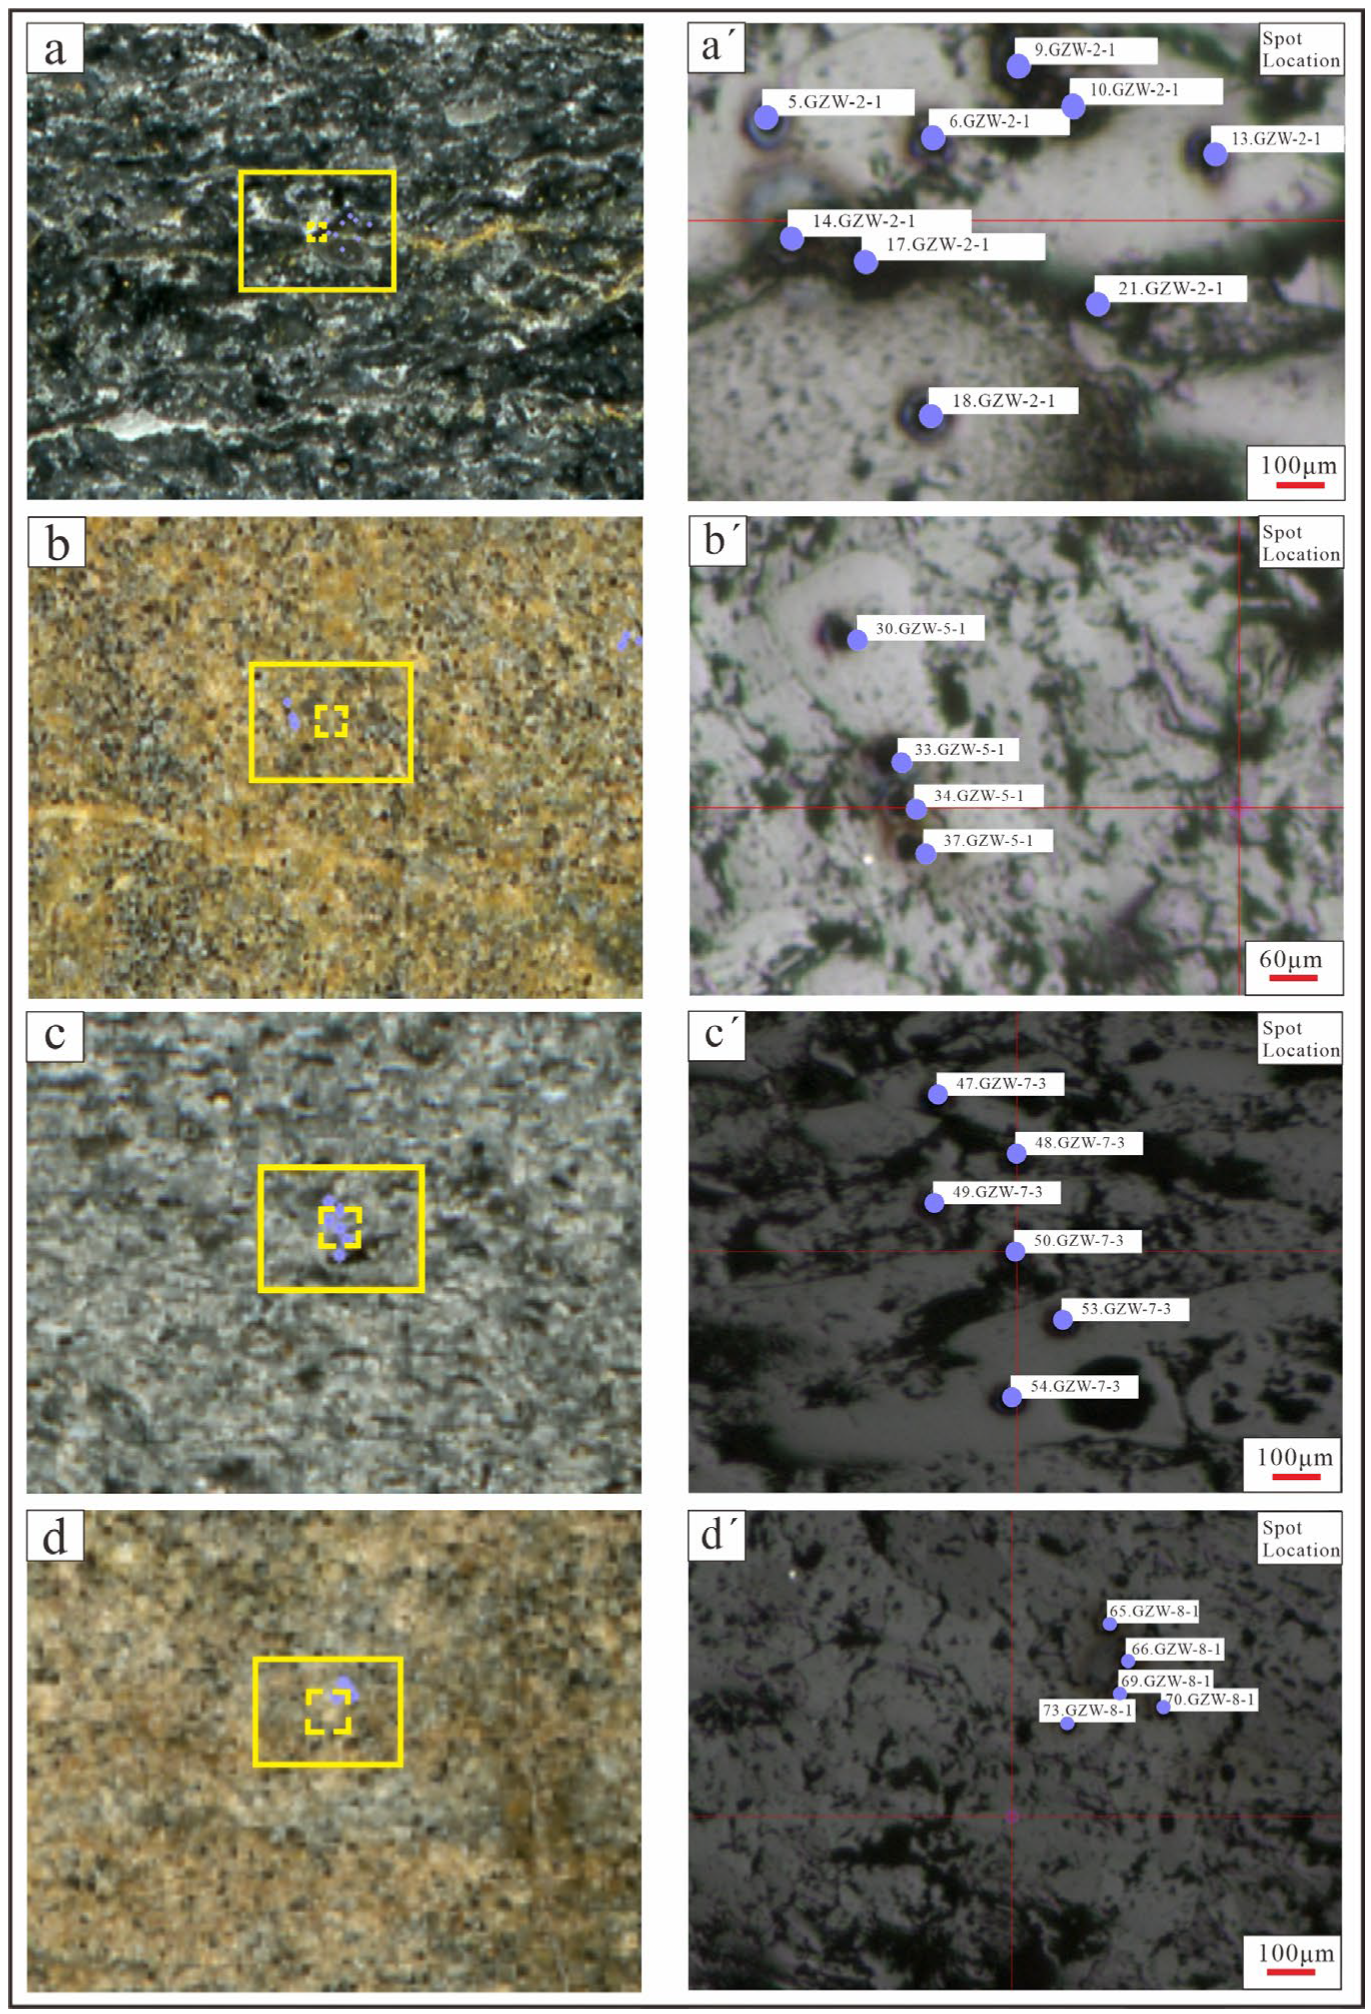
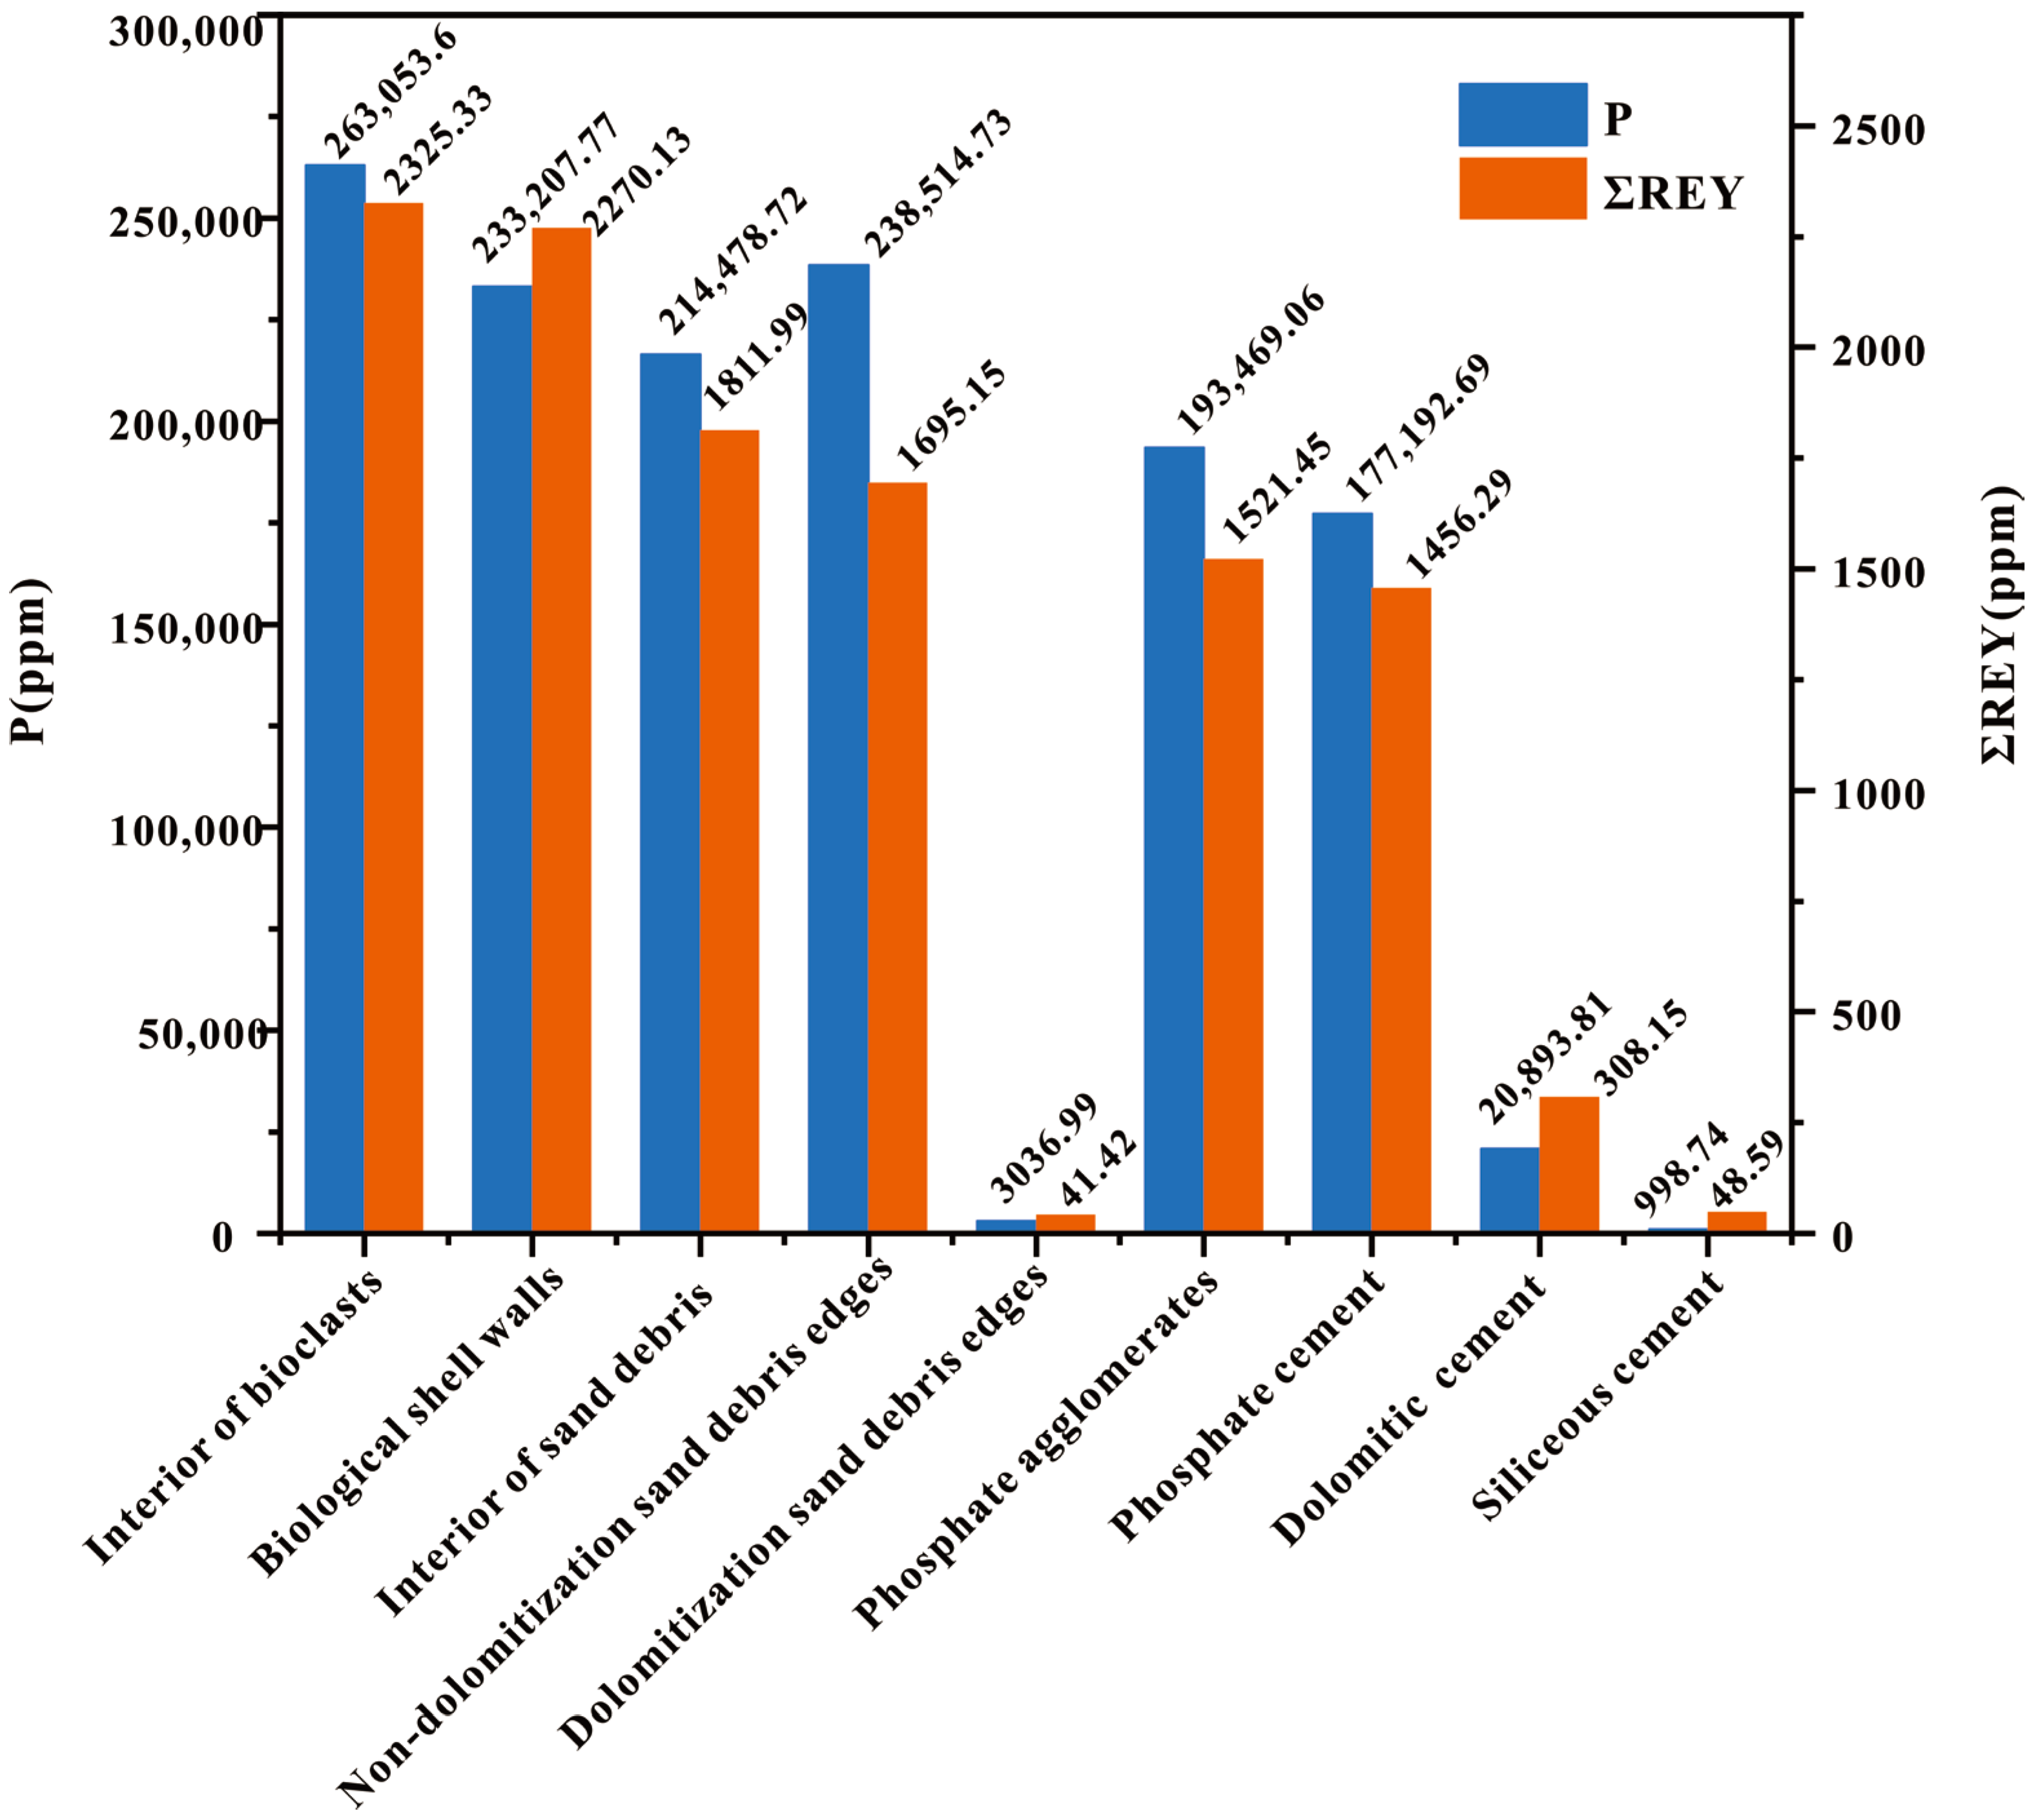
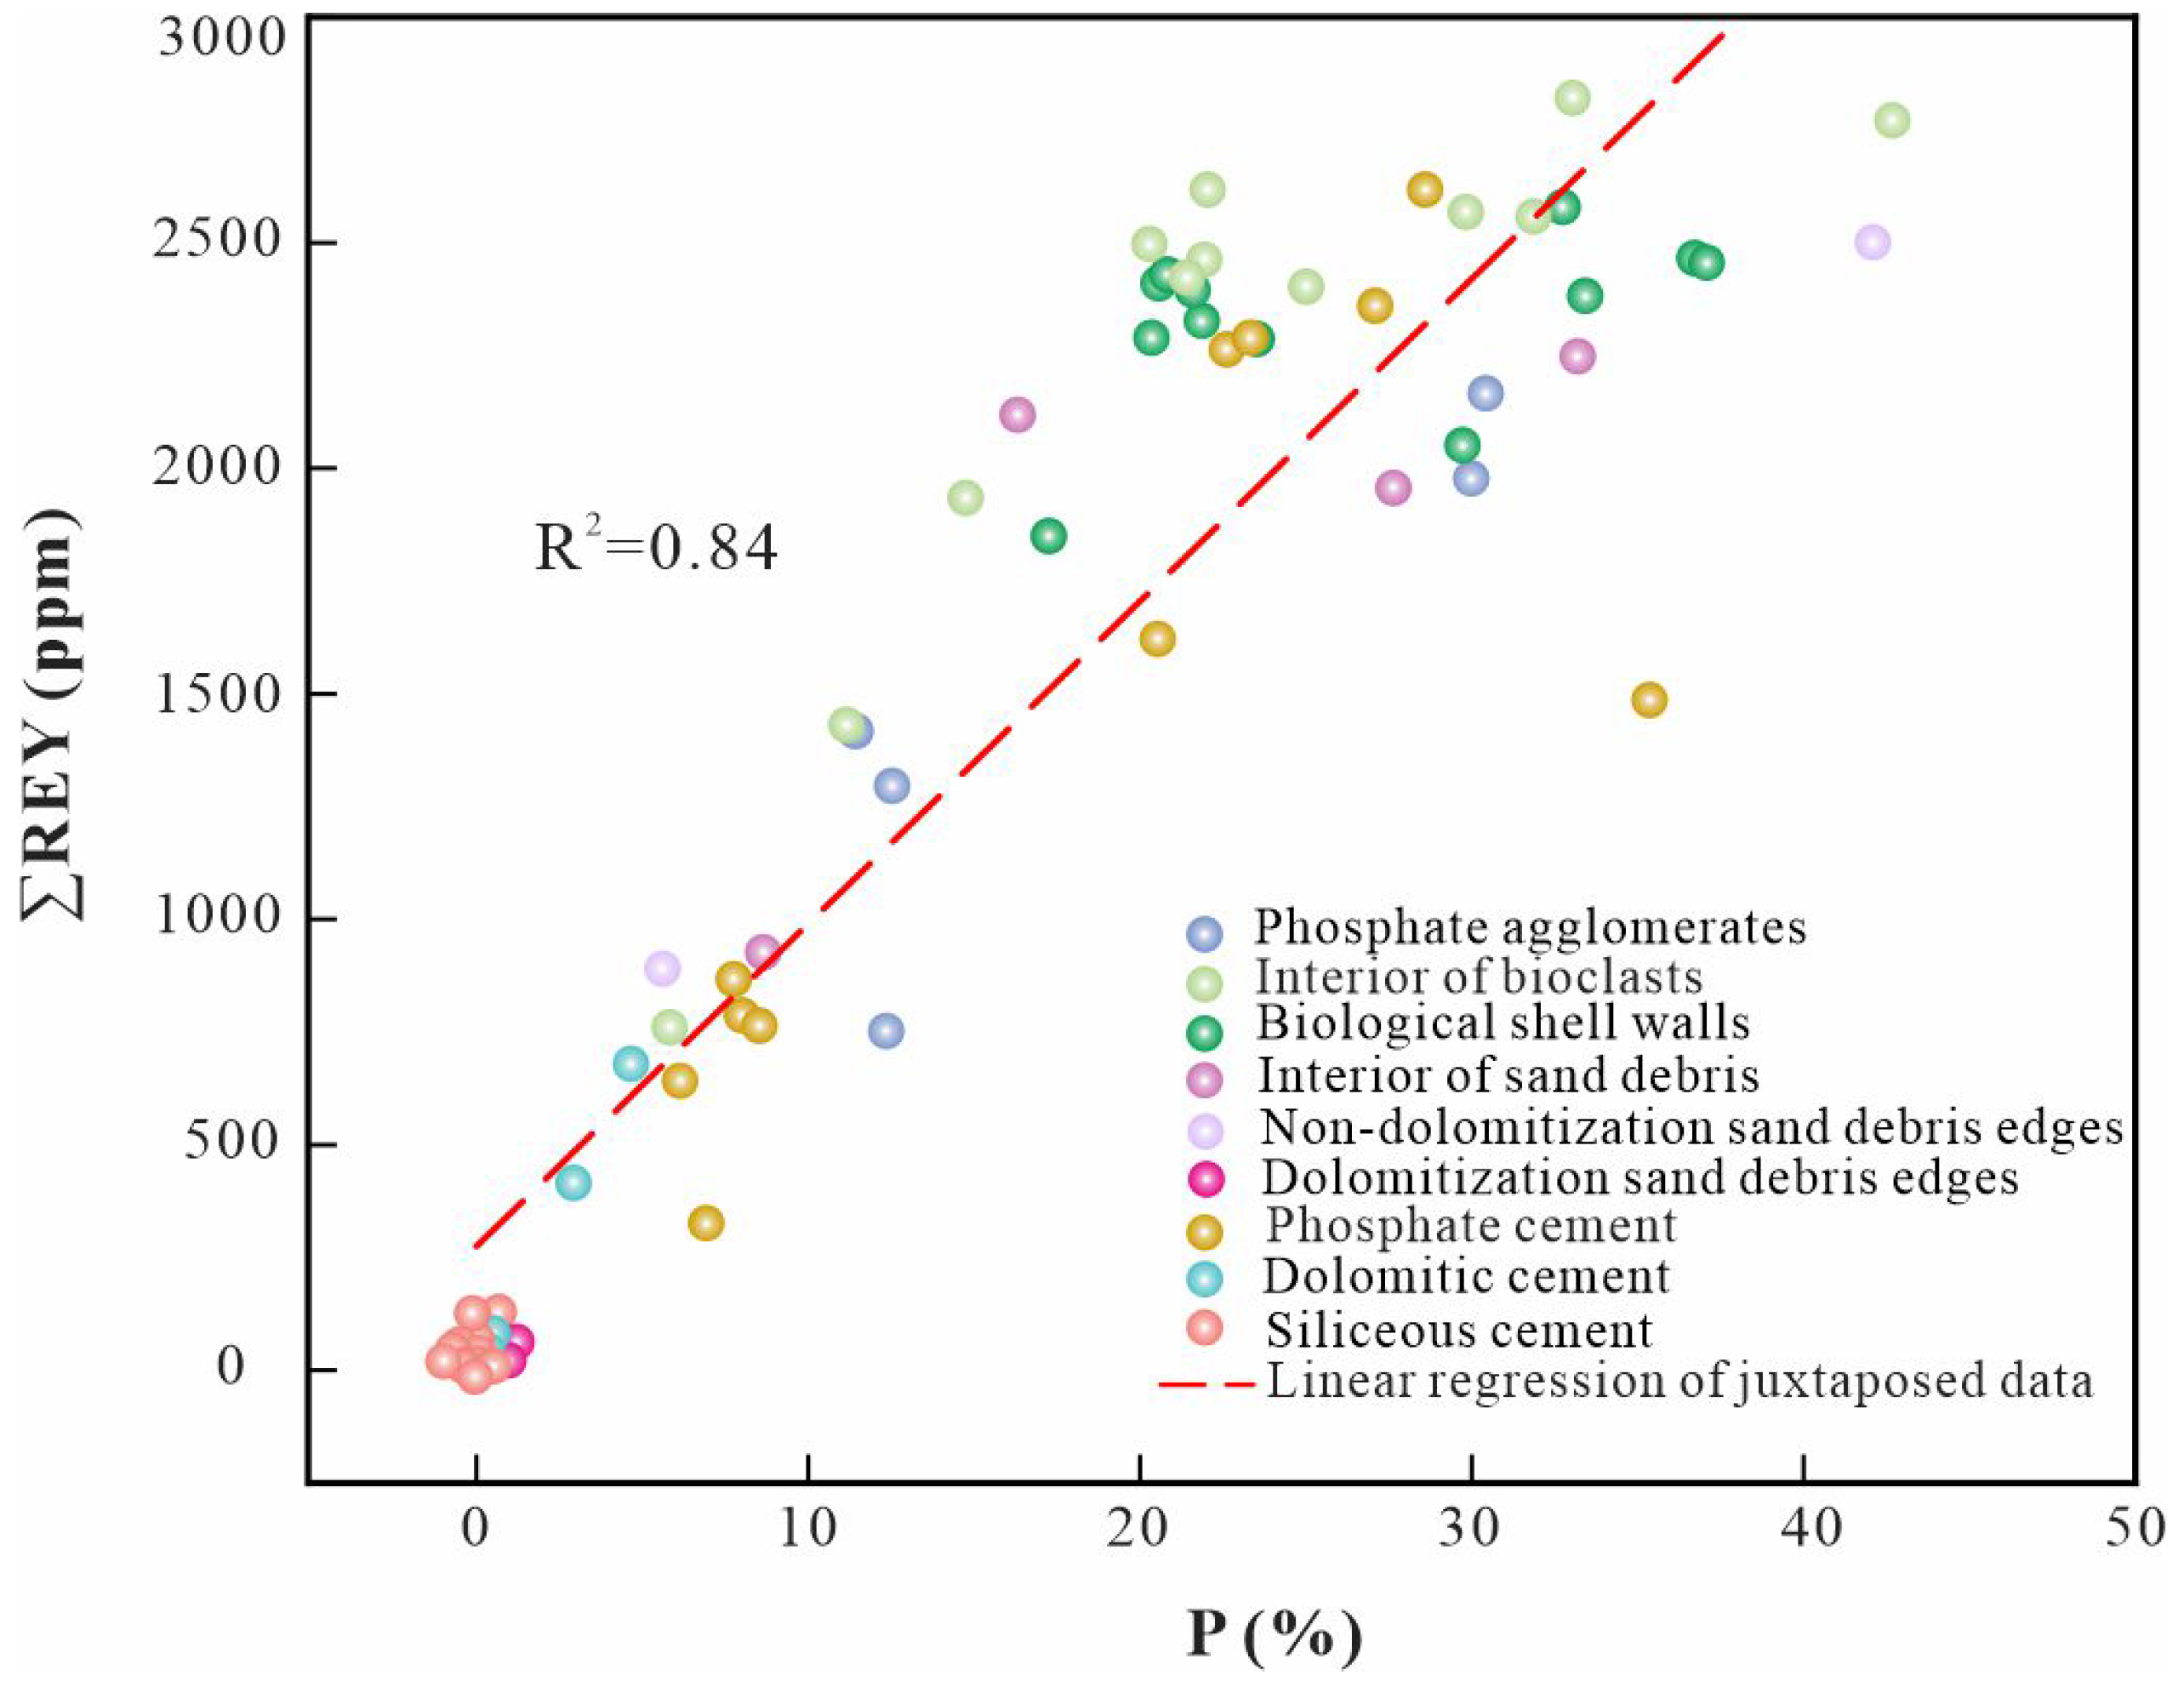
4.3. Microdistribution and Occurrence Modes of REEs Based on LA-ICP-MS
4.4. Sequential Extraction of REEs
4.4.1. Water-Soluble State and Exchangeable State
4.4.2. Carbonate-Bound State
4.4.3. Ferromanganese Oxide-Bound State
4.4.4. Organic Matter-Bound Form
4.4.5. Residual State
5. Conclusions
Author Contributions
Funding
Data Availability Statement
Acknowledgments
Conflicts of Interest
References
- Batapola, N.M.; Dushyantha, N.P.; Premasiri, H.M.R.; Abeysinghe, A.M.K.B.; Rohitha, L.P.S.; Ratnayake, N.P.; Dissanayake, D.M.D.O.; Ilankoon, I.M.S.K.; Dharmaratne, P.G.R.A. Comparison of Global Rare Earth Element (Ree) Resources and their Mineralogy with Ree Prospects in Sri Lanka. J. Asian Earth Sci. 2020, 200, 104475. [Google Scholar] [CrossRef]
- Zhu, M.G.; Sun, X.; Liu, R.H.; Xu, H.B. Development Strategies for Rare Earth Functional Materials by 2035. Chin. J. Eng. Sci. 2020, 22, 37–43. [Google Scholar] [CrossRef]
- Emsbo, P.; McLaughlin, P.I.; Breit, G.N.; du Bray, E.A.; Koenig, A.E. Rare Earth Elements in Sedimentary Phosphate Deposits: Solution to the Global Ree Crisis? Gondwana Res. 2015, 27, 776–785. [Google Scholar] [CrossRef]
- Xi, Q.L.; Hui, Z.; Yong, T.; Yun, L.L. REE Geochemical Characteristic of Apatite: Implications for Ore Genesis of the Phosphorite. Minerals 2020, 10, 1012. [Google Scholar] [CrossRef]
- Zhang, Z.; Jiang, Y.; Niu, H.; Xing, J.; Yan, S.; Li, A.; Weng, Q.; Zhao, X. Enrichment of Rare Earth Elements in the Early Cambrian Phosphorite Deposit, SW China: Evidence from Francolite Micro-Petrography and Geochemistry. Ore Geol. Rev. 2021, 138, 104342. [Google Scholar] [CrossRef]
- Rout, S.; Abhilash; Meshram, P.; Zhang, P. A Comprehensive Review on Occurrence and Processing of Phosphate Rock Based Resources- Focus on Rees. Miner. Process Extr. Metall. Rev. 2023, 1–21. [Google Scholar] [CrossRef]
- Liang, K.P.; Cheng, G.F.; Qin, Q.Y.; Wu, R.; Li, B. A Preliminary Study on Formation Conditions and Weathering Leaching Enrichment of Secondary Phosphorite in the Xinhua Phosphate Mining Area, Guizhou. Bull. Geol. Sci. Technol. 2022, 41, 172–183. [Google Scholar] [CrossRef]
- Wang, C.J.; Xie, H.; Wang, Y.H. Characteristics and Indication of Sedimentary Environment and Mineral Provenance of Phosphorite-Type REE Ore Deposit of Early Cambrian in Guizhou. Chin. Soc. Rare Earths. 2023, 41, 1–24. [Google Scholar]
- Xie, H.; Zhu, L.J. Existing State and Distribution Regularity of Rare Earth Elements from Early Cambrian Phosphorite in Guizhou. Chin. Soc. Rare Earths. 2012, 30, 620–627. [Google Scholar]
- Duan, K.B.; Wang, D.H.; Xiong, X.X.; Lian, W.; Gao, P.; Wang, Y.L.; Zhang, Y.A. Review of a Preliminary Quantitative Study and Genetic Analysis for Rare Earth Elements of Ionic Adsorption State in Phosphate Ore Deposit in Zhijin, Guizhou Province. Rock Miner. Anal. 2014, 33, 118–125. [Google Scholar] [CrossRef]
- Xie, J. Research on the Isomorphism Mechanism of Rare Earths in Phosphorite in Guizhou. Ph.D. Thesis, Guizhou University, Guiyang, China, 2020. [Google Scholar] [CrossRef]
- Xing, J.Q.; Zhang, Z.Y.; Xian, H.Y.; Jiang, Y.H.; Liang, X.L.; Qin, W.; Niu, H.C.; He, H.P.; Zhu, J.X. Enrichment Mechanism, Occurrence State and Availability of REEs in the Phosphorite Deposit, Guizhou, China. Bull. Miner. Petrol. Geochem. 2022, 41, 505–516+463–464. [Google Scholar] [CrossRef]
- He, S.; Xia, Y.; Xiao, J.; Gregory, D.; Xie, Z.; Tan, Q.; Yang, H.; Guo, H.; Wu, S.; Gong, X. Geochemistry of REY-Enriched Phosphorites in Zhijin Region, Guizhou Province, SW China: Insight into the Origin of REY. Minerals 2022, 12, 408. [Google Scholar] [CrossRef]
- Wu, S.; Fan, H.; Xia, Y.; Meng, Q.; Gong, X.; He, S.; Liu, X.; Yang, H.; Wen, H. Sources of Rare Earth Elements and Yttrium in the Early Cambrian Phosphorites in Zhijin, Southwest China. Ore Geol. Rev. 2022, 150, 105146. [Google Scholar] [CrossRef]
- Liu, S.R.; Hu, R.Z.; Yao, L.B.; Zhou, G.F. The Independent Rare Earth Minerals were Discovered for the First Time in the Xinhua Phosphorus Deposit in Zhijin, Guizhou Province. Acta Miner. Sin. 2006, 1, 118. [Google Scholar] [CrossRef]
- Chen, W.X. Study on the Occurrence State of Rare Earth Elements in Phosphate Ore and Its Extraction and Separation. Ph.D. Thesis, China University of Geosciences, Wuhan, China, 2022. [Google Scholar] [CrossRef]
- Wu, S.; Yang, H.; Fan, H.; Xia, Y.; Meng, Q.; He, S.; Gong, X. Assessment of the Effect of Organic Matter on Rare Earth Elements and Yttrium Using the Early Cambrian Phosphorite as an Example. Minerals 2022, 12, 876. [Google Scholar] [CrossRef]
- Kechiched, R.; Laouar, R.; Bruguier, O.; Salmi-Laouar, S.; Kocsis, L.; Bosch, D.; Foufou, A.; Ameur-Zaimeche, O.; Larit, H. Glauconite-Bearing Sedimentary Phosphorites from the Tébessa Region (Eastern Algeria): Evidence of Ree Enrichment and Geochemical Constraints on their Origin. J. Afr. Earth Sci. 2018, 145, 190–200. [Google Scholar] [CrossRef]
- Zhu, B.; Jiang, S.Y. A LA-ICP-MS analysis of rare earth elements on phosphatic grains of the Ediacaran Doushantuo phosphorite at Weng’an, South China: Implication for depositional conditions and diagenetic processes. Geol. Mag. 2017, 154, 1381–1397. [Google Scholar] [CrossRef]
- Xia, X.H.; Han, Y.C.; Lian, W.; Yuan, C.J.; Xu, S.K.; Yan, F.; Lian, Z.P. Sedimentary Genesis Feature of Bamianshan Unusual Large Fluorite Deposit in Zhejiang Province. Acta Sedimentol. Sin. 2010, 28, 1175–1181. [Google Scholar] [CrossRef]
- Wang, K.; Zhai, D.; Liu, J.; Wu, H. LA-ICP-MS Trace Element Analysis of Pyrite from the Dafang Gold Deposit, South China: Implications for Ore Genesis. Ore Geol. Rev. 2021, 139, 104507. [Google Scholar] [CrossRef]
- Godet, A.; Raimondo, T.; Guilmette, C. Atoll Garnet: Insights from LA-ICP-MS Trace Element Mapping. Contrib. Miner. Petrol. 2022, 177, 57. [Google Scholar] [CrossRef]
- Bernard, R.E.; Chin, E.J.; Murphy, C. Melt-Assisted Deformation in the ower Crust of an Active Plate Boundary, Baja California. Lithos 2023, 438–439, 106975. [Google Scholar] [CrossRef]
- Kumkrong, P.; Mihai, O.; Mercier, P.H.J.; Pihilligawa, I.G.; Tyo, D.D.; Mester, Z. Tessier Sequential Extraction On 17 Elements from Three Marine Sediment Certified Reference Materials (Hiss-1, Mess-4, and Pacs-3). Anal. Bioanal. Chem. 2021, 413, 1047–1057. [Google Scholar] [CrossRef]
- Park, S.; Kim, M.; Lim, Y.; Yu, J.; Chen, S.; Woo, S.W.; Yoon, S.; Bae, S.; Kim, H.S. Characterization of Rare Earth Elements Present in Coal Ash by Sequential Extraction. J. Hazard. Mater. 2021, 402, 123760. [Google Scholar] [CrossRef]
- Xu, F.; Qin, S.; Li, S.; Wang, J.; Qi, D.; Lu, Q.; Xing, J. Distribution, Occurrence Mode, and Extraction Potential of Critical Elements in Coal Ashes of the Chongqing Power Plant. J. Clean. Prod. 2022, 342, 130910. [Google Scholar] [CrossRef]
- Sut-Lohmann, M.; Ramezany, S.; Kästner, F.; Raab, T.; Heinrich, M.; Grimm, M. Using Modified Tessier Sequential Extraction to Specify Potentially Toxic Metals at a Former Sewage Farm. J. Environ. Manag. 2022, 304, 114229. [Google Scholar] [CrossRef]
- Zhou, Z.R. Study on Occurrence State and Source of Uranium in Phosphorus Deposits of Bahuang, Tongren, Guizhou Province. Master’s Dissertation, Guizhou University, Guiyang, China, 2017. Available online: https://kns.cnki.net/KCMS/detail/detail.aspx?dbname=CMFD201801&filename=1017876759.nh (accessed on 16 February 2018).
- Shi, C.H.; Hu, R.Z.; Wang, G.Z. Study on Ree Geochemistry of Phosphorites, Guizhou Province. Miner. Petrol. 2004, 4, 71–75. [Google Scholar] [CrossRef]
- Wang, Y.H.; Xie, H.; Zhang, L. Constraints of sedimentary environment on phosphorization of phosphorus-bearing rock series in Xinhua Gezhongwu Formation, County, Guizhou. Bull. Geol. Sci. Technol. 2023, 42, 201–214. [Google Scholar] [CrossRef]
- Xing, J.; Jiang, Y.; Xian, H.; Zhang, Z.; Yang, Y.; Tan, W.; Liang, X.; Niu, H.; He, H.; Zhu, J. Hydrothermal Activity during the Formation of Rey-Rich Phosphorites in the Early Cambrian Gezhongwu Formation, Zhijin, South China: A Micro- and Nano-Scale Mineralogical Study. Ore Geol. Rev. 2021, 136, 104224. [Google Scholar] [CrossRef]
- Akagi, T.; Edanami, K. Sources of Rare Earth Elements in Shells and Soft-Tissues of Bivalves from Tokyo Bay. Mar. Chem. 2017, 194, 55–62. [Google Scholar] [CrossRef]
- Zuo, T.M.; Zhang, Y.K.; Wang, Q.L.; Liu, D.; Xu, Y.R. Occurrence of Uranium in a Carbonate-Siliceous-Politic Rock Uranium Deposit in Sichuan. Acta Geol. Sichuan 2016, 36, 582–584. [Google Scholar]
- Wang, Y.H.; Zhu, Y.Y.; Huang, J.D.; Song, H.Y.; Du, Y.; Li, Z. Application of Rare Earth Elements of the Marine Carbonate Rocks in Paleo environmental Researches. Adv. Earth. Sci. 2018, 33, 922–932. [Google Scholar]
- Wang, Z.G.; Xie, H.; Yang, X.; Zhou, Z.R. Stepwise Extraction Study on the Occurrence of Uranium in Tongren Bahuang Phosphorite, Guizhou. Rock. Miner. Anal. 2018, 37, 256–265. [Google Scholar] [CrossRef]
- Wang, Y.P.; Huang, Y.; Wang, S.M.; Xu, C.X.; Liu, M. Chemical Speciation of Elements in Sediments and Soils and Their Sequential Extraction Process. Geol. Bull. China 2005, 24, 728–734. [Google Scholar]
- Wang, C.J. Study on Enrichment Mechanism of Rare Earth Elements in Phosphorus Deposits in Different Sedimentary Environments of Early Cambrian in Guizhou. Master’s Thesis, Guizhou University, Guiyang, China, 2023. [Google Scholar]


| Sample No. | Lithology | P2O5 | SiO2 | Al2O3 | Fe2O3 | FeO | MgO | CaO | Na2O | K2O | MnO | TiO2 | LOL | TOC |
|---|---|---|---|---|---|---|---|---|---|---|---|---|---|---|
| NTT-9-1 | Carbonaceous shale | 0.12 | 62.43 | 15.75 | 3.76 | 0.76 | 1.59 | 0.22 | 0.04 | 4.88 | 0.01 | 0.75 | 9.49 | 1.77 |
| GZW-8-3 | Phosphorite-bearing rock | 2.99 | 11.00 | 0.69 | 3.05 | 1.22 | 16.39 | 28.14 | 0.01 | 0.22 | 0.34 | 0.04 | 37.15 | 0.01 |
| GZW-8-2 | Siliceous phosphorous rock | 22.14 | 29.94 | 0.98 | 0.12 | 0.10 | 0.32 | 33.14 | 0.07 | 0.36 | 0.01 | 0.05 | 1.77 | 0.09 |
| GZW-8-1 | Siliceous phosphorous rock | 12.01 | 64.06 | 0.62 | <0.010 | 0.10 | 0.15 | 16.48 | 0.02 | 0.16 | 0.01 | 0.04 | 1.46 | 0.03 |
| GZW-7-4 | Siliceous phosphorous rock | 17.59 | 44.53 | 2.81 | 0.05 | 0.10 | 0.38 | 23.74 | 0.02 | 0.81 | 0.01 | 0.15 | 1.91 | 0.04 |
| GZW-7-3 | Phosphorous rock | 37.38 | 2.21 | 0.43 | 0.42 | 0.35 | 0.19 | 50.65 | 0.10 | 0.16 | 0.04 | 0.04 | 2.37 | 0.05 |
| GZW-7-2 | Phosphatic rock | 14.46 | 2.86 | 0.39 | 1.02 | 0.60 | 12.69 | 37.73 | 0.02 | 0.13 | 0.16 | 0.03 | 28.66 | 0.01 |
| GZW-7-1 | Phosphorous rock | 21.51 | 2.57 | 0.48 | 0.43 | 0.35 | 8.30 | 41.48 | 0.11 | 0.18 | 0.09 | 0.04 | 19.78 | 0.01 |
| GZW-6-6 | Siliceous phosphorous rock | 26.84 | 25.21 | 1.29 | 0.50 | 0.40 | 0.44 | 36.57 | 0.06 | 0.44 | 0.03 | 0.08 | 2.55 | 0.12 |
| GZW-6-5 | Siliceous phosphorous rock | 14.03 | 58.23 | 1.51 | 0.24 | 0.20 | 0.23 | 18.83 | 0.02 | 0.45 | 0.00 | 0.08 | 1.39 | 0.11 |
| GZW-6-2 | Phosphorous rock | 32.68 | 3.11 | 0.43 | 0.12 | 0.10 | 2.68 | 47.99 | 0.09 | 0.14 | 0.03 | 0.10 | 7.63 | 0.02 |
| GZW-6-1 | Phosphatic rock | 17.27 | 4.54 | 0.43 | 0.21 | 0.15 | 10.96 | 39.06 | 0.03 | 0.15 | 0.07 | 0.04 | 24.82 | 0.01 |
| GZW-5-1 | Silica-containing phosphorous rock | 12.77 | 11.66 | 0.35 | 2.51 | 1.41 | 11.15 | 33.90 | 0.02 | 0.12 | 0.31 | 0.03 | 26.19 | 0.04 |
| GZW-4-2 | Phosphatic rock | 9.33 | 5.92 | 0.38 | 0.93 | 0.67 | 14.79 | 34.49 | 0.01 | 0.13 | 0.14 | 0.02 | 33.01 | 0.02 |
| GZW-4-1 | Phosphorous rock | 32.68 | 1.98 | 0.80 | 0.03 | 0.10 | 2.27 | 48.13 | 0.10 | 0.27 | 0.02 | 0.07 | 7.18 | 0.01 |
| GZW-3-2 | Phosphatic rock | 11.30 | 6.51 | 0.26 | 0.51 | 0.42 | 13.59 | 35.08 | 0.01 | 0.09 | 0.09 | 0.02 | 30.69 | 0.01 |
| GZW-3-1 | Phosphorous rock | 22.40 | 5.91 | 0.40 | 0.17 | 0.10 | 7.35 | 41.11 | 0.06 | 0.14 | 0.05 | 0.05 | 17.46 | 0.03 |
| GZW-2-3 | Phosphorous rock | 32.41 | 3.82 | 0.50 | 0.04 | 0.10 | 1.83 | 47.06 | 0.11 | 0.18 | 0.01 | 0.20 | 6.37 | 0.09 |
| GZW-2-2 | Phosphorite-bearing rock | 5.05 | 13.02 | 0.48 | 0.14 | 0.10 | 13.96 | 31.67 | 0.01 | 0.16 | 0.08 | 0.06 | 34.57 | 0.01 |
| GZW-2-1 | Phosphorous rock | 31.57 | 8.26 | 1.05 | 0.09 | 0.10 | 0.31 | 44.67 | 0.11 | 0.40 | 0.01 | 0.07 | 2.46 | 0.06 |
| DY-1-2 | Siliceous rock | 1.09 | 92.20 | 1.44 | 0.01 | 0.10 | 0.23 | 1.67 | 0.01 | 0.40 | 0.00 | 0.06 | 0.90 | 0.01 |
| DY-1-1 | Dolomite rock | 0.28 | 2.60 | 0.14 | 0.16 | 0.10 | 21.71 | 30.03 | 0.01 | 0.05 | 0.08 | 0.01 | 44.94 | 0.01 |
| Sample No. | Lithology | La | Ce | Pr | Nd | Sm | Eu | Gd | Tb | Dy | Ho | Er | Tm | Yb | Lu | Y | ΣREY |
|---|---|---|---|---|---|---|---|---|---|---|---|---|---|---|---|---|---|
| NTT-9-1 | Carbonaceous shale | 41.30 | 76.90 | 8.01 | 25.80 | 4.02 | 0.73 | 3.25 | 0.57 | 3.70 | 0.82 | 2.51 | 0.42 | 2.79 | 0.43 | 21.90 | 193.14 |
| GZW-8-3 | Phosphorite-bearing rock | 37.80 | 25.30 | 6.13 | 26.20 | 4.79 | 1.06 | 5.92 | 0.85 | 5.31 | 1.21 | 3.35 | 0.46 | 2.56 | 0.35 | 66.70 | 187.99 |
| GZW-8-2 | Siliceous phosphorous rock | 280.15 | 204.00 | 49.40 | 220.00 | 41.80 | 12.70 | 50.00 | 6.56 | 37.10 | 7.66 | 18.70 | 2.14 | 9.70 | 1.18 | 471.00 | 1412.09 |
| GZW-8-1 | Siliceous phosphorous rock | 138.00 | 98.00 | 26.20 | 117.00 | 22.70 | 7.48 | 27.00 | 3.55 | 20.00 | 4.17 | 10.20 | 1.18 | 5.32 | 0.65 | 237.00 | 718.45 |
| GZW-7-4 | Siliceous phosphorous rock | 208.00 | 172.00 | 38.30 | 173.00 | 33.60 | 11.00 | 40.70 | 5.45 | 31.50 | 6.65 | 16.50 | 1.91 | 8.76 | 1.07 | 402.00 | 1150.44 |
| GZW-7-3 | Phosphorous rock | 398.50 | 234.00 | 59.80 | 254.00 | 45.30 | 10.40 | 55.00 | 7.63 | 45.60 | 9.93 | 25.30 | 3.04 | 14.20 | 1.77 | 654 | 1818.47 |
| GZW-7-2 | Phosphatic rock | 138.00 | 94.70 | 25.30 | 111.00 | 20.60 | 6.18 | 25.40 | 3.40 | 19.70 | 4.21 | 10.70 | 1.29 | 6.05 | 0.77 | 263.00 | 730.30 |
| GZW-7-1 | Phosphorous rock | 240.00 | 152.00 | 37.20 | 160.00 | 29.00 | 8.37 | 35.40 | 4.85 | 28.40 | 6.12 | 15.50 | 1.85 | 8.62 | 1.08 | 399.00 | 1127.39 |
| GZW-6-6 | Siliceous phosphorous rock | 336.00 | 225.00 | 54.30 | 235.00 | 43.00 | 11.60 | 51.60 | 7.06 | 41.40 | 8.94 | 22.80 | 2.75 | 13.20 | 1.65 | 556.00 | 1610.30 |
| GZW-6-5 | Siliceous phosphorous rock | 159.00 | 101.00 | 27.20 | 119.00 | 22.20 | 6.57 | 26.70 | 3.63 | 21.20 | 4.54 | 11.50 | 1.40 | 6.71 | 0.84 | 281.00 | 792.49 |
| GZW-6-2 | Phosphorous rock | 365.00 | 228.00 | 57.80 | 247.00 | 44.30 | 11.60 | 53.30 | 7.34 | 43.30 | 9.32 | 23.60 | 2.80 | 13.10 | 1.63 | 590.00 | 1698.09 |
| GZW-6-1 | Phosphatic rock | 190.00 | 111.00 | 30.90 | 133.00 | 24.10 | 6.67 | 29.10 | 4.00 | 23.50 | 5.05 | 12.80 | 1.53 | 7.18 | 0.91 | 316.00 | 895.74 |
| GZW-5-1 | Silica-containing phosphorous rock | 136.00 | 93.30 | 24.50 | 106.00 | 19.90 | 5.47 | 23.80 | 3.21 | 18.60 | 3.98 | 10.10 | 1.23 | 6.05 | 0.78 | 231.00 | 683.92 |
| GZW-4-2 | Phosphatic rock | 93.60 | 54.30 | 15.30 | 65.70 | 12.00 | 2.68 | 14.50 | 2.05 | 12.40 | 2.73 | 7.19 | 0.92 | 4.66 | 0.61 | 163.00 | 451.64 |
| GZW-4-1 | Phosphorous rock | 380.14 | 218.00 | 56.10 | 238.00 | 42.20 | 9.63 | 50.80 | 7.09 | 42.50 | 9.40 | 24.3 | 2.98 | 14.40 | 1.83 | 614.00 | 1711.37 |
| GZW-3-2 | Phosphatic rock | 121.00 | 68.60 | 19.50 | 83.80 | 15.20 | 3.35 | 18.30 | 2.55 | 15.30 | 3.37 | 8.77 | 1.10 | 5.50 | 0.72 | 201.00 | 568.06 |
| GZW-3-1 | Phosphorous rock | 265.00 | 159.00 | 41.00 | 174.00 | 31.30 | 7.05 | 37.00 | 5.14 | 30.40 | 6.61 | 17.00 | 2.07 | 9.86 | 1.24 | 424.00 | 1210.67 |
| GZW-2-3 | Phosphorous rock | 405.30 | 269.00 | 68.70 | 294.00 | 53.40 | 12.50 | 62.40 | 8.60 | 50.50 | 10.80 | 27.30 | 3.29 | 15.50 | 1.94 | 669.00 | 1952.23 |
| GZW-2-2 | Phosphorite-bearing rock | 54.30 | 33.70 | 9.28 | 39.80 | 7.36 | 1.67 | 8.69 | 1.22 | 7.25 | 1.59 | 4.19 | 0.54 | 2.74 | 0.36 | 88.20 | 260.89 |
| GZW-2-1 | Phosphorous rock | 338.20 | 223.00 | 55.20 | 236.00 | 42.70 | 10.50 | 50.80 | 6.94 | 41.00 | 8.90 | 22.80 | 2.76 | 13.20 | 1.66 | 567.00 | 1620.66 |
| DY-1-2 | Siliceous rock | 6.57 | 7.33 | 1.37 | 6.08 | 1.23 | 0.30 | 1.31 | 0.18 | 1.00 | 0.21 | 0.57 | 0.08 | 0.51 | 0.07 | 9.24 | 36.05 |
| DY-1-1 | Dolomite rock | 3.52 | 3.30 | 0.65 | 2.74 | 0.52 | 0.13 | 0.58 | 0.08 | 0.47 | 0.10 | 0.28 | 0.04 | 0.20 | 0.03 | 5.02 | 17.66 |
| ΣREY | P2O5 | SiO2 | Al2O3 | Fe2O3 | FeO | MgO | CaO | Na2O | K2O | MnO | TiO2 | TOC | |
|---|---|---|---|---|---|---|---|---|---|---|---|---|---|
| ΣREY | 1.00 | ||||||||||||
| P2O5 | 0.98 | 1.00 | |||||||||||
| SiO2 | −0.18 | −0.29 | 1.00 | ||||||||||
| Al2O3 | 0.15 | 0.04 | 0.61 | 1.00 | |||||||||
| Fe2O3 | −0.52 | −0.50 | −0.19 | −0.22 | 1.00 | ||||||||
| FeO | −0.50 | −0.47 | −0.20 | −0.26 | 0.97 | 1.00 | |||||||
| MgO | −0.77 | −0.71 | −0.46 | −0.51 | 0.60 | 0.59 | 1.00 | ||||||
| CaO | 0.66 | 0.75 | −0.85 | −0.43 | −0.17 | −0.14 | −0.07 | 1.00 | |||||
| Na2O | 0.88 | 0.90 | −0.38 | −0.08 | −0.41 | −0.41 | −0.57 | 0.76 | 1.00 | ||||
| K2O | 0.23 | 0.12 | 0.55 | 0.99 | −0.24 | −0.27 | −0.55 | −0.35 | 0.01 | 1.00 | |||
| MnO | −0.62 | −0.58 | −0.30 | −0.34 | 0.97 | 0.95 | 0.76 | −0.14 | −0.47 | −0.37 | 1.00 | ||
| TiO2 | 0.55 | 0.43 | 0.15 | 0.50 | −0.37 | −0.42 | −0.53 | 0.12 | 0.37 | 0.50 | −0.45 | 1.00 | |
| TOC | 0.46 | 0.35 | 0.44 | 0.42 | −0.22 | −0.19 | −0.66 | −0.12 | 0.24 | 0.48 | −0.40 | 0.45 | 1.00 |
| Sample No. | Test Position | P | P (Avg) | La | Ce | Pr | Nd | Sm | Eu | Gd | Tb | Dy | Ho | Er | Tm | Yb | Lu | Y | ∑REY | ∑REY (Avg) |
|---|---|---|---|---|---|---|---|---|---|---|---|---|---|---|---|---|---|---|---|---|
| GZW-2-1 | phosphate agglomerates | 304,323.17 | 193,469.06 | 454.29 | 293.00 | 79.98 | 335.93 | 60.84 | 15.44 | 74.64 | 9.72 | 60.98 | 13.02 | 35.23 | 3.89 | 19.78 | 2.40 | 706.81 | 2165.94 | 1521.45 |
| 299,898.52 | 428.05 | 278.57 | 73.89 | 308.51 | 54.74 | 14.21 | 65.46 | 8.59 | 54.57 | 11.54 | 31.06 | 3.54 | 18.58 | 2.31 | 623.46 | 1977.08 | ||||
| 123,584.77 | 174.09 | 103.64 | 27.57 | 116.69 | 20.81 | 5.04 | 24.00 | 3.15 | 19.34 | 4.16 | 11.31 | 1.25 | 6.59 | 0.80 | 233.36 | 751.82 | ||||
| 125,287.36 | 284.89 | 173.59 | 47.14 | 196.22 | 34.06 | 9.04 | 43.18 | 5.61 | 35.96 | 7.73 | 20.81 | 2.43 | 12.58 | 1.59 | 420.33 | 1295.15 | ||||
| 114,251.47 | 336.92 | 200.43 | 51.81 | 214.98 | 36.22 | 8.94 | 44.03 | 5.67 | 36.38 | 7.90 | 21.30 | 2.40 | 13.05 | 1.58 | 435.66 | 1417.28 | ||||
| GZW-5-1 | interior of bioclasts | 203,510.74 | 263,053.62 | 447.84 | 307.72 | 83.16 | 361.62 | 67.75 | 18.81 | 86.47 | 11.31 | 68.64 | 14.25 | 37.53 | 4.09 | 19.04 | 2.33 | 752.42 | 2283.00 | 2325.33 |
| 205,590.03 | 473.25 | 322.18 | 88.03 | 380.76 | 72.06 | 19.81 | 90.17 | 11.61 | 72.28 | 15.06 | 39.02 | 4.10 | 19.89 | 2.35 | 792.99 | 2403.56 | ||||
| GZW-3-1 | 172,549.65 | 392.14 | 226.83 | 65.35 | 275.94 | 48.85 | 11.86 | 63.70 | 8.56 | 54.58 | 11.53 | 30.99 | 3.35 | 16.67 | 2.02 | 636.88 | 1849.26 | |||
| GZW-6-1 | 297,242.94 | 442.44 | 253.63 | 72.62 | 303.86 | 54.66 | 12.91 | 70.00 | 9.38 | 58.75 | 12.73 | 34.38 | 3.73 | 18.42 | 2.23 | 701.14 | 2050.87 | |||
| GZW-6-2 | 208,288.38 | 557.18 | 311.50 | 85.58 | 355.36 | 61.61 | 14.62 | 77.81 | 10.22 | 64.36 | 14.31 | 38.60 | 4.30 | 21.01 | 2.56 | 809.47 | 2428.49 | |||
| GZW-6-5 | 218,632.79 | 512.79 | 328.35 | 86.98 | 363.65 | 64.96 | 18.10 | 80.21 | 10.06 | 63.85 | 13.53 | 36.55 | 4.15 | 19.65 | 2.47 | 721.00 | 2326.30 | |||
| GZW-7-1 | 215,972.39 | 519.05 | 320.67 | 85.10 | 364.74 | 64.18 | 17.90 | 82.68 | 10.73 | 66.57 | 14.43 | 37.80 | 4.10 | 19.32 | 2.37 | 785.23 | 2394.87 | |||
| GZW-7-3 | 235,223.76 | 452.19 | 290.75 | 82.93 | 365.30 | 68.76 | 19.46 | 88.97 | 11.20 | 70.52 | 14.17 | 36.13 | 3.82 | 16.67 | 2.02 | 762.99 | 2285.88 | |||
| 334,237.58 | 529.99 | 291.17 | 82.55 | 339.95 | 60.28 | 13.61 | 77.90 | 10.46 | 66.15 | 14.69 | 39.34 | 4.35 | 21.85 | 2.74 | 827.21 | 2382.24 | ||||
| 327,423.26 | 615.96 | 336.53 | 90.13 | 368.76 | 64.43 | 14.06 | 81.36 | 10.55 | 69.00 | 14.98 | 40.78 | 4.63 | 22.75 | 2.90 | 841.45 | 2578.26 | ||||
| 367,203.36 | 543.62 | 306.45 | 86.18 | 365.32 | 66.91 | 15.38 | 84.28 | 10.87 | 69.66 | 14.96 | 39.82 | 4.34 | 20.75 | 2.60 | 834.85 | 2465.99 | ||||
| 370,768.53 | 533.42 | 304.70 | 87.48 | 370.47 | 65.83 | 15.39 | 85.83 | 11.08 | 68.93 | 14.84 | 39.72 | 4.32 | 20.57 | 2.55 | 830.15 | 2455.28 | ||||
| GZW-3-1 | biological shell walls | 147,448.20 | 233,207.77 | 428.36 | 239.08 | 67.61 | 283.45 | 50.35 | 11.31 | 63.18 | 8.54 | 54.57 | 12.25 | 31.40 | 3.45 | 17.03 | 2.09 | 660.97 | 1933.64 | 2270.13 |
| GZW-6-2 | 219,451.47 | 560.63 | 310.74 | 86.86 | 359.71 | 64.98 | 15.13 | 79.30 | 10.30 | 66.20 | 14.41 | 38.90 | 4.27 | 21.76 | 2.65 | 825.75 | 2461.59 | |||
| 220,438.86 | 600.22 | 332.90 | 93.97 | 388.63 | 69.63 | 16.08 | 84.84 | 11.11 | 70.56 | 15.13 | 41.02 | 4.52 | 22.96 | 2.80 | 863.38 | 2617.73 | ||||
| 111,517.25 | 328.58 | 196.69 | 50.34 | 207.17 | 36.75 | 9.45 | 44.33 | 5.97 | 38.26 | 8.16 | 22.89 | 2.60 | 13.44 | 1.75 | 464.50 | 1430.89 | ||||
| GZW-6-5 | 58,303.98 | 173.50 | 105.81 | 26.77 | 109.33 | 19.69 | 5.83 | 24.02 | 3.25 | 19.79 | 4.39 | 11.80 | 1.39 | 7.12 | 0.83 | 246.16 | 759.67 | |||
| GZW-7-1 | 426,778.54 | 608.09 | 362.99 | 105.55 | 439.34 | 78.20 | 18.79 | 96.44 | 12.63 | 79.80 | 16.58 | 42.04 | 4.53 | 20.93 | 2.52 | 882.45 | 2770.87 | |||
| GZW-7-2 | 202,821.84 | 528.55 | 323.08 | 92.31 | 389.49 | 69.07 | 17.20 | 88.02 | 11.42 | 71.75 | 15.02 | 39.32 | 4.41 | 20.55 | 2.62 | 824.19 | 2497.00 | |||
| 214,149.22 | 498.35 | 316.03 | 88.25 | 384.35 | 70.00 | 18.78 | 89.76 | 11.24 | 70.90 | 14.53 | 37.40 | 3.92 | 18.65 | 2.26 | 798.21 | 2422.62 | ||||
| GZW-7-3 | 250,125.48 | 543.48 | 305.81 | 84.67 | 350.79 | 63.75 | 14.57 | 77.84 | 10.44 | 66.32 | 14.90 | 38.46 | 4.37 | 21.34 | 2.64 | 802.56 | 2401.95 | |||
| 298,303.57 | 584.71 | 328.09 | 88.85 | 370.04 | 66.64 | 14.84 | 81.72 | 10.86 | 71.21 | 15.26 | 41.28 | 4.73 | 23.30 | 2.94 | 862.77 | 2567.23 | ||||
| 318,726.59 | 600.97 | 327.31 | 88.70 | 367.07 | 64.45 | 14.40 | 81.31 | 10.83 | 69.52 | 15.03 | 41.42 | 4.64 | 21.81 | 2.86 | 847.55 | 2557.87 | ||||
| 330,428.29 | 657.55 | 358.92 | 98.49 | 408.65 | 72.68 | 15.61 | 89.45 | 11.61 | 76.41 | 16.44 | 44.27 | 5.25 | 24.77 | 3.18 | 937.16 | 2820.45 | ||||
| GZW-3-1 | interior of sand debris | 276,426.52 | 214,478.72 | 383.64 | 254.26 | 75.79 | 331.78 | 59.60 | 17.18 | 73.27 | 9.44 | 57.87 | 12.11 | 30.87 | 3.23 | 15.22 | 1.81 | 630.01 | 1956.10 | 1811.99 |
| GZW-5-1 | 163,127.15 | 361.47 | 275.34 | 80.93 | 369.15 | 74.87 | 25.40 | 91.96 | 11.46 | 68.45 | 13.84 | 34.54 | 3.55 | 15.33 | 1.81 | 689.61 | 2117.71 | |||
| GZW-7-1 | 331,929.57 | 507.22 | 305.01 | 80.42 | 332.04 | 58.37 | 16.60 | 72.81 | 9.50 | 61.55 | 13.06 | 35.07 | 3.90 | 18.12 | 2.39 | 731.11 | 2247.15 | |||
| GZW-8-3 | 86,431.63 | 203.81 | 134.62 | 32.08 | 133.90 | 25.06 | 5.41 | 29.82 | 4.02 | 25.43 | 5.63 | 15.06 | 1.67 | 8.57 | 1.05 | 300.86 | 926.99 | |||
| GZW-3-1 | dolomitization sand debris edges | 1422.21 | 3036.99 | 7.49 | 4.15 | 1.07 | 3.96 | 0.75 | 0.17 | 0.93 | 0.13 | 1.08 | 0.32 | 1.00 | 0.12 | 0.85 | 0.15 | 14.54 | 36.73 | 41.43 |
| GZW-5-1 | 4651.76 | 7.99 | 6.52 | 1.57 | 7.70 | 1.44 | 0.40 | 1.98 | 0.24 | 1.38 | 0.28 | 0.80 | 0.09 | 0.55 | 0.07 | 15.10 | 46.12 | |||
| GZW-7-1 | nondolomitization sand debris edges | 42,0900.80 | 238,514.73 | 606.65 | 340.32 | 88.62 | 354.48 | 61.03 | 16.00 | 76.76 | 9.90 | 64.73 | 14.15 | 37.09 | 4.29 | 20.75 | 2.76 | 803.14 | 2500.66 | 1695.15 |
| GZW-8-3 | 56,128.66 | 193.98 | 127.12 | 30.54 | 131.39 | 23.75 | 5.28 | 29.02 | 3.85 | 25.70 | 5.55 | 14.54 | 1.60 | 7.61 | 0.89 | 288.83 | 889.64 | |||
| GZW-2-1 | phosphate cement | 69,238.05 | 177,192.69 | 75.04 | 45.73 | 12.65 | 52.67 | 9.55 | 2.59 | 10.58 | 1.34 | 8.61 | 1.72 | 5.03 | 0.52 | 2.92 | 0.37 | 96.33 | 325.64 | 1456.29 |
| 80,105.51 | 167.91 | 109.26 | 28.73 | 125.95 | 22.32 | 6.08 | 25.68 | 3.36 | 21.44 | 4.57 | 12.21 | 1.49 | 8.78 | 1.22 | 248.10 | 787.10 | ||||
| 61,407.58 | 140.78 | 91.37 | 23.91 | 103.79 | 18.08 | 4.93 | 20.75 | 2.85 | 16.62 | 3.63 | 9.76 | 1.11 | 5.79 | 0.73 | 197.14 | 641.22 | ||||
| 85,372.64 | 167.80 | 107.87 | 28.00 | 119.92 | 20.91 | 5.32 | 24.65 | 3.18 | 20.30 | 4.32 | 11.85 | 1.39 | 8.13 | 1.05 | 238.81 | 763.50 | ||||
| GZW-6-2 | 205,433.86 | 379.44 | 213.59 | 58.72 | 243.63 | 43.76 | 11.27 | 52.72 | 6.94 | 43.19 | 9.26 | 25.21 | 2.94 | 14.13 | 1.73 | 514.73 | 1621.26 | |||
| GZW-7-1 | 353,636.01 | 319.43 | 187.86 | 54.64 | 230.72 | 42.02 | 10.09 | 52.66 | 6.79 | 44.06 | 9.04 | 24.69 | 2.56 | 12.81 | 1.55 | 486.68 | 1485.59 | |||
| 77,620.73 | 178.33 | 105.27 | 31.28 | 131.48 | 24.19 | 5.58 | 30.06 | 4.18 | 26.61 | 5.75 | 15.27 | 1.71 | 8.80 | 1.12 | 296.72 | 866.33 | ||||
| GZW-7-3 | 226,241.76 | 525.13 | 291.02 | 79.64 | 332.71 | 59.78 | 12.88 | 74.26 | 9.40 | 61.33 | 13.48 | 35.96 | 4.05 | 20.01 | 2.43 | 740.71 | 2262.80 | |||
| 233,151.85 | 489.34 | 283.64 | 81.40 | 342.60 | 64.76 | 14.94 | 80.34 | 10.50 | 67.78 | 14.32 | 37.06 | 4.06 | 19.45 | 2.35 | 775.99 | 2288.51 | ||||
| 270,891.10 | 503.71 | 296.33 | 84.87 | 356.92 | 64.80 | 15.05 | 83.14 | 10.75 | 69.28 | 14.57 | 38.84 | 4.09 | 19.72 | 2.48 | 795.62 | 2360.15 | ||||
| 286,020.50 | 573.39 | 325.37 | 92.78 | 394.47 | 72.67 | 16.60 | 91.02 | 11.66 | 75.64 | 15.71 | 42.29 | 4.70 | 22.95 | 2.76 | 875.06 | 2617.09 | ||||
| GZW-5-1 | bright crystalline dolomitic cement | 5074.21 | 20,893.81 | 13.10 | 11.44 | 2.39 | 10.14 | 2.20 | 0.59 | 2.38 | 0.31 | 2.12 | 0.44 | 1.41 | 0.17 | 1.35 | 0.22 | 23.56 | 71.82 | 308.15 |
| 46,630.75 | 139.78 | 89.82 | 25.27 | 108.98 | 20.75 | 5.55 | 24.31 | 3.19 | 19.84 | 4.18 | 11.04 | 1.32 | 6.63 | 0.92 | 217.79 | 679.36 | ||||
| GZW-6-5 | 29,280.88 | 87.94 | 58.60 | 15.10 | 64.39 | 11.65 | 3.49 | 14.25 | 1.68 | 11.28 | 2.50 | 6.44 | 0.71 | 3.67 | 0.44 | 132.77 | 414.91 | |||
| GZW-7-2 | 2589.38 | 12.71 | 7.16 | 1.69 | 7.82 | 1.23 | 0.40 | 1.86 | 0.27 | 2.18 | 0.54 | 1.82 | 0.31 | 1.84 | 0.31 | 26.35 | 66.49 | |||
| GZW-3-1 | siliceous cement | 132.78 | 998.74 | 14.66 | 7.09 | 1.79 | 7.00 | 1.22 | 0.28 | 1.50 | 0.25 | 1.99 | 0.56 | 1.95 | 0.28 | 2.00 | 0.27 | 27.59 | 68.44 | 48.59 |
| 43.31 | 29.47 | 11.35 | 3.31 | 12.99 | 1.90 | 0.43 | 2.95 | 0.46 | 2.98 | 0.83 | 2.70 | 0.40 | 2.20 | 0.35 | 53.20 | 125.50 | ||||
| GZW-5-2 | 238.92 | 3.22 | 4.13 | 0.45 | 2.31 | 0.44 | 0.13 | 0.49 | 0.07 | 0.59 | 0.15 | 0.64 | 0.10 | 0.74 | 0.14 | 6.93 | 20.54 | |||
| GZW-6-5 | 10,447.88 | 32.23 | 21.66 | 5.48 | 23.02 | 4.10 | 1.17 | 4.95 | 0.67 | 4.05 | 0.86 | 2.30 | 0.23 | 1.28 | 0.19 | 47.34 | 149.52 | |||
| GZW-7-1 | 55.59 | 11.49 | 5.51 | 1.36 | 5.60 | 0.81 | 0.26 | 1.27 | 0.25 | 1.89 | 0.51 | 1.66 | 0.24 | 1.53 | 0.22 | 25.88 | 58.48 | |||
| GZW-8-3 | 478.71 | 5.04 | 2.19 | 0.41 | 1.69 | 0.36 | 0.09 | 0.49 | 0.13 | 1.20 | 0.47 | 2.14 | 0.45 | 4.30 | 0.72 | 17.87 | 37.55 | |||
| 147.36 | 3.43 | 2.00 | 0.39 | 1.46 | 0.20 | 0.09 | 0.30 | 0.07 | 0.78 | 0.26 | 1.13 | 0.25 | 1.94 | 0.30 | 10.46 | 23.04 | ||||
| 258.95 | 2.65 | 1.52 | 0.32 | 1.20 | 0.19 | 0.05 | 0.26 | 0.05 | 0.36 | 0.13 | 0.54 | 0.10 | 0.80 | 0.13 | 6.07 | 14.36 | ||||
| 87.95 | 1.98 | 1.02 | 0.23 | 0.78 | 0.12 | 0.03 | 0.16 | 0.03 | 0.49 | 0.13 | 0.89 | 0.13 | 1.05 | 0.17 | 6.92 | 14.15 | ||||
| 0.00 | 3.26 | 2.07 | 0.33 | 1.22 | 0.30 | 0.07 | 0.39 | 0.08 | 0.72 | 0.27 | 1.04 | 0.19 | 1.26 | 0.22 | 11.47 | 22.88 | ||||
| 19.03 | 6.35 | 3.09 | 0.57 | 1.89 | 0.19 | 0.06 | 0.40 | 0.09 | 0.84 | 0.31 | 1.45 | 0.31 | 2.44 | 0.41 | 13.85 | 32.24 | ||||
| 74.36 | 2.73 | 1.28 | 0.28 | 0.96 | 0.12 | 0.03 | 0.16 | 0.05 | 0.48 | 0.16 | 0.65 | 0.16 | 1.26 | 0.22 | 7.79 | 16.33 |
| Analysis Item | Dolomitic Cement (n = 4) | Interior of Bioclasts (n = 12) | Biological Shell Walls (n = 12) | Dolomitization Sand Debris Edges (n = 2) | Interior of Sand Debris (n = 4) | Siliceous Cement (n = 12) | Phosphate Agglomerates (n = 5) | Phosphate Cement (n = 11) | Nondolomitization Sand Debris Edges (n = 2) | Difference | Quadratic Sum | Freedom | Mean Square | F Value | p Value |
|---|---|---|---|---|---|---|---|---|---|---|---|---|---|---|---|
| P | 20,893.81 ± 20,960.64 | 263,053.62 ± 71,242.96 | 233,207.77 ± 101,422.63 | 3036.99 ± 2283.64 | 214,478.72 ± 110,552.06 | 998.74 ± 2978.71 | 193,469.06 ± 99,277.20 | 177,192.69 ± 105,319.39 | 238,514.73 ± 257,932.85 | among groups | 654,787,425,461.879 | 8 | 81,848,428,182.735 | 10.619 | 0.000 |
| intragroup | 423,944,291,676.237 | 55 | 7,708,078,030.477 | ||||||||||||
| total | 1,078,731,717,138.115 | 63 | |||||||||||||
| ∑REY | 308.15 ± 296.34 | 2325.33 ± 197.90 | 2270.13 ± 608.52 | 41.42 ± 6.64 | 1811.99 ± 601.89 | 48.59 ± 45.21 | 1521.45 ± 565.10 | 1456.29 ± 821.83 | 1695.15 ± 1139.16 | among groups | 50,652,366.216 | 8 | 6,331,545.777 | 22.901 | 0.000 |
| intragroup | 215,206,001.072 | 55 | 276,472.747 | ||||||||||||
| total | 65,858,367.288 | 63 |
| Sample No. | Extraction Steps | La | Ce | Pr | Nd | Sm | Eu | Gd | Tb | Dy | Ho | Er | Tm | Yb | Lu | Y | ∑REY | Each Step Percentage of Total |
|---|---|---|---|---|---|---|---|---|---|---|---|---|---|---|---|---|---|---|
| GZW2-1 | 338.200 | 223.000 | 55.200 | 236.000 | 42.700 | 10.500 | 50.800 | 6.940 | 41.000 | 8.900 | 22.800 | 2.760 | 13.200 | 1.660 | 567.000 | 1620.660 | ||
| water-soluble form | 0.796 | 0.587 | 0.139 | 0.501 | 0.072 | 0.017 | 0.078 | 0.014 | 0.072 | 0.018 | 0.044 | 0.006 | 0.030 | 0.004 | 1.187 | 3.562 | 0.23% | |
| exchangeable ion form | 6.670 | 4.141 | 0.916 | 2.897 | 0.493 | 0.177 | 0.570 | 0.122 | 0.536 | 0.163 | 0.323 | 0.071 | 0.255 | 0.051 | 12.362 | 29.747 | 1.92% | |
| carbonate-bound form | 5.847 | 3.927 | 0.893 | 2.672 | 0.527 | 0.320 | 0.502 | 0.136 | 0.434 | 0.163 | 0.298 | 0.071 | 0.204 | 0.061 | 9.965 | 26.019 | 1.68% | |
| iron–manganese oxide-bound form | 7.705 | 4.446 | 1.004 | 4.016 | 0.624 | 0.451 | 0.848 | 0.142 | 0.692 | 0.194 | 0.494 | 0.067 | 0.380 | 0.054 | 12.982 | 34.096 | 2.20% | |
| organic matter-bound form | 47.431 | 35.039 | 8.559 | 33.135 | 4.440 | 1.102 | 6.335 | 1.002 | 5.050 | 1.416 | 3.613 | 0.396 | 2.082 | 0.276 | 61.827 | 211.702 | 13.68% | |
| residual form | 280.505 | 171.816 | 45.584 | 173.940 | 34.135 | 8.820 | 40.248 | 6.408 | 30.323 | 7.386 | 18.493 | 1.998 | 11.496 | 1.347 | 409.395 | 1241.892 | 80.28% | |
| sum | 348.953 | 219.955 | 57.094 | 217.161 | 40.291 | 10.886 | 48.579 | 7.824 | 37.105 | 9.341 | 23.263 | 2.609 | 14.447 | 1.793 | 507.718 | 1547.018 | 100.00% | |
| GZW2-3 | 405.300 | 269.000 | 68.700 | 294.000 | 53.400 | 12.500 | 62.400 | 8.600 | 50.500 | 10.800 | 27.300 | 3.290 | 15.500 | 1.940 | 669.000 | 1952.230 | ||
| water-soluble form | 0.768 | 0.564 | 0.148 | 0.576 | 0.097 | 0.042 | 0.125 | 0.012 | 0.087 | 0.019 | 0.040 | 0.007 | 0.025 | 0.004 | 0.970 | 3.484 | 0.19% | |
| exchangeable ion form | 2.577 | 1.340 | 0.272 | 1.074 | 0.231 | 0.908 | 0.265 | 0.037 | 0.224 | 0.054 | 0.102 | 0.027 | 0.071 | 0.015 | 4.250 | 11.449 | 0.61% | |
| carbonate-bound form | 3.335 | 2.047 | 0.490 | 2.218 | 0.381 | 1.020 | 0.401 | 0.065 | 0.340 | 0.102 | 0.158 | 0.048 | 0.092 | 0.031 | 6.875 | 17.601 | 0.94% | |
| iron–manganese oxide-bound form | 13.398 | 7.076 | 2.021 | 8.879 | 1.632 | 0.954 | 2.108 | 0.211 | 1.609 | 0.340 | 0.809 | 0.104 | 0.466 | 0.058 | 20.983 | 60.649 | 3.24% | |
| organic matter-bound form | 74.625 | 55.854 | 13.692 | 63.504 | 9.594 | 2.471 | 13.572 | 1.323 | 9.870 | 2.184 | 5.009 | 0.576 | 2.232 | 0.288 | 83.784 | 338.577 | 18.08% | |
| residual form | 317.693 | 172.574 | 47.014 | 206.072 | 45.696 | 9.914 | 48.912 | 5.719 | 44.544 | 9.124 | 20.961 | 2.640 | 11.325 | 1.365 | 497.436 | 1440.989 | 76.95% | |
| sum | 412.396 | 239.455 | 63.636 | 282.323 | 57.631 | 15.307 | 65.384 | 7.368 | 56.674 | 11.823 | 27.079 | 3.402 | 14.212 | 1.760 | 614.298 | 1872.748 | 100.00% | |
| GZW4-1 | 380.140 | 218.000 | 56.100 | 238.000 | 42.200 | 9.630 | 50.800 | 7.090 | 42.500 | 9.400 | 24.300 | 2.980 | 14.400 | 1.830 | 614.000 | 1711.370 | ||
| water-soluble form | 0.131 | 0.070 | 0.019 | 0.074 | 0.014 | 0.009 | 0.012 | 0.003 | 0.014 | 0.003 | 0.006 | 0.001 | 0.004 | 0.001 | 0.254 | 0.616 | 0.04% | |
| exchangeable ion form | 3.034 | 1.537 | 0.360 | 1.258 | 0.299 | 0.643 | 0.224 | 0.055 | 0.292 | 0.075 | 0.122 | 0.034 | 0.082 | 0.020 | 6.112 | 14.148 | 0.81% | |
| carbonate-bound form | 1.519 | 0.585 | 0.163 | 0.530 | 0.129 | 0.597 | 0.107 | 0.034 | 0.116 | 0.048 | 0.051 | 0.027 | 0.041 | 0.020 | 3.018 | 6.985 | 0.40% | |
| iron–manganese oxide-bound form | 2.500 | 1.093 | 0.277 | 1.182 | 0.235 | 0.451 | 0.229 | 0.040 | 0.239 | 0.052 | 0.120 | 0.018 | 0.073 | 0.014 | 5.168 | 11.690 | 0.67% | |
| organic matter-bound form | 77.353 | 48.678 | 12.498 | 58.650 | 8.706 | 2.025 | 10.269 | 1.556 | 9.726 | 2.244 | 5.049 | 0.582 | 2.295 | 0.402 | 114.953 | 354.986 | 20.22% | |
| residual form | 292.451 | 149.616 | 39.480 | 167.914 | 36.776 | 6.944 | 34.910 | 5.814 | 37.304 | 7.864 | 18.393 | 2.380 | 10.437 | 1.676 | 555.473 | 1367.430 | 77.88% | |
| sum | 376.989 | 201.579 | 52.798 | 229.609 | 46.160 | 10.668 | 45.751 | 7.502 | 47.690 | 10.285 | 23.741 | 3.042 | 12.931 | 2.134 | 684.975 | 1755.854 | 100.00% | |
| GZW7-3 | 398.500 | 234.000 | 59.800 | 254.000 | 45.300 | 10.400 | 55.000 | 7.630 | 45.600 | 9.930 | 25.300 | 3.040 | 14.200 | 1.770 | 654.000 | 1818.470 | ||
| water-soluble form | 0.118 | 0.071 | 0.018 | 0.076 | 0.011 | 0.004 | 0.013 | 0.002 | 0.011 | 0.002 | 0.007 | 0.001 | 0.004 | 0.001 | 0.195 | 0.536 | 0.03% | |
| exchangeable ion form | 2.935 | 1.845 | 0.417 | 1.488 | 0.272 | 0.153 | 0.306 | 0.061 | 0.245 | 0.068 | 0.150 | 0.043 | 0.095 | 0.020 | 5.194 | 13.290 | 0.73% | |
| carbonate-bound form | 1.073 | 0.663 | 0.270 | 0.468 | 0.129 | 0.133 | 0.109 | 0.036 | 0.088 | 0.034 | 0.068 | 0.026 | 0.041 | 0.020 | 2.091 | 5.247 | 0.29% | |
| iron–manganese oxide-bound form | 1.803 | 0.930 | 0.240 | 1.019 | 0.162 | 0.230 | 0.218 | 0.033 | 0.157 | 0.037 | 0.112 | 0.017 | 0.066 | 0.010 | 3.029 | 8.062 | 0.44% | |
| organic matter-bound form | 57.523 | 36.665 | 9.893 | 43.988 | 5.256 | 1.220 | 8.220 | 1.175 | 5.718 | 1.278 | 3.882 | 0.405 | 1.788 | 0.216 | 78.848 | 256.072 | 14.12% | |
| residual form | 338.844 | 185.418 | 50.158 | 215.128 | 37.470 | 6.962 | 46.768 | 7.236 | 38.132 | 7.890 | 24.528 | 2.930 | 13.144 | 1.572 | 554.715 | 1530.493 | 84.39% | |
| sum | 402.295 | 225.591 | 60.995 | 262.165 | 43.300 | 8.701 | 55.634 | 8.543 | 44.352 | 9.310 | 28.746 | 3.421 | 15.138 | 1.839 | 644.070 | 1813.700 | 100.00% | |
| GZW8-2 | 280.150 | 204.000 | 49.400 | 220.000 | 41.800 | 12.700 | 50.000 | 6.560 | 37.100 | 7.660 | 18.700 | 2.140 | 9.700 | 1.180 | 471.000 | 1412.090 | ||
| water-soluble form | 0.082 | 0.063 | 0.016 | 0.059 | 0.010 | 0.012 | 0.011 | 0.002 | 0.009 | 0.002 | 0.004 | 0.001 | 0.002 | 0.001 | 0.154 | 0.427 | 0.03% | |
| exchangeable ion form | 1.149 | 0.876 | 0.196 | 0.629 | 0.116 | 0.122 | 0.129 | 0.036 | 0.102 | 0.034 | 0.051 | 0.020 | 0.031 | 0.014 | 2.550 | 6.054 | 0.42% | |
| carbonate-bound form | 0.978 | 0.794 | 0.196 | 0.604 | 0.122 | 0.136 | 0.129 | 0.036 | 0.109 | 0.041 | 0.021 | 0.020 | 0.026 | 0.014 | 1.904 | 5.127 | 0.36% | |
| iron–manganese oxide-bound form | 1.729 | 1.082 | 0.291 | 1.383 | 0.214 | 0.217 | 0.278 | 0.043 | 0.212 | 0.047 | 0.106 | 0.013 | 0.059 | 0.011 | 3.515 | 9.200 | 0.64% | |
| organic matter-bound form | 79.604 | 75.343 | 18.030 | 83.978 | 10.392 | 3.462 | 15.294 | 2.075 | 9.918 | 2.112 | 4.811 | 0.486 | 2.061 | 0.312 | 110.723 | 418.599 | 29.09% | |
| residual form | 191.226 | 136.355 | 35.025 | 156.100 | 29.554 | 9.414 | 34.558 | 5.334 | 26.584 | 5.326 | 12.278 | 1.440 | 6.287 | 0.956 | 349.153 | 999.589 | 69.46% |
| Extraction Steps | Occurrence Forms of REEs | REEs Content (ppm) | The Average Proportion of REEs in Each Form (%) | |||||
|---|---|---|---|---|---|---|---|---|
| GZW2-1 | GZW2-3 | GZW4-1 | GZW7-3 | GZW8-2 | Average Value | |||
| 1 | water-soluble form | 3.56 | 3.48 | 0.62 | 0.54 | 0.43 | 1.73 | 0.10 |
| 2 | exchangeable ion form | 29.75 | 11.45 | 14.15 | 13.29 | 6.05 | 14.94 | 0.89 |
| 3 | carbonate-bound form | 26.02 | 17.60 | 6.98 | 5.25 | 5.13 | 12.20 | 0.72 |
| 4 | iron–manganese oxide-bound form | 34.10 | 60.65 | 11.69 | 8.06 | 9.20 | 24.74 | 1.47 |
| 5 | organic matter-bound form | 211.70 | 338.8 | 354.9 | 256.7 | 418.60 | 315.99 | 18.75 |
| 6 | residual form | 1241.89 | 1440.99 | 1367.42 | 1530.49 | 999.59 | 1316.08 | 78.07 |
| Sum | 1547.02 | 1872.75 | 1755.85 | 1813.70 | 1439.00 | 1685.68 | 100.00 | |
Disclaimer/Publisher’s Note: The statements, opinions and data contained in all publications are solely those of the individual author(s) and contributor(s) and not of MDPI and/or the editor(s). MDPI and/or the editor(s) disclaim responsibility for any injury to people or property resulting from any ideas, methods, instructions or products referred to in the content. |
© 2024 by the authors. Licensee MDPI, Basel, Switzerland. This article is an open access article distributed under the terms and conditions of the Creative Commons Attribution (CC BY) license (https://creativecommons.org/licenses/by/4.0/).
Share and Cite
Xiong, C.; Xie, H.; Wang, Y.; Wang, C.; Li, Z.; Yang, C. Microdistribution and Mode of Rare Earth Element Occurrence in the Zhijin Rare Earth Element-Bearing Phosphate Deposit, Guizhou, China. Minerals 2024, 14, 223. https://doi.org/10.3390/min14030223
Xiong C, Xie H, Wang Y, Wang C, Li Z, Yang C. Microdistribution and Mode of Rare Earth Element Occurrence in the Zhijin Rare Earth Element-Bearing Phosphate Deposit, Guizhou, China. Minerals. 2024; 14(3):223. https://doi.org/10.3390/min14030223
Chicago/Turabian StyleXiong, Canjuan, Hong Xie, Yuhang Wang, Changjian Wang, Zhi Li, and Chenglong Yang. 2024. "Microdistribution and Mode of Rare Earth Element Occurrence in the Zhijin Rare Earth Element-Bearing Phosphate Deposit, Guizhou, China" Minerals 14, no. 3: 223. https://doi.org/10.3390/min14030223
APA StyleXiong, C., Xie, H., Wang, Y., Wang, C., Li, Z., & Yang, C. (2024). Microdistribution and Mode of Rare Earth Element Occurrence in the Zhijin Rare Earth Element-Bearing Phosphate Deposit, Guizhou, China. Minerals, 14(3), 223. https://doi.org/10.3390/min14030223