1. Introduction
The Nanling region (NL) in South China is situated at the central junction of the Yangtze Block (YB) and the Cathaysia Block (CB). Data indicate that more than 54% of the global W resources and substantial reserves of Sn and ion-adsorption REEs (IREEs) resources have been discovered in the NL [
1,
2,
3]. Numerous geological research findings for the NL have suggested that W, Sn, and REE deposits are closely associated with Mesozoic granites [
4,
5,
6]. Nonetheless, the W, Sn, and REE deposits exhibit significant variations in mineralization and spatial distribution. For instance, the W and Sn deposits are typical examples of magmatic hydrothermal mineralization [
5], while the REE deposits are formed by chemical weathering processes of REE-rich parent rocks [
7,
8], with initial REE enrichment in granites playing a crucial role [
9]. Spatially, the W and Sn deposits are found in the eastern and western parts of the NL, respectively [
10], with the REE deposits occurring more frequently in the eastern part than in the western part of the NL [
11]. Previous studies have proposed numerous rock- and ore-forming mechanisms for W and Sn mineralization in the NL [
12], but the geological processes underlying W and Sn mineralization in the NL remain unclear. Research on the mineralization of REE deposits has focused primarily on the migration and concentration of REEs during weathering. It is commonly considered that the distribution of granites governs the spatial distribution of REE deposits [
7]. Furthermore, the granites associated with the W, Sn, and REE deposits in the NL mostly formed during the Mesozoic Era [
13], during which South China was characterized by long-term extension [
14]. In summary, there is debate regarding the tungsten and tin mineralization processes in the NL, as well as the varying research emphases of related research on REE mineralization. This has resulted in the development of a distribution pattern for the eastern W and western Sn regions, as well as an endogenous REE enrichment mechanism, which are still in dispute.
The exchange of matter and energy and the interaction of layers from the interior of the Earth constrain the formation of the Earth’s surface and shallow ore-rich areas [
15,
16]. The deep structural features of the Earth contain the aforementioned information. The geochemical signatures present in numerous deposits and surface magmatic rocks in the NL indicate that the Mesozoic mineralization event was concurrent with intense thermal-magmatic activity [
17]. Therefore, the geological background of mineralization in the NL can be investigated using modern deep structural information obtained from geophysical exploration. Geophysical methods for deep exploration include regional gravity and magnetic, magnetotelluric sounding, and seismic methods, among others [
18,
19]. Satellite gravity and magnetic data fall under the umbrella of regional gravity and magnetic methods. These data provide the advantages of an extensive coverage, frequent updates, and lack of geographical limitations [
20]. They have been widely utilized in the study of deep geological issues at both global and regional scales, including internal material distribution, structure, and tectonics [
21,
22,
23].
In this research, we present the findings of satellite gravity and magnetic data processing and inversion (Moho depth, Curie depth, effective elastic thickness, lithospheric density structure, and lithospheric thermal structure) from the NL. With the use of these results, we integrate published geological and geochemical data, along with other geophysical data, to constrain the origin of magma and magma evolution processes, as well as the associated enrichment in W, Sn, and REEs in the NL. Furthermore, we establish enrichment models for W, Sn, and REEs in the NL, thereby enhancing the understanding of the geological background of W, Sn, and REE mineralization.
2. Geological Setting
The South China Block (SCB) is divided into the YB in the northwestern region and the CB in the southeastern region. These two blocks are demarcated by the Jiangshan–Shaoxin fault (
Figure 1). The YB and CB were joined with the Qinhang tectonic belt between 1.1 and 0.83 Ga [
24]. Following the merging during the Neoproterozoic Era, the SCB underwent the Kwangsian orogeny during the middle Palaeozoic. It collided with the Indosinian Block to the southwest and the North China Craton to the north during the Triassic Era [
25]. Additionally, it was influenced by the subduction and retraction of the Palaeo-Pacific Plate during the Jurassic and Cretaceous periods, leading to a shift in its tectonic characteristics from extrusion to extension [
26].
The NL is located at the central intersection of the YB and the CB and is divided into two sections by the Chenzhou–Linwu fault, which trends towards the northeast (
Figure 1). Multiple instances of extensive igneous activity have been observed in the NL, which are closely related to the tectono-thermal events that occurred during the early Palaeozoic and late Mesozoic Eras. Mesozoic magmatic activity was widespread in the NL. The majority of Mesozoic granites in the NL were generated during the Yanshanian period, spanning from the Jurassic Era in the western region to the Early Cretaceous period in the eastern region. These granites intrude the folded sedimentary rocks of the Proterozoic and Palaeozoic Eras [
27].
W-Sn-REE mineralization widespread in the NL in association with Late Triassic and particularly Late Jurassic magmatic events [
28,
29]. Late Triassic magmatism generated granites spatially connected with the W deposits in the western section of the NL (
Figure 2), while Late Jurassic magmatism resulted in the formation of granites associated with the Sn(-W) deposits in the western region, specifically near the NE-trending Chenzhou–Linwu fault [
30]. REE mineralization in the NL is dominated by ion-adsorbed deposits related to weathering granites. The ore-forming parent rocks of the REE deposits are mainly Indosinian granites, early–middle Yanshanian granites, and late Yanshanian granites [
7,
31]. Consequently, polymetallic W-Sn-REE mineralization is widespread in the NL and is associated with Mesozoic granites, which during extension.
3. Data and Materials
3.1. EIGEN-6C4 Satellite Gravity Data
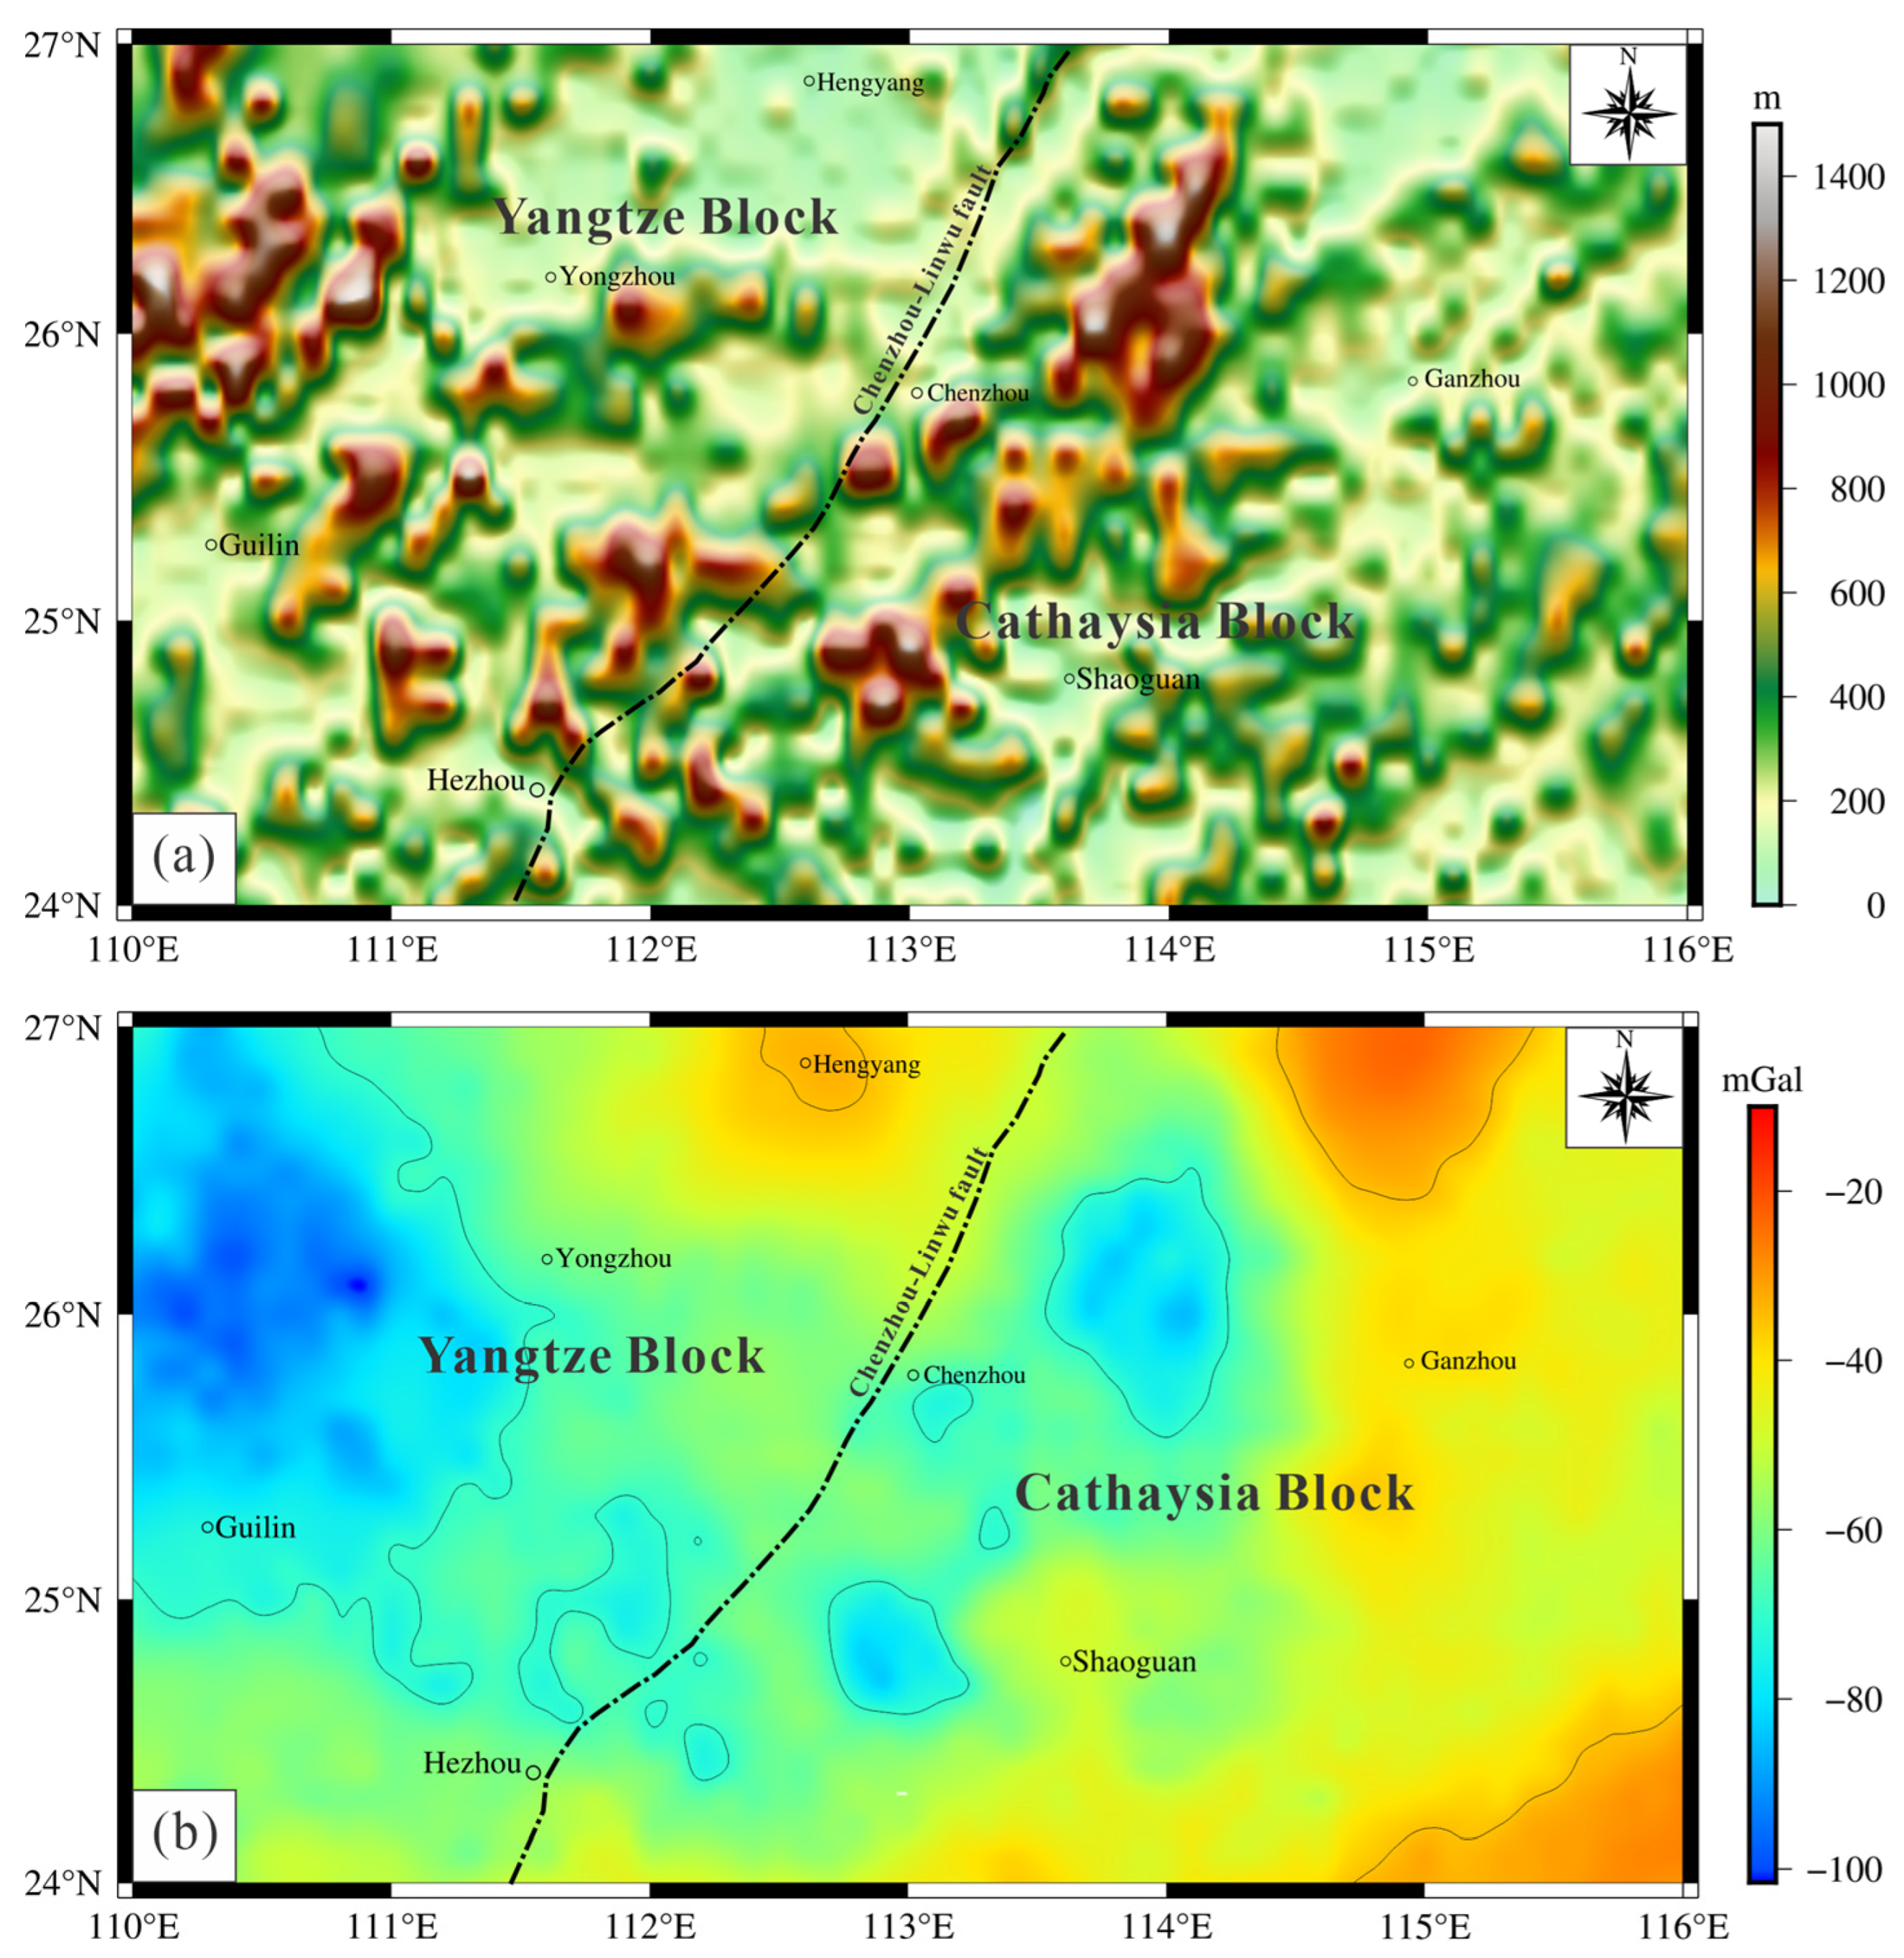
Gravity observation technology using satellites provides extensive coverage, increased accuracy, and improved resolution, effectively overcoming the limitations of ground-based gravity measurements. European Improved Gravity Model of the Earth by New Techniques (EIGEN-6C4) satellite-based gravity data of the NL were utilized. The global Earth gravity model EIGEN-6C4 is derived from the International Centre for Global Earth Models (ICGEM), which is an amalgamation of Gravity Recovery and Climate Experiment (GRACE), Gravity Field and Steady-State Ocean Circulation Explorer (GOCE), Laser Geodynamics Satellite (LACEOS), and DTU12 ground gravity data [
33]. It boasts a high resolution (9 km) and precision (2.73 mGal). The topographic data in
Figure 3a and the Bouguer gravity anomaly (BGA) (
Figure 3b) range from −100 to 20 mGal in the study area. The BGA pattern conforms with the topographic data, with low BGA values indicating regions of high topography and a thick crust. The BGA value increases from west to east, and there is a strong correlation between the BGA and the Chenzhou–Linwu fault structure zones.
3.2. EMAG2 Data
Magnetic anomaly maps provide insight into the subsurface structure and composition of the Earth’s crust. For magnetic analysis, Global Earth Magnetic Anomaly Grid version 2 (EMAG2) data with a 2-arcmin resolution were used. The EMAG2 dataset is a compilation of Challenging Minisatellite Payload (CHAMP) satellite magnetic anomaly model MF6 data (for wavelengths > 330 km) based on different grid and track line data over the ocean and land from both ships and airborne platforms, respectively [
34]. The high-resolution 2-arcminute gridded data of EMAG2 offer numerous opportunities for investigating structural and tectonic processes.
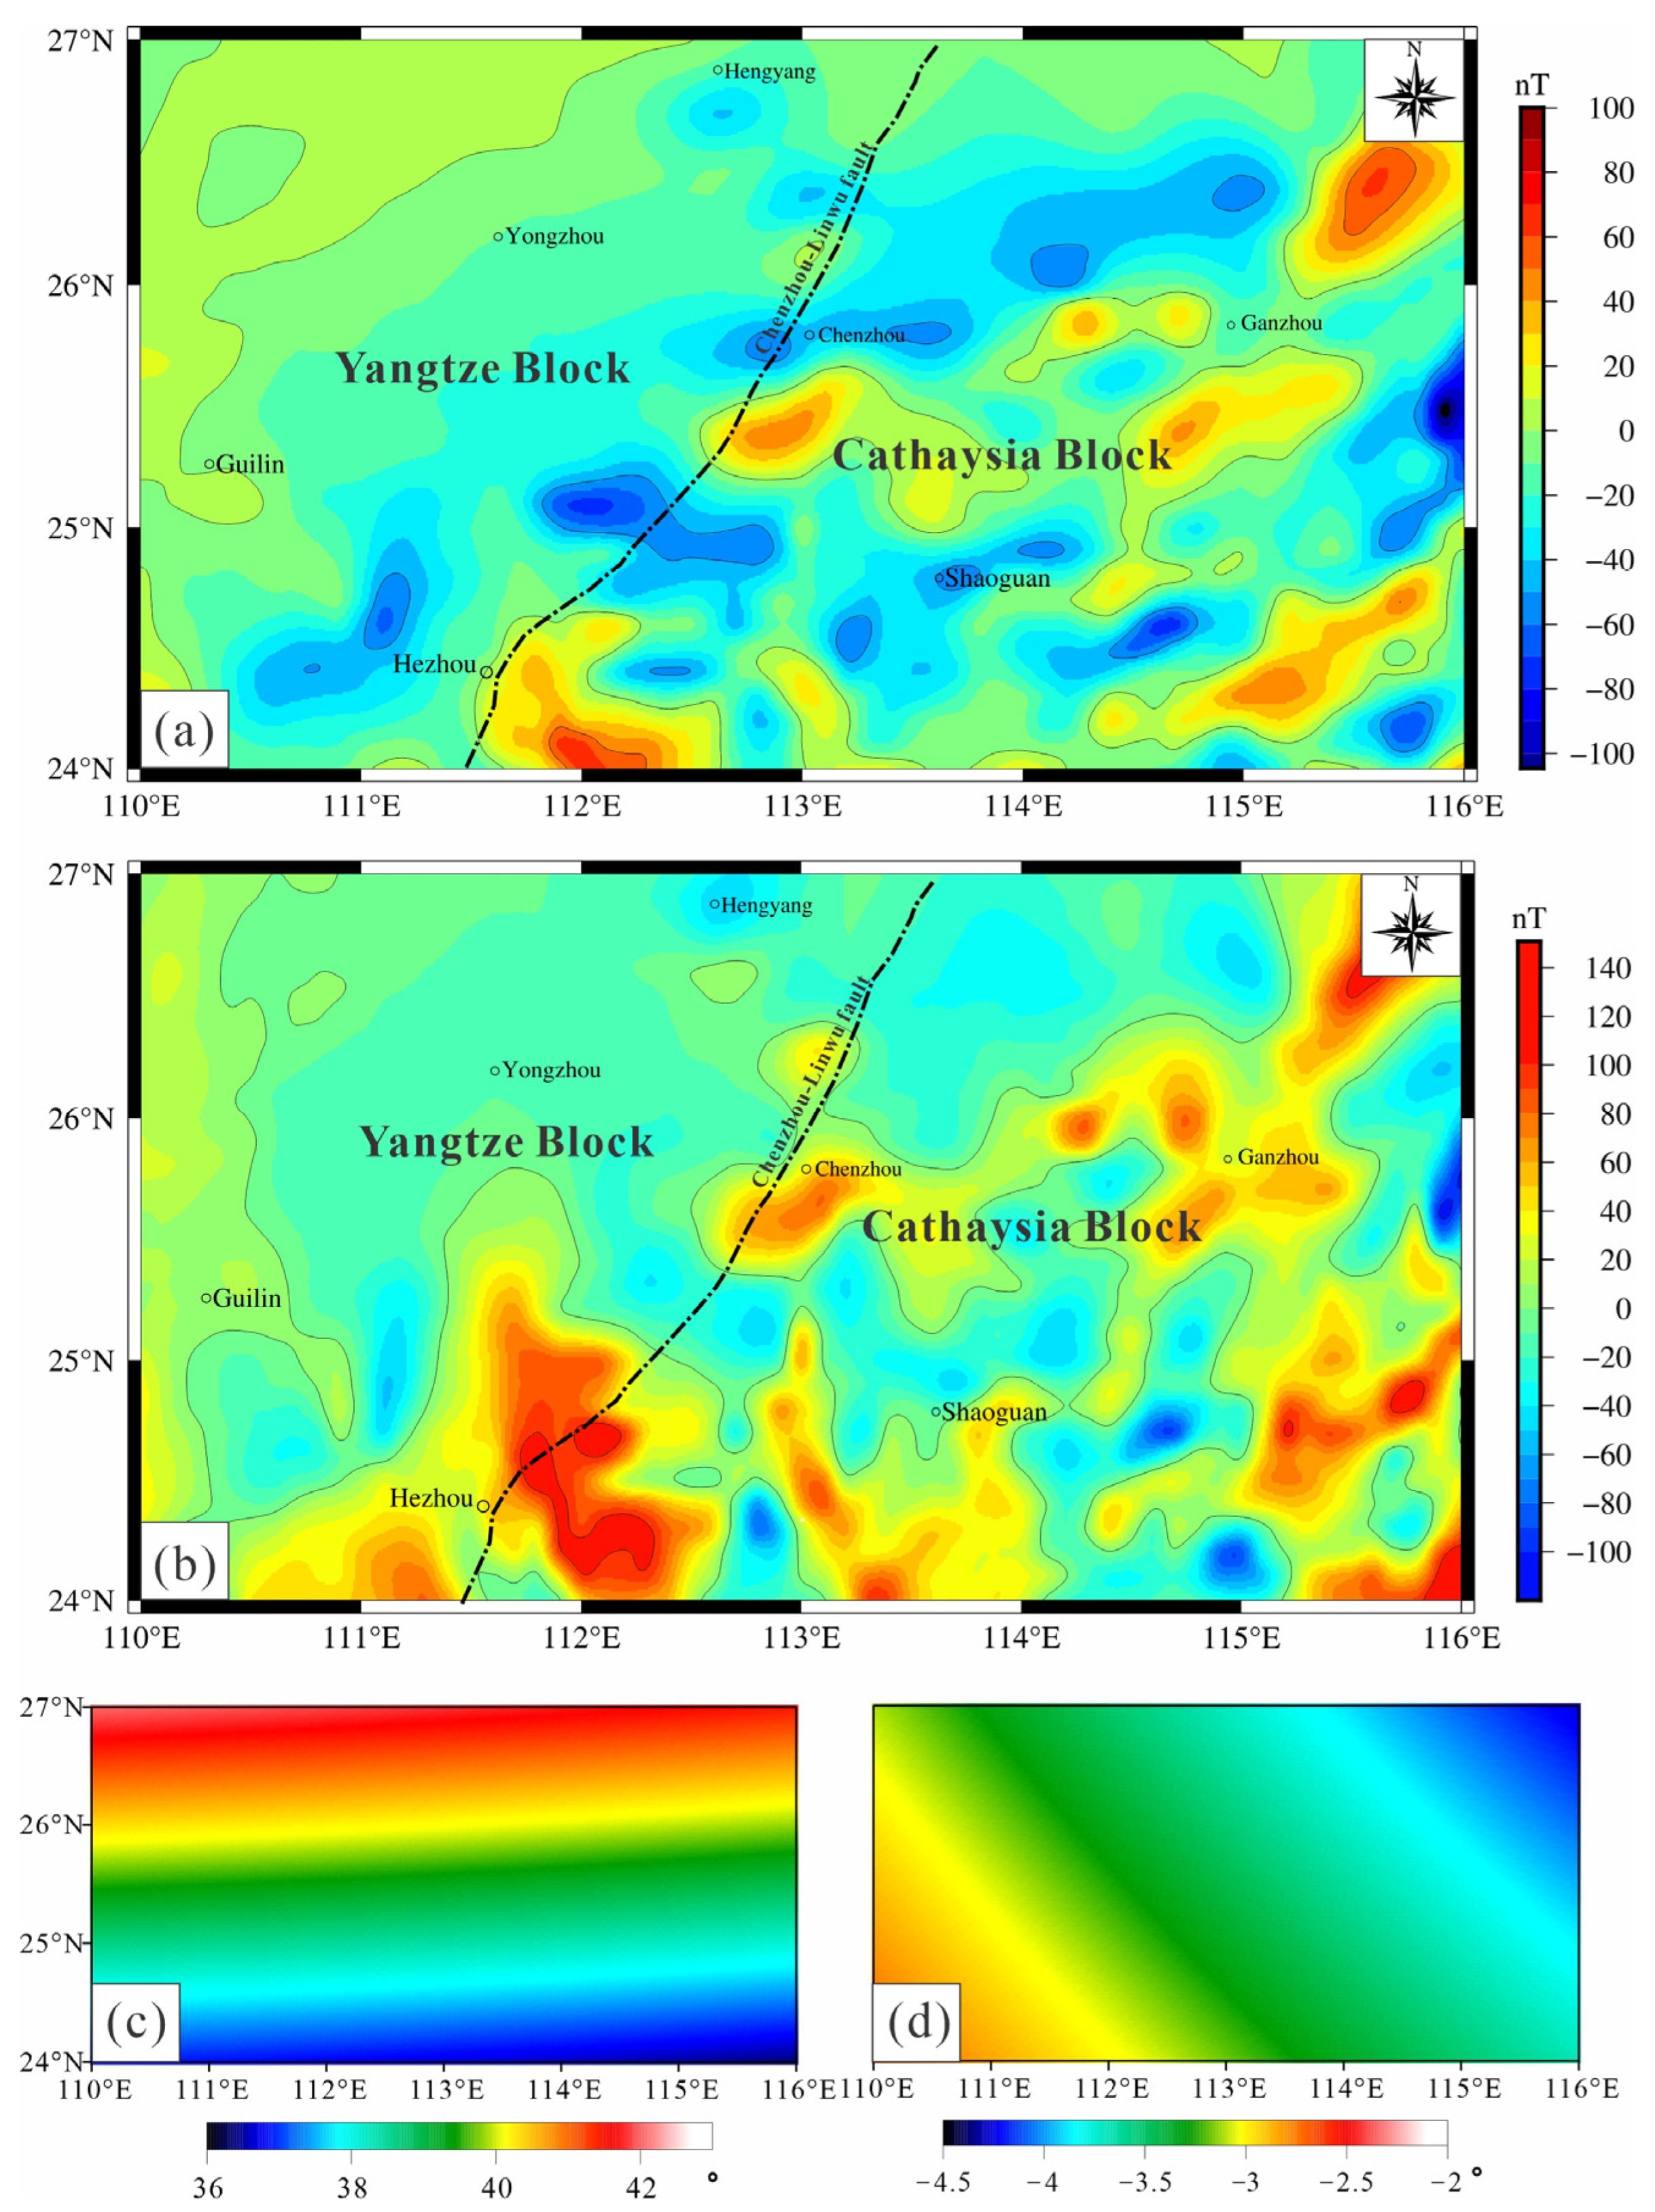
Figure 4a shows the total-field magnetic anomaly data range in the NL between −100 and 100 nT. Due to the diverse orientations of Earth’s magnetization, the NL total-field magnetic anomaly field does not align with the source field, resulting in a distribution of both positive and negative anomalies coexisting (
Figure 4a).
Moreover, the NL exhibits wide longitude 3°and latitude 6°, with variations of 6° in the magnetic inclination and 2.5° in the magnetic declination (refer to the IGRF 13 model, [
35]). To address the issue of vertical correspondence between the total magnetic anomalies and field sources in the NL, we utilized a point-by-point variable parameter reduction to the pole (RTP) method [
36] to polarize the total-field magnetic anomaly. As shown in
Figure 4b, the NL RTP magnetic anomaly ranges from −120 to 140 nT. Notably, the positive and negative anomalies in the NL are significantly reduced, while the high-value magnetic anomalies are prominently shifted to the north. This indicates that the RTP magnetic anomalies can accurately reflect the location of the magnetic source.
4. Methodology
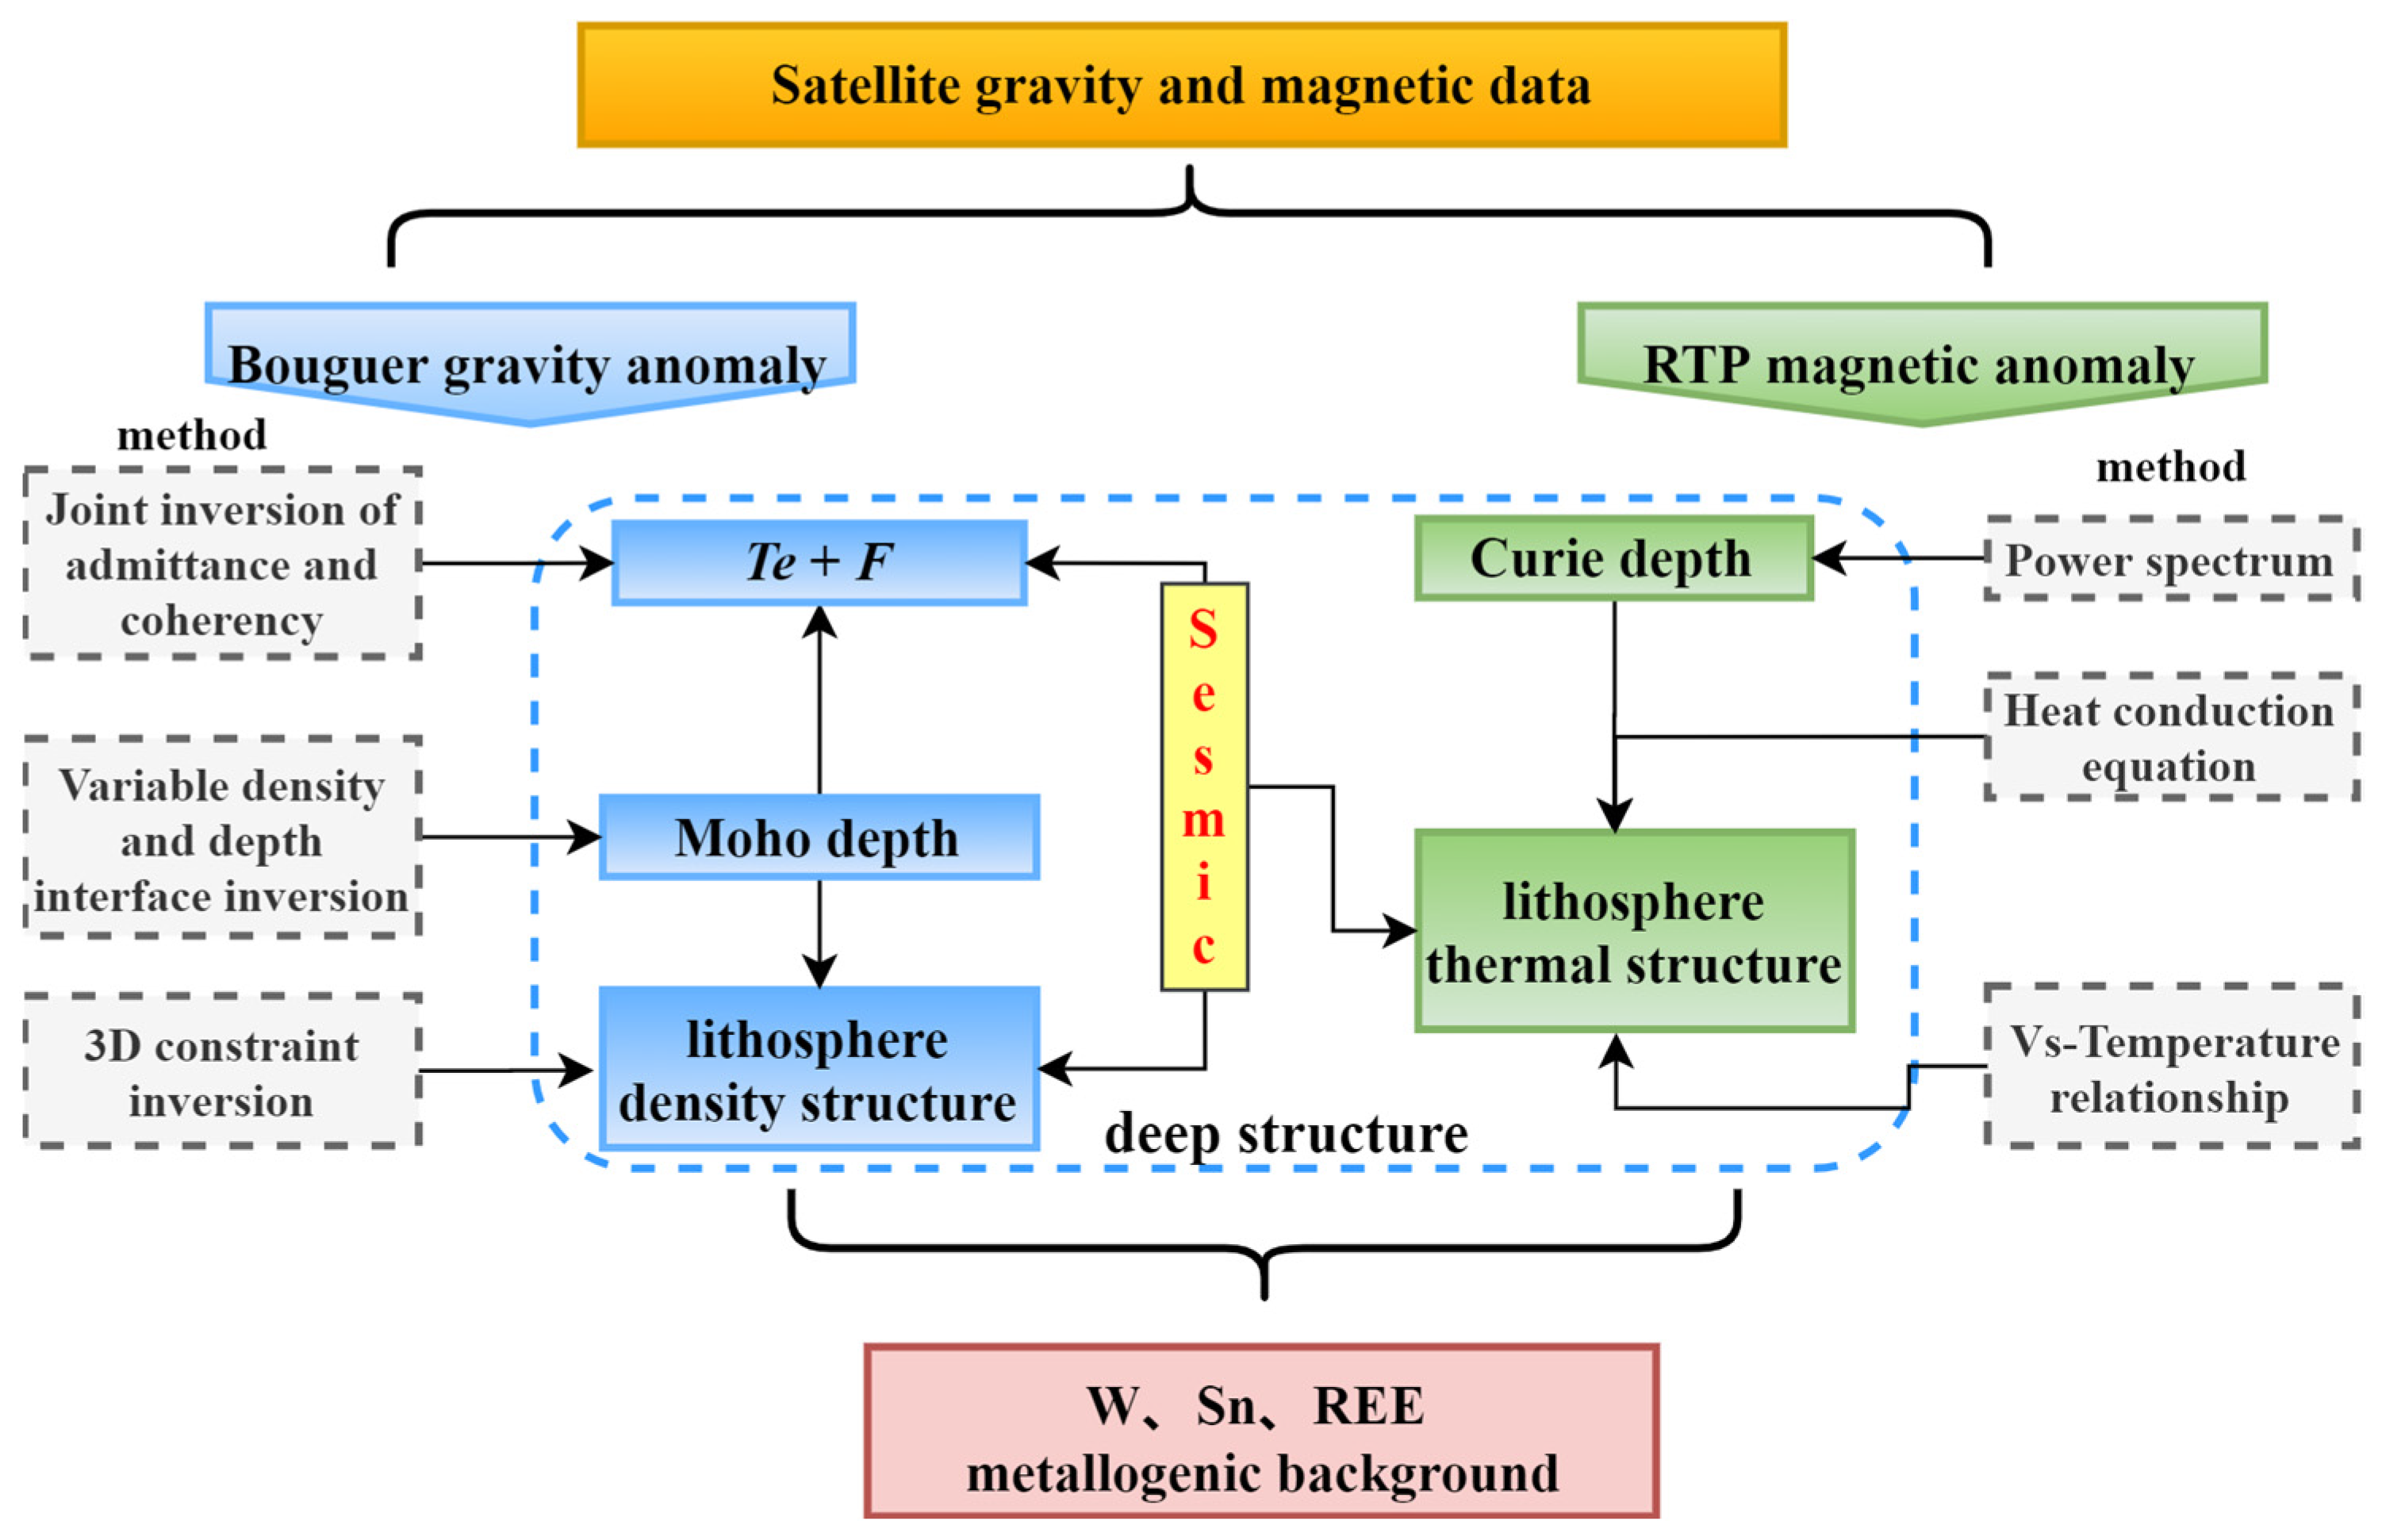
Satellite gravity and magnetic data offer valuable insights into deep structures, encompassing the variability of critical interfaces within the lithosphere, spatial distribution of physical materials, and thermal conditions. In this study, diverse techniques were employed for processing and analysing the satellite gravity and magnetic data to achieve enhanced geological structure interpretation outcomes with increased accuracy (
Figure 5).
4.1. Bouguer Gravity Anomaly Process and Inversion Methods
The BGA provides valuable insights into the undulations in the Moho depth and the heterogeneous distribution of the density in the Earth’s crust. Therefore, we used the BGA to invert the Moho depth and lithospheric density structure.
The Parker–Oldenburg (P-O) interface inversion method [
37,
38] provides the advantages of high computational efficiency, simplicity and convenience. The inverted density interface depth is widely used. The P-O method for density interface inversion depends on two key parameters, namely, the density contrast and reference depth, which are critical in obtaining inversion results. However, in regional studies, there are significant variations in lateral density differences and interface undulations within different blocks. For instance, in the NL, which spans the YB and CB (
Figure 1), there are variations of 0.2 g/cm
3 in the lateral density differences and 10 km in the interface depths (based on the Crust 1.0 model). Therefore, in this study, the improved lateral variable density and variable reference depth P-O method [
36] was employed to calculate the distribution of the Moho depth in the NL considering the density difference and reference depth based on the Crust 1.0 global crustal model.
The primary approach for obtaining the density structure of the lithosphere is the 3D gravity inversion method. Nonetheless, the vertical resolution of gravity anomalies is restricted and the resulting inversions are highly complex. To address these challenges, Li and Oldenburg (1996) [
39] proposed integrating a depth weighting function into the gravity 3D inversion process and incorporating a priori information, such as results of other geophysical methods, to impose constraints and achieve a more reliable density structure. The velocity and density (rock physical properties) are closely linked. The relationship between the density and velocity in the Earth’s interior is predominantly governed by two factors, i.e., the temperature and material composition [
40], while there are significant differences in the material composition and temperature environment between the crust and mantle. As a result, a 3D density inversion reference model was established in this paper by hierarchically transforming the velocity and density, using the Moho depth as the boundary, and accounting for the variations in the material composition between the crust and mantle as well as the influence of the temperature.
Moreover, the flexural deformation of the lithosphere under stress, referred to as the effective elastic thickness, can lead to variations in the gravity anomalies. The primary methods for determining the effective elastic thickness from gravity anomalies include the direct computation technique in the spatial domain and the spectral analysis method in the frequency domain. Among these methods, the spectral analysis technique is preferred because of its high computational efficiency and low complexity, making it a widely utilized technique for determining the effective elastic thickness of the lithosphere. Spectral analysis methods can be divided into the admittance method and the correlation function method based on the relationship between the topographic spectrum and gravity anomaly spectrum [
41]. Audet (2014; 2019) [
42,
43] introduced a joint approach that utilizes the strengths of both the admittance method and the correlation function method to concurrently calculate the effective elastic thickness. In this investigation, we employed this joint method to investigate the distribution characteristics of the effective elastic thickness of the lithosphere in the NL.
4.2. RTP Magnetic Anomaly Processing Methods
The RTP magnetic anomaly not only reflects the spatial distribution of subsurface magnetic sources, but also provides insights into the thermal state of the lithosphere (e.g., Curie depth and lithospheric thermal structure). The Curie depth can be computed using RTP magnetic anomaly data predominantly via the power spectrum technique [
44,
45]. This approach is convenient and does not depend on prior understanding of the physical properties or depth of the magnetic source, among other advantages.
The thermal distribution in the lithosphere reflects the temperature variations beneath the surface. The use of geodetic heat flow data are a more effective approach for calculating stable temperatures in shallow sections of the lithosphere. However, this method is constrained by the limited availability of measured geothermal heat flow data and uneven spatial distribution. Li (2011) [
46] proposed a correlation between the Curie depth and geothermal heat flow, offering a potential solution to the above data scarcity issue. Several research studies have indicated that the temperature is the predominant factor impacting the seismic velocity within the 50–250 km depth range [
47,
48,
49]. The temperature distribution within this depth range can be more accurately estimated by utilizing measured seismic wave velocity data in conjunction with a variety of laboratory-determined elastic parameters, densities, pressures, and other variables. Consequently, in this paper, the Curie depth, measured geodetic heat flow data, and seismic velocity data are integrated to deduce the thermal structure of the lithosphere in the study area from the shallow section to deeper depths.
5. Process and Results
Various data processing methods for satellite gravity and magnetic data were employed to examine the Moho depth, Curie depth, and effective elastic thickness, as well as the density and thermal structure of the lithosphere, to gain a better understanding of the deep structural characteristics of the NL. These results are analysed separately in the following sections.
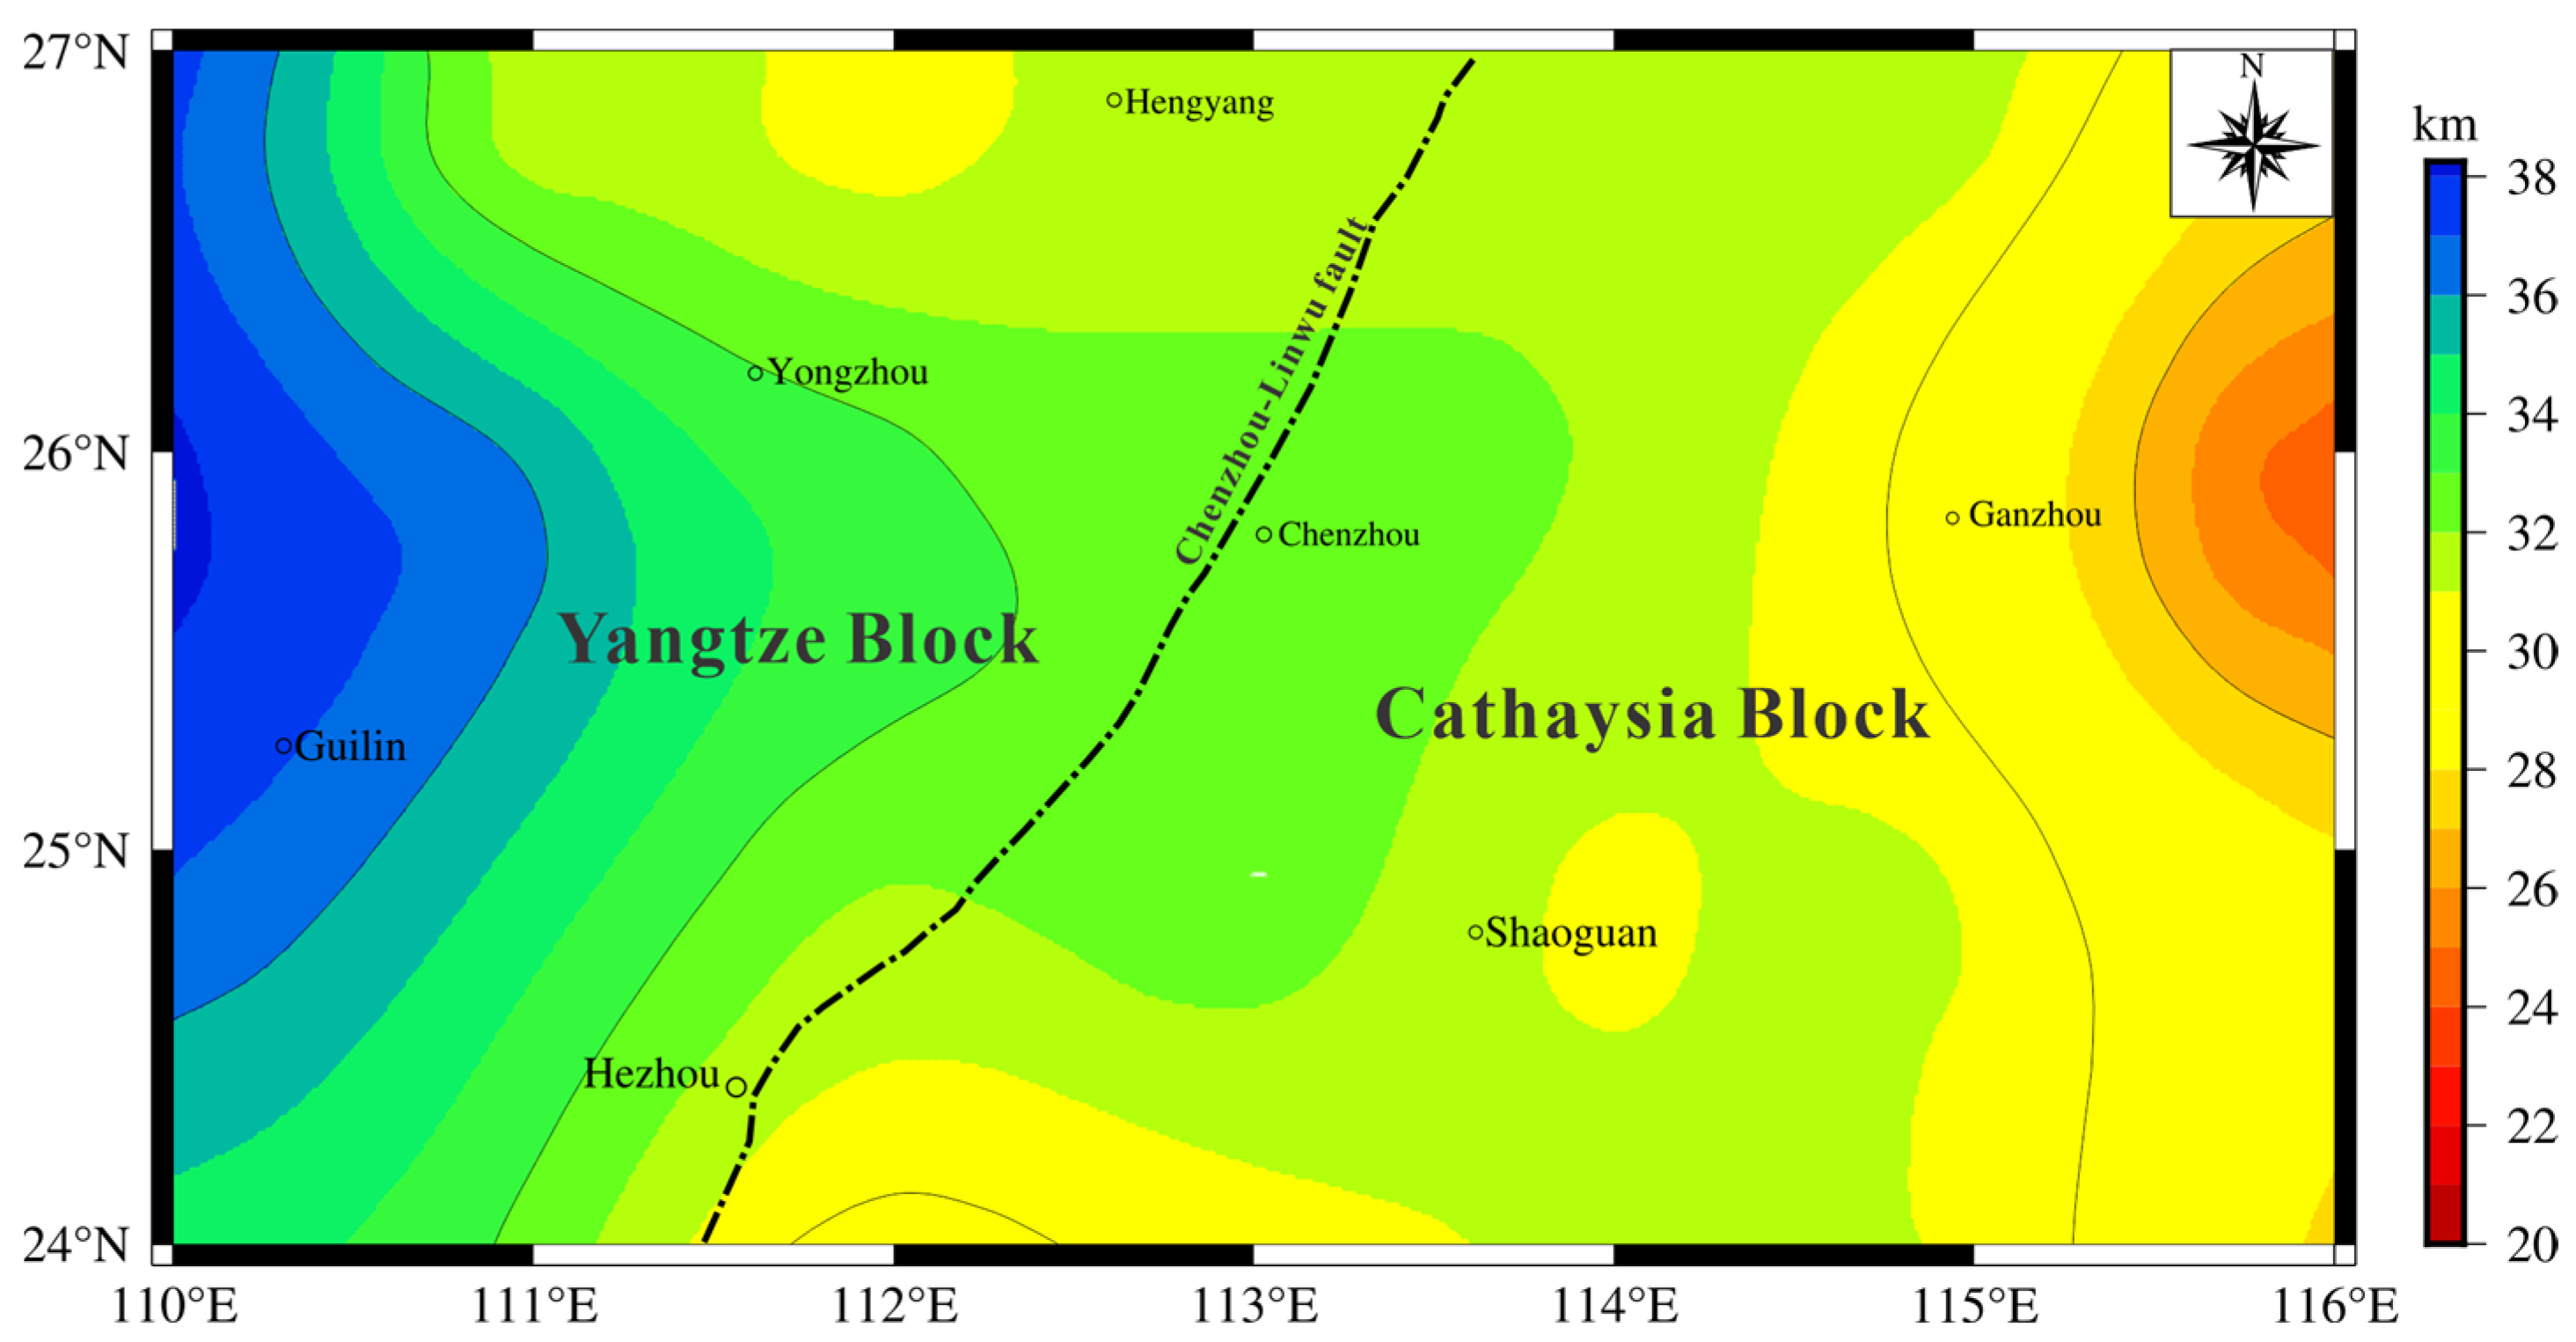
5.1. Moho Depth
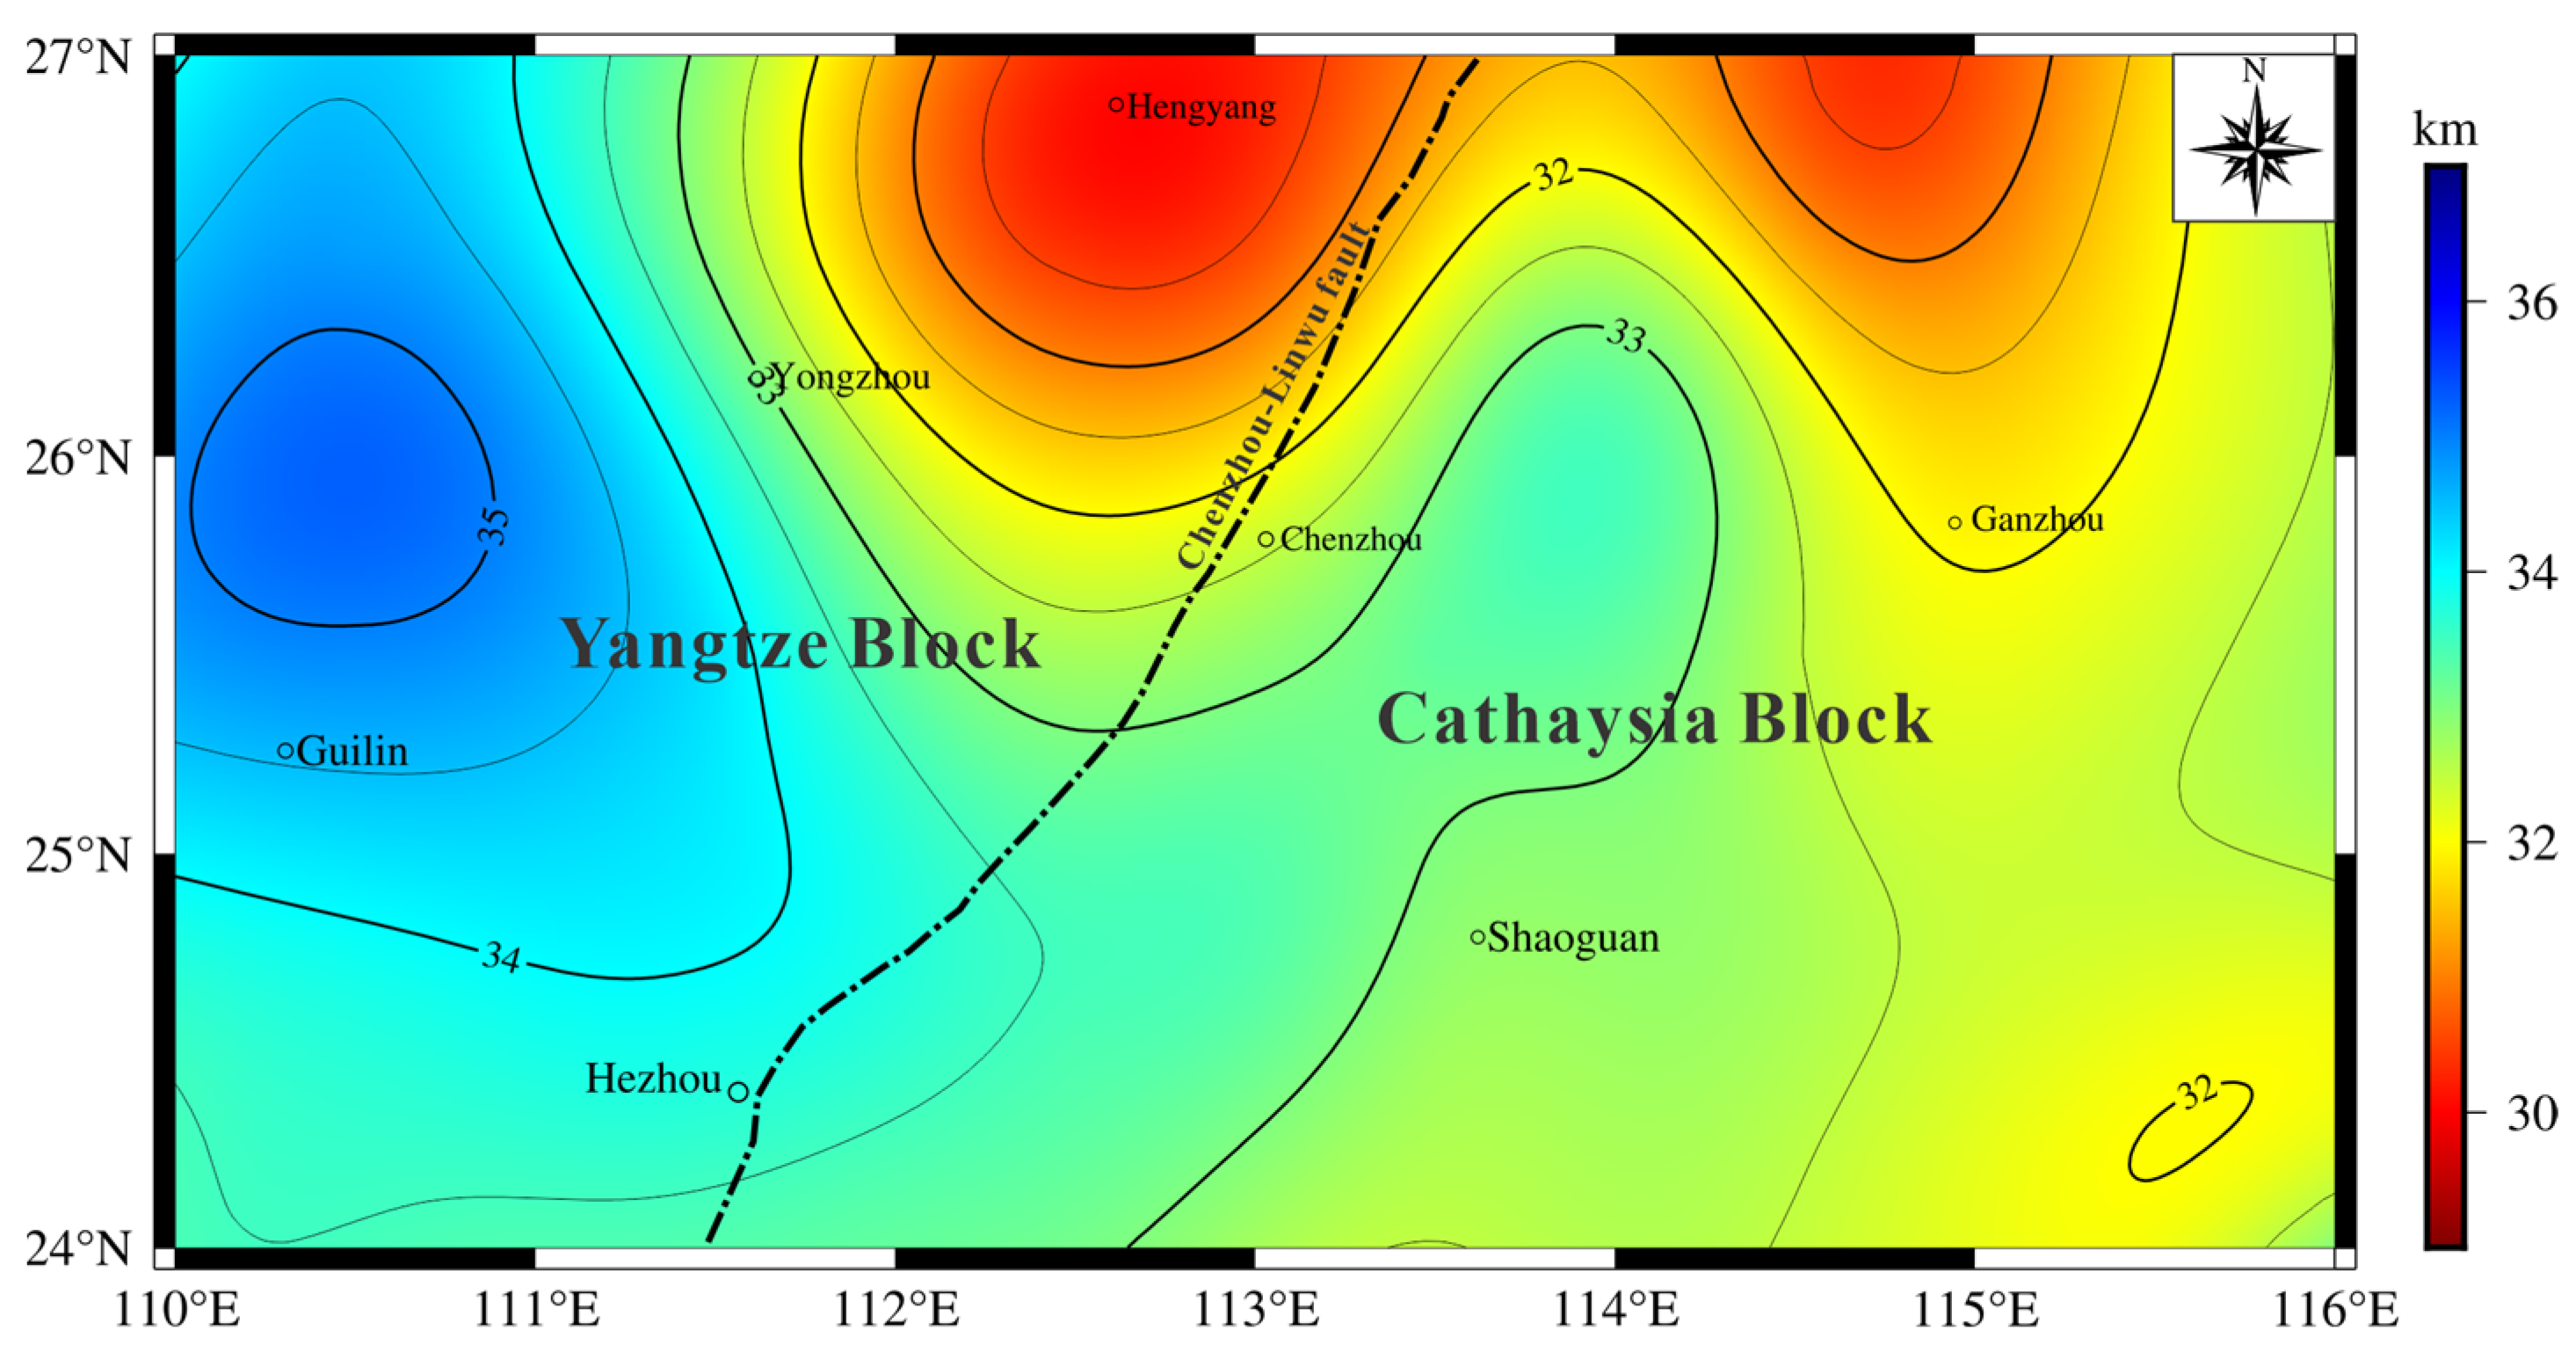
The Moho surface serves as a boundary separating the crust from the mantle based on the density or velocity and functions as a significant interface that reflects the diversity of energy differentiation between the crust and mantle. Therefore, we can use seismic and gravity methods to obtain the Moho depth. Seismic methods provide accurate Moho depth estimates, but the corresponding data are limited. In contrast, the P-O method using gravity data offers the advantage of easier acquisition, although the results are influenced by the chosen reference depth and the density contrast between the crust and mantle. Moreover, the NL spans the YB and CB, exhibiting significant lateral density and crustal depth differences. Consequently, the crustal depth and crust–mantle density contrast from the Crust1.0 global crustal model (based on the seismic method) are employed in this study to constrain the inversion of the Moho depth in the NL. This is accomplished by applying the P-O density interface inversion method with the transverse variable density and variable reference depth. As shown in
Figure 6, the Moho depth distribution in the NL is predominantly characterized by an upward movement to the east and downward movement to the west, with the depth of variation gradually increasing from 28 km in the eastern region to 37 km in the western region.
5.2. Curie Depth
The Curie depth is the lower boundary of the magnetic layer in the upper lithosphere of the Earth, indicating the temperature (approximately 580 °C) at which demagnetization of lithospheric rocks occurs due to the influence of Earth’s temperature and other factors. Many researchers have argued that demagnetizing and extending the upward range of magnetic anomalies are necessary to remove oblique magnetization and mitigate the influence of shallow magnetic anomalies on deep magnetic anomalies before conducting inversions at the Curie depth. We used EMAG2 RTP magnetic anomaly data to directly determine the Curie depth in the NL, as the EMAG2 RTP magnetic anomaly is indicative of regional magnetic field information. The sliding window size and step size in the power spectral analysis method are critical for determining the accuracy of inversion results in Curie depth calculations. In this study, considering extensive research results and numerous window tests, the sliding window size was set to 160 km, with an increment of 40 km, to determine the Curie depth in the study area (
Figure 7). The distribution of the Curie depth in the NL, as shown in
Figure 7, ranges from 20 to 38 km. The overall pattern shows an eastward rise trend and westward subsidence trend.
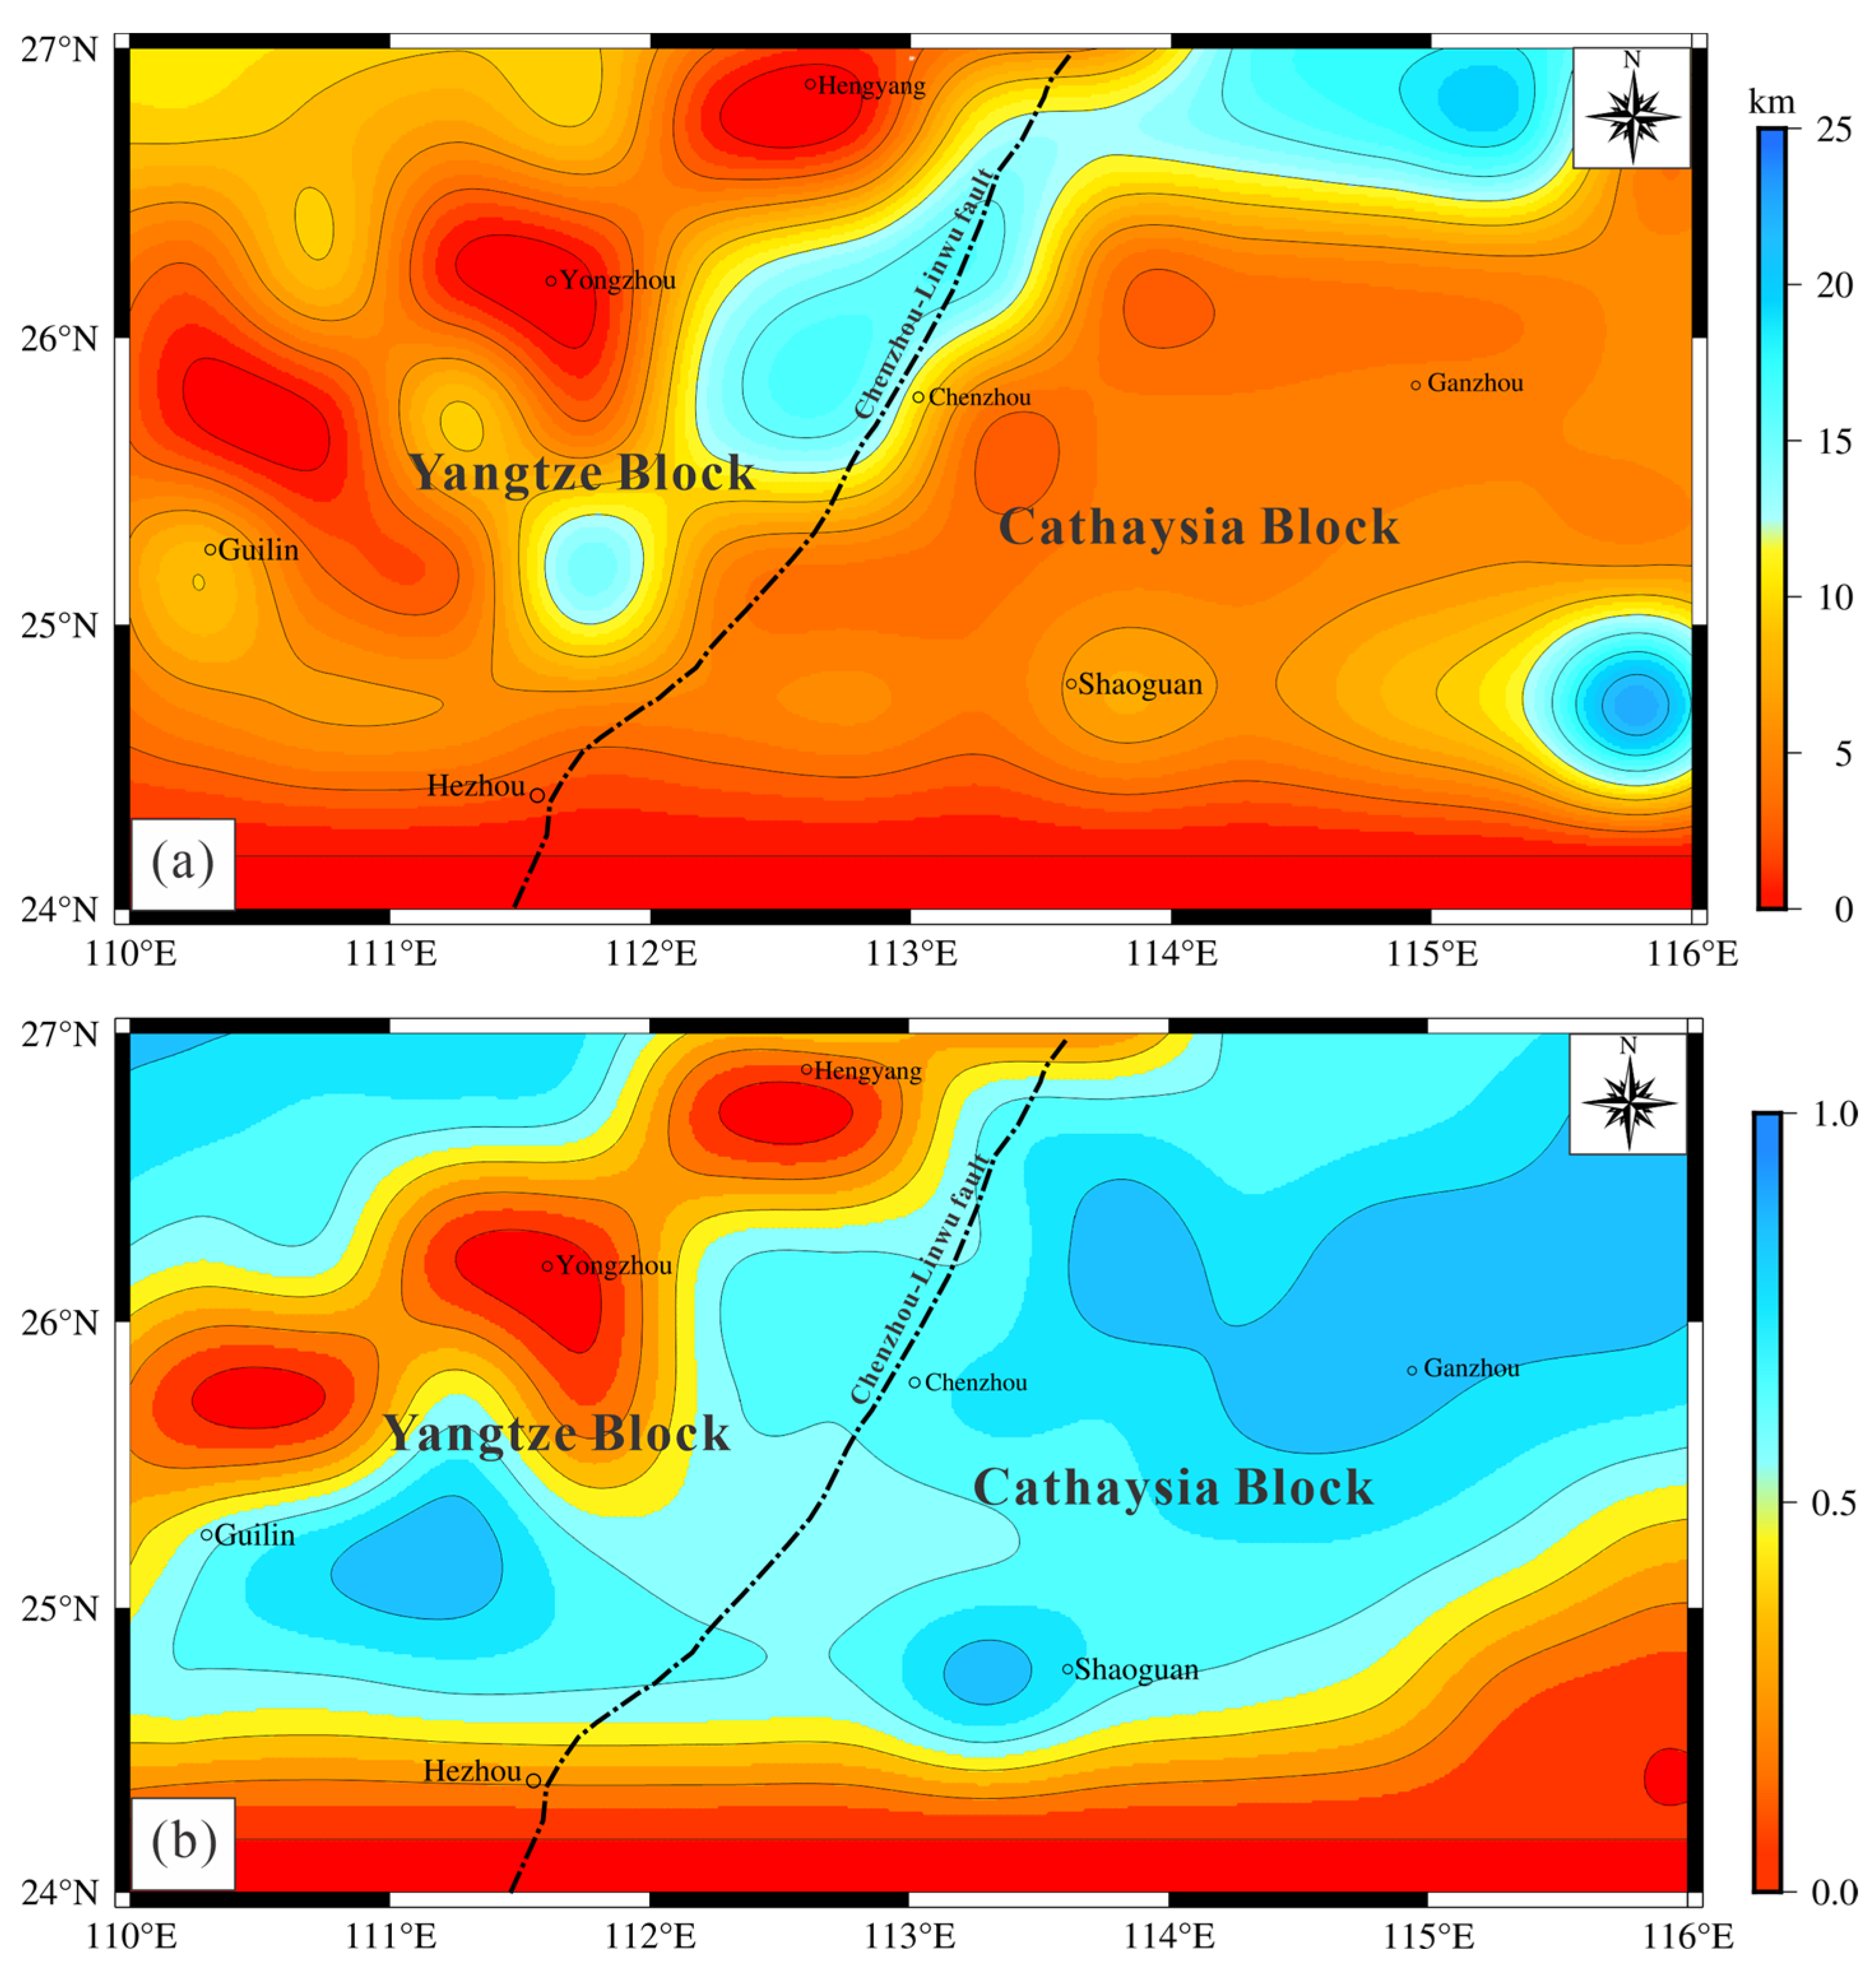
5.3. Effective Elastic Thickness (Te) and Load Ratio (F)
The effective elastic thickness
Te serves as a significant indicator of the mechanical strength over geological time periods. In this study, we employed a joint approach involving conductivity and correlation functions to determine
Te in the NL. This method involves calculating the observed conductivity and correlation function from the spectra of BGA and ETOPO1 topographic data and subsequently deriving the theoretical conductivity and correlation function based on the crustal density, mantle density from the Crust1.0 model, and Moho depth data (
Figure 6). Ultimately, the Bayesian inference approach was used to assess the optimal
Te and
F in the NL, with the goal of minimizing the fitting difference between the observed and theoretical data.
Figure 8 shows the
Te and
F distributions in the NL.
Te is a measure of the overall strength of the lithosphere, with a larger thickness indicating a higher mechanical strength and vice versa.
F indicates the distribution of loading across various density interfaces within the lithosphere prior to flexural deformation, and an
F value exceeding 0.5 suggests changes in the lithospheric strength due to subsurface loading [
50,
51,
52]. As shown in
Figure 8,
Te and
F in the NL mostly range from 0~10 km and 0.5~1.0, respectively. This suggests that subsurface loading from depth is the primary modifier of the lithospheric strength in the NL.
5.4. Lithospheric Density Structure
By employing a priori constraints, the gravity 3D inversion method was employed to characterize the lithospheric density structure in the NL. The Vs-wave velocity model [
53] and two previously published 2D crustal-scale deep seismic reflection Vp profiles were integrated. Velocity–density conversion equations for the crust and mantle were determined using the Moho depth as the crust–mantle boundary (
Figure 6). Furthermore, the distributions of crustal-thickness ground–temperature gradients, integrated geothermal heat-flow values in the South China Block, and mean thermal conductivity data were considered when calculating density values for the crust and mantle. Finally, the sedimentary layer depth from the Crust1.0 global crustal model [
54] and Moho depth information were used as the stratification depths of the sedimentary and crustal layers, respectively. Combined with the background densities of the different layers of the standard lithospheric density structure, the background densities were subtracted from the corresponding layer density distributions to obtain a 3D density anomaly model, which was used as a reference model for 3D gravity inversion to constrain the inversion process. In the 3D gravity inversion calculation process, the target depth for inversion is set to 70 km and divided into x, y, and z directions, with individual grid sizes of 0.25° × 0.25° × 1 km. The wavelet compression parameter was set to 0.025, and the smooth model difference mode was employed. The length scale parameters for the x, y, and z directions were set to 0.05°, 0.05°, and 2 km, respectively. The density reference model assigned a weight of 5 to the velocity point locations and adjacent grids, and a weight of 1 to other regions. With the utilization of the specified inversion parameters, 3D gravity inversion was performed of the BGA data for the study area while incorporating prior information constraints. After multiple iterations, a 3D density anomaly model for the NL was successfully derived, effectively minimizing the data fitting error. The density distributions at different depths in the study area are shown in
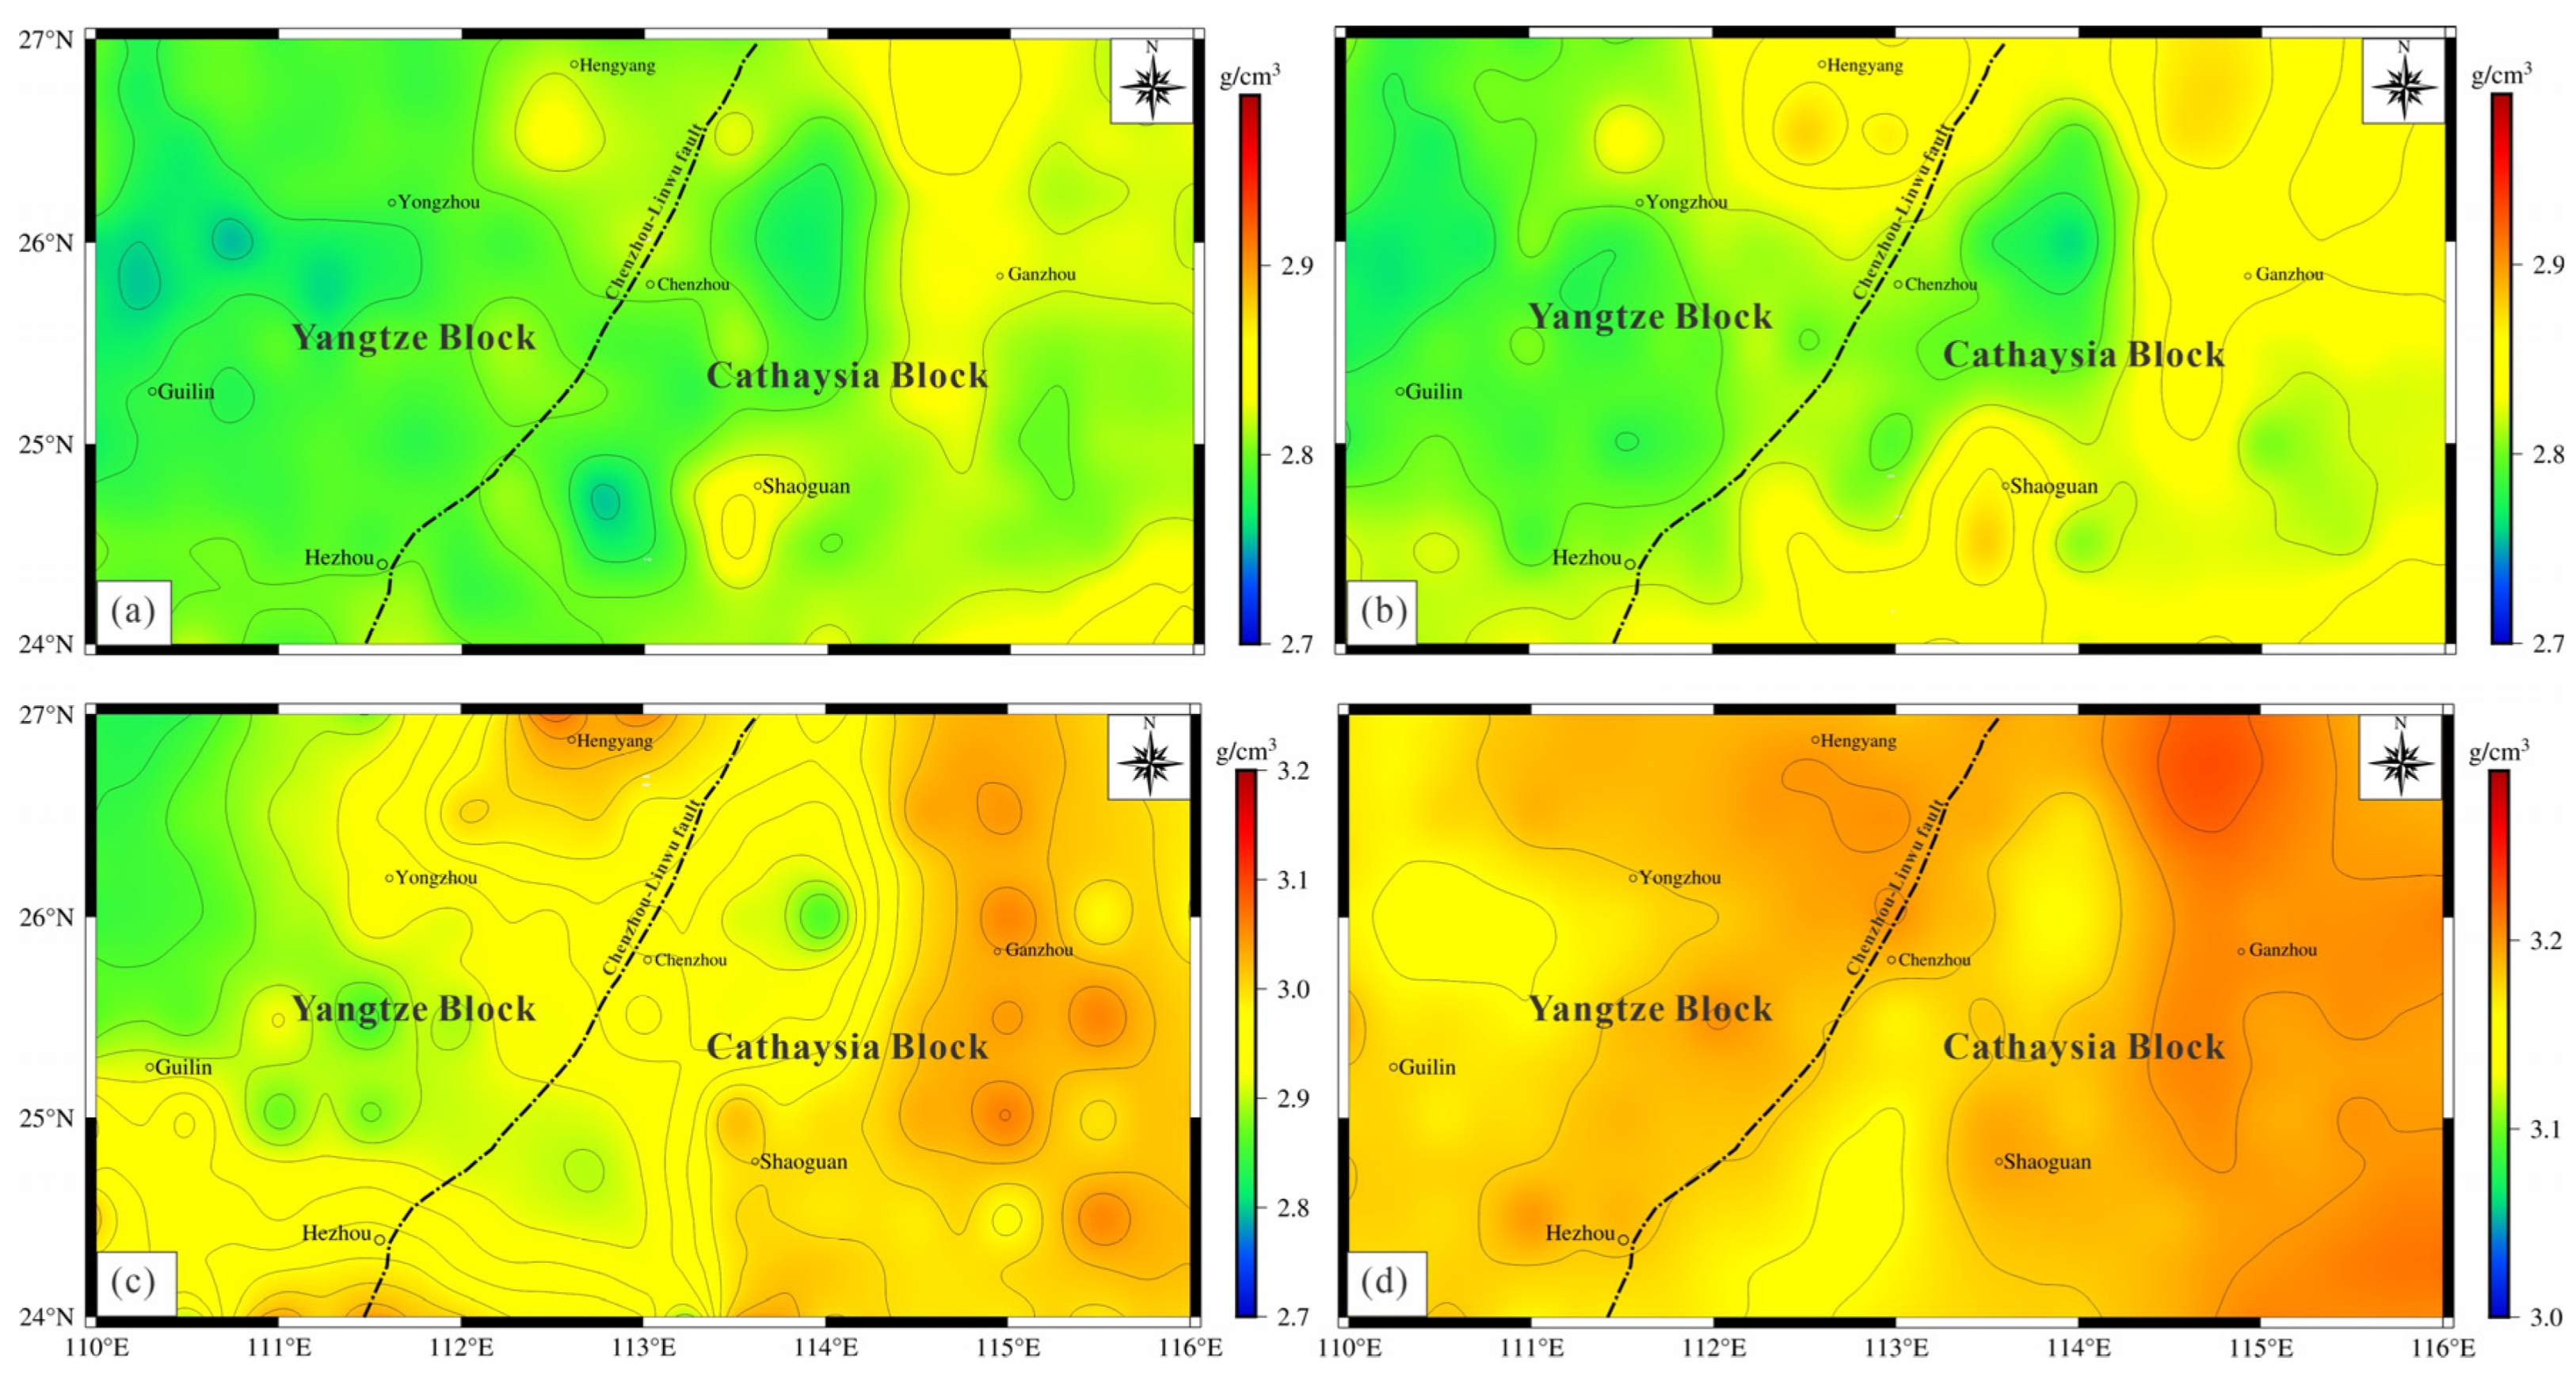
Figure 9.
As shown in
Figure 9, the tectonic units in the NL exhibit marked density variations at both shallow and deep levels, with high- and low-density anomalies demonstrating divergent patterns. Additionally, there is a consistent upward trend in the overall density with increasing depth. At a depth of 10 km, the eastern part of the CB exhibits a localized zone of elevated relative density. This area of high relative density in the eastern part of the CB further expands at a depth of 20 km. At a depth of 30 km, the density in certain areas of the CB reaches 3.2 g/cm
3, indicating proximity to the mantle. At a depth of 40 km, the entire study area exhibits a high density surpassing 3.2 g/cm
3. Combined with the Moho depth, this finding suggests that the entire NL has reached the upper mantle depth at 40 km.
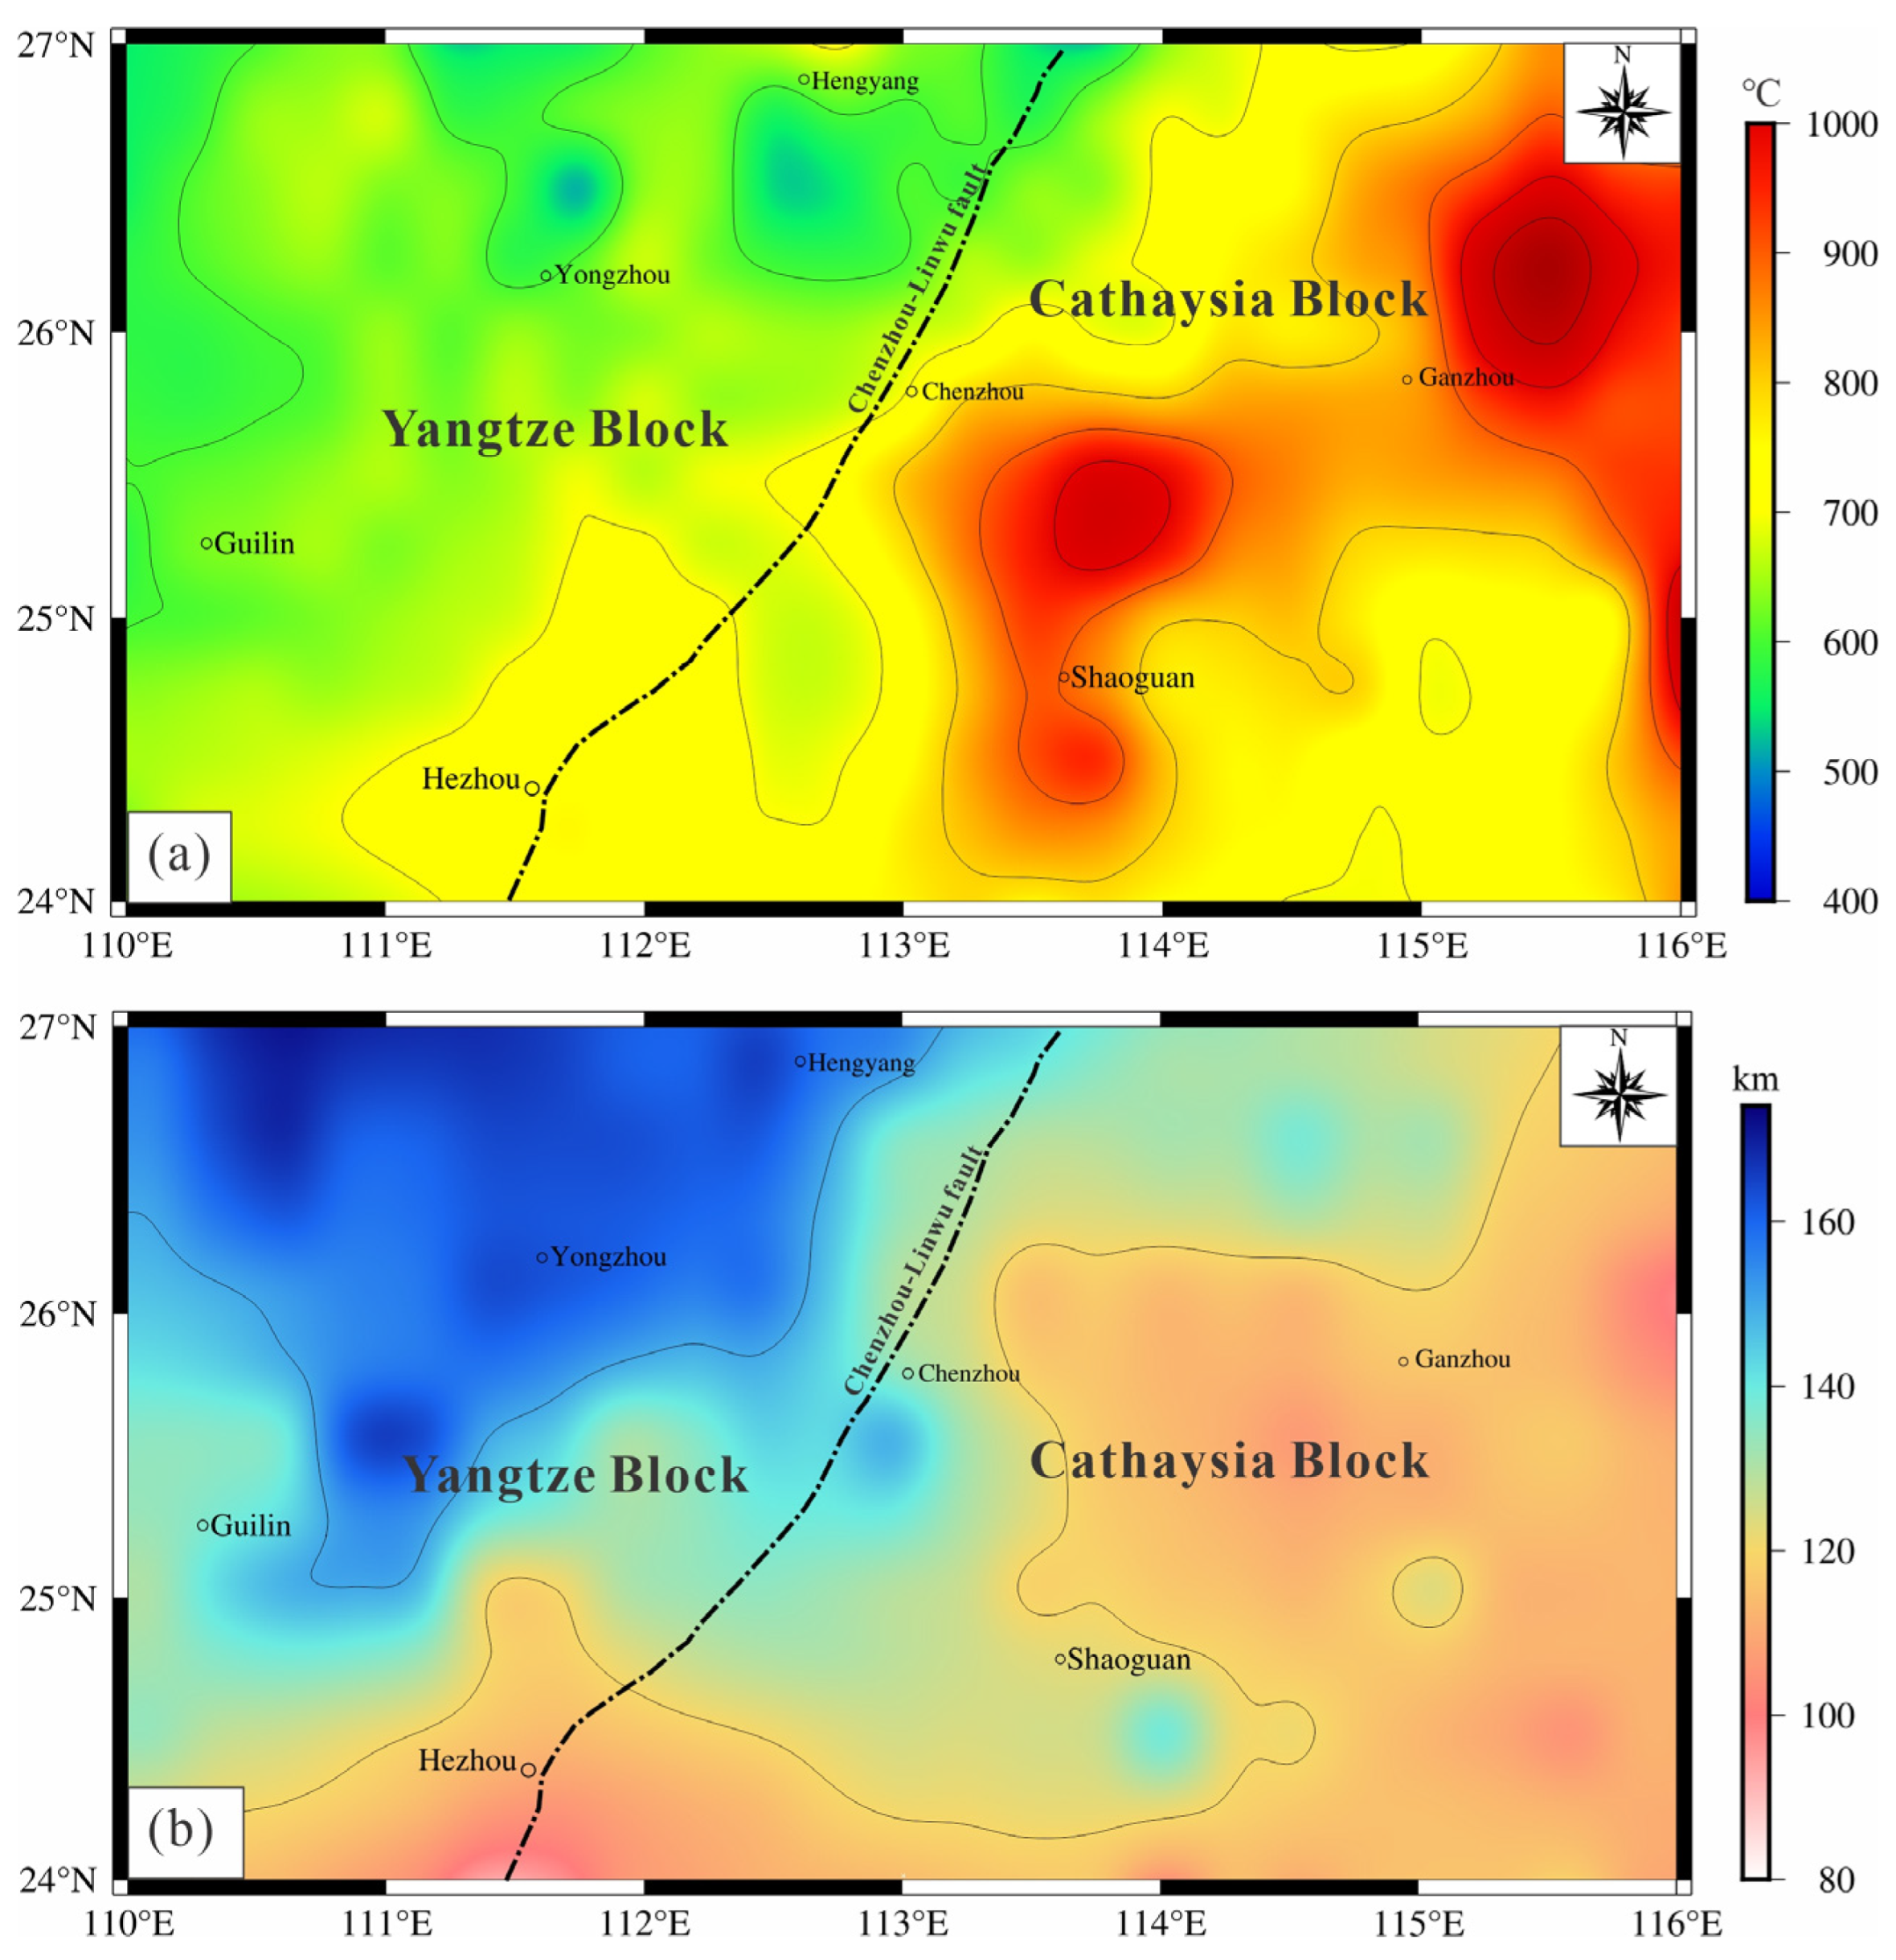
5.5. Lithospheric Thermal Structure
In this paper, we initially derived the shallow thermal characteristics of the lithosphere at depths 0 to 60 km in the study area using Curie depth, geothermal heat flow, stratified heat generation rate and thermal conductivity data. The relationship between the seismic velocity and temperature was subsequently utilized to obtain the deep thermal profile of the lithosphere within the 60–200 km depth range. These two components were integrated to construct the thermal structure of the lithosphere in the NL. The thermal structure distributions at the Moho depth (
Figure 6) and mantle adiabatic temperature (1300 °C) in the NL are shown in
Figure 10a,b, respectively.
Figure 10a shows the Moho temperature in the NL, which range from 400 to 1000 °C. Overall, lateral inhomogeneity is evident, with two hotspot centres located in Shangrao to the north and Ganzhou to the east in the CB, while the temperatures in the YB are generally lower. The thermal lithosphere thickness in the NL ranges from 80 to 160 km (
Figure 10b), with a gradual increase in thickness from northwest to southeast. The relationship between the Moho temperature and thermal lithosphere thickness in the study area exhibits a certain inverse correlation, indicating a consistent lithospheric thermal structure from shallow to deep layers in most areas. This suggests that the lithospheric thermal structure can effectively reflect the tectonic background of the study area.
6. Discussion
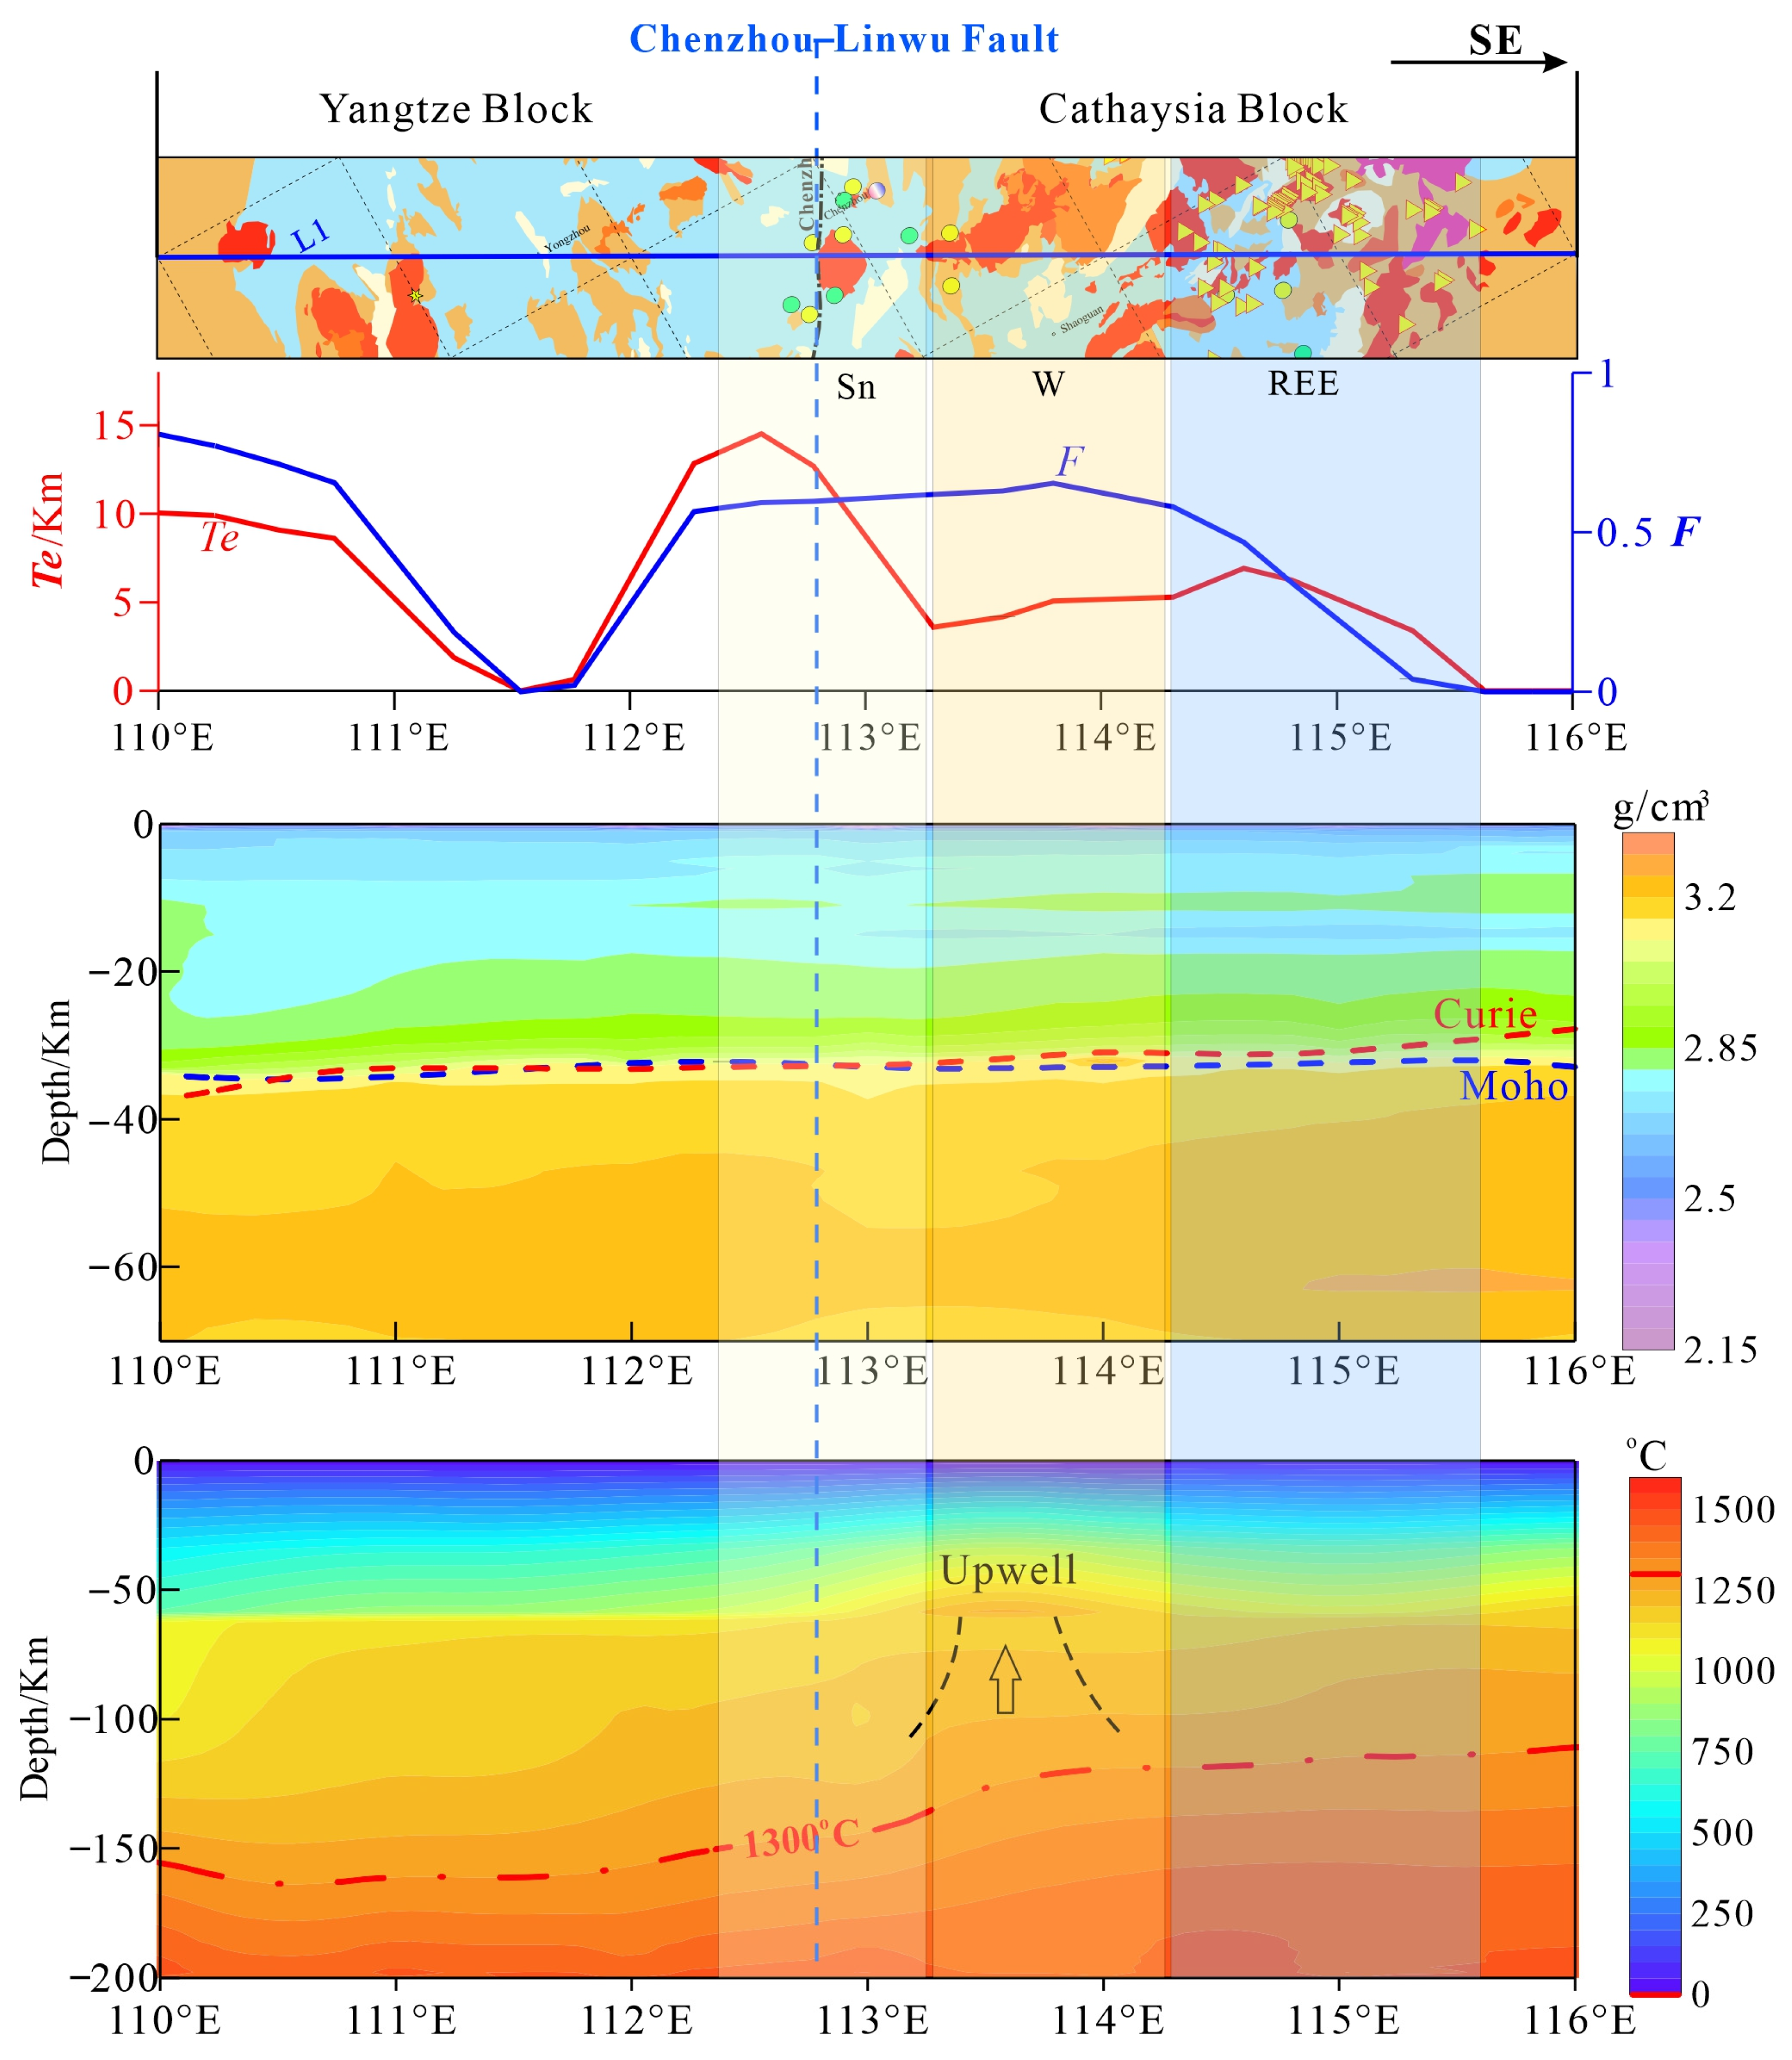
The W-Sn-REE mineralization background was examined by analysing the subsurface structure distribution characteristics of the of Section L1 across various deposit types and constituent blocks in the research area in conjunction with relevant geological and geochemical data.
6.1. Deep Structure Features of the NL
Based on
Figure 11, the lithospheric effective elastic thickness (
Te) in the NL ranges from 0 to 15 km. The load ratio (
F) mostly ranges from 0.5 to 1, and the Moho depth (32 to 35 km) is smaller than the average continental crustal depth. The Curie depth is similar to the Moho depth in most areas. This suggests high thermotectonic activity and relatively uplifted crust in the study area. The Moho/Curie depth, temperature, and thickness of the thermal lithosphere in the NL exhibit gradual increases in elevation and thinning from west to east, with the Chenzhou–Linwu fault serving as the dividing line. The significant differences in the distributions of deep structures between the eastern and western sections indicate an inconsistency in the tectonic evolution process in the NL.
The Curie depth in the eastern part of the NL is shallower than the Moho depth, with higher lithospheric temperatures and gradually decreasing
Te and
F values from west to east. The lithospheric density structure reveals the presence of extensive low-density layers in the middle and lower crust, while the mantle density in the region adjacent to the Chenzhou–Linwu fault to exhibits localized areas of low values. In the western portion of the NL, most of the Moho depths are smaller than the Curie depth, while the central part of the western section of the NL exhibits gull-like
Te and
F anomalies, which are associated with lower temperatures. These significant structural characteristics suggest that the intensity of tectonic activity in the eastern section of the Nanling is higher than that in the western section and that the degree of crustal modification is higher in the eastern section than in the western section. The difference in deep structural features between the eastern and western sections of the NL may be attributed to the combination of the evolutionary processes of the YB and CB. This possibly occurs because the CB is a microplate accretionary block [
55], while the YB is an ancient craton [
56,
57]. The NL, resulting from the collision of the CB and YB, is situated in the eastern part of the CB and influenced by the subduction and retraction of the Palaeo-Pacific Plate. The collision of the CB and YB has led to a gathering block, accompanied by asthenospheric upwelling, intensified magmatic activity, and extensive modification of the Earth’s crust and mantle. This ultimately led to the creation of a large area of low density in the middle and lower crust and the Earth’s mantle in the eastern section of the NL. Conversely, the western section of the NL, located in the eastern part of the YB, is shielded by the ancient craton, thus inhibiting crustal uplift and heat transfer. Therefore, the decrease or thinning distributions of the Curie depth, Moho depth, and thermal lithosphere thickness exhibit gradual changes from west to east in the NL.
6.2. W-Sn Metallogenic Background
The primary sources of tungsten and tin ores in the NL occur predominantly in the eastern part of the Chenzhou–Linwu fault zone. Tin ores are primarily found in close proximity to the Chenzhou–Linwu fault zone, whereas tungsten ores occur nearer the eastern region of the NL. The distribution of tungsten and tin ores typically demonstrates an eastward occurrence of tungsten and westward occurrence of tin, in accordance with the distribution characteristics of their respective ore-forming parent rocks [
58].
As shown in
Figure 11, the deep structural characteristics of the tungsten deposits are
Te < 5 km,
F > 0.5, and a Curie depth shallower than the Moho depth, suggesting massively remodelling by the deep thermal tectonic activity. High-temperature uplift of the mantle may indicate lithospheric dismantling and asthenospheric upwelling. The presence of a wide range of low-density layers in the middle crust and mantle may represent the partial melting of the affected crust and mantle caused by deep thermal modification. The tin deposits occur in a region with deep structural features that exhibit a rapid decrease in
Te from 15 km to the west to 5 km to the east, with
F > 0.5, indicating that thermal modification from depth has significantly altered the lithosphere in the area. Moreover, there is a gradual increase in the lithospheric temperatures and Curie and Moho depths from west to east, suggesting a trend towards incremental uplift. The Chenzhou–Linwu fault is located at the intersection of the Curie and Moho depths and temperature gradient zones, indicating that the fault may extend deep into the crust–mantle interface and serve as a deep boundary between the CB and YB.
The geological and geochemical data of the tungsten and tin deposits in the NL suggest a close link between W-Sn deposits mineralization and highly differentiated granite during the same period [
17,
59,
60]. The temperature at which tungsten-bearing granite forms is approximately 650–750 °C, while the temperature at which tin-bearing and tin–tungsten-bearing granite are formed is approximately 800–820 °C [
1]. This indicates that the formation temperature of tungsten ore is lower than that of tin/tin–tungsten ore.
The deep structural characteristics of the NL tungsten and tin mining region and its tectonic evolution were also examined. It is hypothesized that in the retraction of the Palaeo-Pacific Plate during the Late Jurassic–Early Cretaceous and Late Cretaceous periods [
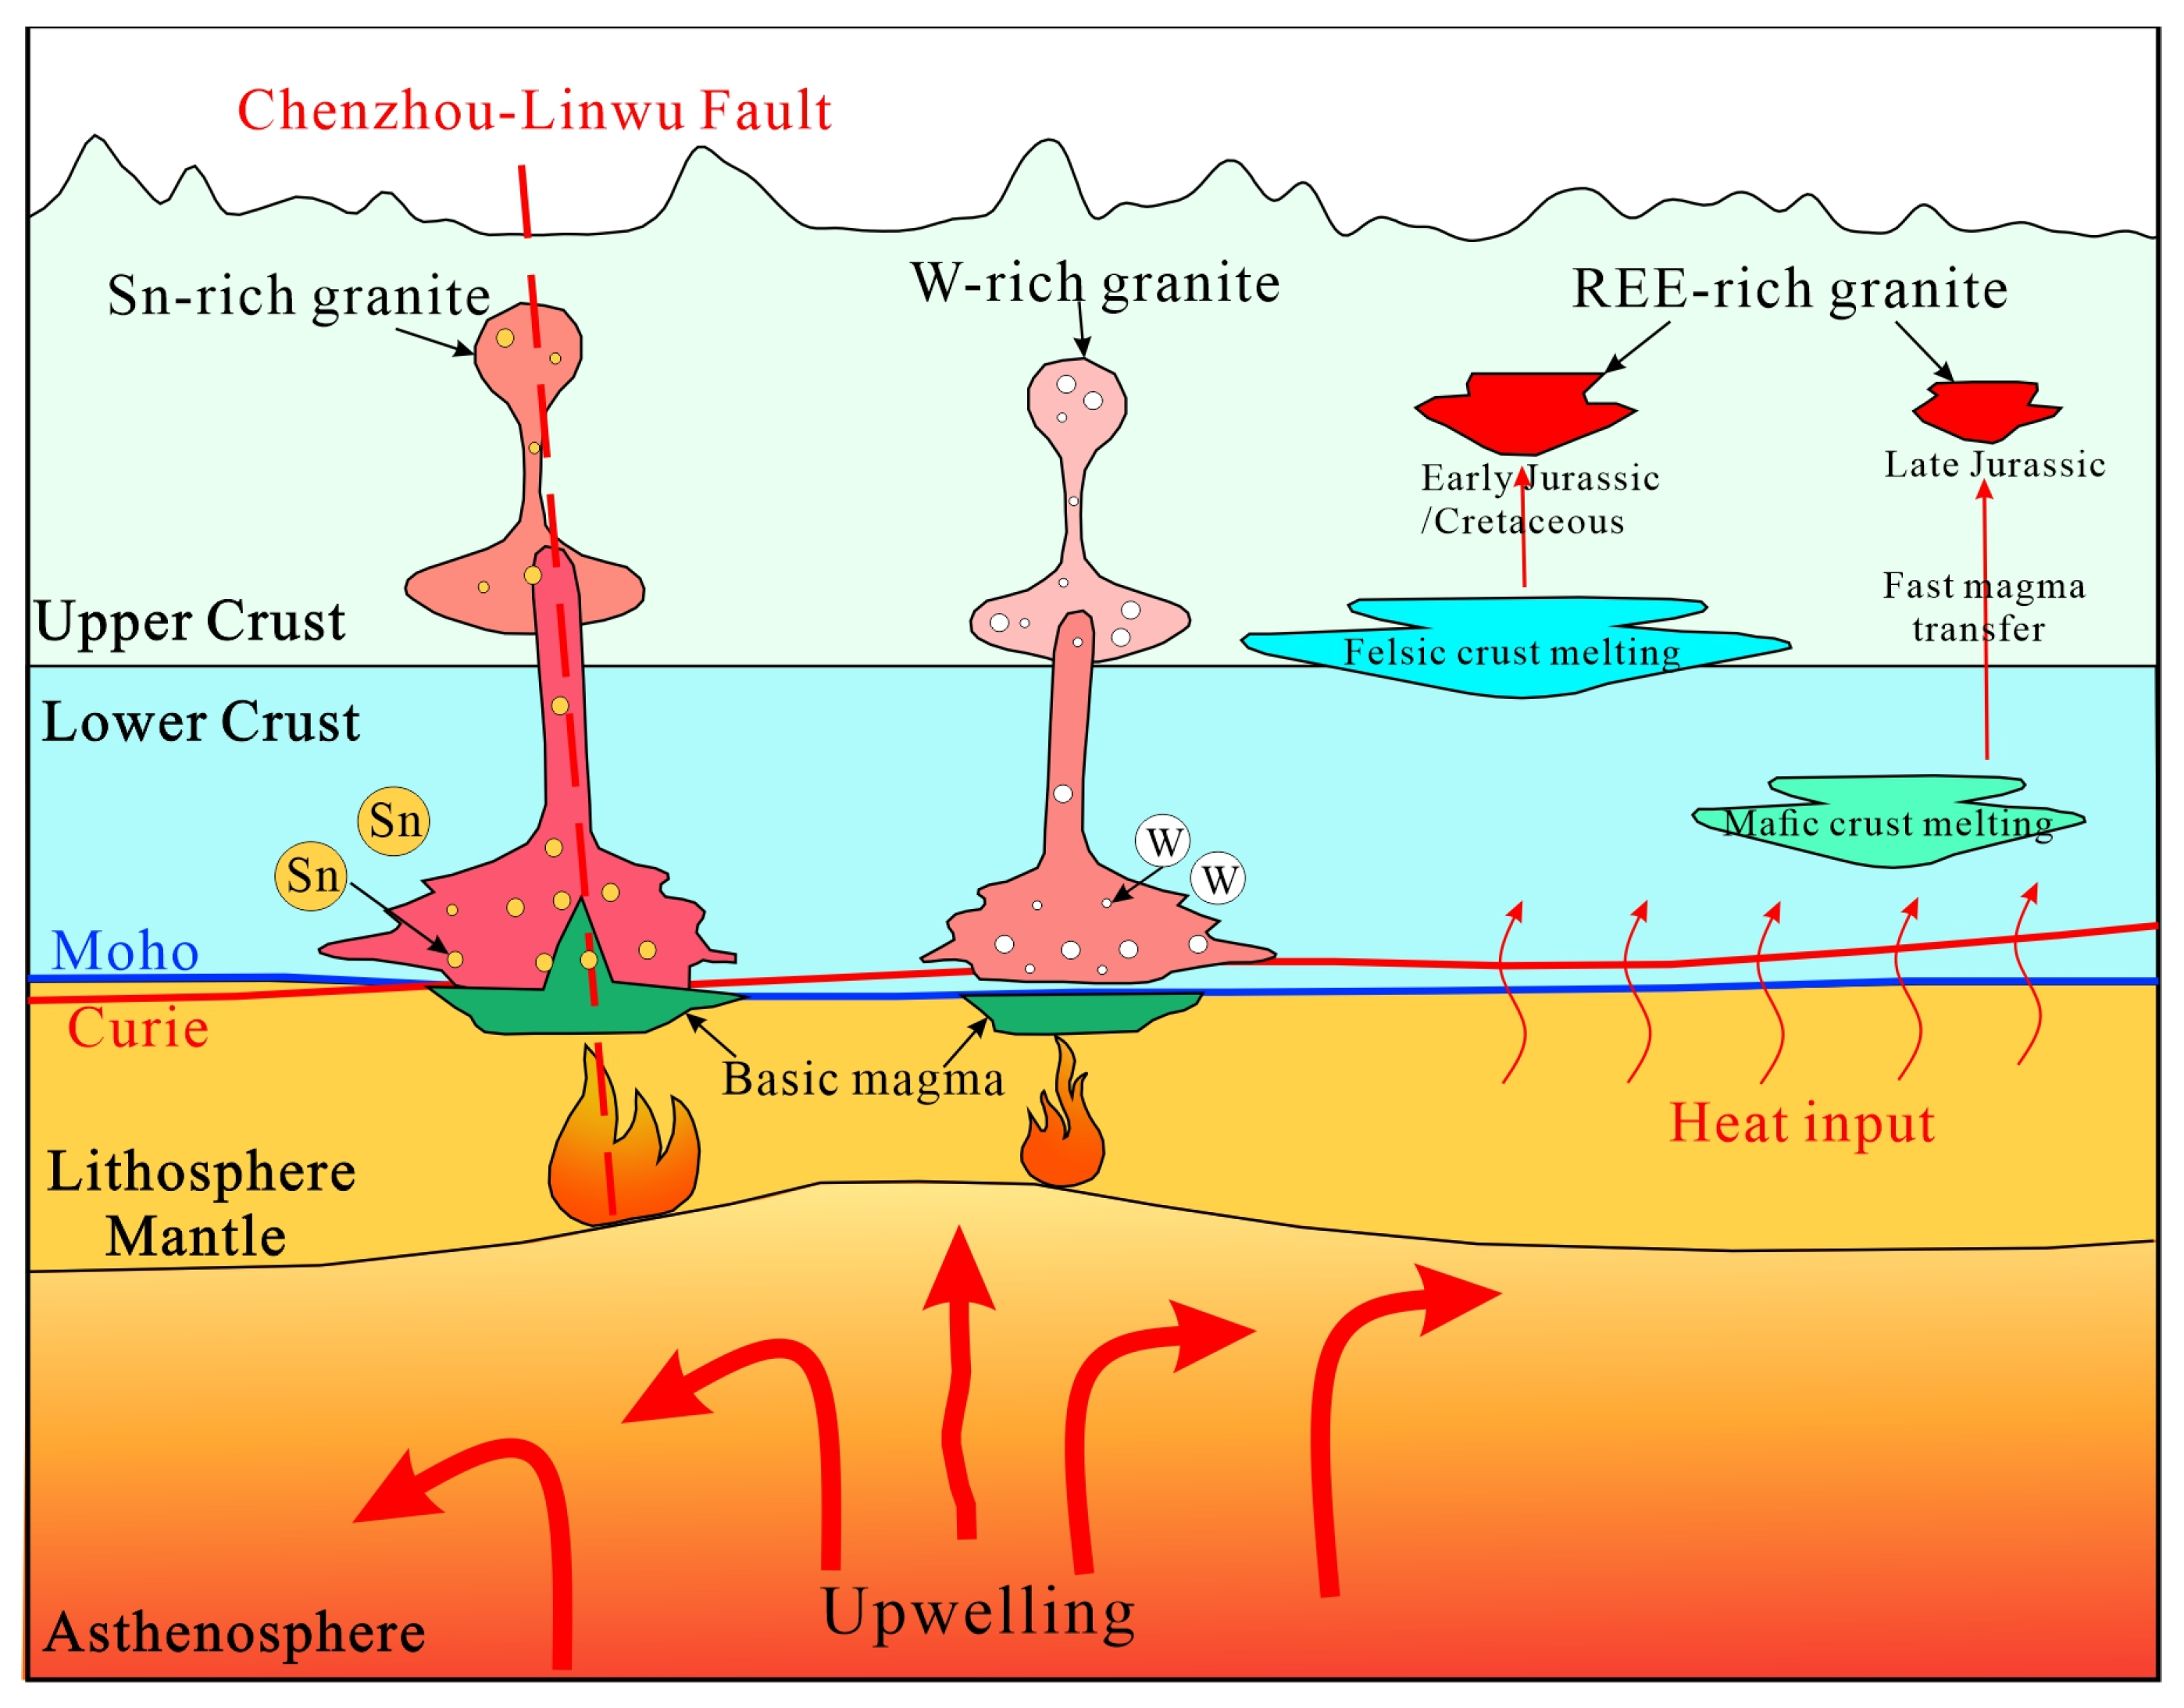
61], the lithosphere centred on the NL underwent dismantling and subduction, resulting in the asthenospheric upwelling. This led to the upward transmission of deep energy and material, which, in turn, induced the partial melting of the mantle and crust of the overlying lithosphere, leading to the upward transfer of magma carrying the ore-bearing elements of the tungsten and tin deposits. The tin deposit area is associated with the Chenzhou–Linwu fault, a deep fault that connects the crust and mantle. The Chenzhou–Linwu fault serves as a pathway for mineral and heat transfer during crustal extension and asthenospheric upwelling, facilitating the transport of mantle-derived materials to shallower depths. In contrast, tungsten ore accumulations, located relatively far from the Chenzhou–Linwu fault, lack direct ore and heat conduction pathways and experience crustal heating under deep thermal conditions, resulting in extensive partial melting of the mid-crust (low-density layer). Consequently, Sn-rich granites are primarily sourced from materials of mantle origin, while W-rich granites are mainly derived from materials of crustal origin (
Figure 12).
6.3. REE Metallogenic Background
The occurrence of rare-earth mineralization and tungsten–tin mineralization in the NL strata is commonly associated with granite, yet these rocks do not coexist [
5]. The genesis of REE deposits is influenced not only by the prevalence of their parent rocks but also by external environmental conditions, such as hot and humid climates. Our focus is exclusively on investigating the concentration process of rare-earth elements in the parent rocks of the NL.
The distribution pattern of REE deposits in the eastern part of the NL is illustrated in the L1 profile (
Figure 12). The deep structural characteristics of the REE deposit aggregation area reveal that
Te varies between 5 and 10 km, and
F is sharply attenuated to below 0.5. These findings indicate that the change the lithospheric strength in this area was caused mainly by topographic changes and shallow crustal density variations [
62]. Additionally, there is evidence of a large-scale low-density layer in the crust at a depth of approximately 20 km, signifying intense intracrustal modification activity in the area of REE concentration. The Moho and Curie depths in this region exhibit a relative uplift, with the Curie depth shallower than the Moho depth. The thermal lithospheric thickness is smaller, and the lithospheric mantle temperature is higher, indicating that the change in the crustal density can be attributed to deep thermal modification caused by asthenospheric upwelling.
The majority of REE deposits in the NL are found in Indosinian metaluminous granite, Yanshanian A-type granite, and Middle–Late Yanshanian biotite monzonitic granite [
5]. Indosinian metaluminous granite predominantly formed from partially melted crustal materials within the context of continental crust thickening following the Indosinian orogeny and belongs to the category of crustal source-type granite [
63,
64,
65]. The primary petrochemical characteristics of Yanshanian A-type granite closely resemble those of S-type granite, which is a component of the Yanshanian multistage composite rock formation and is derived from crustal remelting [
66]. Middle–Late Yanshanian biotite monzonitic granite features I-type or synfelsic granodiorite. Moreover, the most important heavy rare-earth deposits in the NL primarily occur in the highly evolved differentiation late Yanshanian complex granite facies zone [
67,
68,
69].
Considering the deep structural features of the REE deposit accumulation zone and integrating information on the tectonic evolution process and REE ore-forming parent rocks in the NL, it is suggested that the REE enrichment process in the eastern section of the NL may involve two distinct stages.
During the Early Triassic period of the Mesozoic Era, the NL experienced asthenospheric upwelling under the subduction of the Palaeo-Pacific plate, which carried heat and energy upwards. The REE deposits in the area are located far from the centre of the asthenospheric upwelling area, without deep faults connected to the mantle, resulting in the transfer of heat to the crust and partial melting. In this process, the content of REEs in the felsic crust was higher than that in the mafic crust [
70]. As a result of crustal melting, REEs are enriched by drawing from crustal source materials [
71].
During the Late Jurassic, as the Palaeo-Pacific Plate retracted, and the upwelling action of the asthenosphere expanded, causing rapid upward magma intrusion. The upwelling of magmatic material and heat then caused crustal basement modification [
9]. Due to the brief duration of magma intrusion, few minerals abundant in rare-earth elements crystallized, leaving behind more rare-earth-element-enriched minerals. Additionally, rocks with higher crystalline differentiation tend to form parent rocks rich in heavy rare-earth elements, while those with lower evolutionary differentiation form parent rocks dominated by light rare-earth elements (
Figure 12).
7. Conclusions
In this paper, satellite gravity and magnetic derived EIGEN-6C4 and EMAG2 data are employed, which are commonly applied to study deep geological issues such as structure, tectonics, and subsurface material distribution globally or in large regions, to comprehensively explore the NL. The satellite gravity and magnetic data of the NL are processed using advanced methods such as the lateral variable density and variable depth P-O density interface inversion method, the point-by-point variable parameterized reduction to the pole method, the power spectrum method, the joint method of the conductivity and correlation function, the 3D gravity inversion method under the constraints of a priori information, and the method of constructing the thermal structure of the lithosphere. These methods are used to derive the significant variations in interfaces (Moho depth, Curie depth, and lithospheric effective elastic thickness) and the physical structures (lithospheric density and thermal structure) that reflect the deep structural characteristics of the NL. The results for the NL provide a basis for examining the deep structural characteristics and mineralization background of W, Sn, and REEs in conjunction with pertinent geological and geochemical data. The main research findings are as follows:
(1) The eastern and western parts of the NL are associated with the CB, which was created by the collision of small tectonic plates, and the YB, which formed from an ancient craton. Due to the subduction and retreat of the Palaeo-Pacific Plate and the collision of the CB and YB, the eastern section of the NL underwent more extensive shell–mantle modification. This resulted in the development of protoliths containing abundant tungsten, tin, and rare-earth elements, leading to the formation of the internationally renowned W-Sn-REE metallogenic belt in the NL.
(2) The spatial distribution of tungsten and tin in the NL may be attributed to the association of the tungsten–tin concentration area with the Chenzhou–Linwu fault, a deep rift linking the crust and mantle. The Chenzhou–Linwu fault zone functions as a conduit for mineral and thermal transmission in the extensional background process and asthenospheric upwelling transporting mantle source material to the shallow part of the region and thereby creating Sn-rich granite. In contrast, the aggregation area of tungsten ore, which occurs farther from the Chenzhou–Linwu fault zone, lacks direct ore-conducting and heat-conducting pathways. Under the conditions of deep thermal action and crustal baking, tungsten in the crust becomes concentrated, leading to the formation of W-rich granite.
(3) The enrichment of rare-earth elements in the parent rock of the NL may be attributed to the early Mesozoic (Triassic period) subduction of the Palaeo-Pacific Plate, which caused the release of heat from asthenospheric upwelling to the crust through heat transfer. Partial crust melting led to the formation of REE-rich granite by extracting REEs from the felsic crust with a high REE content. During the Late Jurassic, as the subducted Palaeo-Pacific Plate retreated, the extent of asthenospheric upwelling expanded, leading to shorter intrusion times of magma and the formation of more REE-bearing secondary minerals. Among these, the relatively high degree of crystalline differentiation resulted in the formation of ore-forming parent rocks with a high content of heavy REEs.
Author Contributions
Conceptualization, F.L. and J.Y.; formal analysis, F.L., J.Y., S.Z. and G.F.; methodology, F.L., J.Y. and G.F.; visualization, F.L., S.Z., J.L., G.F., D.W. and G.R.; writing—original draft, F.L., J.Y. and S.Z.; project administration, J.Y., F.L. and J.L. All authors have read and agreed to the published version of the manuscript.
Funding
This research were funded by the National Natural Science Foundation of China (U2344220, 92062108), the China Geological Survey Project (DD20221643; DD20230008), the Department of Natural Resources of Jiangxi Province Science and Technology Innovation Project (ZRKJ20232410, ZRKJ20232407), the Startup Project of Doctor Scientific Research of Jiangxi College of Applied Technology (JXYY-G2023005), the Resource Environment and Engineering Exploration Technology Application Innovation Center of Jiangxi College of Applied Technology (010-2302700003), the Key Laboratory of Ionic Rare Earth Resources and Environment, Ministry of Natural Resources of the People’s Republic of China (2023IRERE104), and the SinoProbe Laboratory, Chinese Academy of Geological Sciences.
Data Availability Statement
Acknowledgments
The authors are grateful for the constructive comments from the anonymous reviewers.
Conflicts of Interest
The authors declare no conflicts of interest.
References
- Yuan, S.D.; Williams-Jones, A.E.; Mao, J.W.; Zhao, P.; Yan, C.; Zhang, D. The origin of the zhangjialong tungsten deposit, south china: Implications for W-Sn mineralization in large granite batholiths. Econ. Geol. 2018, 113, 1193–1208. [Google Scholar] [CrossRef]
- U.S. Geological Survey. Minerals Commodity Summaries; U.S. Geological Survey: Reston, VA, USA, 2017. [Google Scholar]
- Ministry of Natural Resources of the People’s Republic of China. China Mineral Resources; The Geological Publishing House: Beijing, China, 2018; pp. 1–58. [Google Scholar]
- Xu, K.Q.; Tu, G.C. (Eds.) Geology of Granites and Their Metallogenetic Relations; Science Press: Beijing, China, 1984; pp. 1–31. [Google Scholar]
- Hua, R.M.; Zhang, W.L.; Gu, S.Y.; Chen, P.R. Comparison between REE granite and W-Sn granite in the Nanling region, South China, and their mineralizations. Acta Petrol. Sin. 2007, 23, 2321–2328, (In Chinese with English abstract). [Google Scholar]
- Zhang, R.Q.; Lu, J.J.; Wang, R.C.; Yang, P.; Zhu, J.C.; Yao, Y.; Gao, J.F.; Li, C.; Lei, Z.H.; Zhang, W.L.; et al. Constraints of in situ zircon and cassiterite U-Pb, molybdenite Re-Os and muscovite 40Ar-39Ar ages on multiple generations of granitic magmatism and related W-Sn mineralization in the Wangxianling area, Nanling Range, South China. Ore Geol. Rev. 2015, 65, 1021–1042. [Google Scholar] [CrossRef]
- He, C.; Xu, C.; Zhao, Z.; Kynicky, J.; Song, W.L. Petrogenesis and mineralization of REE-rich granites in Qingxi and Guanxi, Nanling region, South China. Ore Geol. Rev. 2016, 81, 309–325. [Google Scholar] [CrossRef]
- Xu, C.; Song, W.L.; He, C.; Wang, L.Z. The overview of the distribution, type and genesis of the exogenetic rare earth elements (REE) deposits. Bull. Mineral. Petrol. Geochem. 2015, 34, 234–241, (In Chinese with English abstract). [Google Scholar]
- Zhao, X.; Li, N.B.; Huizenga, J.M.; Yan, S.; Yang, Y.Y.; Niu, H.C. Rare earth element enrichment in the ion-adsorption deposits associated granites at Mesozoic extensional tectonic setting in South China. Ore Geol. Rev. 2021, 137, 104317. [Google Scholar] [CrossRef]
- Wang, D.H.; Huang, F.; Wang, Y.; He, H.H.; Li, X.M.; Liu, X.X.; Sheng, J.F.; Liang, T. Regional metallogeny of Tungsten-tin-polymetallic deposits in Nanling region, South China. Ore Geol. Rev. 2020, 120, 103305. [Google Scholar] [CrossRef]
- Huo, M.Y. Distribution characteristics of the wethering-crust-type Rare-earth resources in Nanling, China. J. Nat. Resour. 1992, 7, 64–69, (In Chinese with English abstract). [Google Scholar]
- Ni, P.; Wang, G.G.; Li, W.S.; Chi, Z.; Li, S.N.; Gao, Y. A review of the Yanshanian ore-related felsic magmatism and tectonic settings in the Nanling W-Sn and Wuyi Au-Cu metallogenic belts, Cathaysia Block, South China. Ore Geol. Rev. 2021, 133, 104088. [Google Scholar] [CrossRef]
- Zhang, X.H.; Yuan, L.L.; Xue, F.H.; Yan, X.; Mao, Q. Early Permian A-type granites from central Inner Mongolia, North China: Magmatic tracer of post- collisional tectonics and oceanic crustal recycling. Gondwana Results 2015, 28, 311–327. [Google Scholar] [CrossRef]
- Li, Z.X.; Li, X.H. Formation of the 1300-km-wide intracontinental orogen and postorogenic magmatic province in Mesozoic South China: A flat–slab subduction model. Geology 2007, 35, 179–182. [Google Scholar] [CrossRef]
- Teng, J.W. The exchange of substance and energy, different sphere coupling and deep dynamical process within the earth. Earth Sci. Front. 2001, 8, 1–8, (In Chinese with English abstract). [Google Scholar]
- Teng, J.W. Deep structure of the earth, deep dynamic process and leading direction in China. Geol. Rev. 2002, 48, 125–139, (In Chinese with English abstract). [Google Scholar]
- Hu, R.Z.; Chen, W.T.; Xu, D.R.; Zhou, M.F. Reviews and new metallogenic models of mineral deposits in South China: An introduction. J. Asian Earth Sci. 2017, 137, 1–8. [Google Scholar] [CrossRef]
- Lü, Q.T.; Meng, G.X.; Yan, J.Y.; Zhang, K.; Gong, X.J.; Gao, F.X. The geophysical exploration of Mesozoic iron-copper mineral system in the Middle and Lower Reaches of the Yangtze River Metallogenic Belt: A synthesis. Earth Sci. Front. 2020, 27, 232–253, (In Chinese with English abstract). [Google Scholar]
- Luo, F.; Lü, Q.T.; Zhang, K.; Yan, J.Y.; Farquharson, C.G.; Zhang, C.; Fu, G.M. Crustal Electrical Structure and Deep Metallogenic Potential in South China’s Northern Wuyi Area, Based on Magnetotelluric Data. Acta Geol. Sin. Engl. Ed. 2022, 96, 791–805. [Google Scholar] [CrossRef]
- Luo, F.; Lü, Q.T.; Yan, J.Y.; Zhang, K.; Fu, G.M.; Zhong, R.F. Review of the satellite gravity and magnetic data forward and inversion methods in spherical coordinate. Prog. Geophys. 2021, 36, 1420–1431, (In Chinese with English abstract). [Google Scholar]
- Sahoo, S.D.; Pal, S.K. Crustal structure and Moho topography of the southern part (18° S–25° S) of Central Indian Ridge using high-resolution EIGEN6C4 global gravity model data. Geo-Mar. Lett. 2021, 41, 1–20. [Google Scholar] [CrossRef]
- Tchoukeu, C.D.N.; Sobh, M.; Basseka, C.A.; Mouzong, M.; Djomani, Y.P.; Etame, J. The mechanical behaviour of the lithosphere beneath the chad basin and the bangui magnetic anomaly.insights from moho depth and effective elastic thickness estimates. J. Afr. Earth Sci. 2021, 182, 104299. [Google Scholar] [CrossRef]
- Yan, J.Y.; Lü, Q.T.; Luo, F.; Cheng, S.; Zhang, K.; Zhang, Y.; Xu, Y.; Zhang, C.; Liu, Z.; Ruan, S. A gravity and magnetic study of lithospheric architecture and structures of south china with implications for the distribution of plutons and mineral systems of the main metallogenic belts. J. Asian Earth Sci. 2021, 221, 104938. [Google Scholar] [CrossRef]
- Shu, L.S.; Yao, J.L.; Wang, B.; Faure, M.; Charvet, J.; Chen, Y. Neoproterozoic plate tectonic process and Phanerozoic geodynamic evolution of the South China Block. Earth-Sci. Rev. 2021, 216, 103596. [Google Scholar] [CrossRef]
- Carter, A.; Roques, D.; Bristow, C. Understanding, Mesozoic accretion in Southeast Indosinian: Significance of Triassic thermotectonism (Indosinian orogeny) in Vietnam. Geology 2001, 29, 211–214. [Google Scholar] [CrossRef]
- Chen, Y.X.; Li, H.; Sun, W.D.; Ireland, T.; Tian, X.F.; Hu, Y.B.; Yang, W.B.; Chen, C.; Xu, D.R. Generation of Late Mesozoic Qianlishan A2-Type Granite in Nanling Range, South China: Implications for Shizhuyuan W-Sn Mineralization and Tectonic Evolution. Lithos 2016, 266, 435–452. [Google Scholar] [CrossRef]
- Murakami, H.; Ishihara, S. REE Mineralization of Weathered Crust and Clay Sediment on Granitic Rocks in the Sanyo Belt, SW Japan and the Southern Jiangxi Province. China Resour. Geol. 2008, 58, 373–401. [Google Scholar] [CrossRef]
- Hu, R.Z.; Zhou, M.F. Multiple Mesozoic mineralization events in South China-an introduction to the thematic issue. Miner. Depos. 2012, 47, 579–588. [Google Scholar] [CrossRef]
- Mao, J.W.; Ouyang, H.G.; Song, S.W.; Santosh, M.; Yuan, S.D.; Zhou, Z.H.; Zheng, W.; Liu, H.; Liu, P.; Cheng, Y.B.; et al. Geology and metallogeny of tungsten and tin deposits in China. SEG Spec. Publ. 2019, 22, 411–482. [Google Scholar]
- Zhao, Z.; Wang, D.H.; Bagas, L.; Chen, Z.Y. Geochemical and REE mineralogical characteristics of the Zhaibei Granite in Jiangxi Province, southern China, and a model for the genesis of ion-adsorption REE deposits. Ore Geol. Rev. 2022, 140, 104579. [Google Scholar] [CrossRef]
- Fu, W.; Zhao, Q.; Luo, P.; Li, P.Q.; Lu, J.P.; Yi, Z.B.; Xu, C. Mineralization diversity of ion-adsorption type REE deposit in southern China and its critical influence by parent rocks. Acta Geol. Sin. 2022, 96, 3901–3925. [Google Scholar]
- Mao, J.W.; Xie, G.Q.; Guo, C.L. Large-scale tungsten-tin mineralization in the Nanling region, South China: Metallogenic ages and corresponding geodynamic processes. Acta Petrol. Sin. 2007, 23, 2329–2338, (In Chinese with English abstract). [Google Scholar]
- Förste, C.; Bruinsma, S.; Abrikosov, O.; Flechtner, F.; Marty, J.C.; Lemoine, J.M.; Dahle, C.; Neumayer, H.; Barthelmes, F.; Knig, R. EIGEN-6C4 The latest combined global gravity field model including GOCE data up to degree and order 1949 of GFZ Potsdam and GRGS Toulouse. GFZ Data Serv. 2014, 10. [Google Scholar] [CrossRef]
- Maus, S.; Barckhausen, U.; Berkenbosch, H.; Bournas, N.; Brozena, J.; Childers, V.; Dostaler, F.; Fairhead, J.D.; Finn, C.; von Frese, R.R.B.; et al. EMAG2: A 2–arc min resolution Earth Magnetic Anomaly Grid compiled from satellite, airborne, and marine magnetic measurements. Geochem. Geophys. Geosyst. 2009, 10, Q08005. [Google Scholar] [CrossRef]
- Alken, P.; Chulliat, A.; Nair, M. NOAA/NCEI and University of Colorado candidate models for IGRF-13. Earth Planets Space 2021, 73, 1–9. [Google Scholar] [CrossRef]
- Luo, F. Research on Satellite Gravity and Magnetic Data PROCESSING methods and Their Application in South China Tectonics. Ph.D. Thesis, East China University of Technology, Fuzhou, China, 2022; pp. 1–144. [Google Scholar]
- Parker, R. The rapid calculation of potential anomalies. Geophys. J. Int. 1973, 31, 447–455. [Google Scholar] [CrossRef]
- Oldenburg, D.W. The inversion and interpretation of gravity anomalies. Geophysical 1974, 39, 536. [Google Scholar] [CrossRef]
- Li, Y.; Oldenburg, D.W. 3D inversion of gravity data. Geophysics 1998, 63, 109–119. [Google Scholar] [CrossRef]
- Chu, W.; Xu, Y.; Duan, J.X.; Fan, J. Review on the structure and density distribution characteristics of the Earth’s interior. Prog. Geophys. 2021, 36, 443–457, (In Chinese with English abstract). [Google Scholar]
- Luo, F.; Yan, J.Y.; Zhang, C.; Zhong, R.F.; Xie, X.H. The effective elastic thickness of lithosphere and its tectonic implications in the South China Block. Acta Geosci. Sin. 2022, 43, 771–784, (In Chinese with English abstract). [Google Scholar]
- Audet, P. Toward mapping the effective elastic thickness of planetary lithospheres from a spherical wavelet analysis of gravity and topography. Phys. Earth Planet. Inter. 2014, 226, 48–82. [Google Scholar] [CrossRef]
- Audet, P. PlateFlex: Software for mapping the elastic thickness of the lithosphere (Version v0.1.0) [CP]. Zenodo 2019. [Google Scholar] [CrossRef]
- Blakely, R. Potential Theory in Gravity and Magnetic Application; Cambridge University Press: Cambridge, UK, 1995. [Google Scholar]
- Tanaka, A.; Okubo, Y.; Matsubayashi, O. Curie point depth based on spectrum analysis of the magnetic anomaly data in East and Southeast Asia. Tectonophysics 1999, 306, 461–470. [Google Scholar] [CrossRef]
- Li, C.F. An integrated geodynamic model of the Nankai subduction zone and neighboring regions from geophysical inversion and modeling. J. Geodyn. 2011, 51, 64–80. [Google Scholar] [CrossRef]
- Nolet, G.; Zielhuis, A. Low S velocities under the Tornquist-Teisseyre zone: Evidence for water injection into the transition zone by subduction. J. Geophys. Res. Solid Earth 1994, 99, 15813–15820. [Google Scholar] [CrossRef]
- Sobolev, S.V.; Zeyen, H.; Stoll, G.; Werling, F.; Altherr, R.; Fuchs, K. Upper mantle temperatures from teleseismic tomography of French Massif Central including effects of composition, mineral reactions, anharmonicity, anelasticity and partial melt. Earth Planet. Sci. Lett. 1996, 139, 147–163. [Google Scholar] [CrossRef]
- Goes, S.; Govers, R.; Vacher, P. Shallow mantle temperatures under Europe from P and S wave tomography. J. Geophys. Res. Solid Earth 2000, 105, 11153–11169. [Google Scholar] [CrossRef]
- Forsyth, D.W. Subsurface loading and estimates of the flexural rigidity of continental lithosphere. J. Geophys. Res. 1985, 90, 12623. [Google Scholar] [CrossRef]
- McKenzie, D.; Priestley, K. The influence of lithospheric thickness variations on continental evolution. Lithos 2008, 102, 1–11. [Google Scholar] [CrossRef]
- Kirby, J.F.; Swain, C.J. A reassessment of spectral Te estimation in continental interiors: The case of North America. J. Geophys. Res. Solid Earth 2009, 114, B08401. [Google Scholar] [CrossRef]
- Zhou, L.; Xie, J.Y.; Shen, W.; Zheng, Y.; Yang, Y.; Shi, H.; Ritzwoller, M.H. The structure of the crust and uppermost mantle beneath South China from ambient noise and earthquake tomography. Geophys. J. Int. 2012, 189, 1565–1583. [Google Scholar] [CrossRef]
- Laske, G.; Masters, G.; Ma, Z.; Pasyanos, M. Update on CRUST1. 0—A 1-degree global model of Earth’s crust. Geophys. Res. Abstr. 2013, 15, 2658. [Google Scholar]
- Zhang, K.; Lü, Q.T.; Zhao, J.H.; Yan, J.Y.; Hu, H.; Luo, F.; Fu, G.M.; Tao, X. Magnetotelluric evidence for the multi-microcontinental composition of eastern South China and its tectonic evolution. Sci. Rep. 2020, 10, 13105. [Google Scholar]
- Li, C.; Van Der Hilst, R.D. Structure of the upper mantle and transition zone beneath Southeast Asia from traveltime tomography. J. Geophys. Res. Solid Earth 2010, 115, B07308. [Google Scholar] [CrossRef]
- He, C.; Santosh, M. Crustal evolution and metallogeny in relation to mantle dynamics: A perspective from P-wave tomography of the South China Block. Lithos 2016, 263, 3–14. [Google Scholar] [CrossRef]
- Hua, R.M.; Li, G.L.; Zhang, W.L.; Hu, D.Q.; Chen, P.R.; Chen, W.F.; Wang, X.D. A tentative discussion on differences between large-scale tungsten and tin mineralizations in South China. Miner. Depos. 2010, 29, 9–24, (In Chinese with English abstract). [Google Scholar]
- Shu, L.S. An analysis of principal features of tectonic evolution in South China Block. Geol. Bull. China 2012, 31, 1035–1053, (In Chinese with English abstract). [Google Scholar]
- Zhao, W.W.; Zhou, M.F.; Li, Y.H.M.; Zhao, Z.; Gao, J.F. Genetic types, mineralization styles, and geodynamic settings of Mesozoic tungsten deposits in South China. J. Asian Earth Sci. 2017, 137, 109–140. [Google Scholar] [CrossRef]
- Li, W.S.; Ni, P.; Wang, G.G.; Yang, Y.L.; Fan, M.S. A possible linkage between highly fractionated granitoids and associated W-mineralization in the Mesozoic Yaogangxian granitic intrusion, Nanling region, South China. J. Asian Earth Sci. 2020, 193, 104314. [Google Scholar] [CrossRef]
- Jimenez-Diaz, A.; Ruiz, J.; Pérez-Gussinyé, M.; Kirby, J.F.; Álvarez-Gómez, J.A.; Tejero, R.; Capote, R. Spatial variations of effective elastic thickness of the lithosphere in Central America and surrounding regions. Earth Planet. Sci. Lett. 2014, 391, 55–66. [Google Scholar] [CrossRef]
- Shu, L.S.; Wang, D.Z.; Shen, W.Z. Nd-Sr isotope compositions of granitic rocks of the Mesozoic metamorphic core complex in the Wugongshan area, Jiangxi province. J. Nanjing Univ. (Nat. Sci.) 2000, 36, 306–311, (In Chinese with English abstract). [Google Scholar]
- Wang, Y.J.; Zhang, Y.H.; Fan, W.M.; Guo, F. Numerical modeling for generation of Indo-Sinian peraluminous granitoids Hunan Province: Basaltic underplating vs. Tectonic thickening. Sci. China (Ser. D) 2002, 45, 1042–1056. [Google Scholar] [CrossRef]
- Zhou, X.M. My thinking about granite geneses of South China. Geol. J. China Univ. 2003, 9, 556–565, (In Chinese with English abstract). [Google Scholar]
- Wu, S.P.; Wang, M.Y.; Qi, K.J. Present situation of research on A-type granite: A review. Acta Petrol. Mineral. 2007, 26, 57–66, (In Chinese with English abstract). [Google Scholar]
- Wu, C.Y.; Zhu, Z.S. Rare earth element models of highly evolved granitoids in the Nanling mountain area. Geol. Rev. 1994, 40, 406–417, (In Chinese with English abstract). [Google Scholar]
- Li, Y.H.M.; Zhao, W.W.; Zhou, M.F. Nature of parent rocks, mineralization styles and ore genesis of regolith-hosted REE deposits in South China: An integrated genetic model. J. Asian Earth Sci. 2017, 148, 65–95. [Google Scholar] [CrossRef]
- Feng, Y.; Zhao, B.; Chu, G.; Li, S.; Wang, J.; Wen, Z. Late Mesozoic magmatism in the Gucheng district: Implications for REE metallogenesis in South China. Ore Geol. Rev. 2022, 148, 105034. [Google Scholar] [CrossRef]
- Rudnick, R.L.; Gao, S. Composition of the continental crust. Treat. Geochem 2003, 3, 1–64. [Google Scholar]
- Wu, C.Y.; Huang, D.H.; Guo, Z. REE geochemistry in the weathered crust of granites, Longnan area, Jiangxi Province. Acta Geol. Sin. (Engl. Ed.) 1990, 3, 193–209. [Google Scholar]
| Disclaimer/Publisher’s Note: The statements, opinions and data contained in all publications are solely those of the individual author(s) and contributor(s) and not of MDPI and/or the editor(s). MDPI and/or the editor(s) disclaim responsibility for any injury to people or property resulting from any ideas, methods, instructions or products referred to in the content. |
© 2024 by the authors. Licensee MDPI, Basel, Switzerland. This article is an open access article distributed under the terms and conditions of the Creative Commons Attribution (CC BY) license (https://creativecommons.org/licenses/by/4.0/).

 ,
, 


