Article

Combined Scanned Macro X-Ray Fluorescence and Reflectance Spectroscopy Mapping on Corroded Ancient Bronzes

Department of Material Science, University of Milano Bicocca, 20126 Milano, Italy
*
Author to whom correspondence should be addressed.
Minerals 2024, 14(2), 192; https://doi.org/10.3390/min14020192
Submission received: 2 January 2024 / Revised: 8 February 2024 / Accepted: 9 February 2024 / Published: 12 February 2024

Abstract

:
Bronze is an alloy composed primarily of copper and tin and since its discovery is widespread in the whole world. This alloy can thus be found in many archaeological sites and its study can give information about the technology of production, the trading routes, or the warfare within a region. However, bronze artefacts can undergo severe alteration processes, and the formation of corrosion layers of different copper minerals can prevent the readability of the artefact or even destroy it, as in the case of the ‘bronze disease’. Their preservation is crucial for maintaining a connection to our cultural heritage. In this paper, we present the study of some corroded bronze artefacts found in different burying conditions. They have been analysed through a scanner system that combines two non-invasive techniques, macro XRF (MA-XRF) and visible, near infrared, short wave infrared (VIS-NIR-SWIR) reflectance, to unravel information about the metal and the patina composition, thickness, and distribution. As the corrosion of bronze depends on the burying conditions and the alloy composition, these data are of the utmost importance to understanding the alteration processes occurring in the archaeological site and to ensure the artefacts’ optimal preservation.

1. Introduction

Metallic artifacts are among the artistic products that suffer most from degradation processes, especially when they are stored in external, marine, or underground environments. Corrosion of metals occurs in almost all burial environments [1,2,3] determining in some cases not only the alteration of the surface and the complete loss of surface morphology but also the loss of structural integrity. Copper artifacts are naturally subject to degradation, and the resulting products largely depend on the type of environment in which they are stored and whether they are pure or alloyed with other metals such as tin, zinc or lead [4]. For example, in the case of buried bronzes, a surface patina is often found characterized by the enrichment of tin in the external layers of corrosion: the surface is covered by a layer of passivation, called noble patina, characterized by an impoverishment of copper, which protects the manufactured material by preserving all the artistic characteristics of the surface and not reducing its structural resistance [5]. However, if the presence of copper compounds, such as cuprous oxides and copper chlorides, are detected on the surface, there is a corrosive phenomenon that causes a degradation process that continues over time, creating irreparable damage to the object [6]. It is therefore clear that it is necessary to be able to determine the type of surface corrosion products to be able to intervene in the most correct way to preserve the integrity of the artistic artifact.
There are now consolidated methodologies for the recognition of corrosion products, methods which, however, often involve sampling material from the object [7] or the use of benchtop instruments which, therefore, cannot be used in situ [8,9]. When approaching objects of cultural importance, the use of non-invasive analytical methodologies with portable instruments to study material composition is essential [10,11], especially if you want to perform extensive analyses on the whole, or most of, the surface of the artifact [12,13,14,15,16]. This approach is commonly used in the case of paintings in which, before taking samples of material to carry out any studies on the stratigraphy and organic compounds, localized or mapping analyses are carried out with non-invasive spectroscopic techniques such as X-ray fluorescence (XRF) and reflectance spectroscopy in the visible and infrared range (VIS-NIR-SWIR RS) [17,18,19,20,21,22].
Precisely starting from this type of approach and considering that many of the copper corrosion products have in fact been used since ancient times as pigments [23,24,25], we decided to study the possibility of distinguishing, if not even recognizing, the products that make up the corrosion patinas of two types of artifacts: some plaquettes mainly composed of copper and a bronze alloy plate. Due to the nature of the investigated samples, which present a high level of inhomogeneities (both on the surface and in-depth), we cannot only rely on the data acquired on single points, as they are not representative of the nature of the whole object. Furthermore, the choice of applying two very different techniques, XRF, which gives the element composition, and VIS-NIR-SWIR RS, which investigates the molecular structure, allows for observing differences where compositional variations are negligible.
For this purpose, we employed a portable instrument that allows simultaneous acquisition of energy dispersive XRF (EDXRF) and RS spectra, both on a single point and as a mapping of large surfaces.

2. Materials and Methods
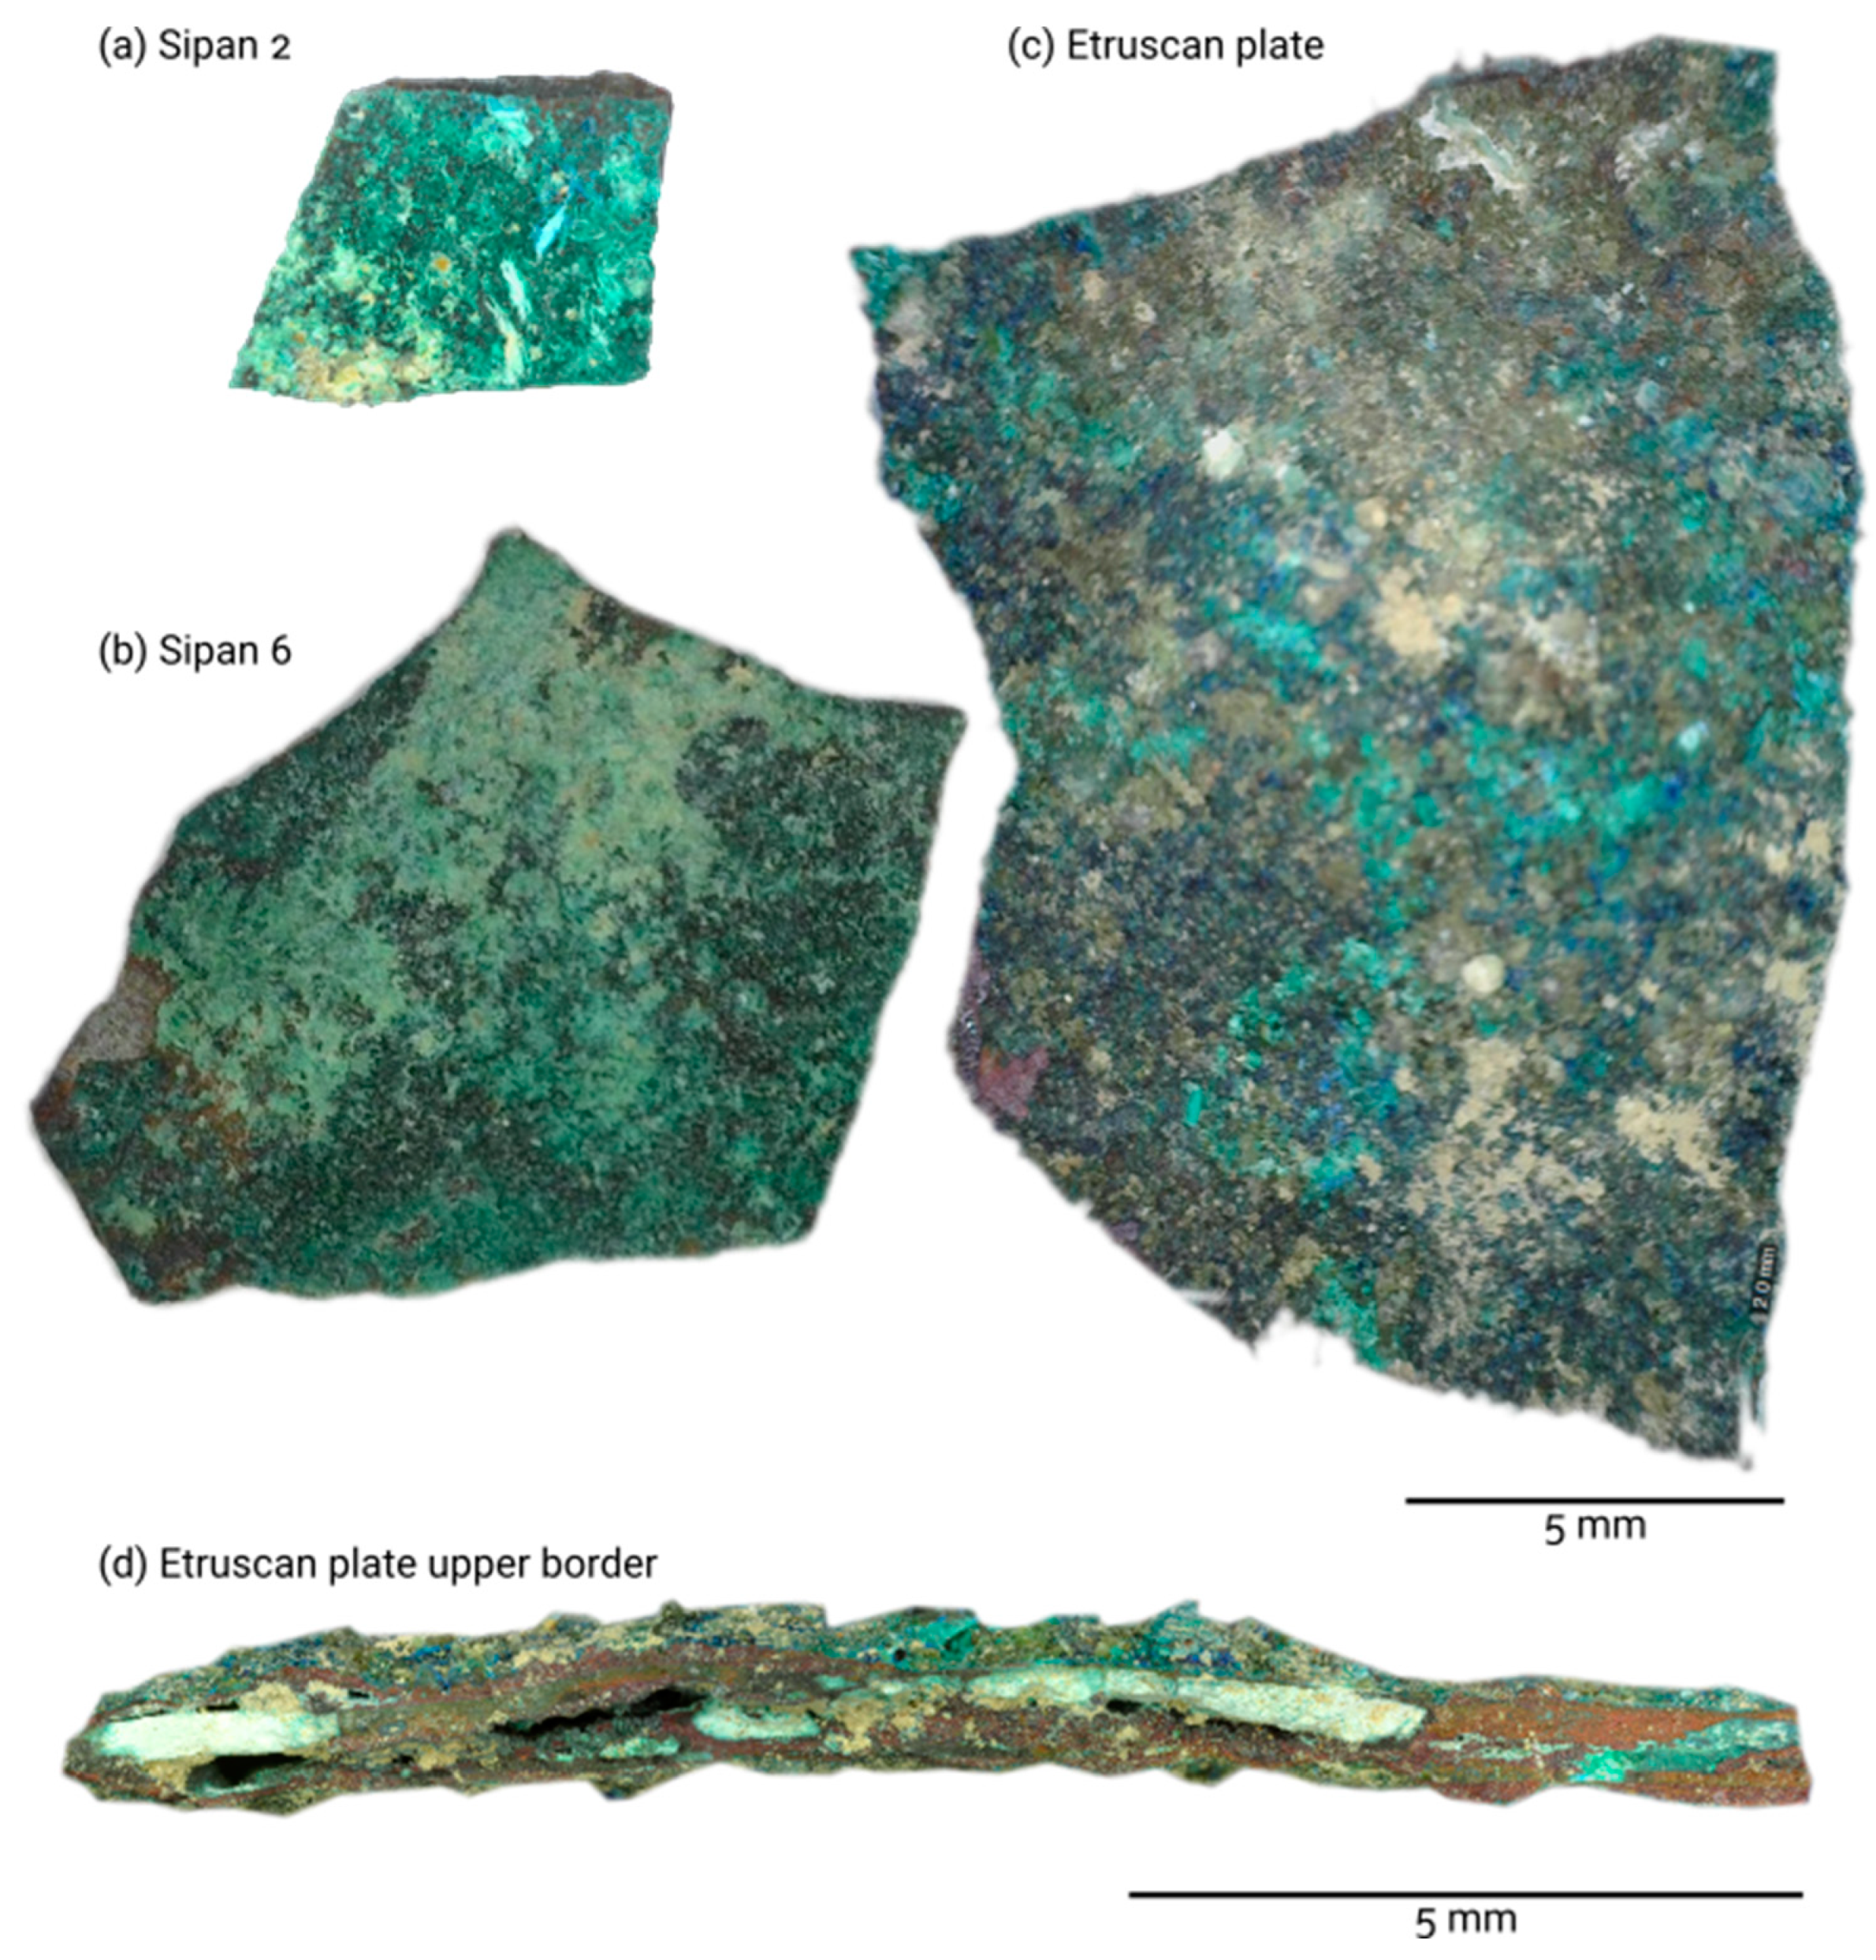
2.1. Samples

The samples studied in this preliminary work were chosen for their certain archaeological provenance, for the clear presence of a surface patina, and for their small size, which allowed further checks on the surface composition of the patina to be carried out through the more consolidated Raman analyses.
The first materials analysed are several plaquettes found in 2007 in a tomb in the archaeological area of Sipán, a region of present-day Peru (South America), and which can be dated between the II and IX centuries AD. These materials have already been partly analysed with non-invasive methodologies in 2011 to study their composition; starting from these studies we wanted to deepen and extend our knowledge. These samples are copper plates with a probable surface gilding which was hypothesised to be due to the presence of gold in some analysed points, although the presence of the surface patina made it difficult to detect [26,27,28]. Of the different samples available, in this work, two samples, Sipan 2 and Sipan 6, were analysed (Figure 1a,b).
The second type of sample was found in an archaeological excavation in central Italy and is probably of Etruscan workmanship dating back to around the II-III century BCE. (Figure 1c). It is a bronze sheet, of approximately 22 × 17 mm; the plate has a patina of corrosion widely green in colour, with shades ranging from light green to dark green and with blue inclusions in some places. Also, grey regions with a dull green hue can be observed in the upper part of the sample.
All the studied samples present a high level of degradation and the formation of a thick patina layer on the surface (an example in Figure 1d); in some regions the patina is so thick that the original material is no longer visible. Additionally, the patina is not even homogeneous either in thickness or composition, as different alternated red and green layers can be observed.

2.2. Methods

For the study conducted in this work, a combined scanner for synchronous EDXRF and reflectance spectroscopy, in the visible to SWIR region, created for applications on cultural heritage objects was used.
IRIS Combined X-Ray Fluorescence & Reflectance Spectroscopy Scanner System (XGLAB, Milan, Italy, 2023), the commercial name of the instrument produced by Bruker, is a system for non-destructive and non-contact analysis of materials, which allows both single-point measurements and continuous scanning analysis of the sample surface. The measuring head combines both an EDXRF system, consisting of an x-ray tube, SDD detector, collimator, and filter wheel, and an optical system composed of optical fibres for VIS-NIR-SWIR spectroscopy.
XRF is a non-invasive analytical technique that allows for elemental detection in the range between Si and U (for some portable instruments the detection of elements as light as F is feasible). In principle, with this technique it is possible to perform both a qualitative and a quantitative analysis; however, for the latter, a homogenous sample should be analysed. Homogeneity is very uncommon in cultural heritage objects, thus the information collected with this technique concerns the overall volume investigated. As X-rays can penetrate for several micrometers inside of the sample (depending on the sample composition, density, and the energy of the photons) XRF is considered a bulk technique. Another issue to consider when performing quantitative analysis is that the theoretical description is performed assuming a perfectly flat sample and the density of each layer. These two assumptions are also seldom required in cultural heritage samples, where alteration layers are not flat and/or porose. Indeed, the quantification of layers where the layer density is not known can lead to over or underestimating the sample thickness or composition. [29,30,31]. To discriminate in-depth information with this technique alone, it is possible to employ confocal lenses (confocal XRF) [32,33,34,35], fluorescence line ratio [36,37], or varying geometry scanning, like Angle Resolved XRF or Grazing Emission/Incidence XRF [38,39,40]; however, the applicability of these techniques depends mostly on the maximum probed depth, which is the ultimate limit, even if it is difficult to estimate the real volume investigated. If we consider the mean density of some copper compounds (malachite and atacamite 3.8 g/cm3 or antlerite 3.9 g/cm3) we can estimate for the Cu Kα line a maximum penetration of 60µm, which is compatible, if not thicker than the alteration layer.
The XRF head is equipped with a rhodium (Rh) transmission (1 µm) tube, with a maximum power of 10W, covered with a Be window that is 250µm thick, and an SDD detector (XGLAB, Milan, Italy, 2023) (active area of 50 mm2 and thickness of 450 µm) with a resolution of approximately 138 eV at Mn Kα line protected by a Be window that is 12.5 µm thick. The distance between the source and the analysed spot is 54 mm, while the distance with the detector is 14 mm. The angle of detection and irradiation are, respectively, 52° and 68°. The source is collimated with a cylindrical collimator that is 0.5 mm in diameter, and the measurements have been performed with the unfiltered source.
VIS-NIR-SWIR reflectance spectroscopy is based on the absorption and reflection properties of materials when stimulated by electromagnetic radiation in the visible (VIS), near-infrared (NIR), and short-wave infrared (SWIR) ranges. In the visible and near-infrared regions, the reflectance curve is mostly characterized by phenomena related to transitions in atomic energy levels, charge transfer, or conduction band transitions. In SWIR, however, the spectra are the result of energy absorption within the crystal lattice from vibrational states. Like in infrared spectroscopies such as Fourier transform infrared (FTIR) and Raman spectroscopy, absorption features occur at well-defined wavelengths because the vibrational states of molecules correspond to distinct energy levels [41]. Reflectance measurements refer to the percentage of incident radiation that is reflected by the sample; therefore, to obtain correct reflectance spectra it is first necessary to perform a calibration on a white standard which defines the upper limit (100% of reflected radiation) and a black one for the lower one (0% of reflected radiation). Any measurements that exceed 100% would indicate the presence of an emitted radiation by the sample itself. Generally, this occurs in the case in which the excitation source generates luminescence phenomena in the sample, such as luminescence induced by ultraviolet radiation (UVL) [42] or visible light (VIL) [43].
The system for reflectance measurements consists of a halogen lamp with a nominal power of 9 mW whose radiation is transported through a bundle of optical fibres to the head of the instrument, and the light is projected and focused on the sample. The reflected light is then collected and transported by two different fibres of the same optical beam and sent to two spectrometers: one dedicated to the visible range (VIS-NIR, 360–1000 nm with a resolution of 1.5 nm) and one to the infrared (NIR-SWIR 900–2500 nm with a resolution of 8.9 nm). The white reference is a PTFE-based material with a nominal reflectance of 98% in the 360–1000 nm range and 92% in the SWIR range. For black calibration the instrument carries out a measurement with the lamp shutter closed, to use the ambient lighting as a background reference. For an optimal measurement, it is best to carry out the measurements in reduced or at least controlled light conditions, so as not to vary the background light radiation. Finally, a visible camera and a system with two lasers (axial and focus) are inserted into the head of the IRIS system for the correct positioning of the head with respect to the sample.
With this same instrument we have also measured some pure materials such as malachite and azurite to retrieve their characteristic spectra; the other pure spectra have instead been acquired from the literature [44].
As a verification of the interpretations performed through the joint reading of the RS spectra and the XRF analyses, some Raman measurements were performed in the same areas. The LabRAM HR (Horiba–Jobin Yvon) spectrometer, at the DST-UniMIB, with an argon laser (488 nm) as an excitation source, in the spectral range of 200–1200 cm−1 has been used. Since this instrument has a better spatial resolution than the analyses performed with IRIS, several spectra were acquired to cover a comparable area, and from these, all the spectra that presented different characteristics were extracted [45]. The recognition was then performed by comparison with online databases, in particular those of the RRUFF Project [46].

2.3. Data Analysis

In order to obtain information from the acquisition of spectroscopic maps, some analysis methods were employed. All the analytical procedures have been performed with in-house codes written in Python (3.11.5) [47].
The data hypercubes containing the XRF measurements were processed to highlight the presence of certain chemical elements of particular interest. To do this, regions of interest (ROIs) are selected in the XRF spectrum around the energy value relating to the peak of the element considered. In the colour gradient map, for each position (x, y), the number of normalised counts relating to that ROI is therefore shown, indicating the detection of that specific element in the considered position.
To study the hypercubes containing the reflectance data, the spectra correlation mapper (SCM) was used; the SCM is an algorithm for evaluating the similarity between long vectors and is an evolution of the more commonly used spectra angle mapper (SAM) [48]. Unlike the SAM, the SCM can distinguish between correlation and anti-correlation, achieving better precision in distinguishing reflectance spectra. Each spectrum hypervector inset in the acquired hypercube is compared with a reference vector, called endmember, obtaining a result that varies between -1 and 1 (which represents the degree of similarity between the reference and the unknown spectrum). By associating the correlation value obtained with each original (x, y) position, a colour gradient map is generated in which the degree of correlation between what is recorded by the instrument and the chosen reference is highlighted. As endmembers, to calculate the SCM we employed all the spectra collected in the point analyses, and then we selected those that presented the widest correlation.
From the map obtained both with ROIs (for XRF) and with the SCM (for RS) we calculated the representative spectrum of the map, through a weighted average of all the acquired spectra, where the weights employed are the ROIs (or SCM) calculated values. These spectra are thus characteristic only of the highlighted regions and can stress the differences in the areas of the samples without checking all the acquired spectra.
A further elaboration was the construction of RGB (red, green, blue) colour maps through the association of each colour channel with a different correlation map, obtained by choosing three different endmembers (or ROIs). Differently from the XRF colour map, which allows the identification of the areas of co-presence of different chemical elements, the RGB map of the reflectance spectra allows for verification of the actual distribution of the reference spectra and the verification of whether there are areas not covered by the specific choice of endmembers and which therefore require further verification.

3. Results

To validate the approach used and the unitary reading of the data obtained with the two spectroscopic techniques, the single-point spectra were first acquired then the maps were recorded. The RS spectra of the individual measurements were compared with previously published work and then used as references to generate the SCM maps.

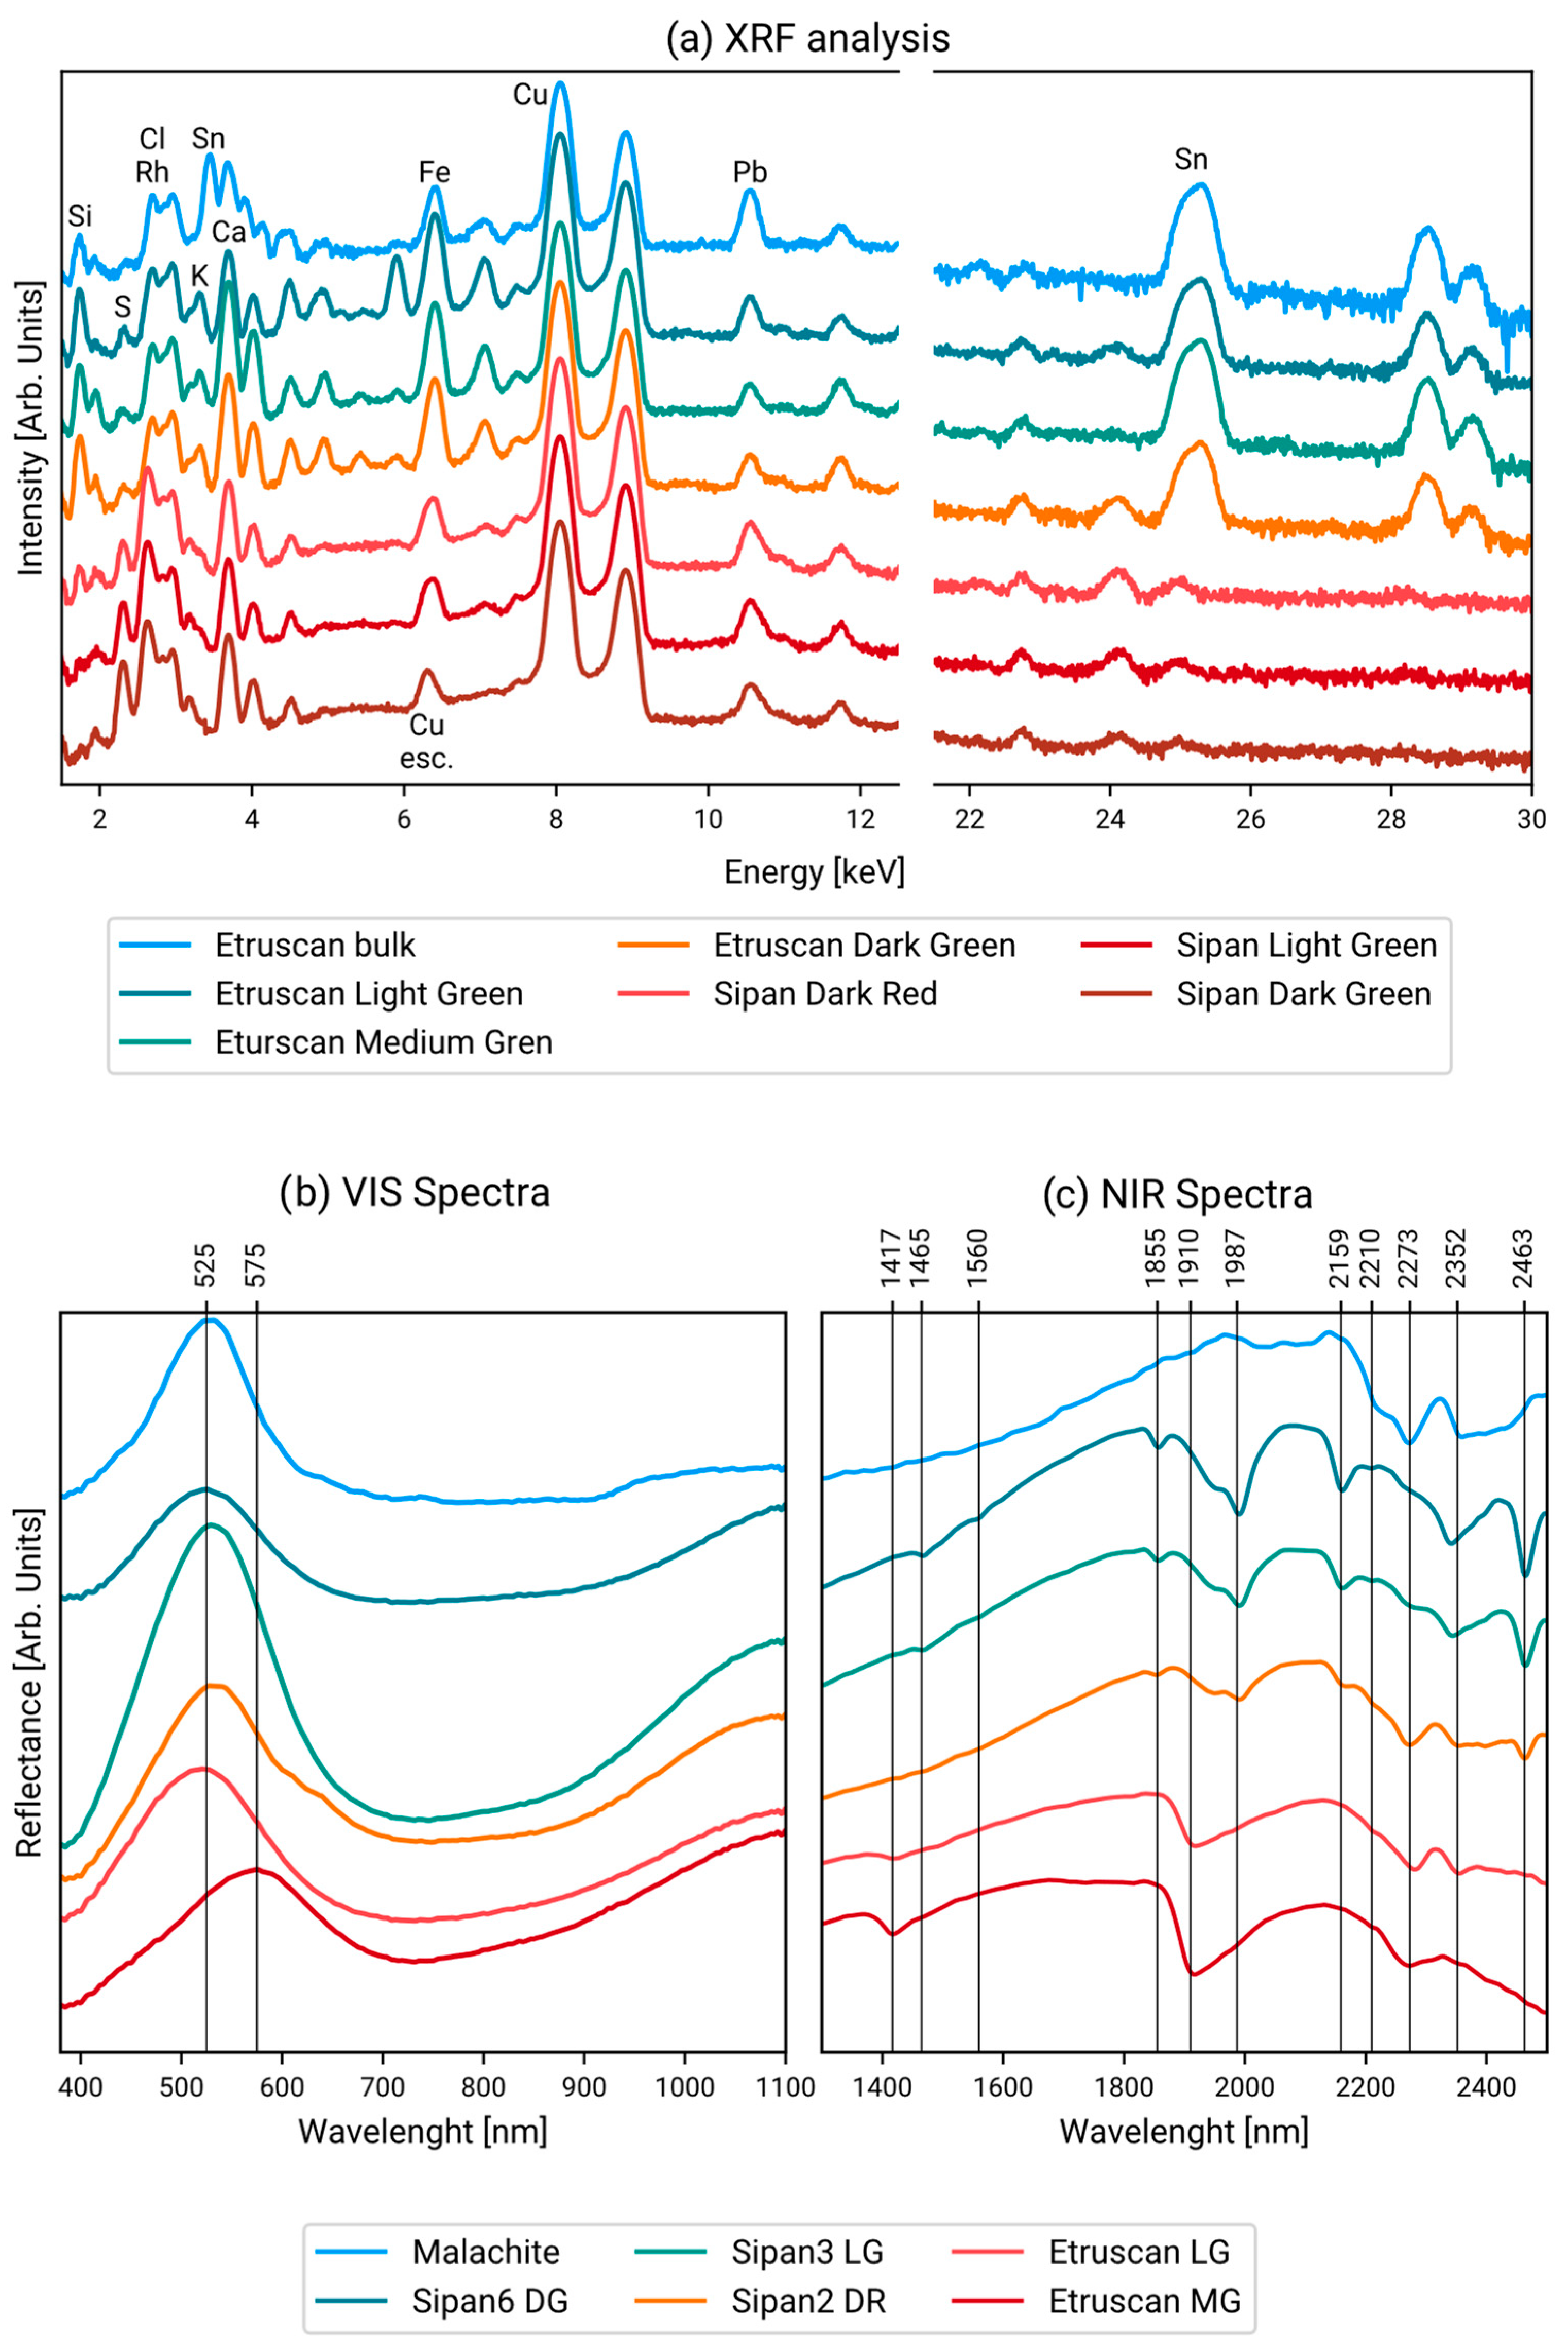
3.1. Point Data Results

To determine the nature of the materials from which the samples are made, single-point measurements were acquired, both with XRF and RS. The composition of the Sipán samples was known from previous analyses [26], so we focused on analysing the surface areas that had a patina. Data were therefore acquired from the surfaces of different objects in regions that had different chromatic shades and could therefore be hypothesised to be different compositions. In Figure 2 the XRF spectra, Panel (a), and RS spectra, Panels (b) and (c) of these points are shown. It is evident that the elemental composition differs slightly between the different points analysed showing a conspicuous presence of copper. In the Etruscan plate, it is possible to observe the tin K lines in all the samples; however, only on the spot referring to the bulk, collected in a point in which the patina has detached, is it possible to observe the Sn-L lines. As these are less energetic, they are more prone to be attenuated and are a hint of the tin present on the surface of the sample. For this very reason, if a noble patina was investigated (with a depletion of copper and an enrichment of tin on the surface) we would expect to detect both the K and L lines of this element. In the Sipán sample, instead, no tin can be observed as the plate is made solely of copper. Referring to the elements characterised in the alterations, we can observe that the Etruscan plate has a higher peak of Si (probably due to the burial environment) while more intense peaks of S and Cl can be observed on the Sipan samples.
By examining the reflectance curves instead, we can distinguish the contribution from the visible range to that of the IR ranges. The identification of copper compounds from the visible component of the reflectance spectra alone is extremely difficult, if not impossible, while the main contribution comes from the near-infrared wavelengths, in which the presence of absorptions at specific wavelengths helps in the identification of materials [49,50]. Both in the Sipán samples and the light green area (LG) of the Etruscan plate we can see the absorptions at 2210, 2273, and 2352 nm, which characterize malachite. The absorptions at 1465, 1855, 1987, and 2159 nm, which are instead visible only in the Sipán samples, are attributable to the atacamite. [44]. Finally, in the Etruscan sample, the presence of a broad absorption band between 1855 and 2050 nm together with the one at 1417 nm can lead us to assume the presence of basic copper sulphate mixed with other material which is currently unidentifiable, and which modifies the reflectance spectrum compared to the pure reference [44].
Raman spectroscopy identified the presence of both malachite and atacamite along with eriochalcite as the copper corrosion products in the Sipán samples, and calcite was identified as a probable inclusion deriving from the discovery sites as shown in Figure 3. In the same figure, malachite and antlerite, a basic copper sulfate, are identified in the Etruscan samples.

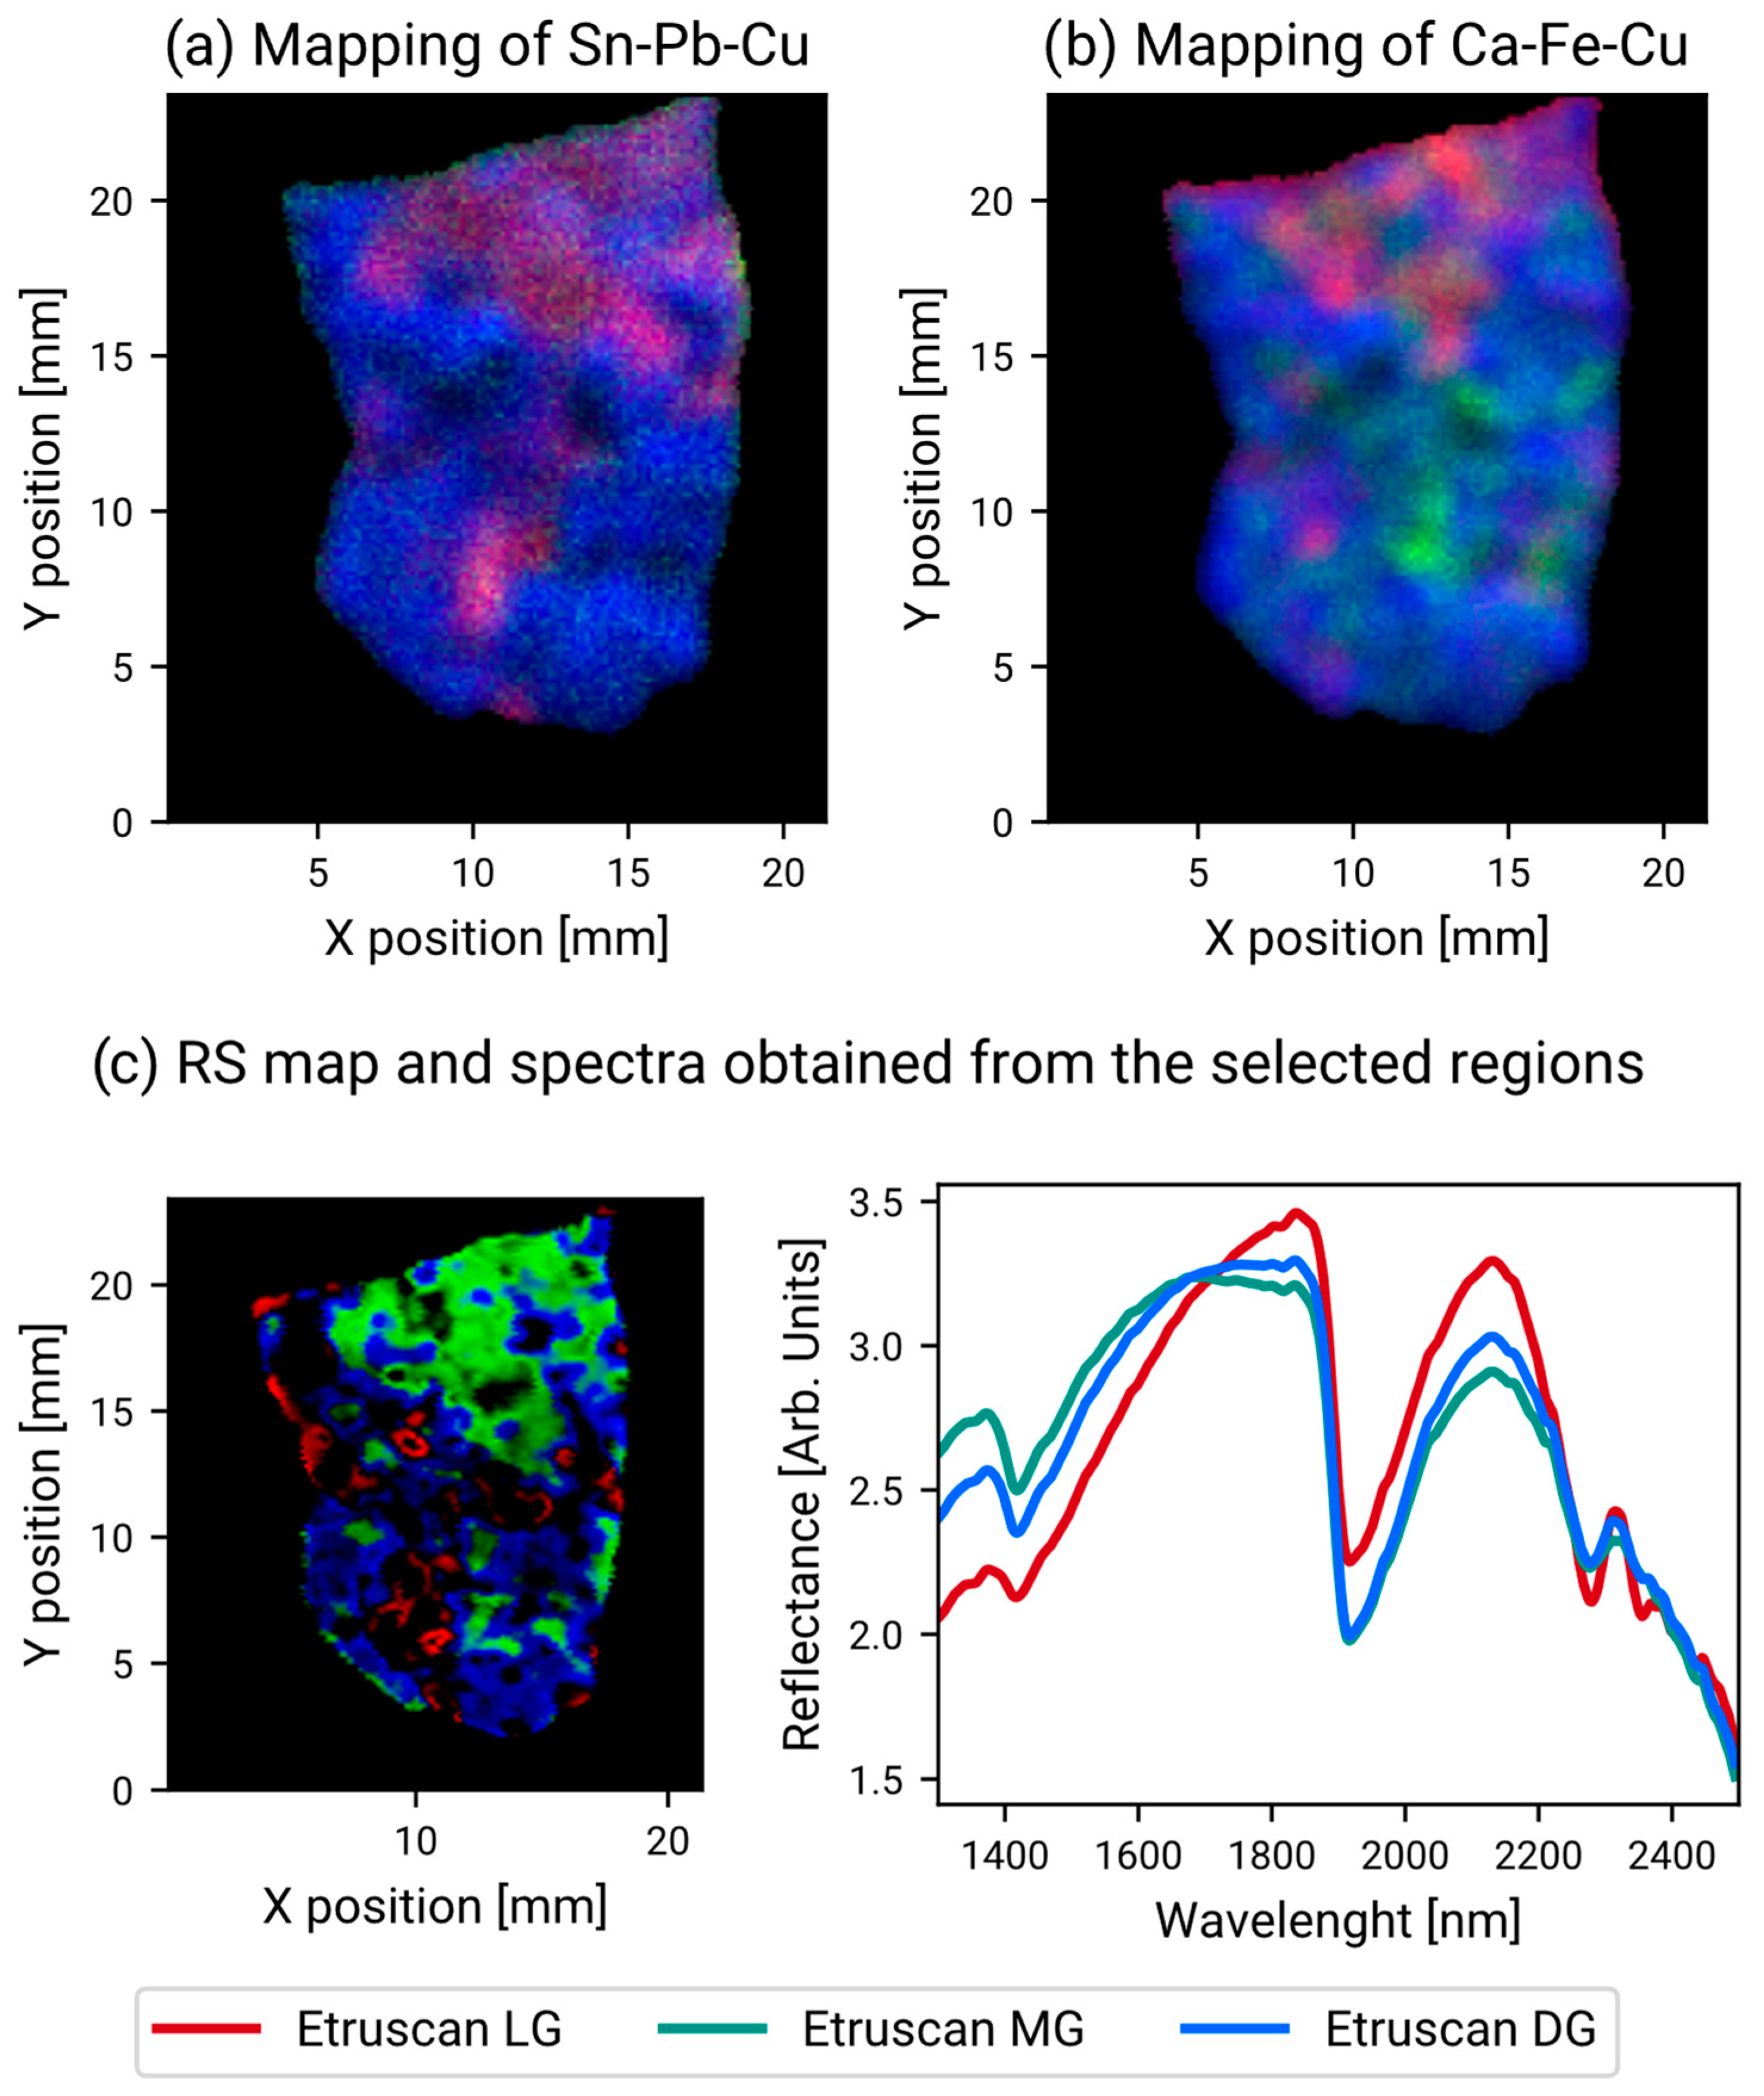
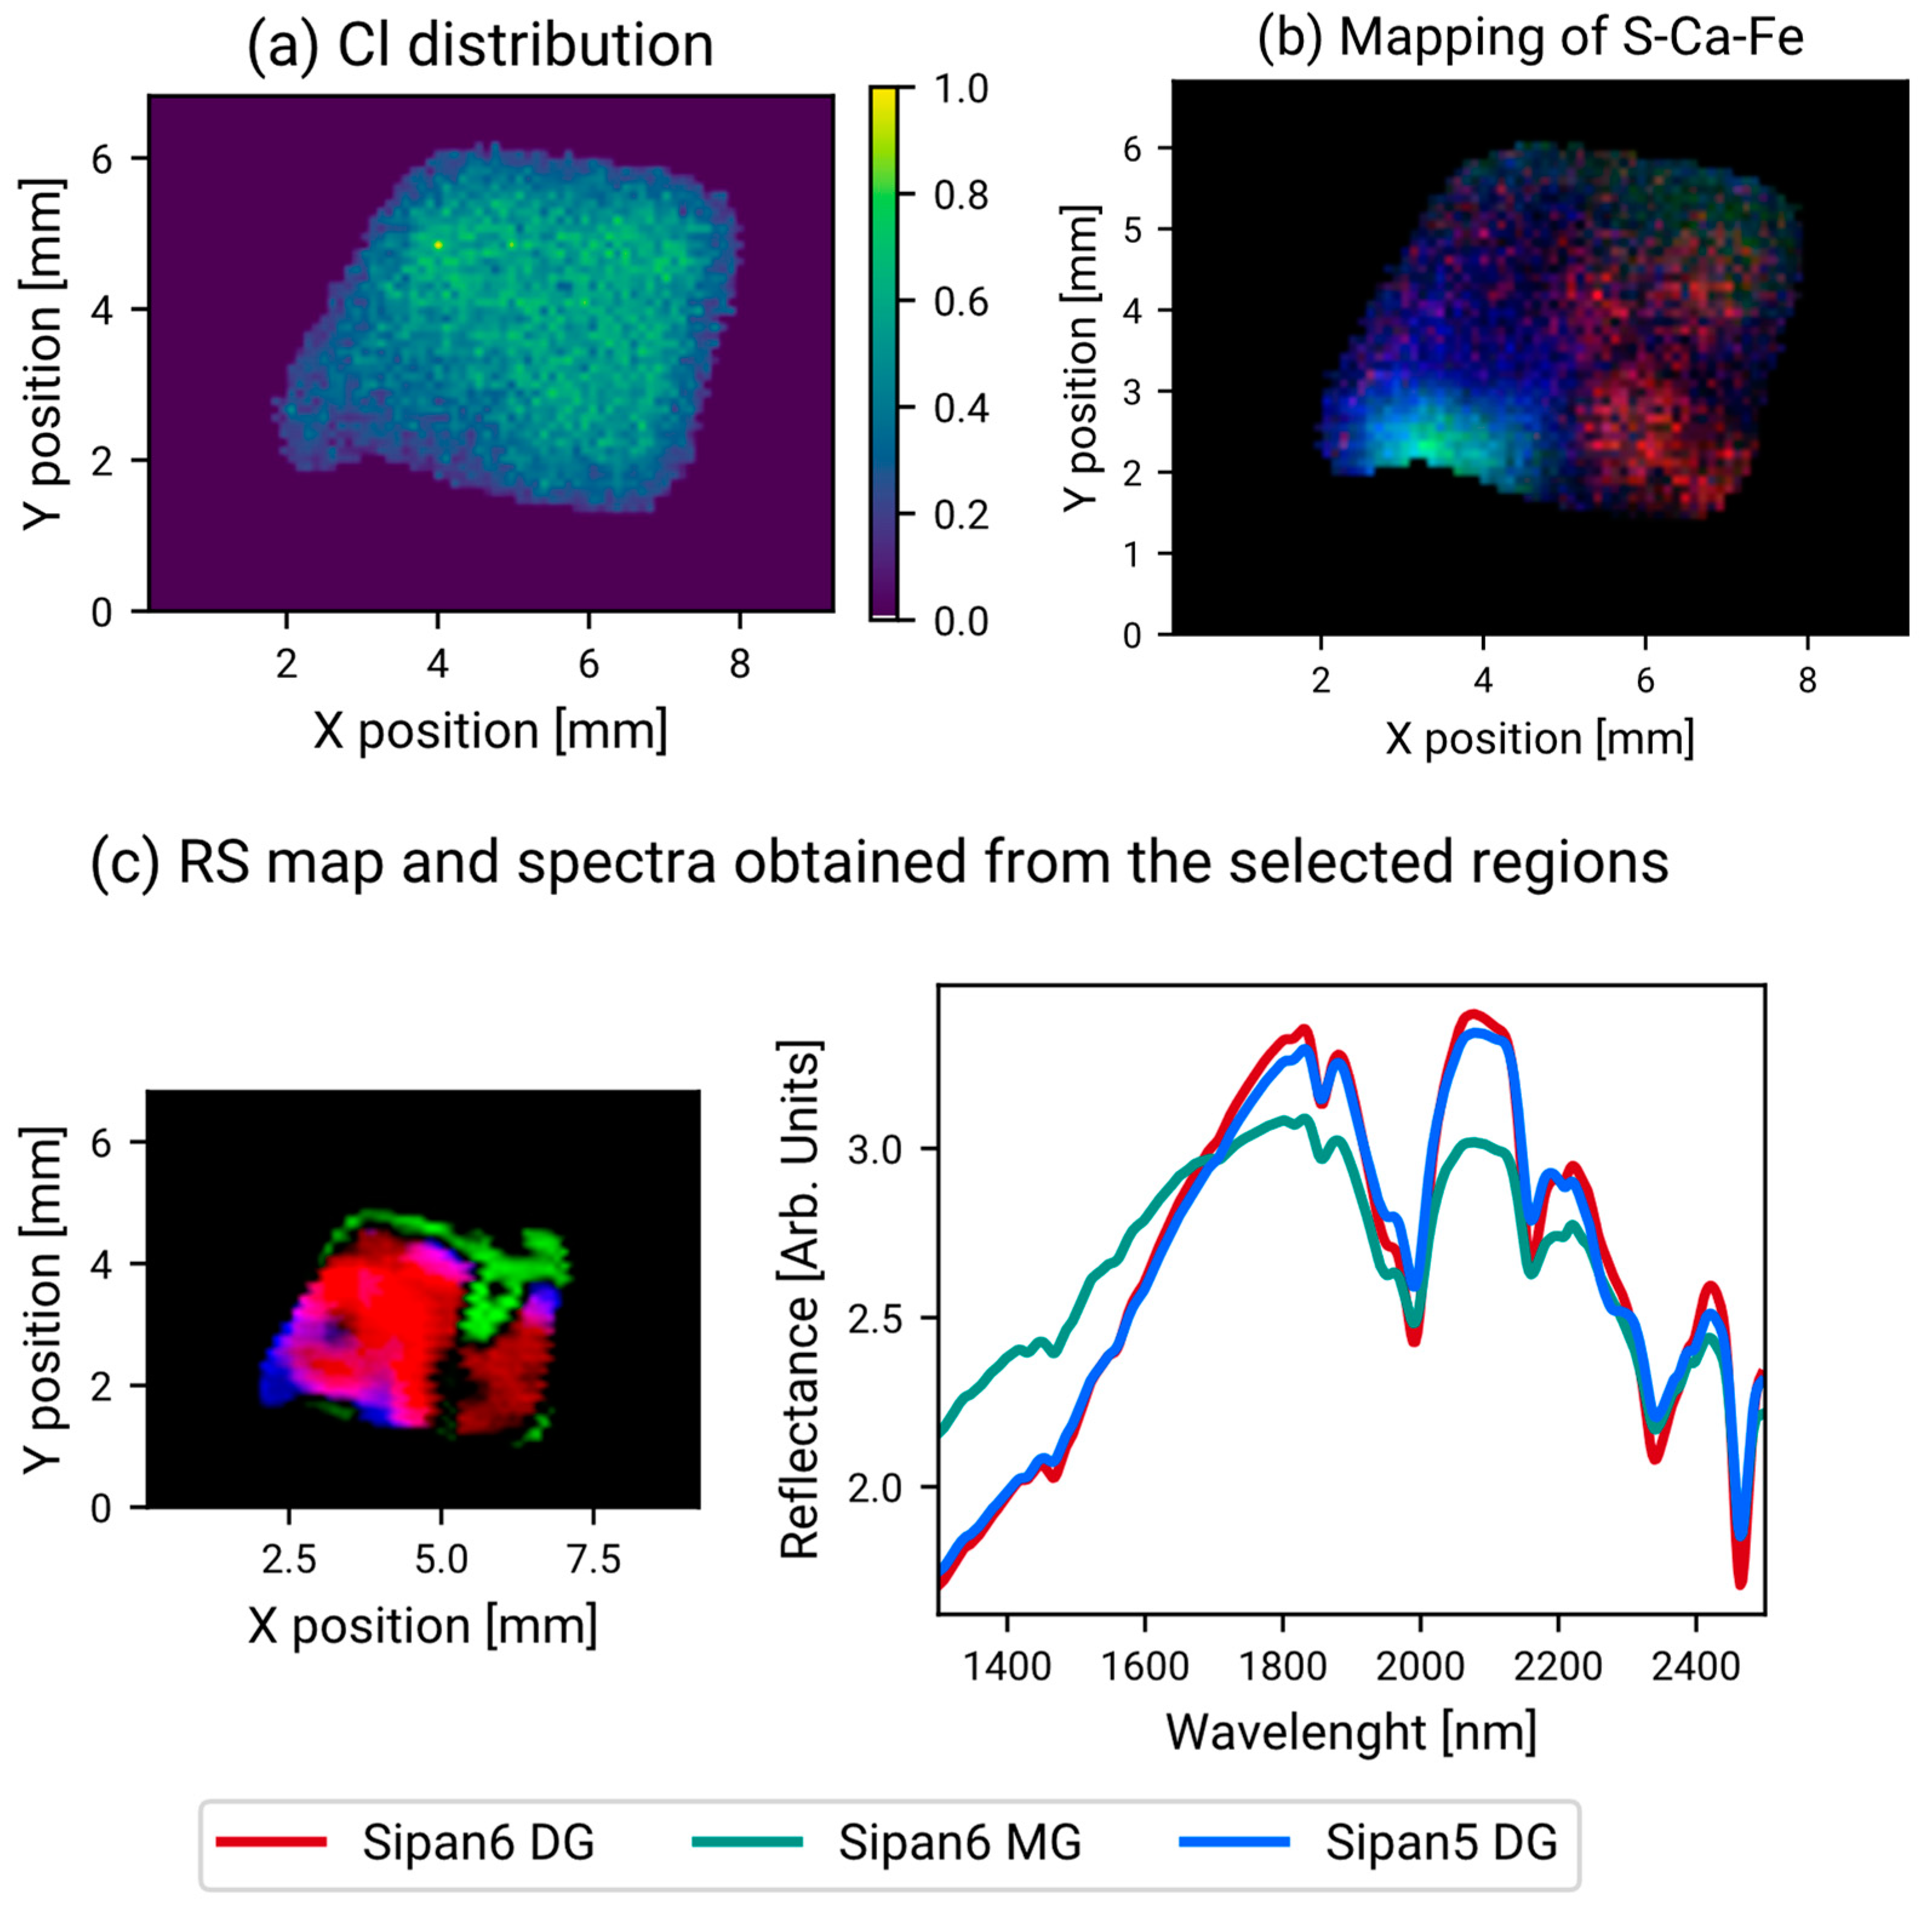
3.2. Mapping Results

Maps were performed on two of the Sipan samples (samples 2 and 6) and on the Etruscan plate by combining XRF spectroscopy and reflectance spectrometry. In this way, we obtained hypercubes of data in which for each spatial position (x, y) an XRF spectrum and two reflectance spectra (one for the visible range and one for the infrared range) were recorded. The XRF data were then processed to obtain elemental intensity maps through the selection of ROIs, while similarity maps were processed with the reflectance data using the spectra correlation mapper as the algorithm and single spectra as the endmembers.
The tin distribution can be observed through the intensity signal of tin K (Figure 4a) and L lines; however, as no L lines can be detected for this element, we can exclude its presence from the surface of the sample. For this reason, the intensity of K lines can mostly reflect the thickness of the patina layer, as we expect the original material to be (more or less) homogeneous in composition (also considering the small size of the sample). It is thus possible to notice the higher intensity of tin in the upper part of the sample and in a spot in the central part; thus, we can deduce a high variation in the thickness of the patina layer. In Figure 4b, instead, it is possible to observe the distribution of Ca and Fe. Calcium is more present in the upper part of the sample, while iron is detected in areas in the central parts; however, their presence is also very inhomogeneous. If we compare the Ca region with the visible image (Figure 1a), we can observe its correspondence with the dull green patina. Regarding the RS data (Figure 4c), we observe that the point spectra collected on the sample roughly describe all the areas of the sample; in particular, the spectrum collected on the medium green region (MG) describes the upper part of the sample, relating with Sn and Ca, while the dark green (DG) describes mostly the lower part of the sample, and the light green (LG) is found in only small spots. The RS spectra obtained from the three regions are quite similar to each other, in particular those coming from the green and blue areas of the map.
In the two Sipán samples (Figure 5 and Figure 6) we can observe the distribution of chlorine, which is quite homogeneous all over the surface of the sample (Panel a), while sulfur, calcium, and iron are present in spots. In particular, in sample 2 (Figure 5, Panel b) we can observe that S and Ca are quite related (the red areas of S present an orange hue on the map, indicating the presence of both sulfur and calcium). Also, we can observe that the regions in which chlorine has a lower intensity are related to a higher intensity of iron. Instead, in sample 6 (Figure 6, Panel b) sulfur and calcium are not related, and instead calcium seems to be localized only in the lower part of the sample, in the same region in which the intensity of chlorine decreases. In sample 6 that region corresponds to the white patina (Figure 1, Panel b). For the RS analyses, we observe that the spectra that better describe the sample are not always those collected on the sample itself; indeed, the blue region on the Sipan 2 sample is obtained using the measurement collected from the Sipan 3 sample (Figure 5, panel c), while the blue region on the Sipán 6 (Figure 6, Panel c) sample is obtained using a measurement from the Sipan 5 sample. Since these samples have the same composition and the same history (burial conditions), the alterations on them are the same. As point analyses are not representative of the whole samples when the materials are so inhomogeneous, it is possible that the spectrum collected from a similar sample is more representative than one collected on the same sample, which however refers only to that small region analysed. All the spectra obtained from the highlighted regions are quite similar. For sample 2 (Figure 5, Panel c), what is observed is that the red spectra (thus the red region in the map) present the two much less intense absorption bands at 1950–2000 nm, with a similar ratio, while the other two spectra present much more intense bands, with a different ratio. Additionally, the red spectrum shows a high absorption at 2273 nm and nearly no absorption at 2352 nm, clearly indicating a different compound. In sample 6 (Figure 6, Panel c) all the spectra are quite similar; indeed, the blue and red regions in the map are widely overlapped (magenta areas), and only the green area is clearly different.

4. Discussion

As can be seen from the obtained results, the joint use of elementary and molecular spectroscopic techniques can be a good starting point for the completely non-invasive and in situ identification of the nature of surface patinas on metal materials, and in particular, of copper and bronze. The possibility of performing mapping on the surfaces, or on part of them, together with the use of recognition algorithms such as the selection of elementary ROIs and the SCM for the reflectance spectra allows us to clearly distinguish the presence of differences which otherwise, with the naked eye alone, would not always be identifiable. The SCM algorithm, unlike the SAM, having the possibility of distinguishing between correlated and anti-correlated vectors, allows greater precision in the correlation of the spectra to be achieved and eliminates the possibility of false positives.
The use of internal references such as endmembers for the creation of correlation maps has the advantage of defining areas of similarity on the surface of the examined samples. From these areas, which are homogeneous according to the SCM analysis, the characteristic reflectance curves can then be extracted; these curves can then be further compared to external standards for compound recognition. This comparison can be carried out by direct comparison, through similarity algorithms such as the spectra correlation mapper used here or through Machine Learning methods [51]. In all these cases, the fundamental thing is to have standard references on which to base the recognitions, with references of both pure materials and mixtures of compounds: it is in fact known, in the case of pigments, how mixtures of different materials can modify the spectrum of reflectance according to the theories of Kubelka–Munk [52,53]. The authors intend to continue this study by acquiring reflectance and X-ray fluorescence data and VIS-NIR-SWIR Reflectance spectra of pure standards and mixtures with known concentrations with the instrument used to create a reference database to be used in future works.
An intrinsic limit of the techniques used in this work is the evaluation of the volumes investigated: in XRF analyses, the thicknesses investigated typically depend on the atoms that make up the material and on their absorption of X radiation; otherwise, reflectance spectrometry is generally indicated as a superficial technique even though we know that in the infrared range, from about 800nm onwards, scattering phenomena are possible which allow us to excite and obtain information on the deeper layers, in the order of micrometres [54]. However, the joint use of techniques that employ different volumes of analysis can lead to obtaining information relating to the inhomogeneity of the sample, which is a typical factor in the context of cultural projects and all those processes of uncontrolled natural degradation, such as the case of patina formation. Once again, the analysis of known materials used as reference standards is essential for the characterization of the instruments used [55].

5. Conclusions

The work presented here shows the potentials, the limits, and the future steps needed to increase the performance of the joint use of two non-invasive and non-contact techniques such as X-ray fluorescence and VIS-NIR-SWIR reflectance spectrometry in mapping configuration for the characterization of the corrosion materials that make up the patinas of copper-based metallic objects. This approach can be extended to other materials with the necessary creation of a reference database of known materials and the characterization of the investigation volumes of the two techniques for the specific instrument used.

Author Contributions

Conceptualization, J.O. and S.C.; methodology, J.O. and S.C.; software, J.O.; validation, J.O. and S.C.; formal analysis, S.C.; data curation, J.O. and S.C.; writing—original draft preparation, J.O. and S.C.; writing—review and editing, J.O. and S.C. All authors have read and agreed to the published version of the manuscript.

Funding

This research received no external funding.

Data Availability Statement

The data presented in this study are available on request from the corresponding author due to privacy.

Acknowledgments

Roberto Lorenzi, Department Scienza dei Materiali of University of Milano Bicocca, for executing Raman measures. Francesca Rizzo e Francesco Borsari for the availability of Etruscan samples.

Conflicts of Interest

The authors declare no conflicts of interest.

References

  1. Dillmann, P.; Beranger, G.; Piccardo, P.; Matthiessen, H. Corrosion of Metallic Heritage Artefacts: Investigation, Conservation and Prediction of Long Term Behaviour; Elsevier: Amsterdam, The Netherlands, 2014; ISBN 978-1-84569-301-5. [Google Scholar]
  2. Dillmann, P.; Neff, D.; Féron, D. Archaeological Analogues and Corrosion Prediction: From Past to Future. A Review. Corros. Eng. Sci. Technol. 2014, 49, 567–576. [Google Scholar] [CrossRef]
  3. Sandu, I.G.; Mircea, O.; Vasilache, V.; Sandu, I. Influence of Archaeological Environment Factors in Alteration Processes of Copper Alloy Artifacts. Microsc. Res. Tech. 2012, 75, 1646–1652. [Google Scholar] [CrossRef] [PubMed]
  4. Scott, D.A. Copper and Bronze in Art: Corrosion, Colorants, Conservation; Getty Publications: Los Angeles, CA, USA, 2002; ISBN 978-0-89236-638-5. [Google Scholar]
  5. Robbiola, L.; Fiaud, C.; Harch, A. Characterisation of Passive Layers of Bronze Patinas (Cu-Sn Alloys) in Relation with the Tin Content of the Alloy. In Proceedings of the European Symposium on Modifications of Passive Films, Paris, France, 15–17 February 1993; pp. 150–154. [Google Scholar]
  6. Robbiola, L.; Blengino, J.-M.; Fiaud, C. Morphology and Mechanisms of Formation of Natural Patinas on Archaeological Cu–Sn Alloys. Corros. Sci. 1998, 40, 2083–2111. [Google Scholar] [CrossRef]
  7. Catelli, E.; Sciutto, G.; Prati, S.; Jia, Y.; Mazzeo, R. Characterization of Outdoor Bronze Monument Patinas: The Potentialities of near-Infrared Spectroscopic Analysis. Env. Sci. Pollut. Res. 2018, 25, 24379–24393. [Google Scholar] [CrossRef] [PubMed]
  8. Bettuzzi, M.; Casali, F.; Morigi, M.P.; Brancaccio, R.; Carson, D.; Chiari, G.; Maish, J. Computed Tomography of a Medium Size Roman Bronze Statue of Cupid. Appl. Phys. A 2015, 118, 1161–1169. [Google Scholar] [CrossRef]
  9. Privitera, A.; Corbascio, A.; Calcani, G.; Della Ventura, G.; Ricci, M.A.; Sodo, A. Raman Approach to the Forensic Study of Bronze Patinas. J. Archaeol. Sci. Rep. 2021, 39, 103115. [Google Scholar] [CrossRef]
  10. Bonizzoni, L.; Galli, A.; Poldi, G. In Situ EDXRF Analyses on Renaissance Plaquettes and Indoor Bronzes Patina Problems and Provenance Clues. X-Ray Spectrom. Int. J. 2008, 37, 388–394. [Google Scholar] [CrossRef]
  11. Galli, A.; Bonizzoni, L. True versus Forged in the Cultural Heritage Materials: The Role of PXRF Analysis. X-Ray Spectrom. 2014, 43, 22–28. [Google Scholar] [CrossRef]
  12. Bonizzoni, L.; Canevari, C.; Galli, A.; Gargano, M.; Ludwig, N.; Malagodi, M.; Rovetta, T. A Multidisciplinary Materials Characterization of a Joannes Marcus Viol (16th Century). Herit. Sci. 2014, 2, 15. [Google Scholar] [CrossRef]
  13. Bonizzoni, L.; Caglio, S.; Galli, A.; Germinario, C.; Izzo, F.; Magrini, D. Identifying Original and Restoration Materials through Spectroscopic Analyses on Saturnino Gatti Mural Paintings: How Far a Noninvasive Approach Can Go. Appl. Sci. 2023, 13, 6638. [Google Scholar] [CrossRef]
  14. Galli, A.; Caccia, M.; Alberti, R.; Bonizzoni, L.; Aresi, N.; Frizzi, T.; Bombelli, L.; Gironda, M.; Martini, M. Discovering the Material Palette of the Artist: A p-XRF Stratigraphic Study of the Giotto Panel ‘God the Father with Angels’: Discovering the Pigment Palette Using a p-XRF Stratigraphic Analysis. X-Ray Spectrom. 2017, 46, 435–441. [Google Scholar] [CrossRef]
  15. Bottaini, C.; Brunetti, A.; Bordalo, R.; Valera, A.; Schiavon, N. Non-Destructive Characterization of Archeological Cu-Based Artifacts from the Early Metallurgy of Southern Portugal. Archaeol. Anthr. Sci. 2018, 10, 1903–1912. [Google Scholar] [CrossRef]
  16. Mezzi, A.; de Caro, T.; Riccucci, C.; Parisi, E.I.; Faraldi, F.; Vassiliou, P.; Grassini, S. Analytical Methodologies for the Investigation of Soil-Induced Degradation of Cu-Based Archaeological Artefacts. Surf. Interface Anal. 2012, 44, 953–957. [Google Scholar] [CrossRef]
  17. Gargano, M.; Galli, A.; Bonizzoni, L.; Alberti, R.; Aresi, N.; Caccia, M.; Castiglioni, I.; Interlenghi, M.; Salvatore, C.; Ludwig, N.; et al. The Giotto’s Workshop in the XXI Century: Looking inside the “God the Father with Angels” Gable. J. Cult. Herit. 2019, 36, 255–263. [Google Scholar] [CrossRef]
  18. Galli, A.; Caccia, M.; Caglio, S.; Bonizzoni, L.; Castiglioni, I.; Gironda, M.; Alberti, R.; Martini, M. An Innovative Protocol for the Study of Painting Materials Involving the Combined Use of MA-XRF Maps and Hyperspectral Images. Eur. Phys. J. Plus 2022, 137, 22. [Google Scholar] [CrossRef]
  19. Orsilli, J.; Galli, A.; Bonizzoni, L.; Caccia, M. More than XRF Mapping: STEAM (Statistically Tailored Elemental Angle Mapper) a Pioneering Analysis Protocol for Pigment Studies. Appl. Sci. 2021, 11, 1446. [Google Scholar] [CrossRef]
  20. Alfeld, M.; Mulliez, M.; Devogelaere, J.; de Viguerie, L.; Jockey, P.; Walter, P. MA-XRF and Hyperspectral Reflectance Imaging for Visualizing Traces of Antique Polychromy on the Frieze of the Siphnian Treasury. Microchem. J. 2018, 141, 395–403. [Google Scholar] [CrossRef]
  21. da Silva, A.T.; Legrand, S.; Van der Snickt, G.; Featherstone, R.; Janssens, K.; Bottinelli, G. MA-XRF Imaging on René Magritte’s La Condition Humaine: Insights into the Artist’s Palette and Technique and the Discovery of a Third Quarter of La Pose Enchantée. Herit. Sci. 2017, 5, 37. [Google Scholar] [CrossRef]
  22. Tapia, J.; Eveno, M.; Calligaro, T.; Pichon, L.; Laval, E.; Ravaud, E.; Reiche, I. Efficiency of Combined MA-XRF and CXRF to Give Nondestructive Insights about Changes of a Historical Painting. Eur. Phys. J. Plus 2023, 138, 46. [Google Scholar] [CrossRef]
  23. Solomon, S.D.; Rutkowsky, S.A.; Mahon, M.L.; Halpern, E.M. Synthesis of Copper Pigments, Malachite and Verdigris: Making Tempera Paint. J. Chem. Educ. 2011, 88, 1694–1697. [Google Scholar] [CrossRef]
  24. Švarcová, S.; Hradil, D.; Hradilová, J.; Čermáková, Z. Pigments—Copper-Based Greens and Blues. Archaeol. Anthr. Sci. 2021, 13, 190. [Google Scholar] [CrossRef]
  25. Scott, D.A. A Review of Copper Chlorides and Related Salts in Bronze Corrosion and as Painting Pigments. Stud. Conserv. 2000, 45, 39–53. [Google Scholar] [CrossRef]
  26. Galli, A.; Bonizzoni, L.; Sibilia, E.; Martini, M. EDXRF Analysis of Metal Artefacts from the Grave Goods of the Royal Tomb 14 of Sipán, Peru. X-Ray Spectrom. 2011, 40, 74–78. [Google Scholar] [CrossRef]
  27. HoÈrz, G.; Kallfass, M. The Treasure of Gold and Silver Artifacts from the Royal Tombs of SipaÂn, Peru Ð a Study on the Moche Metalworking Techniques. Mater. Charact. 2000, 45, 391–419. [Google Scholar] [CrossRef]
  28. Ingo, G.M.; Bustamante, A.D.; Alva, W.; Angelini, E.; Cesareo, R.; Gigante, G.E.; Zambrano, S.D.P.A.; Riccucci, C.; Di Carlo, G.; Parisi, E.I.; et al. Gold Coated Copper Artifacts from the Royal Tombs of Sipán (Huaca Rajada, Perù): Manufacturing Techniques and Corrosion Phenomena. Appl. Phys. A 2013, 113, 877–887. [Google Scholar] [CrossRef]
  29. Bonizzoni, L.; Maloni, A.; Milazzo, M. Evaluation of Effects of Irregular Shape on Quantitative XRF Analysis of Metal Objects. X-Ray Spectrom. 2006, 35, 390–399. [Google Scholar] [CrossRef]
  30. Ager, F.J.; Ferretti, M.; Grilli, M.L.; Juanes, D.; Ortega-Feliu, I.; Respaldiza, M.A.; Roldán, C.; Scrivano, S. Reconsidering the Accuracy of X-Ray Fluorescence and Ion Beam Based Methods When Used to Measure the Thickness of Ancient Gildings. Spectrochim. Acta Part B At. Spectrosc. 2017, 135, 42–47. [Google Scholar] [CrossRef]
  31. Duée, C.; Orberger, B.; Maubec, N.; Laperche, V.; Capar, L.; Bourguignon, A.; Bourrat, X.; El Mendili, Y.; Chateigner, D.; Gascoin, S.; et al. Impact of Heterogeneities and Surface Roughness on pXRF, pIR, XRD and Raman Analyses: Challenges for on-Line, Real-Time Combined Mineralogical and Chemical Analyses on Drill Cores and Implication for “High Speed” Ni-Laterite Exploration. J. Geochem. Explor. 2019, 198, 1–17. [Google Scholar] [CrossRef]
  32. Kanngießer, B.; Malzer, W.; Mantouvalou, I.; Sokaras, D.; Karydas, A.G. A Deep View in Cultural Heritage—Confocal Micro X-Ray Spectroscopy for Depth Resolved Elemental Analysis. Appl. Phys. A 2012, 106, 325–338. [Google Scholar] [CrossRef]
  33. Nakano, K.; Tsuji, K. Nondestructive Elemental Depth Profiling of Japanese Lacquerware ‘Tamamushi-Nuri’ by Confocal 3D-XRF Analysis in Comparison with Micro GE-XRF. X-Ray Spectrom. 2009, 38, 446–450. [Google Scholar] [CrossRef]
  34. Šmit, Ž.; Janssens, K.; Proost, K.; Langus, I. Confocal μ-XRF Depth Analysis of Paint Layers. Nucl. Instrum. Methods Phys. Res. Sect. B Beam Interact. Mater. At. 2004, 219–220, 35–40. [Google Scholar] [CrossRef]
  35. Trojek, T.; Prokeš, R.; Šefců, R.; Bilavčíková, H.; Čechák, T. Confocal X-Ray Fluorescence Spectrometer for in-Situ Analyses of Paintings. Radiat. Phys. Chem. 2017, 137, 238–242. [Google Scholar] [CrossRef]
  36. Cesareo, R.; de Assis, J.T.; Roldán, C.; Bustamante, A.D.; Brunetti, A.; Schiavon, N. Multilayered Samples Reconstructed by Measuring Kα/Kβ or Lα/Lβ X-Ray Intensity Ratios by EDXRF. Nucl. Instrum. Methods Phys. Res. Sect. B Beam Interact. Mater. At. 2013, 312, 15–22. [Google Scholar] [CrossRef]
  37. Trojek, T.; Čechák, T.; Musílek, L. Recognition of Pigment Layers in Illuminated Manuscripts by Means of Kα/Kβ and Lα/Lβ Ratios of Characteristic X-Rays. Appl. Radiat. Isot. 2010, 68, 871–874. [Google Scholar] [CrossRef]
  38. Orsilli, J. AR-XRF Techniques for the Analysis of Cultural Heritage Layered Samples; University of Milano Bicocca: Milan, Italy, 2023. [Google Scholar]
  39. Orsilli, J.; Migliori, A.; Padilla-Alvarez, R.; Martini, M.; Galli, A. AR-XRF Measurements and Data Treatment for the Evaluation of Gilding Samples of Cultural Heritage. J. Anal. At. Spectrom. 2023, 38, 174–185. [Google Scholar] [CrossRef]
  40. Margreiter, R.; Baumann, J.; Mantouvalou, I.; Radtke, M.; Reinholz, U.; Strub, E. Investigations on Fire-Gilding. Archaeometry 2022, 64, 1465–1478. [Google Scholar] [CrossRef]
  41. Hauff, P. An Overview of VIS-NIR-SWIR Field Spectroscopy as Applied to Precious Metals Exploration. Spectr. Int. Inc. 2008, 80001, 303–403. [Google Scholar]
  42. Caccia, M.; Caglio, S.; Galli, A. Objective Interpretation of Ultraviolet-Induced Luminescence for Characterizing Pictorial Materials. Sci. Rep. 2023, 13, 20240. [Google Scholar] [CrossRef]
  43. Verri, G. The Application of Visible-Induced Luminescence Imaging to the Examination of Museum Objects. In Proceedings of the O3A: Optics for Arts, Architecture, and Archaeology II, Munich, Germany, 25 June 2009; SPIE: Bellingham, WA, USA, 2009; Volume 7391, pp. 37–48. [Google Scholar]
  44. Liu, W.; Li, M.; Wu, N.; Liu, S.; Chen, J. A New Application of Fiber Optics Reflection Spectroscopy (FORS): Identification of “Bronze Disease” Induced Corrosion Products on Ancient Bronzes. J. Cult. Herit. 2021, 49, 19–27. [Google Scholar] [CrossRef]
  45. Frost, R.L. Raman Spectroscopy of Selected Copper Minerals of Significance in Corrosion. Spectrochim. Acta Part. A Mol. Biomol. Spectrosc. 2003, 59, 1195–1204. [Google Scholar] [CrossRef]
  46. Database of Raman Spectroscopy, X-Ray Diffraction and Chemistry of Minerals. Available online: https://rruff.info/ (accessed on 28 December 2023).
  47. Python Software Foundation Python. Available online: https://www.python.org/ (accessed on 3 January 2022).
  48. Meneses, P.R. Spectral Correlation Mapper (SCM): An Improvement on the Spectral Angle Mapper (SAM); JPL Publication: Pasadena, CA, USA, 2000. [Google Scholar]
  49. Ricciardi, P.; Pallipurath, A.; Rose, K. ‘It’s Not Easy Being Green’: A Spectroscopic Study of Green Pigments Used in Illuminated Manuscripts. Anal. Methods 2013, 5, 3819–3824. [Google Scholar] [CrossRef]
  50. Bruni, S.; Caglio, S.; Guglielmi, V.; Poldi, G. The Joined Use of n.i. Spectroscopic Analyses—FTIR, Raman, Visible Reflectance Spectrometry and EDXRF—to Study Drawings and Illuminated Manuscripts. Appl. Phys. A 2008, 92, 103–108. [Google Scholar] [CrossRef]
  51. Hu, Q.; Liu, W.; Liu, S.; Chen, J. Detecting Copper Trihydroxychlorides with Reflectance Spectroscopy and Machine Learning Methods. J. Cult. Herit. 2023, 59, 49–56. [Google Scholar] [CrossRef]
  52. Clementi, C.; Miliani, C.; Verri, G.; Sotiropoulou, S.; Romani, A.; Brunetti, B.G.; Sgamellotti, A. Application of the Kubelka—Munk Correction for Self-Absorption of Fluorescence Emission in Carmine Lake Paint Layers. Appl. Spectrosc. 2009, 63, 1323–1330. [Google Scholar] [CrossRef]
  53. Dupuis, G.; Menu, M. Quantitative Characterisation of Pigment Mixtures Used in Art by Fibre-Optics Diffuse-Reflectance Spectroscopy. Appl. Phys. A 2006, 83, 469–474. [Google Scholar] [CrossRef]
  54. Dal Fovo, A.; Fontana, R. Stratigraphic Mapping of Paintings by Multispectral Reflectography. Eur. Phys. J. Plus 2023, 138, 1112. [Google Scholar] [CrossRef]
  55. Bonizzoni, L.; Caglio, S.; Galli, A.; Poldi, G. Comparison of Three Portable EDXRF Spectrometers for Pigment Characterization. X-Ray Spectrom. 2010, 39, 233–242. [Google Scholar] [CrossRef]
Figure 1. Visible images of the examined samples: (a) Sipan plate no. 2; (b) Sipan plate no. 6; (c) Etruscan plate. Image (d) is theEtruscan plate upper border, where different layers of alteration can be observed. The thickness of the plate is around 1.2mm.
Minerals 14 00192 g001
Figure 2. The single-point spectra acquired on the different samples; spectra are stacked for readability: (a) XRF spectra with the indication of the peaks of the chemical elements of interest for the present study, (b) visible range (400–1000 nm), and (c) infrared range (1000–2500 nm) reflectance spectra with the indication of the wavelengths of interest for the identification of materials.
Minerals 14 00192 g002
Figure 3. Selected Raman spectra of the corrosion layer of the different samples with an indication of the recognized minerals: M—malachite, C—calcite, E—eriochalcite, An—antlerite, and At—atacamite.
Minerals 14 00192 g003
Figure 4. Maps from the Etruscan plate. (a) Map intensity of Sn (red), Pb (green), and Cu (blue); (b) map intensity of Ca (red), Fe (green), and Cu (blue); (c) bottom, RS map obtained with the three Etruscan single-point measurements; on the right are the spectra obtained from the selected areas of the map.
Minerals 14 00192 g004
Figure 5. Images from the Sipan 2 sample. (a) Normalised map intensity of chlorine; (b) map intensity of S (red), Ca (green), and Fe (blue); (c) bottom, RS map obtained with three-point RS measurements; on the right are the spectra obtained from the selected areas of the map.
Minerals 14 00192 g005
Figure 6. Images from the Sipan 6 sample. (a) Normalised map intensity of chlorine; (b) map intensity of S (red), Ca (green), and Fe (blue); (c) bottom, RS map obtained with three-point RS measurements; on the right are the spectra obtained from the selected areas of the map.
Minerals 14 00192 g006
Disclaimer/Publisher’s Note: The statements, opinions and data contained in all publications are solely those of the individual author(s) and contributor(s) and not of MDPI and/or the editor(s). MDPI and/or the editor(s) disclaim responsibility for any injury to people or property resulting from any ideas, methods, instructions or products referred to in the content.

